Submitted:
08 April 2026
Posted:
09 April 2026
You are already at the latest version
Abstract
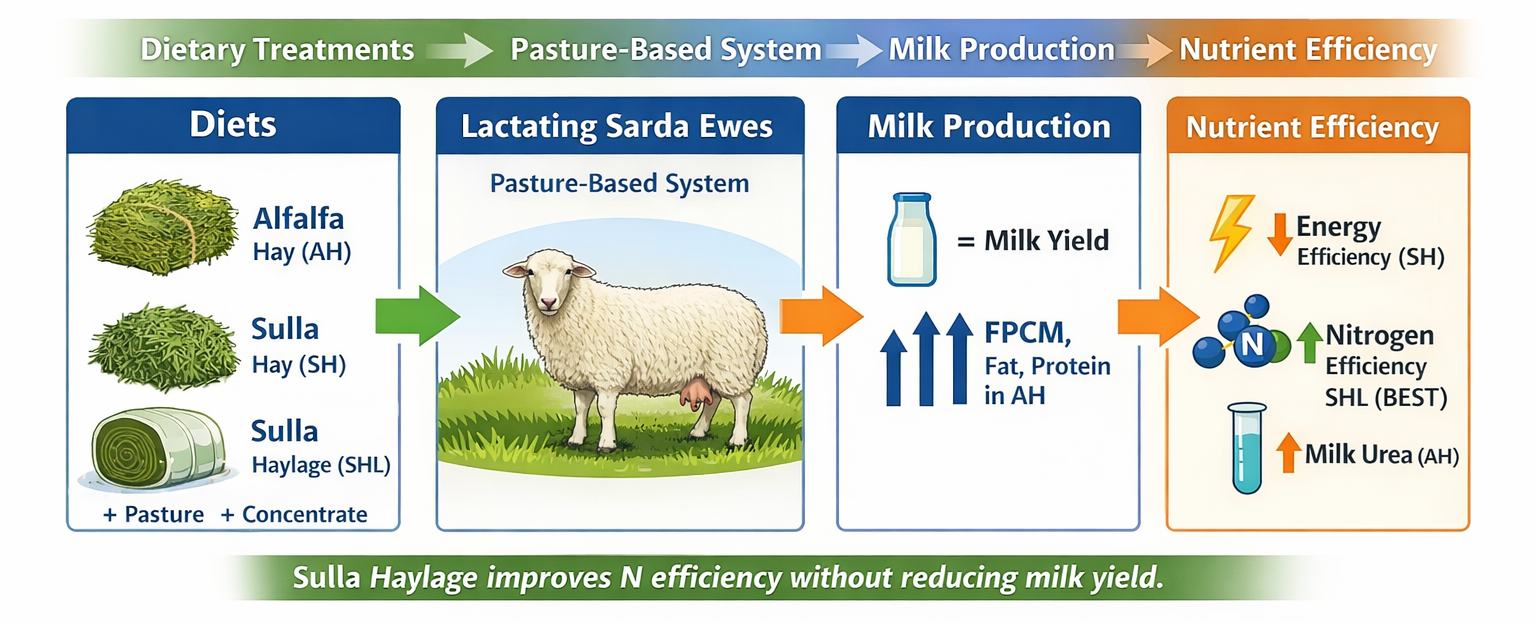
This study evaluated the effects of replacing alfalfa hay with sulla (Sulla coronaria (L.) B.H. Choi & H. Ohashi) hay or sulla haylage in pasture-based diets for lactating Sarda ewes on milk production, composition, and nutrient utilization efficiency. Seventy-two mid-lactation ewes were assigned to three dietary treatments: alfalfa hay (AH), sulla hay (SH), or sulla haylage (SHL), all combined with 3 h/day grazing and concentrate supplementation. Diets were formulated to be theoretically isoenergetic and isoproteic. Pasture quality was comparable among groups throughout the experimental period. Milk yield did not differ among treatments; however, fat- and protein-corrected milk (FPCM) and milk components were higher in AH compared with sulla-based diets. Nitrogen intake (NI) was greatest in AH, as reflected by higher milk urea concentration. Energy utilization efficiency (FPCM/UFL intake) differed among treatments, with lower values in SH compared with AH and SHL. Protein utilization efficiency (Milk N/NI) was highest in SHL, intermediate in SH, and lowest in AH (p < 0.001). Condensed tannins were not detected in conserved sulla forages, suggesting that conservation processes may reduce the characteristic tannin-related nutritional effects of fresh sulla. Results indicate that forage conservation method influences nutrient utilization efficiency, with sulla haylage improving nitrogen efficiency without impairing milk yield.
Keywords:
dairy ewes
; Sulla coronaria
; forage conservation
; nitrogen use efficiency
; grazing system
1. Introduction
Legume-based forages are increasingly recognized as key components of sustainable small ruminant production systems, particularly in Mediterranean environments, owing to their high nutritive value, biological nitrogen fixation capacity and positive effects on animal performance and product quality [1,2]. Among these species, Sulla coronaria L. (sulla) is a short-lived forage legume well adapted to the calcareous and clayey soils of Southern Europe and widely used in sheep production systems [3]. Several studies have consistently reported increased milk yield and improved milk quality in dairy sheep grazing sulla-based pastures compared with grass-dominated swards, including positive effects on milk protein content and fatty acid profile [4,5,6].
The favourable nutritional properties of sulla are mainly associated with its balanced chemical composition and its moderate concentration of condensed tannins (CT), generally ranging between 20 and 40 g/kg dry matter [7,8]. Under Mediterranean conditions, CT concentrations may vary considerably widely (8–50 g/kg DM) depending on phenological stage, genotype and environmental factors [2,9,10]. At moderate level, CT do not negatively affect feed intake, digestibility or animal performance, while enhancing nitrogen by reducing ruminal protein degradation and increasing the flow of undegraded dietary protein to the small intestine [11,12].
In addition, condensed tannins may protect polyunsaturated fatty acids from ruminal biohydrogenation, thereby increasing their transfer to milk and dairy products [5,6]. They may also exert antioxidant activity, potentially improving animal health and oxidative stability of dairy products [13]. Beyond their nutritional role, CT-containing legumes have also been associated with reduced enteric methane emissions and improved resilience to gastrointestinal parasites, contributing to the environmental sustainability of small ruminant systems [14,15].
The nutritional advantages of sulla are generally greater when the forage is consumed fresh rather than conserved [16]. However, in Mediterranean sheep farming systems, the utilization of sulla under grazing conditions is largely confined to spring, leading to underexploitation of its productive potential. Consequently, there is growing interest in conservation strategies aimed at extending its availability beyond the grazing season. Traditional haymaking may result in substantial losses of biomass, nutrients and polyphenolic compounds, particularly under unstable weather conditions [17]. Alternative conservation techniques, such as forage dehydration or ensiling in wrapped bales (haylage), may provide greater flexibility in harvest timing and improved preservation of nutrients and CT [18].
Despite the extensive literature on fresh sulla utilization in dairy sheep nutrition, information regarding the effects of conserved sulla forages, particularly wrapped haylage, on animal performance and milk quality remains limited. Therefore, the objective of the present study was to compare the effects of three theoretically isoenergetic and isoproteic diets differing in forage type and conservation method: alfalfa hay, sulla hay and sulla wrapped hay (haylage) on animal performance of lactating dairy sheep.
2. Materials and Methods
2.1. Experimental Site and Ethical Approval
The experiment was conducted at the Bonassai Experimental Farm of the Agricultural Research Agency of Sardinia (AGRIS Sardegna), located in north-western Sardinia, Italy (40°40′16.2″ N, 8°22′0.4″ E; 32 m a. s. l.). All experimental procedures complied with European Union legislation concerning the protection of animals used for scientific purposes. Animal handling, management, and data collection were performed by trained personnel and were approved by the institutional ethical bodies of AGRIS Sardegna and the University of Sassari.
2.2. Animals, Management, and Experimental Design
The experiment was carried out in spring 2025, (mid-April to mid-June). A total of 72 multiparous lactating Sarda ewes were selected and assigned to three experimental groups (n = 24 per group) based on homogeneous physiological and productive characteristics. At the beginning of the trial, ewes averaged 3.5 ± 0.8 years of age, lambing date 17 December 2024 ± 2.5 days, 102 ± 2.5 days in milk, daily milk yield 2.23 ± 0.04 kg/day, live weight (LW) 51.6 ± 0.6 kg, and body condition score (BCS) 2.5 ± 0.03.
Throughout the experimental period, ewes were machine-milked twice daily (morning and evening) and managed under a pasture-based feeding system. All animals grazed for 3 h/day (8:30 – 11:30) on Italian ryegrass pasture and received indoor hay, immediately after the grazing session, and commercial concentrates, at milkings, as supplements. Following a 10 days adaptation period, during which all animals received the same diet (4 h/day grazing on Italian ryegrass pasture plus ryegrass hay and concentrate) ewes were assigned to one of the following dietary treatments expressed on fresh matter (FM) basis:
alfalfa hay (AH): 3 h/day grazing plus alfalfa hay (1.35 kg/head per day) and concentrates consisting of maize grain (0.350 kg/head per day at morning milking) and commercial concentrate (0.350 kg/head per day at evening milking).
sulla hay (SH): 3 h/day day grazing plus sulla hay (1.70 kg/head per day) and the same concentrate supply as the AH group.
sulla haylage (SHL): 3 h/day grazing plus sulla wrapped hay (3.50 kg/head per day) and the same concentrate supply as the other groups.
Diets were formulated and evaluated using the Small Ruminant Nutrition System (SRNS; [19]) and were designed to be theoretically isoenergetic and isoproteic.
2.3. Pasture Management
The grazing area was divided into three paddocks, each allocated to one experimental group of sheep. Each paddock was further subdivided into sub-paddocks (approximately 1,500 m²), which were grazed for seven consecutive days following a rotational grazing system.
2.4. Feed Sampling and Chemical Analyses
Pasture biomass availability and botanical–chemical composition were assessed at the beginning and end of each grazing rotation. In each sub-paddock, four herbage samples were collected by cutting 0.5 m² quadrats randomly distributed across the grazed area. Samples of offered herbage and post-grazing residues were oven-dried to determine dry matter (DM) content.
Climatic parameters (air temperature, relative humidity, rainfall, wind speed, and wind direction) were automatically recorded hourly using an on-site weather station. The temperature–humidity index (THI) was calculated according to [20].
Samples of concentrates and conserved forages were collected at the beginning, midpoint and end of the trial. In addition hand-plucked herbage samples representative of the grazed pasture were collected fortnightly for each experimental group. All feed samples were oven-dried at 65 °C and ground to pass a 1-mm screen prior to analysis.
The chemical composition of offered herbage, post-grazing residues, hand-plucked herbage, and hay was determined using near-infrared reflectance spectroscopy (NIRS), whereas concentrates and maize grain were analyzed by conventional wet chemistry methods according to [21]. Fibre fractions, including amylase-treated neutral detergent fibre (aNDF), acid detergent fibre (ADF) acid detergent lignin (ADL), were determined following [22]. Non-structural carbohydrates (NSC) were calculated as:
In vitro dry matter digestibility (IVDMD) was determined using the pepsin–cellulase method [23]. Freeze-dried hay subsamples were analyzed for total phenols, non-tannic phenols and tannic phenols using the Folin–Ciocalteu method, and for condensed tannins using the butanol–HCl assay, expressed as leucocyanidin equivalents [24,25]. The detection limit of the butanol–HCl assay under the analytical conditions adopted in this study was 1.0 g/kg DM. Samples with condensed tannin concentrations below this threshold were considered not detectable.
2.5. Animal Measurements, Intake Estimation, and Milk Analysis
Live weight and BCS [26] were recorded monthly. Individual milk yield was recorded weekly. Individual concentrate intake and average group hay intake were measured daily. Individual herbage intake at pasture was estimated daily using the model proposed by [27].
Net energy (UFL kg/DM) and metabolizable protein contents (MP kg/DM) of the diets were calculated according to [28].
Milk samples were collected weekly from each ewe during milking recording and analyzed for fat, true protein (N × 6.38), lactose, urea, and somatic cell count (SCC) using an infrared analyzer (Milkoscan, Foss Electric, Hillerød, Denmark). Fat- and protein-corrected milk yield (6.5%; 5.8; FPCM) was calculated according to [29].
Energy utilization efficiency (EUE) was calculated as the ratio between FPCM and net energy intake expressed as UFL. Nitrogen utilization efficiency (NUE) was calculated as the ratio between milk nitrogen output (MilkN) and nitrogen intake (NI).
2.5. Statistical Analysis
Biomass availability, botanical and chemical composition of herbage at the beginning and end of grazing period were analyzed using linear mixed models including experimental group, week and their interaction as fixed effects. When significant effects were detected, differences among means were assessed using Tukey’s honestly significant difference (HSD) test.
The chemical composition and nutritive value of conserved forages were analyzed using linear mixed models including experimental group as fixed effects. Least-squares means (LSMEANS) were compared using Tukey’s adjustment.
Intake data were analyzed using mixed-effects models including experimental group, week and their interaction as fixed effects. Ewe was included as a random effect to account for repeated measurements. The covariance structure of repeated observations was modelled using a first-order autoregressive structure [AR(1)], with week as the time index. Degrees of freedom were estimated using the Kenward–Roger method.
Live weight, BCS, milk yield, and milk composition were analyzed using mixed linear models including experimental group, sampling month, and their interaction as fixed effects, and ewe as a random intercept. When appropriate, initial measurements were included as covariates.
Energy and nitrogen utilization efficiency were analyzed using mixed linear models for repeated measures. The model included experimental diet, week, and their interaction as fixed effects, with ewe nested within diet, as a random intercept. Repeated weekly measurements were modelled using an autoregressive covariance structure [AR(1)]. Models were fitted by restricted maximum likelihood (REML), and denominator degrees of freedom were estimated using the Kenward–Roger method. When the interaction was significant, pairwise comparisons among diets within each week were performed using Tukey–Kramer-adjusted LSMeans. Differences were considered statistically significant at P ≤ 0.05. Model assumptions were assessed by visual inspection of residual plots to verify normality and homoscedasticity. No major deviations from model assumptions were detected.
All statistical analyses were performed using SAS software [30].
3. Results
3.1. Pasture and Climatic Condition
At grazing entry, total herbage mass (3.12 ± 0.17 t DM/ha) and herbage allowance expressed per animal per day (0.94 ± 0.05 kg DM) and per hour (0.235 ± 0.013 kg DM) did not differ among experimental groups (Table 1, P > 0.05). Italian ryegrass largely dominated the sward across all treatments. Small but significant differences in botanical composition were observed among groups. The SH treatment showed a higher proportion of Italian ryegrass compared with the SHL group (P < 0.05), with a corresponding inverse trend for other species (Table 1). Residual herbage mass differed among treatments (P ≤ 0.05), indicating differences in grazing intensity despite similar herbage availability at entry. Residual herbage allowance expressed on both a daily and hourly basis also differed among treatments (P ≤ 0.04). However, pairwise comparisons adjusted using the Tukey–Kramer method did not detect significant differences between individual treatments.
The chemical composition of herbage on offer was generally comparable among groups (Table 2). Crude protein (CP) and in vitro dry matter digestibility (IVDMD) did not differ significantly among treatments (P > 0.05). However, small differences were detected in fibre fractions, with slightly lower NDF and ADF concentrations in the AH alfalfa hay and SH groups compared with the SHL group (P < 0.05).
Marked changes in pasture nutritive value were observed between grazing entry and post-grazing residues (Table 3). Residual herbage showed lower CP and IVDMD and higher NDF and ADF concentrations compared with herbage on offer (P ≤ 0.001). No significant group × grazing phase interaction was detected for any variable (P > 0.05), indicating that the magnitude and direction of these changes were consistent across treatments.
Air temperature during grazing hours increased progressively over the experimental period, reflecting the seasonal transition from mid-spring to early summer typical of Mediterranean environments. Mean weekly air temperature rose from approximately 14–15 °C in the initial weeks to 21–22 °C in the final weeks of the trial (Figure 1). Relative humidity showed moderate variability across weeks, with higher values at the beginning of the experimental period, lower values during the central weeks, and a slight increase toward the end of the trial (Figure 1). Wind speed remained generally low, with only a transient increase around week 6, while rainfall events were sporadic and limited (Figure 2).
As a result of the combined temperature and humidity patterns, the temperature–humidity index (THI) recorded during grazing sessions (08:30–11:30) increased gradually across weeks (Figure 3). THI values remained mostly below 65 during the early phase of the experiment and progressively approached or exceeded this threshold in the final weeks. Values within the range 68 ≤ THI < 72, indicative of possible thermal discomfort [31] were mainly observed during the last weeks of the experimental period.
3.2. Nutritive Values of Experimental Diets
The chemical composition and nutritive value of concentrates used during the experiment are reported in Table 4, whereas the composition of conserved forages offered is presented in Table 5. Crude protein concentration was higher in alfalfa hay compared with both sulla-based forages (P ≤ 0.001). Ether extract showed minor differences among forage types (P ≤ 0.05). Significant differences were observed for fibre fractions: NDF was higher in SH compared with AH and SHL (P = 0.01), whereas ADF was higher in SHL compared with AH (P = 0.05). No differences were detected for ADL among forage.
Non-structural carbohydrate (NSC) concentration was higher in SHL compared with the other conserved forages (P ≤ 0.05). Total phenols and tannic phenols were low in all conserved forages but were higher in SHL (P ≤ 0.02). Condensed tannins were not detected in any of the conserved forages. No significant differences were observed among forage types for OM, IVDMD, or UFL; (P > 0.05). Metabolizable protein (MP) concentration was higher in AH compared with both sulla-based forages (P ≤ 0.01).
The chemical composition and nutritive value of grazed herbage, estimated from hand-plucked samples, are presented in Table 6. No significant effects of experimental group were detected for any analysed variable, including DM, CP, EE, fibre fractions, IVDMD, UFL, or MP (P > 0.05).
A significant effect of sampling week was detected only for dry matter content (P ≤ 0.001), reflecting the progressive maturation of the pasture. No significant group × week interactions were observed for any variable, indicating that temporal changes in pasture composition were consistent across treatments.
The effects of experimental group, week, and their interaction on feed intake are reported in Table 7. Herbage dry matter intake (HDMI) differed among treatments (P ≤ 0.05), with higher values observed in the AH group compared with the SHL group, while the SH group showed intermediate values. Both week and the group x week interaction significantly affected herbage intake (P ≤ 0.001).
Significant differences among treatments were also observed for total dry matter intake (TDMI), total crude protein intake (TCPI), total net energy intake (TUFLI), and total metabolizable protein intake (TMPI) (P ≤ 0.001 for all variables).
The SH group showed the highest TDMI and TUFLI, whereas the SHL group exhibited the lowest values for all intake variables. The AH group showed intermediate values for TDMI and TUFLI but the highest TCPI and TMPI.
Week and the group × week interaction significantly affected all intake variables (P = 0.001), indicating that differences among treatments varied over time.
3.3. Live weight, BCS, Milk Yield and Composition
The effects of experimental group, sampling month, and their interaction on live weight and body condition score are reported in Table 8. No significant differences among treatments were observed for LW or BCS (P > 0.05). However, sampling month significantly affected both variables (P ≤ 0.01), whereas no significant group × month interaction was detected.
Live weight increased slightly over time across all treatments (Figure 4), with higher values recorded in June compared with April and May (P ≤ 0.001). A similar temporal pattern was observed for BCS (Figure 5), which progressively increased during the experimental period, irrespective of dietary treatment.
The effects of experimental group, week, and their interaction on milk yield and milk composition are presented in Table 9.
Milk yield did not differ among treatments (P = 0.35), whereas week significantly affected milk production (P ≤ 0.001). No significant group × week interaction was detected for milk yield. In contrast, fat- and protein-corrected milk (FPCM) differed among treatments (P ≤ 0.01), with higher values observed in the alfalfa hay group compared with both sulla-based groups.
Significant treatment effects were also detected for milk fat, protein, and lactose concentrations (P ≤ 0.001), which progressively decreased from the alfalfa hay group to the SH and SHL groups.
Milk urea concentration was higher in the alfalfa hay group compared with both sulla-based treatments (P ≤ 0.001). Somatic cell count score (SCCS =log10 SCC) differed among treatments (P ≤ 0.05), with lower values observed in the SHL group. No significant effect of week was detected for SCCS (P = 0.24), although a significant group × week interaction was observed (P ≤ 0.001), indicating a differential temporal pattern among treatments.
3.4. Energy and Nitrogen Utilization Efficiency
Energy utilization efficiency differed among treatments (P ≤ 0.001) and was affected by week (P ≤ 0.001), with a significant treatment × week interaction (P ≤ 0.001). Overall LSMeans indicated that SHL did not differ from Alfalfa hay, whereas SH showed lower energy efficiency compared with both Alfalfa hay and sulla hay (P ≤ 0.001).
Nitrogen utilization efficiency differed among treatments (P ≤ 0.001) and was affected by week (P ≤ 0.001), with a significant treatment × week interaction (P ≤ 0.001). SHL showed the highest protein efficiency, followed by SH and Alfalfa hay with all pairwise comparisons significant (Tukey–Kramer adjusted P ≤ 0.001).
Figure 6.
Least-squares means (±SE) of energy utilization efficiency (FPCM/UFL) in the three experimental groups. Different letters indicate significant differences among treatments within week (Tukey–Kramer adjusted P ≤ 0.05).
Figure 6.
Least-squares means (±SE) of energy utilization efficiency (FPCM/UFL) in the three experimental groups. Different letters indicate significant differences among treatments within week (Tukey–Kramer adjusted P ≤ 0.05).

Figure 7.
Least-squares means (±SE) of nitrogen utilization efficiency (MilkN/NI) in the three experimental groups. Different letters indicate significant differences among treatments within weeks (Tukey–Kramer adjusted P ≤ 0.05).
Figure 7.
Least-squares means (±SE) of nitrogen utilization efficiency (MilkN/NI) in the three experimental groups. Different letters indicate significant differences among treatments within weeks (Tukey–Kramer adjusted P ≤ 0.05).

4. Discussion
Overall, the nutritive value of the pasture offered to the three experimental groups was comparable throughout the grazing period, with only a slightly lower quality observed in the SHL group (Table 2), consistent with its lower estimated pasture intake (Table 7). The differences detected between grazing entry and post-grazing residue reflected a consistent selective grazing process rather than treatment-specific effects (Table 1 and Table 3). These findings support the interpretation that the observed differences in milk yield, milk composition, and nutrient utilization efficiency were primarily attributable to the type and conservation method of the supplemented forages rather than to variations in pasture quality.
The progressive increase in air temperature and temperature–humidity index (THI) reflected seasonal transition under Mediterranean conditions (Figure 1 and Figure 3). Although THI values increased toward the end of the experimental period, they remained mostly within the thermoneutral or mild heat load range (Figure 3). Therefore, heat stress was unlikely to have substantially influenced feed intake or milk production, although minor temporal variation in animal responses cannot be entirely excluded.
Differences in chemical composition among conserved forages were consistent with both forage species and conservation method. Alfalfa hay provided higher crude protein and metabolizable protein concentrations than sulla-based forages, confirming its established role as a high-protein forage in dairy sheep diets. In contrast, SHL was characterized by higher fibre fractions and total phenolic content, likely reflecting fermentation-related modifications and reduced leaf losses during conservation (Table 5).
Fresh sulla coronaria typically contains moderate concentrations of condensed tannins (20–40 g kg⁻¹ DM), depending on genotype and phenological stage [2,7]. These tannins have been associated with reduced ruminal protein degradation and improved nitrogen utilization efficiency [8]. Forage conservation processes such as drying, wilting and fermentation may alter tannin extractability and biological activity. Previous studies have reported inconsistent effects of conservation on tannin preservation [32,33,34]. Some authors [35] demonstrated that although total condensed tannin concentrations may remain measurable after haymaking or ensiling, the proportion of extractable tannins decreases while protein-bound and fibre-bound fractions increase. Such structural modifications may reduce ruminal availability even when total tannin content is retained. Under the conditions of the present experiment, tannin concentration and/or extractability were likely below biologically relevant thresholds. Consequently, the production responses observed herein were probably driven by differences in nutrient composition, intake regulation and protein–energy balance rather than by tannin-mediated mechanisms.
The high refusal rate observed for SHL (approximately 33% of the offered dry matter) further influenced intake patterns. Its elevated moisture content and bulk density likely constrained voluntary intake, resulting in lower total dry matter, energy and protein intake compared with the other treatments. Selective feeding behaviour may also have modified the actual nutrient composition of the ingested fraction.
Milk yield was maintained across dietary treatments, indicating that partial replacement of AH with conserved sulla forages did not impair overall production under pasture-based conditions (Table 9). However, differences were observed in milk composition and nutrient utilization efficiency (Table 10 and 11). The higher milk urea concentration detected in the AH group indicates greater nitrogen surplus and lower nitrogen utilization efficiency, as milk urea is widely recognized as an indicator of inefficient nitrogen capture [36]. It is important to distinguish between milk protein concentration and nitrogen utilization efficiency: although alfalfa hay increased milk protein content, nitrogen intake was proportionally higher, resulting in lower efficiency relative to nitrogen supply.
Energy utilization efficiency differed among treatments and was significantly influenced by week (Table 10). Despite higher net energy intake in the SH group, its energy efficiency was lower than that observed for AH and SHL. This indicates that greater energy intake did not proportionally increase milk energy output, suggesting differences in energy partitioning. Variations in feeding behaviour, intake pattern or post-absorptive nutrient utilization may have contributed to these differences [37]. Because body reserve mobilization and metabolic indicators were not measured, the relative contribution of maintenance requirements and tissue dynamics cannot be fully clarified.
Nitrogen utilization efficiency showed a marked dietary response, with SHL achieving the highest efficiency (Table 11). The lower efficiency observed in the AH group is consistent with its higher crude protein intake and elevated milk urea concentration, indicating increased nitrogen excretion relative to milk nitrogen output. The superior nitrogen efficiency observed with SHL may reflect improved synchronization between rumen-degradable protein and fermentable energy supply, a mechanism known to enhance microbial protein synthesis efficiency and reduce nitrogen losses [38]. Another factor that may contribute to the detrimental effect of the sulla group on milk urea is the presence of phenolic compounds in sulla forage, although their overall concentration is relatively low. Phenols are known to affect rumen microbial activity, potentially reducing ruminal biohydrogenation and NH₃ production [39]. However, in the absence of rumen fermentation measurements, this interpretation should be considered speculative and interpreted at the whole-animal level.
Taken together, these results demonstrate that forage species and conservation method influenced nutrient intake patterns; milk composition and nutrient utilization efficiency through mechanisms primarily related to physical characteristics, intake regulation and protein–energy balance rather than condensed tannin activity. While fresh sulla is often valued for its tannin-mediated nutritional effects, the conserved sulla forages evaluated in this study appeared to modulate production responses mainly through changes in nutrient profile and feeding dynamics. These findings highlight that the nutritional functionality of sulla forage depends not only on botanical identity but also on conservation process, which may substantially modify its bioactive compound profile and biological activity.
5. Conclusions
This study demonstrates that conserved sulla-based forages can partially replace alfalfa hay in pasture-based diets for lactating dairy ewes without detrimental effects on milk yield, live weight, or body condition score. While overall milk production was maintained, differences in milk composition and nutrient utilization efficiency confirm that both forage species and conservation method play a key role in modulating production responses.
Alfalfa hay supported higher milk fat and protein concentrations but was associated with lower nitrogen utilization efficiency and increased milk urea concentration, indicating a greater nitrogen surplus. In contrast, SHL improved nitrogen utilization efficiency while maintaining satisfactory energy efficiency, suggesting a more balanced protein–energy supply. Despite higher intake levels, SH showed lower energy efficiency, pointing to differences in energy partitioning among forage types.
The absence of detectable condensed tannins in the conserved sulla forages indicates that conservation processes may substantially modify or reduce the characteristic tannin-related nutritional effects of fresh sulla. Therefore, the functional value of sulla forage appears to depend not only on botanical identity but also on conservation method.
Overall, SHL emerges as a promising alternative to alfalfa hay for improving nitrogen use efficiency and supporting more sustainable nutrient management in Mediterranean dairy sheep systems.
Author Contributions
“Conceptualization, M.D., M.A., and A.F.; methodology, M.D., V.G., A.C. and M.S.; validation, M.D., M.A., A.F., A.C., and M.S.; formal analysis, M.D., M.A., and M.S.; investigation, V.G., M.A., A.F., M.G.S., M.R.C., and A.C.; resources, M.D., and M.S.; data curation, A.F., M.G.S., and M.R.C.; writing—original draft preparation, M.D., V.G, and M.S.; writing—review and editing, M.D., M.A., V.G., M.S., A.F., A.C., M.G.S., and M.R.C.; supervision, M.D., and V.G.; project administration, M.D.. All authors have read and agreed to the published version of the manuscript.”.
Funding
“This research was partially funded by EU project TechCare, which has received funding from the European Union’s Horizon 2020 Research and Innovation Programme under grant agreement No 862050.
Institutional Review Board Statement
Approved by Ethical Committee (O.P.B.S.A.) of University of Sassari and Agris Sardegna (n. 52682 - 06/05/2021).
Data Availability Statement
The datasets presented in this article are not readily available because the data are part of an ongoing study. Request to access the datasets should be directed to the corresponding authors.
Acknowledgments
The authors wish to thank S. Picconi and A. Pintore for their technical help in running the experiments, M. Delrio, M. A. Sanna, M. Niolu, L. Sanna and all laboratory staff to carry out chemical analyses.
Conflicts of Interest
The authors declare no conflicts of interest.
Abbreviations
The following abbreviations are used in this manuscript:
| AH | Alfalfa hay |
| SH | Sulla hay |
| SHL | Sulla haylage (sulla hay wrapped) |
| LW | Live weight |
| BCS | Body condition score |
| DM | Dry matter |
| OM | Organic matter |
| CP | Crude protein |
| EE | Ether extracts |
| NSC | Non-structural carbohydrates |
| NDF | Neutral detergent fiber |
| aNDF | Amylase-treated neutral detergent fiber |
| ADF | Acid detergent fiber |
| ADL | Acid detergent lignin, |
| IVDMD | In vitro DM digestibility |
| TotP | Total phenols |
| TanP | Tannic phenols |
| CT | Condensed tannins |
| UFL | Feed unit for milk production |
| MP | Metabolizable protein |
| FPCM | Fat and protein corrected milk |
| SCC | Somatic cell count |
| SCCS | Log10 somatic cell count |
| N | Nitrogen |
| EUE | Energy utilization efficiency |
| NUE | Nitrogen utilization efficiency |
References
- Rochon, J.J.; Doyle, C.J.; Greef, J.M.; Hopkins, A.; Molle, G.; Sitzia, M.; Scholefield, D.; Smith, C.J. Grazing legumes in Europe: A review of their status, management, benefits, research needs and future prospects. Grass Forage Sci. 2004, 59, 197–214. [CrossRef]
- Molle, G.; Decandia, M.; Giovanetti, V.; Cabiddu, A.; Fois, N.; Sitzia, M. Responses to condensed tannins of flowering sulla (Hedysarum coronarium L.) grazed by dairy sheep. Part 1: Effects on feeding behaviour, intake, diet digestibility and performance. Livest. Sci. 2009, 123, 138–146. [CrossRef]
- Sitzia, M.; Ruiz, F.A. Sheep. In Encyclopedia of Dairy Sciences, 3rd ed.; McSweeney, P.L.H., McNamara, J.P., Eds.; Academic Press: Oxford, UK, 2016; pp. 287–296. [CrossRef]
- Addis, M.; Cabiddu, A.; Pinna, G.; Decandia, M.; Piredda, G.; Pirisi, A.; Molle, G. Milk and cheese fatty acid composition in sheep fed Mediterranean forages with reference to conjugated linoleic acid cis-9, trans-11. J. Dairy Sci. 2005, 88, 3443–3454. [CrossRef]
- Cabiddu, A.; Molle, G.; Decandia, M.; Spada, S.; Fiori, M.; Piredda, G.; Addis, M. Responses to condensed tannins of flowering sulla (Hedysarum coronarium L.) grazed by dairy sheep. Part 2: Effects on milk fatty acid profile. Livest. Sci. 2009, 123, 230–240. [CrossRef]
- Bonanno, A.; Di Grigoli, A.; Mazza, F.; De Pasquale, C.; Giosuè, C.; Vitale, F.; Alabiso, M. Effects of ewes grazing sulla or ryegrass pasture for different daily durations on forage intake, milk production and fatty acid composition of cheese. Animal 2016, 10, 2074–2082. [CrossRef]
- Barry, T.N. Condensed tannins: Their role in ruminant protein and carbohydrate digestion and possible effects upon the rumen ecosystem. In The Roles of Protozoa and Fungi in Ruminant Digestion; Nolan, J.V., Leng, R.A., Demeyer, D.I., Eds.; Penambul Books: Armidale, Australia, 1989; pp. 153–169.
- Stienezen, M.; Waghorn, G.C.; Douglas, G.B. Digestibility and voluntary intake of fresh sulla (Hedysarum coronarium) fed to sheep. In Proc. N. Z. Soc. Anim. Prod. 1996, 56, 191–194. [CrossRef]
- Piluzza, G.; Sulas, L.; Bullitta, S. Tannins in forage plants and their role in animal husbandry and environmental sustainability: A review. Grass Forage Sci. 2014, 69, 32–48. [CrossRef]
- Amato, G.; Di Miceli, G.; Giambalvo, D.; Scarpello, C.; Stringi, L. Condensed tannins content in sulla (Hedysarum coronarium L.) as affected by environment, genotype and growth stage. In Bioactive Compounds in Pasture Species for Phytotherapy and Animal Welfare; Bullitta, S., Ed.; CNR-ISPAAM: Sassari, Italy, 2005; pp. 41–54.
- Decandia, M.; Cabiddu, A.; Molle, G. Effect of tannins on the nutrition, grazing or browsing management and environmental impact of small ruminants fed Mediterranean pastures. In Tannins: Types, Foods Containing, and Nutrition; Petridis, G.K., Ed.; Nova Science Publishers: New York, NY, USA, 2011; pp. 83–112.
- Frutos, P.; Hervás, G.; Natalello, A.; Luciano, G.; Fondevila, M.; Priolo, A.; Toral, P.G. Ability of tannins to modulate ruminal lipid metabolism and milk and meat fatty acid profiles. Anim. Feed Sci. Technol. 2020, 269, 114623. [CrossRef]
- Tava, A.; De Benedetto, M.G.; Tedesco, D.; Di Miceli, G.; Piluzza, G. Proanthocyanidins from Hedysarum, Lotus and Onobrychis spp. growing in Sardinia and Sicily and their antioxidant activity. In Proc. XX Int. Grassl. Congr.; Wageningen Academic Publishers: Wageningen, The Netherlands, 2005; p. 271. [CrossRef]
- Min, B.R.; Barry, T.N.; Attwood, G.T.; McNabb, W.C. The effect of condensed tannins on the nutrition and health of ruminants fed fresh temperate forages: A review. Anim. Feed Sci. Technol. 2003, 106, 3–19. [CrossRef]
- Hoste, H.; Jackson, F.; Athanasiadou, S.; Thamsborg, S.M.; Hoskin, S.O. The effects of tannin-rich plants on parasitic nematodes in ruminants. Trends Parasitol. 2006, 22, 253–261. [CrossRef]
- Molle, G.; Decandia, M.; Fois, N.; Ligios, S.; Cabiddu, A.; Sitzia, M. The performance of Mediterranean dairy sheep given access to sulla (Hedysarum coronarium L.) and annual ryegrass (Lolium rigidum Gaudin) pastures in different time proportions. Small Rumin. Res. 2003, 49, 319–328. [CrossRef]
- Borreani, G.; Giaccone, D.; Mimosi, A.; Tabacco, E. Comparison of hay and haylage from permanent Alpine meadows in winter dairy cow diets. J. Dairy Sci. 2007, 90, 5643–5650. [CrossRef]
- Frame, J.; Laidlaw, A.S. Improving the utilization of forage legumes. In Forage Legumes for Temperate Grasslands; Frame, J., Ed.; Science Publishers: Rome, Italy, 2005; pp. 1–15.
- Tedeschi, L.O.; Cannas, A.; Fox, D.G. A nutrition mathematical model to account for dietary supply and requirements of energy and other nutrients for domesticated small ruminants: The development and evaluation of the Small Ruminant Nutrition System. Small Rumin. Res. 2010, 89, 174–184. [CrossRef]
- National Research Council. A Guide to Environmental Research on Animals; National Academy of Sciences: Washington, DC, USA, 1971; p. 196.
- AOAC. Official Methods of Analysis, 15th ed.; Association of Official Analytical Chemists: Washington, DC, USA, 1990.
- Van Soest, P.J.; Robertson, J.B.; Lewis, B.A. Methods for dietary fiber, neutral detergent fiber, and nonstarch polysaccharides in relation to animal nutrition. J. Dairy Sci. 1991, 74, 3583–3597. [CrossRef]
- Aufrère, J.; Demarquilly, C. Predicting organic matter digestibility of forages by two pepsin–cellulase methods. In Proc. 16th Int. Grassl. Cong.; Nice, France, 4–11 October 1989.
- Makkar, H.P.S.; Bluemmel, M.; Borowi, N.K.; Becker, K. Gravimetric determination of tannins and their correlations with chemical and protein precipitation methods. J. Sci. Food Agric. 1993, 61, 161–165. [CrossRef]
- Makkar, H.P.S. Quantification of Tannins in Tree and Shrub Foliage: A Laboratory Manual; IAEA: Vienna, Austria, 1999.
- Russel, A. Body condition scoring of sheep. In Pract. 1984, 6, 91–93.
- Molle, G.; Cannas, A.; Gregorini, P. A review on the effects of part-time grazing herbaceous pastures on feeding behaviour and intake of cattle, sheep and horses. Livest. Sci. 2022, 263, 104982. [CrossRef]
- Cannas, A. Feeding of lactating ewe. In Dairy Sheep Nutrition; Pulina, G., Ed.; CAB International: Wallingford, Oxon, UK, 2004; pp. 31–49.
- Pulina, G.; Nudda, A. Milk production. In Dairy Sheep Nutrition; Pulina, G., Ed.; CABI Publishing: Wallingford, Oxon, UK, 2004; pp. 1–12.
- SAS Institute Inc. SAS/STAT® 9.4 User’s Guide; SAS Institute Inc.: Cary, NC, USA, 2013.
- Peana, I.; Francesconi, A.H.D.; Dimauro, C.; Cannas, A.; Sitzia, M. Effect of winter and spring meteorological conditions on milk production of grazing dairy sheep in the Mediterranean environment. Small Rumin. Res. 2017, 153, 194–208. [CrossRef]
- Minnee, E.M.K.; Woodward, S.L.; Waghorn, G.C.; Laboyrie, P.G. The effect of ensiling forage legumes on condensed tannins. In Proc. 32nd Annu. Conf. Agron. Soc. N. Z.; Palmerston North, New Zealand, 2002; Agron. N. Z. 32–33, 117–119.
- Gannuscio, R.; Ponte, M.; Di Grigoli, A.; Maniaci, G.; Di Trana, A.; Bacchi, M.; Alabiso, M.; Bonanno, A.; Todaro, M. Feeding dairy ewes with fresh or dehydrated sulla (Sulla coronarium L.) forage. 1. Effects on feed utilization, milk production, and oxidative status. Animals 2022, 12, 2317. [CrossRef]
- Piccirillo, B.; Ponte, M.; Pipi, M.; Di Grigoli, A.; Bonanno, A.; Cutrignelli, M.I.; Vastolo, A.; Calabrò, S. Pelleted sulla forage (Hedysarum coronarium L.) as a resource for sheep feeding systems: In vitro nutritional value and sustainability perspectives. Animals 2025, 15, 2322. [CrossRef]
- Rufino-Moya, P.J.; Blanco, M.; Bertolín, J.R.; Joy, M. Effect of the method of preservation on the chemical composition and in vitro fermentation characteristics in two legumes rich in condensed tannins. Anim. Feed Sci. Technol. 2019, 251, 12–20. [CrossRef]
- Giovanetti, V.; Boe, F.; Decandia, M.; Bomboi, G.C.; Atzori, A.S.; Cannas, A.; Molle, G. Milk urea concentration in dairy sheep: Accounting for dietary energy concentration. Animals 2019, 9, 1118. [CrossRef]
- Cannas, A.; Tedeschi, L.O.; Atzori, A.S.; Lunesu, M.F. How can nutrition models increase the production efficiency of sheep and goat operations? Anim. Front. 2019, 9, 33–44. [CrossRef]
- Sinclair, L.A.; Garnsworthy, P.C.; Newbold, J.R.; Buttery, P.J. Effects of synchronizing the rate of dietary energy and nitrogen release in diets with a similar carbohydrate composition on rumen fermentation and microbial protein synthesis in sheep. J. Agric. Sci. 1995, 124, 463–472. [CrossRef]
- Huang, R.; Romero, P.; Belanche, A.; Ungerfeld, E.M.; Yanez-Ruiz, D.; Morgavi, D.P.; Popova, M. Evaluating the effect of phenolic compounds as hydrogen acceptors when ruminal methanogenesis is inhibited in vitro—Part 1: Dairy cows. Animal 2023, 17, 100788. [CrossRef]
Figure 1.
Weekly trends of air temperature (T) and relative humidity (RH) recorded during grazing sessions (8:30 – 11:30) over the experimental period.
Figure 1.
Weekly trends of air temperature (T) and relative humidity (RH) recorded during grazing sessions (8:30 – 11:30) over the experimental period.

Figure 2.
Weekly trends of wind speed and rainfall recorded during grazing sessions (8:30 – 11:30) over the experimental period.
Figure 2.
Weekly trends of wind speed and rainfall recorded during grazing sessions (8:30 – 11:30) over the experimental period.

Figure 3.
Hourly and weekly trends of the temperature–humidity index (THI) recorded during grazing sessions (08:30–11:30) over the experimental period.
Figure 3.
Hourly and weekly trends of the temperature–humidity index (THI) recorded during grazing sessions (08:30–11:30) over the experimental period.

Figure 4.
Live weight (LW) of Sarda dairy ewes during the experimental period (least-squares means ± SE).
Figure 4.
Live weight (LW) of Sarda dairy ewes during the experimental period (least-squares means ± SE).

Figure 5.
Body condition score (BCS) of Sarda dairy ewes during the experimental period (least-squares means ± SE).
Figure 5.
Body condition score (BCS) of Sarda dairy ewes during the experimental period (least-squares means ± SE).


Table 1.
Herbage availability, botanical composition and residual biomass at the beginning and at the end of grazing period.
Table 1.
Herbage availability, botanical composition and residual biomass at the beginning and at the end of grazing period.
| alfalfa hay | sulla hay | sulla haylage | P-value | |
|---|---|---|---|---|
| Total herbage mass (t DM/ha) | 3.06 ± 0.32 | 3.07 ± 0.30 | 3.23 ± 0.29 | 0.5 |
| Italian ryegrass (%) | 88.0 ± 2.7ab | 91.3 ± 2.3a | 85.7 ± 2.8b | 0.04 |
| Other species (%) | 12.0 ± 2.7ab | 8.7 ± 2.3b | 14.3 ± 2.8a | 0.04 |
| Herbage allowance (kg DM/head/day) | 0.94 ± 0.10 | 0.92 ± 0.09 | 0.96 ± 0.09 | 0.70 |
| Herbage allowance (kg DM/head/hour) | 0.24 ± 0.02 | 0.23 ± 0.02 | 0.24 ± 0.02 | 0.70 |
| Residual herbage mass (t DM/ha) | 1.19 ± 0.25b | 1.21 ± 0.25ab | 1.43 ± 0.25a | 0.02 |
| Residual herbage allowance (kg DM/head/day) | 0.368 ± 0.08 | 0.366 ± 0.08 | 0.430 ± 0.08 | 0.04 |
| Residual herbage allowance (kg DM/head/hour) | 0.092 ± 0.02 | 0.092 ± 0.02 | 0.108 ± 0.02 | 0.04 |
Different letters indicate significant differences (P ≤ 0.05).
Table 2.
Chemical composition and nutritive value of herbage mass on offer. Values are expressed as LS means ± SE.
Table 2.
Chemical composition and nutritive value of herbage mass on offer. Values are expressed as LS means ± SE.
| alfalfa hay | sulla hay | sulla haylage | Effect, P value | |
|---|---|---|---|---|
| CP1 (%) | 9.18 ± 0.41 | 9.33 ± 0.29 | 8.37 ± 0.30 | 0.27 |
| NDF2 (%) | 57.66 ± 0.60b | 56.95 ± 0.59ab | 58.99 ± 0.49a | 0.04 |
| ADF3 (%) | 32.63 ± 0.50b | 32.47 ± 0.48ab | 33.67 ± 0.39a | 0.03 |
| IVDMD4 (%) | 62.90 ± 0.63 | 63.07 ± 0.60 | 61.39 ± 0.62 | 0.26 |
Different letters indicate significant differences (P ≤ 0.05). 1CP=crude protein; 2NDF = neutral detergent fibre; 3ADF = acid detergent fibre; 4IVDMD = In vitro dry matter digestibility.
Table 3.
Changes in nutritive value of total herbage from the beginning (Herbage on offer) and the end of grazing period (Residue herbage). Values are expressed as LS means ± SE, averaged across experimental groups.
Table 3.
Changes in nutritive value of total herbage from the beginning (Herbage on offer) and the end of grazing period (Residue herbage). Values are expressed as LS means ± SE, averaged across experimental groups.
| Herbage on offer | Residue herbage | Effect, P value | |
|---|---|---|---|
| CP1 (%) | 9.00 ± 0.24 | 6.73 ± 0.17 | < 0.001 |
| NDF2 (%) | 57.87 ± 0.49 | 66.25 ± 0.45 | < 0.001 |
| ADF3 (%) | 32.92 ± 0.32 | 38.78 ± 0.33 | < 0.001 |
| IVDMD4 (%) | 62.45 ± 0.62 | 54.03 ± 0.49 | < 0.001 |
Different letters indicate significant differences (P ≤ 0.05). 1CP=crude protein; 2NDF = neutral detergent fibre; 3ADF = acid detergent fibre; 4IVDMD = In vitro dry matter digestibility.
Table 4.
Chemical composition and nutritive values (on a dry matter basis) of concentrates used during the experiment.
Table 4.
Chemical composition and nutritive values (on a dry matter basis) of concentrates used during the experiment.
| DM1 | OM2 | CP3 | EE4 | NSC5 | aNDF6 | ADF7 | ADL8 | IVDMD9 | UFL10 | MP11 | |
|---|---|---|---|---|---|---|---|---|---|---|---|
| Mais grain | 88.0 | 98.4 | 9.4 | 5.2 | 70.7 | 13.1 | 6.4 | 0.6 | 94.6 | 1.31 | 89.7 |
| Concentrate | 88.6 | 89.2 | 18.0 | 2.6 | 39.7 | 28.9 | 15.1 | 3.3 | 81.8 | 0.96 | 165.3 |
1DM = Dry matter; 2OM = Organic matter; 3CP=Crude protein; 4EE = Ether extract; 5NSC = Non-fiber carbohydrates; 6aNDF = Amylase-treated neutral detergent fiber; 7ADF = Acid detergent fibre; 8ADL = Acid detergent lignin; 9IVDMD = In vitro dry matter digestibility; 10UFL = Feed unit for milk production; 11MP = Metabolizable protein.
Table 5.
Chemical composition and nutritive values (on a dry matter basis) of conserved forages offered to the animals during the experiment (least-squares means ± SE).
Table 5.
Chemical composition and nutritive values (on a dry matter basis) of conserved forages offered to the animals during the experiment (least-squares means ± SE).
| alfalfa hay | sulla hay | sulla haylage | Effect, P value | |
|---|---|---|---|---|
| DM1 | 85.42 ± 2.26 a | 80.06 ± 2.26 a | 35.14 ± 2.26 b | 0.001 |
| OM2 (% DM) | 83.44 ± 1.22 | 88.10 ± 1.22 | 85.52 ± 1.22 | 0.09 |
| CP3 (% DM) | 19.86 ± 0.95 a | 10.91 ± 0.95 b | 12.00 ± 0.95 b | 0.001 |
| EE4 (% DM) | 2.83 ± 0.08 a | 2.43 ± 0.08 b | 2.59 ± 0.08 ab | 0.05 |
| NSC5 (% DM) | 11.56 ± 1.34 b | 17.65 ± 1.34 b | 21.47 ± 1.34 a | 0.05 |
| NDF6 (% DM) | 49.19 ± 1.05 b | 57.11 ± 1.05 a | 49.47 ± 1.05 b | 0.01 |
| ADF7 (% DM) | 35.19 ± 0.93 b | 39.09 ± 0.93 ab | 40.35 ± 0.93 a | 0.05 |
| ADL8 (% DM) | 6.56 ± 0.52 | 6.01 ± 0.52 | 7.15 ± 0.52 | 0.36 |
| Total Phenols (% DM) | 0.86 ± 0.02 b | 0.86 ± 0.02 b | 1.28 ± 0.02 a | 0.02 |
| Tannic Phenols (% DM) | 0.20 ± 0.04 b | 0.19 ± 0.04 b | 0.44 ± 0.04 a | 0.01 |
| IVDMD9 (% DM) | 63.98 ± 1.42 | 59.55 ± 1.42 | 63.78 ± 1.42 | 0.12 |
| UFL10 (unit/kg DM) | 0.642 ± 0.02 | 0.650 ± 0.02 | 0.675 ± 0.022 | 0.58 |
| MP11 (g/kg DM) | 174.5 ± 8.0 a | 99.1 ± 8.0 b | 109.3 ± 8.0 b | 0.01 |
Different letters indicate differences between groups. 1DM = Dry matter; 2OM = Organic matter; 3CP=Crude protein; 4EE = Ether extract; 5NSC = Non-fiber carbohydrates; 6NDF = Neutral detergent fiber; 7ADF = Acid detergent fibre; 8ADL = Acid detergent lignin; 9IVDMD = In vitro dry matter digestibility; 10UFL = Feed unit for milk production; 11MP = Metabolizable protein.
Table 6.
Effects of experimental group (G), week (W) and their interaction (G×W) on the chemical composition of grazed herbage estimated from hand-plucked samples (least-squares means ± SE).
Table 6.
Effects of experimental group (G), week (W) and their interaction (G×W) on the chemical composition of grazed herbage estimated from hand-plucked samples (least-squares means ± SE).
| alfalfa hay | sulla hay | sulla haylage | Effects, P value | |||
|---|---|---|---|---|---|---|
| G | W | GxW | ||||
| DM1 | 32.92 ± 1.3 | 32.36 ± 1.3 | 34.41 ± 1.3 | 0.9 | 0.001 | 0.9 |
| OM2 (% DM) | 89.79± 0.5 | 89.66± 0.5 | 89.68± 0.5 | 0.3 | 0.9 | 0.3 |
| CP3 (% DM) | 9.23 ± 0.8 | 8.80 ± 0.8 | 9.08 ± 0.8 | 0.7 | 0.8 | 0.6 |
| EE4 (% DM) | 3.05 ± 0.2 | 2.97 ± 0.2 | 3.03 ± 0.2 | 0.8 | 0.08 | 0.6 |
| NSC5 (% DM) | 16.84 ± 1.9 | 17.18 ± 1.9 | 16.42 ± 1.9 | 0.9 | 0.5 | 0.9 |
| NDF6 (% DM) | 60.66 ± 2.8 | 60.69 ± 2.8 | 61.15 ± 2.8 | 0.9 | 0.8 | 0.8 |
| ADF7 (% DM) | 34.18 ± 1.6 | 34.20 ± 1.6 | 34.40 ± 1.6 | 0.8 | 0.3 | 0.8 |
| ADL8 (% DM) | 2.27 ± 0.4 | 2.03 ± 0.4 | 2.17 ± 0.4 | 0.9 | 0.2 | 0.9 |
| IVDMD9 (% DM) | 55.68 ± 2.6 | 55.32 ± 2.6 | 54.71 ± 2.6 | 0.8 | 0.9 | 0.7 |
| UFL10 (unit/kg DM) | 0.63 ± 0.04 | 0.62 ± 0.04 | 0.61 ± 0.04 | 0.9 | 0.8 | 0.8 |
| MP11 (g/kg DM) | 84.38 ± 7.0 | 80.65 ± 7.0 | 83.03 ± 7.0 | 0.8 | 0.8 | 0.6 |
Different letters indicate differences between groups. 1DM = Dry matter; 2OM = Organic matter; 3CP=Crude protein; 4EE = Ether extract; 5NSC = Non-fiber carbohydrates; 6NDF = Neutral detergent fiber; 7ADF = Acid detergent fibre; 8ADL = Acid detergent lignin; 9IVDMD = In vitro dry matter digestibility; 10UFL = Feed unit for milk production; 11MP = Metabolizable protein.
Table 7.
Effects of experimental group (G), week (W) and their interaction (G×W) on feed intake of Sarda dairy ewes (least-squares means ± SE).
Table 7.
Effects of experimental group (G), week (W) and their interaction (G×W) on feed intake of Sarda dairy ewes (least-squares means ± SE).
| alfalfa hay | sulla hay | sulla haylage | Effects, P value | |||
|---|---|---|---|---|---|---|
| G | W | GxW | ||||
| HDMI1 kg/head/day | 0.690 ± 0.02 a | 0.648 ± 0.02 ab | 0.614 ± 0.02 b | 0.05 | 0.001 | 0.001 |
| TDMI2 kg/head/day | 2.598 ± 0.02 b | 2.702 ± 0.02 a | 1.970 ± 0.02 c | 0.001 | 0.001 | 0.001 |
| TCPI3 g/head/day | 405 ± 1.5 a | 300 ± 1.5 b | 231 ± 1.5 c | 0.001 | 0.001 | 0.001 |
| TUFLI4 unit/head/day | 1.97 ± 0.01 b | 2.04 ± 0.01 a | 1.58 ± 0.01 c | 0.001 | 0.001 | 0.001 |
| TMPI5 g/head/day | 363 ± 1.3 a | 274 ± 1.3 b | 212 ± 1.3 c | 0.001 | 0.001 | 0.001 |
Different letters indicate differences between groups. 1HDMI = Herbage dry matter intake; 2TDMI = Total dry matter intake; 3TCPI = Total crude protein intake; 4TUFLI = Total feed unit for milk production intake; 5TMPI = Total metabolizable protein intake.
Table 8.
Effects of experimental group (G), sampling month (M) and their interaction (G × M) on live weight (LW) and body condition score (BCS) of Sarda dairy ewes (least-squares means ± SE).
Table 8.
Effects of experimental group (G), sampling month (M) and their interaction (G × M) on live weight (LW) and body condition score (BCS) of Sarda dairy ewes (least-squares means ± SE).
| alfalfa hay | sulla hay | sulla haylage | Effects, P value | |||
|---|---|---|---|---|---|---|
| G | M | GxM | ||||
| LW1 kg | 51.54 ± 0.31 | 52.06 ± 0.31 | 51.60 ± 0.31 | 0.44 | 0.001 | 0.52 |
| BCS2 | 2.59 ± 0.03 | 2.61 ± 0.03 | 2.57 ± 0.03 | 0.79 | 0.01 | 0.69 |
Different letters indicate differences between groups. 1LW = Live weight; 2BCS = Body condition score.
Table 9.
Effects of experimental group (G), week (W) and their interaction (G × W) on milk yield and milk composition of Sarda dairy ewes (least-squares means ± SE).
Table 9.
Effects of experimental group (G), week (W) and their interaction (G × W) on milk yield and milk composition of Sarda dairy ewes (least-squares means ± SE).
| alfalfa hay | sulla hay | sulla haylage | Effects, P value | |||
|---|---|---|---|---|---|---|
| G | W | GxW | ||||
| Milk kg/head/day | 1.47 ± 0.05 | 1.45 ± 0.05 | 1.37 ± 0.05 | 0.35 | 0.001 | 0.59 |
| FPCM1 kg/head/day | 1.41 ± 0.04 a | 1.33 ± 0.04 b | 1.21 ± 0.04 b | 0.01 | 0.001 | 0.98 |
| Fat g/kg | 6.25 ± 0.09 a | 5.65 ± 0.09 b | 5.36 ± 0.09 c | 0.001 | 0.001 | 0.001 |
| Protein g/kg | 5.57 ± 0.06 a | 5.33 ± 0.06 b | 5.02 ± 0.06 c | 0.001 | 0.001 | 0.001 |
| Lactose g/kg | 4.52 ± 0.03 a | 4.26 ± 0.03 b | 4.13 ± 0.03 c | 0.001 | 0.001 | 0.001 |
| Urea mg/dl | 61.83 ± 0.6 a | 46.55 ± 0.6 b | 45.88 ± 0.6 b | 0.001 | 0.001 | 0.001 |
| SCCS2 | 5.71 ± 0.08 a | 5.74 ± 0.08 a | 5.50 ± 0.08 b | 0.05 | 0.24 | 0.001 |
Different letters indicate differences between groups. 1FPCM = Fat protein corrected milk; 2SCCS = Somatic cell count score (log10 somatic cell count).
Table 10.
Least squares means (LSMeans) of energy and protein efficiency in the 3 dietary treatments.
Table 10.
Least squares means (LSMeans) of energy and protein efficiency in the 3 dietary treatments.
| alfalfa hay | sulla hay | sulla haylage | Effects, P value | |||
|---|---|---|---|---|---|---|
| G | W | GxW | ||||
| EUE1 (FPCM/UFLI) | 0.734 ± 0.02a | 0.640 ± 0.02b | 0.776 ± 0.02a | 0.001 | 0.001 | 0.001 |
| NUE2 (MilkN/NI) | 0.197 ± 0.01c | 0.249 ± 0.01b | 0.299 ± 0.01a | 0.001 | 0.001 | 0.001 |
Different letters indicate differences between groups. 1EUE = Energy utilization efficiency; 2NUE = Nitrogen utilization efficiency.
Disclaimer/Publisher’s Note: The statements, opinions and data contained in all publications are solely those of the individual author(s) and contributor(s) and not of MDPI and/or the editor(s). MDPI and/or the editor(s) disclaim responsibility for any injury to people or property resulting from any ideas, methods, instructions or products referred to in the content. |
© 2026 by the authors. Licensee MDPI, Basel, Switzerland. This article is an open access article distributed under the terms and conditions of the Creative Commons Attribution (CC BY) license (http://creativecommons.org/licenses/by/4.0/).
Copyright: This open access article is published under a Creative Commons CC BY 4.0 license, which permit the free download, distribution, and reuse, provided that the author and preprint are cited in any reuse.


