Preprint
Article

This version is not peer-reviewed.

LED Light-Quality Optimization to Enhance Shoot and Essential Oil Yield of Tagetes erecta L. in Controlled-Environment

A peer-reviewed version of this preprint was published in:
Molecules 2026, 31(9), 1491. https://doi.org/10.3390/molecules31091491

Submitted:

04 April 2026

Posted:

07 April 2026

You are already at the latest version

Abstract

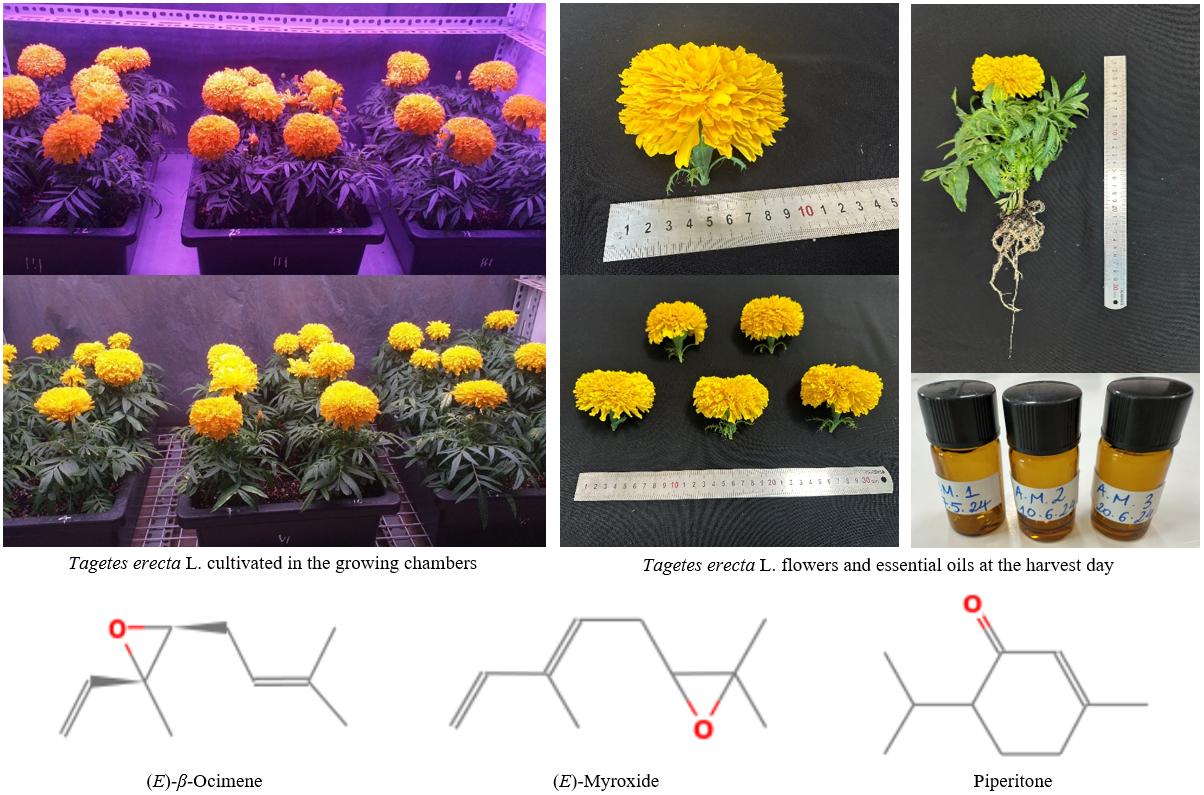
This study evaluated the effects of light spectral quality on shoot yield and essential oil of Tagetes erecta L. cultivated in controlled growth chambers. Plants were grown for up to 101 days under three LED lighting treatments with different red, blue, and white wavelength ratios and a constant 16 h photoperiod. The F2 treatment (5 red­­:1 blue) produced yields of fresh shoots, early blooming flowers, and oils of 271 ± 28 g/tray, 97.43 ± 13.14 g/tray, and 52.46 ± 5.41 mg/tray, respectively. These values were significantly higher (p < 0.05) than those of the F1 treatment (white:red-phosphor), and represented increases of 1.37-, 1.26-, and 1.38-fold, respectively. Gas chromatography identified three major oil constituents—(E)-β-ocimene (22.9–28.8%), (E)-myroxide (13.9–20.6%), and piperitone (7.3–9.6%)—among a total of 24—25 compounds. Essential oils inhibited from four to five of the seven tested microbial strains, with the notable activity against Escherichia coli and Candida albicans recorded in F2 and F1, respectively. These findings confirm that light spectral quality is a critical factor regulating flower, essential oil yield, and antimicrobial efficacy in T. erecta, and support the use of optimized LED spectra as a practical approach to improve plant’s yield and phytochemical quality.

Keywords: 
;  ;  ;  ;  ;  

1. Introduction

African marigold (Tagetes erecta L.), a member of the Asteraceae family, is an annual herbaceous species characterized by pinnately compound leaves, and large flowers - either single or double capitula that range from bright yellow to deep orange. Owing to its prolific flowering, vivid coloration, and relatively short growth cycle, African marigold is widely cultivated as an ornamental crop. Among six evaluated Tagetes species, African marigold has demonstrated the highest flower yield, reaching up to 7.3 t ha⁻¹ [1]. Species of the genus Tagetes are well known for their insecticidal and nematicidal properties [2,3]. They are frequently incorporated into crop rotations as natural pest-repellent plants due to the bioactive volatile compounds present in their leaves and flowers. The flowers and their extracts are used in traditional medicine for anti-inflammatory, antiseptic, and digestive purposes. In addition, its antibacterial and antioxidant activities were investigated [4]. On the other hand, the flowers are rich in carotenoids, particularly lutein, which are extracted for use as natural food colorants, feed additives, and ingredients in pharmaceutical and cosmetic formulations [5]. Essential oils from Tagetes species are valued in perfumery, deodorants, and personal care products, and are increasingly studied for applications as biopesticides and flavoring agents [6]. Species such as T. minuta and T. erecta supply essential oils to niche segments of the fragrance industry. However, essential oil content and composition vary widely depending on plant organ, cultivar, geographic origin, environmental conditions (including light and nutrition), harvest time, and extraction method [7,8,9,10,11,12]. Although African marigold holds substantial medicinal and economic value and is widely cultivated commercially, such compositional variability poses challenges for product standardization, underscoring the need for optimized and standardized cultivation, harvesting, drying, and extraction protocols.
African marigolds can be cultivated and harvested under traditional open-field conditions; however, greenhouse production enables year-round cultivation and greater environmental control. In such systems, optimizing growth conditions—particularly light supply—is essential to ensure high productivity and consistent product quality. Light is a key ecological factor regulating the growth, morphology, and physiology of Asteraceae in general and Tagetes species in particular. Beyond serving as the primary energy source for photosynthesis, light acts as a regulatory signal influencing flowering, branching, pigment synthesis, and essential oil biosynthesis [11]. Both light intensity and spectral quality—especially within the red (R), blue (B), green (G), and far red (Fr) regions—strongly affect the biosynthesis and accumulation of secondary metabolites such as carotenoids, flavonoids, phenolics, and terpenoids, which determine the aroma, bioactivity, and medicinal value of this species [13]. R and B wavelengths regulate stem elongation, leaf expansion, and photosynthetic enzyme activity [14], while irradiance, spectrum, and photoperiod collectively modulate gene expression associated with secondary metabolic pathways. Spectral variation can shift plant resource allocation between biomass production and secondary compound accumulation [15]. Numerous studies highlight the importance of optimizing R:B ratios. For example, R:B (1:1) increased fruit size and weight in chili pepper (Capsicum annuum 'Cheonyang') while enabling control of capsaicinoid and carotenoid content [16]. In strawberry (Fragaria × ananassa), R:B (1.1:1.0) improved fresh weight compared with white (W) light and other R:B ratios [17]. Various R:B combinations also enhanced vegetative and floral traits in Lilium brownii var. viridulum ‘Corvara’ [18]. In T. minuta, moderate shading (~25%) increased total oil content relative to full sun or heavy shade, whereas 50–70% shading reduced oil yield and altered composition [11]. LED studies in T. erecta showed that combined R:B (1:1) lighting or cool white fluorescent lamps at 90 ± 10 µmol m⁻² s⁻¹ under a 16-h photoperiod enhanced dry biomass accumulation, while R:Fr (1:1) increased bud formation, and fluorescent light maximized open flower number [19]. R-light generally promotes early flowering and biomass production, whereas higher B fraction often enhances plant height, pigment accumulation, antioxidant activity, and certain secondary metabolites. Thus, the R:B ratio should be tailored according to production objectives, whether maximizing flower and essential oil yield or enhancing phytochemical quality [20]. Furthermore, a daily light integral (DLI) ≥ 10 mol m⁻² d⁻¹ during the finishing stage was shown to produce uniformly high-quality T. erecta stems [21]. Spectral management is also important during post-production: fluorescent or green LED lighting effectively maintained the quality of T. erecta ‘Orange Boy’ seedlings during 28 days of storage at 8 °C under low irradiance conditions [22].
Optimizing artificial light spectra represents a promising strategy for enhancing growth and increasing the biological value of Asteraceae species by regulating the accumulation of bioactive secondary metabolites. This approach is particularly important for medicinal and essential oil crops, in addition to supporting the ornamental value of Asteraceae in general and African marigold in particular. Cultivation of medicinal plants in controlled growth chambers—where temperature, humidity, and light spectra are precisely regulated—offers significant advantages in the context of climate change. Such systems buffer crops from heat stress, heavy rainfall, and extreme weather fluctuations, ensuring uniform growth and potentially shortening production cycles. Spectral and irradiance optimization enhances photosynthetic efficiency and stimulates the biosynthesis of biologically active secondary compounds, which are critical determinants of medicinal quality. Precise environmental control also reduces pest and disease pressure, minimizes pesticide use, and water consumption, and facilitates the production of clean, standardized plant materials. Moreover, controlled environments enable year-round and off-season cultivation, ensuring a stable supply chain for medicinal and ornamental markets. Collectively, this production model enhances yield, appearance, and phytochemical quality while supporting sustainable and climate-resilient agriculture [23,24,25].
Building on these advantages, the present study evaluated the effects of different light spectra on the growth, development, and essential oil accumulation of T. erecta under controlled growth chamber conditions. By systematically adjusting spectral composition, we aimed to identify optimal wavelength combinations that promote uniform vegetative growth, synchronized flowering, and enhanced synthesis of bioactive secondary metabolites. Such optimization not only improves medicinal quality and supply reliability but also enhances ornamental traits, including flower size and morphology. To our knowledge, this is the first study to comprehensively assess the impact of multispectral LED lighting on essential oil content, chemical composition, and antimicrobial activity in T. erecta, providing new insights for sustainable and precision-based cultivation strategies.

2. Results and Discussions

2.1. The Effect of LED Light Conditions on Biomass and Essential Oil Yield of Tagetes Erecta

The different light spectra had distinct effects on growth, development, and essential oil biosynthesis in the aerial parts of Tagetes erecta L. (African marigold). The time to first flowering (defined as at least one fully opened flower per plant) ranged from 11 weeks to more than 14 weeks. White LEDs coated with red-emitting phosphor (WRp, treatment F1) promoted earlier flowering (77 days) compared to treatments combining R with B and/or W lights (91 and 101 days in treatments F2 and F3, data not showed). Significant differences (p < 0.05) were observed in the fresh yield of the first-opened flowers. The highest values were recorded in F2 (5R1B, 97.43 g/tray) and F3 (3R2B1W, 91.54 g/tray) treatments, while the lowest were found in F1 (WRp, 77.06 g/tray) treatment (Figure 1 (A)). At harvest, each plant yielded 1–2 opened flowers, with the highest average number of flowers obtained in F1 (9.77 flowers/tray). The lowest number was recorded in F3 (8.20 flowers/tray), but the difference was not significant between the treatments (Figure 1 (B)). The fresh yields of total flowers were also slightly different between the lighting treatments, that ranged from 97.59 to 111.6 g/tray (Figure 1 (C)). The proportion of flower fresh yield relative to the combined yield of stems, leaves, and buds varied between 66.03% and 99.21%. The F1 yielded the highest flower weight ratio, which differed significantly (p = 0.001) from the other treatments (Figure 1 (D)).
In higher vascular plants, radiation is perceived by several classes of photoreceptors. Phytochromes primarily absorb R (601–700 nm) and Fr (701–800 nm) wavelengths, cryptochromes absorb B (400–500 nm) and UV-A radiation, and phototropins are specialized B-light receptors, as first characterized in Arabidopsis thaliana [26]. These photoreceptors interact to regulate flowering, photomorphogenesis, and photosynthetic development [27,28,29]. In the present study, treatment F1 (WRp) provided broad spectral compositions, thereby promoting earlier reproductive development [30]. Notably, this treatment contained higher proportion of Fr radiation (12.45 %, see Table 5), a key signal for floral induction mediated primarily through phytochromes [31,32]. Phytochromes exist in two interconvertible forms: the inactive Pr (R-absorbing) and the active Pfr (Fr-absorbing) form, with their relative abundance regulated by R and Fr radiation [33]. Fr enrichment can accelerate flowering by reducing the level of active phytochrome B (Pfr), a known floral repressor in both long-day and short-day species [34,35]. Earlier flowering under R:Fr (1:1) irradiation was also reported in marigold at 90 ± 10 µmol m⁻² s⁻¹ [19]. In contrast, F3 (3R2W1B) treatment exhibited the latest flowering time (p < 0.001), possibly due to its higher proportions of B-light (42.05 %) and G-light (10.22 %) (see Table 5), which can delay flowering [36,37]. B-light at ≥ 20 µmol m⁻² s⁻¹ promoted flowering in long-day plants but might inhibit flowering in short-day species when applied as night interruption or photoperiod extension [38,39]. Whereas, the lower B proportion in F1 treatment was insufficient to delay flowering, consistent with reports that low-intensity nocturnal B-light does not affect flowering in some short-day plants, including African marigold [40]. A noteworthy finding of this study is that the time to first flowering is inversely proportional to the intensity ratio of R- to B-light. This observation aligns with previous research demonstrating that R-light plays a key role in promoting earlier flowering in African marigold [20]. Collectively, these results highlight the central role of phytochrome-mediated signaling in regulating flowering and demonstrate how spectral adjustment can be used to control vegetative growth and reproductive timing in a species-specific manner.
The greatest fresh yield of early-blooming flowers was achieved under R- and B-light condition with a ratio of 2.84 : 1 (73.45 % : 25.82 %, treatment F2, see Table 5), while the irradiance from other spectra was negligible. This underscores the synergistic role of these two wavelengths in promoting floral biomass during African marigold growth and development. Chlorophyll exhibits absorption peaks around 430 nm and 660 nm, corresponding to B and R light, respectively; therefore, these wavelengths are particularly effective in driving photosynthesis and biomass accumulation [41]. The promotive effects of R- and B-light observed in this study are consistent with previous reports. R-light was shown to significantly increase biomass, while B-light enhances plant height in African marigold [42]. A 3:1 of R-to-B-LED ratio supported morphological development and increased average fruit weight in tomato (Solanum lycopersicum) [43]. Similarly, a 7:1 ratio improved dry weight in Chinese cabbage (Brassica chinensis) compared with HPS lighting [44], and 8:1–9:1 ratios enhanced shoot biomass in cucumber (Cucumis sativus) [45]. These improvements are likely associated with enhanced photosynthetic capacity and increased stomatal conductance under combined R- and B-lights, facilitating CO₂ assimilation and transpiration [14]. However, plant responses are strongly ratio-dependent. In tomato, R:B (9:1) increased dry weight more than 7:3 or 1:1 ratios [46], whereas fruit yield improved only under R:B (5:1) at 135 μmol m⁻² s⁻¹ [47]. Treatment F1 exhibited the lowest yield of early-blooming flowers, likely because flowering occurred too early, before the plants had reached peak vegetative growth and accumulated sufficient biomass, thereby limiting flower development and quality. In addition, the presence of a G-light component in F1 (5.88%) may have further contributed to the reduced flower yield. Although treatment F3 flowered later than F2 (101 days versus 91 days), its higher proportion of G-light (10.22% versus 0.52%) may have negatively influenced assimilate accumulation, resulting in a slightly lower flower yield compared with F2. This is consistent with previous research showing the negative impact of G-light on the biomass of tomato and basil [48].
The highest flower number observed in F1 aligns with studies showing that fluorescent light supplemented with R-LED enhances flowering in African marigold [19,42]. Likewise, R:B (3:1) increased flower number by 15% compared with R:B (1:1) or HPS lighting under continuous supplemental illumination [49], and similar results were reported for the ‘Antigua Orange’ cultivar at 120 μmol m⁻² s⁻¹ [50]. A comparison of the data recorded between the two treatments: F2 (R:B = 73.45% : 25.82%) and F3 (R:B = 47.30% : 42.05%) in the current study are also consistent with this trend. Conversely, while the F1 treatment showed the highest number of African marigold flowers, its fresh flower yield was the lowest. This indicates smaller flower size compared to the other treatments. On the other hand, the ratio of flower yield to the yield of the rest of the shoot was highest in F1, meaning that their stem, leaves, and flower buds of the marigold also had the lowest biomass among the treatments.
The fresh yield of shoot parts of African marigold was highest under treatment of F2 (271 ± 28 g/tray), followed by F3 (268 ± 21 g/tray). These values were significantly higher (p < 0.001) than the treatment of F1 (198 ± 29 g/tray). This indicates that LED illuminations containing R and B spectra at the ratios of 2.84 : 1 (73.45% : 25.82%) and 1.12 : 1 (47.30% : 42.05%) have more positive effects on the growth of this species than the ratio of 3.71 : 1 (64.28% : 17.33%). Simultaneously, these results further demonstrate that the precise balance of R and B spectral components, unique to each species and variety, is critical for optimal plant development. In addition, the G-depleted spectrum in treatment F2 (0.52%) likely promoted plant growth, resulting in greater biomass accumulation compared with treatments containing higher proportions of G-light. This result is consistent with earlier findings reported by Klein et al. [51]. Plant water content ranged from 89.2–90.2%, with lower value achieved in treatment F1. This result may be due to the impact of the high ratio of R : B and the high proportion of Fr in F1, through a mechanism of increased stomatal conductance leading to increased transpiration [52,53]. Dry yields of shoot part were greatest under treatments F3 (26.81 ± 2.10) and F2 (26.57 ± 2.74 g/tray), with no significant difference between them. Both values were significantly higher (p = 0.003) than that of treatment F1 (21.37 ± 3.15 g/tray). Essential oil concentration and yield differed significantly (p < 0.001) among the three treatments, with the highest value observed in F2 (0.2285 ± 0.0155 % and 52.46 ± 5.41 mg/tray), followed by F3 (0.1974 ± 0.0126 % and 43.11 ± 3.38 mg/tray), and the lowest value in F1 (0.1541 ± 0.0101 % and 37.95 ± 5.59 mg/tray) (Table 1).
The effect of light on shoot yield of African marigold showed the most positive response under the F2 treatment in the present study. This result is relatively consistent with previous research showing that a B:R (1:3) spectral ratio under supplemental lighting increased above-ground biomass yield in African marigold, compared with a B:R (1:1) and high-pressure sodium (HPS) lighting [49]. The essential oil content observed in this study was also comparable to previous reports, e.g., floral essential oil reached up to 2.5% of fresh weight [1], while leaf essential oil content was approximately 0.2% [54]. Variation in oil content in African marigold appears to be influenced, at least in part, by spectral quality. Under equivalent light intensities in the present study, treatments containing a high total fraction of R and B lights (treatments F2, R+B = 99.27%, and F3, R+B = 89.35%) significantly enhanced essential oil biosynthesis and accumulation compared with the WRp treatment (F1, R+B = 81.61%). These results highlight the positive role of combined R and B wavelengths in stimulating secondary metabolite production, consistent with findings in lettuce [55]. A previous study demonstrated that R-light positively influenced essential oil production in Thymus migricus and T. carmanicus, whereas W-light exerts a stimulatory effect in T. vulgaris and T. kotschyanus [56]. In general, plants response to light spectra are species-specific, resulting in considerable variation in the accumulation of volatile compounds. To our knowledge, no previous studies have specifically examined the effects of light spectral composition on essential oil accumulation in African marigold, underscoring the novelty of the present work.
Thus, these results demonstrate that different light spectra distinctly influence the growth of African marigold. Therefore, light wavelength composition can be strategically adjusted to regulate plant photomorphogenesis under indoor cultivation, depending on production goals. To promote early flowering and increase flower number, incorporating a small proportion of Fr-light into the growing environment is recommended. On the other hand, to achieve larger flower size, higher shoot yield, and greater accumulation of volatile compounds, cultivation conditions should minimize or exclude G-light and maintain an R:B ratio between 1.12:1 and 2.84:1, rather than using a higher ratio such as 3.71:1. These recommendations apply under conditions of light intensity and other environmental parameters equivalent to those established in this study.

2.2. The Effect of LED Light Conditions on Essential Oil Composition of Tagetes Erecta

The essential oils extracted from the aerial parts of African marigold under different light treatments contained 24–25 identified compounds, representing 93.7–94.7% of the total composition. The predominant groups were monoterpene hydrocarbons (40.2–46.8%) and oxygenated hydrocarbons (35.8–42.0%). Three major constituents were identified: (E)-β-ocimene (22.9–28.8%), (E)-myroxide (13.9–20.6%), and piperitone (7.3–9.6%). The contents of each of these three main compounds in African marigold essential oil differed significantly (p < 0.001) among the three light treatments in the current study. The highest concentrations of (E)-β-ocimene and piperitone were observed under illumination treatment F3, whereas the lowest were recorded under F1. In contrast, (E)-myroxide reached its highest concentration under F1 and its lowest under F3. Other relatively abundant constituents included limonene (5.2–5.7%), terpinolene (4.5–5.5%), 3-thujyl acetate (4.0–5.1%), and piperitenone (4.3–6.2%). The remaining compounds had concentrations ranging from trace (Tr) to 3.8% of the total oils (Table 2).
The essential oil composition of African marigold reported in this study is not much different from findings of previous research, although relative proportions vary. For example, flower and leaf samples from Italy contained limonene (3.5% and 15.6%), terpinolene (5.8% and 28.5%), and piperitone (28.9% and 24.2%) [1]. In Brazil, leaf samples were rich in terpinolene (12.4%), (E)-β-ocimene (13.1%), piperitone (20.0%), and limonene (11.0%) [54]; limonene (10.4%), dihydrotagetone (11.8%), α-terpinolene (18.1%), and (E)-β-ocimene (13.0%) [57]. Samples from India showed limonene (7.6% and 6.9%), terpinolene (11.2% and 4.7%), (Z)-myroxide (4.2% and 7.9%), piperitone (52.4% and 28.5%), piperitenone (5.0 and 10.9), and varying levels of piperitenone oxide, and β-caryophyllene [58]. Flowers generally produce higher levels of oxygenated terpenes than leaves [12,59]. The data of African marigold essential oils show recurring major constituents, but their relative abundance depends on cultivar, plant part, environmental conditions, developmental stage, extraction method, and geographic origin. Notably, the essential oil sample in this study had significantly higher levels of (E)-β-ocimene and (E)-myroxide compared to samples from other countries. Lighting condition with a high R:B ratio increased the accumulation of (E)-myroxide, while the opposite effect was observed for the most dominant compound, (E)-β-ocimene. The study results showed that the synergistic effect of these primary spectra (R and B), when applied at appropriate ratios and intensities, not only enhances plant growth but also actively promotes the accumulation of the target compounds. Depending on the intended post-harvest use of African marigold, specific spectral conditions can be selected. For instance, to maximize (E)-β-ocimene yield, an R:B ratio of 1.12:1 under comparable environmental conditions may be applied. In addition, Fr and G spectral components may also partly contribute to this effect; however, this aspect has not yet been systematically investigated.

2.3. The Effect of LED Light Conditions on Antimicrobial Activity of the Essential Oil of Tagetes Erecta

The antimicrobial activity of African marigold essential oils was tested against seven microbial strains: three Gram-positive bacteria (Staphylococcus aureus, Bacillus subtilis, Lactobacillus fermentum), three Gram-negative bacteria (Salmonella enterica, Escherichia coli, Pseudomonas aeruginosa), and one yeast (Candida albicans). Overall, the African marigold essential oils grown under different lighting conditions showed no inhibitory effect against B. subtilis. Another common characteristic of these samples is their inhibition against three pathogenic microorganism strains, including S. aureus, E. coli, and P. aeruginosa. The MIC values of all three oil samples against the seven tested microorganism strains ranged from 8000 to >16,000 µg/mL . The oil from treatment F1 demonstrated the strongest antimicrobial activity, inhibiting 5/7 strains. It was most effective against S. aureus, S. enterica, and C. albicans (IC₅₀ = 4500 ± 201 to 13,818 ± 610 µg/mL). The oil from treatment F2 also inhibited 5/7 strains, with IC₅₀ values of 4758 ± 225 to 12,000 ± 579 µg/mL. Notably, it inhibited E. coli most strongly compared with other treatments. By comparison, F3 inhibited 4/7 strains, with IC50 values ​​ranging from 7,571 ± 377 to 16,000 ± 577 µg/mL indicating the weaker inhibition (Table 3).
The African marigold essential oil from treatment F1, with the highest proportion of oxygenated monoterpene group (42.0%), may be the reason for its leading antimicrobial activity against three strains: S. aureus, S. enterica, and C. albicans. However, the inhibition levels of African marigold essential oils against other microbial strains may be due to the synergistic effect of their constituents. The essential oil of African marigold leaves contains high levels of (Z)-β-ocimene, which has been shown to have antifungal activity against several pathogenic fungi, with IC50 values ​​from Petri dishes of 2-6 µL/80 mm depending on the fungal strains tested [60]. Some previous research showed that the dominance of tagetone and ocimene contributes to the characteristic aroma and reinforces the broad spectrum of bioactivity associated with African marigold essential oil [6,12]. Overall, African marigold essential oil in different light formulations showed inhibitory activity against from four to five out of seven tested microorganism strains. None of the oil samples inhibited B. subtilis, and only one oil sample weakly inhibited L. fermentum. Previous studies indicated that African marigold essential oil exhibits very low or no toxicity in animal models. Specifically, weak toxicity was observed in mice [61], and dermal exposureon rats produced no toxic effects [62]. In contrast, in vitro studies reported high cytotoxic activity of African marigold essential oil against both tumor and normal cell lines [57,63]. This is the basis for the potential use of African marigold essential oil in serving human life activities.
These findings indicate that the antimicrobial activity of African marigold essential oil can be modulated by altering light spectral composition during cultivation. WRp LED lighting under the conditions established in this study can be recommended, as it inhibited five harmful microorganisms while showing no inhibitory effects on two beneficial Gram-positive bacteria.

3. Materials and Methods

3.1. Plant Materials and Lighting Conditions

The experiment was conducted in a growth chamber in Hanoi, Vietnam (N21°04ʹ07ʺ, E105°45ʹ51ʺ). The seeds of Tagetes erecta L. (African marigold), cultivar PH-10, purchased from Phuong Hoang Ltd. company in Ho Chi Minh city, Vietnam, were sown in February 2024. The seedlings were transplanted in March 2024 with a distance of 20 × 15 cm, six plants per one black plastic rectangle tray (38 × 45 × 12 cm). A substrate mixture of peat moss, vermiculite and perlite at a ratio of 3:1:1 (v/v) was filled in the trays. The growth chamber was maintained at 25 °C using a Daikin air conditioner 24000 btu (model: FTXM71XVMV, Thailand), with relative humidity controlled between 60–80% using a humidifier (model: H981-F33, China). The seedlings were irrigated every two days with water, and once a week with 50 mL of ½ MS solution (Table 4). Each experimental treatment was replicated 6 times.
Then, a multiple spectral LED lighting experiment was held during 11 to more than 14 weeks from 11th March 2024 to 20th June 2024. Three LED treatments conducted by combinations of different light spectra including red (R), white (W), blue (B) were measured using CL-500A Illuminance Spectrophotometer, Konica Minolta, Tokyo 100-7015, Japan. F1-treatment consists of a W-LED and R-phosphor; F2-treatment is a combination of semiconductor LEDs with narrow bandwidth at 460 nm (B-LED) and 660 nm (R-LED); F3-treatment is optically configured by semiconductor B- and R-LEDs which was augmented with a certain small number of W-phosphor-converted LEDs. The LED light intensity was maintained at 2500 lux with a tolerance of ± 100 lux measured using T-10A Illuminance Meter, Konica Minolta, Tokyo 100-7015, Japan, which caused no photodamage or heat stress to plant [64], and was applied continuously16 h/day, starting before sunrise and extending after sunset (Table 5 and Figure 2). The T5-type LED lamps with a length of 1.2 m were installed above the growth chamber at an approximate distance of 70 cm from the chamber floor to ensure uniform light distribution and spectral blending. The lamps were centrally positioned and aligned longitudinally along the growth chamber. Plants in each treatment were isolated using black sheets to prevent interference from other light sources. The aerial parts of African marigold were harvested at the time that at least one flower per plant is full blooming, for further analysis and evaluation.
Table 5. Light conditions in the cultivation of Tagetes erecta.
Treatments F1 F2 F3
LED ratio White: Red-phosphor (WRp) 5 Red : 1 Blue (5R1B) 3 Red : 2 Blue : 1 White (3R2B1W)
Spectral distribution (%)
{(UV < 400 nm) : (B ~ 400-500 nm) : (G ~ 501-600 nm) : (R ~ 601-700nm) : (Fr >700 nm)}
0.06 : 17.33 : 5.88 : 64.28 : 12.45 0.07 : 25.82 : 0.52 : 73.45 : 0.14 0.09 : 42.05 : 10.22 : 47.30 : 0.34
Total of B & R (%) 81.61 99.27 89.35
The reduced ratio of R to B 3.71 : 1 2.84 : 1 1.12 : 1
Duration (h/day) 16 16 16
Lighting time 6:00-22:00 6:00-22:00 6:00-22:00
Light intensity (lux) 2500 ± 100 2500 ± 100 2500 ± 100
Light intensity (µmol·m-2·s-1) 206 ± 8.2 208 ± 8.3 199 ± 8.0
Total daily light (mol·m-2 ·d-1) 11.866 ± 0.472 11.981 ± 0.478 11.462 ± 0.461
To compare the spectral ratios between the three treatments, their common point is that they all have the highest amounts of R and B spectra, and almost no UV spectrum. The difference is that treatment F1 contains the highest amount of Fr and the lowest amount of B, compared to the other two treatments. F2 has almost no G- and Fr-light, but the highest amount of R. Treatment F3 contains the highest amount of B and G, compared to F1 and F2, almost no Fr, and a slightly higher UV.

3.2. Essential Oil Isolation

Each African marigold sample, consisting of 1.1–1.5 kg of aerial biomass, was shredded and subjected to hydrodistillation for 3.5 hours using a Clevenger-type apparatus [65]. The obtained essential oil was then separated and stored at –5 °C for subsequent analysis.

3.3. Essential Oil GC-MS and GC-FID Analysis

Essential oils were analyzed by GC/MS-FID using an Agilent 7890A GC system coupled with a 5975C Mass Selective Detector. Separation was performed on an HP-5MS fused silica capillary column (60 m × 0.25 mm i.d., 0.25 μm film thickness). Helium was used as the carrier gas at a flow rate of 1.0 mL/min. The injector was set at 250 °C, with a 1 μL injection volume in split mode (1:100). The oven program started at 60 °C and was increased to 260 °C at 4 °C/min. Detector temperatures were maintained at 280 °C. For MS analysis, conditions included an interface temperature of 280 °C, electron ionization (EI) at 70 eV, a scan rate of 4.0 scans/s, and a mass range of 35–450 Da. FID analysis was conducted under identical chromatographic conditions, with the detector temperature also set at 250 °C. Constituents were identified by comparing their relative retention indices (determined by co-injection with a homologous series of n-alkanes, C7–C30) and mass spectral fragmentation patterns with reference libraries (NIST08, Wiley09, HPCH1607) [66,67,68]. Data was processed using MassFinder 4.0. Relative concentrations were calculated from FID peak areas without standardization.

3.4. Tested Microbial Strains

The antimicrobial activity of the essential oils was evaluated against three Gram-positive bacteria (Staphylococcus aureus ATCC 13709, Bacillus subtilis ATCC 6633, and Lactobacillus fermentum VTCC N4), three Gram-negative bacteria (Salmonella enterica VTCC, Escherichia coli ATCC 25922, and Pseudomonas aeruginosa ATCC 15442), and one yeast strain (Candida albicans ATCC 10231). ATCC strains were obtained from the American Type Culture Collection, while VTCC strains were provided by the Vietnam Type Culture Collection, Institute of Microbiology and Biotechnology, Vietnam National University, Hanoi.

3.5. Screening of Antimicrobial Activity of Essential Oil

The minimum inhibitory concentration (MIC) and half-maximal inhibitory concentration (IC₅₀) of the essential oils were determined in triplicate using the broth microdilution method [69,70]. Stock solutions were prepared in dimethyl sulfoxide (DMSO) and serially diluted with sterile distilled water to yield concentrations ranging from 16,000 to 1000 μg/mL (serial dilutions include five concentrations: 16,000, 8000, 4000, 2000, and 1000 μg/mL). Dilutions were prepared in microtubes and transferred into 96-well microplates. Bacterial strains were cultured in double-strength Mueller–Hinton broth or double-strength tryptic soy broth, while fungal strains were grown in double-strength Sabouraud dextrose broth. Microbial suspensions were adjusted to 5 × 10⁵ CFU/mL for bacteria and 1 × 10³ CFU/mL for fungi. Negative controls contained culture medium without essential oil dilutions and microorganisms, and positive controls consisted of culture medium and microorganisms. Plates were incubated at 37 °C for 24 h, and MIC values were defined as the lowest concentration that completely inhibited visible microbial growth. IC₅₀ values were calculated from the percentage of growth inhibition, based on turbidity measurements recorded with an EPOCH2C spectrophotometer (BioTek Instruments, Winooski, VT, USA). Data were analyzed using Raw Data software (Intercity Business Park Mechelen Noord, Mechelen, Belgium) according to the following equations:
% i n h i b i t i o n = O D c o n t r o l +   O D t e s t   a g e n t O D c o n t r o l + O D c o n t r o l × 100 %
I C 50 = H i g h C o n c   ( H i g h I n h %   50 % )   ( H i g h C o n c L o w C o n c ) ( H i g h I n h % L o w I n h % )
Where:
OD: Optical density; control (+): Cells in medium without antimicrobial agent; test agent: coressponds to a specific, known concentration of the antimicrobial agent; control (-): Culture medium without cells. HighConc/LowConc: High and low concentrations of the test agent, respectively; HighInh%/LowInh%: Percentage of microbial growth inhibition at high and low concentrations, respectively.
Reference materials: Ampicillin was used as a reference for Gram (+) bacteria, with IC₅₀ and MIC values of 0.02–3.62 µg/mL and 0.125–32.0 µg/mL, respectively. Cefotaxime served as the reference for Gram (–) bacteria, showing IC₅₀ values of 0.07–4.34 µg/mL and MIC values of 0.5–32.0 µg/mL. For fungal strains, nystatin was employed, exhibiting an IC₅₀ of 1.32 µg/mL and an MIC of 8.0 µg/mL.

3.6. Statistical Analysis

Data of African marigolds were evaluated using a single-factor completely randomized ANOVA to assess the effects of different lighting treatments. When significant differences were observed, mean separation was performed using the least significant difference (LSD) test at p ≤ 0.05. All statistical analyses were conducted with IRRISTAT version 5.0 (International Rice Research Institute, Philippines).

4. Conclusions

Light quality plays a pivotal role in regulating both vegetative and reproductive growth in plants. In this study, a high proportion of R light combined with a specific B spectrum was particularly effective in maximizing plant performance, significantly increasing above-ground biomass, enhancing flower yield, and producing heavier flowers. This spectral combination also stimulated essential oil biosynthesis and accumulation in African marigold, while conferring stronger antibacterial activity against E. coli. In contrast, phosphor-coated W LED light, which contains a relative high fraction of Fr light, promoted earlier flowering and increased flower number. This treatment also resulted in a higher concentration of oxygenated monoterpenes in the essential oils, which might exhibit the strongest antimicrobial activity against S. aureus, S. enterica, and C. albicans. Overall, these findings demonstrate the potential of spectral optimization to enhance crop productivity and phytochemical quality in controlled environments. Tailored lighting regimes can be strategically designed to achieve specific production goals—such as improving flower morphology, increasing yield, or enhancing essential oil content and bioactivity—thereby enabling precise control of plant development and secondary metabolite accumulation in controlled-environment agriculture.

Author Contributions

Conceptualization, H.T.T.C., C.Q.T. and P.T.D.; methodology, H.T.T.C., N.H.N. and C.Q.T.; validation, H.T.T.C., K.Q.T. and P.T.D.; formal analysis, H.T.T.C. and T.T.T.D.; investigation, H.T.T.C., N.H.N., Q.P., T.H.T.H., T.V.N., T.Q.T. .; resources, T.V.N.; data curation, H.T.T.C.; writing—original draft preparation, H.T.T.C.; writing—review and editing, H.T.T.C., H.H.C., W.N.S., K.Q.T. and P.T.D.; project administration, T.V.N.; funding acquisition, T.V.N.. All authors have read and agreed to the published version of the manuscript.

Funding

This research was funded by the Vietnam Academy of Science and Technology, grant number CN4000.01/23-25

Institutional Review Board Statement

Not applicable.

Data Availability Statement

All data are available in this publication.

Conflicts of Interest

The authors declare no conflicts of interest.

Abbreviations

The following abbreviations are used in this manuscript:
B blue
DLI daily light integral
Fr far red
G green
IC₅₀ half-maximal inhibitory concentration
MIC minimum inhibitory concentration
R red
Rp red-phosphor
Tr trace
UV ultra violet
W white

References

  1. Marotti, M.; Piccaglia, R.; Biavati, B.; Marotti, I. Characterization and Yield Evaluation of Essential Oils from Different Tagetes Species. J. Essent. Oil Res. 2004, 16, 440–444. [Google Scholar] [CrossRef]
  2. Cristina e Santos, P.; Granero, F.O.; Junior, J.L.B.; Pavarini, R.; Pavarini, G.M.P.; Chorilli, M.; Zambom, C.R.; Silva, L.P.; Silva, R.M.G. da Insecticidal Activity of Tagetes Erecta and Tagetes Patula Extracts and Fractions Free and Microencapsulated. Biocatal. Agric. Biotechnol. 2022, 45, 102511. [Google Scholar] [CrossRef]
  3. Sharma, G.; Rajhansa, K.C.; Sharma, P.; Singh, A.; Sharma, A.; Sahu, M.K.; Sharma, R.; Pandey, A.K. Marigold (Tagetes Spp.): A Diverse Crop with Multipurpose Value for Health and Environment: A Review. Agric. Rev. 2024, 45, 618–626. [Google Scholar] [CrossRef]
  4. Talukdar, N.; Kashyap, B.; Barman, I.; Gogoi, J.; Kalita, P.P. A Review on Tagetes Erecta (Marigold) with Reference to Its Pharmacologicalimportance. Indian J. Nat. Sci. 2023, 14, 56465–56472. [Google Scholar]
  5. Siddiqa, A.; Khaliq, A.; Mehmood, T.; Chughtai, M.F.J.; Sanchez-Migallon, A.M.; Ahsan, S.; Sabir, A.; Mohamed Ahmed, I.A. Phytochemical Profiling of Tagetes Erecta L. Flowers at Various Blooming Stages through Optimized Extraction of Bioactive Compounds for the Development of Functional Juice. Front. Sustain. Food Syst. 2025, 9. [Google Scholar] [CrossRef]
  6. Salehi, B.; Valussi, M.; Morais-Braga, M.F.; Carneiro, J.N.; Leal, A.L.; Coutinho, H.D.; Vitalini, S.; Kręgiel, D.; Antolak, H.; Sharifi-Rad, M.; et al. Tagetes Spp. Essential Oils and Other Extracts: Chemical Characterization and Biological Activity. Molecules 2018, 23, 2847. [Google Scholar] [CrossRef]
  7. Ravikumar, P. Chemical Examination and Insecticidal Properties of Tagetes Erecta and Tagetes Patula. Asian J. Biol. Sci. 2010, 5, 29–31. [Google Scholar]
  8. Gupta, P.; Vasudeva, N. A Potential Ornamental Plant Drug. Hamdard Med. 2012, 55, 45–59. [Google Scholar]
  9. Singh, P.; Krishna, A.; Kumar, V.; Krishna, S.; Singh, K.; Gupta, M.; Singh, S. Chemistry and Biology of Industrial Crop Tagetes Species: A Review. J. Essent. Oil Res. 2016, 28, 1–14. [Google Scholar] [CrossRef]
  10. Laosinwattana, C.; Wichittrakarn, P.; Teerarak, M. Chemical Composition and Herbicidal Action of Essential Oil from Tagetes Erecta L. Leaves. Ind. Crops Prod. 2018, 126, 129–134. [Google Scholar] [CrossRef]
  11. Kumar, A.; Gautam, R.D.; Kumar, A.; Singh, S.; Singh, S. Understanding the Effect of Different Abiotic Stresses on Wild Marigold (Tagetes Minuta L.) and Role of Breeding Strategies for Developing Tolerant Lines. Front. Plant Sci. 2022, Volume 12. [Google Scholar] [CrossRef]
  12. Ahmadpour, V.; Modarresi, M.; Eftekhari, M.; Saeedi, M.; Karimi, N.; Rasekhian, M. Chemical Composition of Essential and Fixed Oils of Tagetes Erecta Fruits (Iran) and Their Implications in Inhibition of Cancer Signaling. Sci. Rep. 2024, 14, 19667. [Google Scholar] [CrossRef]
  13. Bhatla, S.C.; Lal, M.A. Plant Physiology, Development and Metabolism, 2nd ed.; Springer Singapore, 2023. [Google Scholar]
  14. Hogewoning, S.W.; Trouwborst, G.; Maljaars, H.; Poorter, H.; van Ieperen, W.; Harbinson, J. Blue Light Dose–Responses of Leaf Photosynthesis, Morphology, and Chemical Composition of Cucumis Sativus Grown under Different Combinations of Red and Blue Light. J. Exp. Bot. 2010, 61, 3107–3117. [Google Scholar] [CrossRef] [PubMed]
  15. Zhang, S.; Zhang, L.; Zou, H.; Qiu, L.; Zheng, Y.; Yang, D.; Wang, Y. Effects of Light on Secondary Metabolite Biosynthesis in Medicinal Plants. Front. Plant Sci. 2021, Volume 12. [Google Scholar] [CrossRef] [PubMed]
  16. Gangadhar, B.H.; Mishra, R.K.; Pandian, G.; Park, S.W. Comparative Study of Color, Pungency, and Biochemical Composition in Chili Pepper (Capsicum Annuum) Under Different Light-Emitting Diode Treatments. HortScience 2012, 47, 1729–1735. [Google Scholar] [CrossRef]
  17. Piovene, C.; Orsini, F.; Bosi, S.; Sanoubar, R.; Bregola, V.; Dinelli, G.; Gianquinto, G. Optimal Red:Blue Ratio in Led Lighting for Nutraceutical Indoor Horticulture. Sci. Hortic. (Amsterdam). 2015, 193, 202–208. [Google Scholar] [CrossRef]
  18. Flores-Pérez, S.; Castillo-González, A.M.; Valdez-Aguilar, L.A.; Avítia-García, E.; Flores-Pérez, S.; Castillo-González, A.M.; Valdez-Aguilar, L.A.; Avítia-García, E. Use of Different Proportions of Red and Blue LEDs to Improve the Growth of Lilium Spp. Rev. Mex. ciencias agrícolas 2021, 12, 835–847. [Google Scholar]
  19. Jeong, W.H.; Chun, W.L.; Kee, Y.P. Influence of Mixed LED Radiation on the Growth of Annual Plants. J. Plant Biol. 2006, 49, 286–290. [Google Scholar] [CrossRef]
  20. Ngcobo, B.L. Influence of LED Lights on Growth, Development, and Antioxidant Capacity of Marigold Plants in Protected Cultivation. In Proceedings of the Acta Horticulturae; International Society for Horticultural Science (ISHS), Leuven, Belgium, September 30 2025; pp. 119–124. [Google Scholar]
  21. Spall, C.E.; Lopez, R.G. Daily Light Integral and/or Photoperiod during the Young Plant and Finishing Stages Influence Floral Initiation and Quality of Witchgrass and Marigold Cut Flowers. Front. Plant Sci. 2022, 13, 956157. [Google Scholar] [CrossRef]
  22. Heo, J.W.; Kim, D.E.; Kang, K.K.; Park, S.H.; Chun, C. Growth and Flowering before and after Storage of African Marigold and Salvia Seedlings Stored under Different Light Conditions. Hortic. Sci. Technol. 2013, 31, 400–406. [Google Scholar] [CrossRef]
  23. Stutte, G.W. Controlled Environment Production of Medicinal and Aromatic Plants. In Medicinal and Aromatic Crops: Production, Phytochemistry, and Utilization; ACS Symposium Series; American Chemical Society, 2016; Vol. 1218, pp. 4–49. ISBN 9780841231276. [Google Scholar]
  24. Boyd, A.P.; Zankowski, P.; Wheeler, R.; Stokes-Draut, J.R.; Chudnovsky, Y.; Ingram, D.; Tijerina, M.; Mickens, M.; Steward, D.; Armstrong, K.; et al. Controlled Environment Agriculture: An Opportunity to Strengthen Interagency Research Collaboration in the US Government. PNAS Nexus 2025, 4, pgaf155. [Google Scholar] [CrossRef]
  25. Dsouza, A.; Dixon, M.; Shukla, M.; Graham, T. Harnessing Controlled-Environment Systems for Enhanced Production of Medicinal Plants. J. Exp. Bot. 2025, 76, 76–93. [Google Scholar] [CrossRef]
  26. Casal, J.J. Phytochromes, Cryptochromes, Phototropin: Photoreceptor Interactions in Plants. Photochem. Photobiol. 2000, 71, 1–11. [Google Scholar] [CrossRef]
  27. Cashmore, A.R.; Jarillo, J.A.; Wu, Y.J.; Liu, D. Cryptochromes: Blue Light Receptors for Plants and Animals. Science 1999, 284, 760–765. [Google Scholar] [CrossRef]
  28. Demotes-Mainard, S.; Péron, T.; Corot, A.; Bertheloot, J.; Le Gourrierec, J.; Pelleschi-Travier, S.; Crespel, L.; Morel, P.; Huché-Thélier, L.; Boumaza, R.; et al. Plant Responses to Red and Far-Red Lights, Applications in Horticulture. Environ. Exp. Bot. 2016, 121, 4–21. [Google Scholar] [CrossRef]
  29. Huché-Thélier, L.; Crespel, L.; Gourrierec, J. Le; Morel, P.; Sakr, S.; Leduc, N. Light Signaling and Plant Responses to Blue and UV Radiations—Perspectives for Applications in Horticulture. Environ. Exp. Bot. 2016, 121, 22–38. [Google Scholar] [CrossRef]
  30. Nie, W.-F.; Li, Y.; Chen, Y.; Zhou, Y.; Yu, T.; Zhou, Y.; Yang, Y. Spectral Light Quality Regulates the Morphogenesis, Architecture, and Flowering in Pepper (Capsicum Annuum L.). J. Photochem. Photobiol. B. 2023, 241, 112673. [Google Scholar] [CrossRef] [PubMed]
  31. Cerdán, P.D.; Chory, J. Regulation of Flowering Time by Light Quality. Nature 2003, 129. [Google Scholar] [CrossRef] [PubMed]
  32. Legris, M.; Ince, Y.Ç.; Fankhauser, C. Molecular Mechanisms Underlying Phytochrome-Controlled Morphogenesis in Plants. Nat. Commun. 2019, 10, 5219. [Google Scholar] [CrossRef]
  33. C. Sager, J.; O. Smith, W.; L. Edwards, J.; L. Cyr, K. Photosynthetic Efficiency and Phytochrome Photoequilibria Determination Using Spectral Data. Trans. ASAE 1988, 31, 1882–1889. [Google Scholar] [CrossRef]
  34. Reed, J.W.; Nagatani, A.; Elich, T.D.; Fagan, M.; Chory, J. Phytochrome A and Phytochrome B Have Overlapping but Distinct Functions in Arabidopsis Development. Plant Physiol. 1994, 104, 1139–1149. [Google Scholar] [CrossRef]
  35. Taiz, L.; Zeiger, E.; Møller, I.M.; Murphy, A. (Eds.) Plant Physiology and Development.; Sinauer Associates Incorporated, 2015; ISBN 9781605353531. [Google Scholar]
  36. Meng, Q.; Runkle, E.S. Regulation of Flowering by Green Light Depends on Its Photon Flux Density and Involves Cryptochromes. Physiol. Plant. 2019, 166, 762–771. [Google Scholar] [CrossRef]
  37. Kong, Y.; Zheng, Y. Diverse Flowering Response to Blue Light Manipulation: Application of Electric Lighting in Controlled-Environment Plant Production. Horticulturae 2024, 10, 578. [Google Scholar] [CrossRef]
  38. Hamamoto, H.; Shimaji, H.; Higashide, T. Budding and Bolting Responses of Horticultural Plants to Night-Break Treatments with LEDs of Various Colors. J. Agric. Meteorol. 2003, 59, 103–110. [Google Scholar] [CrossRef]
  39. Yang, J.; Song, J.; Jeong, B.R. Low-Intensity Blue Light Supplemented during Photoperiod in Controlled Environment Induces Flowering and Antioxidant Production in Kalanchoe. Antioxidants 2022, 11, 811. [Google Scholar] [CrossRef] [PubMed]
  40. Meng, Q.; Runkle, E.S. Low-Intensity Blue Light in Night-Interruption Lighting Does Not Influence Flowering of Herbaceous Ornamentals. Sci. Hortic. (Amsterdam). 2015, 186, 230–238. [Google Scholar] [CrossRef]
  41. Chory, J. Light Signal Transduction: An Infinite Spectrum of Possibilities. Plant J. 2010, 61, 982–991. [Google Scholar] [CrossRef] [PubMed]
  42. Heo, J.; Lee, C.; Chakrabarty, D.; Paek, K. Growth Responses of Marigold and Salvia Bedding Plants as Affected by Monochromic or Mixture Radiation Provided by a Light-Emitting Diode (LED). Plant Growth Regul. 2002, 38, 225–230. [Google Scholar] [CrossRef]
  43. Paucek, I.; Pennisi, G.; Pistillo, A.; Appolloni, E.; Crepaldi, A.; Calegari, B.; Spinelli, F.; Cellini, A.; Gabarrell, X.; Orsini, F.; et al. Supplementary LED Interlighting Improves Yield and Precocity of Greenhouse Tomatoes in the Mediterranean. Agronomy 2020, 10, 1002. [Google Scholar] [CrossRef]
  44. Avercheva, O. V; Berkovich, Y.A.; Erokhin, A.N.; Zhigalova, T. V; Pogosyan, S.I.; Smolyanina, S.O. Growth and Photosynthesis of Chinese Cabbage Plants Grown under Light-Emitting Diode-Based Light Source. Russ. J. Plant Physiol. 2009, 56, 14–21. [Google Scholar] [CrossRef]
  45. Cao, G.; Zhang, G.; Yu, J.; Ma, Y. Effects of Different Led Light Qualities on Cucumber Seedling Growth and Chlorophyll Fluorescence Parameters. Sci. Agric. Sin. 2013, 46, 1297–1304. [Google Scholar]
  46. Nanya, K.; Ishigami, Y.; Hikosaka, S.; Goto, E. Effects of Blue and Red Light on Stem Elongation and Flowering of Tomato Seedlings. In Proceedings of the Acta Horticulturae; International Society for Horticultural Science (ISHS), Leuven, Belgium, 14 October 2012; pp. 261–266. [Google Scholar]
  47. Deram, P.; Lefsrud, M.G.; Orsat, V. Supplemental Lighting Orientation and Red-to-Blue Ratio of Light-Emitting Diodes for Greenhouse Tomato Production. HortScience 2014, 49, 448–452. [Google Scholar] [CrossRef]
  48. Chen, Y.; Bian, Z.; Marcelis, L.F.M.; Heuvelink, E.; Yang, Q.; Kaiser, E. Green Light Is Similarly Effective in Promoting Plant Biomass as Red/Blue Light: A Meta-Analysis. J. Exp. Bot. 2024, 75, 5655–5666. [Google Scholar] [CrossRef]
  49. Sams, C.E.; Kopsell, D.; Morrow, R.C. Light Quality Impacts on Growth, Flowering, Mineral Uptake and Petal Pigmentation of Marigold. Acta Hortic. 2016, 1134, 139–145. [Google Scholar] [CrossRef]
  50. Keshavarz, M.; Matloobi, M.; Alizadeh-Salteh, S.; Rezghiyan, A. Optimizing Plant Growth and Pigment Profiles of African Marigold (Tagetes Erecta L.) under Different Light Spectra. BMC Plant Biol. 2025, 25, 1619. [Google Scholar] [CrossRef]
  51. Klein, R.M.; Edsall, P.C.; Gentile, A.C. Effects of Near Ultraviolet and Green Radiations on Plant Growth. Plant Physiol. 1965, 40, 903–906. [Google Scholar] [CrossRef] [PubMed]
  52. Park, J.U.; An, S.K.; Kim, J. Far-Red Light Affects Stomatal Opening and Evapotranspiration of Sweet Basil. Horticulturae 2023, 9, 1095. [Google Scholar] [CrossRef]
  53. Taweesak, V.; Boonsong, E. Effects of Different Light-Emitting Diode (LED) Illumination on Growth and Flowering in Chrysanthemum. Int. J. Agric. Biol. 2025, 33, 330601. [Google Scholar] [CrossRef]
  54. Machado, M.I.L.; Silva, M.G. V; Matos, F.J.A.; Craveiro, A.A.; Alencar, J.W. The Presence of Indole as Minor Constituent of Tagetes Erecta Leaf Oil. J. Essent. Oil Res. 1994, 6, 203–205. [Google Scholar] [CrossRef]
  55. Heo, J.W.; Kang, D.H.; Bang, H.S.; Hong, S.G.; Chun, C.; Kang, K.K. Early Growth, Pigmentation, Protein Content, and Phenylalanine Ammonia-lyase Activity of Red Curled Lettuces Grown under Different Lighting Conditions. 2012, 30, 6–12. [Google Scholar] [CrossRef]
  56. Tohidi, B.; Rahimmalek, M.; Arzani, A.; Sabzalian, M.R. Thymol, Carvacrol, and Antioxidant Accumulation in Thymus Species in Response to Different Light Spectra Emitted by Light-Emitting Diodes. Food Chem. 2020, 307, 125521. [Google Scholar] [CrossRef]
  57. de Oliveira, P.F.; Alves, J.M.; Damasceno, J.L.; Oliveira, R.A.M.; Dias, H.J.; Crotti, A.E.M.; Tavares, D.C. Cytotoxicity Screening of Essential Oils in Cancer Cell Lines. Rev. Bras. Farmacogn. 2015, 25, 183–188. [Google Scholar] [CrossRef]
  58. Krishna, A.; Kumar, S.; Mallavarapu, G.R.; Ramesh, S. Composition of the Essential Oils of the Leaves and Flowers of Tagetes Erecta L. J. Essent. Oil Res. 2004, 16, 520–522. [Google Scholar] [CrossRef]
  59. Cerrón-Mercado, F.; Perez-Alvarez, J.A.; Nolazco-Cama, D.; Salva-Ruíz, B.; Tellez-Monzon, L.; Fernández-López, J.; Viuda-Martos, M. Chemical Composition, Antioxidant and Antibacterial Activities of Essential Oil Obtained from Chincho (Tagetes Elliptica Sm) Leaves Grown in the Peruvian Andes. Foods 2023, 12, 894. [Google Scholar] [CrossRef]
  60. Singh, G.; Singh, O.P.; De Lampasona, M.P.; Catalán, C.A.N. Studies on Essential Oils. Part 35: Chemical and Biocidal Investigations on Tagetes Erecta Leaf Volatile Oil. Flavour Fragr. J. 2003, 18, 62–65. [Google Scholar] [CrossRef]
  61. Martínez, R.; Diaz, B.; Vásquez, L.; Compagnone, R.S.; Tillett, S.; Canelón, D.J.; Torrico, F.; Suárez, A.I. Chemical Composition of Essential Oils and Toxicological Evaluation of Tagetes Erecta and Tagetes Patula from Venezuela. J. Essent. Oil Bear. Plants 2009, 12, 476–481. [Google Scholar] [CrossRef]
  62. Adebiyi, E.O.; Igberaese, P.O.; Ajoba, F.B.; Alao, A.A.; Aderibigbe, R.O.; Ayoola, D.O. Repeated-Dose Dermal Toxicity of Tagetes Erecta Essential Oil in Wistar Rats. African J. Adv. Sci. Technol. Res. 2026, 22, 1–10. [Google Scholar]
  63. Safar, A.A.; Ghafoor, A.O.; Dastan, D. Screening of Chemical Characterization, Antifungal and Cytotoxic Activities of Essential Oil Constituents of Tagetes Erecta L. from Erbil, Kurdistan Region-Iraq. Polish J. Environ. Stud. 2020, 29, 2317–2326. [Google Scholar] [CrossRef]
  64. Ptak, P.; Górecki, K.; Heleniak, J.; Orlikowski, M. Investigations of Electrical and Optical Parameters of Some LED Luminaires—A Study Case. Energies 2021, 14, 1612. [Google Scholar] [CrossRef]
  65. Ministry of Health Vietnamese Pharmacopoeia; Medical Publishing House: Hanoi, Vietnam, 2018.
  66. König, W.A.; Joulain, D.; Hochmuth, D.H. Terpenoids and Related Constituents of Essential Oils. Libr. MassFinder Hamburg, Ger. 2004, 2. [Google Scholar]
  67. Adams, R.P. Identification of Essential Oil Components by Gas Chromatography, Mass Spectrometry, 4th ed.; Allured Publishing Corporation: Carol Stream, IL, USA, 2017; ISBN 978-1-932633-21-4. [Google Scholar]
  68. NIST Chemistry Webbook, NIST Standard Reference Database Number 69; Linstrom, P.J., Mallard, W.G., Eds.; National Institute of Standards and Technology: Gaithersburg MD, 2021; p. 20899. [Google Scholar]
  69. Hadacek, F.; Greger, H. Testing of Antifungal Natural Products: Methodologies, Comparability of Results and Assay Choice. Phytochem. Anal. 2000, 11, 137–147. [Google Scholar] [CrossRef]
  70. Cos, P.; Vlietinck, A.J.; Berghe, D. Vanden; Maes, L. Anti-Infective Potential of Natural Products: How to Develop a Stronger in Vitro “Proof-of-Concept”. J. Ethnopharmacol. 2006, 106, 290–302. [Google Scholar] [CrossRef] [PubMed]
Figure 1. Some physiological parameters of Tagetes erecta cultivated under different light conditions (Note: Mean values followed by the same letter within a chart are not statistically different for 0.05 significant level (n=36). Statistical analyses were performed using IRRISTAT ver. 5.0 (International Rice Research Institute, Laguna, Philippines)).
Preprints 206648 g001
Figure 2. Normalized spectral distribution of LED lighting.
Preprints 206648 g002
Table 1. Biomass and essential oil yield of Tagetes erecta cultivated under different light conditions.
Treatment Fresh yield of shoot (g/tray) Water content (%) Dry yield of shoot (g/tray) Essential oil content
(% w/w, dry)
Essential oil yield (mg/tray)
F1 198 ± 29b 89.2 ±0.095c 21.37 ± 3.15b 0.1541 ± 0.0101c 37.95 ± 5.59c
F2 271 ± 28a 90.2 ± 0.124a 26.57 ± 2.74a 0.2285 ± 0.0155a 52.46 ± 5.41a
F3 268 ± 21a 90.0 ± 0.131b 26.81 ± 2.10a 0.1974 ± 0.0126b 43.11 ± 3.38b
Note: Mean values followed by the same letter within a column are not statistically different for 0.05 significant level (n = 36). Statistical analyses were performed using IRRISTAT ver. 5.0 (International Rice Research Institute, Laguna, Philippines).
Table 2. Composition of essential oils of Tagetes erecta cultivated under different light conditions.
Compoundsa RIb F1c F2c F3c
α-Pinene 940 0.2 0.2 0.2
Sabinene 980 0.4 0.4 0.4
Myrcene 993 3.3 2.3 2.5
(3Z)-Hexenyl acetate 1006 0.1 0.2 0.1
Limonene 1035 5.2 5.5 5.7
(Z)-β-Ocimene 1039 3.2 3.5 3.8
(E)-β-Ocimene 1050 22.9 27.3 28.8
γ-Terpinene 1064 Tr 0.1 Tr
Terpinolene 1095 4.5 5.5 5.1
Linalool 1102 0.8 0.6 0.5
1,3,8-p-Menthatriene 1119 0.3 0.3 0.3
(Z)-Myroxide 1134 0.2 0.1 0.1
(E)-Myroxide 1145 20.6 15.0 13.9
iso-Menthol 1180 0.2 0.1 0.1
Terpinen-4-ol 1187 0.1 0.1 0.1
(3Z)-Hexenyl butanoate 1190 0.5 0.9 0.8
p-Cymen-8-ol 1192 0.2 Tr Tr
p-Methylacetophenone 1193 0.2 Tr Tr
Octyl acetate 1211 Tr Tr 0.3
2-Phenylethyl acetate 1263 2.7 2.3 2.3
Piperitone 1266 7.3 8.7 9.6
3-Thujyl acetate 1296 4.0 4.8 5.1
Indole 1302 1.2 1.1 1.1
Piperitenone 1354 6.2 5.4 4.3
Piperitenone oxide 1378 2.6 1.7 2.1
α-Santalene 1433 Tr Tr 0.2
(E)-β-Caryophyllene 1439 2.7 3.4 2.9
(Z)-β-Farnesene 1461 0.5 0.5 0.5
Germacrene D 1500 1.5 1.6 1.4
Bicyclogermacrene 1516 0.9 1.3 1.1
(E)-Nerolidol 1570 0.3 0.4 0.3
Spathulenol 1598 0.1 0.1 Tr
Caryophyllene oxide 1606 0.2 0.3 0.2
Neophytadiene 1842 0.6 0.8 0.9
Total 93.7 94.5 94.7
Monoterpene hydrocarbon 40.2 45.1 46.8
Oxygenated monoterpene 42.0 36.5 35.8
Sesquiterpene hydrocarbon 5.6 6.8 6.1
Oxygenated sesquiterpene 0.6 0.8 0.5
Diterpene hydrocarbon 0.6 0.8 0.9
Benzenoids 2.9 2.3 2.3
Oxylipins 0.6 1.1 1.2
Others 1.2 1.1 1.1
Number of compounds quantified 25 24 24
Note: aOrder of compounds eluted on the HP-5MS column; bRI: retention index of compounds on the HP-5MS column; cStandard deviations were insignificant and excluded from the Table to avoid congestion (n = 3); Tr: Trace (concentration < 0.1%).
Table 3. Antimicrobial activity of essential oils of Tagetes erecta cultivated under different light conditions.
Treatments Parameters The concentration of essential oil inhibiting the tested microorganisms (µg/mL)
Gram (+) bacteria Gram (-) bacteria Yeast
Staphylococcus aureus Bacillus subtilis Lactobacillus fermentum Salmonella enterica Escherichia coli Pseudomonas aeruginosa Candida albicans
F1 IC50 5134 ± 267 >16,000 >16,000 13,818 ± 610 6469 ± 320 6536 ± 341 4500 ± 201
MIC 8000 >16,000 >16,000 >16,000 16,000 >16,000 8000
F2 IC50 5183 ± 278 >16,000 12,000 ± 579 >16,000 4774 ± 257 8453 ± 414 4758 ± 225
MIC 8000 >16,000 >16,000 >16,000 8000 >16,000 8000
F3 IC50 9391 ± 476 >16,000 >16,000 16,000 ± 577 13,333 ± 569 7571 ± 377 >16,000
MIC >16,000 >16,000 >16,000 >16,000 >16,000 >16,000 >16,000
Ampicillin IC50 0.02 ± 0.005 3.62 ± 0.15 1.03 ± 0.07
MIC 0.125 ± 0.0 32 ± 0.0 32 ± 0.0
Cefotaxime IC50 0.43 ± 0.05 0.007 ± 0.002 4.34 ± 0.15
MIC 32 ± 0.0 0.5 ± 0.0 8 ± 0.0
Nystatin IC50 1.32 ± 0.05
MIC 8 ± 0.0
Table 4. MS solution used in the cultivation of Tagetes erecta.
Nutrients Components Concentration (µM)
Macro-nutrients Nitrogen 298.95
phosphorous 62.00
Potassium 155.95
Calcium 17.00
Magnesium 7.50
Sulfur 13.55
Micro-nutrients Iron 0.50
Manganese 5.00
Zinc 0.50
Boron 0.50
Copper 0.05
Molybdenum 0.50
Cobalt 0.05
Disclaimer/Publisher’s Note: The statements, opinions and data contained in all publications are solely those of the individual author(s) and contributor(s) and not of MDPI and/or the editor(s). MDPI and/or the editor(s) disclaim responsibility for any injury to people or property resulting from any ideas, methods, instructions or products referred to in the content.
Copyright: This open access article is published under a Creative Commons CC BY 4.0 license, which permit the free download, distribution, and reuse, provided that the author and preprint are cited in any reuse.
Prerpints.org logo

Preprints.org is a free preprint server supported by MDPI in Basel, Switzerland.

Subscribe

Disclaimer

Terms of Use

Privacy Policy

Privacy Settings

© 2026 MDPI (Basel, Switzerland) unless otherwise stated