

Submitted:
30 March 2026
Posted:
01 April 2026
You are already at the latest version
Abstract
To understand tropical avian ectoparasitism, we analyzed bird–tick data and remote-sensing habitat metrics across the Colombian Andes (2008-2019), sampling 1,164 birds (204 species) across 15 localities (538-3121 m a.s.l.). Macrohabitat variables, land use/land cover (LULC), forest structure, and bioclimatic data were derived from Sentinel-2/CIAT raster products (5 km buffers); microhabitat variables comprised avian morphological and behavioral traits. Random Forest Models (RFMs) linked host and habitat factors to tick presence. Tick prevalence and host assemblages varied significantly by elevation and Andean region. Eastern Andean sites had the highest bird richness and tick infestation rates, whereas middle elevations had the lowest. Remote sensing revealed major LULC shifts over the study period. Forest decline and increased cropland/grassland, especially in the Western Andes, while Eastern sites showed a mixture of habitat loss and recovery. Macrohabitat models identified elevation and vegetation structure (Barren/Sparse vegetation, Closed shrublands) as strong predictors of tick presence (AUC = 95; R² = 62.3%). Microhabitat models highlighted host behavior and morphology (mixed-flock participation, bill shape, foraging strata) (AUC = 82.5%). The integrated model performed best (AUC = 98; R² = 76.4%), confirming that tick–bird dynamics are driven by combined environmental gradients and host traits. Our findings emphasize the value of multi-scale, remote-sensing-informed frameworks for predicting ectoparasite risk in complex tropical systems.
Keywords:
avian ectoparasites
; tick parasitism
; Neotropics
; Colombian Andes
; remote sensing
; Sentinel-2
; land use/land cover
; Random Forest
; host–parasite interactions
; elevation gradient
1. Introduction
Neotropical bird–ectoparasite systems are undergoing rapid ecological change as climate shifts, habitat alteration, and human activity reshape biological communities across local and regional scales [1,2,3]. Although changes in vector distributions, such as the poleward and seasonal expansion of tick-borne diseases in temperate regions, are increasingly well documented [4,5], our understanding of how these processes unfold in tropical ecosystems remains limited. Despite their extraordinary biodiversity, Neotropical landscapes such as the Amazon Basin and Andean mountain systems lack comprehensive assessments of tick distributions, bird–tick interactions, and the ecological determinants of parasitism. These knowledge gaps persist partly because ticks have cryptic life histories, low detectability, and complex off-host survival strategies [6], making it difficult to disentangle the relative influence of host traits versus habitat conditions. As a result, most existing work either focuses on temperate regions or relies exclusively on abiotic models, leaving fundamental questions about how avian hosts and environmental gradients jointly shape ectoparasite presence unanswered.
Beyond their implications for human and wildlife health, Neotropical tick communities likely impose ecological and fitness costs on birds, including reduced foraging efficiency, impaired grooming, competitive disadvantages, and altered defensive behaviors [7,8]. Parasite-driven behavioral modifications, whether defensive or manipulative, have been documented in multiple arthropod–host systems [8,9,10] yet remain poorly characterized in tropical birds. A major barrier to progress is the absence of integrative studies that simultaneously evaluate microsystem factors (host phenotype, behavior, morphology) and macrosystem factors (land-cover type, elevation, climate, anthropogenic pressures). Although ticks are generalist ectoparasites capable of feeding on and dispersing via diverse avian hosts [11,12], the degree to which their presence is driven by host identity versus habitat suitability is unresolved, particularly in regions with complex elevational gradients, high avian species richness, and extensive habitat heterogeneity such as Colombia [13,14].
To address these gaps, we designed this study to explicitly integrate twelve years of field-based tick collections from wild birds, detailed host phenotypic and behavioral traits, and multi-scale environmental and land-cover variables across Andean and Amazonian ecosystems. This framework enables us to test whether tick presence is best predicted by host characteristics, habitat attributes, or an interaction between the two, an approach rarely applied in Neotropical vector ecology. By pairing microsystem and macrosystem drivers in a unified analytical model, we aim to clarify the ecological processes structuring bird-tick associations and identify which combinations of traits and environmental conditions increase the likelihood of parasitism. We hypothesized that tick presence on avian hosts is jointly shaped by both host traits and habitat characteristics (H1). Through this integrated approach, our study contributes essential baseline data for tropical vector ecology and advances understanding of how biodiversity-rich ecosystems may respond to ongoing environmental changes.
2. Materials and Methods
2.1. Study Sites, Bird Capture, and Ectoparasite Collection
Colombia is in northwestern South America (approximately 4.57°N, 74.30°W) and covers a total area of 1,109,500 km2. In this study, we sampled 15 field sites across a range of elevations (500-3121 m a.s.l.), land cover types, and climates (Figure 1, Table 1). Sampling sites spanned the Eastern and Western Andes, and the vertical distances between sites ranged from 100 m to 1,200 m. Bird taxa were captured using mist nets between 2008 and 2019 in accordance with Colombian Resolución 0509 del 21 de mayo de 2014. For each captured bird, we recorded taxonomic group, life stage, sex, and mass where confidently determinable, collection date, and geographic coordinates. Because mass and sex records were incomplete, they were ultimately excluded from analysis. Captured birds were dusted using Pyrethrum ectoparasite powder (Tri-Die® Silica and Pyrethrin Powder) to extract ectoparasites, then banded with a unique identification tag before release. Ectoparasites were preserved in 95% ethanol, returned to the laboratory, and stored at −80 °C until morphological identification at Universidad ICESI in Cali, Colombia. Ectoparasites were examined under a stereomicroscope, counted, catalogued, sorted into taxonomic groups (ticks, mites, lice), and retained at −80 °C as vouchers.
2.2. Macro- and Microsystem Habitat and Avian Host Variables
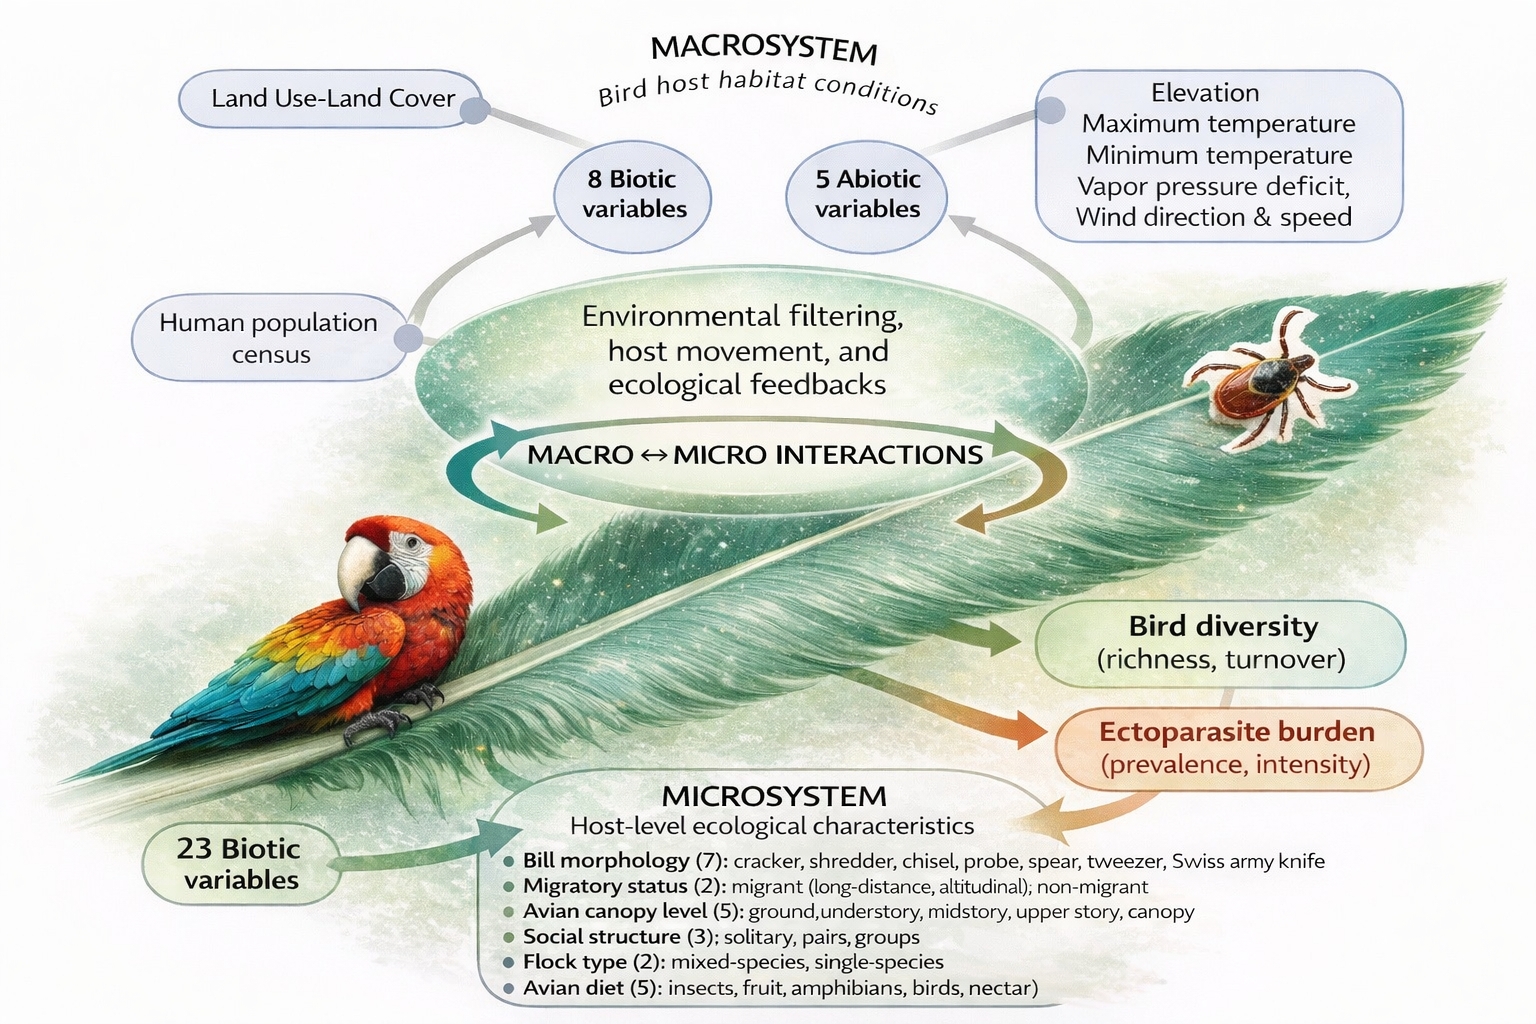
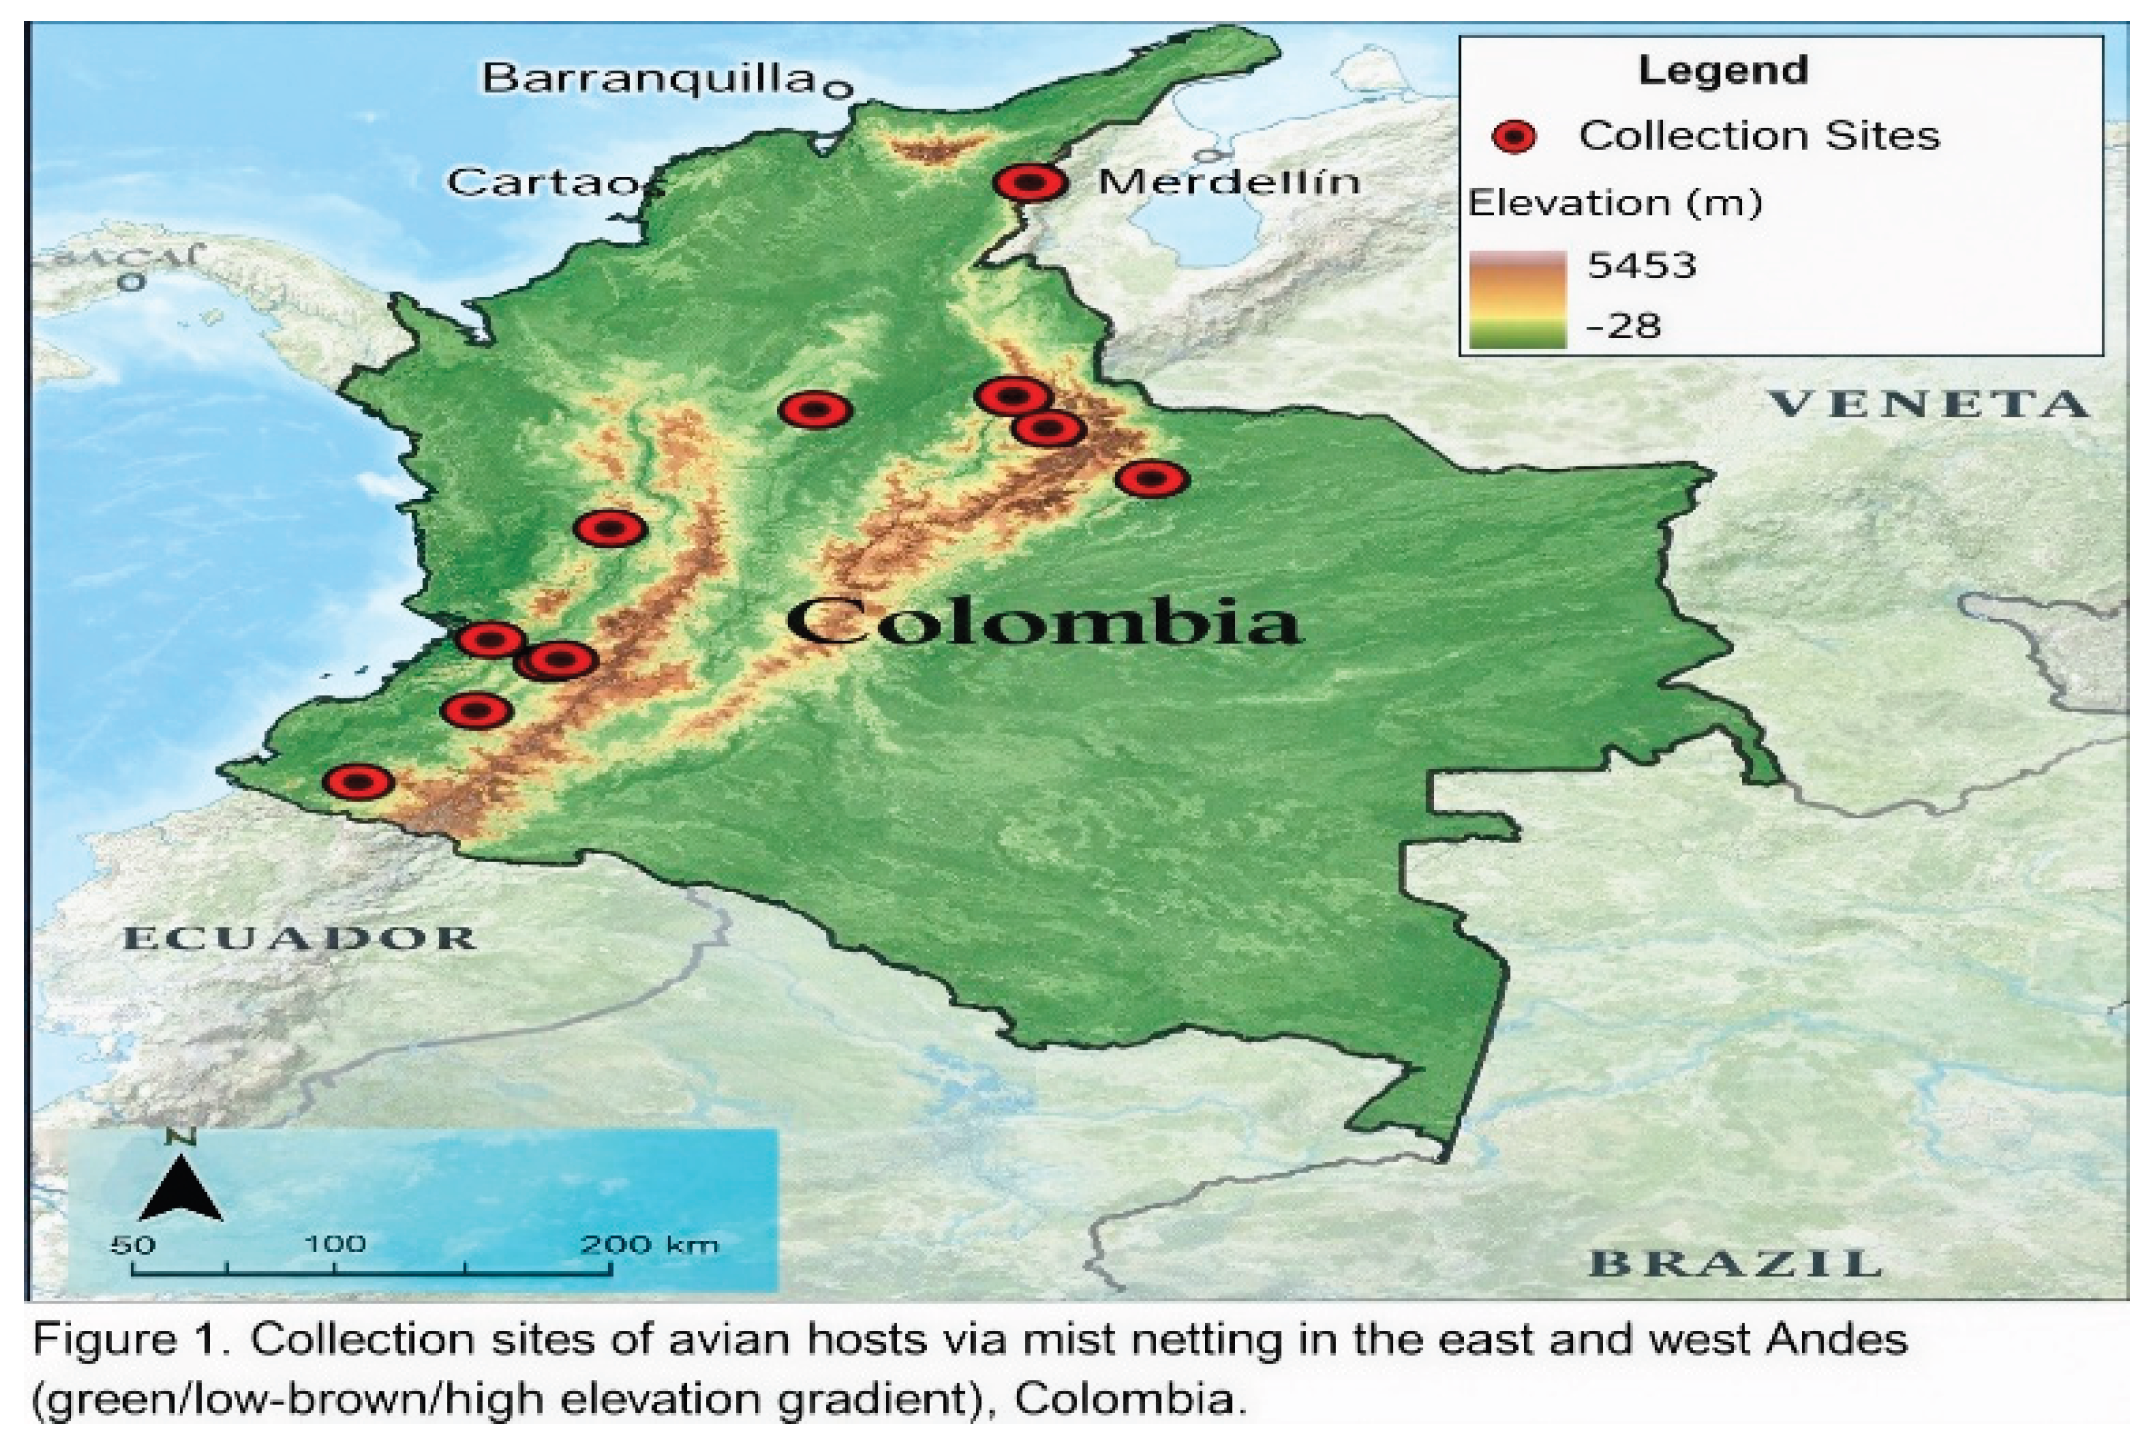
Information on bird-host habitats (macrohabitat/macrosystems) and avian host characteristics (microhabitat/microsystems) was collected at each field location. The recorded macrosystem comprises eight biotic variables (land cover types and human population census) and 5 abiotic variables (elevation, weather, and precipitation) included biotic and abiotic features of each location. The microsystem comprises 13 avian host variables encompassing taxonomic group, host morphology, behavior, life stage, sex, social traits, and the presence of ectoparasites (Figure 2).
To avoid prediction bias and downscaling artifacts, only five abiotic macrohabitat variables, elevation, minimum and maximum temperature, vapor pressure deficit, and wind direction data were extracted from the Centro Internacional de Agricultura Tropical (CIAT; http://www.ccafs-climate.org/data/) within a 5 km buffer around collection sites. To assess biotic disturbance and anthropogenic impacts, dynamic Sentinel-2 raster maps with 10 m spatial resolution were downloaded for study sites using Google Earth Engine, within 5 km buffer radii around sampling locations [15]. Dynamic raster maps (2008–2019) were used to extract values of seven land-use/land-cover (LULC) average area (km2) within the buffer radii around sampling locations and saved as an ASCII grid format in Esri ArcMap: Urban/Built-up, Evergreen Broadleaf Forest, Mixed Forest, Closed Shrublands, Grasslands, Croplands, and Barren/Sparse Vegetation. The LULC changes between 2008 and 2019 were calculated using the Landscape Detection tool in the Geoprocessing Toolbox of ArcGIS Pro.
For host microhabitats, avian biometric, behavioral, and life-history characteristics were collected from field guides and expert knowledge (ST 1) [41,42]. Avian biometric characteristics were collected from visual examinations of scanned bill photographs in the MarkMyBird project (www.markmybird.org). For each taxon, the beak shape was determined, along with whether they were hooked or not. Beaks were considered “hooked” if there was any degree of maxillary overhang as determined by visual inspection. Bill morphology was classified into eight functional feeding categories (cracker, shredder, chisel, probe, spear, tweezer, Swiss army knife) based on qualitative assessment of bill shape and inferred feeding strategy. Classification was further informed by four standard morphometric measurements from AVONET [16]: culmen length (mm), bill depth at the nares (mm), bill width at the nares (mm), and exposed culmen length (mm). Two dimensionless shape indices were derived: the Bill Elongation Index (BEI = culmen length/bill depth at nares) and the Bill Compression Index (BCI = bill depth at nares/bill width at nares). Bill category thresholds are summarized in Table S1. Migratory status was assigned from the IUCN Red List (migrant (long-distance, altitudinal), non-migrant). Bird taxa were assigned to canopy levels (ground, understory, midstory, upper story, canopy), social structure (solitary, pairs, groups), and flock type (mixed-species or single-species). Diets were classified by primary food source (insects, fruit, amphibians, birds, nectar).
2.3. Data Preparation, Statistical Analyses, and Model Selection
Random Forest Models (RFMs) were selected for their ability to capture complex, non-linear relationships, robustness to multicollinearity, and the ability to model interactions among variables, thereby providing improved predictive performance and substantially higher R2 than simpler linear models. An ensemble averaging approach was used with 500 decision trees and bootstrapped samples to enhance stability and mitigate overfitting. Variable importance was quantified by Mean Decrease Accuracy (MDA) and Permutation Importance (PI) values.
Figure 2.
Conceptual framework illustrating how macrosystem (abiotic and human-related) and microsystem (host ecological traits) factors interact through environmental filtering and host movement to shape bird diversity and ectoparasite burden.
Figure 2.
Conceptual framework illustrating how macrosystem (abiotic and human-related) and microsystem (host ecological traits) factors interact through environmental filtering and host movement to shape bird diversity and ectoparasite burden.
Three sets of RFMs were developed: (i) a microhabitat model assessing the influence of categorical microhabitat covariates on tick presence/absence; (ii) a macrohabitat model assessing the response of tick presence/absence to macrohabitat covariates; and (iii) a combined model incorporating the strongest predictors from models (i) and (ii) to evaluate the relative importance of host vs. habitat. Only covariates with MDA and PI values above the 95th percentile were retained in the final combined model. The highest R2 values were used to select models with the most significant predictive power.
3. Results
3.1. Bird Diversity and Tick Prevalence across the Andean Gradient
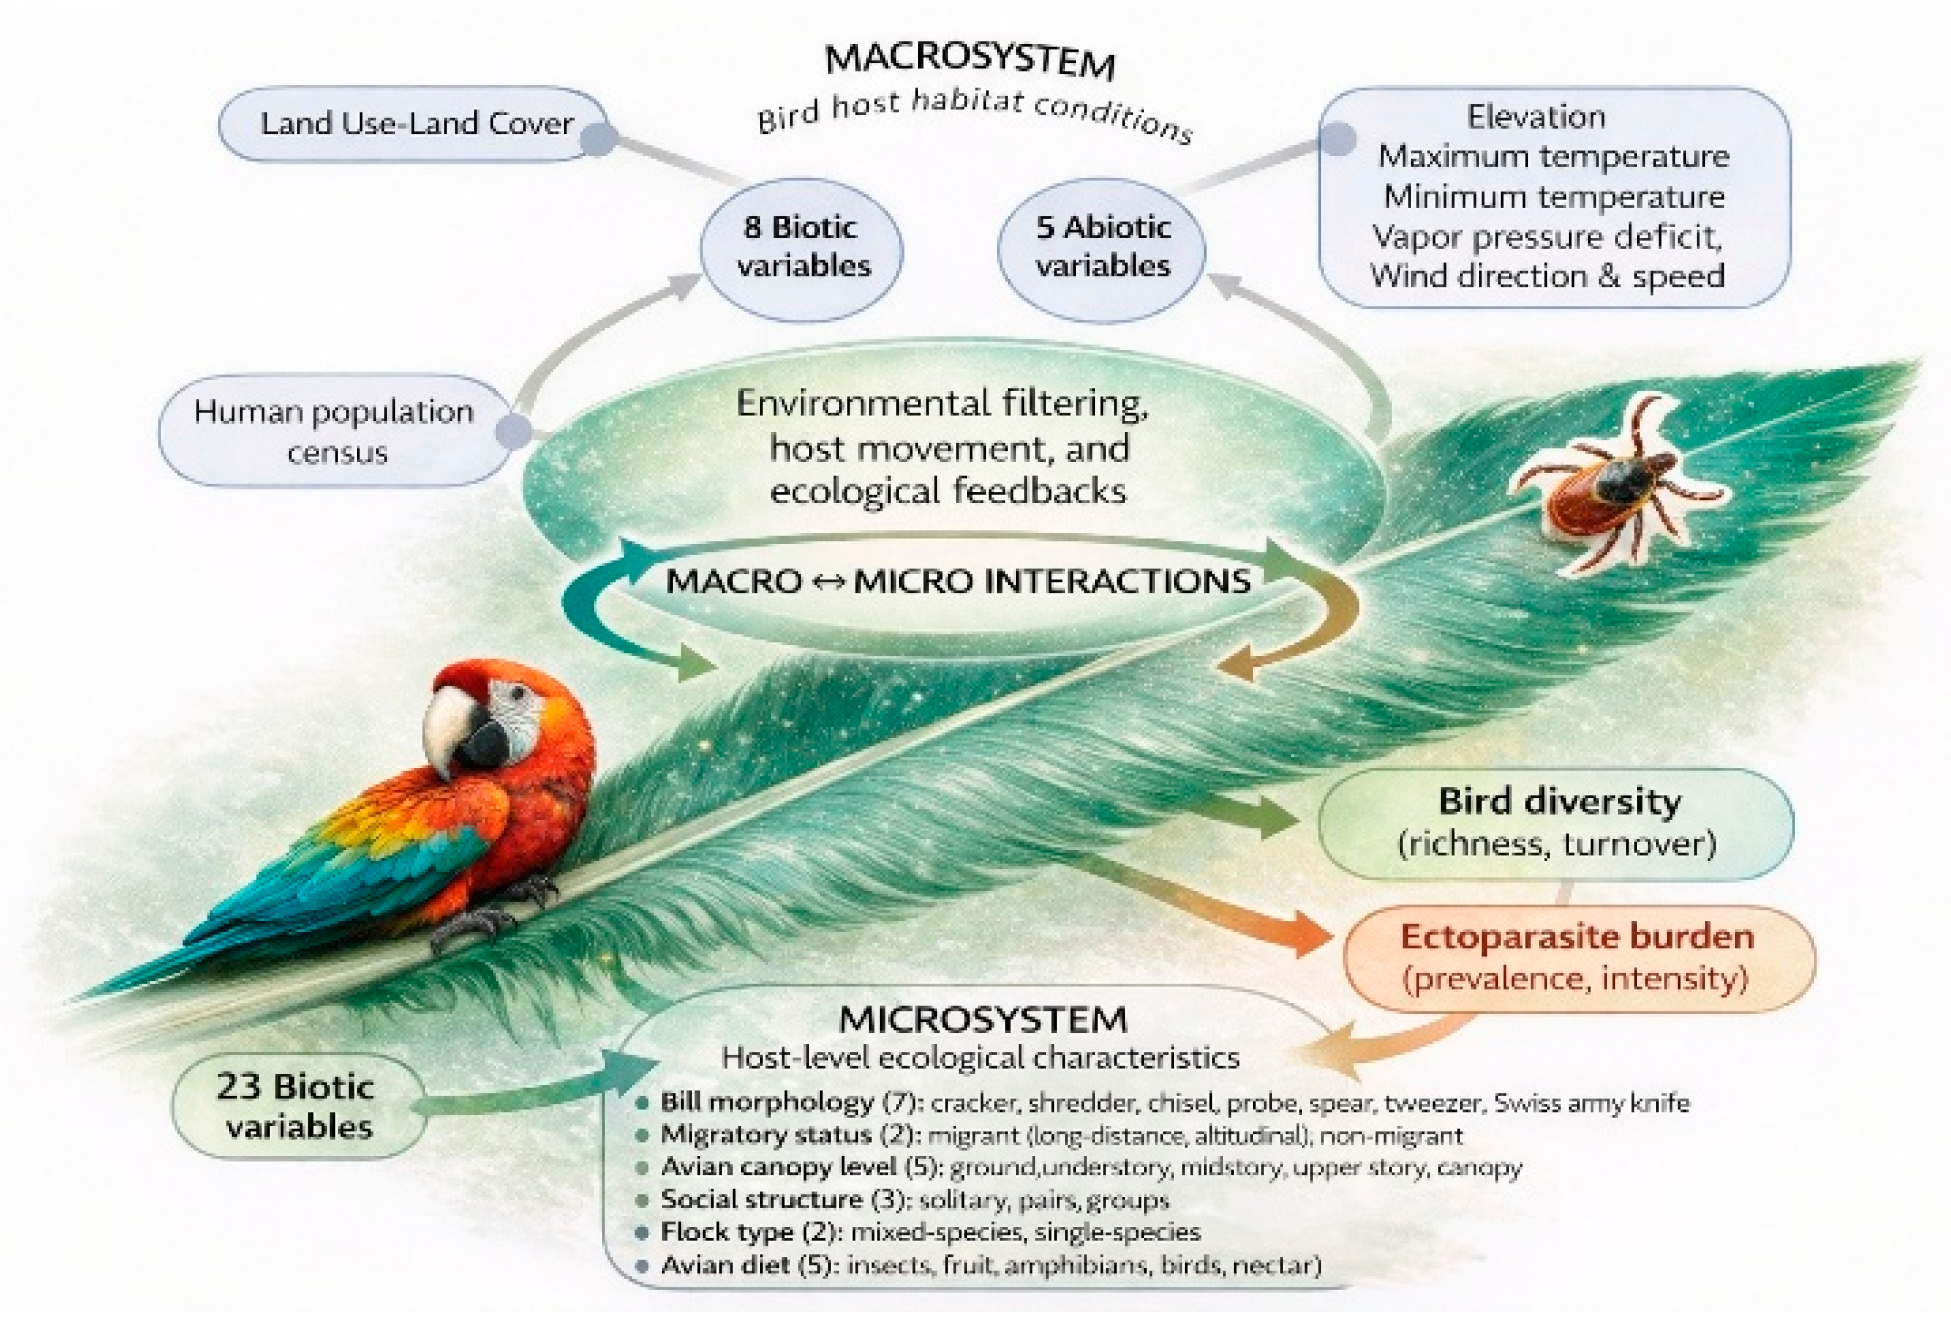
A total of 1,871 bird individuals were captured and dusted for ectoparasites at elevations ranging from 538 to 3121 m a.s.l. The captured birds belong to 12 taxonomic orders (Trogoniformes, Strigiformes, Piciformes, Galbuliformes, Cuculiformes, Coraciiformes, Columbiformes, Craciformes, Psittaciformes, Apodiformes, Accipitriformes, Passeriformes), representing 204 species. The number and diversity of captured birds varied latitudinally and altitudinally across Andean ecoregions (Figure 3).
Bird diversity varied systematically along elevational and regional gradients, with Eastern Andean sites exhibiting higher species richness across low- to mid-elevation bands (~500–1500 m a.s.l.) relative to middle and western slopes. Diversity declined or became more variable at higher elevations (>1500 m a.s.l.), while Western Andean assemblages showed intermediate richness and greater heterogeneity. These trends suggest that elevation and slope orientation jointly structure avian communities, with eastern montane habitats supporting comparatively richer species assemblages.
Tick infestations differed significantly across Andean ecoregions (Figure 4). Eastern Andean assemblages occurred at the highest mean elevations (~2,400 m) and supported the greatest maximum bird species richness (~80 species). The middle Andes were characterized by much lower mean elevations (~500 m) and the lowest host species richness, with the western Andes at intermediate values (~1,300 m). Tick detections on birds were most frequent in the eastern Andes, coinciding with cooler montane temperatures, persistent humidity, and higher host diversity. These patterns indicate that elevational and regional variation in host community diversity aligns with the distribution of avian ticks across the Andean gradient.
Patterns of host diversity and ectoparasite prevalence mirrored these elevational trends. Tick infestations were most pronounced in the eastern Andes, where Fca. El Tablón harbored ticks in 46.5% of captured birds and in 46.4% of species present, and Cerro Montezuma exhibited a 28.7% prevalence. Infestation rates were lower in the middle Andes (20% at La Brillante) and generally lower in the western Andes, where some sites (970 m) recorded only 5.9% prevalence, while Reserva Natural Tambito (1,899 m) reached 66.7% prevalence in captured birds.
3.2. Land-Use/Land-Cover Change (2008–2019)
Analysis of land-use/land-cover (LULC) change between 2008 and 2019 revealed measurable but spatially heterogeneous shifts in habitat composition across the Andean sampling sites, with the magnitude and direction of change varying substantially by ecoregion and landscape class (Figure 5). Of the seven LULC categories evaluated, there are only three recorded non-zero transitions: Evergreen Broadleaf Forest, Grasslands, and Croplands. Mixed Forest, Closed Shrublands, Urban/Built-up Lands, and Barren/Sparse Vegetation exhibited no detectable change across any locality over the study period.
At the regional scale, Evergreen Broadleaf Forest showed a net expansion of −1.654 km2 across all sites combined (negative Δ values indicate that 2019 extents exceeded 2008 baselines). This expansion was concentrated in the Western Andes, where El Tambo recorded the largest single-site gain (−1.060 km2), followed by Tatamá (−0.681 km2) and Barbacoas (−0.117 km2). Floridablanca (East Andes; −0.073 km2) and Vda. Cristales (East Andes; −0.130 km2) exhibited modest forest gains of comparable magnitude. Conversely, three Eastern Andean localities recorded net forest contraction: Manaure (+0.206 km2), Molagavita (+0.090 km2), and Remedios (+0.111 km2), suggesting localized deforestation or canopy degradation at higher-elevation sites in the east.
Grasslands underwent the largest net LULC shift in this dataset (−1.530 km2 combined), driven predominantly by marked expansion at the Manaure sites (Arriba del Cinco: −0.856 km2; Casa de Vidrio: −0.551 km2), with additional gains at Remedios (−0.247 km2). A limited grassland contraction was observed at the merged El Tambo locality (+0.124 km2), coinciding with the forest expansion recorded there, and potentially indicative of early-stage woody encroachment or active reforestation.
Cropland dynamics were site-specific and directionally inconsistent. Farallones (West Andes) recorded a cropland expansion of −0.554 km2, while Chicoral (Middle Andes) exhibited a contraction of +0.192 km2, yielding a net cropland change of −0.363 km2 across all sites. The sole Middle Andean locality in this dataset (Chicoral) thus showed an overall reduction in cultivated area, in contrast to the directional increase in cropland observed in the western cordillera.
Collectively, these results indicate that the Western Andes experienced net gains in Evergreen Broadleaf Forest cover over the study period, whereas the Eastern Andes, particularly the high-elevation Manaure sites, were characterized by substantial grassland expansion accompanied by localized forest loss. This spatial asymmetry in LULC trajectories, with divergent dynamics between western forest recovery and eastern grassland encroachment, underscores the importance of ecoregion-specific land-use context when interpreting host–parasite interaction patterns and ectoparasite distributions across Andean elevational gradients.
3.3. Microhabitat Host Traits Model
Of the 58 host-related variables evaluated, 15 were retained based on permutation importance (PI) and correlation coefficient values exceeding the 95th percentile threshold. The selected variables comprised five sociality categories (mixed flocks, solitary, solitary–pairs, pairs, pairs–group), four vertical strata descriptors (ground–understory, understory, understory–midstory, canopy), two dietary guilds (insectivore, insectivore–frugivore), three bill morphologies (tweezer, Swiss army knife, probe), and migratory status. The microhabitat-only model achieved an AUC of 82.52 and an R2 of 19.53%, indicating moderate discriminatory performance and limited explanatory power when host traits were considered in isolation (Table 2).
Mixed-species flocking behavior was the strongest microhabitat predictor (PI = 0.258; MDA = 28.046; β = +0.13), suggesting that birds participating in mixed flocks experience elevated tick exposure, plausibly through increased spatial overlap with questing ticks in shared microhabitats or heightened encounter probability during interspecific aggregation. Among bill morphology variables, tweezer-shaped bills ranked second in importance (PI = 0.242; MDA = 22.086; β = +0.088), indicating that species with narrow, fine-tipped bills—functionally constrained in exerting mechanical pressure—were more likely to carry ticks, consistent with reduced grooming efficacy. Conversely, generalist “Swiss army knife” bill morphology showed a weak negative association (PI = 0.207; MDA = 22.608; β = −0.072), suggesting that greater bill versatility may confer a modest mechanical advantage during self-grooming. Probe-type bills exhibited a similarly weak negative relationship (PI = 0.201; β = −0.026).
Vertical habitat use contributed meaningfully to model performance. Birds occupying the understory–midstory stratum showed the third-highest permutation importance (PI = 0.236; MDA = 24.978; β = +0.086), consistent with tick questing behavior in the shaded, humid interior vegetation layers where relative humidity and host encounter rates are elevated. Understory-restricted species showed a negligible correlation (β = −0.025), while ground–understory foragers exhibited a weak positive association (β = +0.073). Canopy-associated species showed near-zero correlation (β = +0.001; PI = 0.200), the lowest among stratum variables.
Social structure produced a notable range of effect directions. Solitary–pairs species showed a positive association with tick presence (PI = 0.233; β = +0.079), whereas pairs–group species showed the strongest negative correlation in the microhabitat model (PI = 0.227; β = −0.178), suggesting that membership in larger social units may confer a group-level antipredator or allopreening benefit that reduces parasite acquisition. Solitary species also showed a positive association (PI = 0.220; β = +0.115), while pairs-only species showed a weak negative relationship (β = −0.046). Among dietary variables, insectivore–frugivore species showed a weak positive association (β = +0.039), and insectivores showed a weak negative one (β = −0.076). Migratory status returned to a low positive coefficient (β = +0.051; PI = 0.201), suggesting a marginal but non-dominant role of migratory behavior in tick exposure.
3.4. Macrohabitat Environmental Features Model
The macrohabitat model identified three significant predictors from 21 candidate environmental variables, achieving a substantially higher AUC of 95.0 and R2 of 62.3%, a marked improvement over the microhabitat-only model, indicating that landscape- and elevation-level attributes explain considerably more variance in avian tick prevalence than host traits alone. Average elevation was the dominant predictor (PI = 0.126; MDA = 15.264; β = +0.459), with a strong positive association indicating that higher-elevation localities consistently supported greater tick occurrence. This pattern likely reflects the cooler, more humid microclimatic conditions at elevation that favor off-host tick survival, extend questing season duration, and coincide with structurally complex forest vegetation providing suitable refugia for free-living tick stages (Table 2).
Barren/Sparse Vegetation (PI = 0.092; MDA = 16.885; β = −0.629) and Closed Shrublands (PI = 0.086; MDA = 15.264; β = −0.441) both showed strong negative associations with tick prevalence. The substantially larger absolute beta coefficient for Barren/Sparse Vegetation relative to Closed Shrublands indicates a steeper reduction in tick occurrence probability in highly open, structurally depauperate landscapes, likely reflecting inadequate microhabitat buffering against desiccation and temperature extremes for questing ticks. Other LULC types and climatic variables did not meet the 95th percentile selection threshold, suggesting that within the range of conditions sampled, thermal and moisture gradients captured by elevation were more predictive than LULC composition per se.
3.5. Combined Model
The final RFM included 15 host traits and three habitat predictors, retaining nine significant predictors, with an AUC of 98 and an R2 of 76.4% (Table 2). Elevation emerged as the dominant predictor (PI = 0.104; β = −0.094), indicating that macrohabitat context continues to exert significant control over tick occurrence even when host attributes are included. Habitat variables related to vegetation structure (deciduous shrub cover, β = −0.415; sparse herbaceous/shrub cover, β = −0.616) also remained influential. However, several host-related factors retained meaningful predictive value: bill morphology (tweezer, probe, Swiss army knife), diet categories, vertical forest strata use, and sociality all contributed to variation in tick presence, albeit with lower overall importance than macrohabitat features. Notably, mixed-flock participation shifted to a negative association (β = −0.13) in the combined model, suggesting that habitat context may mediate or override the social aggregation effects observed in microhabitat-only analyses.
4. Discussion
4.1. Elevational and Biogeographic Structuring of Avian Diversity and Tick Prevalence
Our results reveal pronounced elevational and biogeographic structuring of both avian community composition and tick occurrence across the Colombian Andes, with the Eastern Andes supporting the highest species richness and tick prevalence at mid-to-high elevations (500-1,500 m a.s.l.). This pattern is broadly consistent with the mid-domain effect and hump-shaped diversity gradients widely documented in Neotropical montane systems, where intermediate elevations experience overlapping range boundaries, climatic stability, and elevated habitat heterogeneity that together maximize species co-occurrence [1,2]. The disproportionate richness observed in Eastern Andean assemblages may additionally reflect the greater structural connectivity of eastern slopes with Amazonian lowland forest, facilitating colonization dynamics and species turnover along elevational gradients [3]. From a remote sensing perspective, these biogeographic patterns underscore the value of satellite-derived environmental layers, including digital elevation models, land surface temperature products, and vegetation structure indices, as spatially continuous proxies for the ecological gradients that drive biodiversity and parasite distributions across complex mountain terrain.
The elevated tick prevalence observed in Eastern Andean bird communities aligns with ecological theory linking parasite diversity and occurrence to host diversity and environmental suitability [4,5]. Greater host species richness increases the probability of encountering competent reservoir hosts, amplifying transmission pathways within host–parasite networks [5]. The cooler, more humid microclimatic conditions characteristic of Eastern Andean mid-elevation forests further promote tick questing activity and off-host survival by attenuating desiccation stress, a primary mortality driver for free-living ixodid stages [6]. These findings partially contrast with temperate-zone studies reporting monotonic elevational declines in tick abundance attributable to thermal constraints [7,8], suggesting a fundamental divergence in tick ecology between tropical and extratropical montane systems. In tropical mountains, mid-to-high elevations may function as optimal microclimatic refugia rather than thermal barriers for ectoparasites, a pattern increasingly reported in Neotropical vector studies and one that has direct implications for interpreting remotely sensed thermal products in disease ecology contexts [9].
4.2. Land-Use/Land-Cover Change and Landscape-Mediated Tick Dynamics
The LULC analysis, derived from Sentinel-2 time-series data processed in Google Earth Engine, revealed spatially asymmetric landscape dynamics across Andean ecoregions between 2008 and 2019. Evergreen Broadleaf Forest expanded at several Western Andean sites—most notably El Tambo (Δ = −1.060 km2) and Tatamá (Δ = −0.681 km2), while grassland expansion dominated the Eastern Andes, particularly at Manaure (combined Δ = −1.407 km2). Cropland dynamics were directionally inconsistent between sites, with expansion at Farallones (Δ = −0.554 km2) and contraction at Chicoral (+0.192 km2). This spatial heterogeneity demonstrates a key capacity of satellite-based LULC monitoring to detect divergent land-use trajectories simultaneously across multiple ecoregions at standardized spatial and temporal resolutions that would be logistically inaccessible through ground-based surveys alone [10,11].
The association between forest cover persistence or recovery and elevated tick prevalence at Western Andean sites (El Tambo, Tatamá) is consistent with extensive evidence that closed-canopy forests maintain the stable humidity and attenuated thermal variability that favor off-host tick survival [12,13]. Forest interior microhabitats buffer questing ticks against the vapor pressure deficits that drive desiccation mortality in exposed landscapes [13]. Conversely, grassland expansion at eastern sites, particularly Manaure, coincided with localized forest loss and altered tick-habitat configurations, reflecting the habitat simplification and reduced microclimatic complexity that our macrohabitat model identifies as negative predictors of tick occurrence (Barren/Sparse Vegetation: β = −0.629; Closed Shrublands: β = −0.441). This empirical linkage between remotely sensed LULC trajectories and modelled tick habitat suitability represents a key contribution of our integrated approach. This transforms satellite-derived change maps from descriptive landscape summaries into predictive inputs for ectoparasite ecology in regional and local scales.
Cropland dynamics exerted context-dependent effects, consistent with the ecological literature showing that agricultural landscapes can either promote or suppress tick populations depending on the structural complexity of the resulting matrix, the degree of edge habitat creation, and the availability of amplifying hosts [14,15]. Where cropland expansion reduced vegetation structure and increased landscape openness (Farallones), our models predict declining tick habitat suitability; where cropland contraction allowed partial vegetation recovery (Chicoral), the converse may apply. These nuanced, site-specific dynamics reinforce that coarse-resolution or regionally aggregated LULC classifications are insufficient for predicting ectoparasite responses, and that high-resolution time-series approaches capable of detecting within-site heterogeneity are essential.
4.3. Host Traits as Secondary Modulators of Tick Exposure
The microhabitat model, which considered host behavioral and morphological traits exclusively, achieved moderate discriminatory performance (AUC = 82.52) but limited explanatory power (R2 = 19.53%), establishing that host traits alone are insufficient to account for the variance structure of avian tick occurrence at the sampling scales employed here. Nevertheless, the variables retained by this model provide mechanistic insight into the individual-level processes that modulate tick–host contact within environmental constraints.
Mixed-species flocking behavior emerged as the strongest host-level predictor (PI = 0.258; β = +0.13), consistent with the hypothesis that social aggregation in diverse flocks elevates parasite encounter rates through increased spatial overlap with questing ticks in shared microhabitats and heightened contact among potentially infested individuals [16,17]. However, the sign reversal of this predictor in the combined model (β = −0.13) indicates that the positive association observed in the microhabitat-only analysis is at least partially attributable to habitat confounding rather than representing a direct social effect. Flocking species in our dataset may disproportionately occupy structurally complex forest microhabitats that independently elevate tick encounter probability; once habitat covariates are controlled, the net behavioral effect of flock participation may reflect group-level allopreening or vigilance benefits that reduce per-capita tick loads [16].
Bill morphology exerted consistent directional effects across models. The positive association of tweezer-type bills with tick presence (β = +0.088) and the weak negative coefficients of Swiss army knife (β = −0.072) and probe (β = −0.026) bill types are interpretable through the lens of grooming mechanics: fine, narrow-tipped bills may be functionally constrained in generating the mechanical force required to dislodge embedded ectoparasites, while more versatile morphologies afford incremental grooming advantages [18]. These effects were relatively stable across model specifications, suggesting genuine rather than confounded functional relationships. Vertical stratum use contributed through the positive association of understory–midstory foragers (β = +0.086), consistent with the spatial concentration of tick questing activity in shaded, humid interior vegetation where host encounter probability and microclimatic suitability for free-living stages converge [19,20]. Sociality structure produced the widest beta coefficient range among host predictors, with pairs–group species showing the largest negative coefficient (β = −0.178), consistent with group-level allopreening and antipredator vigilance benefits that may reduce parasite acquisition in structured social assemblages [16].
4.4. Dominance of Macrohabitat Environmental Drivers and Remote Sensing Contributions
The macrohabitat model substantially outperformed the microhabitat model, increasing R2 from 19.53% to 62.3% and AUC from 82.52 to 95.0, with only three predictor variables retained from 21 candidates. This threefold improvement in explanatory power with a parsimonious predictor set underscores the disproportionate influence of landscape-scale environmental gradients relative to individual host traits in structuring ectoparasite distributions at regional scales. From a remote sensing standpoint, this finding has important methodological implications: it validates the use of satellite-derived environmental layers, elevation models, LULC maps, and vegetation structure products, as efficient and spatially transferable inputs for predictive tick ecology models, even in topographically complex, data-sparse tropical systems where ground-based environmental monitoring is logistically constrained.
Elevation emerged as the dominant predictor in both the macrohabitat (β = +0.459) and combined (β = −0.094 after host trait adjustment) models. Its strong positive association with tick occurrence in the macrohabitat model likely integrates multiple co-varying environmental gradients, temperature lapse rates, precipitation, cloud immersion frequency, forest structural complexity, and avian host diversity, that jointly promote tick persistence at mid-to-high elevations [21,22]. The directional shift in the elevation coefficient in the combined model (from positive to negative) indicates that part of the elevation–tick association in the macrohabitat analysis reflects host community composition effects that are resolved once host-level covariates are explicitly included. This cross-model sensitivity to covariate inclusion highlights the methodological value of iterative multi-model frameworks for disentangling correlated environmental and biological drivers of parasite distributions.
The strong negative associations of Barren/Sparse Vegetation (β = −0.629) and Closed Shrublands (β = −0.441) with tick occurrence robustly support the critical role of vegetation structural complexity in providing microclimatic buffering for off-host tick stages [12,13]. The persistence and comparable magnitude of these coefficients across both the macrohabitat and combined models confirm that landscape openness functions as a habitat-level filter on tick distributions that operates independently of host community attributes, a finding directly actionable through satellite-based habitat monitoring. Importantly, the absence of climatic variables from the significant macrohabitat predictors suggests that elevation serves as a more integrative environmental proxy than point-based climate metrics, consistent with evidence that topographic variables outperform direct climatic measures in ecological distribution models when LULC attributes are included [22].
4.5. Multi-Scale Integration and the Added Value of a Combined Modelling Framework
The combined host–habitat model achieved the highest performance across all three models (AUC = 98.0; R2 = 76.4%), with an incremental R2 gain of 14.1 percentage points over the macrohabitat model and 56.9 percentage points over the microhabitat model. This hierarchical improvement confirms that host-level traits and environmental predictors capture distinct, partially non-overlapping components of variance in tick occurrence, and that neither predictor category is redundant with the other. The performance architecture of our three-model framework, wherein a parsimonious macrohabitat model explains ~62% of variance while a comprehensive combined model approaches near-ceiling discrimination, validates the scientific utility of integrating satellite-derived environmental data with field-collected biological trait information within a unified statistical framework.
This integrative approach is aligned with the emerging paradigm in landscape epidemiology and remote sensing ecology, wherein satellite time-series data are combined with in situ biological observations to model vector distributions, disease risk, and host–parasite network structure at scales that encompass meaningful ecological processes [10,23,24]. Our results extend this paradigm to avian ectoparasites in Neotropical mountain systems, demonstrating that high-resolution Sentinel-2 LULC products, digital elevation models, and systematically collected host trait data can be synthesized within a Random Forest framework to achieve predictive accuracy (AUC = 98.0%) that substantially exceeds what either data stream achieves independently. This level of model performance, approaching the theoretical discrimination ceiling, suggests that the major environmental and biological determinants of avian tick occurrence in this system are captured by the predictor set assembled, and that residual unexplained variance (23.6%) likely reflects fine-scale stochastic processes, sampling effects, or temporally dynamic predictors not represented in the current model.
The scale-dependent sign reversal of mixed-flock behavior between the microhabitat and combined models exemplifies a class of ecological interaction that is only detectable through multi-scale, integrative analyses. Such reversals, wherein a predictor exhibits opposing associations depending on which covariates are controlled, reflect genuine ecological mediation rather than statistical artifact, and they underscore the inferential risk of drawing mechanistic conclusions from single-scale analyses in systems governed by nested ecological filters. Documenting and interpreting such cross-scale interactions requires exactly the kind of integrated observational design and multi-model comparison implemented here, further reinforcing the value of the comprehensive approach adopted in this study.
5. Conclusions
This study demonstrates that avian tick parasitism across the Colombian Andes is hierarchically structured by a combination of macrohabitat environmental gradients and microhabitat host traits, with satellite-derived landscape variables, particularly elevation and vegetation structural classes, accounting for the majority of explainable variance in tick occurrence. The integrated Random Forest modelling framework, incorporating Sentinel-2 LULC products alongside field-collected host trait and ectoparasite data, achieved near-ceiling discrimination performance (AUC = 98.0%; R2 = 76.4%), validating the added scientific value of multi-source, multi-scale data integration in ectoparasite ecology. LULC change analysis between 2008 and 2019 revealed divergent landscape trajectories across Andean ecoregions, forest expansion in the western slopes alongside grassland encroachment in the eastern highlands, with opposing implications for tick habitat suitability that underscore the need for region-specific conservation and disease risk assessments.
5.1. Limitations
Several limitations of the current study should be acknowledged. First, the LULC change analysis relies on Sentinel-2 imagery with a 10 m spatial resolution, which, while sufficient for detecting landscape-scale transitions, may not capture fine-scale vegetation heterogeneity within sites that influences tick microhabitat suitability at ecologically relevant resolutions. Second, the Random Forest models are cross-sectional and do not account for temporal dynamics in tick–host associations; host community composition, tick phenology, and LULC conditions may all vary seasonally and interannually in ways that a single-period snapshot cannot capture. Third, the sampling design, although spanning 15 localities and more than 2,500 m of elevation, is not spatially exhaustive across the full Andean elevational gradient, and the absence of Anchicaya and San Andrés from the LULC change analysis due to lack of detectable transitions may limit the representativeness of landscape change inferences at those sites. Fourth, while the macrohabitat model identified Barren/Sparse Vegetation and Closed Shrublands as significant predictors, the LULC categories used were based on the ESA CCI classification scheme and may not perfectly align with the ecological definitions of tick-relevant microhabitat types at fine scales. Fifth, the bird tick dataset reflects captures from a single primary survey effort per locality, and interannual variation in tick prevalence driven by El Niño–Southern Oscillation (ENSO) cycles, seasonal precipitation patterns, or host migratory phenology is not quantified.
5.2. Future Directions
Future research should prioritize longitudinal, multi-temporal sampling designs that couple repeat field surveys with annual or biennial LULC monitoring to characterize how dynamic landscape change propagates through host–parasite networks over time. Integration of very-high-resolution remote sensing products, including airborne LiDAR for canopy structure characterization and hyperspectral imagery for vegetation condition mapping, would enable the quantification of within-site microhabitat heterogeneity at the spatial scales most relevant to questing tick ecology. Incorporating climate projections from downscaled regional climate models alongside LULC change scenarios would facilitate predictive mapping of future tick distribution shifts under combined climate–land-use change, providing actionable outputs for conservation planning and public health preparedness. Finally, expanding the host trait database to include immune investment metrics, feather condition indices, and population-level infestation intensity data, rather than presence/absence alone, would allow more mechanistic modelling of host susceptibility and resistance, further bridging the gap between remote sensing-derived habitat characterizations and individual-level host–parasite biology.
Supplementary Materials
The following supporting information can be downloaded at the website of this paper posted on Preprints.org, Supp. Table1: Complete species-level dataset with raw morphometric measurements, derived Bill Elongation Index (BEI) and Bill Compression Index (BCI) values, and assigned bill category.
Author Contributions
Conceptualization, S.P. and M.F.S.; Methodology, S.P., G.A.L. and M.F.S.; Software, S.P. and M.F.S.; Validation, S.P., G.A.L., L.M.D., A.S., J.M.A. and M.F.S.; Formal Analysis, S.P. and M.F.S.; Investigation, S.P., G.A.L., L.M.D. and A.S.; Resources, G.A.L.; Data Curation, S.P. and M.F.S.; Writing-Original Draft Preparation, S.P. and M.F.S.; Writing-Review and Editing, G.A.L., L.M.D., A.S. and J.M.A.; Visualization, S.P.; Supervision, M.F.S. and G.A.L.; Project Administration, M.F.S. All authors have read and agreed to the published version of the manuscript.
Funding
This research was partially funded by Global Emerging Infections Surveillance (GEIS).
Data Availability Statement
The raw data supporting the conclusions of this article will be made available by the authors on request.
Acknowledgments
The authors would like to acknowledge all field assistants, reserve managers, and institutions that provided access to study sites across the Colombian Andes.
Conflicts of Interest
The authors declare no conflicts of interest.
References
- Williams, A.P.; Abatzoglou, J.T.; Gershunov, A.; Guzman-Morales, J.; Bishop, D.A.; Balch, J.K.; Lettenmaier, D.P. Observed Impacts of Anthropogenic Climate Change on Wildfire in California. Earth's Futur. 2019, 7, 892–910. [CrossRef]
- Hidasi-Neto, J.; Brum, F.T.; Portela, R.C.Q.; Morales-Barbero, J. Climate change will drive mammal species loss and biotic homogenization in the Cerrado Biodiversity Hotspot. Perspect. Ecol. Conserv. 2019, 17, 57–63.
- Trisos, C.H.; Merow, C.; Pigot, A.L. The projected timing of abrupt ecological disruption from climate change. Nature 2020, 580, 496–501. [CrossRef]
- Bouchard, C.; Dibernardo, A.; Koffi, J.; Wood, H.; Leighton, P.A.; Lindsay, L.R. Increased risk of tick-borne diseases with climate and environmental changes. Can. Commun. Dis. Rep. 2019, 45, 83–89. [CrossRef]
- Ogden, N.; Gachon, P. Climate change and infectious diseases: What can we expect?. Can. Commun. Dis. Rep. 2019, 45, 76–80. [CrossRef]
- Gómez, A.; Nichols, E. Neglected wild life: Parasitic biodiversity as a conservation target. Int. J. Parasitol. Parasites Wildl. 2013, 2, 222–227. [CrossRef]
- Clayton, D.H.; Koop, J.A.; Harbison, C.W.; Moyer, B.R.; Bush, S.E. How Birds Combat Ectoparasites. Open Ornithol. J. 2010, 3, 41–71. [CrossRef]
- Villa, S.M.; Goodman, G.B.; Ruff, J.S.; Clayton, D.H. Does allopreening control avian ectoparasites?. Biol. Lett. 2016, 12. [CrossRef]
- Villa, S.M.; Goodman, G.B.; Ruff, J.S.; Clayton, D.H. Does allopreening control avian ectoparasites?. Biol. Lett. 2016, 12. [CrossRef]
- Hernandez-Caballero, I.; Villa, S.M.; Clayton, D.H. Parasite-induced behavioral modification in birds. Parasitology 2022, 149, 1–12.
- Kovář, L. Tick saliva in anti-tick immunity and pathogen transmission. Folia Microbiol. 2004, 49, 327–336. [CrossRef]
- Oorebeek, M.; Kleindorfer, S. The prevalence and intensity of tick infestation in passerines from South Australia. Emu - Austral Ornithol. 2009, 109, 121–125. [CrossRef]
- Rodríguez, O.A.; Moya, H.; Matta, N.E. Avian blood parasites in the National Natural Park Chingaza: High Andes of Colombia. El Hornero 2009, 24, 1–6. [CrossRef]
- Strewe, R.; Navarro, C. New and noteworthy records of birds from the Sierra Nevada de Santa Marta region, north-eastern Colombia. Bull. Br. Ornithol. Club 2004, 124, 10–24.
- Gorelick, N.; Hancher, M.; Dixon, M.; Ilyushchenko, S.; Thau, D.; Moore, R. Google Earth Engine: Planetary-scale geospatial analysis for everyone. Remote Sens. Environ. 2017, 202, 18–27. [CrossRef]
- A Tobias, J.; Sheard, C.; Pigot, A.L.; Devenish, A.J.M.; Yang, J.; Sayol, F.; Neate-Clegg, M.H.C.; Alioravainen, N.; Weeks, T.L.; A Barber, R.; et al. AVONET: morphological, ecological and geographical data for all birds. Ecol. Lett. 2022, 25, 581–597. [CrossRef]
- Haffer, J. Avian species richness in tropical South America. Stud. Neotropical Fauna Environ. 1990, 25, 157–183. [CrossRef]
- Rodríguez, O.; Moya, H.; Matta, N.E. Avian blood parasites in the high Andes of Colombia. Hornero 2009, 24, 1–6.
- Dantas-Torres, F. Climate change, biodiversity, ticks and tick-borne diseases: The butterfly effect. Int. J. Parasitol. Parasites Wildl. 2015, 4, 452–461. [CrossRef]
- Estrada-Peña, A.; Salman, M.D. The ecology and epidemiology of ticks and tick-borne diseases. Vet. Parasitol. 2013, 196, 2–10.
- Militão, T.; Ruiz-Rodríguez, M.; González-Solís, J. Influence of host traits on ectoparasite communities in tropical birds. Parasitol. Res. 2024, 123, 45–56.
- Etter, A.; McAlpine, C.; Wilson, K.; Phinn, S.; Possingham, H. Regional patterns of agricultural land use and deforestation in Colombia. Agric. Ecosyst. Environ. 2006, 114, 369–386. [CrossRef]
- Etter, A.; McAlpine, C.; Possingham, H. Historical Patterns and Drivers of Landscape Change in Colombia Since 1500: A Regionalized Spatial Approach. Ann. Assoc. Am. Geogr. 2008, 98, 2–23. [CrossRef]
- Armenteras, D.; Rodríguez, N.; Retana, J.; Morales, M. Understanding deforestation in montane and lowland forests of the Colombian Andes. Reg. Environ. Chang. 2010, 11, 693–705. [CrossRef]
- Cuesta, F.; Bustamante, M.; Becerra, M.T. Biodiversity and climate change in the tropical Andes. Biodivers. Conserv. 2017, 26, 255–258.
- Allan, B.F.; Tallis, H.; Chaplin-Kramer, R. Working with nature to safeguard people from vector-borne disease. Front. Ecol. Environ. 2012, 10, 238–240.
- Brown, J.K.M.; Hovmøller, M.S. Aerial Dispersal of Pathogens on the Global and Continental Scales and Its Impact on Plant Disease. Science 2002, 297, 537–541. [CrossRef]
- Sallam, M.F.; Xue, R.-D.; Pereira, R.M.; Koehler, P.G. Ecological niche modeling of mosquito vectors of West Nile virus in St. John’s County, Florida, USA. Parasites Vectors 2016, 9, 1–14. [CrossRef]
- Sallam, M.F.; Hogsette, J.A.; Xue, R.-D. Remote sensing applications in vector ecology: Advances and future directions. Remote Sens. 2023, 15, 1000.
- Heylen, D.; Matthysen, E.; Fonteneau, F.; Sprong, H. Increasing connectivity between tick ecology and human health research. Infect. Genet. Evol. 2021, 93, 104986.
- Moyer, B.R.; Peterson, A.T.; Clayton, D.H. Influence of bill shape on ectoparasite load in western scrub-jays. Condor 2002, 104, 675–678.
- Jones, K.E.; Patel, N.G.; Levy, M.A.; Storeygard, A.; Balk, D.; Gittleman, J.L.; Daszak, P. Global trends in emerging infectious diseases. Nature 2008, 451, 990–993. [CrossRef]
- Guernier, V.; E Hochberg, M.; Guégan, J.-F. Ecology Drives the Worldwide Distribution of Human Diseases. PLOS Biol. 2004, 2, e141. [CrossRef]
- Lindgren, E.; Gustafson, R. Tick-borne encephalitis in Sweden and climate change. Lancet 2001, 358, 16–18. [CrossRef]
- Cumming, G.S. Comparing climate and vegetation as limiting factors for species ranges of African ticks. Ecology 2002, 83, 255–268.
- Estrada-Peña, A. The relationships between habitat topology, critical scales of connectivity and tick abundance Ixodes ricinus in a heterogeneous landscape in northern Spain. Ecography 2003, 26, 661–671. [CrossRef]
- Perret, J.-L.; Rais, O.; Gern, L. Influence of Climate on the Proportion of Ixodes ricinus Nymphs and Adults Questing in a Tick Population. J. Med Èntomol. 2004, 41, 361–365. [CrossRef]
- Dallas, T.A.; Carlson, C.J.; Poisot, T. Testing predictability of disease outbreaks with a simple model of pathogen biogeography. R. Soc. Open Sci. 2019, 6, 190883. [CrossRef]
- Johnson, P.T.J.; de Roode, J.C.; Fenton, A. Why infectious disease research needs community ecology. Science 2015, 349, 1259504–1259504. [CrossRef]
- Breiman, L. Random forests. Mach. Learn. 2001, 45, 5–32.
- Hilty, S.L.; Brown, W.L. A Guide to the Birds of Colombia; Princeton University Press: Princeton, NJ, USA, 1986.
- McMullan, M.; Donegan, T.M. Field Guide to the Birds of Colombia, 3rd ed.; ProAves: Bogotá, Colombia, 2014.
- Lindholm, A.K.; Clayton, D.H.; Moore, J. Host-Parasite Evolution: General Principles and Avian Models. J. Anim. Ecol. 1997, 66, 913. [CrossRef]
- Ebert, D. Ecology, Epidemiology, and Evolution of Parasitism in Daphnia; National Library of Medicine (US), NCBI: Bethesda, MD, USA, 2005.
- Hatcher, M.J.; Dick, J.T.A.; Dunn, A.M. How parasites affect interactions between competitors and predators. Ecol. Lett. 2006, 9, 1253–1271. [CrossRef]
- Libersat, F.; Kaiser, M.; Emanuel, S. Mind Control: How Parasites Manipulate Cognitive Functions in Their Insect Hosts. Front. Psychol. 2018, 9, 572. [CrossRef]
Figure 3.
Bird diversity (left) across elevation bands and Andes ecoregions (right).
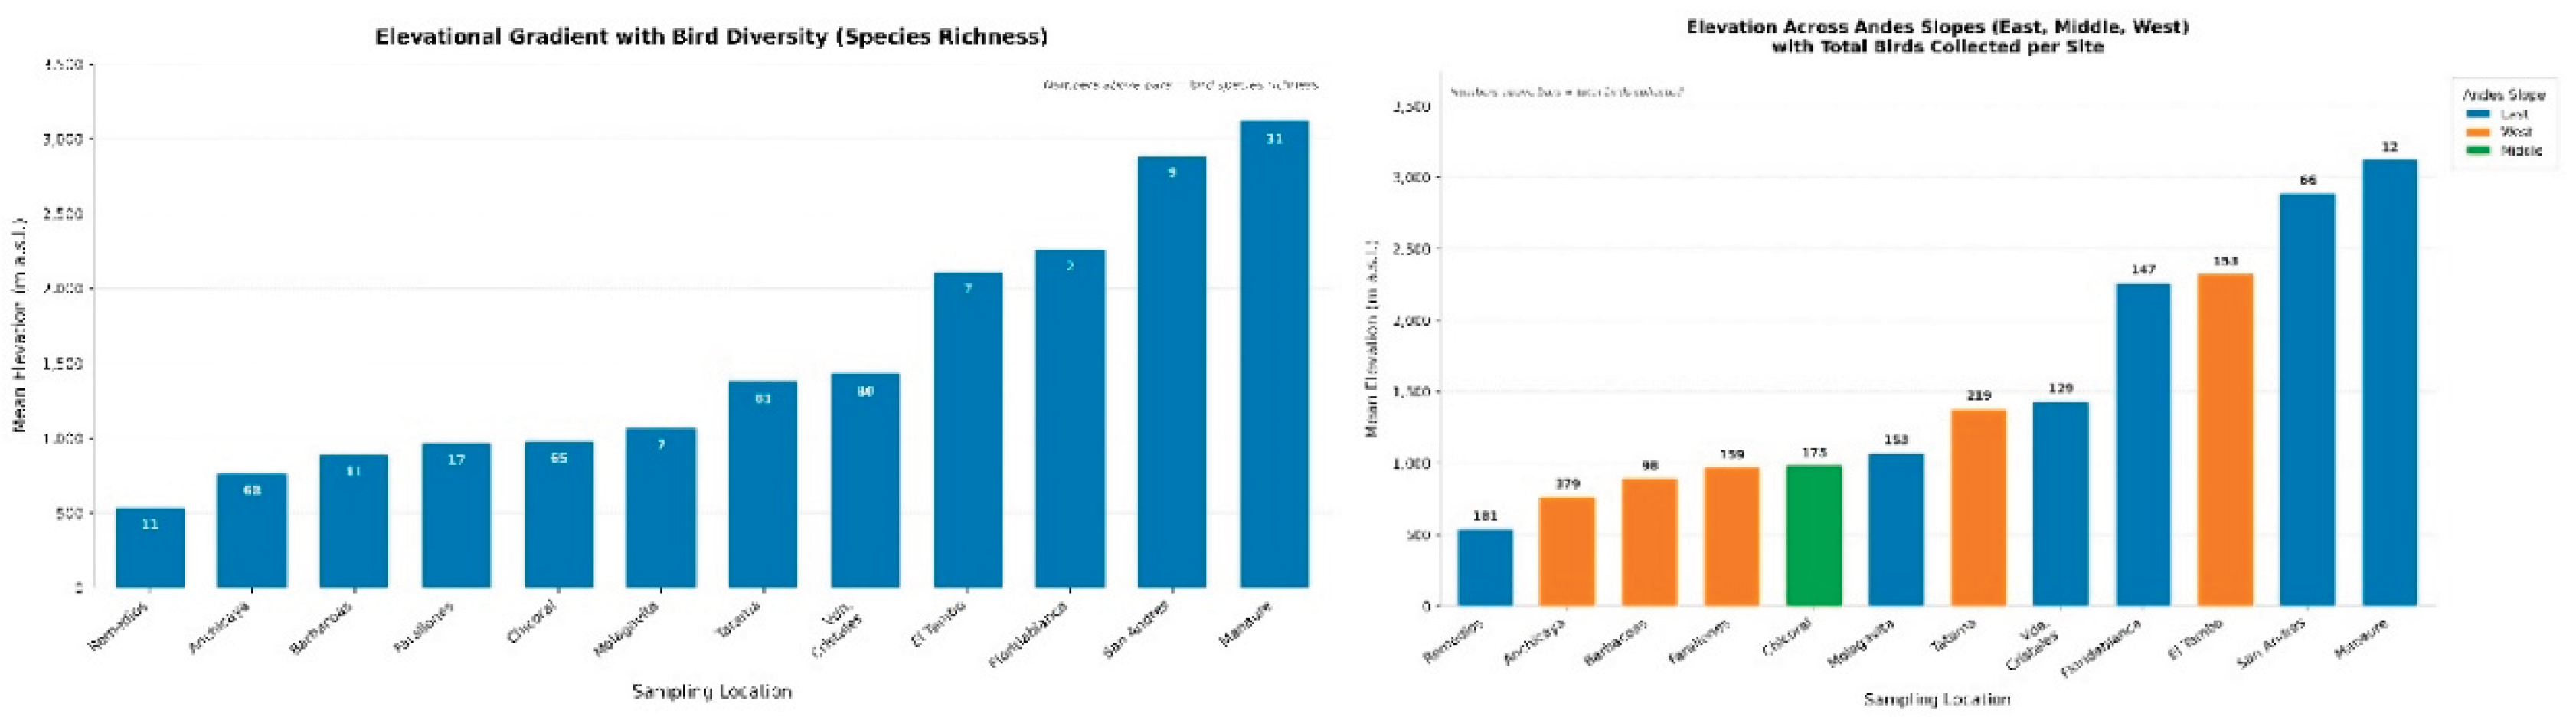
Figure 4.
Tick prevalence (sum) relative to bird capture (left), and percentage of infestedbirds with tick (right) across elevation bands (right).
Figure 4.
Tick prevalence (sum) relative to bird capture (left), and percentage of infestedbirds with tick (right) across elevation bands (right).
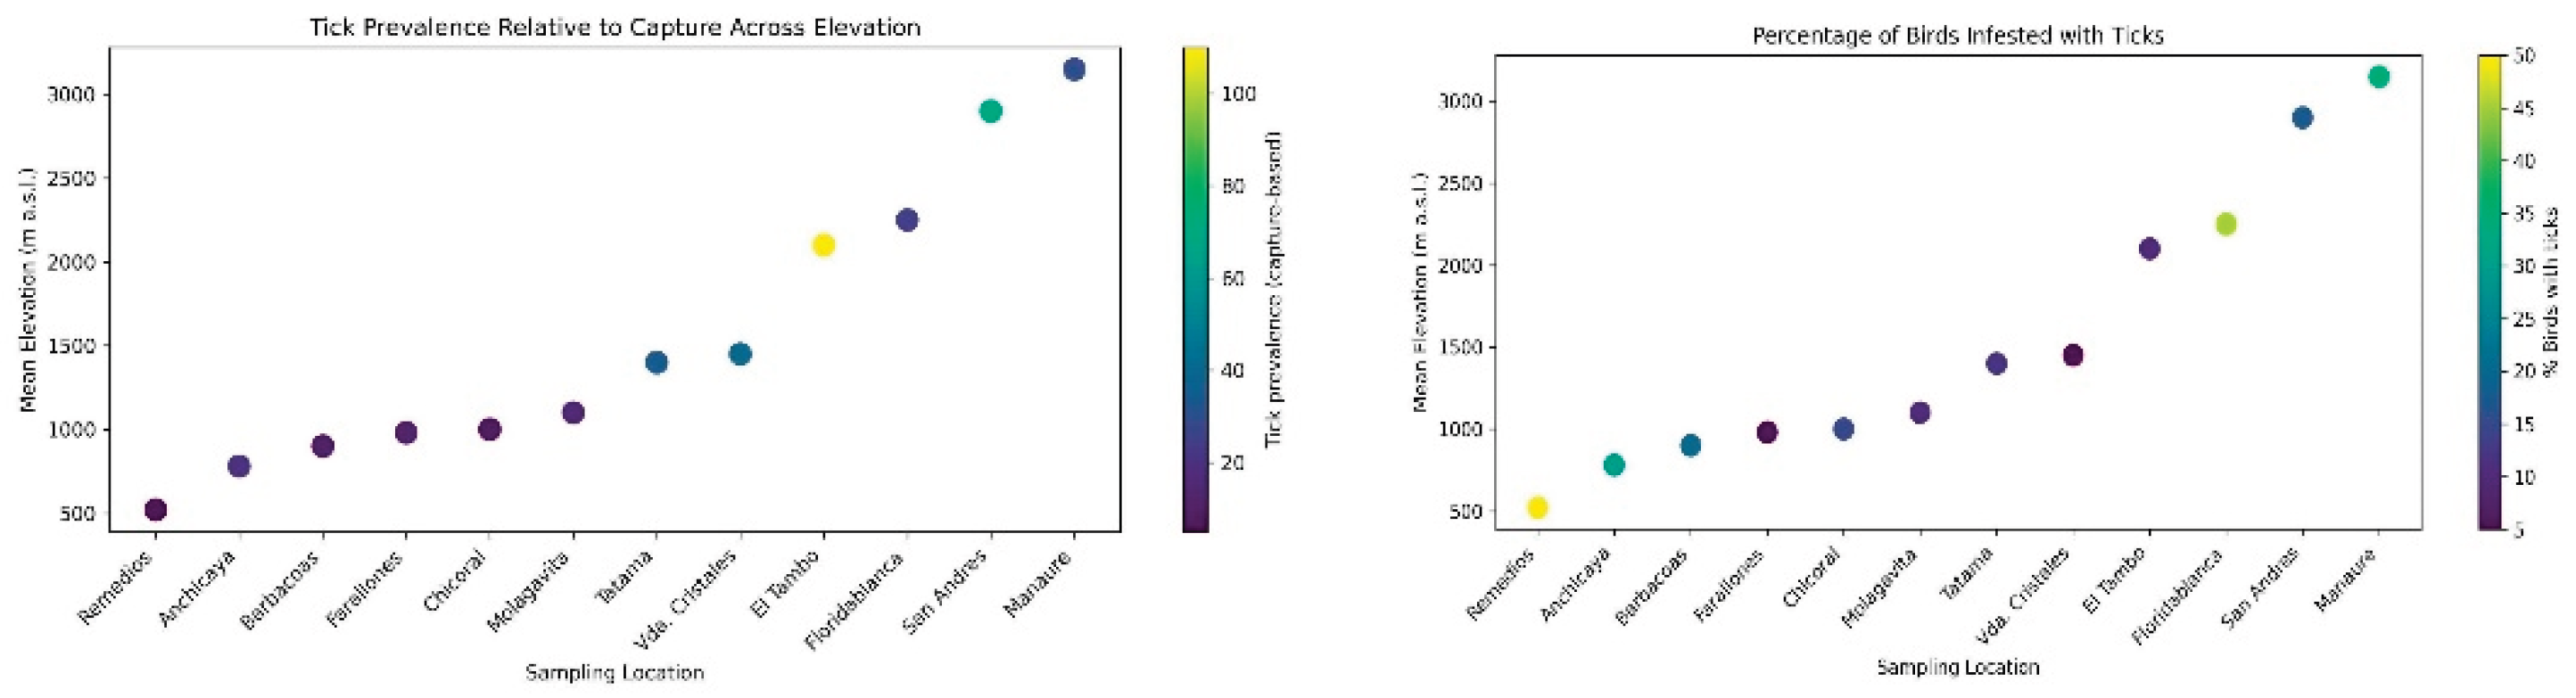
Figure 5.
Land-use/land-cover (LULC) change (2008–2019) per sampling locality across the Colombian Andes. Bars represent the net change in mean shape area (Δ × 106 m2) per LULC type between 2008 and 2019, calculated as Δ = Area2008 − Area2019; negative values indicate net expansion (2019 extent exceeds 2008 baseline) and positive values indicate net contraction.
Figure 5.
Land-use/land-cover (LULC) change (2008–2019) per sampling locality across the Colombian Andes. Bars represent the net change in mean shape area (Δ × 106 m2) per LULC type between 2008 and 2019, calculated as Δ = Area2008 − Area2019; negative values indicate net expansion (2019 extent exceeds 2008 baseline) and positive values indicate net contraction.
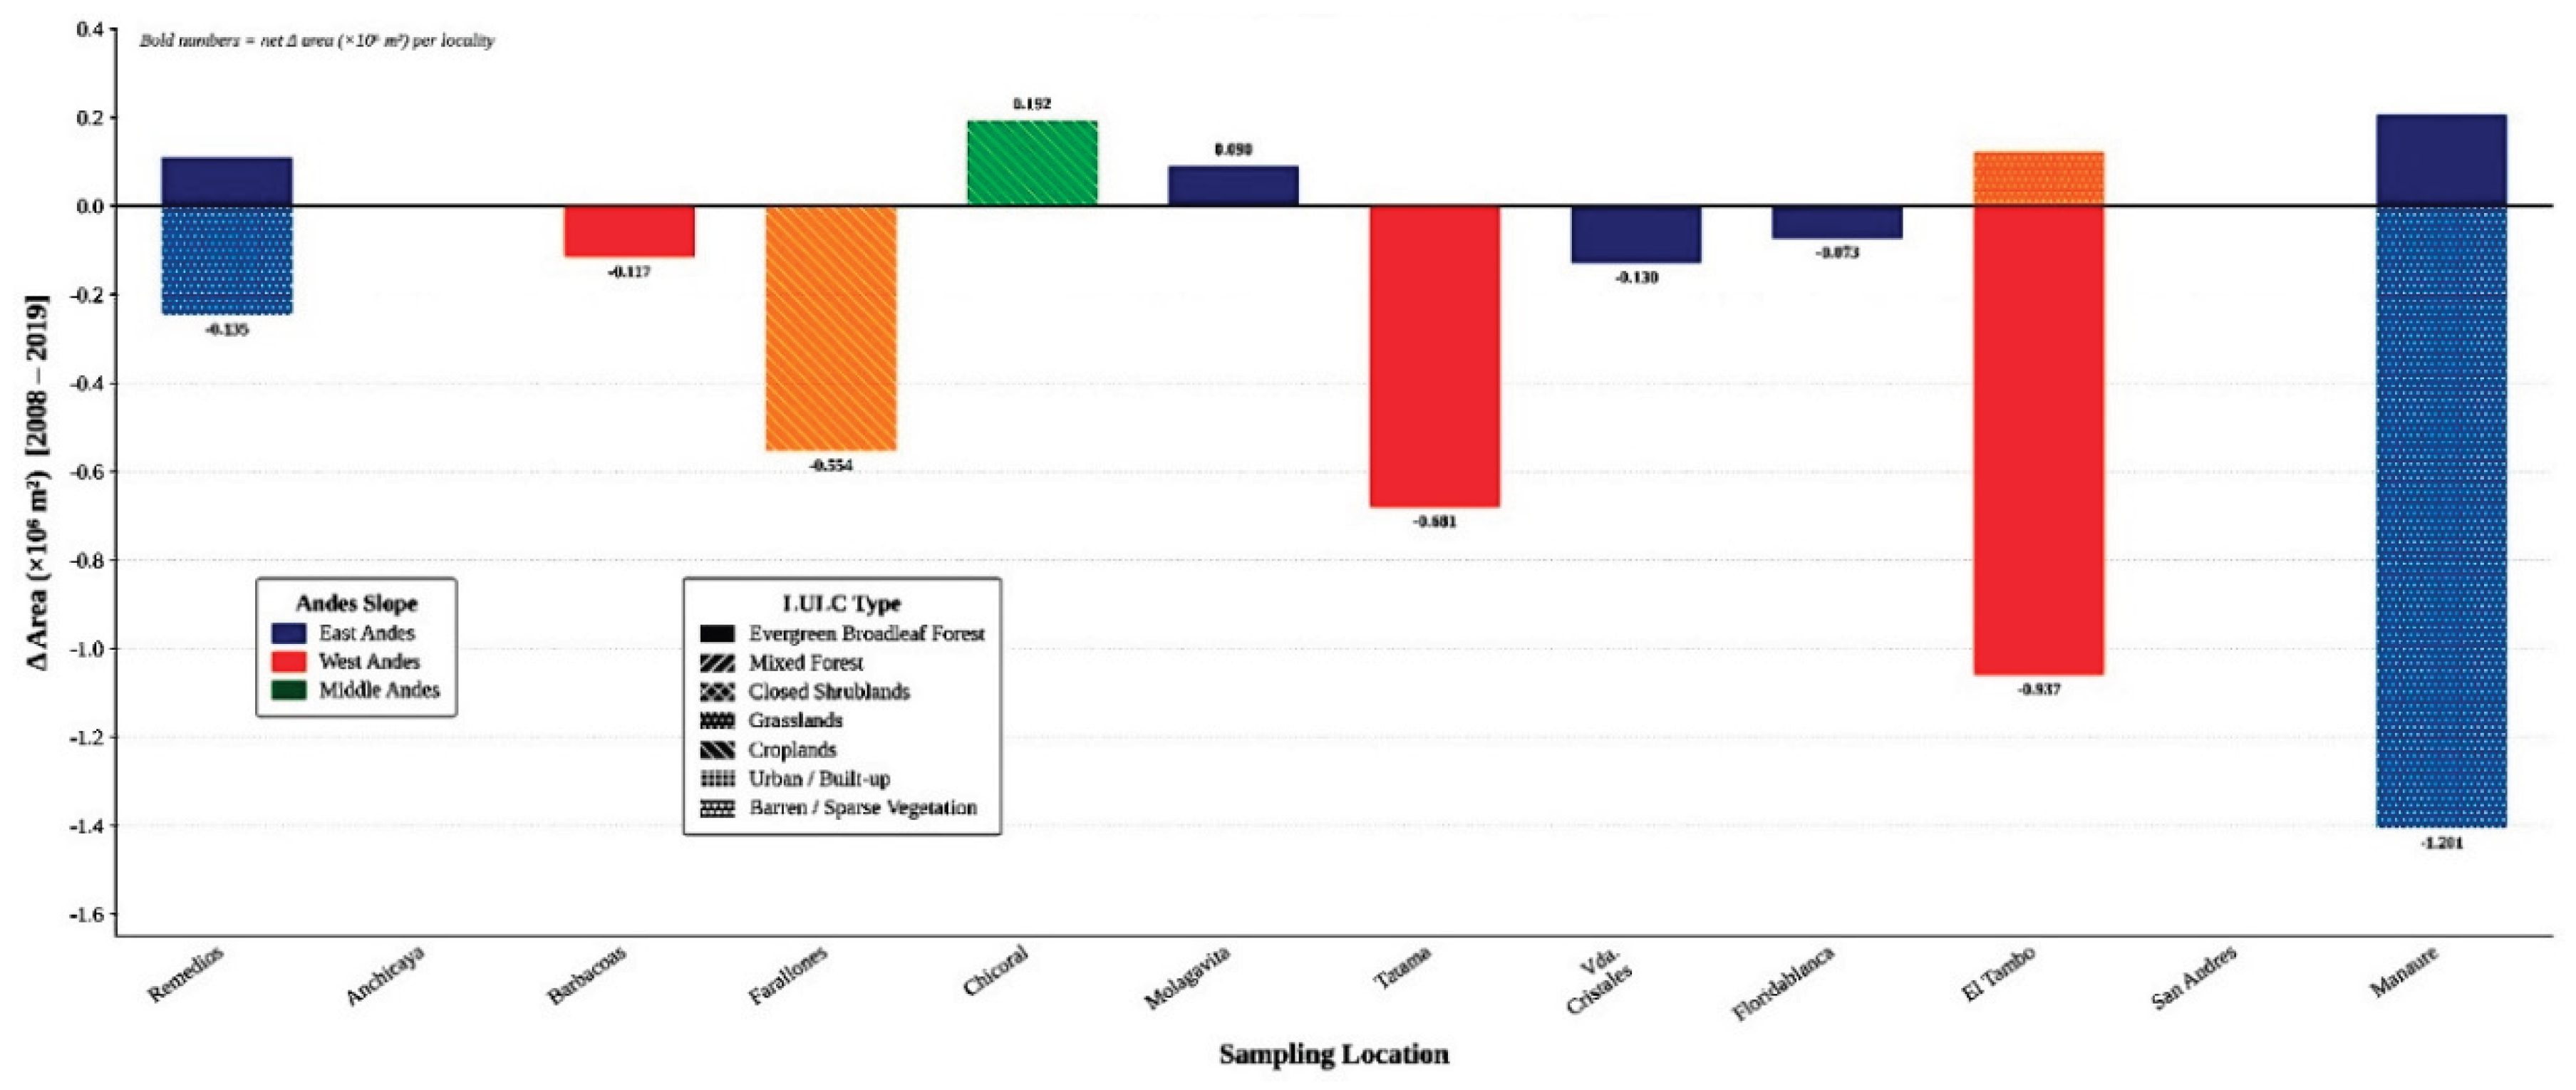

Table 1.
Fifteen field sampling locations of bird ectoparasites during 2008–2019.
| Sampling Location | Andes Region | Reserve/Location | Lat (°) | Lon (°) | Elev. (m) | Birds/Species | Tick Prev. (Birds %) | Tick Prev. (Species %) |
| Chicoral | Middle | Res. forestal Bitaco | 3.340 | -76.351 | 983.9 | 211/65 | 0.00 | 0.00 |
| Anchicaya | West | Anchicayá | 3.601 | -76.895 | 765.7 | 210/68 | 11.90 | 11.76 |
| Barbacoas | West | Reserva el Pangan | 1.355 | -78.077 | 890.4 | 18/11 | 11.11 | 9.09 |
| Farallones | West | Est. Biol. Zygia | 3.262 | -76.402 | 970.7 | 22/17 | 4.55 | 5.88 |
| El Tambo | West | Res. Mirabilis-Swarovski | 2.522 | -76.983 | 2323.3 | 4/4 | 0.00 | 0.00 |
| Res. Natural Tambito | 2.502 | -77.001 | 1899.0 | 3/3 | 33.33 | 33.33 | ||
| Tatama | West | Cerro Montezuma | 5.238 | -76.084 | 1380.0 | 296/63 | 28.72 | 28.57 |
| Remedios | East | La Brillante | 6.905 | -74.577 | 538.8 | 15/11 | 20.00 | 18.18 |
| Floridablanca | East | Res. Maklenikes | 7.084 | -73.021 | 2260.8 | 3/2 | 66.67 | 50.00 |
| San Andres | East | Fca. El Tablon | 6.745 | -72.795 | 2887.7 | 9/7 | 0.00 | 0.00 |
| Fca. La Paterna/La Corcova | 6.740 | -72.802 | 2891.6 | 2/2 | 50.00 | 50.00 | ||
| Manaure | East | Arriba del Cinco | 10.364 | -72.897 | 3120.2 | 159/28 | 46.54 | 46.43 |
| Casa de Vidrio | 10.364 | -72.290 | 3121.3 | 4/3 | 25.00 | 33.33 | ||
| Molagavita | West | La Pica, Fca. La Rinconada | 6.012 | -72.013 | 1072.3 | 17/7 | 0.00 | 0.00 |
| Vda. Cristales | East | Reserva El Rasgon | 7.040 | -72.989 | 1432.5 | 191/80 | 11.52 | 11.25 |
Table 2.
Variable importance metrics from microhabitat, macrohabitat, and combined Random Forest Models for tick prevalence on avian hosts in the Colombian Andes.
Table 2.
Variable importance metrics from microhabitat, macrohabitat, and combined Random Forest Models for tick prevalence on avian hosts in the Colombian Andes.
| Variable | Permutation Importance (%) | Mean Decrease Accuracy (MDA) | Correlation Coefficient β |
| MICROHABITAT MODEL | |||
| Mixed_flocks | 0.258 | 28.046 | 0.13 |
| Bill_shape_tweezer | 0.242 | 22.086 | 0.088 |
| understory_midstory | 0.236 | 24.978 | 0.086 |
| Sociality_solitary_pairs | 0.233 | 19.663 | 0.079 |
| Sociality_pairs_group | 0.227 | 27.285 | −0.178 |
| Understory | 0.224 | 24.082 | −0.025 |
| Diet_insects_fruit | 0.224 | 21.937 | 0.039 |
| Sociality_solitary | 0.220 | 19.405 | 0.115 |
| Diet_insects | 0.218 | 22.480 | −0.076 |
| Sociality_pairs | 0.210 | 19.361 | −0.046 |
| Bill_shape_swiss_army_knife | 0.207 | 22.608 | −0.072 |
| Ground_understory | 0.201 | 16.516 | 0.073 |
| Migratory | 0.201 | 19.033 | 0.051 |
| Bill_shape_probe | 0.201 | 19.571 | −0.026 |
| Canopy | 0.200 | 22.019 | 0.001 |
| MACROHABITAT MODEL | |||
| Avg. elevation (m) | 0.126 | 15.264 | 0.459 |
| Barren/Sparse vegetation | 0.092 | 16.885 | −0.629 |
| Closed shrublands | 0.086 | 15.264 | −0.441 |
| COMBINED MODEL | |||
| Avg. elevation (m) | 0.104 | 61.616 | −0.094 |
| Bill_shape_probe | 0.019 | 39.238 | −0.026 |
| Diet_insects | 0.021 | 31.837 | −0.076 |
| Diet_insects_fruit | 0.021 | 30.384 | 0.039 |
| Bill_shape_swiss_army_knife | 0.020 | 30.219 | −0.072 |
| Bill_shape_tweezer | 0.020 | 29.409 | 0.088 |
| Sociality_solitary_pairs | 0.019 | 28.893 | 0.078 |
| Ground_understory | 0.017 | 27.951 | 0.073 |
| Mixed_flocks | 0.019 | 26.903 | −0.13 |
| Understory | 0.019 | 26.483 | −0.025 |
| Sociality_pairs | 0.018 | 25.123 | −0.046 |
| Sociality_solitary | 0.019 | 24.291 | 0.115 |
| Migratory | 0.016 | 24.092 | 0.051 |
| Understory_midstory | 0.019 | 23.459 | 0.086 |
| Closed shrublands | 0.078 | 21.708 | −0.415 |
| Barren/Sparse vegetation | 0.074 | 20.104 | −0.616 |
| Sociality_pairs_group | 0.017 | 18.329 | −0.178 |
| Canopy | 0.016 | 15.308 | 0.001 |
Disclaimer/Publisher’s Note: The statements, opinions and data contained in all publications are solely those of the individual author(s) and contributor(s) and not of MDPI and/or the editor(s). MDPI and/or the editor(s) disclaim responsibility for any injury to people or property resulting from any ideas, methods, instructions or products referred to in the content. |
© 2026 by the authors. Licensee MDPI, Basel, Switzerland. This article is an open access article distributed under the terms and conditions of the Creative Commons Attribution (CC BY) license.
Copyright: This open access article is published under a Creative Commons CC BY 4.0 license, which permit the free download, distribution, and reuse, provided that the author and preprint are cited in any reuse.


