

Submitted:
26 March 2026
Posted:
30 March 2026
You are already at the latest version
Abstract
Aqueous pyrolysis liquid (APL) is the water‑rich by‑product of pyrolysis with high organic content; however, it is too dilute for economical fuel upgrading, so practical applications remain limited. This study investigates the feasibility of co-digesting hydrolyzed sewage sludge filtrate with APL in high-rate anaerobic reactors to enhance energy recovery and as a treatment step for APL. Two lab-scale reactors were operated for >500 days: one fed with filtrate and APL, and a control fed with filtrate only. Results show that APL can be degraded at loadings up to 0.3 g CODAPL/L/d (≈2.1% w/w) without severe inhibition, achieving 93% CODAPL removal and stable methane production. Compared to previous studies, this work demonstrates substantially higher APL degradation under co-digestion conditions. Higher loadings (≥0.44 g CODAPL/L/d) caused inhibition despite recovery attempts. Microbial analysis revealed a shift from acetoclastic to hydrogenotrophic methanogenesis, dominated by Methanobacterium and Methanosarcina, alongside enrichment of taxa linked to resistance to a toxic environment. Measurements of pollutant concentration in effluent indicated partial degradation of low-molecular-weight polycyclic aromatic hydrocarbons (PAHs) and transformation of some polyfluoroalkyl substances (PFAS), though most pollutants persisted in effluent. These findings highlight the potential of high-rate reactors for APL treatment and underscore the need for strategies such as inoculum acclimation, pretreatment, or additives to achieve industrial-scale loadings. The study provides insights into microbial resilience, pollutant fate, and operational considerations for integrated anaerobic digestion–pyrolysis systems.

Keywords:
anaerobic digestion
; aqueous pyrolysis liquid
; resource recovery
; microbial dynamics
; pollutant fate
; integration technologies
1. Introduction
In recent years, both the academic and industrial sectors have focused on recovering energy and valuable products from sewage sludge (SS) and other waste streams. To advance the zero-waste goal, these efforts prioritize responsible production and consumption alongside material reuse and recovery, and they prohibit releases to air, land, or water that may jeopardize environmental and human health (Zero Waste Associates, 2013). SS is commonly stabilized through anaerobic digestion (AD) in municipal wastewater treatment plants. The products of AD are biogas, an energy carrier, and digestate, a potential soil amendment. Therefore, these two products are considered bioenergy and biofertilizer with significant values. However, the digestate may have adverse effects on soil due to the presence of heavy metals and persistent organic pollutants (POPs) (Golovko et al., 2022; Czatzkowska et al., 2025). Effluent quality is crucial for using AD as the sole technology. According to the U.S Environmental Protection Agency, Class A (pathogen-free) and B biosolids can be used as soil conditioners and to fertilize vegetation, but not on soil restricted for food production (Walker et al., 1994). Also in the European Union (EU), SS is not on the EU fertilizing products and is regulated by a 40-year-old regulation (Leino et al., 2025). These regulations are outdated and do not address emerging pollutants, which pose potential ecological and human health risks, even as a soil amender. Therefore, new technologies for handling SS that maximize energy recovery and minimize environmental burden are needed. One of the proposed new technologies is to use pyrolysis as an additional unit in the SS treatment system.
While AD can effectively break down organic matter, it has difficulty degrading POPs and various other contaminants. POPs such as polyfluoroalkyl substances (PFAS), polycyclic aromatic hydrocarbons (PAHs), polychlorinated biphenyls (PCBs), and dioxins which can be found in SS (Clarke and Smith, 2011; Lamolinara et al., 2022). Other pollutants found in SS are pharmaceuticals, antibiotics, personal care products, and microplastics (Gonzalez-Salgado et al., 2020; Estoppey et al., 2024; Biel-Maeso et al., 2019). These can be partially degraded in AD, where it is reported that 60% of antibiotics, 30-50% of pesticides and pharmaceuticals, and only 0-25% of POPs are degraded (Paramonov et al., 2024). In this sense, most of the pollutants will end up in the effluent. A proposition is to extend the system beyond AD to remove pollutants. Pyrolysis is emerging as a novel method for SS treatment. The pyrolysis process operates in the absence of air and produces three products: pyrolysis liquid (PL), pyrolytic gas, and biochar (Al-Rumaihi et al., 2022). It has been found that pyrolysis at ≥ 400°C reduced POPs in biochar to below the detection limit (Moško et al., 2021; Buss, 2021; Hušek et al., 2022). Biochar can thereby serve as a safe substitute for digestate disposal, providing valuable nutrients (nitrogen, phosphorus, potassium, magnesium, calcium), increasing soil pH, and improving soil structure through aeration and water infiltration (Hossain et al., 2020). Research supports using SS biochar as a fertilizer, highlighting the need to ensure its safe production for soil application.
Integration of AD and pyrolysis is an emerging topic now for pollution removal, volume reduction of sludge, and to maximize energy recovery by refeeding the PL (Tayibi et al., 2021). Previous attempts have been made to recycle the PL back to AD, but research has shown inhibition and high POP concentrations in effluent (Hamalainen et al., 2022; Flatabø et al., 2024). The PL can be separated into an organic-rich phase (bio-oil) and a water phase, termed as aqueous pyrolysis liquid (APL) (Csutoras and Miskolczi, 2024). Bio-oil can be upgraded to fuel-quality by removing water and corrosive constituents (Shah et al., 2020; Seyedi et al., 2020). APL, on the other hand, has no particular use due to its high water content, low heating value, and high chemical oxygen demand (COD) (Seyedi et al., 2021). Research has shown that PAHs, which are formed during pyrolysis, end up in the bio-oil rather than the APL, which reduces the POP content in APL (Schlederer et al., 2024). PFAS, on the other hand, can be redistributed according to the pyrolysis carrier gas flow, where approximately 6-7% will end up in APL, and 2-5% will end up in the bio-oil, respectively, to the original PFAS concentration in the biosolids (Schlederer et al., 2024). APL contains less undegradable oil and a lower concentration of POPs than the entire PL, which may make it a better substrate for AD (Schlederer et al., 2024). However, there are some challenges regarding APL degradation.
Several articles have investigated APL from lignocellulosic material (Zhou et al., 2019; Torri and Fabbri, 2014), organic fraction of municipal solid waste (Yang et al., 2018a), digestate (Hubner and Mumme, 2015), corn stover (Uludag-Demirer et al., 2025), corn stalk (Torri and Fabbri, 2014), and manure (Yu et al., 2020) in AD. These articles show potential for methane production, but also that APL introduces inhibitors that could have adverse effects depending on the loading. A few articles report APL from SS in AD. Seyedi et al. (2020) conducted a long-term continuous experiment with biosolid APL pyrolyzed at 800°C and synthetic primary sludge and found that APL loadings >0.1 g COD/L/d enabled methane production without inhibition. Zhang et al. (2025) co-digested SS APL in a continuous system with SS and degraded >73% of the COD in the APL (CODAPL) to methane. Schlederer et al. (2024) conducted batch tests with SS APL and found a long adaptation time but successful APL digestion. The APL can be digested, but there are some challenges related to inhibition. Inhibitors such as phenols, cresol, styrene, xylene, and nitrogenated organics have been reported in the APL (Seyedi et al., 2019; Ghimire et al., 2021). Accordingly, the literature identifies APL concentration limits for anaerobic digestion, above which adverse effects become pronounced. Hubner and Mumme (2015) found that APL from cow manure and maize digestate could be degraded in a batch reactor at ≤12 g COD/L, yielding 63.4% COD removal, whereas higher COD loading (30 g COD/L) led to inhibition. Some articles also report a maximum threshold for the entire SS PL in co-digestion, with 1% v/w (Hamalainen et al., 2022) or a loading of 0.15 g COD/L/d optimal (Flatabø et al., 2024). Only one article evaluates the threshold SS APL loading in co-digestion (Seyedi et al., 2020), therefore, there is a lack of research in that field.
Most research is focusing on APL digestion in batch reactors (Hubner and Mumme, 2015; Uludag-Demirer et al., 2025; Schlederer et al., 2024; Wen et al., 2020; Yang et al., 2018b; Yu et al., 2020) or in conventional continuous reactors (Seyedi et al., 2020; Torri and Fabbri, 2014; Zhang et al., 2025; Zhou et al., 2019). Previous studies suggest that there is a clear advantage to choosing a continuous reactor due to direct evolution, which can tolerate even higher APL loadings (Zhou et al., 2019). Hamalainen et al. (2022) found that 1% pyrolysis liquid v/w in batch had an adverse effect on the methane production, while in the continuous system, it slightly increased methane production. Also, Seyedi et al. (2020) found that continuous systems produced methane at low APL loadings, whereas batch systems were inhibited. One step further into the acclimation of microbes is to advance toward high-rate reactors. The advantage of a high-rate reactor is the use of granules, which have been found to improve resistance to toxic compounds via extracellular polymeric substance (EPS) production and stratification (Li et al., 2025). EPS production and stratification are essential for pollutant removal (Melo et al., 2022). To use a high-rate reactor, the feed must be solid-liquid separated, as the reactor requires low TS. Only one article has experimented with solid/liquid separation, where the solids are pyrolyzed and the liquid fraction is sent to AD to be co-digested with APL from the pyrolysis process (Okopi et al., 2024a). This study specifically examines food waste treatment, in which the addition of APL did not show any inhibitory effect. However, the article does not investigate microbial pathways and the APL threshold in the digester.
In this study, we evaluate co-processing of the APL produced from pyrolysis of the solid fraction of hydrolyzed sludge (HS) with the liquid fraction in a high-rate anaerobic reactor. The experiment is used to investigate the degradation potential and methane production from APL, as well as the overall treatment efficiency. The study thereby examines the efficiency and degradability of APL in AD. Attention is also directed to the microbial dynamics in the system to evaluate the possibility of direct evolution. Effluent quality is also inspected to assess potential pollutants entering the waste stream. The results of this study can be used to evaluate the potential of high-rate anaerobic systems for treating complex waste streams such as APL, particularly with respect to microbial resilience, pollutant removal, and methane production. These findings contribute to future reactor design and operational strategies for industrial applications involving toxic compounds and POPs.
2. Materials and Methods
In this study, one reactor was fed filtrate and APL, termed the APL-reactor, and one was fed just filtrate, termed the control reactor.
2.1. Origin of Inoculum, Substrate, and APL
The inoculum was in the form of granules obtained from Biowater Technology AS. It was sourced from the full-scale HyVAB® biological treatment facility operated by Smaken av Grimstad AS in Grimstad, Norway. This plant treats wastewater generated primarily from vegetable washing processes.
The substrate was filtrate from sludge (60/40% SS and food waste) that had undergone thermal hydrolysis process (THP) at an industrial AD plant. The filtrate was collected and used either directly from on-site or transported to the laboratory, where it was frozen first. For extracting the filtrate, first, polymer (Zetag® 7563, cationic polyelectrolyte) at 0.25% w/w in water was prepared and mixed with the HS at approximately 20% of mass. HS and polymer were mixed manually and filled into a filter cloth. The polymer promoted sludge coagulation and improved dewatering. The HS filtrate was collected in tanks and frozen for further use. Nutrients were added when operational issues occurred in the reactor. The supplementation included vitamins (1 mL/L), minerals (1 mL/L), and salts (10 mL/L), with detailed compositions described in Sivalingam et al. (2021).
The APL was obtained from Scanship AS and produced by pyrolysis of digested HS from the industrial AD plant at 700°C. Pyrolysis was performed in a Biogreen® unit, and details of the process and setup can be found in Flatabø et al. (2023). There are two condensation temperatures: first, above 100°C, and second, under 100°C. In the first condensation, high-boiling-point compounds such as heavy tars, PAHs, sugars, high-boiling phenolic compounds, and oxygenated organics (Mati et al., 2022). The second phase is the APL and consists mainly of water and lighter, water-soluble compounds, such as light oxygenates (acids, aldehydes, ketones, etc.) and low-boiling-point phenolic compounds (Mati et al., 2022).
2.2. Reactor Design and Operation
2.2.1. Reactor Design
The laboratory AD reactors were made to resemble a 1-meter vertical reactor with a total volume of 2.3 L. A rubber stopper was placed at the top and bottom to ensure a closed environment, and a 3 cm headspace was maintained for safety. The active volume was 2.05 L, including the volume of the recycling line. A recycling line was employed to maintain a constant up-flow velocity, keeping granules suspended. In the initial phase, the recirculation was set to 2.2 m/h. Still, due to high washout of granules and a significant number of granules being crushed in the recirculation pump (peristaltic pump), the recirculation speed was lowered to 1.0-1.5 m/h. Variations in the recirculation speed were due to clogging. The recirculation line takes liquid from the top and pumps it back to the bottom, where a plastic retention grid prevents larger granules from settling and clogging inlets. There was also a feed inlet under the retention grid, which also contributed to the upward speed. At the top of the reactor, a custom-designed plastic solid separator retained the biomass, preventing it from being sent to the gas/liquid separator. A sampling port for biomass extraction was set 15 cm above the inlet line. Moreover, the reactor material was polyvinyl chloride (PVC), and the recycled line was made from nylon. See Figure 1 for the complete schematic of the process.
2.2.2. Feeding System
The prepared substrates were kept refrigerated (4°C) and stirred continuously while being fed to the reactors through Tygon® and nylon tubes using a peristaltic pump. A timer switch was used to control the inlet flow through 20 on/off schedules. The substrate COD, the desired organic loading, and the pump speed adjusted the inflow. Particulate deposition within the tubing led to fouling, decreasing the effective internal diameter, however, complete occlusion (clogging) events were rare. Even though the feed was filtered, some solid particles, averaging 1.2% of total solids (TS), remained in the substrate. Tubes were flushed regularly, often during pump calibration.
2.2.3. Gas/Liquid Separation System and Effluent Protocol
For gas/liquid separation, a 250 mL glass bottle was inverted, with a Tygon® tube for gas and a nylon tube for effluent. The effluent tube was used to regulate the liquid level inside the separator, while the gas tube was placed higher. A loop was made on the effluent line to prevent gas from entering the effluent. Also, the effluent line was immersed in water as an additional gas lock. The effluent sample was taken directly from the gas/liquid separator.
2.2.4. Methane Gas Monitoring
Biogas generated from the AD reactor was first passed through a carbon dioxide (CO₂) absorption unit containing 3M NaOH. Saturation of the solution was monitored using thymolphthalein as a pH indicator, and the solution was replaced upon color change. The remaining gas, primarily methane (approximately 97%), was subsequently directed to a volume displacement gas counter for quantification. Gas production was continuously monitored and logged every three minutes via a custom-built data acquisition system developed in LabVIEW.
2.3. Chemical Analysis
A sample of the filtrate HS was taken directly from the substrate storage tanks, and effluent samples were measured weekly. The samples were analyzed for TS, volatile solids (VS), total COD (tCOD), and pH. After filtering, the samples were measured for soluble COD (sCOD), total ammonium nitrogen (TAN), and volatile fatty acids (VFAs) (acetic acid, propionic acid, butyric acid, iso-butyric acid, valeric acid, isovaleric acid, caproic acid, iso-caproic acid, and heptanoic acid). TS and VS were determined following the standard procedure outlined in EPA Method 1684 (2001)COD was determined using a Spectroquant® test kit in accordance with ISO 15705 (2002), with a measurement range of 500–10,000 mg/L. For filtering, the samples were centrifuged at 10,000 rpm for 10 min, and the supernatant was subsequently filtered through a 0.45 µm filter prior to analysis. TAN was quantified using a Spectroquant® test kit, following the ISO 23695 standard protocol. The measurement range of the kit was 4.0–80.0 mg/L. VFAs were analyzed by gas chromatography with a flame ionization detector and a capillary column, following the procedures and instrumentation described by Bergland et al. (2015). Free ammonia nitrogen (FAN) was calculated as a relative fraction of TAN by Equation 1 (Jiang et al., 2019).
APL was analyzed in another article, in which chemical characteristics were reported in Indrebø et al. (2026a). For the biogas, composition was measured weekly or every other week. Biogas composition was measured before the CO2-trap to estimate the actual composition and after to estimate the efficiency of the trap. The gas composition (CO₂ and CH₄) was measured using a gas chromatograph, as described by Bergland et al. (2015).
2.3.1. Chemical Analysis of Pollutants
Samples of the effluent and substrate were taken to estimate the POP concentration. Three samples from the APL reactor were taken on day 424, 508, and 528, where the first one was during a stable, low APL loading, while the two latter were during the end phase. Only one sample from the control was taken on day 424, since it remained relatively stable throughout the entire time period. The samples were measured for PAH and PFAS. PAHs were quantified because they are a known constraint when integrating PL into AD, with concentrations reported to be 146-fold higher in PL-added reactors than in the control reactor (Flatabø et al., 2024). PFAS were also measured due to their recognized significance and associated health concerns. The samples were centrifuged to remove solids and sent to a laboratory (ALS Global) that conducted the analysis. Only the liquid fraction was analyzed, as the study targeted dissolved constituents relevant to immediate bioavailability and inhibition in AD. The accredited methods used by ALS Global are validated for aqueous matrices. 16 PAHs were extracted using GC-MS or GC-MS/MS according to EPA 8270/ISO 6468 method. 17 PFAS were extracted using LC-MS/MS according to the method EPA 537. Due to the complex matrix in the APL sample, no PAH results were obtained. Only one APL gave results on PFAS.
2.4. Microbial Sample
Microbial samples were obtained from the sampling port where 8 samples from the APL-reactor and 2 samples from the control reactor were sent for analysis. The samples were centrifuged at 4,500 rpm for 30 minutes. The supernatant was discarded, and the pellet was frozen and shipped on dry ice to DNASense ApS (9920 Aalborg, Denmark). DNA was extracted using the FastDNA SPIN Kit for Soil, and libraries were prepared using in-house protocols at DNASense. Gene amplicon sequencing targeting the variable regions V4–V8 (abeV48A) of the 16S/18S rRNA gene was performed to characterize archaeal, bacterial, and eukaryotic communities. Sequence reads were classified using the MiDAS 5.3 database.
3. Results and Discussion
3.1. Feed and APL Characteristics
3.1.1. HS Filtrate
The COD of the HS filtrate was 22.6 ± 3.9 g COD/L, and the TS was 1.2% ± 0.23% with a VS/TS ratio of 88% ± 4.35%. To prepare the substrate, SS was first treated using THP. The HS was then mixed with polymer/water solution to dilute it prior to filtration. Studies found that the COD of HS filtrate after THP was 21.8 g/L (Flatabø & Bergland, 2022) and 27.5 g/L (Indrebø et al., 2026), without polymer/water addition. This shows that the COD content in the HS filtrate used in the laboratory experiment falls within the range reported by the industrial system, making the system industrially relevant. THP is crucial because it enhances dewaterability, removes pathogens, and solubilizes the substrate through high heat and pressure (Han et al., 2017). The solubilized fats and proteins are reflected in the sCOD, ammonium, and VFA concentrations (Xue et al., 2015). Hence, the sCOD concentration increases after the THP process (Hamalainen et al., 2022), but is subsequently diluted by polymer addition. The TAN concentration was on average 1.2 ± 0.6 g/L with a pH of 6.6, which means that most TAN will not shift toward the inhibitory FAN. Moreover, the phenol concentration was measured at 69.4 ± 17.4 mg/L, which is much lower than 0.5 g/L, reported to cause reactor failure (Poirier et al., 2016a).
3.1.2. APL
Quantifying APL yield is essential for industrial loading calculations, as it directly determines volumetric feed rates and COD-based organic loading rate (OLR). With the pilot-scale pyrolysis unit at 700 °C, 20 min, 85.7% TS with digested HS, assuming that 89% of PL will be fractioned as APL (personal communication), approximately 30% w/w APL is produced per kg HS (Flatabø et al., 2023). These are yield data for digestate pyrolysis, which are assumed to be similar to or slightly higher than those for undigested SS. A previous study found that digested SS pyrolysis at 650 °C yielded 21.2% APL, whereas undigested SS pyrolysis yielded 24% APL (Moussa et al., 2025). The APL yield is only relevant for estimating the targeted amount of APL in the experiment. The fraction of APL in co-digestion with HS filtrate should be ~2.7% w/w; however, it is likely to be higher in the real scenario. In the experiment, the aim was to evaluate the relevant loading and to further assess the possible maximum APL addition.
The COD of APL will differ from that of digested and undigested HS due to the higher organic content in undigested HS. Moussa et al. (2025) found that undigested SS APL has higher alcohol, acid, and amide concentrations, and lower hydrocarbons and ester concentrations compared to digested SS. In addition, the APL of undigested SS has a lower water content than that of digested SS, affecting the COD value (Moussa et al., 2025). Therefore, the COD of undigested HS might be slightly higher in a real system compared to that used in the experiment. The COD values of the APLs were 104 g/L (± 3.8) (APL 1) and 167 g/L (± 121.6) (APL 2), respectively (Indrebø et al., 2026a). APL 1 was collected through gravitational separation (non-fractional APL). The APL 2 was collected during fractional condensation and is the most relevant to the industrial system; however, it was not available until the end of the experiment. The COD concentration of 167 g COD/L resembles previously reported SS APL pyrolyzed at 800°C with 202 gCOD/L (Seyedi et al., 2020). The other APL has a COD concentration of 104 g/L and a low standard deviation, which is lower than typical COD concentrations for similar substrates. It is possible that the storage of APL altered its chemical structure due to its unstable nature (Schlederer et al., 2024; Mohamed and Li, 2023). In terms of other components, TAN was the same (2.4 wt.%) for both APLs, but phenol (0.35 wt.%) and total VFAs (1.2%) in the fractional APL were 2-fold that of the non-fractional APL. For undigested sludge APL, the TAN concentration is likely lower due to undegraded proteins.
3.2. Reactor Experiment
The results of methane yield, tCOD reduction, and sCOD reduction in the reactors are presented in Figure 2. The figure also shows the APL loading along the time period.
3.2.1. Phase I
Firstly, only the HS filtrate was digested in both high-rate reactors to adapt the reactors to the new substrate. Both reactors started (phase I) with an OLR of 1.7 gCOD/L/d and were increased to 3 gCOD/L/d, which was reached on day 42. The hydraulic retention time (HRT) was adjusted to the desired OLR and was 8 days ± 1.8 days. The inoculum was taken from a reactor running on filtrate from vegetable waste, which is less complex and inhibitory than the HS filtrate. Microbes were washed out from both the digesters in the beginning (day 0-69), which could be a sign of inhibition (Yang et al., 2025; Poirier et al., 2016b) or that microbes did not manage to settle in the reactor due to too high up-flow velocity. The HS filtrate contains elevated ammonium levels and some phenol, which can be inhibitory to the AD process, especially with an unadapted inoculum (Indrebø et al., 2025). As a direct result of the wash-out, recycling speed was lowered, and effluent was centrifuged, and microbes were added back to the reactor to prevent a complete wash-out. However, this was stopped on day 71 when a solid/liquid separator was added inside the reactor to hinder microbes from escaping. The separator retained the granules, increasing the COD reduction from 54-58% to 62% while maintaining the same sCOD reduction. There is also an apparent decline in %TS in the effluent (Fig. S1), which highlights the importance of adequate solid retention systems in the digester.
3.2.2. Phase II
On day 132 (phase II), APL was added to the substrate in the APL-digesters, and both reactors were kept with an OLR of 3 g tCOD/L/d and an HRT of 8 days. The loading was 0.4% wAPL/wSub, equivalent to 0.05 g CODAPL/L/d (COD fraction by the APL in total feed), the same starting point as Seyedi et al. (2020). This loading was kept until day 265 to make sure that the reactor adapted completely. There was a drop in tCOD degradation from 190 to 232, attributable to microbial washout (Fig. S1). It was decided to wait for a consistent degradation and lower effluent wash-out before continuing the experiment. The APL contains some compounds or pollutants that need further adaptation. APL includes compounds such as cresol, alcohols, benzene, phenols, styrene, xylene, and nitrogenated organics, which can inhibit methane production (Seyedi et al., 2019). Also, POPs such as PFAS inhibit methane production from VFAs (a 36-46% reduction) (Silva et al., 2022). These compounds requires time for adaptation and for possible degradation.
From day 132-185, calculations show that 100% of the APL’s COD was degraded. During the period 186-223, only 38% of the APL was degraded, indicating some inhibition. Vitamins, minerals, and salt were added on day 210 to improve digestion and reduce washout. Estimating the APL degradation is based on the COD reduction of the HS filtrate from the control reactor, which was suggested by Flatabø et al. (2024). Although this calculation is sensitive to COD variations in feed and in the reactor, it gives valuable insight into the APL degradation.
3.2.3. Phase III- VI, Ramp-Up
A ramp-up was started on day 266 (phase III), where the reactor was given an APL of 0.08 gCODAPL/L/d (=0.8 % wAPL/wSub) (a complete overview of the ramp-up stages is given in Table S1). Each step was more than 2 HRTs (2x HRT = ~16 days) to allow adequate time to adapt to higher inhibitor concentrations. Calculations showed that 100% of the COD in the APL was digested at 0.08 g CODAPL/L/d (phase III), 98% at 0.1 g CODAPL/L/d (0.9% wAPL/wSub) (phase IV), and 73% during 0.13 g CODAPL/L/d (0.9% wAPL/wSub) (phase IV). However, at 0.17 g CODAPL/L/d (1.1% wAPL/wSub) (phase V), the APL digestion dropped to 53% even though COD reductions and gas yields were high, and the %TS was only slightly higher than from the last loading (0.41% to 0.54%). This was likely due to some inhibition in the reactor. However, the APL digestion recovered to >60%, and it was decided to proceed to 0.19 g CODAPL/L/d (1.25% wAPL/wSub) (phase V), where the CODAPL reduction was 80%. Since reactor performance was improving, it was decided to increase APL loading to 0.33 g COD/L/d (phase IV) to investigate the impact of sudden high loadings and to identify microbes' tolerance. At this loading (day 423-437), the COD reductions remained high, but the gas yield decreased. Using gas yield as a parameter was challenging because gas could escape into the effluent, as reported on day 415. Recovering from this situation proved difficult, and some gas likely continued to escape into the effluent even after the problem was addressed. Even the control reactor exhibited varying gas yields during the experiment, underscoring the challenges posed by this parameter. This issue was reported by Indrebø et al. (2026a) and Flatabø et al. (2024), underscoring the limitations of gas volume measurement by water displacement in continuous systems. However, real-time monitoring of reactor performance is an effective way to detect issues rapidly. Since the gas yield was decreasing, vitamins, minerals, and salt were added on day 424.
3.2.4. Phase VII
The next APL loading was 2.9% wAPL/wSub (phase VII), equivalent to a loading of 0.44 g CODAPL/L/d, which was the industrial loading, meaning that all APL could be transferred to AD. During this loading, COD reductions and gas yield dropped. One thing to note is that some NaOH entered the system on day 446 due to underpressure from a rupture in the recirculation line. It is probable that the microbes were severely inhibited and died, with dead microbes going to the effluent (1.36% TS, Fig. S1), and some entered the recirculation line and clogged it. The drops in COD reduction and gas yield happened before the accident, where only 19% of APL was degraded. The reactor was not stopped when this accident occurred, as it had happened in a previous test, and it recovered after just a few days. To alleviate some of the APL stress, the reactor was only fed HS filtrate for a couple of days (not shown in the figure for simplicity), and vitamins, minerals, and salt were added. There were signs of recovery, with gas yield and COD reduction slowly increasing. However, the recovery process was slow, so to accelerate it, 30% of the APL-reactor volume was removed and replaced with volume from the control reactor on day 486. It managed to recover but did not reach the same efficiency as in the previous stages. A new APL (APL 2) was used on day 497, as the previous one had been depleted. First, only 2.2% fractional APL, equivalent to 0.6 g CODAPL/L/d, was used. The CODAPL reduction was on average 31.3%, but reached >60% at the end of the loading. This APL has previously been found to be less inhibiting than the first one (Indrebø et al., 2026a); therefore, it was interesting to increase the loading higher and even beyond what was already tested. In this final attempt, a 4.2% wAPL/wSub (or 1.3 g CODAPL/L/d) was tested, resulting in decreased COD reduction and gas yield, ultimately leading to complete inhibition. Although APL 2 was found to be less inhibitory, more time was needed to adapt to the high loading.
3.2.5. Reactor Comparison
The pH of the APL-reactor was on average 8.2 (Fig. S2) and was 2% higher than the control reactor, which is due to the high pH in APL. Methanogenesis has an optimal pH range of 6.6-7.8 (Fu et al., 2021), however, the APL-reactor managed to have VFA reduction suggesting that the pH did not disrupt methane production. The APL-reactor also had a higher methane content in the biogas, averaging 76%, which is 1.4% higher than the control reactor (Fig. S3). At higher APL loadings (<0.85% wAPL/wSub), the methane content increased further by 2.2%. These findings align with previous simulations, which found that PL addition increases the partial pressure of methane and pH (Indrebø et al., 2025). Compared with the control reactor, the TAN concentration increased by only 1% in the APL-reactor, whereas the FAN concentration increased by 41% (Fig. S4), indicating the inhibitory potential of APL. Previous articles have found that FAN is the greatest issue with digested SS APL in AD (Indrebø et al., 2025; Flatabø et al., 2024). During APL loading at 2.9%, there was a drop in COD reduction, while FAN remained low, suggesting other inhibitors. This shows that there is no clear sign of FAN inhibition, but maybe others that are toxic alone or in synergy (Seyedi et al., 2019).
Low COD reductions and gas yield can indicate inhibition, whereas high microbial washout signals instability. For both reactors, there was an acclimatization period for the granules to adapt to the filtrate, which lasted for 125 days after APL addition. This highlights that the granules were not adapted to the APL mixed feed but managed to adapt. In the remaining experiment, the %TS in effluent remained low, but was slightly higher in the control reactor. This also shows that even the HS filtrate inhibited the granules. The TS spiked to 2.4% after the accident on day 446, which clearly shows the inhibition level, which could be an indirect result of APL addition.
3.3. Microbial Dynamics
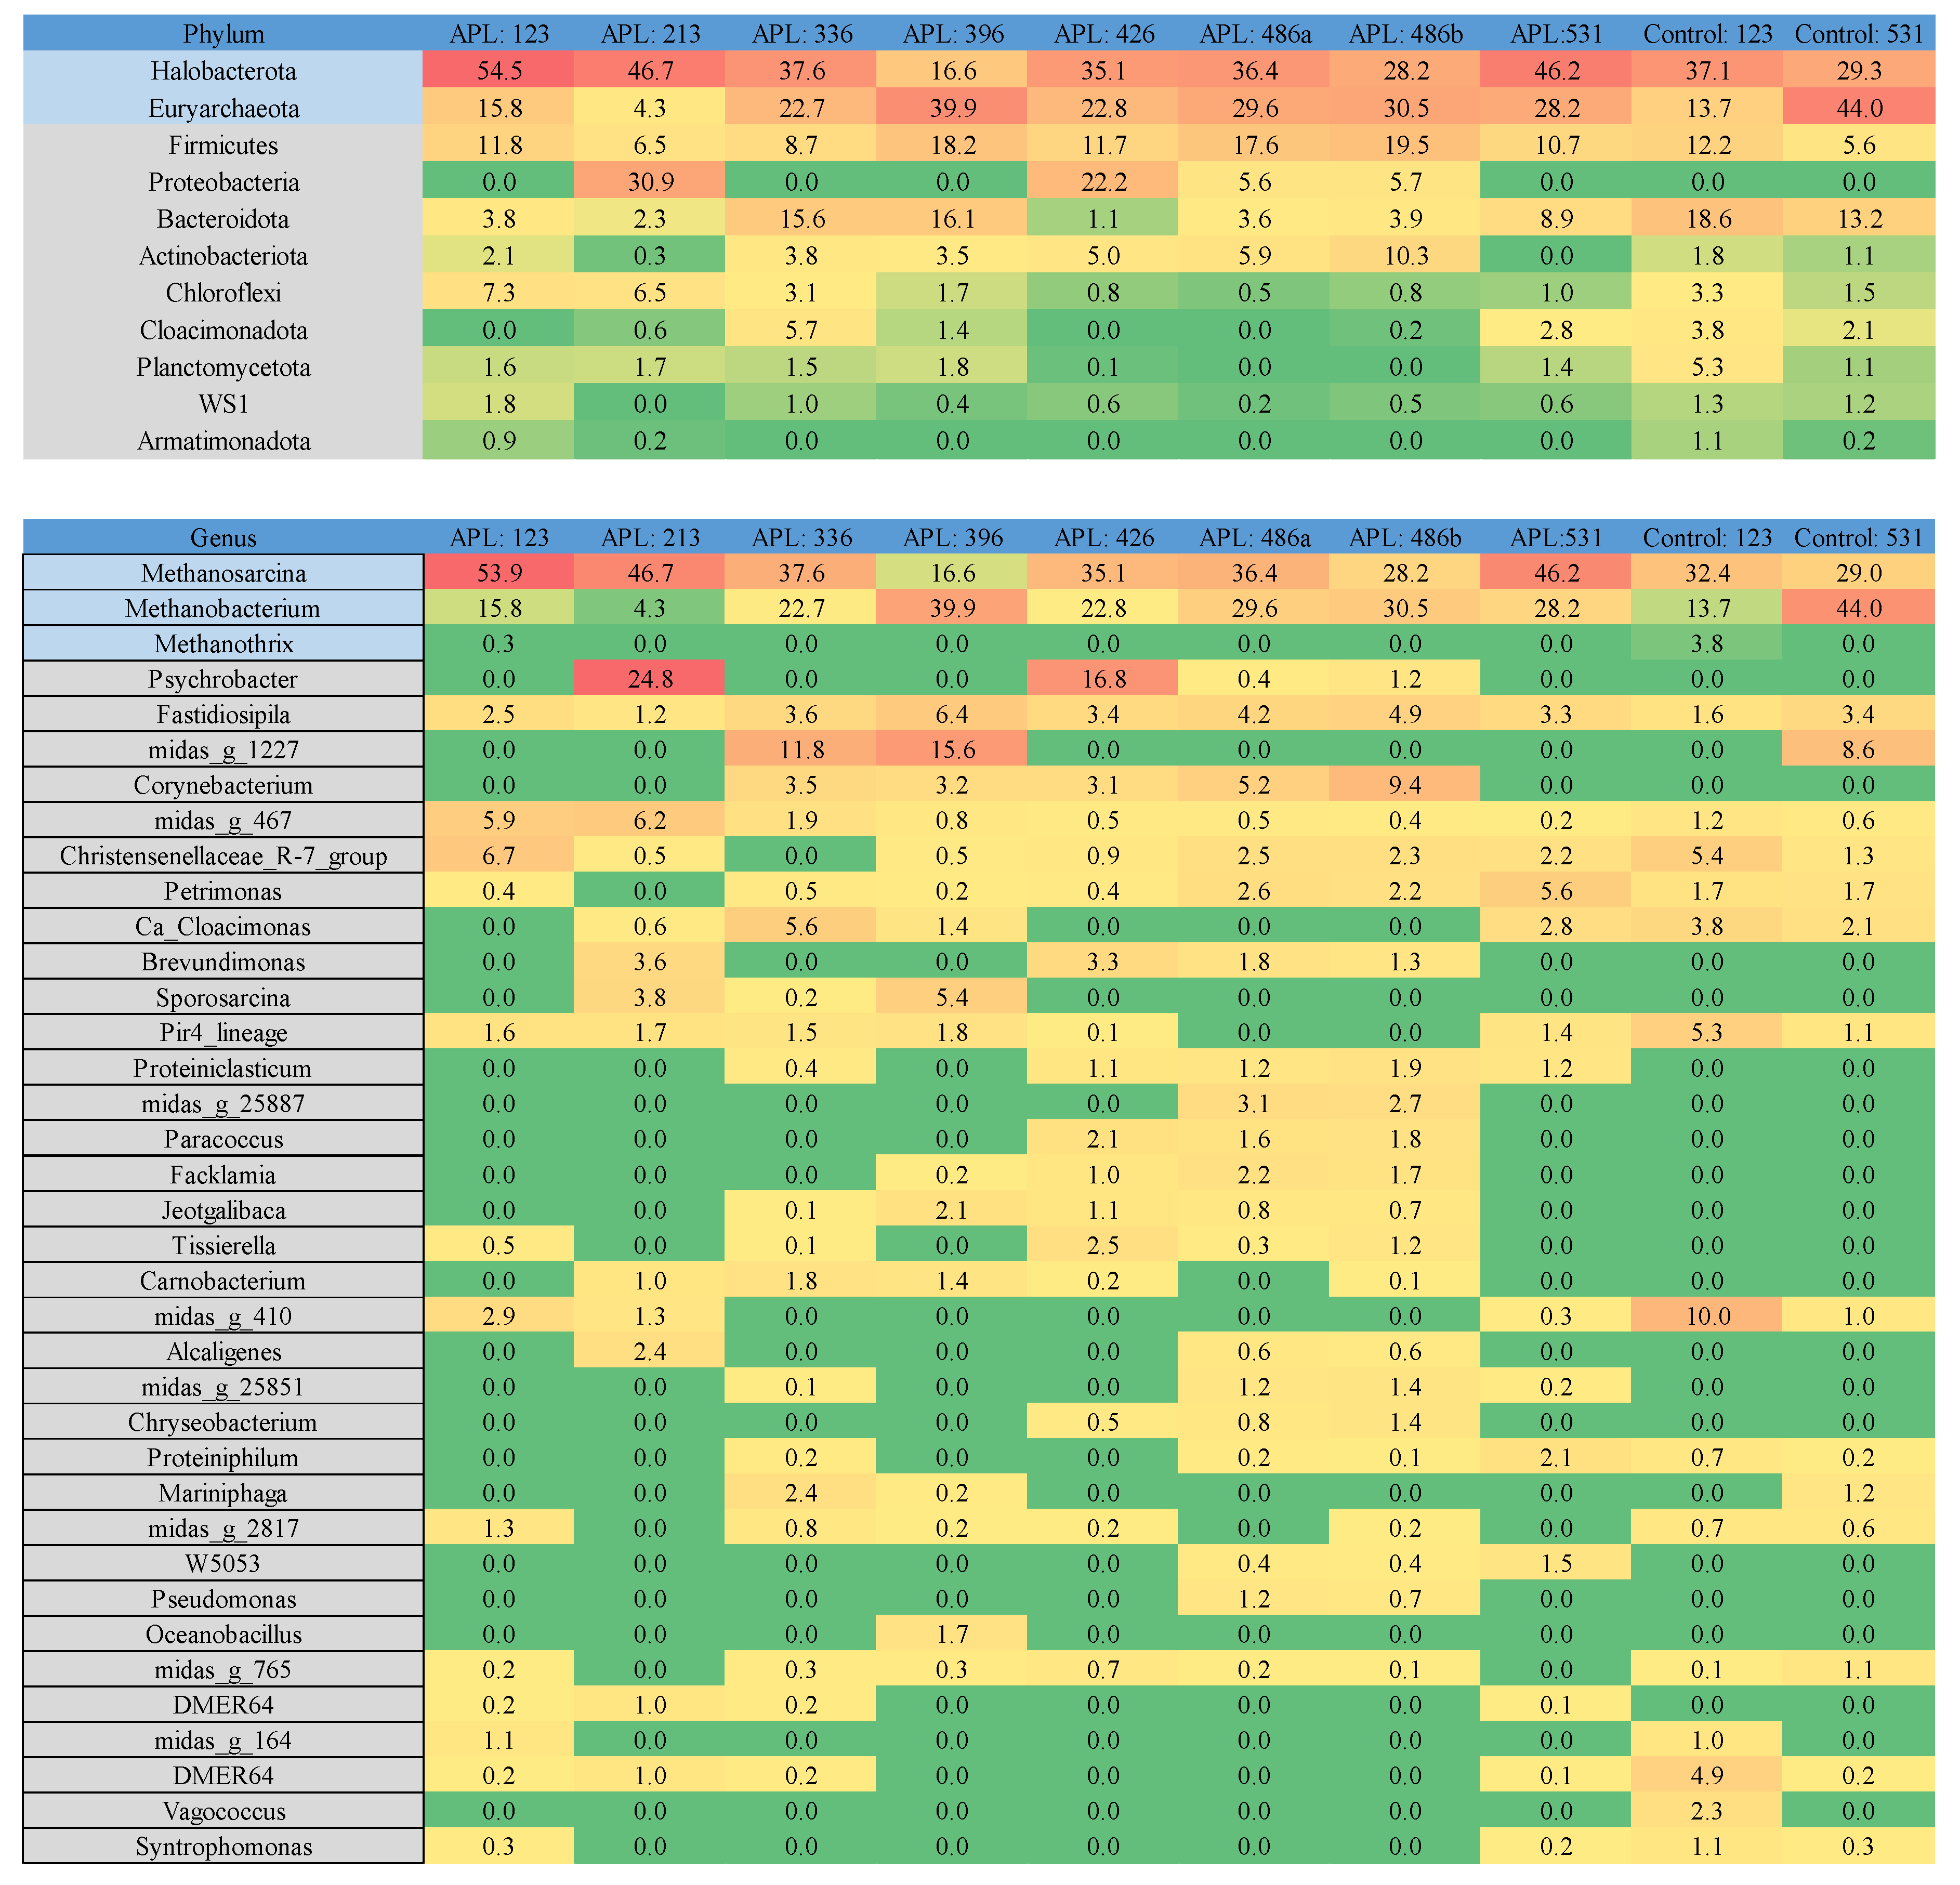
The addition of APL can alter the microbial dynamics, and it is crucial to understand how these changes affect process stability, methane yield, and the resilience of key functional groups. The control reactor will be analyzed at two points, and the APL reactor at eight points (see Fig. 3).
3.3.1. Control Reactor
The first sample was taken on day 123, which was at the appropriate OLR used for the rest of the experiment, and was used as a comparison with the APL-digester before APL addition. The second sample was on day 531, which was at the end of the experiment. The microbial diversity decreased over time despite stable operating conditions. The Shannon index declined from 3.5 on day 123 to 2.3 on day 531, accompanied by a reduction in Operational taxonomic unit (OTU) richness (116 to 77) and evenness (0.74 to 0.54) (Tab. S2). This indicates a shift toward a more specialized and uneven community dominated by a few taxa. However, Simpson’s index remained unchanged (1.7), suggesting that while overall diversity diminished, the dominant functional groups persisted, maintaining process stability. Such community simplification is typical in long-term AD, where adaptation to consistent substrates favors highly efficient degraders and methanogens (Vanwonterghem et al., 2014).
Within the bacterial phylum, on day 123, the community was dominated by Bacteroidota (18.6%) and Firmicutes (12.2%), with the remaining taxa present at <5%. On day 531, all bacterial phyla declined in relative abundance such as Bacteroidota (13.2%) and Firmicutes (5.6%). On a genus level, midas_g_410 (10.0%), Christensenellaceae_R-7_group (5.4%), and Pir4_lineage (5.2%) were the most abundant on day 123. While on day 531, these genuses were suppressed, and midas_g_1227 went from 0% on day 123 to 8.6% on the last day. Both midas_g_410 and midas_g_1227 are in the phylum Bacteroidota, which are specialized in breaking down organic matter such as polysaccharides, proteins, and lipids into simpler compounds through the production of extracellular enzymes (McKee et al., 2021).
For the archaea community, it is evident that they dominate the reactor at the end of the experiment, from 51.5% relative dominance to 73.4%. However, the population of Halobacterota decreased from 37.1% to 29.3%, while that of Euryarchaeota increased from 13.7% to 44%, indicating a shift in microbial dynamics. At the genus level, Methanosarcina is initially present (32.4%) and at the end (29%). Methanobacterium is the most abundant in the end from 13.7% to 44.0%, showing that methane production occurs via the hydrogenotrophic pathway. This shift to hydrogenotrophic methanogens can occur during high inhibition levels, especially during high FAN inhibition. The IC50 of FAN on acetolactic methanogens is 123 mg N/L, suggesting that this pathway is not viable as the average FAN in the reactor is 268 mg/L (Wang et al., 2022). The relative abundance of methanogens increases over time, along with low VFAs, suggesting steady-state digestion and improved methane production (Vanwonterghem et al., 2014).
Figure 3.
Relative abundance of microbial taxa across samples (APL-reactor and control-reactor). The top heatmap shows distribution at the phylum level, while the bottom heatmap details the corresponding genus-level composition within those phyla. Warmer colors indicate higher relative abundance, highlighting dominant groups. Only >1% relative abundance is shown.
Figure 3.
Relative abundance of microbial taxa across samples (APL-reactor and control-reactor). The top heatmap shows distribution at the phylum level, while the bottom heatmap details the corresponding genus-level composition within those phyla. Warmer colors indicate higher relative abundance, highlighting dominant groups. Only >1% relative abundance is shown.
3.3.2. APL Reactor
Microbial diversity in the digester exhibited notable fluctuations over time. The sample from day 123 (phase I) was before APL addition, and showed moderate diversity (Shannon index = 2.44), relatively low evenness (0.55), and moderate richness (OTU=86) (Tab S3). This suggests that the system is still in an adaptation phase. Simpson’s index was at the lowest point (1.29), indicating a dominance of a few taxa. The sample from day 213 (phase II) showed that APL addition caused a sharp reduction in richness (OTU=48), but evenness improved. Day 336 and 396 (phase IV), there is a moderate richness (OTU=68 (both)), higher diversity (Shannon=2.78 and 2.75, respectively), and higher evenness (0.66 and 0.65, respectively), suggesting adaptation. Shannon (2.81) and OTU (73) increased slightly, while evenness remained stable on day 426 (start of phase V), indicating well-distributed taxa and adaptation. On day 486, the reactor entered a recovery phase. To stabilize performance, 30% of the reactor content was removed and replaced with biomass from the control reactor. Samples were collected immediately before and after reinoculation to assess the impact on microbial community structure. Before reinoculation, evenness (0.59) and Shannon (2.57) were reduced, indicating a less balanced, less diverse reactor, reflecting the stressed environment. After reinoculation, the OTU increased by 21 (OTU=98), and evenness (0.63) and Shannon (2.88) increased, indicating a more diverse microbial community. On the last day, the OTU decreased to 80, Shannon to 2.31, and evenness to 0.53, showing low evenness and diversity. The mapped reads were also the lowest, showing a drop in sequencing depth or microbial abundance. Simpson’s index was calculated to be 1.44, which was much lower than previously 1.91, indicating dominance of a few taxa.
For the bacterial phylum, the Firmicutes (11.8%), Chloroflexi (7.3%), and Bacteroidota (3.8%) dominated initially (phase I). Firmicutes are known for breaking down complex polymers (Zhang et al., 2024b), Chloroflexi participate in hydrolysis (Petriglieri et al., 2018), and Bacteroidota are specialized in degrading polysaccharides and proteins (Chen et al., 2016). Previous studies found that Firmicutes/Bacteroidota was a good indicator of process stability, where high levels show stable operation (Chen et al., 2016). This suggests that the AD reactor was stable before the APL was added, as evidenced by methane production and COD removal. When APL was added (phase II), there was a drop of Firmicutes (6.5%), Cholorflexi (6.5%), and Bacteroidota (2.3%) while there was a rise in Proteobacteria (30.9%). In phase IV, the Proteobacteria are absent while Firmicutes and Bacteroidota dominate. Proteobacteria dominate again in phase V (22.2%), but remains low in the subsequent phases. Firmicutes and Proteobacteria are the major phyla in the subsequent steps. Among the most interesting genuses are Christensenellaceae_R-7_group which are often linked to syntrophic interactions with hydrogenotrophic methanogens (Ruaud et al., 2020). Also, Pshychrobacter were abundant in phase II and V, and has been found to be involved in aromatic compound transformation (Prem et al., 2020).
For the methanogenic culture, only two phylum were detected: Halobacterota and Euryarchaeota. These two phyla accounted for more than 50% of the reactor's microbial community, with the lowest being 51% on day 213 (phase II), the first sample taken after APL addition. Initially, Methanosarcina dominated (53.9%), but decreased until day 396 (16.6%). Methanobacterium outcompeted with Methanosarcina and reached 39.9% on day 396. Methanosarcina can utilize both acetate and hydrogen for methane production, while Methanobacterium only utilize hydrogen (Boone et al., 1993). This suggests that the reactor was hydrogenotrophic. In the subsequent days, both microorganisms were present, where Methanosarcina had a slightly higher abundance. This suggests that both acetolactic and hydrogenotrophic methanogenesis occurred simultaneously.
3.3.3. Discussion on microbial dynamics
On day 123, a sample was collected to compare the microbial communities of the reactors before APL addition. The results showed a significant difference: the APL reactor was predominantly dominated by methanogens, comprising 70.2% of its microbial population, while the control reactor had a lower proportion of methanogens at 50.9%. Both reactors produce methane partially by the hydrogenotrophic pathway through the Methanobacterium. However, most methane production comes from Methanosarcina, which has the highest abundance. Since no known syntrophic acetate-oxidizing bacteria (SAOB) were detected and the VFA concentration was low, the main cleavage pathway is acetogenesis (Jiang et al., 2022). There are also differences in the bacterial structure, such as the high abundance of Bacteroidota in the control (18.6%) compared to the APL digester (3.8%).
The reactor’s main methanogenic pathway shifted gradually from acetogenic to hydrogenotrophic on day 396. The bacteria midas_g_1227 went from being absent to being one of the more abundant on day 336 (11.8%) and 396 (15.6%). It is seen that this microbe increases with the abundance of hydrogenotrophic methanogens. This pattern was also seen in the last control sample, where the hydrogenotrophic population dominated. During sampling periods, the VFAs remained low, which suggests that SAOBs were involved in producing hydrogen or formate for hydrogenotrophs. Midas_g_1227 is found in >170 full-scale anaerobic digesters around the world, it is considered a globally prevalent and functionally important taxon within AD microbiomes (Dueholm et al., 2024). However, no data were found on its functions, but it is likely that, based on this study, it is involved in syntrophic or hydrogenotrophic functions.
This study found that Methanosarcina dominated alongside Methanobacterium, which was expected since these microbes are more robust and resilient than the widely known Methanothrix. Methanosarcina often dominates in digesters treating high TAN/FAN, high salt concentrations, high pH, and high acetate concentrations (De Vrieze et al., 2012; Chellapandi and Saranya, 2024). There was a shift from Methanosarcina to Methanobacterium for the APL reactor, which is most likely due to the increase of TAN (>3 g N/L), which partially inhibits Methanosarcina. A shift back to Methanosarcina is seen when the TAN concentration goes down (~2.5 gN/L). A previous study has also found that TAN concentration >3g/L shifts the methanogenic pathway to hydrogenotrophic (Oliveira et al., 2025). Yu et al. (2020) also found that Methanosarcina dominated when digesting lignocellulosic APL mixed with swine manure. In that study, the TAN was around 2 g N/L, which emphasizes the hypothesis that Methanosarcina thrives below 2.5 g N/L. Other articles found that Methanothrix were dominating the digester during APL feeding (Seyedi et al., 2020; Zhou et al., 2019). Seyedi et al. (2020) analyzed the short-term (<50 days) microbial community during APL digestion of biosolids and found that methane production occurred via the acetoclastic pathway. However, an unknown archaea was detected in the sample after APL addition, which could be a more robust archaea or possibly a hydrogen-utilizing archaea. Another article also found that Methanothrix dominated in the beginning, but was reduced, and the hydrogenotrophic methanogen, Methanolinea, gradually dominated in the end (Zhou et al., 2019). Previous articles suggest that the APL gradually shifts the microbial community, either partially or dominantly, toward a hydrogenotrophic community, which aligns with this study.
On a bacterial level, previous research found that Firmicutes and Bacteroidetes were dominating (Yu et al., 2020; Seyedi et al., 2020). In particular, the class Clostridia (phylum Firmicutes) was dominant, as observed in the reactor in this study (Yu et al., 2020). The Clostridia population ranged from 1.7 to16.1% across all samples. Clostridia have been found to play a critical role in AD recovery after ammonia inhibition, because of their ability to ferment protein and amino acid and their resilience to stress (spore-forming bacteria) (Chen et al., 2018). Other interesting bacterial genera are Pseudomonas, which have been found to degrade PFAS by secreting specific enzymes that can break the C-F bond (Ye et al., 2025). This genus has also been shown to degrade PAHs by producing biosurfactants and oxidizing aromatic rings via dioxygenases (Chen et al., 2023). Tests with this strain are commonly found in pure culture tests, and limited information is found on mixed culture. However, this is an interesting observation as Pseudomonas peaks during inhibition (day 486).
3.4. Effluent Pollutants
Effluents from AD processes are typically monitored to ensure compliance with discharge requirements, especially when directed to a wastewater treatment plant. More attention converges toward POPs in the discharge from SS treatment. In this study, only PAH and PFAS were measured in effluents and substrates after centrifugation. The APLs are complex mixtures, and only the PFAS were measured in APL 2. However, POPs are highly recalcitrant; therefore, it is assumed that not all of them are biologically degraded. Results from the laboratory analysis of 16-PAHs and 17-PFAS are presented in Table 1. Values in Table 1 are either given in measured concentrations and/or with the highest possible value, including the limit of quantification.
Only naphthalene was measured in the HS (0.14 µg/L), but it was found to be <0.03 µg/L in the control effluent (Tab. S4). This is a 79% reduction of naphthalene in the reactor. Previous studies have also demonstrated that low-molecular-weight PAHs, such as naphthalene, can be degraded during AD (Christensen et al., 2004; Meckenstock et al., 2004). Thermodynamic calculations indicated that the feasibility of PAH degradation under methanogenic conditions has been linked to the presence of hydrogenotrophic microbes (Christensen et al., 2004). Hydrogenotrophic microbes have been detected in the reactor, which makes a favorable environment for PAH degradation.
The PAH concentration in the APLs was estimated and found to be significantly higher on day 424 (1609.8 µg/L) than on the following days (627.6 and 980.8 µg/L). This indicates that the APL 1, from non-fractional condensation, used on day 424 has a much higher composition of PAHs than APL 2, from fractional condensation, due to the different separation techniques. According to Schlederer et al. (2024), PAHs end up in the oil phase rather than the APL. It was expected that the non-fractional APL would contain PAH, since the APL can be inhomogeneous and may contain oil fractions. However, it was expected that the fractional APL would contain a lower concentration of PAHs because there is a better separation technique. Previous studies reported that 3591 mg PAH-16/kg was present throughout the PL of digested HS at 700°C (Sørmo et al., 2024). The article also showed that there was limited separation between APL and tar (Sørmo et al., 2024). However, some separation was observed in the current study due to aging, but the separation of PAHs was insufficient. Approximately 45% of the PAHs of the total PL ended up in the non-fractional APL. While >27% ended up in the fractional APL. However, the calculated PAH (presented in Tab. 1) assumed that the HS filtrate is the same for all samples; the detection limit was used as the highest value, and no PAH degradation. It is worth noting that the amount of APL used on day 508 was lower than on day 528. This can be due to the degradation of PAH during AD. A study found that some PAHs were degraded during AD in a continuous stirred tank reactor (CSTR): fluoranthene (22% reduction), Benzo(b)fluoranthene (6% reduction), and Benzo(a)pyrene (18% reduction) (Aemig et al., 2019). It is possible to degrade PAHs in AD; however, the compound’s ring number is related to the degradation rate (Heker et al., 2025). More research on granule adaptation and PAH degradation is needed to establish the feasibility of a high-rate reactor system.
For PFAS removal, HS filtrate and all effluent samples were below the detection limit (0.1 µg/L). Non-fractional APL gave a measurement of PFAS of 2.3 µg/L. Perfluorohexanoic acid (PFHxA), Perfluoroheptanoic acid (PFHpA), Perfluorooctanoic acid (PFOA), Perfluorononanoic acid (PFNA), Perfluorodecanoic acid (PFDA), and 6:2 Fluorotelomer sulfonate (6:2 FTS) were successfully measured in the APL. Based on mass balances, PFHxA was reduced by 14-16% on day 424, and was reduced by 40% on day 528. On days 424 and 508, PFHpA and PFOA were increased by 5-7%, while PFNA, PFDA, and 6:2 FTS were increased by 15%. On day 528, PFHpA and PFOA were reduced by 4-5% while PFNA, PFDA, 6:2 FTS were increased by 17-18%. Studies show that PFAS does not degrade during conventional biological processes such as AD (Liu and Charbonnet, 2025). Instead, negative removal efficiencies have been observed, as seen in the present study, due to precursor transformation (Liu and Charbonnet, 2025).
Only one study examines PAH and PFAS in an AD-Py integrated system and its removal, and found a 12% reduction of PAH when HS was mixed with PL (Flatabø et al., 2024). The study also found a 4% reduction in PFAS (Flatabø et al., 2024). In the present study, there were no absolute reduction values due to values lower than the detection limit or limited data. However, based on previous research and findings in this study, PAHs and PFAS will remain in the effluent partly undegraded. Smaller PAH compounds can be degraded, while some of the PFAS can be transformed. The data presented in this study can be used to evaluate if the PFAS and PAHs are within the limits for reject water disposal when filtrate and APL are mixed. Strategies for PFAS and PAH removal should be explored for enhancing POP removal. Biochar can be an effective approach to sorb PAH (Shi et al., 2023) and PFAS (Sørmo et al., 2021; Liang et al., 2024).
3.5. APL Digestion
The results show that mixing the non-fractional APL at 2.1% wAPL/wSub, 0.3 g CODAPL/L/d in co-digestion with HS filtrate did not inhibit methane production. During this period, pH remained stable around 8.1, with low effluent TS, and low VFA concentration in the effluent (Tab. S1). However, the reactor managed even higher loadings of 2.9%, even though the COD reduction decreased initially; it recovered slightly on its own after the reactor's accident. With the second APL, it is probable that the 2.2% w/w, 0.6 g CODAPL/L/d, could be possible with a longer adaptation period. At a load of 4.2%, complete inhibition was observed.
A previous study also examined biosolid APL adaptation in a long-term (>500 days) CSTR experiment co-digesting synthetic feed (Seyedi et al., 2020). The approach was similar to this study, where there was a set OLR and the APL was added as a COD fraction of the total feed, which was stepwise increased. During 0.06-0.1 g CODAPL/L/d, stoichiometric calculations showed that APL was degraded for methane production. At a g CODAPL/L/d of 0.25-0.5, there were indications of inhibition, and methane production ceased (Seyedi et al., 2020). The reactor recovered without APL addition and was reintroduced at 0.3 g COD/L/d, showing no inhibition. In the current study, 0.3 g COD/L/d showed high APL degradation and no inhibition. This shows that APL can be degraded at loadings higher than those reported by Seyedi et al. (2020). Another study used PL from SS digestate in co-digestion with HS and found that the loading was capped at 0.15 g CODPL/L/d (Flatabø et al., 2024). Hamalainen et al. (2022) co-digested HS with PL from digestate and found that a 1% v/w feed (equivalent to 0.12 g COD/L/d) was appropriate and did not affect methane yield or digestate characteristics. PL contains some additional compounds in the organic fraction, which intensifies the toxicity compared to just the APL (Seyedi et al., 2021). In a recent study with fractional APL of digested SS, the loading was capped to 0.2 g CODAPL/L/d (2.4% wAPL/wSub) (Indrebø et al., 2026a). In the current study, it is shown that the APL degradability in another reactor setup increased the APL loading capacity to 0.3 g COD/L/d.
APL degradation is a critical parameter for evaluating the feasibility utilizing AD for APL treatment. This study found that 93% of the APL’s COD was possible to digest at the 0.3 g CODAPL/L/d. This is calculated as the amount of APL remaining in the effluent after subtracting the amount of HS filtrate sCOD degraded in the control reactor. This implies that differences between APL- and control-reactor can have implications. However, sCOD is considered the more stable parameter in the reactor and should be representative of the substrate's degradability, as it is readily degradable. Compared with other studies, Seyedi et al. (2020) found that 0.1 g COD/L/d achieved the theoretical stoichiometric maximum daily methane production, indicating that APL was successfully degraded at this loading. Another article found that 56.9% and 36.9% COD removal was achieved with APL from digestate at the pyrolysis temperatures 330°C and 530°C, respectively, in batch tests (Hubner and Mumme, 2015). A few articles state CODAPL reduction, since it is a complex parameter to evaluate. Previously, a 21% PL COD reduction was estimated, but it was highlighted that such simplifications can be challenging as they do not account for COD reduction variations from the co-feed (Flatabø et al., 2024). In general, this study shows higher APL degradation than in previous articles. This suggests that the APL was more bioavailable, probably because it was mixed only with filtrate, which limits adsorption onto sludge.
3.6. Industrial Relevance
The reactor setup has been evaluated as one of the most critical decisions. Co-digesting APL in batch reactors has been found to be more inhibiting than in semi-continuous systems (Hamalainen et al., 2022). Continuous systems can prevent shock loadings of toxic compounds, dilute them, and support microbial acclimatization (Li et al., 2024). Therefore, continuous systems should be prioritized, with further improvement. One drawback of a conventional CSTR is its low solid retention time (SRT), which allows microbes to escape with the effluent. In high-rate anaerobic reactors, the decoupling of solid retention time (SRT) and HRT allows microbial communities to remain in the system longer, thereby increasing their exposure to inhibitory compounds and promoting adaptation and resilience under toxic conditions (Lee et al., 2025; Seyedi et al., 2021).There is adaptation to the high TAN/FAN contractions in the system through methanogenic shifts and also identification on specific genera in the system. TAN/FAN has been identified as the main inhibitor in the system, and the system’s inoculum should be adapted to this prior to feeding.
Solid/liquid separation of SS prior to pyrolysis and AD is a novel treatment method and allows optimal utilization of both fractions. The liquid consists of easily degradable organics, while the solids contain recalcitrant material, which can be unsuitable for AD. APL from pyrolysis of the solid fraction will contain certain POPs that are introduced into the system. The hypothesis is that POPs are more bioavailable without any sludge, as POPs sorb onto sludge matter and reduce their bioavailability (Barret et al., 2010; Aemig et al., 2016). It is evident that the APL is more bioavailable in the high-rate reactor based on COD removal compared to other reactor types, making solid/liquid separation more attractive. Previously, Indrebø et al. (2026b) found that this system treating SS showed the lowest climate benefits among technologies such as AD, pyrolysis, and AD-Py due to lower biogas production and POPs in the effluent. However, Okopi et al. (2024b) found that solid/liquid separation followed by AD/Py was the most beneficial, compared with AD, pyrolysis, and ADCo-incineration, for food waste treatment. Another study by the same author also found that ADCo-Py was more energetically and economically feasible as well; pyrolysis and ADCo-incineration require 3.8 and 2.8 times more energy (Okopi et al., 2024a). This suggests that the ADCo-Py system outlined in this study can potentially be more sustainable, energetically, and economically more feasible than other treatment methods. The same authors also examined solid/liquid separation of food waste and compared filtrate and filtrate + APL from food waste AD and pyrolysis (Okopi et al., 2024a). This article found that the APL+filtrate exhibited almost the same methane yield as just filtrate, suggesting that APL did not pose severe inhibition.
In the ADCo-Py process, it is possible to skip the THP, even though the dewaterability of the sludge will decrease, it will save energy, and avoid steam dilution. One of the critical parameters is the VS/TS in the raw sludge, where a VS/TS >63% favors pyrolysis, while an integrated system favors feed in the range of 61-63% (Li and Feng, 2018). AD is the best strategy for SS treatment due to no energy or material expenditure for drying and pyrolysis (Li and Feng, 2018). However, standalone AD will be difficult in the future due to POP regulations. Recommended strategy is therefore to avoid processes that dilute the raw sludge. Future research should look into the techno-economic perspective of the ADCo-Py (with or without APL recycling) systems for SS treatment.
In the current study, APL degradation has been shown at a higher loading than previously reported. However, the APL loading of 2.1-2.2% w/w is lower than the 2.7% w/w needed in an industrial setting where all SS is pyrolyzed. The experiment shows that the industrial loading was not achievable without inhibiting methane production. Strategies to improve APL digestion should be investigated. One strategy is to use acclimated inoculum, such as a methanogenic culture from reactors treating complex wastewater with high FAN concentration. Other strategies include altering the pyrolysis conditions. Studies have shown that lower pyrolysis temperatures are beneficial for digestion (Zhang et al., 2024a; Hubner and Mumme, 2015; Zhang et al., 2025). It is also possible to alter the moisture content of the pyrolysis infeed, where a lower moisture content has shown less toxicity (Zhang et al., 2024a). Another strategy is to pretreat the APL or use biochar or other additives in the reactor. Zhang et al. (2024a) found that overliming alleviated inhibition and increased biogas production by 32-fold compared to untreated APL. Pre-ozonation has also proven to decrease toxicity on APL derived from municipal wastewater solids pyrolyzed at 700°C (Seyedi et al., 2024). Biochar as an additive to AD has been shown to mitigate APL inhibition (Uludag-Demirer et al., 2025; Torri and Fabbri, 2014; Wen et al., 2020).
Conclusions
High-rate anaerobic reactors demonstrate promising potential for co-digesting HS filtrate and APL, achieving high COD removal and methane recovery at moderate APL loadings. The system tolerated up to 0.3 g CODAPL/L/d without severe inhibition, outperforming previously reported thresholds. However, industrial-scale loadings (≥0.44 g CODAPL/L/d) resulted in inhibition, indicating that further optimization is required. Microbial community analysis revealed adaptive shifts toward hydrogenotrophic methanogenesis and enrichment of taxa associated with resilience under toxic conditions. Despite partial degradation of PAHs and transformation of some PFAS, most POPs remained in effluent, emphasizing the need for complementary removal strategies. Future work should focus on inoculum acclimation, APL pretreatment, and techno-economic assessment of integrated AD-pyrolysis systems to enable sustainable SS management.
Acknowledgments
This research was conducted as part of the PhD program at the University of South-Eastern Norway. The authors gratefully acknowledge Biowater Technology AS, Scanship AS, and Lindum AS for their invaluable support. Lindum and Scanship are specifically acknowledged for providing feed, APL, and reactor setup. Graphical abstract and Figure 1 were created using BioRender.com.
References
- Aemig, Q.; Chéron, C.; Delgenès, N.; Jimenez, J.; Houot, S.; Steyer, J. P.; Patureau, D. Distribution of Polycyclic Aromatic Hydrocarbons (PAHs) in sludge organic matter pools as a driving force of their fate during anaerobic digestion [Article]. Waste Management 2016, 48, 389–396. [Google Scholar] [CrossRef]
- Aemig, Q.; Doussiet, N.; Danel, A.; Delgenès, N.; Jimenez, J.; Houot, S.; Patureau, D. Organic micropollutants’ distribution within sludge organic matter fractions explains their dynamic during sewage sludge anaerobic digestion followed by composting [Article]. Environmental Science and Pollution Research 2019, 26(6), 5820–5830. [Google Scholar] [CrossRef]
- Al-Rumaihi, A.; Shahbaz, M.; McKay, G.; Mackey, H.; Al-Ansari, T. A review of pyrolysis technologies and feedstock: A blending approach for plastic and biomass towards optimum biochar yield. Renewable and Sustainable Energy Reviews 2022, 167, 112715. [Google Scholar] [CrossRef]
- Barret, M.; Carrère, H.; Delgadillo, L.; Patureau, D. PAH fate during the anaerobic digestion of contaminated sludge: Do bioavailability and/or cometabolism limit their biodegradation? [Article]. Water Research 2010, 44(13), 3797–3806. [Google Scholar] [CrossRef]
- Bergland, W. H.; Dinamarca, C.; Toradzadegan, M.; Nordgård, A. S. R.; Bakke, I.; Bakke, R. High rate manure supernatant digestion. Water Research 2015, 76, 1–9. [Google Scholar] [CrossRef]
- Biel-Maeso, M.; Corada-Fernández, C.; Lara-Martín, P. A. Removal of personal care products (PCPs) in wastewater and sludge treatment and their occurrence in receiving soils. Water Research 2019, 150, 129–139. [Google Scholar] [CrossRef]
- Boone, D. R.; Whitman, W. B.; Rouvière, P. Diversity and Taxonomy of Methanogens. In Methanogenesis: Ecology, Physiology, Biochemistry & Genetics.; FERRY, J. G., Ed.; Springer US: Boston, MA, 1993. [Google Scholar]
- Buss, W. Pyrolysis Solves the Issue of Organic Contaminants in Sewage Sludge while Retaining Carbon. Making the Case for Sewage Sludge Treatment via Pyrolysis. ACS Sustainable Chem. Eng 2021, 9(30), 10048–10053. [Google Scholar] [CrossRef]
- Chellapandi, P.; Saranya, S. Biogas starter from genome-scale data for methanogenic bioprocessing of protein waste. Systems Microbiology and Biomanufacturing 2024, 4(2), 542–563. [Google Scholar] [CrossRef]
- Chen, C.; Zhang, Z.; Xu, P.; Hu, H.; Tang, H. Anaerobic biodegradation of polycyclic aromatic hydrocarbons. Environmental Research 2023, 223, 115472. [Google Scholar] [CrossRef] [PubMed]
- Chen, S.; Cheng, H.; Wyckoff, K. N.; He, Q. Linkages of Firmicutes and Bacteroidetes populations to methanogenic process performance. Journal of Industrial Microbiology and Biotechnology 2016, 43(6), 771–781. [Google Scholar] [CrossRef]
- Chen, S.; He, J.; Wang, H.; Dong, B.; Li, N.; Dai, X. Microbial responses and metabolic pathways reveal the recovery mechanism of an anaerobic digestion system subjected to progressive inhibition by ammonia. Chemical Engineering Journal 2018, 350, 312–323. [Google Scholar] [CrossRef]
- Christensen, N.; Batstone, D. J.; He, Z.; Angelidaki, I.; Schmidt, J. E. Removal of polycyclic aromatic hydrocarbons (PAHs) from sewage sludge by anaerobic degradation [Article]. Water Science and Technology 2004, 50(9), 237–244. [Google Scholar] [CrossRef] [PubMed]
- Clarke, B. O.; Smith, S. R. Review of ‘emerging’ organic contaminants in biosolids and assessment of international research priorities for the agricultural use of biosolids. Environment International 2011, 37(1), 226–247. [Google Scholar] [CrossRef]
- Csutoras, B.; Miskolczi, N. Thermo-catalytic pyrolysis of sewage sludge and techno-economic analysis: The effect of synthetic zeolites and natural sourced catalysts. Bioresource Technology 2024, 400, 130676. [Google Scholar] [CrossRef]
- Czatzkowska, M.; Rolbiecki, D.; Korzeniewska, E.; Harnisz, M. Heavy Metal and Antimicrobial Residue Levels in Various Types of Digestate from Biogas Plants—A Review. Sustainability 2025, 17(2), 416. [Google Scholar] [CrossRef]
- De Vrieze, J.; Hennebel, T.; Boon, N.; Verstraete, W. Methanosarcina: The rediscovered methanogen for heavy duty biomethanation. Bioresource Technology 2012, 112, 1–9. [Google Scholar] [CrossRef]
- Dueholm, M. K. D.; Andersen, K. S.; Korntved, A.-K. C.; Rudkjøbing, V.; Alves, M.; Bajón-Fernández, Y.; Batstone, D.; Butler, C.; Cruz, M. C.; Davidsson, Å.; Erijman, L.; Holliger, C.; Koch, K.; Kreuzinger, N.; Lee, C.; Lyberatos, G.; Mutnuri, S.; O’Flaherty, V.; Oleskowicz-Popiel, P.; Pokorna, D.; Rajal, V.; Recktenwald, M.; Rodríguez, J.; Saikaly, P. E.; Tooker, N.; Vierheilig, J.; De Vrieze, J.; Wurzbacher, C.; Nielsen, P. H. MiDAS 5: Global diversity of bacteria and archaea in anaerobic digesters. Nature Communications 2024, 15(1), 5361. [Google Scholar] [CrossRef]
- EPA Method 1684. Method 1684: Total, fixed, and volatile solids in water, solids, and biosolids; US Environmental Protection Agency: Washington, 2001. [Google Scholar]
- Estoppey, N.; Castro, G.; Slinde, G. A.; Hansen, C. B.; Løseth, M. E.; Krahn, K. M.; Demmer, V.; Svenni, J.; Tran, T.-V.-A. T.; Asimakopoulos, A. G.; Arp, H. P. H.; Cornelissen, G. Exposure assessment of plastics, phthalate plasticizers and their transformation products in diverse bio-based fertilizers. Science of The Total Environment 2024, 918, 170501. [Google Scholar] [CrossRef]
- Flatabø, G. Ø.; Cornelissen, G.; Carlsson, P.; Nilsen, P. J.; Tapasvi, D.; Bergland, W. H.; Sørmo, E. Industrially relevant pyrolysis of diverse contaminated organic wastes: Gas compositions and emissions to air. Journal of Cleaner Production 2023, 423, 138777. [Google Scholar] [CrossRef]
- Flatabø, G. Ø.; Indrebø, T. S.; Svennevik, O. K.; Ahmed, B.; Nilsen, P. J.; Bergland, W. H. Anaerobic Co-Digestion of Sewage Sludge and its Pyrolysis Condensate: Implications for Methane Production and Filtrate Water Quality. Preprint: to be published in Heliyon;(Accepted). 2024. [CrossRef]
- Fu, S.; Angelidaki, I.; Zhang, Y. In situ Biogas Upgrading by CO2-to-CH4 Bioconversion. Trends in Biotechnology 2021, 39(4), 336–347. [Google Scholar] [CrossRef]
- Ghimire, N.; Bakke, R.; Bergland, W. H. Liquefaction of lignocellulosic biomass for methane production: A review. Bioresource Technology 2021, 332, 125068. [Google Scholar] [CrossRef] [PubMed]
- Golovko, O.; Ahrens, L.; Schelin, J.; Sörengård, M.; Bergstrand, K.-J.; Asp, H.; Hultberg, M.; Wiberg, K. Organic micropollutants, heavy metals and pathogens in anaerobic digestate based on food waste. Journal of Environmental Management 2022, 313, 114997. [Google Scholar] [CrossRef] [PubMed]
- Gonzalez-Salgado, I.; Cavaillé, L.; Dubos, S.; Mengelle, E.; Kim, C.; Bounouba, M.; Paul, E.; Pommier, S.; Bessiere, Y. Combining thermophilic aerobic reactor (TAR) with mesophilic anaerobic digestion (MAD) improves the degradation of pharmaceutical compounds. Water Research 2020, 182, 116033. [Google Scholar] [CrossRef]
- Hamalainen, A.; Kokko, M.; Chatterjee, P.; Kinnunen, V.; Rintala, J. The effects of digestate pyrolysis liquid on the thermophilic anaerobic digestion of sewage sludge-Perspective for a centralized biogas plant using thermal hydrolysis pretreatment. Waste Management 2022, 147, 73–82. [Google Scholar] [CrossRef]
- Han, D.; Lee, C.-Y.; Chang, S. W.; Kim, D.-J. Enhanced methane production and wastewater sludge stabilization of a continuous full scale thermal pretreatment and thermophilic anaerobic digestion. Bioresource Technology 2017, 245, 1162–1167. [Google Scholar] [CrossRef]
- Heker, I.; Samak Nadia, A.; Kong, Y.; Meckenstock Rainer, U. Anaerobic degradation of polycyclic aromatic hydrocarbons. Applied and Environmental Microbiology 2025, 91(4), e02268-24. [Google Scholar] [CrossRef]
- Hossain, M. Z.; Bahar, M. M.; Sarkar, B.; Donne, S. W.; Ok, Y. S.; Palansooriya, K. N.; Kirkham, M. B.; Chowdhury, S.; Bolan, N. Biochar and its importance on nutrient dynamics in soil and plant. Biochar 2020, 2(4), 379–420. [Google Scholar] [CrossRef]
- Hubner, T.; Mumme, J. Integration of pyrolysis and anaerobic digestion - Use of aqueous liquor from digestate pyrolysis for biogas production. Bioresource Technology 2015, 183, 86–92. [Google Scholar] [CrossRef]
- Hušek, M.; Moško, J.; Pohořelý, M. Sewage sludge treatment methods and P-recovery possibilities: Current state-of-the-art. J Environ Manage 2022, 315, 115090–115090. [Google Scholar] [CrossRef]
- Indrebø, T.; Flatabø, G. Ø.; Bergland, W. H.; Arachchige, G. L. S. Anaerobic digestion of biosolid pyrolysis liquid and hydrolyzed sludge-simulation with extended ADM1 model. Scandinavian Simulation Society 2025, 249–256. [Google Scholar] [CrossRef]
- Indrebø, T. L.; Babiker Ahmed, B. A.; Flatabø, G. Ø.; Bergland, W. H.; Samarakoon Arachchige, G.; Ghimire, N. Evaluating aqueous pyrolysis liquid as co-substrate in anaerobic digestion of hydrolyzed sewage sludge. Bioresource Technology 2026a, 133928. [Google Scholar] [CrossRef]
- Indrebø, T. L.; Flatabø, G. Ø.; Stoknes, K.; Arachchige, G. S. Comparative environmental assessment of integrated anaerobic digestion and pyrolysis systems for sewage sludge treatment: impact assessment using ReCiPe and USEtox methods. Bioresource Technology 2026b, 440, 133431. [Google Scholar] [CrossRef] [PubMed]
- ISO 15705 2002; Water quality — Determination of the chemical oxygen demand index (ST-COD) — Small-scale sealed-tube method.
- Jiang, M.; Qiao, W.; Wang, Y.; Zou, T.; Lin, M.; Dong, R. Balancing acidogenesis and methanogenesis metabolism in thermophilic anaerobic digestion of food waste under a high loading rate. Science of The Total Environment 2022, 824, 153867. [Google Scholar] [CrossRef] [PubMed]
- Jiang, Y.; McAdam, E.; Zhang, Y.; Heaven, S.; Banks, C.; Longhurst, P. Ammonia inhibition and toxicity in anaerobic digestion: A critical review. Journal of Water Process Engineering 2019, 32, 100899. [Google Scholar] [CrossRef]
- Lamolinara, B.; Pérez-Martínez, A.; Guardado-Yordi, E.; Guillén Fiallos, C.; Diéguez-Santana, K.; Ruiz-Mercado, G. J. Anaerobic digestate management, environmental impacts, and techno-economic challenges. Waste Management 2022, 140, 14–30. [Google Scholar] [CrossRef]
- Lee, E.; Min, K. J.; Park, K. Y. Changes in anaerobic digestion performance and microbial community by increasing SRT through sludge recycling in food waste leachate treatment. Scientific Reports 2025, 15(1), 19845. [Google Scholar] [CrossRef]
- Leino, O.; Äystö, L.; Fjäder, P.; Perkola, N.; Lehtoranta, S. Contaminants of environmental concern in sewage sludge in the Nordic countries. Environmental Pollution 2025, 381, 126604. [Google Scholar] [CrossRef]
- Li, H.; Feng, K. Life cycle assessment of the environmental impacts and energy efficiency of an integration of sludge anaerobic digestion and pyrolysis. Journal of Cleaner Production 2018, 195, 476–485. [Google Scholar] [CrossRef]
- Li, X.; Wang, Z.; He, Y.; Wang, Y.; Wang, S.; Zheng, Z.; Wang, S.; Xu, J.; Cai, Y.; Ying, H. A Comprehensive Review of the Strategies to Improve Anaerobic Digestion: Their Mechanism and Digestion Performance. Methane 2024, 3(2), 227–256. [Google Scholar] [CrossRef]
- Li, Y.; Campos, L. C.; Hu, Y. The role of sludge microstructure in enhancing anaerobic digestion: a comprehensive review combining bibliometric and experimental insights. In Environment, Development and Sustainability; 2025. [Google Scholar] [CrossRef]
- Liang, D.; Li, C.; Chen, H.; Sørmo, E.; Cornelissen, G.; Gao, Y.; Reguyal, F.; Sarmah, A.; Ippolito, J.; Kammann, C.; Li, F.; Sailaukhanuly, Y.; Cai, H.; Hu, Y.; Wang, M.; Li, X.; Cui, X.; Robinson, B.; Khan, E.; Rinklebe, J.; Ye, T.; Wu, F.; Zhang, X.; Wang, H. A critical review of biochar for the remediation of PFAS-contaminated soil and water. Science of The Total Environment 2024, 951, 174962. [Google Scholar] [CrossRef] [PubMed]
- Liu, J.; Charbonnet, J. A. A Critical Review of PFAS Analysis, Occurrence, and Fate in Wastewater Treatment Plants. Environmental Science & Technology 2025, 59(48), 25492–25517. [Google Scholar] [CrossRef] [PubMed]
- Mati, A.; Buffi, M.; Dell’Orco, S.; Lombardi, G.; Ruiz Ramiro, P. M.; Kersten, S. R. A.; Chiaramonti, D. Fractional Condensation of Fast Pyrolysis Bio-Oil to Improve Biocrude Quality towards Alternative Fuels Production. Applied Sciences 2022, 12(10), 4822. [Google Scholar] [CrossRef]
- McKee, L. S.; La Rosa, S. L.; Westereng, B.; Eijsink, V. G.; Pope, P. B.; Larsbrink, J. Polysaccharide degradation by the Bacteroidetes: mechanisms and nomenclature. Environ Microbiol Rep 2021, 13(5), 559–581. [Google Scholar] [CrossRef]
- Meckenstock, R. U.; Safinowski, M.; Griebler, C. Anaerobic degradation of polycyclic aromatic hydrocarbons. In FEMS Microbiology Ecology; 2004; pp. 27–36. [Google Scholar]
- Melo, A.; Quintelas, C.; Ferreira, E. C.; Mesquita, D. P. The Role of Extracellular Polymeric Substances in Micropollutant Removal [Review]. Frontiers in Chemical Engineering 2022, 4–2022. [Google Scholar] [CrossRef]
- Mohamed, B. A.; Li, L. Y. Biofuel production by co-pyrolysis of sewage sludge and other materials: a review. Environmental chemistry letters 2023, 21(1), 153–182. [Google Scholar] [CrossRef]
- Moško, J.; Pohořelý, M.; Cajthaml, T.; Jeremiáš, M.; Robles-Aguilar, A. A.; Skoblia, S.; Beňo, Z.; Innemanová, P.; Linhartová, L.; Michalíková, K.; Meers, E. Effect of pyrolysis temperature on removal of organic pollutants present in anaerobically stabilized sewage sludge. Chemosphere 2021, 265, 129082. [Google Scholar] [CrossRef]
- Moussa, O.; Makkawi, Y.; Masek, O.; Mohamed, B. Pyrolysis of anaerobically digested and undigested sewage sludge: Comparative assessment of product quality, emissions, and carbon sequestration. Energy Conversion and Management: X 2025, 27, 101213. [Google Scholar] [CrossRef]
- Okopi, S. I.; Wang, J.; Liang, W.; Kong, W.; Hu, Y.; Cui, J.; Guo, X.; Zhao, W.; Che, L.; Gu, Z.; Xu, F. Experimental study and techno-economic analysis of co-processing system for treatment of food waste with various impurities. Bioresource Technology 2024a, 394, 130020. [Google Scholar] [CrossRef] [PubMed]
- Okopi, S. I.; Zeng, J. F.; Fan, X. T.; Lu, J. X.; Cui, J. H.; Hu, Y.; Wang, J. Y.; Chen, J. X.; Djandja, O. S.; Ma, Y. Q.; Che, L.; Gu, Z. L.; Xu, F. Q. Environmental sustainability assessment of a new food waste anaerobic digestion and pyrolysis hybridization system. Waste Management 2024b, 179, 130–143. [Google Scholar] [CrossRef] [PubMed]
- Oliveira, H. R.; Anacleto, T. M.; Abreu, F.; Enrich-Prast, A. New insights into the factors influencing methanogenic pathways in anaerobic digesters. Anaerobe 2025, 91, 102925. [Google Scholar] [CrossRef]
- Paramonov, A.; Ablieieva, I.; Vaskina, I.; Lysytska, A.; Makarenko, N. The efficiency of organic pollutants degradation in the process of anaerobic digestion of feedstocks with different origin. Ecological Safety and Balanced Use of Resources 2024, 15(1), 24. [Google Scholar] [CrossRef]
- Petriglieri, F.; Nierychlo, M.; Nielsen, P. H.; McIlroy, S. J. In situ visualisation of the abundant Chloroflexi populations in full-scale anaerobic digesters and the fate of immigrating species. PLOS ONE 2018, 13(11), e0206255. [Google Scholar] [CrossRef]
- Poirier, S.; Bize, A.; Bureau, C.; Bouchez, T.; Chapleur, O. Community shifts within anaerobic digestion microbiota facing phenol inhibition: Towards early warning microbial indicators? Water Research 2016a, 100, 296–305. [Google Scholar] [CrossRef]
- Poirier, S.; Desmond-Le Quéméner, E.; Madigou, C.; Bouchez, T.; Chapleur, O. Anaerobic digestion of biowaste under extreme ammonia concentration: Identification of key microbial phylotypes. Bioresource Technology 2016b, 207, 92–101. [Google Scholar] [CrossRef]
- Prem, E. M.; Stres, B.; Illmer, P.; Wagner, A. O. Microbial community dynamics in mesophilic and thermophilic batch reactors under methanogenic, phenyl acid-forming conditions. Biotechnology for Biofuels 2020, 13(1), 81. [Google Scholar] [CrossRef] [PubMed]
- Ruaud, A.; Esquivel-Elizondo, S.; de la Cuesta-Zuluaga, J.; Waters, J. L.; Angenent, L. T.; Youngblut, N. D.; Ley, R. E. Syntrophy via Interspecies H(2) Transfer between Christensenella and Methanobrevibacter Underlies Their Global Cooccurrence in the Human Gut. mBio 2020, 11(1). [Google Scholar] [CrossRef] [PubMed]
- Schlederer, F.; Martín-Hernández, E.; Vaneeckhaute, C. On safety of sewage biosolids valorisation: Distribution of PFAS, PAHs, PCDD/Fs, and heavy metals in low-temperature pyrolysis end-products for agricultural and energetic applications. Chemical Engineering Journal 2024, 498, 155534. [Google Scholar] [CrossRef]
- Seyedi, S.; Venkiteshwaran, K.; Benn, N.; Zitomer, D. Inhibition during Anaerobic Co-Digestion of Aqueous Pyrolysis Liquid from Wastewater Solids and Synthetic Primary Sludge. Sustainability 2020, 12(8), Article 3441. [Google Scholar] [CrossRef]
- Seyedi, S.; Venkiteshwaran, K.; Zitomer, D. Toxicity of Various Pyrolysis Liquids From Biosolids on Methane Production Yield. Frontiers in Energy Research 2019, 7, Article 5. [Google Scholar] [CrossRef]
- Seyedi, S.; Venkiteshwaran, K.; Zitomer, D. Current status of biomethane production using aqueous liquid from pyrolysis and hydrothermal liquefaction of sewage sludge and similar biomass. Reviews in Environmental Science and Bio-Technology 2021, 20(1), 237–255. [Google Scholar] [CrossRef]
- Seyedi, S.; Venkiteshwaran, K.; Zitomer, D. Improved methanogenesis from aqueous pyrolysis liquid (APL) by inoculum selection and pre-ozonation [10.1039/D3EW00768E]. Environmental Science: Water Research & Technology 2024, 10(8), 1827–1839. [Google Scholar] [CrossRef]
- Shah, Z.; Veses, R. C.; Brum, J.; Klunk, M. A.; Rocha, L. A. O.; Missaggia, A. B.; Oliveira, A. P. d.; Caetano, N. R. Sewage Sludge Bio-Oil Development and Characterization. Inventions 2020, 5(3), 36. [Google Scholar] [CrossRef]
- Shi, Y.; Xue, H.; Yao, Y.; Jing, C.; Liu, R.; Niu, Q.; Lu, H. Overcoming methanogenesis barrier to acid inhibition and enhancing PAHs removal by granular biochar during anaerobic digestion. Chemical Engineering Journal 2023, 477, 147229. [Google Scholar] [CrossRef]
- Silva, A. R.; Duarte, M. S.; Alves, M. M.; Pereira, L. Bioremediation of Perfluoroalkyl Substances (PFAS) by Anaerobic Digestion: Effect of PFAS on Different Trophic Groups and Methane Production Accelerated by Carbon Materials. Molecules 2022, 27(6), 1895. [Google Scholar] [CrossRef]
- Sivalingam, V.; Ahmadi, V.; Babafemi, O.; Dinamarca, C. Integrating Syngas Fermentation into a Single-Cell Microbial Electrosynthesis (MES) Reactor. Catalysts 2021, 11(1), 40. [Google Scholar] [CrossRef]
- Sørmo, E.; Krahn, K. M.; Flatabø, G. Ø.; Hartnik, T.; Arp, H. P. H.; Cornelissen, G. Distribution of PAHs, PCBs, and PCDD/Fs in products from full-scale relevant pyrolysis of diverse contaminated organic waste. Journal of Hazardous Materials 2024, 461, 132546. [Google Scholar] [CrossRef] [PubMed]
- Sørmo, E.; Silvani, L.; Bjerkli, N.; Hagemann, N.; Zimmerman, A. R.; Hale, S. E.; Hansen, C. B.; Hartnik, T.; Cornelissen, G. Stabilization of PFAS-contaminated soil with activated biochar. Science of The Total Environment 2021, 763, 144034. [Google Scholar] [CrossRef]
- Tayibi, S.; Monlau, F.; Bargaz, A.; Jimenez, R.; Barakat, A. Synergy of anaerobic digestion and pyrolysis processes for sustainable waste management: A critical review and future perspectives. Renewable & Sustainable Energy Reviews 2021, 152, 111603. [Google Scholar] [CrossRef]
- Torri, C.; Fabbri, D. Biochar enables anaerobic digestion of aqueous phase from intermediate pyrolysis of biomass. Bioresour Technol 2014, 172, 335–341. [Google Scholar] [CrossRef]
- Uludag-Demirer, S.; Xu, M.; Marks, A.; Liu, Y.; Saffron, C.; Liao, W. Influence of biochar on microbial communities and anaerobic digestion of aqueous pyrolysis liquid (APL). Biomass and Bioenergy 2025, 198, 107891. [Google Scholar] [CrossRef]
- Vanwonterghem, I.; Jensen, P. D.; Dennis, P. G.; Hugenholtz, P.; Rabaey, K.; Tyson, G. W. Deterministic processes guide long-term synchronised population dynamics in replicate anaerobic digesters. The ISME Journal 2014, 8(10), 2015–2028. [Google Scholar] [CrossRef]
- Walker, J.; Knight, L.; Stein; L. (1994). A Plain English Guide to the EPA Part 503 Biosolids Rule. A Plain English Guide to the EPA Part 503 Biosolids Rule; United States Enviormental Protection Agency (EPA): USA, 1994. [Google Scholar]
- Wang, Z.; Wang, S.; Hu, Y.; Du, B.; Meng, J.; Wu, G.; Liu, H.; Zhan, X. Distinguishing responses of acetoclastic and hydrogenotrophic methanogens to ammonia stress in mesophilic mixed cultures. Water Research 2022, 224, 119029. [Google Scholar] [CrossRef] [PubMed]
- Wen, C. N.; Moreira, C. M.; Rehmann, L.; Berruti, F. Feasibility of anaerobic digestion as a treatment for the aqueous pyrolysis condensate (APC) of birch bark. Bioresource Technology 2020, 307, 123199. [Google Scholar] [CrossRef]
- Xue, Y.; Liu, H.; Chen, S.; Dichtl, N.; Dai, X.; Li, N. Effects of thermal hydrolysis on organic matter solubilization and anaerobic digestion of high solid sludge. Chemical Engineering Journal 2015, 264, 174–180. [Google Scholar] [CrossRef]
- Yang, J.; Zhang, J.; Du, X.; Gao, T.; Cheng, Z.; Fu, W.; Wang, S. Ammonia inhibition in anaerobic digestion of organic waste: a review. International Journal of Environmental Science and Technology 2025, 22(5), 3927–3942. [Google Scholar] [CrossRef]
- Yang, Y.; Heaven, S.; Venetsaneas, N.; Banks, C. J.; Bridgwater, A. V. Slow pyrolysis of organic fraction of municipal solid waste (OFMSW): Characterisation of products and screening of the aqueous liquid product for anaerobic digestion. Applied Energy 2018a, 213, 158–168. [Google Scholar] [CrossRef]
- Yang, Y.; Wang, J.; Chong, K.; Bridgwater, A. V. A techno-economic analysis of energy recovery from organic fraction of municipal solid waste (MSW) by an integrated intermediate pyrolysis and combined heat and power (CHP) plant. Energy Conversion and Management 2018b, 174, 406–416. [Google Scholar] [CrossRef]
- Ye, D.; Wang, Z.; Qian, X.; Ouyang, K.; Wu, D.; Tang, F.; Hrynsphan, D.; Savitskaya, T.; Chen, J. Biodegradation of per- and polyfluoroalkyl substances: microbes, enzymes and their interactions. Reviews in Environmental Science and Bio/Technology 2025, 24(1), 43–62. [Google Scholar] [CrossRef]
- Yu, X.; Zhang, C.; Qiu, L.; Yao, Y.; Sun, G.; Guo, X. Anaerobic digestion of swine manure using aqueous pyrolysis liquid as an additive. Renewable Energy 2020, 147, 2484–2493. [Google Scholar] [CrossRef]
- Zero Waste Associates. Road to zero waste plan. 2013. Available online: https://www.fcgov.com/recycling/pdf/RoadtoZeroWasteReport_FINAL.pdf.
- Zhang, R.; Kim, G.; Oshita, K.; Takaoka, M. Biogas valorization of the aqueous phase of pyrolysis liquid via co-digestion with sewage sludge towards sustainable circular-integrated treatment system. Bioresource Technology 2025, 438, 133234. [Google Scholar] [CrossRef] [PubMed]
- Zhang, R.; Oshita, K.; Takaoka, M. Use of aqueous liquor from digested sludge pyrolysis for biogas production: characterization, toxicity assessment, and rate-limiting step determination. Bioresource Technology 2024a, 413, 131434. [Google Scholar] [CrossRef] [PubMed]
- Zhang, X.; Wang, Y.; Jiao, P.; Zhang, M.; Deng, Y.; Jiang, C.; Liu, X.-W.; Lou, L.; Li, Y.; Zhang, X.-X.; Ma, L. Microbiome-functionality in anaerobic digesters: A critical review. Water Research 2024b, 249, 120891. [Google Scholar] [CrossRef] [PubMed]
- Zhou, H. Q.; Brown, R. C.; Wen, Z. Y. Anaerobic digestion of aqueous phase from pyrolysis of biomass: Reducing toxicity and improving microbial tolerance. Bioresource Technology 2019, 292, 121976. [Google Scholar] [CrossRef] [PubMed]
Figure 1.
Schematic of the laboratory setup, including continuous mixing of filtered hydrolyzed sludge and APL, which is stored in a refrigerator, feed pump, vertical reactor with a microbial sampling port, recirculation system, and solid/liquid separator, a gas/liquid separator, effluent tank, and CO2-trap with methane volume measurer, which is logged.
Figure 1.
Schematic of the laboratory setup, including continuous mixing of filtered hydrolyzed sludge and APL, which is stored in a refrigerator, feed pump, vertical reactor with a microbial sampling port, recirculation system, and solid/liquid separator, a gas/liquid separator, effluent tank, and CO2-trap with methane volume measurer, which is logged.
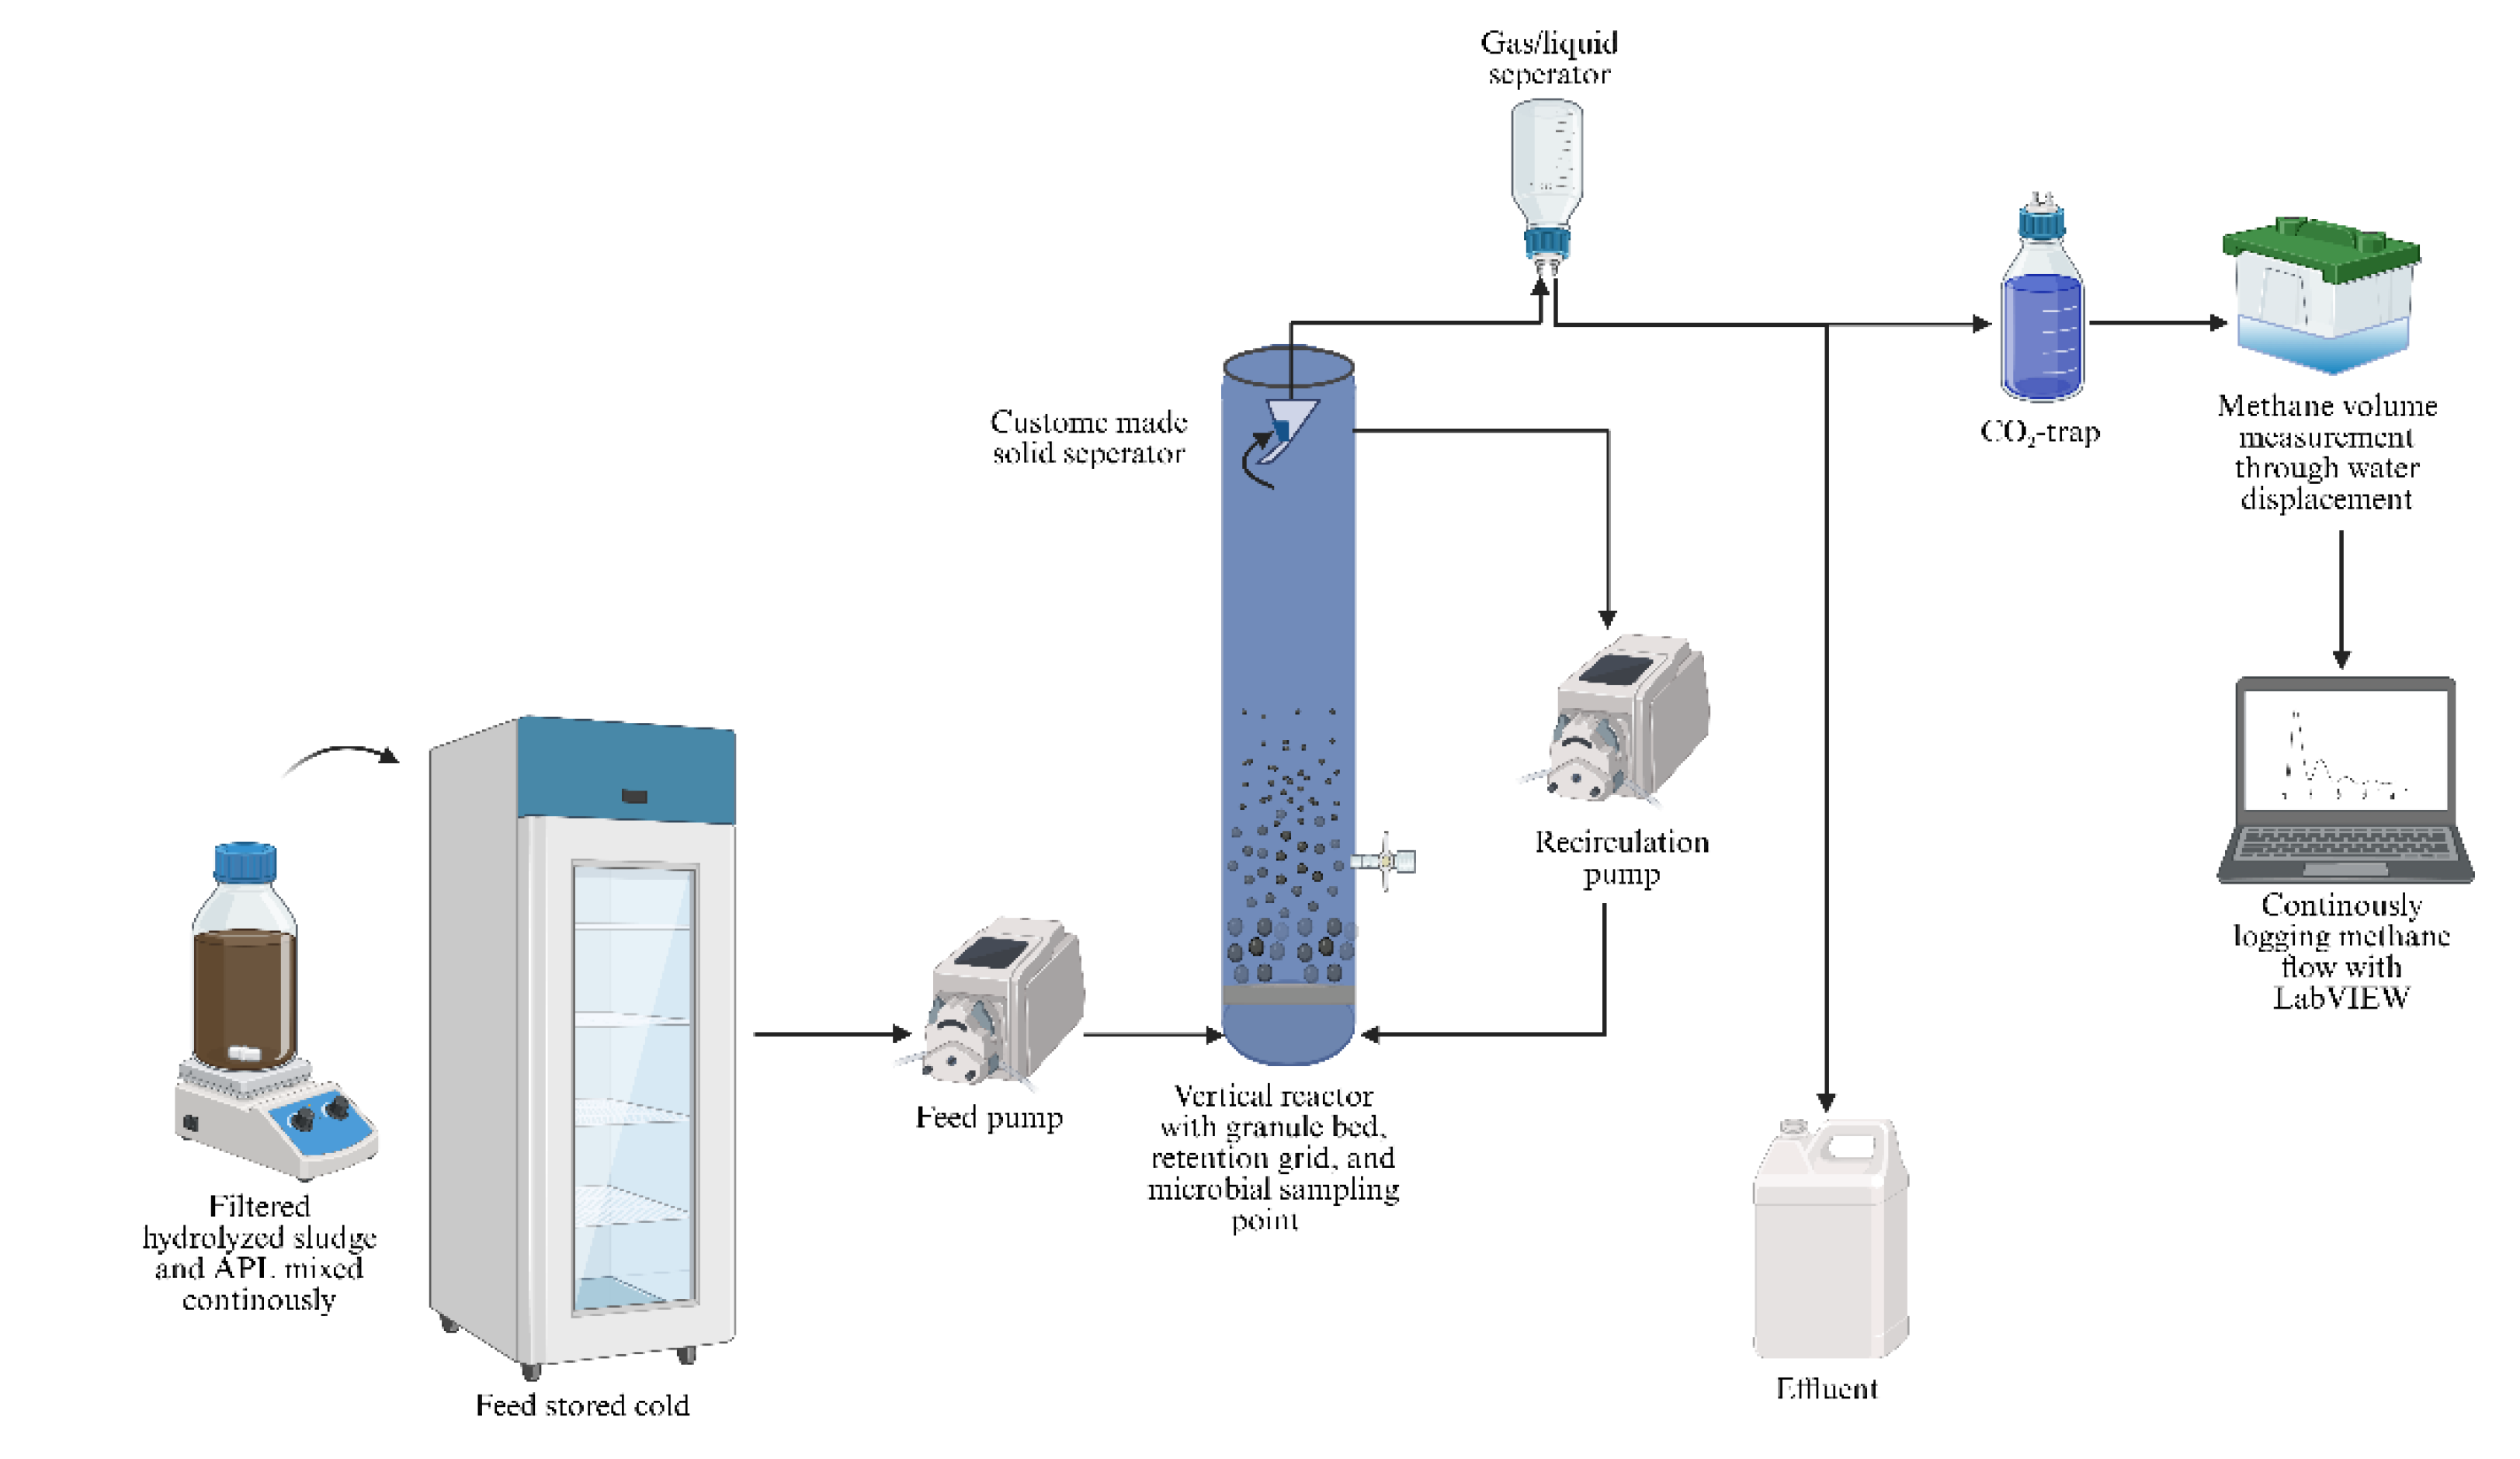
Figure 2.
Weekly methane yield (grey), weekly tCOD reduction (green), and weekly sCOD reduction (black) for a) control reactor, which is only fed filtrate from hydrolyzed sludge, and b) APL-reactor fed filtrate and aqueous pyrolysis liquid (APL). APL loadings (red) are shown in b). b) is divided into phases in accordance with the APL loadings.
Figure 2.
Weekly methane yield (grey), weekly tCOD reduction (green), and weekly sCOD reduction (black) for a) control reactor, which is only fed filtrate from hydrolyzed sludge, and b) APL-reactor fed filtrate and aqueous pyrolysis liquid (APL). APL loadings (red) are shown in b). b) is divided into phases in accordance with the APL loadings.
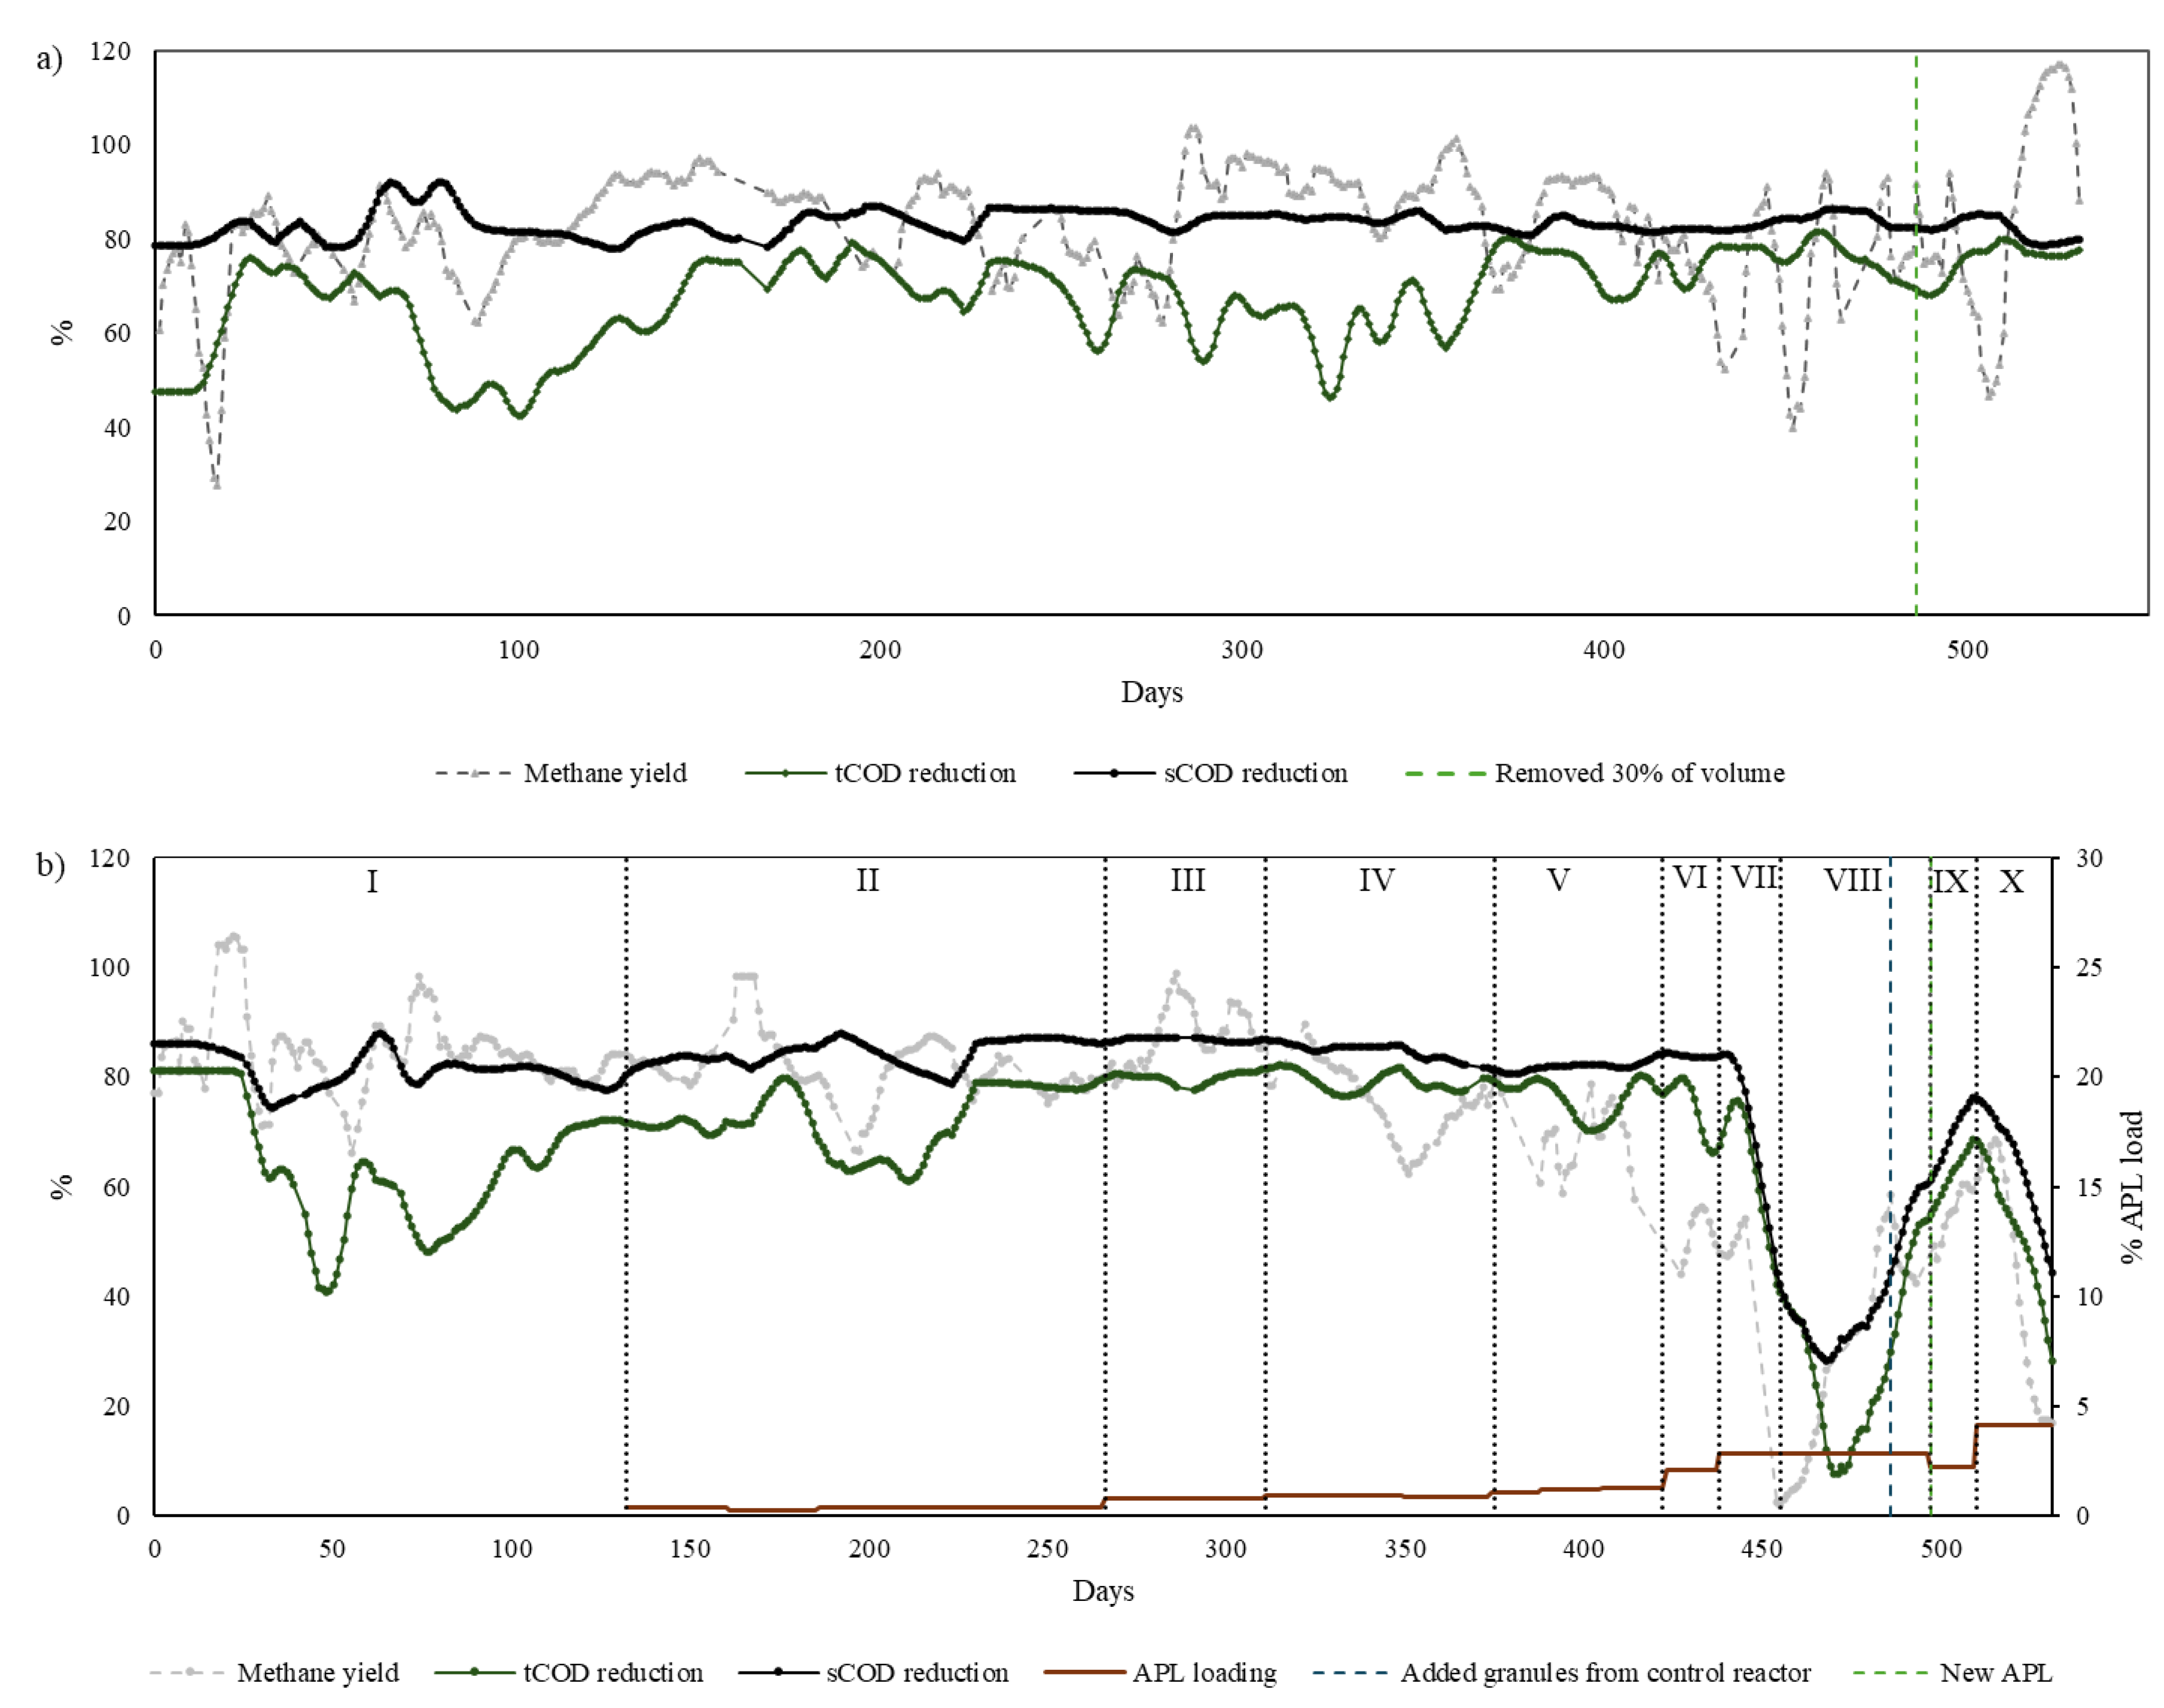

Table 1.
Concentrations of the sum of 16 PAHs and 17 PFAS in HS-liquid, APL, control reactor effluent, and APL-reactor effluent across selected sampling days (µg/L). Values in parentheses indicate estimated concentrations below quantification.
Table 1.
Concentrations of the sum of 16 PAHs and 17 PFAS in HS-liquid, APL, control reactor effluent, and APL-reactor effluent across selected sampling days (µg/L). Values in parentheses indicate estimated concentrations below quantification.
| Sum of 16 PAHs | |||
| Day 424a | Day 508b | Day 528b | |
| HS-liquid (µg/L) | 0.14 (<0.46) | ||
| APL (µg/L) | 1609.8 | 627.6 | 980.8 |
| Control reactor (µg/L) | <0.095 | ||
| APL-reactor effluent (µg/L) | 34.9 (<39.0) | 15.5 (<17.0) | 58 (65.9) |
| Sum of 17 PFAS | |||
| HS-liquid (µg/L) | 0 (<1.7) | ||
| APL (non-fractional) (µg/L) | 2.3 (<5.5) | ||
| Control reactor (µg/L) | 0 (<1.7) | ||
| APL-reactor (µg/L) | 0 (<1.9) | 0 (<1.9) | 0 (<1.9) |
a Using APL 1: From gravitational condensation.b Using APL 2: fractional condensation.
Disclaimer/Publisher’s Note: The statements, opinions and data contained in all publications are solely those of the individual author(s) and contributor(s) and not of MDPI and/or the editor(s). MDPI and/or the editor(s) disclaim responsibility for any injury to people or property resulting from any ideas, methods, instructions or products referred to in the content. |
© 2026 by the authors. Licensee MDPI, Basel, Switzerland. This article is an open access article distributed under the terms and conditions of the Creative Commons Attribution (CC BY) license (http://creativecommons.org/licenses/by/4.0/).
Copyright: This open access article is published under a Creative Commons CC BY 4.0 license, which permit the free download, distribution, and reuse, provided that the author and preprint are cited in any reuse.