Submitted:
06 March 2026
Posted:
06 March 2026
Read the latest preprint version here
Abstract
Antimicrobial resistance (AMR) is a silently escalating global crisis, presenting a specific challenge for the One Health approach. Landscapes can serve as reservoirs of AMR, while synurban wildlife may act as vectors of bidirectional exchange. However, these species can also be utilised as sentinels of landscape AMR load. Herbivorous avian bioindicators, such as the Common Wood Pigeon (Columba palumbus), continuously sample the landscape during foraging and drinking, providing unbiased data on the state of AMR. This study aimed to investigate the potential of this species for assessing the impact of landscape diversity on bacterial communities and their AMR patterns. Toward this objective, two landscape units of 4-km-diameter located at an upstream and a downstream section of a river, relative to a provincial town, were compared using 16 cloacal samples per site. Heterotrophic plate count techniques resulted in 60 isolates, of which 48 were identified, and 35 were tested for AMR using the VITEK 2 Compact system. Rényi diversity profiles of landscape compositions, bacterial communities, and AMR patterns revealed that higher landscape diversity was associated with lower bacterial but higher AMR pattern diversity. Additionally, the structure of more diverse bacterial communities shifted toward Gram-negative taxa. These findings support the hypothesis that culture-based methods using Common Wood Pigeons, complemented by Rényi diversity analysis and the determination of Gram-positive/Gram-negative ratios, provide valuable data on landscape health, even with small sample sizes.
Keywords:
Common Wood Pigeon
; Rényi entropy
; antimicrobial resistance
; Gram-positive/Gram-negative ratio
; landscape
; sentinel
1. Introduction
The One Health approach is predicated on the recognition that pathogens circulate dynamically across human, animal, and environmental domains [1,2,3]. While this phenomenon is conspicuous in the case of emerging infectious diseases, the dissemination of antimicrobial resistance (AMR) is far more insidious. Due to its stealthy progression across these interfaces, AMR is widely characterised as a 'silent pandemic' [2].
Evidence suggests that wildlife [2,4], surface water (including groundwater), and soil [3] can act as reservoirs for AMR bacteria and antimicrobial resistance genes (ARGs). The circulation of water throughout the ecosystem facilitates the movement of these bacteria and genes between the domains of health. Furthermore, AMR transmission via rivers and stormwater runoff is a well-documented phenomenon, highlighting critical environmental exposure pathways [3,5].
As the AMR crisis subtly escalates, adopting a holistic surveillance strategy, integrating all ecosystem components, is essential for estimating the situation's severity [3]. Avian species are frequently utilised as bioindicators of environmental AMR load because their active movement allows them to sample specific areas, providing a comprehensive and balanced representation of the landscape's microbial state [1,6]. In contrast to small mammal populations, which provide point-source data [4], birds integrate landscape variations, offering a broader cross-sectional snapshot [6]. Birds with limited home ranges are extensively utilised as bioindicators of small-scale areas. For Feral Pigeons (Columba livia), the typical foraging range has a radius of approximately 2 km [7], whereas for Common Wood Pigeons (Columba palumbus), this distance varies with food availability (1-5.7 km). In mosaic landscapes with abundant forage sources, their flight range can be as small as <1 km [8,9].
Species with scavenger or predatory diets are considered as bioaccumulators of pathogens; therefore, they are employed as sentinels to detect even rare bacteria or resistant genes in the ecosystem. However, the use of accumulating organisms introduces a selection bias, which means that biological accumulation disproportionately enhances the effect of a hot-spot within the sampled landscape [2,10]. Conversely, herbivorous animals can serve as proxies for background environmental health, providing a baseline reflection of the current ambient AMR load [2]. Unlike feral pigeons [11], gulls (Laridae family) and storks (Ciconia spp.) [12], granivorous and frugivorous birds typically avoid feeding at landfills. Consequently, their exposure to AMR sources is directly proportional to the frequency of these sources within the investigated landscape [2,13].
The Common Wood Pigeon has undergone a significant population expansion across Europe, with the breeding population nearly doubling since the 1990s, now estimated at 25.5–36.5 million pairs [14]. This demographic explosion is a complex process driven by shifting agricultural practices and the species' remarkable adaptive capacity to diverse environments[15,16]. From an epidemiological perspective, climate change is a critical driver; earlier spring arrivals and extended breeding seasons [17] have been accompanied by significant shifts in migratory patterns. The species' range has expanded northward, and an increasing number of individuals now overwinter in regions like the Carpathian Basin, where this was previously uncommon [18].
The synurbanisation of the species has been ongoing in Western Europe since the 19th century and has intensified in Central Europe since the 1980s [19]. Today, population densities in urban and suburban areas often significantly exceed those of rural populations [20]. This ecological shift carries profound environmental health implications: the presence of Wood Pigeons in human-dominated landscapes leads to the accumulation of organic matter (faecal deposition), which directly alters the microbial composition of local ecosystems [21]. As Wood Pigeons can serve as reservoirs for antimicrobial-resistant (AMR) bacteria [22], their role as biological vectors has gained prominence due to the increased human-wildlife contact.
In accordance with the Birds Directive, the Common Wood Pigeon is a huntable species across Europe. Due to its significant impact on crop damage, hunting is widely employed as a population control measure in most Member States [23,24]. Hunter-harvested individuals are suitable for sample collection for bacteriological investigation. Furthermore, the species' large populations facilitate large-scale, minimally invasive swab sampling of live birds at ringing stations throughout Europe [6]. Such surveillance can provide critical data on the AMR carriage of these birds, thereby reflecting the AMR load along their migratory flyways [25].
Assessing the resistome of a specific habitat requires a multi-layered approach. Culture-based methods are inherently biased toward less fastidious, readily cultivable bacteria, whereas routine genotypic methods (such as qPCR) are limited to detecting previously characterised AMR genes [26]. While focusing on a single bacterial taxon via selective media increases isolation efficiency, it may fail to represent the broader resistome dynamics of the habitat, as resistance mechanisms and their genetic vehicles vary significantly across different taxa [27]. Therefore, a comprehensive evaluation must balance the high-resolution data of specific indicators with a broader assessment of the overall environmental microbial community.
Heterotrophic Plate Count (HPC) bacteria are extensively used in drinking water quality control as well as in environmental monitoring programs. These bacteria are non-fastidious, aerobic or facultatively anaerobic, and mesophilic, allowing for rapid growth on general culture media. These characteristics make them highly suitable for surveillance efforts regarding environmental AMR dynamics [28,29,30].
Beyond the accumulation of resistance genes, anthropogenic impact on bacterial communities results in a taxonomic shift toward Gram-negative (GN) dominance. This phenomenon has been linked to pesticide loading [31] and the heavy metal content of industrial effluents [32]. Furthermore, less diverse bacterial communities are more susceptible to accumulating resistance genes [27]. Based on these scientific data, we hypothesised that the parallel analysis of landscape diversity, bacterial community structure, and phenotypic antimicrobial resistance (AMR) provides a more comprehensive insight into the bidirectional AMR transmission at the human-wildlife interface.
Several methods have been introduced in ecology to estimate diversity. Since species richness alone is insufficient for comparing communities—for instance, a community dominated by a few species is less diverse than an even one with the same number of species—various indices have been developed [33,34]. However, standard indices often fail to address extreme scenarios, such as the presence of numerous rare species or the absolute dominance of a few. These metrics remain biased toward specific aspects of diversity: the widely used Shannon index is sensitive to rare species, the Simpson index emphasises dominant species, while the Berger-Parker index reflects only the single most abundant taxon [33,35].
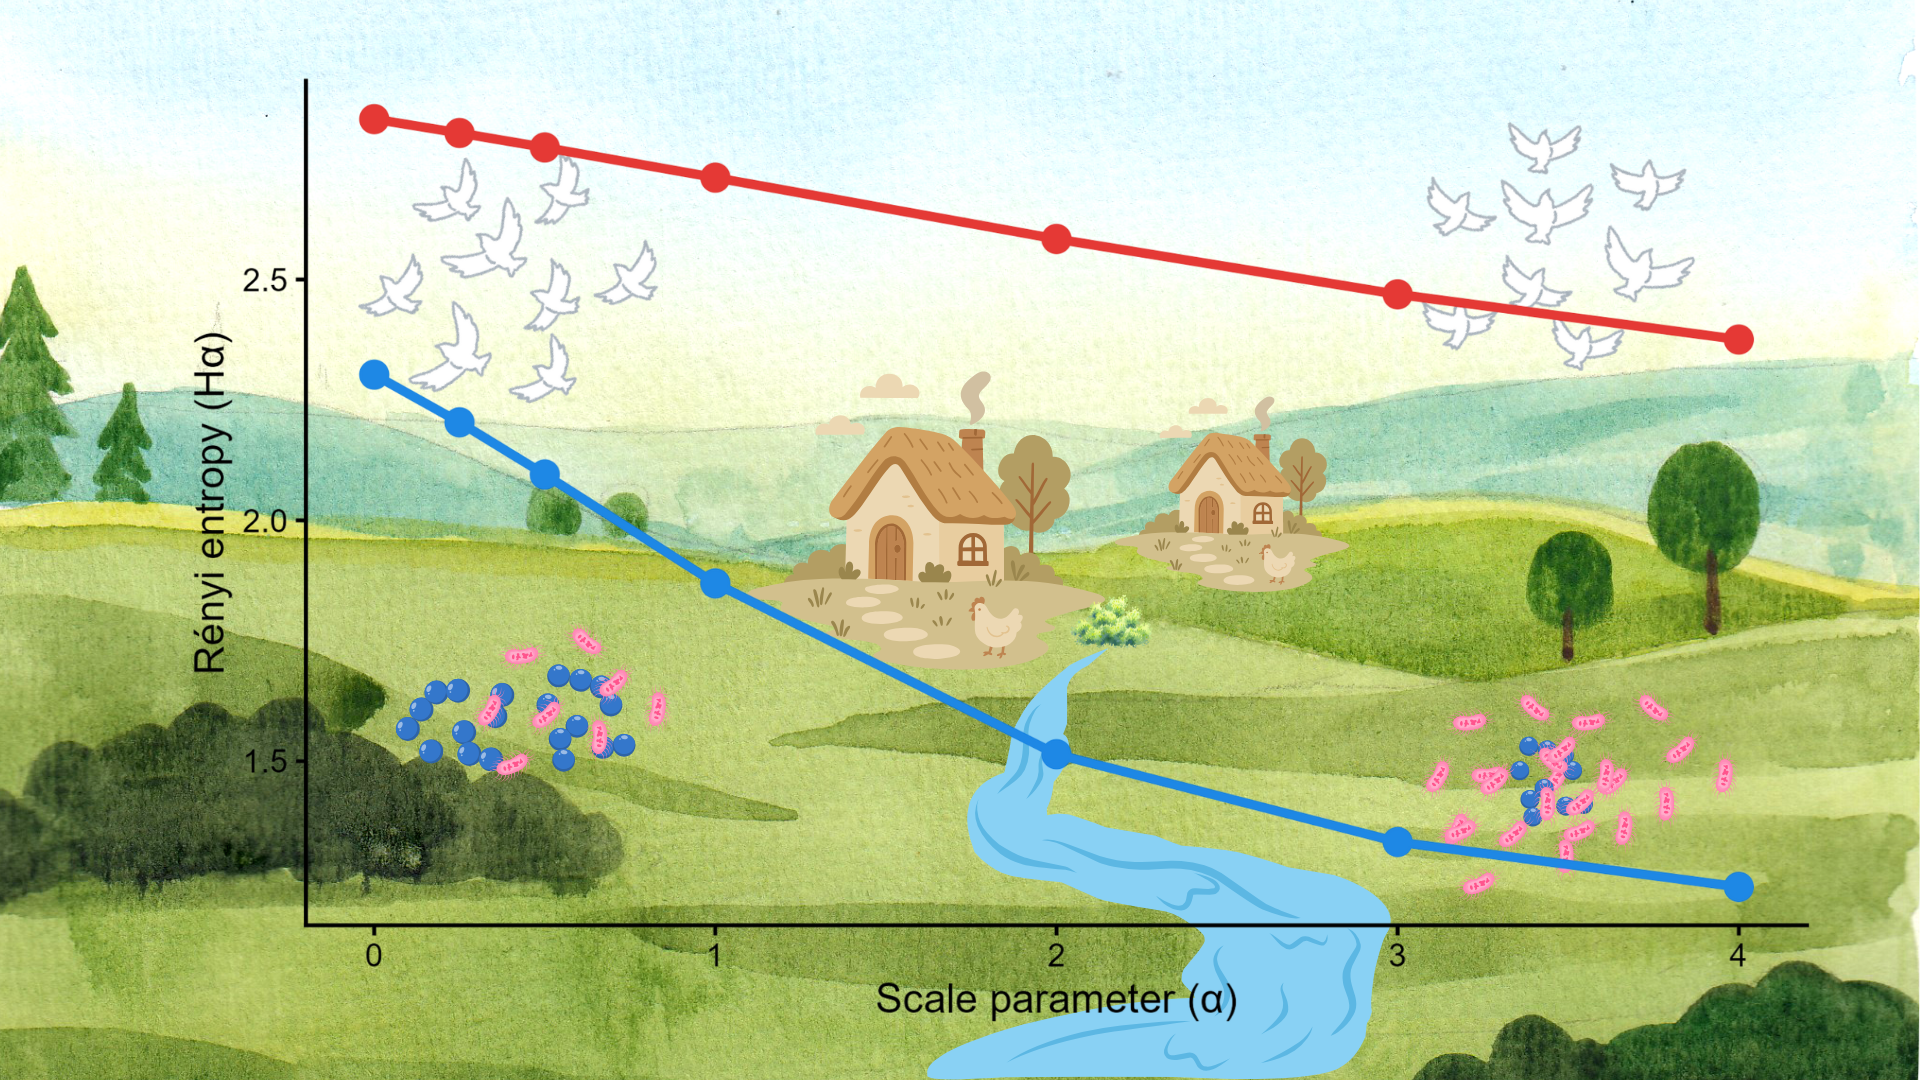
Rényi entropy (Hα) offers a more robust approach by providing a comprehensive diversity profile instead of a single value. It is based on a family of functions that simultaneously accounts for both rare and dominant elements, characterised by the scale parameter alpha (α). At α = 0, the value corresponds to species richness; thus, this section of the profile is highly sensitive to rare species. As α approaches 1, the value converges to the Shannon index. At α = 2, the curve represents quadratic diversity (Simpson index), reflecting the influence of dominant species. As alpha tends toward infinity, the curve flattens and yields the Berger-Parker index. Consequently, Rényi entropy is uniquely suited for analysing complex communities where both rare and dominant species play critical roles [33,34].
This pilot study aimed to develop a non-selective approach for mapping AMR at the human-wildlife interface in a suburban environment. To achieve this, cloacal swabs were collected from a common herbivorous bird species. The high mobility of these birds ensured spatial integration of the data, while their herbivorous diet served to filter out the biological noise associated with pathogen bioaccumulation typically found in species utilising anthropogenic waste. Laboratory procedures targeted HPC bacteria using non-selective cultivation to obtain a broader overview of the microbial community. This approach was intentionally chosen to prioritise a comprehensive landscape-level assessment over a high-resolution, taxon-specific analysis of microbial dynamics.
2. Materials and Methods
2.1. Study area
The study area is part of the Zagyva River catchment system, located in the northern part of the Great Hungarian Plain. The river originates within Hungary, approximately 100 river kilometres (rkm) upstream from the sampling sites. Four small industrial towns are situated along the Zagyva River: Salgótarján, Bátonyterenye, Pásztó, and Hatvan. Among these, Hatvan is located closest to the study area, representing a significant urban-industrial influence. This lowland region lies at an altitude of approximately 86 m within the continental temperate zone. Both sampling sites (with 4 km diameter) were situated in the suburban zone of Jászberény, a small provincial town characteristic of the region.
The river flows through the town, originating from the direction of the Jászfelsőszentgyörgy sampling site (JFGY; 47.498276/19.848227) toward the northern outskirts of Jászberény (JB; 47.515572/19.935496). The upstream section relative to the town is characterised by a meandering riverbed with semi-natural floodplain forests along the banks. These forests provide essential foraging and nesting habitats for the Common Wood Pigeon.
Within the town, the river is primarily confined between artificial embankments. Few sections retain canopy cover or riparian vegetation; consequently, the flow velocity is higher within this urban reach. The JB sampling site is situated on the downstream section relative to the town centre. The studied river reaches at JFGY and JB are 5.1 km and 4.8 km in length, respectively (Figure 1).
Although wastewater management has improved remarkably since Hungary acceded to the European Union, the Zagyva River was historically a well-known example of heavy water pollution. The legacy of this industrial and communal contamination, spanning decades of the 19th and 20th centuries, is well-documented across the river and its tributaries [36,37,38].
2.2. Sample collection
The carcasses involved in the study were obtained from regular pest control activities regulated by Hungarian law, specifically Act No. 1996/LV on Wildlife and Act No. 79/2004. (V. 4.) FVM Regulation on its implementation.
After harvesting, all carcasses were subjected to biometric measurements (body weight, body, wing, tail, and bill length) according to the method described by [39]. A bacteriological sample was taken with a sterile swab from the cloacal lumen and placed into transport medium (A0590 Amies Transport Medium with Charcoal, Sigma-Aldrich, Merck KGaA, Darmstadt, Germany). Inoculated transport media were stored and transported at 4°C until laboratory processing.
2.3. Bacteriological investigation
Transport swabs were incubated in 5 mL of buffered peptone water (BPW) liquid medium (produced in-house from Buffered Peptone Water, GranuCult® prime; Sigma-Aldrich, Merck KGaA, Darmstadt, Germany) at 37°C temperature for 24 hours to ensure the revival of bacteria. From each tube of BPW, 100 μL inoculum was spread on the surface of Plate Count Agar (PCA; prepared in-home with Plate Count Agar, GranuCult® prime; Sigma-Aldrich, Merck KGaA, Darmstadt, Germany in accordance with the manufacturer's instructions). Inoculated PCA plates were incubated for 48 hours at 37°C and were checked every 24 hours.
Pure cultures were obtained by transferring separate colonies onto PCA plates using a four-quadrant streak plate method. Gram staining was performed on pure cultures using the Gram-Nicolle Kit (VWR International, LLC, Radnor, PA, USA) in accordance with the manufacturer's instructions to differentiate between Gram-positive (GP) and Gram-negative (GN) bacteria.
For identification, the VITEK 2 Compact system (bioMérieux, Marcy-l'Étoile, France) was employed. For GP and GN bacteria, VITEK 2 GP (Ref. No. 21342) and VITEK 2 GN (Ref. No. 21341) cards were used, respectively. Antimicrobial susceptibility testing (AST) was carried out on bacterial isolates identified with at least 80% probability. Bacterial species lacking an AST record in the VITEK database (e.g. Kocuria spp.) were excluded from this phase. For GPs, the investigated antibiotics included: cefoxitin (FOX), benzylpenicillin (B-PEN), oxacillin (OXA), gentamicin (GEN), ciprofloxacin (CIP), moxifloxacin (MOX), erythromycin (ERY), clindamycin (CLIN), linezolid (LIN), teicoplanin (TEI), vancomycin (VAN), tetracycline (TET), tigecycline (TIGE), fosfomycin (FOM), fusidic acid (FUS), rifampicin (RIF), and trimethoprim (TRIM). For GNs, ampicillin/sulbactam (AMP/SAM), ticarcillin/clavulanic acid (TIC/CLA), piperacillin (PIP), piperacillin/tazobactam (TZP), ceftazidime (CZD), cefepime (CFP), aztreonam (AZT), imipenem (IMI), meropenem (MER), amikacin (AMI), gentamicin (GEN), tobramycin (TOB), ciprofloxacin (CIP), levofloxacin (LEV), colistin (COL), and trimethoprim/sulfamethoxazole (SXT) were tested. These analyses were performed using VITEK 2 AST-P592 (Ref. No. 222887) and VITEK 2 AST-N331 (Ref. No. 418675) cards, respectively. Findings were exported to Excel sheets (Microsoft® Excel® for Microsoft 365 MSO, Version 2511).
2.4. Data analysis
For spatial analysis, land cover data were obtained from http://alapterkep.termeszetem.hu/ (accessed on December 6, 2025). Specific patch types were classified into subcategories based on their functional relevance, such as grouping orchards and vineyards as intensively cultivated areas and potential foraging sites for pigeons. These subcategories were aggregated into main categories: urban areas (URB), agricultural lands (AGRO), semi-natural habitats (SEMINAT), and surface waters (WATER). Sunburst diagrams were generated to visualise the hierarchical distribution of patch types and their respective categories across the two study sites. As the river provides the most significant water source for the regional wildlife, the same land cover classification was conducted within a 50-m-wide buffer zone along the river.
To evaluate differences in landscape heterogeneity between the two sampling sites, landscape diversity was quantified using Rényi’s generalised entropy, calculated as follows [33,35]:
where Hα is the Rényi entropy, α is the scale parameter, and pi is the relative frequency of the given land cover type in the sample.
The diversity profiles were visualised to compare landscape evenness and richness across a range of scale parameters (α). Calculation and visualisation of Rényi's entropy were conducted within the R (v4.4.2) statistical environment [40] using vegan [41], plotly [42], and ggplot2 [43] packages.
In contrast to single-value indices, Rényi’s entropy provides a more comprehensive insight into the structural complexity of the investigated landscape. Instead of providing a static parameter, it characterises the balance between dominant habitat types and the preservation of rare habitats. Since this study aimed to evaluate the anthropogenic impact on the background AMR load, assessing landscape naturalness through Rényi’s diversity profiles proved essential. These curves enabled us to investigate the specific association between the degree of naturalness and the spatial distribution of AMR load within distinct landscape units [33,44].
The morphometric analyses aimed to compare the populations of the two sampling sites and to identify outlying individuals that might indicate specific health issues. Mean (x̄) and standard deviation (SD) were calculated for all morphometric parameters at both sites (JFGY and JB). After confirming normality using the Shapiro-Wilk test, population datasets were compared using independent-samples t-tests in the PAST (version 4.17) statistical software [45].
With respect to the bacteriological data, the GP/GN ratios, the diversity of bacterial communities and resistance phenotypes, the Multiple Antibiotic Resistance (MAR) indices, and the prevalence of multidrug-resistant (MDR) bacteria were determined for both sampling sites. The GP/GN ratio was employed as a proxy for environmental integrity, as anthropogenic disturbances, such as pesticide contamination [31] or industrial wastewater discharge [32], typically shift the community structure toward a predominance of GN taxa. The Chi-square test was used to compare these parameters between the two sites (R software v4.4.2).
To determine the GP/GN ratio, all pure bacterial isolates were included based on Gram staining results, regardless of identification success. To avoid bias, if multiple isolates of the same species were recovered from a single animal, only one was included in the analysis. The MAR index was calculated as the proportion of the total number of phenotypic resistance occurrences in the total number of AST tests performed. These indices were determined globally for both sampling sites, as well as separately for GN and GP bacteria within each location. The prevalence of MDR was calculated both within the sampled bird populations and among all AST-tested isolates. Bacterial strains exhibiting resistance to at least three different antimicrobial classes were classified as MDR.
For better insight into the ecological interdependence of landscape composition, bacterial community structure and AMR pattern, the diversity of these parameters was assessed and compared between sites using Rényi’s entropy analysis in R environment (v4.4.2) [40] employing vegan [41], plotly [42], and ggplot2 [43] packages.
Our research data are available at https://zenodo.org/records/18505851 with a README file adapted from Conzett and Dijkstra Haugstvedt [46].
3. Results
Morphometric analysis revealed that the average body mass of the individuals was 496±32 g at the JB site and 476±28 g at the JGYF site. The mean body length was 422±12 mm and 425±12 mm, while the mean wing length was 242±5 mm and 244±7 mm for the JB and JGYF sites, respectively. Statistical comparison showed no significant differences between the two locations regarding body mass (t(30) = 1.839; p = 0.076), body length (t(30) = 0.674; p = 0.505), or wing length (t(30) = 1.014; p = 0.318).
Although both sites are characterised by a dominant habitat class (AGRO) consisting primarily of cropland, alongside numerous smaller habitat patches, the sunburst diagrams revealed remarkable structural differences between the two units.Contrary to expectations based on urbanisation levels, the JB site exhibited higher ecological naturalness compared to JGYF. This variation in landscape composition reflects the structure of bacterial communities and AMR profiles of the two sites (Figure 2).
Of the 32 cloacal swabs examined, 31 tested positive for HPC bacteria, resulting in 60 bacterial isolates. From these, 48 were successfully identified and 35 were AST-tested using the VITEK 2 Compact system. The 21 and 27 isolates recovered from the JB and JGYF sites were assigned to 10 and 17 species, respectively. The GP/GN ratio was the sole bacteriological parameter exhibiting a significant difference (p = 0.105) between the two sampling sites. No other comparisons yielded statistically significant differences regarding the bacterial communities of the locations. Details of bacteriological findings are available at https://zenodo.org/records/18505851
All isolates belonging to the Staphylococcus genus proved to be MDR; notably, two isolates (S. gallinarum and S./Mammaliicoccus lentus, both from the JB site) exhibited a methicillin-resistant phenotype. Conversely, the most abundant GP genus, Enterococcus, showed only intermediate susceptibility to trimethoprim/sulfamethoxazole, while remaining susceptible to all other tested antimicrobials. Among GNs, two Pseudomonas fluorescens and one Sphingomonas paucimobilis isolate from the JGYF site were classified as MDR. Remarkably, aztreonam, carbapenem and colistin resistance were detected in the P. fluorescens isolates. In addition to these, colistin resistance was observed in the Enterobacter cloacae Complex (at both sites), as well as in the Serratia fonticola and Serratia liquefaciens Group (at the JGYF site). The only Escherichia coli isolate at site JB was susceptible to all tested antimicrobials. Other species of the GN class showed resistance to none or only one antimicrobial (Table 1). More details of AST results are available in the Zenodo repository (https://zenodo.org/records/18505851).
The Rényi entropy profiles of the two sampling sites demonstrated that overall landscape diversity had higher evenness at site JB; however, the riverine buffer zone was significantly more diverse at site JFGY (Figure 3). Comparing the diversity profiles of bacterial communities (Figure 4) and AMR burden (Figure 5) showed higher overall diversity at site JFGY. Regarding the separate analysis of each AMR feature, the Rényi curves cross each other, indicating that the two sites cannot be ranked consistently, as their relative diversity depends on the chosen scale parameter (α).
4. Discussion
This study utilised a pilot model to estimate the environmental AMR load of the landscape. For this purpose, cloacal swabs were collected from a herbivorous avian species, serving as a sentinel for local environmental health, to detect heterotrophic plate count (HPC) bacteria. Sampling was focused on two 4-km-diameter landscape units located 6.9 km apart, strategically selected to represent a river’s upstream and downstream environments relative to a provincial town. This spatial approach allows for a nuanced comparison of anthropogenic influence on the background resistome.
Although the morphometric assessment of the two study populations demonstrated remarkable uniformity, indicating generally good health status, several HPC bacteria with pathogenic potential were isolated from both sites. The most abundant GP genus was Enterococcus, with 9 and 4 isolates recovered from sites JB and JFGY, respectively. Notably, none of these isolates exhibited resistance to the tested antimicrobials. The only exception was a uniformly occurring intermediate susceptibility to trimethoprim-sulfamethoxazole. However, both intrinsic and acquired resistance of enterococci to various antimicrobials is a well-documented phenomenon [47,48]. Of the 13 Enterococcus isolates, 8 were identified as E. faecium, accounting for 13% of the total microbial recovery. This finding diverges from the general observation of high E. faecium prevalence in faecal-contaminated soils, water sources, and the commensal microbiota of vertebrates. Interestingly, all E. faecium isolates remained susceptible to all tested antimicrobials, despite the fact that multidrug resistance (MDR) is frequently documented in this species [48].
Both the low recovery rate and the lack of antimicrobial resistance appear to be unique characteristics of this E. faecium population. The low detection rate may be attributed to the non-selective culture method, which likely favoured competitors with higher initial cell counts or faster growth rates, potentially outcompeting enterococci during the incubation period. Regarding the observed susceptibility levels, the lack of phenotypic resistance in these eight isolates does not necessarily imply that the investigated E. faecium population is entirely free from antimicrobial resistance. This suggests that while resistance was not detected, its presence at low frequencies in the environment cannot be ruled out. Consequently, these findings—derived from a landscape-scale AMR surveillance—warrant further, more comprehensive investigation using selective culture methods to accurately assess the true AMR status of the local Enterococcus community.
Interestingly, all Staphylococcus isolates were multidrug-resistant (MDR), with those from site JB also exhibiting methicillin resistance. This aligns with previous environmental studies, which frequently report both MDR and methicillin resistance in staphylococci [49]. Notably, higher MAR indices were observed in this taxon at site JB, despite this site appearing less contaminated based on other AMR indicators. Two isolates of the Mammaliicoccus genus (formerly Staphylococcus), namely M. lentus and M. sciuri, exhibited AMR patterns similar to their staphylococcal counterparts at the same site. This is significant, as mammaliicocci are often considered reservoirs and potential sources of resistance genes for other Staphylococcus species [50].
Due to the low number of isolates (n=4), the apparently higher AMR load in the staphylococcal community at site JB remains indicative rather than conclusive. However, it is noteworthy that water sources for Wood Pigeons at site JB are subject to more direct environmental impacts than those at site JFGY. The latter is located further upstream; for instance, Hatvan, the nearest major urban centre, is approximately 35–40 river kilometres (rkm) from site JFGY. Although staphylococci are ubiquitous and resilient, the distance from potential anthropogenic sources, combined with intense competition from more pollution-tolerant GN bacteria at site JFGY, likely hindered their detection. Given that all recovered isolates were MDR, these findings underscore the necessity of further studies using selective, high-salt culture media to better characterise the halotolerant staphylococcal community.
Among GN bacteria, two MDR P. fluorescens isolates with co-resistance to carbapenems, aztreonam, and colistin were detected at site JFGY. While intrinsic carbapenem resistance in P. fluorescens has been documented [51], the MDR phenotype suggests extreme selection pressure on the bacterial population [52,53]. Such phenomena are frequently associated with heavy-metal pollution from industrial effluents[32,54,55]. Due to the lack of comprehensive environmental sampling of the river sediment, historical industrial pollution of the Zagyva River [36,37,38] is only hypothesized as a potential cause of this phenomenon. Regarding colistin resistance in Pseudomonas spp., it often manifests as heteroresistance, where a generally susceptible population harbours a resistant subpopulation. This phenomenon complicates AST testing, as isolates may appear susceptible in vitro despite clinical treatment failure [56]. In this study, both P. fluorescens isolates exhibited full resistance to colistin. Furthermore, colistin resistance was observed in all six Enterobacter cloacae Complex isolates from both sites. Although colistin resistance is common in the E. cloacae Complex, it is also frequently masked by heteroresistance [57]. Therefore, the high prevalence of manifested colistin resistance detected here is noteworthy and might be attributed to the pre-enrichment of samples in buffered peptone water. Studies on heteroresistance have confirmed that specific culture conditions, such as osmolarity, pH and oxygen availability, can alter the growth of colistin-resistant subpopulations; similarly, broth-based cultivation may promote the proliferation of resistant cells [57].
Although the E. cloacae Complex is ubiquitous, only six isolates were recovered. Interestingly, at site JB, where GPs dominated, this species was detected five times more frequently than at site JFGY. This irregular detection pattern was likely due to the non-selective culture technique, as previously noted for Enterococcus spp.
Furthermore, an isolate of the typical environmental bacterium S. paucimobilis was detected at site JFGY, exhibiting resistance to ciprofloxacin and tobramycin, and intermediate susceptibility to amikacin and gentamicin. This species is known for its adaptability to extreme conditions, such as heavy-metal pollution, and is therefore utilised in bioremediation [58]. In highly polluted environments, co-selection for resistance to both heavy metals and antimicrobials is well-documented in this species [58]. Additionally, S. paucimobilis is an oligotrophic bacterium, allowing it to thrive in nutrient-poor environments. This trait facilitates its role as a healthcare-associated pathogen, as it can survive and proliferate on the surfaces of tracheal tubes and catheters [59].
In a broader context, Rényi's diversity profiles highlighted potential landscape-level mediators of AMR load. A comparison of landscape diversity revealed higher evenness at site JB. While JB encompasses a larger urban area, the significant proportion of urban green space contributes to a more heterogeneous urban ecosystem. Traditionally, anthropogenic areas have been viewed primarily as sources of pollution, often dominated by non-ecological elements [60]. However, urban-to-rural gradients are not simple geographical transects; they represent complex patterns of diverse functional land use that can, in some cases, support increased ecosystem function and biodiversity [61]. Consequently, the higher landscape-level evenness at JB may foster a more resilient environmental microbiome than the intensively cultivated, more homogenous croplands dominating site JFGY [31,32]. At the latter site, high landscape diversity is confined to a narrow riparian buffer zone, while the surrounding area is dominated by agricultural land use. Paradoxically, the higher landscape diversity at JB was accompanied by lower bacterial alpha-diversity compared to JFGY. It is important to note that surveillance focusing on heterotrophic plate count (HPC) bacteria provides only a partial view of the total bacterial profile. Nevertheless, the seemingly higher bacterial diversity at JFGY is characterised by a profound shift toward GN dominance, with more than twice as many GN isolates detected than at JB. This ratio was nearly inverted at site JB, with the difference in the GP/GN ratio between the two sites being statistically significant (P=0.0105). If the GP/GN ratio is considered a proxy for naturalness in bacterial communities [31,32], the apparent contradiction between higher landscape diversity and lower bacterial diversity at JB becomes explainable [62]. Furthermore, the AMR profiles of the two sites support the hypothesis that landscape-level diversity may mitigate AMR load, even within human-impacted environments.
The diversity of AMR profiles was evaluated using two complementary approaches: co-resistance patterns and the occurrence of individual phenotypic resistance traits were both subjected to Rényi diversity profile analysis. At site JFGY, the higher diversity of co-resistance patterns suggests that intense selective pressure has fostered the emergence of diverse multi-drug resistant (MDR) phenotypes (Figure 5). Regarding the occurrence of separate resistance features, the Rényi profiles of the two sites intersect; consequently, neither site can be unequivocally categorised as more diverse. However, the higher Hα values at JFGY for α<2 indicate that, beyond a high richness of phenotypic resistance, the profile is shaped by a few dominant resistance features. In contrast, the less steep curve at site JB demonstrates lower AMR richness coupled with higher evenness. From an ecological perspective, the AMR diversity profiles at site JB reflect a more stable state. Given that nearly all resistance cases at JB are restricted to the Staphylococcus genus, and the vast majority of both GP and GN isolates were fully susceptible to the tested antimicrobials, the AMR load at site JB is hypothesised to be less severe than at JFGY.
The finding that a more diverse bacterial community exhibited higher AMR phenotype richness seemingly contradicts previous observations suggesting that environmental microbiome diversity provides a protective buffer against AMR accumulation [27]. However, the shifted GP/GN ratio within the diverse collection of HPC bacteria at site JFGY reveals that this apparent diversity is largely restricted to the GN population [62]. Coupled with increased AMR richness, this suggests that intense selective pressure allowed GN species to outcompete GP bacteria at JFGY, leading to a taxonomically skewed community. Additionally, the most diverse microhabitats at site JFGY are located within a narrow, 50-meter-wide riparian buffer zone. Notably, Klümper et al. (2024) [27] observed that the protective role of biodiversity often fails in riparian ecosystems, as riverbeds are highly dynamic environments where various anthropogenic and natural stressors converge, potentially facilitating the persistence of resistant taxa.
In the current study, both sites encompassed a river section of similar length, serving as the primary water source for the investigated pigeon populations. However, these sections exhibited remarkable hydrological differences. Site JB features a downstream section with increased flow velocity due to channelisation, whereas the upstream section at JFGY is characterised by a meandering, slow-flowing (lentic-like) character. Despite the high biological diversity of the riparian vegetation along this meandering reach, the reduced water velocity promotes sedimentation; this process may act as a filter, trapping pollutants and associated bacteria transported from the upper catchment. It is probable that this natural ecological filter above the city maintains relatively high water quality within the urban river section, resulting in a more natural and less AMR-burdened bacterial community in pigeons utilising urban water sources.
Interestingly, the proximity of anthropogenic effluents appeared to have a less detrimental impact on the downstream bacterial community than anticipated. Both the GP/GN ratio and the AMR profiles exhibited a more 'natural' state here than at the upstream section. However, the presence of methicillin resistance in Staphylococcus species at site JB, and its absence at the upstream site, suggests that local urban sources may emit resistant bacteria or antibiotic resistance genes (ARGs) into the ecosystem [3,5].
Despite these compelling findings, the study has certain limitations. As a pilot investigation, the sample size (N=16 per site) was not intended to determine the absolute prevalence of specific AMR phenotypes. While the heterotrophic plate count (HPC) method provides a valuable snapshot of bacterial community diversity and resistance patterns, it is less suited for precise quantification of these parameters. The relatively low mean isolate number per sample represents a potential constraint, suggesting a possible loss of certain bacterial taxa during laboratory processing. Nevertheless, even this limited sample size revealed clear, trend-like differences between the two sites. The reduced naturalness and elevated AMR load at site JFGY were consistently confirmed through the analysis of GP/GN ratios [31,32] and the Rényi diversity profiles [35] of interconnected parameters, including landscape, HPC bacteria, and AMR phenotypes.
5. Conclusions
This study demonstrates that faecal samples from a herbivorous avian bioindicator can effectively assess baseline AMR loads and identify potential anthropogenic sources. By collecting cloacal swabs from Common Wood Pigeons at two sites only 6.9 km apart, we assumed minimal overlap between the flight ranges of the two populations—a hypothesis supported by the remarkable dissimilarity in their bacterial communities and resistance profiles. Utilising Rényi’s diversity profiles proved instrumental in identifying the underlying causes of these differences. While these pilot findings are not yet sufficient to build a predictive model, they confirm that HPC bacteria from avian hosts provide critical information regarding the AMR load of species-specific home ranges. Future surveillance, utilising larger home-range data and replacing culture-based methods with more precise molecular techniques[26,27], will further enhance our understanding of AMR dynamics. Ultimately, employing Rényi’s complex approach to diversity improves the accuracy of assessing how diversity loss and anthropogenic influence shape the AMR landscape of an ecosystem [35].
Author Contributions
Conceptualization, Á.C., G.N. and T.T..; methodology, Á.C..; investigation, Á.S., E.N., A.B., Á.C., and B.B.; resources, M.K.; data curation, E.N., G.N., and T.T..; writing—original draft preparation, Á.S., A.B., Á.C., B.B., G.N., M.K., and T.T.; writing—review and editing, Á.C., G.N., and M.K..; visualization, E.N., G.N., and T.T.; supervision, M.K. and T.T..; project administration, Á.C.; funding acquisition, M.K. All authors have read and agreed to the published version of the manuscript.
Funding
This work was partially funded by the Hungarian Research Network (HUN-REN-MATE, Mycotoxins in the Food Chain research group) and by the Hungarian National Laboratory project RRF-2.3.1-21-2022-00007, and further by the Flagship Research Groups Programme by the Hungarian University of Agriculture and Life Sciences.
Data Availability Statement
All data generated or analysed during this study are openly available in the Zenodo repository at https://zenodo.org/records/18505851.
Acknowledgments
During the preparation of this manuscript, the authors used Google Gemini for the purposes of correction of grammatical error and improvement of fluency. The authors have reviewed and edited the output and take full responsibility for the content of this publication.
Conflicts of Interest
The authors declare no conflicts of interest. The funders had no role in the design of the study; in the collection, analyses, or interpretation of data; in the writing of the manuscript; or in the decision to publish the results.
Abbreviations
The following abbreviations are used in this manuscript:
| AMI | amikacin |
| AMR | Antimicrobial Resistance |
| AMP/SAM | ampicillin/sulbactam |
| ARG | Antimicrobial Resistance Gene |
| AST | Antimicrobial Susceptibility Testing |
| AZT | aztreonam |
| B-PEN | benzylpenicillin |
| CFP | cefepime |
| CIP | ciprofloxacin |
| CLIN | clindamycin |
| COL | colistin |
| CZD | ceftazidime |
| ERY | erythromycin |
| FOM | fosfomycin |
| FOX | cefoxitin |
| FUS | fusidic acid |
| GEN | gentamicin |
| GN | Gram-negative |
| GP | Gram-positive |
| HPC | Heterotrophic Plate Count |
| IMI | imipenem |
| JB | Jászberény (study site) |
| JFGY | Jászfelsőszentgyörgy (study site) |
| LEV | levofloxacin |
| LIN | linezolid |
| MAR | Multiple Antibiotic Resistance |
| MDR | Multidrug Resistance |
| MER | meropenem |
| MOX | moxifloxacin |
| OXA | oxacillin |
| PCA | Plate Count Agar |
| PIP | piperacillin |
| RIF | rifampicin |
| SD | Standard Deviation |
| SXT | trimethoprim/sulfamethoxazole |
| TEI | teicoplanin |
| TET | tetracycline |
| TIC/CLA | ticarcillin/clavulanic acid |
| TIGE | tigecycline |
| TOM | tobramycin |
| TRIM | trimethoprim |
| TZP | piperacillin/tazobactam |
| VAN | vancomycin |
References
- Huang, J.; Zhou, N.; Cheng, Z.; Chen, Y.; Li, M.; Lv, C.; Guo, X.; Li, Q.; Yao, Y.; Dong, K.; Zhu, Y. Chromosomally located blaCMH in Enterobacter cloacae complex across human-bird-environment interfaces: A one-health perspective. Sci. Total. Environ. 2024, 954, 176486. [Google Scholar] [CrossRef]
- Doyle, C.; Wall, K.; Fanning, S.; McMahon, B. J. Making sense of sentinels: wildlife as the One Health bridge for environmental antimicrobial resistance surveillance. J. Appl. Microbiol. 2025, 136, lxaf017. [Google Scholar] [CrossRef] [PubMed]
- Kim, D. W.; Cha, C. J. Antibiotic resistome from the One-Health perspective: understanding and controlling antimicrobial resistance transmission. Exp. Mol. Med. 2021, 53, 301–309. [Google Scholar] [CrossRef] [PubMed]
- Zanardi, G.; Iemmi, T.; Spadini, C.; Taddei, S.; Cavirani, S.; Cabassi, C. S. Wild micromammals as bioindicators of antibiotic resistance in ecopathology in Northern Italy. Animals 2020, 10, 1184. [Google Scholar] [CrossRef]
- Piotrowska, M.; Popowska, M. The prevalence of antibiotic resistance genes among Aeromonas species in aquatic environments. Ann. Microbiol. 2014, 64, 921–934. [Google Scholar] [CrossRef]
- Grilli, G.; Rapi, M. C.; Musa, L.; Di Giacinto, G.; Passamonti, F.; Raimondi, S.; Cianca, O.; Franciosini, M. P. Looking for ESKAPE bacteria: Occurrence and phenotypic antimicrobial resistance profiles in wild birds from Northern and Central Italy sites. Antibiotics 2025, 14, 1025. [Google Scholar] [CrossRef]
- Cai, F.; Calisi, R. M. Seasons and neighborhoods of high lead toxicity in New York City: the feral pigeon as a bioindicator. Chemosphere 2016, 161, 274–279. [Google Scholar] [CrossRef]
- Haynes, P. J.; Inglis, I. R.; Isaacson, T. J.; Fryday, S. L. Woodpigeon Columba palumbus movements in eastern England. Bird Study 2023, 50, 33–38. [Google Scholar] [CrossRef]
- Schumm, Y.R.; Masello, J.F.; Cohou, V.; Mourguiart, P.; Metzger, B.; Rösner, S.; Quillfedt, P. Should I stay or should I fly? Migration phenology, individual-based migration decision and seasonal changes in foraging behaviour of Common Woodpigeons. Sci. Nat. 2022, 109, 44. [Google Scholar] [CrossRef]
- Rapi, MC; Filipe, J; Filippone Pavesi, L; Raimondi, S; Addis, MF; Franciosini, MP; Grilli, G. Resisting the final line: Phenotypic detection of resistance to last-resort antimicrobials in Gram-negative bacteria isolated from wild birds in Northern Italy. Animals 2025, 15, 2289. [Google Scholar] [CrossRef]
- Pollack, L.; Ondrasek, N. R.; Calisi, R. Urban health and ecology: the promise of an avian biomonitoring tool. Curr. Zool. 2017, 63, 205–212. [Google Scholar] [CrossRef] [PubMed]
- Martín-Vélez, V.; Sánchez, M.I.; Lovas-Kiss, Á.; Hortas, F.; Green, A. J. Dispersal of aquatic invertebrates by lesser black-backed gulls and white storks within and between inland habitats. Aquat. Sci. 2022, 84, 10. [Google Scholar] [CrossRef]
- Luna, Á.; Pomeda-Gutiérrez, F.; Galán Díaz, J. Feeding ecology of the common wood pigeon (Columba palumbus) in a major European city. R. Soc. Open Sci. 2024, 11, 1231721. [Google Scholar] [CrossRef] [PubMed]
- BirdLife International. Species factsheet: Common Woodpigeon Columba palumbus. Available online: https://datazone.birdlife.org/species/factsheet/common-woodpigeon-columba-palumbus (accessed on 28 December 2025).
- Negrier, C.; Fantinati, M.; Jouglar, J. Y.; Lyazrhi, F.; Cohou, V.; Priymenko, N. Dietary regimen of the woodpigeon (Columba palumbus). J. Anim. Physiol. Anim. Nutr. 2021, 105, 376–384. [Google Scholar] [CrossRef]
- Haraszthy, L. Common Wood Pigeon Columba palumbus Linnaeus, 1758. in: Breeding biology of Hungarian nesting birds (in Jungarian). Haraszthy, L., Ed.; Pro Vértes Nonprofit Zrt.: Csákvár, Hungary, 2019; Volume 1, pp. 201–206. [Google Scholar]
- Schuster, S. Verhaltensänderungen bei Ringeltauben Columba palumbus im Voralpenraum. Ornithol. Jh. Baden-Württemb. 2017, 31, 100–110. [Google Scholar]
- Bozó, L.; Csörgő, T. Changes in spring arrival dates of Central European bird species over the past 100 years. Acta Zool. Acad. Sci. Hung. 2020, 66, 283–298. [Google Scholar] [CrossRef]
- Juhász, L. Synecological analysis of the ornithofauna of the city of Debrecen (in Hungarian). Puszta 1985, 3, 37–52. [Google Scholar]
- Lykov, E. L. Urban population of the Common Wood Pigeon in Krasnodar. Ornis Hung. 2024, 32, 38–153. [Google Scholar] [CrossRef]
- Illés, A.; Nagy, E.; Nagy, R. R.; Tari, T. The environmental impact of the feral pigeon (Columba livia f. domestica) in the historic city centre of Sopron. Analecta Tech. Szeged. 2023, 17, 69–76. [Google Scholar] [CrossRef]
- Radimersky, T.; Frolkova, P.; Janoszowska, D.; Dolejska, M.; Svec, P.; Roubalova, E.; Cikova, P.; Cizek, A.; Literak, I. Antibiotic resistance in faecal bacteria (Escherichia coli, Enterococcus spp.) in feral pigeons. J. Appl. Microbiol. 2010, 109, 1687–1695. [Google Scholar] [CrossRef]
- Sausse, C.; Lévy, M. Bird damage to sunflower: International situation and prospects. OCL, 2021, 28, 34. [Google Scholar] [CrossRef]
- European Council. Directive 2009/147/EC of the European Parliament and of the Council of 30 November 2009 on the conservation of wild birds. Available online: https://eur-lex.europa.eu/eli/dir/2009/147/oj/eng (accessed on 04 January 2026).
- Butkauskas, D.; Švažas, S.; Bea, A.; Prakas, P.; Olano, I.; Grishanov, G.; Mischenko, A.; Kozulin, A.; Stanevičius, V.; Báldi, A.; et al. Designation of flyways and genetic structure of Woodpigeon Columba palumbus in Europe and Morocco. Eur. J. Wildl. Res. 2019, 65, 91. [Google Scholar] [CrossRef]
- Ahmad, S.; Lohiya, S.; Taksande, A.; Meshram, R. J.; Varma, A.; Vagha, K. A comprehensive review of innovative paradigms in microbial detection and antimicrobial resistance: Beyond traditional cultural methods. Cureus 2024, 16, e61476. [Google Scholar] [CrossRef]
- Klümper, U.; Gionchetta, G.; Catão, E.; Bellanger, X.; Dielacher, I.; Elena, A. X.; Fang, P.; Galazka, S.; Goryluk-Salmonowicz, A.; Kneis, D.; et al. Environmental microbiome diversity and stability is a barrier to antimicrobial resistance gene accumulation. Commun. Biol. 2024, 7, 706. [Google Scholar] [CrossRef]
- Gensberger, E. T.; Gössl, E. M.; Antonielli, L.; Sessitsch, A.; Kostić, T. Effect of different heterotrophic plate count methods on the estimation of the composition of the culturable microbial community. PeerJ. 2015, 3, e862. [Google Scholar] [CrossRef]
- Allen, M. J.; Edberg, S. C.; Reasoner, D. J. Heterotrophic plate count bacteria—what is their significance in drinking water? Int. J. Food Microbiol. 2004, 92, 265–274. [Google Scholar] [CrossRef] [PubMed]
- Falcone-Dias, M.F.; Farache Filho, A. Quantitative variations in heterotrophic plate count and in the presence of indicator microorganisms in bottled mineral water. Food Control 2013, 31, 90–96. [Google Scholar] [CrossRef]
- Bitar, M. R.; Pinto, V. D.; Moreira, L. M.; Ribeiro, S. P. Gram-negative bacteria associated with a dominant arboreal ant species outcompete phyllosphere-associated bacteria species in a tropical canopy. Oecologia 2021, 195, 959–970. [Google Scholar] [CrossRef]
- Biswas, R.; Halder, U.; Kabiraj, A.; Mondal, A.; Bandopadhyay, R. Overview on the role of heavy metals tolerance on developing antibiotic resistance in both Gram-negative and Gram-positive bacteria. Arch. Microbiol. 2021, 203, 2761–2770. [Google Scholar] [CrossRef]
- Tóthmérész, B. DivOrd 1.50: a program for diversity ordering. Tiscia 1993, 27, 33–44. [Google Scholar]
- Chao, A.; Ricotta, C. Quantifying evenness and linking it to diversity, beta diversity, and similarity. Ecology 2019, 100, e02852. [Google Scholar] [CrossRef] [PubMed]
- Tóthmérész, B. Comparison of different methods for diversity ordering. J. Veg. Sci. 1995, 6, 283–290. [Google Scholar] [CrossRef]
- Sebők, R.; Prikler, B.; Dobolyi, C.; Szoboszlay, S.; Kriszt, B.; Szabó, I. Effects of treated wastewater discharge into a stream on microscopic fungal communities of microplastic surfaces. In 19th International Congress of the Hungarian Society for Microbiology, Márialigeti, K.; Dobay, O. (Eds.); Acta Microbiol. Immunol. Hung. 2023, 70 (Suppl 1), 53–88. [CrossRef]
- Sebők, B. The social changes of Szolnok County in the period of socialist industrialization. Paideia 2024, 14, 147–157. [Google Scholar] [CrossRef]
- Balla, A.; Moshen, A.; Kiss, T. Microplastic clouds in rivers: spatiotemporal dynamics of microplastic pollution in a fluvial system. Environ. Sci. Eur. 2024, 36, 143. [Google Scholar] [CrossRef]
- Huallacháin, D.Ó.; Dunne, J. Analysis of biometric data to determinethe sex of woodpigeons Columba palumbus. Ringing Migr. 2010, 25, 29–32. [Google Scholar] [CrossRef]
- R Core Team. R: A Language and environment for statistical computing, R Foundation for Statistical Computing, Vienna, Austria, 2024; (https://www.R-project.org/).
- Oksanen, J.; Blanchet, F. G.; Kindt, R.; Legendre, P.; Minchin, P. R.; O'Hara, R. B.; Simpson, G. L.; Sólymos, P.; Stevens, M. H. H.; Wagner, H. vegan: Community Ecology Package Package v2.7-2, [R package]. 2025. (https://CRAN.R-project.org/package=vegan).
- Sievert, C. Interactive web-based data visualization with R, plotly, and shiny; Chapman and Hall/CRC: Florida, USA, 2020. [Google Scholar]
- Wickham, H. ggplot2: Elegant graphics for data analysis; Springer-Verlag: New York, USA, 2016. [Google Scholar]
- Carranza, M.L.; Acosta, A.; Ricotta, C. Analyzing landscape diversity in time: The use of Renyi's generalized entropy function. Ecol. Indic. 2007, 7, 05–510. [Google Scholar] [CrossRef]
- Hammer, Ø.; Harper, D.A.T.; Ryan, P.D. PAST: Paleontological Statistics Software Package for education and data analysis. Palaeontol. Electron. 2001, 4, 9. [Google Scholar]
- Conzett, P.; Dijkstra Haugstvedt, N. DataverseNO README File Template - General (v2.4). Zenodo. 2024. [Google Scholar] [CrossRef]
- Kristich, C.J.; Rice, L.B.; Arias, C.A. Enterococcal infection—treatment and antibiotic resistance. In Enterococci: From commensals to leading causes of drug resistant infection; Gilmore, M.S., Ed.; Massachusetts Eye and Ear Infirmary: Boston, USA, 2014. [Google Scholar]
- Radisic, V.; Grevskott, D. H.; Junghardt, N.; Øvreås, L.; Marathe, N. P. Multidrug-resistant Enterococcus faecium strains enter the Norwegian marine environment through treated sewage. Microbiology Open 2024, 13, e1397. [Google Scholar] [CrossRef]
- Oladipo, A. O.; Oladipo, O. G.; Bezuidenhout, C. C. Bezuidenhout, Multi-drug resistance traits of methicillin-resistant Staphylococcus aureus and other Staphylococcal species from clinical and environmental sources. J. Water Health 2019, 17, 930–943. [Google Scholar] [CrossRef] [PubMed]
- Abdullahi, I. N.; Lozano, C.; Höfle, Ú.; Cardona-Cabrera, T.; Zarazaga, M.; Torres, C. Antimicrobial resistome of coagulase-negative staphylococci from nasotracheal cavities of nestlings of Ciconia ciconia in Southern Spain: detection of mecC-SCCmec type-XI-carrying S. lentus. Comp. Immunol. Microbiol. Infect. Dis. 2023, 99, 102012. [Google Scholar] [CrossRef] [PubMed]
- Lewandowska, W.; Mahillon, J.; Drewnowska, J. M.; Swiecicka, I. Insight into the phylogeny and antibiotic resistance of Pseudomonas spp. originating from soil of the Białowieża National Park in Northeastern Poland. Front. Microbiol. 2025, 16, 1454510. [Google Scholar] [CrossRef]
- Santoro, D. O.; Romao, C. M.; Clementino, M. M. Decreased aztreonam susceptibility among Pseudomonas aeruginosa isolates from hospital effluent treatment system and clinical samples. Int. J. Environ. Health Res. 2012, 22, 560–570. [Google Scholar] [CrossRef]
- Flores Ribeiro, A.; Bodilis, J.; Alonso, L.; Buquet, S.; Feuilloley, M.; Dupont, J. P.; Pawlak, B. Occurrence of multi-antibiotic resistant Pseudomonas spp. in drinking water produced from karstic hydrosystems. Sci. Total Environ. 2014, 490, 370–378. [Google Scholar] [CrossRef]
- Cooper, G. L.; Louie, A.; Baltch, A. L.; Chu, R. C.; Smith, R. P.; Ritz, W. J.; Michelsen, P. Influence of zinc on Pseudomonas aeruginosa susceptibilities to imipenem. J. Clin. Microbiol. 1993, 31, 2366–2370. [Google Scholar] [CrossRef] [PubMed]
- Poirel, L.; Palmieri, M.; Brilhante, M.; Masseron, A.; Perreten, V.; Nordmann, P. PFM-like enzymes are a novel family of subclass B2 metallo-β-lactamases from Pseudomonas synxantha belonging to the Pseudomonas fluorescens complex. Antimicrob. Agents Chemother. 2020, 64, e01700-19. [Google Scholar] [CrossRef]
- Dehbanipour, R.; Maleki, V. T. Z.; Ghalavand, Z. Colistin heteroresistance, mechanisms, diagnostic methods, and therapeutic options: A review. Germs 2015, 15, 166. [Google Scholar] [CrossRef]
- Doijad, S. P.; Gisch, N.; Frantz, R.; Kumbhar, B. V.; Falgenhauer, J.; Imirzalioglu, C.; Falgenhauer, L.; Mischnik, A.; Rupp, J.; Behnke, M.; et al. Resolving colistin resistance and heteroresistance in Enterobacter species. Nat. Commun. 2023, 14, 140. [Google Scholar] [CrossRef]
- Ozer, G.; Ergene, A.; Icgen, B. Biochemical and molecular characterization of strontium-resistant environmental isolates of Pseudomonas fluorescens and Sphingomonas paucimobilis. Geomicrobiol. J. 2013, 30, 381–390. [Google Scholar] [CrossRef]
- Ryan, M. P.; Adley, C. C. Sphingomonas paucimobilis: a persistent Gram-negative nosocomial infectious organism. J. Hosp. Infect. 2010, 75, 153–157. [Google Scholar] [CrossRef]
- Kremer, P.; Hamstead, Z.; Haase, D.; McPhearson, T.; Frantzeskaki, N.; Andersson, E.; Kabisch, N.; Larondelle, N.; Rall, E. L.; Voigt, A.; et al. Key insights for the future of urban ecosystem services research. Ecol. Soc. 2016, 21, 29. [Google Scholar] [CrossRef]
- Alberti, M. The effects of urban patterns on ecosystem function. Int. Reg. Sci. Rev. 2005, 28, 168–192. [Google Scholar] [CrossRef]
- Clark, J. S.; Dietze, M.; Chakraborty, S.; Agarwal, P. K.; Ibanez, I.; LaDeau, S.; Wolosin, M. Resolving the biodiversity paradox. Ecol. Lett. 2007, 10, 647–659. [Google Scholar] [CrossRef] [PubMed]
Figure 1.
Map of the two study sites (JFGY: Jászfelsőszentgyörgy, JB: Jászberény) and their location within the Zagyva River’s catchment. Salgótarján (S), Pásztó (P), and Hatvan (H) are industrial hubs along the river's upstream sections. Diameters of the sampling sites: 4 km.
Figure 1.
Map of the two study sites (JFGY: Jászfelsőszentgyörgy, JB: Jászberény) and their location within the Zagyva River’s catchment. Salgótarján (S), Pásztó (P), and Hatvan (H) are industrial hubs along the river's upstream sections. Diameters of the sampling sites: 4 km.

Figure 2.
Comparison of sunburst diagrams regarding landscape compositions (A, B), bacterial communities (C, D), and antimicrobial patterns (E, F) of the two study sites (JFGY: Jászfelsőszentgyörgy, JB: Jászberény). Land cover type categories: AGRO (agricultural land), URB (urban area), SEMINATURAL (seminatural microhabitats, e.g. forest, grassland, riparian vegetation). Land cover type subcategories: artificial (built environment), green artificial (urban green space), grassland (seminatural grassland), woodland, wet habitats (water-influenced seminatural habitats, e.g. riparian vegetation), surface water (lotic and lentic waters), cropland, complex cultivation (landscape mosaic of mixed cultivation), orchard and vineyard. Classes of bacteria: Gram-positive (GP), Gram-negative (GN). Tested antimicrobials: cefoxitin (FOX), benzylpenicillin (B-PEN), oxacillin (OXA), gentamicin (GEN), ciprofloxacin (CIP), erythromycin (ERY), clindamycin (CLIN), tetracycline (TET), fosfomycin (FOM), fusidic acid (FUS), rifampicin (RIF), ampicillin/sulbactam (AMP/SAM), ticarcillin/clavulanic acid (TIC/CLA), piperacillin (PIP), ceftazidime (CZD), aztreonam (AZT), imipenem (IMI), amikacin (AMI), gentamicin (GEN), tobramycin (TOB), ciprofloxacin (CIP), colistin (COL).

Figure 3.
Rényi landscape diversity profiles of the study sites (a) and their 50-m-wide riverine buffer zones (b). Hα represents the Rényi entropy and α is the scale parameter. Specific values shown: α = 0 (landscape type richness), α -> 1 (Shannon diversity index), α = 2 (Simpson dominance index). Abbreviations: JB – Jászberény; JFGY – Jászfelsőszentgyörgy.

Figure 4.
Rényi diversity profiles of bacterial communities of the two study sites. Hα represents the Rényi entropy and α is the scale parameter. Specific values shown: α = 0 (species richness), α -> 1 (Shannon diversity index), α = 2 (Simpson dominance index). Abbreviations: JB – Jászberény; JFGY – Jászfelsőszentgyörgy.

Figure 5.
Rényi diversity of antimicrobial resistance (AMR) patterns (a) and separate phenotypic resistance features (b) on the two sites. Hα represents the Rényi entropy, and α is the scale parameter. Specific values shown: α = 0 (AMR richness), α -> 1 (Shannon diversity index), α = 2 (Simpson dominance index). Abbreviations: JB – Jászberény; JFGY – Jászfelsőszentgyörgy, AMR - antimicrobial resistance pattern (a) or feature (b).


Table 1.
Antimicrobial resistance profiles of bacterial species isolated from the two study sites.
| Study site | Bacterial species | AMR profile |
| JB | Staphylococcus gallinarum (GP)1 | FOX2, B-PEN, ERY, TET3, FOM, FUS, RIF (I)4 |
| Mammaliicoccus lentus (GP) | FOX, B-PEN, OXA, CLIN, FOM, RIF | |
| Klebsiella oxytoca (GN) | AMP, TIC/CLA, PIP | |
| JFGY | Staphylococcus equorum (GP) | ERY, CLIN, FOM |
| Mammaliicoccus sciuri (GP) | B-PEN, CLIN, FUS | |
| Acinetobacter baumannii Complex (GN) | PIP | |
| Acinetobacter lwoffii (GN) | AMP (I) | |
| Aeromonas hydrophila (GN) | CIP | |
| Citrobacter braakii (GN) | AMP/SAM | |
| Pseudomonas fluorescens (GN) | TIC/CLA, FOX, AZT, IMI, AMI, TOB, COL, MER (I), GEN (I) | |
| Serratia fonticola (GN) | COL | |
| Serratia liquefaciens Group (GN) | COL | |
| Sphingomonas paucimobilis (GN) | TOB, CIP, AMI (I), GEN (I) | |
| Both5 | Enterobacter cloacae Complex (GN) | COL |
1 Gram classification is noted as GP (Gram-positive) and GN (Gram-negative). In GP species, resistance was exclusively associated with Staphylococcus/Mammaliicoccus isolates. 2 Antimicrobials: cefoxitin (FOX), benzylpenicillin (B-PEN), oxacillin (OXA), gentamicin (GEN), ciprofloxacin (CIP), erythromycin (ERY), clindamycin (CLIN), tetracycline (TET), fosfomycin (FOM), fusidic acid (FUS), rifampicin (RIF), ampicillin/sulbactam (AMP/SAM), ticarcillin/clavulanic acid (TIC/CLA), piperacillin (PIP), aztreonam (AZT), imipenem (IMI), meropenem (MER), amikacin (AMI), gentamicin (GEN), tobramycin (TOB), colistin (COL). 3 Phenotypic resistance detected at only one site is indicated in bold. 4 (I) indicates intermediate susceptibility. 5 Enterobacter cloacae complex was the only taxon exhibiting phenotypic resistance at both sites (JB and JFGY).
Disclaimer/Publisher’s Note: The statements, opinions and data contained in all publications are solely those of the individual author(s) and contributor(s) and not of MDPI and/or the editor(s). MDPI and/or the editor(s) disclaim responsibility for any injury to people or property resulting from any ideas, methods, instructions or products referred to in the content. |
© 2026 by the authors. Licensee MDPI, Basel, Switzerland. This article is an open access article distributed under the terms and conditions of the Creative Commons Attribution (CC BY) license (http://creativecommons.org/licenses/by/4.0/).
Copyright: This open access article is published under a Creative Commons CC BY 4.0 license, which permit the free download, distribution, and reuse, provided that the author and preprint are cited in any reuse.


