Submitted:
04 March 2026
Posted:
06 March 2026
You are already at the latest version
Abstract
The environmental impacts from fossil fuel use have accelerated the global transition to sustainable energy sources. Hydrogen has become a promising alternative due to its high energy density and clean combustion. However, hydrogen production streams are frequently contaminated with methane, which needs efficient, durable, and cost-effective purification technologies such as Pressure Swing Adsorption (PSA). The present study provides a comparative evaluation of biomass-derived activated carbons and a commercial activated carbon for hydrogen–methane separation. High surface-area activated carbons were synthesized from sustainable pine and birch precursors via chemical activation using potassium hydroxide (KOH, impregnation ra-tio 3:1) at 800 °C. Their adsorption performance was systematically assessed in a fixed-bed PSA system operating at pressures of 25, 35, and 50 bar, with a gas mixture of hydrogen-methane, where methane feed concentrations was ranging from 10 to 30 vol%. The biomass-derived activated carbons showed well-developed textural characteristics, with specific surface areas up to 1416 m² g⁻¹, exceeding that of the commercial reference material (1023 m² g⁻¹). This improved pore structure was reflected in their adsorption behavior at an operating pressure of 50 bar, the birch-derived carbon achieved a methane uptake of 10.5 mol kg⁻¹, more than twice the capacity measured for the commercial adsorbent of 5.30 mol kg⁻¹. Beyond initial adsorption capacity, the study emphasizes operational durability and reusability. Cyclic adsorption–desorption experiments, supported by Raman spectroscopy, revealed pronounced structural degradation in the commercial activated carbon under repeated operational stress, as indicated by an increase in the ID/IG ratio from 1.08 to 1.24. In contrast, the biomass-derived activated carbons preserved their morphological integrity and adsorption efficiency over successive cycles. These findings demonstrate that pine- and birch-derived activated carbons are not only sustainable alternatives but also operationally stable adsorbents capable for hydrogen purification processes.
Keywords:
hydrogen purification
; activated carbons
; pressure swing adsorption
; desorption
; hydrogen-methane separation
1. Introduction
Hydrogen plays an established role in the chemical and refining industries and is increasingly being explored for broader energy applications. Its high gravimetric energy density and clean conversion in fuel cells, which generate only water as a byproduct, make hydrogen an appealing choice for applications where low emissions and high efficiency are required [1]. Hydrogen is now being integrated into energy strategies aimed at diversifying energy supply and supporting low-carbon power, industrial processes, and transportation systems.
A wide range of technologies is available for hydrogen production, including thermochemical conversion, renewable electricity–driven water electrolysis, biological routes, and solar water splitting. Independent of the production pathway, large-scale use of hydrogen depends on the availability of suitable storage solutions. Common approaches include compressed gas and cryogenic storage, adsorption on porous materials, absorption in metal lattices, and chemical hydrogen carriers. For medium- and long-term storage, geological formations such as depleted oil and gas reservoirs and salt caverns are considered particularly attractive due to their large capacity and existing infrastructure[1,2].
When hydrogen is stored in depleted gas reservoirs, residual natural gas remains in the formation and serves as cushion gas to maintain pressure and stable flow during withdrawal. Before hydrogen can be delivered to pipelines or used in downstream applications, the mixture needs to be purified, as methane (CH4) is a significant impurity associated with underground hydrogen storage [3].
Reaching the high purity levels involves advanced gas-cleaning technologies that can selectively remove impurities while minimizing energy consumption.
Temperature swing adsorption (TSA) regenerates the adsorbent by utilizing heat, taking advantage of the exothermic nature of the adsorption process. Vacuum swing adsorption (VSA) achieves adsorbent regeneration by lowering the system pressure, which requires a vacuum, thereby increasing the effective working capacity of the material, especially when treating gas streams with low impurity concentrations [4,5,6].
Pressure swing adsorption (PSA) has emerged as a practical and energy-efficient method for hydrogen purification from methane-containing streams. PSA systems are adaptable to varying feed compositions and operating conditions, operate continuously, and can be integrated into both new and existing hydrogen facilities. Their performance depends strongly on the choice of adsorbent [7,8,9]. Commonly used materials include zeolites, silica gels, and activated carbons. Activated carbon is often used due to its moderate methane adsorption capacity, rapid kinetics, and easy regeneration [10,11,12].
One of the important advantages of using activated carbon in hydrogen purification applications is its strong adsorption affinity for impurity gas as CH4, while hydrogen interacts weakly with the carbon surface. This can be explained by the fact when hydrogen-rich gas mixtures flow through an activated carbon bed, impurities are preferentially retained and hydrogen largely pass through the adsorbent [12,13]. Since adsorbent selection plays a decisive role in PSA performance, materials with high surface area and suitable pore structure are generally favored. The use of biomass and agricultural by-products as precursors for production of activated carbon has increased, motivated by their widespread availability, cost-effectiveness, and reduced environmental impact. A broad range of feedstocks, including coconut shells, palm kern shell, rice husks, pine wood, and birch wood, has been explored as adsorbent materials for gas purification, water purification, CO2 adsorption [13,14,15,16,17,18]. Research in this area typically compares activation strategies based on physical activation, such as steam or CO2, or chemical activation including KOH, H3PO4, and ZnCl2 [19,20,21]. Among the various materials examined, KOH-activated carbons are highlighted due to their very high surface areas and pronounced microporosity. Coconut shell–derived activated carbons are widely recognized for achieving very high surface areas, increasing attention is being directed toward alternative biomass sources that are locally available and less dependent on globally traded or environmentally sensitive feedstocks. In this context, pine and birch have emerged as promising precursors, with several studies reporting surface areas reaching up to approximately 2300 m2 g−1 [22,23,24]. Such properties make pine- and birch-derived activated carbons attractive candidates for adsorption processes operating at elevated pressures.
In this study, the methane adsorption performance of three activated carbons—two laboratory-prepared carbons derived from pine and birch, and a commercial material—was systematically investigated under high-pressure conditions. The selected adsorbents exhibit textural properties, including differences in surface area and pore size distribution. Key operating parameters, including adsorption pressure, inlet flow rate, and methane concentration, were systematically varied to assess their impact on adsorption behavior. In addition, structural and surface characteristics of the activated carbons were examined using SEM, EDX, FTIR, and Raman spectroscopy to elucidate structure–property relationships, with particular emphasis on assessing the suitability and performance of biomass-derived activated carbons at elevated pressures.
2. Experimental
2.1. Materials
Three activated carbon samples were investigated in this study. Two biomass-derived activated biochars, produced from birch (Betula pendula) and pine (Pinus sylvestris), were synthesized in the laboratory following a chemical activation procedure described in a previous research [14]. In addition, a commercially available activated carbon was included as a reference material to enable comparative evaluation of adsorption performance. The feed gas streams were prepared using high-purity gases supplied in cylinders by Messer Austria GmbH, including hydrogen (99.999 vol%), methane (99.5 vol%), and helium (99.999 vol%).
2.2. Characterization
In a previous study [14], the focus was on the chemical activation process used for preparing the adsorbent materials. In the present work, characterization is directed toward the activated carbon samples after conducting pressure swing adsorption (PSA) experiments, to evaluate potential structural and surface modifications induced by high-pressure operation.
Surface morphology was analyzed with an FEI Quanta FEG 250 scanning electron microscope. Initially, the samples were mounted on aluminum stubs using carbon tape and coated with gold to secure the material and enhance surface conductivity and electron reflection. The coating was carried out under vacuum in a Q150T S sputter coater for approximately 10 minutes at a current intensity of 30 mA.
The elemental composition was further analyzed by energy-dispersive X-ray spectroscopy (EDX) using the TEAM software.
Raman spectra were obtained using a WITec Alpha 300 RSA system equipped with a 532 nm laser, where each spectrum was recorded with an integration time of 5 s, and 60 accumulations were averaged per measurement. A laser power of 10 mW and a 10× objective lens were used for all analyses.
Fourier-transform infrared (FT-IR) spectroscopy was used to identify surface functional groups, including hydroxyl, carbonyl, and aldehyde functionalities in all three samples. Measurements were conducted with a VERTEX 70 spectrometer over the wavenumber range of 4000–400 cm−1. For each sample, 64 scans were collected at a spectral resolution of 2 cm−1 to ensure high signal quality and reproducibility.
Textural properties of the adsorbents, including surface area and pore structure parameters, were taken from the previously reported study [14], where detailed characterization data are provided.
2.3. Adsorption and Desorption System
In order to evaluate the adsorption performance of the activated biochars, several adsorption and desorption experiments were performed in a laboratory-scale PSA system. Both biomass-derived activated biochar samples, birch and pine, were tested by comparing the results with a commercial adsorbent. The analysis focused primarily on adsorption breakthrough behavior and the amount of methane adsorbed by the adsorbent in relation to the total adsorbent mass. This single-column adsorption unit was originally designed to simulate the different gas compositions at different pressures as they can be found in a depleted natural gas reservoir used for the seasonal storage of energy in the form of hydrogen. Therefore, it is equipped with a high-pressure mixing line to create different gas mixtures at different pressures on-site. Adsorption experiments were carried out in a fixed-bed stainless steel column with an inner diameter of 2,2 cm and a usable height of 8,8 cm, and the filling covers a volume of approximately 33,5 cm3. The hydrogen and methane gas mixtures were fed through the column, and the system pressure was regulated using a back pressure valve (BPV1), as illustrated in Figure 1. The gas composition in the off-gas is analyzed with a 990 MicroGC gas chromatograph by Agilent Technologies, which has been calibrated with three-component gas mixtures containing H2, CH4, and N2. The MicroGC is connected to the off-gas line via a capillary line, and a sample is sucked into the device approximately every 2,73 minutes. The remaining outlet gas was directed to a flare for combustion. Hydrogen, methane, and helium were supplied from high-purity gas cylinders. The flow rates were set on the mass flow controllers (MFC1- He, MFC2- CH4, MFC3- H2), with the total operating flow rate maintained at 500 sccm/min. All measurements were performed at ambient temperature, approximately 23 °C.
2.4. Adsorption Breakthrough and Desorption Experiments
Before each experiment, the system was purged with helium to remove residual oxygen and any previously adsorbed species. The operating pressure for the selected stage was then established by setting the appropriate position of the back-pressure valve (BPV1), after which the system pressure was increased using pure hydrogen.
Once the target pressure was reached, the ball valves at the inlet (BV5) and outlet (BV7) of the adsorption column were closed, directing the gas flow only through bypass line 2, which corresponds to the mixing line. This bypass line is mainly used to create a steady-state mixing ratio between hydrogen and methane according to the respective pressure level before adsorption is initiated. Adsorption was started by simultaneously opening valves BV5 and BV7, followed immediately by closing BV6 to redirect the gas flow through the adsorption column. After approximately 30 to 55 minutes, depending on the experimental parameters, the methane feed concentration is set to zero on the MFC 2, and desorption is initiated manually by slowly opening the back pressure valve to decrease the system pressure to ambient conditions. The experiment was concluded once the methane concentration in the outlet gas was lower than 0.1%, after which the system was purged again with helium. The representative stages at which the experiments are performed are shown in Table 1.
For all stages, the total inlet flow rate was maintained at 500 sccm/min, while the methane–hydrogen mixing ratio was controlled by adjusting the individual volumetric flow rates of the respective mass flow controllers. As an illustrative example, in Stage III, where methane constituted 30 vol% of the feed, the hydrogen and methane flow rates were set to 350 sccm/min and 150 sccm/min, respectively.
To proceed with further evaluation, the data obtained from the MicroGC needs to undergo several post-processing steps. The data exported from the MicroGC includes the proportion of each respective component in vol%. These values must first be converted into concentrations based on the operating conditions.
In the equation 1, the is the concentration of CH4 at the stage under operating conditions at a given time and the total concentration of the gas mixture under operating conditions and under the assumption that the gas mixture behaves like an ideal gas. This is important because the off-gas is analyzed at ambient pressure and temperature, and the adsorption takes place at different conditions that vary throughout the stages. is then calculated as follows, where is the universal gas constant, the temperature under operating conditions, which is the same for all stages, and the operating pressure at the respective stage, according to Table 1.
The calculated concentrations values over time are then approximated through a two-parameter fit of the so-called logistic function as presented by [25]. The amount of substance adsorbed during the experiments is then equal to:
where is the total flow rate under operating conditions, the feed concentration of methane under operating conditions at the respective stage , the time at which the breakthrough curve is horizontal again and the breakthrough curve approximated by the logistic function:
The fit-parameters are and , where is the threshold point and an indicator for the steepness of the function at the time [25]. is calculated by applying the ideal gas law to convert between the flow rate adjusted on the MFCs in (; , ) and the operating conditions:
After integration, the final equation reads:
These values can be calculated for every activated carbon sample at every stage and divided by the total adsorbent mass :
The partial pressure of the respective stage and sample is calculated with the measured share of methane recorded during the experiment:
3. Results
3.1. Textural Properties of the Activated Carbons
The textural characteristics of the activated carbons selected for the adsorption experiments from the previous study are summarized and presented in Table 2 [14]. Two biomass-derived activated carbons, prepared from pine and birch and activated at 800 °C using a KOH impregnation ratio of 3:1, were chosen based on their comparatively high surface areas and pore volumes. These materials are compared with a commercial activated carbon used as a benchmark.
The pine- and birch-derived activated carbons exhibit BET surface areas of 1416 and 1398 m2 g−1, respectively, both exceeding that of the commercial material (1023 m2 g−1). Higher total pore volumes are observed for the laboratory-prepared carbons, reaching 0.59 cm3 g−1 for pine and 0.58 cm3 g−1 for birch, compared to 0.44 cm3 g−1 for the commercial sample. The average pore diameters are similar across all three materials, ranging from approximately 0.83–0.85 nm, indicating a predominantly microporous pore structure.
These textural properties provide the structural basis for evaluating methane adsorption and breakthrough behavior under high-pressure PSA conditions, which are discussed in the following sections.
3.2. Methane Breakthrough Behavior Under Different Pressures
For each operating stage, the breakthrough curves obtained during adsorption are presented in Figure 2 (a: Stage I, b: Stage II, and c: Stage III). For the birch- and pine-derived activated carbons, one representative breakthrough curve is shown and compared with the corresponding curve of the commercial adsorbent. Repeated experiments demonstrated reproducible results in the adsorption measurements, particularly with respect to the breakthrough profiles, which showed consistent behavior across all runs.
In addition, all data sets were recorded using the same sampling interval of 2.73 min, while their respective time stamps are asynchronous. When adsorption is initiated at a certain time, it is possible that the injection of the sample into the MicroGC’s column takes place within the next 2.73 minutes, which means that the detection by the GC is only a snapshot at a given time. During post-processing, this systematic offset between the actual start of adsorption and the first GC measurement was accounted for. Because of the measurement interval of ~ 2,73 min, the exact breakthrough times t_b cannot be determined, as the real breakthrough occurs somewhere between t_b + t_lag, where .
In total, 16 adsorption experiments were performed. For each pressure stage, one for the commercial adsorbent and two for the birch and pine samples, to ensure comparability and consistency of the data, particularly for the laboratory-prepared activated carbon. The breakthrough curves indicate that as operating pressures increase and methane concentrations in the feed gas decrease, the time it takes for breakthrough to occur also increases. This is expected because the partial pressure of the adsorbate in the feed gas decreases.
The results are presented in Table 3, Table 4 and Table 5. For each sample, the mass of the adsorbent that fits inside the column was weighed, and the bulk density was estimated to occupy approximately 88% of the total reactor volume.
This estimation takes into account that the reactor is equipped with netting and fiberglass wool at both the entrance and exit to prevent any potential entry of activated carbon abrasion into the piping system. These additional components cover the entire inner column diameter of 2.2 cm and have a height of approximately 6 mm each. As a result, the “usable height” of the column is 8.8 cm, as described at the beginning of Chapter 2.3.
As shown in Figure 2, a clear shift of the breakthrough curves toward longer times is observed with increasing operating pressure from Stage III (25 bar) to Stage I (50 bar). The breakthrough times listed in Table 6 increase systematically with pressure for all three adsorbents, which is attributed to the decrease in methane concentration in the feed gas at higher operating pressures, resulting in a lower adsorbate partial pressure and delayed breakthrough. Such behavior is consistent with adsorption theory and previously reported studies on high-pressure gas adsorption.
A comparison among the three activated carbons reveals distinct differences in breakthrough performance. At Stage I (50 bar), both pine- and birch-derived activated carbons exhibit slightly longer breakthrough times than the commercial activated carbon, representing acceptable adsorption performance under high-pressure conditions. In contrast, at lower pressures (Stages II and III), the commercial activated carbon shows longer breakthrough times than the biomass-derived materials. This behavior can be partially explained by differences in bulk density. The bulk densities of the pine (0.297 g·cm−3) and birch (0.247 g·cm−3) activated carbons are nearly half that of the commercial activated carbon (0.538 g·cm−3), resulting in a lower mass of adsorbent per unit bed volume.
Among the laboratory-prepared adsorbents, pine-derived activated carbon shows consistently strong breakthrough performance across all pressure stages, which motivated its selection for extended cyclic stability testing and subsequent structural analysis by Raman spectroscopy in section 3.4.4. Despite the lower adsorbent mass of the pine-derived activated carbon in the column, a slightly longer breakthrough time is observed at Stage I, which is consistent with its higher gravimetric adsorption capacity. At Stages II and III, the pine-derived activated carbon exhibits shorter breakthrough times compared to the commercial activated carbon. This does not indicate lower adsorption capacity but rather reflects the combined effects of lower bulk density, reduced adsorbent mass, and earlier bed saturation. It should be noted that, due to the discrete sampling interval of the MicroGC, the breakthrough times are associated with higher uncertainty.
Figure 3 presents the methane adsorption isotherms for commercial, pine-derived, and birch-derived activated carbons, together with the corresponding Langmuir model fits. The adsorbed amount increases steadily with increasing methane partial pressure for all materials, indicating typical physisorption behavior dominated by micropore filling.
At all pressures, the biomass-derived activated carbons show significantly higher gravimetric methane uptake than the commercial activated carbon, which is consistent with their higher BET surface areas and well-developed microporous structures. In contrast, the commercial activated carbon exhibits a lower adsorption capacity over the entire pressure range. The experimental data are well described by the Langmuir model, suggesting that methane adsorption proceeds primarily via monolayer adsorption on energetically similar adsorption sites.
The bulk density of the pine and birch samples is nearly half that of commercial activated carbon. As a result, the amount of substance adsorbed per unit mass of the adsorbent is significantly higher when using these samples compared to the commercial adsorbent. In all experiments, the volume of the column filled with adsorbent was kept constant. Therefore, in Figure 3, the amount of substance adsorbed is plotted on the y-axis without relating it to the total mass of the adsorbent.
3.3. Desorption
During the desorption step shown in Figure 4 (a: Stage I, b: Stage II, and c: Stage III), the overall shape of the concentration profiles remained comparable; however, slight variations were observed between individual desorption curves. These differences arise from the manual control of the depressurization step, resulting in small variations in the pressure release rate (Δp/Δt) between experiments.
A comparison among the three activated carbons reveals that methane desorption from the pine-derived activated carbon occurs more rapidly than from the birch-derived and commercial activated carbons. As demonstrated by the adsorption breakthrough times (Table 6), the pine-derived activated carbon exhibits shorter breakthrough times, particularly at lower pressures, indicating a lower methane loading at the end of the adsorption step. In addition, due to its lower bulk density (0.297 g cm−3), a smaller mass of pine-derived activated carbon is present in the column compared to the commercial material (0.538 g cm−3). Consequently, the total amount of methane stored in the adsorber at the onset of desorption is lowest for the pine-derived activated carbon, leading to a steeper decline in Y/Yα and shorter apparent desorption times.
In contrast, the commercial activated carbon retains a larger methane inventory due to its longer breakthrough times and higher bulk density, resulting in more extended desorption profiles. The birch-derived activated carbon exhibits intermediate behavior, consistent with its adsorption capacity and bulk density. Importantly, all investigated materials exhibit nearly complete methane removal during desorption, confirming that adsorption under the applied conditions is predominantly physisorptive and reversible, demonstrating good regenerability of both commercial and biomass-derived activated carbons.
3.4. Post PSA Structural and Surface Characterization
3.4.1. Morphological Stability and Elemental Composition After PSA (SEM-EDX)
Scanning electron microscopy was employed to gain further insight into the surface morphology of the activated carbons before and after exposure to high-pressure PSA adsorption–desorption experiments, as presented in Figure 5.
The fresh commercial activated carbon exhibits a heterogeneous surface morphology with irregularly shaped particles and a relatively compact morphology, as shown in Figure 5-a. After PSA operation (Figure 5-b), the commercial material shows roughening and particle fragmentation. However, the overall particle morphology and structural framework remain intact, indicating no severe structural collapse under the applied operating conditions. The fresh birch-derived activated carbon (Figure 5-c) exhibits a well-developed porous structure characterized by extensive and interconnected cavities. This reflects the intrinsic cellular structure of the biomass precursor and the effects of chemical activation. Following adsorption–desorption experiments in Figure 5-d, the porous structure is largely preserved, with no evidence of pore blockage, cracking, or collapse. Minor surface changes are detected, suggesting good resistance to mechanical stress during pressurization and depressurization.
The pine-derived fresh activated carbon (Figure 5-e), shows a highly open and hierarchical pore structure in its fresh state, characterized by large cavities and thin pore walls. Comparison of the fresh and post-PSA samples (Figure 5-f), shows that this morphology remains unchanged after high-pressure operation. There is no significant deformation of pores or structural degradation observed, indicating that the open pore structure of pine activated carbon remains mechanically stable under the tested PSA conditions.
SEM observation shows that all three types of activated carbon maintain their morphological stability during PSA operation.
The elemental composition of the activated carbons, both before and after the PSA operation, was analyzed using EDX analysis to complement the morphological observations obtained from SEM. The results indicate that PSA cycling does not lead to significant changes in elemental composition, as presented in Table 7.
3.4.2. Structural Features of Activated Carbons After PSA (Raman Spectroscopy)
Raman spectroscopy was used to assess the material structure and defect characteristics of the activated carbons before [14], and after the PSA operation. Typically, structural defects and disordered carbon is presented in Figure 6-a, displaying the characteristic D band at approximately 1333 cm−1 , and the G band at approximately 1591 cm−1, representing the graphitized structure of carbon[27,28,29]. To assess the degree of structural disorder, the intensity ratio ID/IG of the D and G bands was calculated and summarized in Figure 6-b.
The fresh commercial activated carbon (S1) exhibits an ID/IG ratio of 1.08, reflecting a predominantly disordered carbon structure typical of activated carbons [30]. After conducting the PSA cycling experiments with the commercial activated carbon (S2), it was observed that the ratio increased to 1.24, indicating an increase in defect density or a slight reduction in structural order. This change suggests that repeated high-pressure adsorption-desorption cycles may introduce additional lattice distortions or microstructural defects within the commercial carbon.
In contrast, the fresh birch-derived activated carbon (S3) shows a lower ID/IG ratio of 0.95, indicating a comparatively higher degree of structural order. After PSA operation (S4), the ratio increases moderately to 1.04, pointing to a limited increase in disorder. A similar trend is observed for the pine-derived activated carbon, where the ID/IG ratio increases from 0.97 for the fresh sample (S5) to 1.02 after PSA cycling (S6).
The smaller changes observed in the ID/IG ratio of biomass-derived carbons, compared to commercial material, indicate a higher resistance to structural disorder during high-pressure operations, supporting their suitability for PSA conditions.
3.4.3. Surface Chemistry Evolution After PSA (FTIR Spectroscopy)
The surface chemistry of the commercial and biomass-derived activated carbons before and after PSA operations was examined by FTIR spectroscopy, as presented in Figure 7. The analysis provides insight into the chemical stability of the adsorbents under high-pressure adsorption–desorption conditions and complements the structural information obtained from SEM, EDX, and Raman spectroscopy.
All fresh activated carbons exhibit a broad absorption band in the range of 3600–3200 cm−1, which is attributed to O–H stretching vibrations associated with surface hydroxyl groups and typically adsorbed moisture. This band is typical for activated carbons and reflects the presence of oxygen-containing surface functionalities, which support effective adsorption[31,32]. After the PSA experiments, the intensity of this band decreases slightly across all samples. This suggests that weakly bound surface species are partially removed during the pressurization conditions and helium purging, rather than indicating chemical degradation of the carbon framework. Weak bands observed around 2300–2100 cm−1 can be attributed to C≡C stretching vibrations or to adsorbed gas species, which are more pronounced in the fresh samples [33]. These features become less distinct after PSA operation, suggesting effective desorption and surface cleaning during the experimental process. In the region between 1700 and 1500 cm−1, absorption bands corresponding to C=O stretching (carbonyl, carboxyl) and aromatic C=C vibrations are evident for all activated carbons [34]. These bands remain present after PSA experiments, with only minor changes in intensity, indicating that the aromatic carbon structure and oxygen-containing functional groups are largely preserved. Bands in the range of 1200–1000 cm−1, associated with C–O stretching vibrations of ether, or ester groups, are observed in both fresh and used samples [20,31]. The persistence of these features after PSA cycling confirms that the surface chemistry of the activated carbons remains stable under the investigated operating conditions.
No new absorption bands appear after PSA operation, and no significant peak shifts are detected, supporting the absence of chemical modification or surface oxidation induced by high-pressure adsorption–desorption cycles.
3.4.4. Cyclic Stability and Structural Evolution of Pine-Derived Activated Carbon Under PSA Operation
Pine-derived activated carbon was chosen for extended cyclic testing due to its textural properties, specifically its highest specific surface area among the activated carbons tested. To evaluate the adsorption and structural stability of the pine-derived activated carbon under high-pressure operation, eight consecutive breakthrough experiments were conducted at 25 bar (Stage IV conditions). These experiments were performed in a cyclic adsorption–desorption manner, and after every two cycles, one sample was withdrawn for Raman spectroscopy in order to monitor potential structural changes.
In addition, two breakthrough experiments obtained during the initial screening phase (Figure 2) were included for comparative purposes in the breakthrough analysis. As a result, a total of ten breakthrough curves were included in the statistical evaluation and presented in Figure 8, while Raman analysis was conducted on samples obtained from the eight consecutive cyclic experiments as shown in Figure 9.
To quantitatively assess the reproducibility and stability of the adsorption performance, the ten breakthrough curves were statistically processed using MATLAB. Because the experimental curves were recorded at slightly different time intervals, a synchronization procedure was first applied. A uniform time axis ranging from 0 to 26 minutes was generated, and each individual breakthrough curve was interpolated onto this common grid. For each curve, 300 equally spaced time steps were calculated, compared to the original 9–10 experimentally measured data points within the same time range. This interpolation enabled a direct point-by-point comparison of all ten experiments. At every single time step, the script calculated the mean value between the 10 curves and the standard deviation. The solid line represents the mean breakthrough curve and the shaded region corresponds to ±1 standard deviation (±1σ). The narrow width of the shaded band over the entire breakthrough region demonstrates excellent reproducibility of the adsorption behavior. The low statistical dispersion indicates that no significant performance degradation or progressive loss of adsorption capacity occurred during repeated high-pressure cycling. The script calculated the t_50 point of the mean value curve, t_50 which is the time at which the system reached 50% of its capacity. The calculated value of t50≈13.24 min confirms the consistent adsorption capacity of the pine-derived activated carbon across all ten cycles. The absence of any systematic shift in the breakthrough front suggests that the material maintains stable adsorption and pore accessibility under repeated pressurization and regeneration.
The Raman spectra of all samples exhibit the characteristic D band at approximately 1333 cm−1 and G band at around 1591 cm−1, corresponding to disordered sp2 carbon and graphitic sp2 domains, as shown in Figure 9-a.
A direct comparison of the spectra reveals no significant peak shifts, band broadening, indicating that no major graphitization, structural collapse, or formation of highly ordered carbon phases occurred during repeated PSA operation. The evolution of the intensity ratio ID/IG , presented in Figure 9-b, provides a slight but systematic increase in ID/IG from 1.0309 (after II cycles) to 1.0486 (after VIII cycles). The magnitude of this increase is small (< 2% relative change), indicating that the structural modifications are subtle and do not translate into measurable deterioration of adsorption performance, as evidenced by the stable breakthrough curves and constant t50 value. Thus, while Raman spectroscopy detects minor microstructural evolution at the atomic scale, these changes do not significantly affect the macroscopic adsorption behavior.
In summary, the combined breakthrough and Raman analyses demonstrate that pine-derived activated carbon maintains both adsorption capacity and structural integrity under repeated high-pressure PSA cycling. The material exhibits high mechanical and chemical stability, with only negligible increases in structural disorder after multiple adsorption–desorption cycles.
4. Discussion
The performance of activated carbons in pressure swing adsorption (PSA) processes is governed by a combination of pore structure, adsorption–desorption behavior, and structural stability under cyclic operation. The present study enables a systematic comparison of commercial and biomass-derived activated carbons under high-pressure conditions relevant to hydrogen purification.
Chemical activation of pine- and birch-derived precursors with potassium hydroxide at 800 °C resulted in carbons with well-developed porous structures, as reflected by their high BET surface areas. The pine- and birch-derived materials reached surface areas of 1416 and 1398 m2 g−1, respectively, exceeding that of the commercial activated carbon (1023 m2 g−1). Such values are characteristic of KOH-activated lignocellulosic carbons and indicate a high degree of microporosity, which is favorable for methane adsorption.
Under high-pressure conditions, the biomass-derived activated carbons exhibit higher gravimetric methane uptakes than the commercial reference material. At 50 bar, methane uptake reaches up to 10.5 mol kg−1 for the birch-derived carbon, compared to 5.30 mol kg−1 for the commercial activated carbon. However, adsorption performance must also be evaluated in terms of volumetric efficiency. The pine- and birch-derived carbons exhibit substantially lower bulk densities (approximately 0.25–0.30 g cm−3) compared to the commercial activated carbon (approximately 0.54 g cm−3).
Post-PSA characterization provides further insight into material stability. Raman spectroscopy reveals only minor changes in the carbon structure of the pine- and birch-derived activated carbons after repeated cycling, indicating that no severe defect formation or graphitization occurs under the applied conditions. The slight increase in the ID/IG ratio suggests limited surface-level structural rearrangements rather than bulk degradation. These findings are supported by morphological observations, which show that the biomass-derived carbons retain their particle integrity after cycling. In contrast, the commercial activated carbon exhibits more pronounced signs of structural degradation, indicating a lower resistance to mechanical stress during cyclic high-pressure operation. Complementary FTIR analysis confirms that surface functional groups remain largely unchanged for all materials, demonstrating chemical stability under the investigated PSA conditions.
Overall, the results demonstrate that pine- and birch-derived activated carbons, despite being produced from low-grade biomass precursors, exhibit adsorption performance and cyclic stability comparable to commercial activated carbon, making them promising candidates for PSA-based hydrogen purification.
Author Contributions
Conceptualization, Selma Kuloglija; methodology, Selma Kuloglija and Alexander Windbacher; validation, Selma Kuloglija, Alexander Windbacher and Christian Jordan; formal analysis, Selma Kuloglija, Alexander Windbacher and Daniela Tomasetig; investigation, Selma Kuloglija, Alexander Windbacher and Ilias-Maximilian Kropik; resources, Winter Franz, Nastaran Abbaspour and Michael Harasek; data curation, Selma Kuloglija and Alexander Windbacher; writing—original draft preparation, Selma Kuloglija; writing—review and editing, Alexander Windbacher, Christian Jordan, Amal El Gohary Ahmed, and Michael Harsek; visualization, Selma Kuloglija; supervision, Christian Jordan and Michael Harasek. All authors have read and agreed to the published version of the manuscript.” Please turn to the CRediT taxonomy for the term explanation. Authorship must be limited to those who have contributed substantially to the work reported.
Funding
This research received no external funding.
Data Availability Statement
Data will be made available on request.
Acknowledgments
This research was funded by the Austrian Science Fund (FWF) I 5404-N. The author has applied a CC BY public copyright license to any author accepted manuscript version arising from this submission. The authors would like to thank TU Wien and USTEM for granting access to the analytical instruments used to measure the properties of the activated carbon. The authors acknowledge TU Wien Bibliothek for financial support through its Open Access Funding Programme. During the preparation of this work, Selma Kuloglija utilized Grammarly to enhance readability and language in the introduction. The authors would also like to thank Yousry Afifi for his valuable discussion and help.
Conflicts of Interest
The authors declare no conflicts of interest.
Abbreviations
The following abbreviations are used in this manuscript:
| PSA | Pressure swing adsorption |
| TSA | Temperature swing adsorption |
| VSA | Vacuum swing adsorption |
| AC | Activated carbon |
| CH4 | Methane |
| H2 | Hydrogen |
| CO2 | Carbon dioxide |
| KOH | Potassium hydroxide |
| ZnCl2 | Zinc chloride |
| H3PO4 | Phosphoric acid |
| SEM | Scanning electron microscope |
| EDX | Energy-dispersive X-ray spectroscopy |
| FT-IR | Fourier-transform infrared spectroscopy |
| BET | Brunauer–Emmett–Teller |
| BPV | Back pressure valve |
| BV | Ball valve |
| MFC | Mass flow controller |
| OP | Operating condition |
References
- Algburi, S. The green hydrogen role in the global energy transformations. Renewable and Sustainable Energy Transition 2025, vol. 8. [Google Scholar] [CrossRef]
- Liao, Y.; Wang, Y.; Lv, M.; Xue, W.; Chen, Z. Study on the impact of hydrogen-natural gas mixing on working cycles of underground gas storage. Int J Hydrogen Energy 2025, vol. 122, 258–269. [Google Scholar] [CrossRef]
- Kalman, V.; Makaruk, A.; Engin, E.; Balla, A.; Harasek, M. Simulation of Hydrogen-Methane Separation with Pressure Swing Adsorption. In Computer Aided Chemical Engineering; Elsevier B.V., 2024; vol. 53, pp. 931–936. [Google Scholar] [CrossRef]
- Shen, Y.; Shi, W.; Zhang, D.; Na, P.; Tang, Z. Recovery of light hydrocarbons from natural gas by vacuum pressure swing adsorption process. J Nat Gas Sci Eng 2019, vol. 68. [Google Scholar] [CrossRef]
- Grande, C. A. PSA Technology for H2 Separation. In Hydrogen Science and Engineering: Materials, Processes, Systems and Technology; Wiley-VCH Verlag, 2016; vol. 1, pp. 491–508. [Google Scholar] [CrossRef]
- Bangar, S. Temperature Swing Adsorption Using Amine Impregnated Adsorbent for CO2 Capture.
- Kalman, V.; Voigt, J.; Jordan, C.; Harasek, M. Hydrogen Purification by Pressure Swing Adsorption: High-Pressure PSA Performance in Recovery from Seasonal Storage. Sustainability (Switzerland) 2022, vol. 14(no. 21). [Google Scholar] [CrossRef]
- Malek, A.; Farooq, S. Hydrogen purification from refinery fuel gas by pressure swing adsorption. AIChE Journal 1998, vol. 44(no. 9), 1985–1992. [Google Scholar] [CrossRef]
- Knaebel, S. P.; Ko, D.; Biegler, L. T. Simulation and Optimization of a Pressure Swing Adsorption System: Recovering Hydrogen from Methane; 2005. [Google Scholar]
- Py, X.; Goetz, V.; Plantard, G. Activated carbons textural optimization for gas storage processes. Chemical Engineering and Processing: Process Intensification 2008, vol. 47(no. 3), 308–315. [Google Scholar] [CrossRef]
- Zhao, W. Activated carbons with appropriate micropore size distribution for hydrogen adsorption. Int J Hydrogen Energy 2011, vol. 36(no. 9), 5431–5434. [Google Scholar] [CrossRef]
- Luberti, M.; Ahn, H. Review of Polybed pressure swing adsorption for hydrogen purification. In Elsevier Ltd; 05 Mar 2022. [Google Scholar] [CrossRef]
- Ioannidou; Zabaniotou, A. Agricultural residues as precursors for activated carbon production-A review. 2007. [Google Scholar] [CrossRef]
- Kuloglija, S. Isotherms and kinetics of CO2 adsorption on biochar-based activated carbon for sustainable climate solutions. Sep Purif Technol 2026, vol. 382. [Google Scholar] [CrossRef]
- Nandi, R.; Jha, M. K.; Guchhait, S. K.; Sutradhar, D.; Yadav, S. Impact of KOH Activation on Rice Husk Derived Porous Activated Carbon for Carbon Capture at Flue Gas alike Temperatures with High CO2/N2 Selectivity. ACS Omega 2023, vol. 8(no. 5), 4802–4812. [Google Scholar] [CrossRef]
- Ello, A.S.; De Souza, L. K. C.; Trokourey, A.; Jaroniec, M. Development of microporous carbons for CO2 capture by KOH activation of African palm shells. Journal of CO2 Utilization 2013, vol. 2, 35–38. [Google Scholar] [CrossRef]
- Shamsudin, K.; Abdullah, A.; Idris, I.; Gobi, S.; Othman, M. R. Hydrogen purification from binary syngas by PSA with pressure equalization using microporous palm kernel shell activated carbon. Fuel 2019, vol. 253, 722–730. [Google Scholar] [CrossRef]
- Li, D.; Ma, T.; Zhang, R.; Tian, Y.; Qiao, Y. Preparation of porous carbons with high low-pressure CO2uptake by KOH activation of rice husk char. Fuel 2015, vol. 139, 68–70. [Google Scholar] [CrossRef]
- Hayashi, Jun’ichi; Kazehaya, A.; Muroyama, K.; Watkinson, A. P. Preparation of activated carbon from lignin by chemical activation. 2000. [Google Scholar] [CrossRef]
- Kuloglija, S. Sustainable Activated Carbon Production from Sunflower Seeds via Chemical Activation. Sustainability 2025, vol. 17(no. 6), 2568. [Google Scholar] [CrossRef]
- Hidayat, A.; Sutrisno, B. Comparison on pore development of activated carbon produced by chemical and physical activation from palm empty fruit bunch. In IOP Conference Series: Materials Science and Engineering; Institute of Physics Publishing, Dec 2016. [Google Scholar] [CrossRef]
- Duran-Jimenez, G. Single-step preparation of activated carbons from pine wood, olive stones and nutshells by KOH and microwaves: Influence of ultra-microporous for high CO2 capture. Chemical Engineering Journal 2024, vol. 499. [Google Scholar] [CrossRef]
- Pimentel, C. H.; Díaz-Fernández, L.; Gómez-Díaz, D.; Freire, M. S.; González-Álvarez, J. Separation of CO2 using biochar and KOH and ZnCl2 activated carbons derived from pine sawdust. J Environ Chem Eng 2023, vol. 11(no. 6). [Google Scholar] [CrossRef]
- Kuznetsov, B. N.; Chesnokov, N. V.; Tsyganova, S. I.; Mikova, N. M.; Ivanov, I. P.; Ivanchenko, N. M. Porous carbon materials produced by the chemical activation of birch wood. Solid Fuel Chemistry 2016, vol. 50(no. 1), 23–30. [Google Scholar] [CrossRef]
- Kruschke, K. Overview of the Generalized Linear Model. In in Doing Bayesian Data Analysis; Elsevier, 2015; pp. 419–447. [Google Scholar] [CrossRef]
- Rani, P.; Trivedi, L.; Gaurav, S. S.; Singh, A.; Shukla, G. Green synthesis of silver nanoparticles by Cassytha filiformis L. Extract and its characterization. In in Materials Today: Proceedings; Elsevier Ltd., 2020; pp. 3510–3516. [Google Scholar] [CrossRef]
- Hastuti, E.; Subhan, A.; Puspitasari, D. Synthesis of activated carbon derived from chicken feather for Li-ion batteries through chemical and physical activation process. Mater Renew Sustain Energy 2021, vol. 10(no. 3). [Google Scholar] [CrossRef]
- Tang, Z. Ultra-microporous biochar-based carbon adsorbents by a facile chemical activation strategy for high-performance CO2 adsorption. Fuel Processing Technology 2023, vol. 241. [Google Scholar] [CrossRef]
- Li. Insights into CO2 adsorption on KOH-activated biochars derived from the mixed sewage sludge and pine sawdust. Science of the Total Environment 2022, vol. 826. [Google Scholar] [CrossRef] [PubMed]
- Vali, P. Bamboo and coconut shell based activated carbon: A Raman spectroscopic study. Mater Chem Phys 2024, vol. 318. [Google Scholar] [CrossRef]
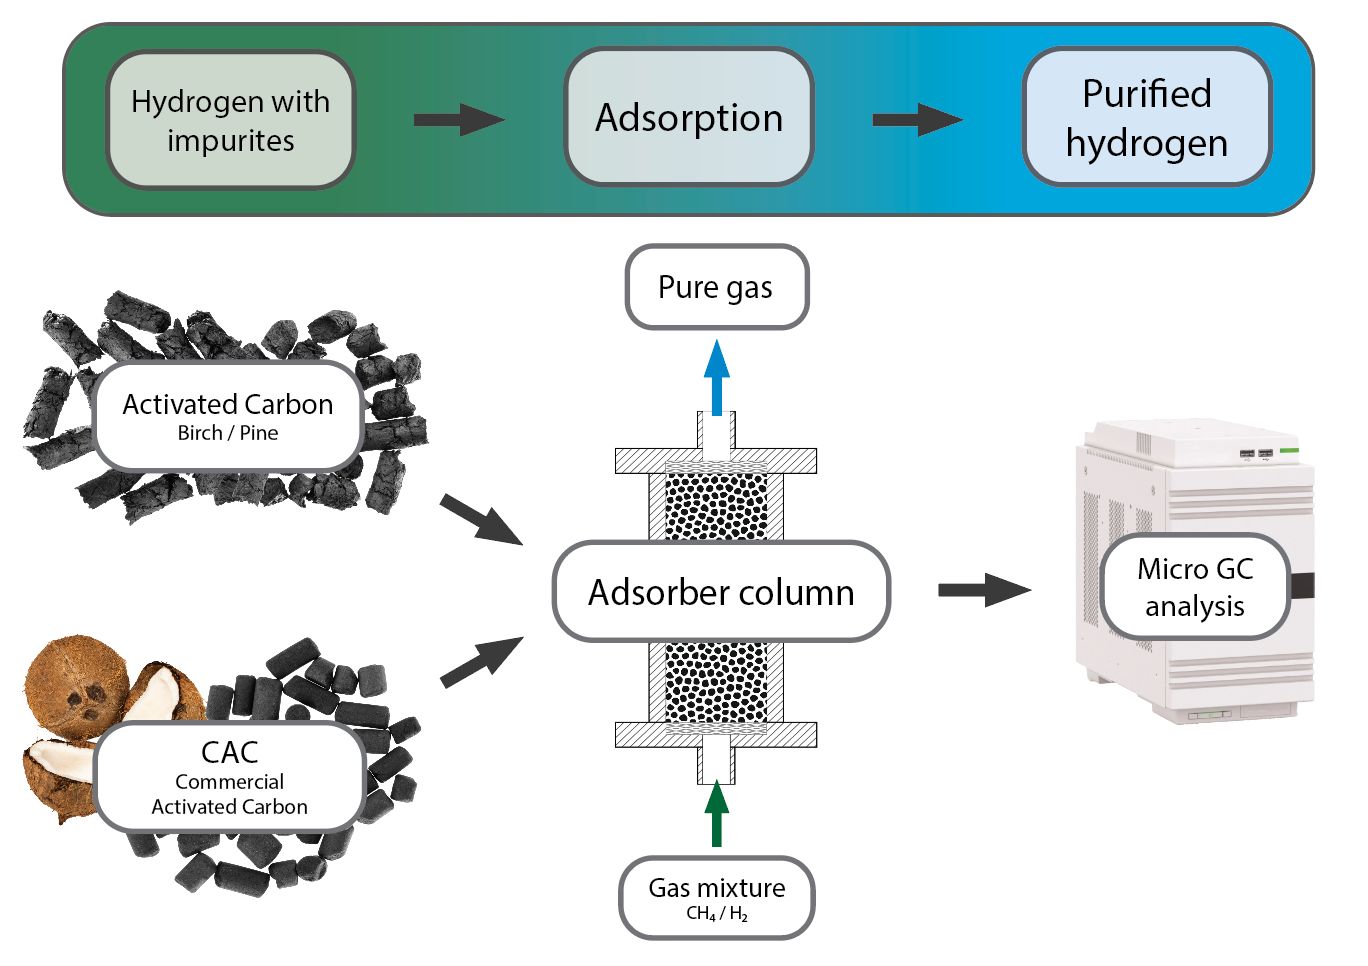
Figure 1.
Schematic diagram of the laboratory-scale pressure swing adsorption (PSA) system used for methane adsorption experiments. The setup includes mass flow controllers (MFC1–MFC3), a high-pressure gas mixing line, a fixed-bed adsorption column, ball valves (BV1–BV7), a back-pressure valve (BPV1), and an online gas analysis system.

Figure 2.
CH4 adsorption breakthrough curves on commercial activated carbon, birch-derived activated carbon, and pine-derived activated carbon at a) Stage I, b) Stage II, and c) Stage III.
Figure 2.
CH4 adsorption breakthrough curves on commercial activated carbon, birch-derived activated carbon, and pine-derived activated carbon at a) Stage I, b) Stage II, and c) Stage III.

Figure 3.
Methane adsorption uptake as a function of methane partial pressure.

Figure 4.
Desorption curves on commercial activated carbon, birch-derived activated carbon, and pine-derived activated carbon at a) Stage I, b) Stage II, and c) Stage III.
Figure 4.
Desorption curves on commercial activated carbon, birch-derived activated carbon, and pine-derived activated carbon at a) Stage I, b) Stage II, and c) Stage III.

Figure 5.
Scanning electron micrographs (SEM) of a) Commercial activated carbon fresh; b) Commercial activated carbon after PSA conditions; c) Birch activated carbon fresh; d) Birch activated carbon after PSA conditions; e) Pine activated carbon fresh; and f) Pine activated carbon after PSA conditions.

Figure 6.
a) Raman spectra of fresh and used samples; b) ID/IG peak area ratio of different samples: S1- Commercial activated carbon fresh, S2- Commercial activated carbon after PSA experiments, S3- Birch activated carbon fresh, S4- Birch activated carbon after PSA experiments, S5- Pine activated carbon fresh, S6- Pine activated carbon after PSA experiments.

Figure 7.
FTIR spectra of commercial activated carbon, and activated carbon derived from birch and pine, both fresh and after PSA treatment.
Figure 7.
FTIR spectra of commercial activated carbon, and activated carbon derived from birch and pine, both fresh and after PSA treatment.

Figure 8.
Cyclic breakthrough reproducibility of pine-derived activated carbon at 25 bar.

Figure 9.
Raman spectra of pine-derived activated carbon after conducting eight cycles of experiments at 25 bar pressure.
Figure 9.
Raman spectra of pine-derived activated carbon after conducting eight cycles of experiments at 25 bar pressure.


Table 1.
Gas compositions at the respective stages.
| Stage | Pressure | Share of methane (nominal) | Average share of methane (measured) |
|---|---|---|---|
| - | bar | vol% | vol% |
| I | 50 | 10 | 12.3 |
| II | 35 | 20 | 23.9 |
| III | 25 | 30 | 33.9 |
Table 2.
BET surface area, total pore volume, and average pore diameter of laboratory-prepared carbons at 800 °C with an impregnation ratio of 3:1, compared with commercial activated carbon.
Table 2.
BET surface area, total pore volume, and average pore diameter of laboratory-prepared carbons at 800 °C with an impregnation ratio of 3:1, compared with commercial activated carbon.
| Sample | SBET (m2/g) | VT (cm3/g) | Dpd (nm) |
|---|---|---|---|
| Pine 3:1 (800 °C) | 1416 | 0.59 | 0.84 |
| Birch 3:1 (800 °C) | 1398 | 0.58 | 0.83 |
| Commercial activated carbon | 1023 | 0.44 | 0.85 |
Table 3.
Calculated data for commercial activated carbon.
| - | bar | vol% | kPa | mol | g | mol/kg | g/cm3 |
| I | 50 | 12.26 | 613 | 0.095 | 18.0 | 5.30 | 0.538 |
| II | 35 | 23.91 | 837 | 0.120 | 6.65 | ||
| III | 25 | 33.19 | 830 | 0.117 | 6.50 |
Table 4.
Calculated data for birch derived activated carbon.
| - | bar | vol% | kPa | mol | g | mol/kg | g/cm3 |
| I | 50 | 12.24 | 612 | 0.087 | 8.25 | 10.5 | 0.247 |
| II | 35 | 23.84 | 834 | 0.107 | 13.2 | ||
| III | 25 | 34.24 | 856 | 0.102 | 12.4 |
Table 5.
Calculated data for pine derived activated carbon.
| - | bar | vol% | kPa | mol | g | mol/kg | g/cm3 |
| I | 50 | 12.26 | 613 | 0.084 | 9.94 | 8.46 | 0.297 |
| II | 35 | 23.80 | 833 | 0.100 | 10.1 | ||
| III | 25 | 34.21 | 855 | 0.100 | 10.0 |
Table 6.
Breakthrough times for fixed volumes of commercial activated carbon, birch derived activated carbon, and pine derived activated carbon.
Table 6.
Breakthrough times for fixed volumes of commercial activated carbon, birch derived activated carbon, and pine derived activated carbon.
|
Commercial (xgram) |
Birch (xgram) |
Pine (xgram) |
|
| - | tb(min) | tb(min) | tb(min) |
| I | 25.5 | 26.6 | 26.7 |
| II | 17.2 | 15.1 | 16.2 |
| III | 12.4 | 10.9 | 9.8 |
Table 7.
Elemental composition of commercial, birch-derived, and pine-derived activated carbons before and after PSA operation determined by EDX analysis.
Table 7.
Elemental composition of commercial, birch-derived, and pine-derived activated carbons before and after PSA operation determined by EDX analysis.
| Element | Commercial AC- fresh | Commercial AC- after PSA | Birch AC- fresh | Birch AC- after PSA | Pine AC- fresh | Pine AC- after PSA | ||
| Weight % | ||||||||
| C K | 90.3 | 93.0 | 94.5 | 89.5 | 93.5 | 90.4 | ||
| O K | 4.2 | 4.9 | 5.6 | 5.3 | 5.0 | 8.8 | ||
| Na K | 0.5 | - | - | - | - | - | ||
| Mg K | 0.4 | - | - | - | - | - | ||
| Al K | 1.0 | - | - | - | 0.3 | 0.2 | ||
| Si K | 1.3 | 1.0 | - | - | 0.1 | - | ||
| K K | 1.1 | 0.9 | - | - | 0.4 | - | ||
| Ca K | 1.2 | - | - | - | - | - | ||
| P K | - | - | - | 1.1 | 0.2 | 0.3 | ||
| Cl K | - | - | - | - | 0.4 | - | ||
Disclaimer/Publisher’s Note: The statements, opinions and data contained in all publications are solely those of the individual author(s) and contributor(s) and not of MDPI and/or the editor(s). MDPI and/or the editor(s) disclaim responsibility for any injury to people or property resulting from any ideas, methods, instructions or products referred to in the content. |
© 2026 by the authors. Licensee MDPI, Basel, Switzerland. This article is an open access article distributed under the terms and conditions of the Creative Commons Attribution (CC BY) license (http://creativecommons.org/licenses/by/4.0/).
Copyright: This open access article is published under a Creative Commons CC BY 4.0 license, which permit the free download, distribution, and reuse, provided that the author and preprint are cited in any reuse.


