
Submitted:
04 March 2026
Posted:
05 March 2026
You are already at the latest version
Abstract
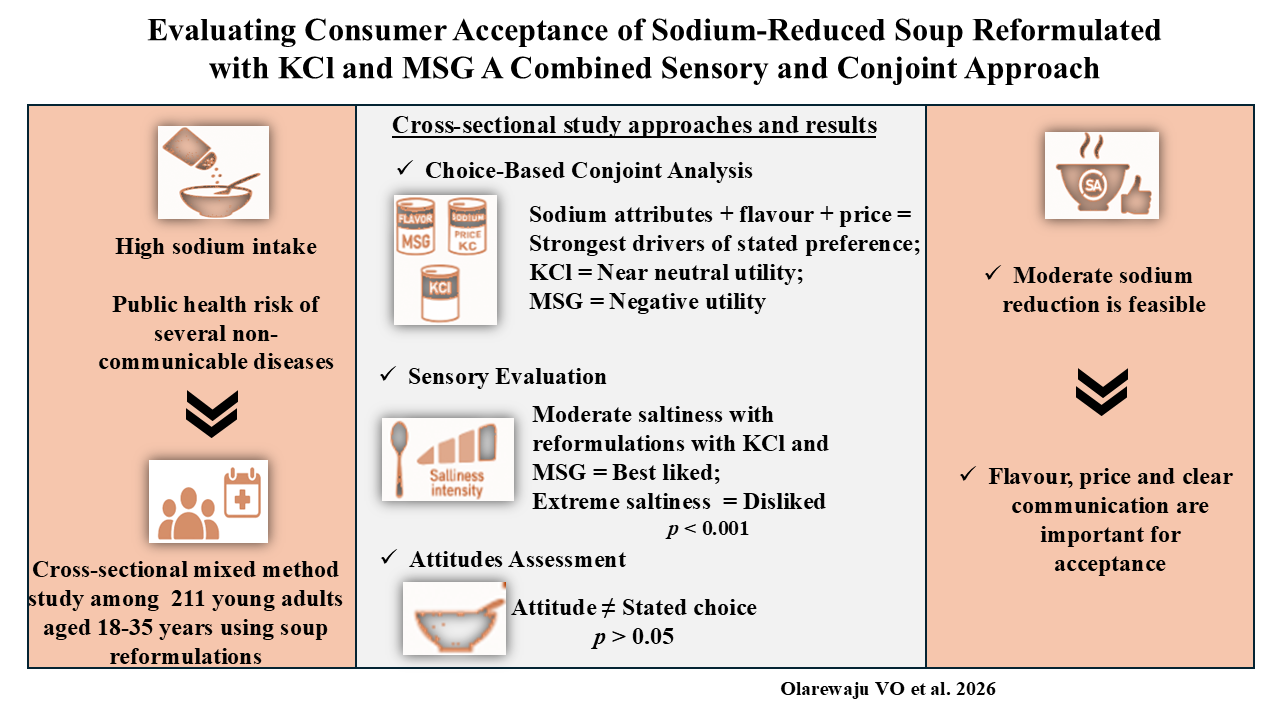
Excess sodium intake is a growing public health concern in Malaysia. Reformulation using potassium chloride (KCl) and monosodium glutamate (MSG) offers a potential strategy to reduce sodium while maintaining palatability, although consumer responses to these ingredients remain mixed. This study examined young adults’ preferences for sodium-reduced canned soup and evaluated how flavour, sodium information, price, and additive-related cues influence stated choice, alongside sensory evaluation of sodium-reduced formulations. A cross-sectional mixed-method study was conducted among 211 Malaysian young adults. Participants completed a choice-based conjoint (CBC) experiment comprising six hypothetical purchase tasks that varied across seven product attributes. Multinomial logit models estimated part worth utilities and attribute importance. Sensory evaluation was conducted in a controlled environment using the generalised Labelled Magnitude Scale (gLMS) and Labelled Affective Magnitude (LAM) scale to assess saltiness intensity and pleasantness across soup formulations. Sodium-related attributes accounted for approximately 36% of stated decision weight, with sodium reduction percentage and flavour emerging as the strongest drivers of stated choice. Moderately sodium-reduced formulations incorporating KCl and MSG achieved favourable sensory ratings. Young adults’ acceptance of sodium-reduced soup is shaped primarily by flavour, sodium cues, and affordability. Sensory findings support the feasibility of sodium reduction using KCl and MSG without compromising palatability.
Keywords:
sodium reduction
; conjoint analysis
; sensory evaluation
; KCl
; MSG
; consumer acceptance
; young adults
; Malaysia
1. Introduction
Excess sodium intake remains a major and preventable contributor to global non-communicable diseases, particularly hypertension and cardiovascular disease. The World Health Organisation (WHO) estimates that high sodium consumption is responsible for approximately 1.89 million deaths annually, making sodium reduction one of the most cost-effective public health interventions worldwide [1,2]. Although sodium is essential for physiological roles in nerve transmission and fluid balance, habitual intake in most populations far exceeds recommended limits. Globally, average sodium intake is estimated at over 4,300 mg/day, more than twice the WHO guideline of 2,000 mg/day [2,3].
Malaysia mirrors these global trends. National surveys indicate that three-quarters (75%) of Malaysian adults consume sodium in excess of recommended levels (mean intake: 7.3 g/day), driven largely by processed foods, sauces, and condiments embedded in everyday diets [4,5]. Although awareness of sodium-related health risks is increasing, meaningful behavioural change remains limited. Cultural preferences for savoury, flavour-dense foods and the widespread availability of high-sodium convenience products continue to reinforce excessive intake [6]. These dynamics highlight a persistent gap between nutritional awareness and actual food choice, suggesting that sensory appeal, price, and familiarity often outweigh health considerations. Young adults are a particularly relevant group, as they are frequent consumers of packaged foods and are still shaping long-term dietary habits; yet their choices tend to be guided more by taste preferences and affordability than by health motivations [7].
Given the scale of the problem, food reformulation has gained momentum as a strategy to reduce sodium intake at the population level. One widely adopted approach involves the partial replacement of sodium chloride (NaCl) with alternative salts or flavour enhancers, notably potassium chloride (KCl) and monosodium glutamate (MSG) [8,9]. Evidence from clinical trials and modelling studies demonstrates that salt substitutes incorporating KCl can reduce blood pressure and are cost-effective in diverse populations [10,11].
Technologically, KCl has been successfully incorporated into soups, sauces, and processed foods, achieving sodium reductions of 25–50% while maintaining acceptable sensory quality at moderate substitution levels [12,13] . However, higher levels of KCl can introduce bitter or metallic off-flavours, requiring careful optimisation [14]. MSG, another commonly used flavour enhancer, can effectively compensate for reduced sodium by enhancing umami perception, often improving overall palatability. Despite being recognised as safe by major regulatory authorities, including the U.S. Food and Drug Administration, MSG remains subject to persistent consumer stigma and misinformation, particularly in some cultural contexts, including of parts of Asian [15,16]. These negative perceptions may influence acceptance of sodium-reduced products that rely on MSG for sensory optimisation, even when nutritional benefits are evident. Consequently, successful sodium reduction strategies require not only technological and sensory feasibility but also a nuanced understanding of consumer preferences, perceptual trade-offs and responses to labelling cues, including the signalling of additives such as KCl and MSG [14].
To capture these complex decision processes, choice-based conjoint (CBC) analysis provides a robust method for examining how consumers make trade-offs among product attributes such as flavour, sodium content, price, and labelling claims [17,18]. However, CBC captures hypothetical, label-based preferences, whereas food acceptance ultimately depends on sensory experience. In sodium-reduced foods, perceptions of saltiness, umami, and overall pleasantness are especially critical because substitution with KCl or MSG may alter taste profiles [19]. Sensory evaluation directly measures these experiential responses offering important context for interpreting stated preferences. Integrating CBC with sensory testing therefore provides a more comprehensive understanding of consumer acceptance, particularly in culturally diverse settings where taste expectations, health beliefs, and economic considerations intersect. Despite the relevance of these issues, evidence on how Malaysian young adults evaluate sodium-reduction strategies, particularly those involving KCl and MSG, remains limited [20,21].
To address this gap, the present study integrates CBC analysis with controlled sensory evaluation and attitudinal assessment to examine young adults’ preferences, perceptions, and acceptance of sodium-reduced soup formulations. Specifically, the study aimed to: (1) quantify the relative importance of flavour, sodium content, sodium reduction claims, price, MSG, KCl, and product labelling using CBC analysis; (2) assess whether anthropometric and body composition measures are associated with preference patterns; (3) evaluate attitudes toward sodium intake and their relationship with attribute-level utilities; and (4) examine saltiness perception and hedonic acceptance of sodium-reduced soup formulations containing NaCl, KCl, and MSG, and contextualise these sensory results alongside stated preferences from the CBC experiment. The findings aim to inform food industry reformulation strategies and public health initiatives supporting sodium reduction among young adults in Malaysia.
2. Materials and Methods
2.1. Study Design and Population
This study employed a cross-sectional mixed-method experimental design integrating CBC experiment with in-person consumer sensory evaluation. Both components were completed by the same participants within a single study session, enabling examination of hypothetical stated choices alongside direct sensory responses to sodium-reduced soup reformulations. and attitudinal assessment to examine young adults’ preference, perception and acceptance of sodium-reduced soup reformulations.
The CBC experiment simulated realistic multi-attribute food choice decisions for canned soup, whereas the sensory evaluation assessed perceived saltiness intensity and hedonic pleasantness of reformulated soup samples. Attitudinal and anthropometric measurements were collected to contextualise variability in both stated preferences and sensory responses. This study formed part of a broader interventional project on salt reduction in institutional food environments [22].
Participants were recruited between May and July 2025 using convenience sampling among students and staff at Sunway University and Sunway College, Malaysia. Recruitment channels included institutional email announcements, social media postings, and peer-to-peer dissemination.
2.2. Eligibility Criteria and Ethical Approval
Eligible individuals were aged ≥18 years, able to understand English, and willing to consume soup samples. Exclusion criteria included: self-reported taste or smell disorders, food allergies, pregnancy or breastfeeding, regular smoking or vaping, active respiratory illness, or unwillingness to consume salty foods. Ethical approval was granted by the Sunway University Research Ethics Committee (2024/REC0216). All participants received written information about the study and provided documented informed consent.
2.3. Sample Size
Sample size for the CBC was guided by the Johnson–Orme heuristic (where c, the largest number of attribute levels = 4; t, the number of tasks per respondent = 6; and a, the number of alternatives per task = 3), yielding a minimum of 111. A target of 200 participants was set to increase precision, allow latent class choice model (LCCM), and align with CBC methodological recommendations [23,24]. All participants completing the CBC experiment also completed the sensory evaluation tasks.
2.4. Choice-Based Conjoint Experiment
2.4.1. Experimental Design
The CBC experiment was grounded in random utility theory, enabling estimation of attribute-level utilities and trade-offs that approximate real-world food purchase decision-making [18]. Participants completed the CBC tasks on-site using the Opinion X online survey platform prior to the sensory evaluation in a single session.
Each participant responded to six choice tasks, each presenting three hypothetical soup alternatives plus a “none of the above” opt-out option, included to reflect realistic consumer behaviours. One combination of the choices that was presented to the participants is shown in (Figure 1). Attribute order and profile presentation were fully randomised.
2.4.2. Attributes and Levels
Seven attributes were selected based on prior literature and Malaysian market products: flavour, sodium content, sodium reduction claim, MSG, KCl, price, and labelling claims (Table 1). “Sodium content” (absolute mg/serving) and “sodium reduction” (relative % reduction) were intentionally treated as independent attributes to examine consumer response to these distinct nutritional labelling formats. The 0 mg sodium level served as an estimation anchor rather than a commercially realistic product. A full factorial design (1,296 profiles) was reduced using a D-efficient fractional factorial design, ensuring orthogonality and efficient main-effects estimation [25].
2.5. Consumer Sensory Evaluation
After completing the CBC tasks, participants proceeded directly to the sensory component. The sensory evaluation was designed to complement CBC findings by assessing perceived saltiness and hedonic pleasantness of sodium-reduced and salt-substituted soup formulations.
2.5.1. Testing Procedure and Environment
The study proceeded as follows: (1) A recruitment booth was set up in a high foot-traffic area on campus; (2) Potential participants were approached, informed about the study purpose, and screened for eligibility; (3) Eligible participants provided written informed consent and completed an online questionnaire (OpinionX) covering socio-demographics and salt practices; (4) Participants then underwent sensory evaluation of salty taste stimuli and (5) Anthropometric and body composition measurements were collected.
Sensory testing was conducted in a quiet, temperature-controlled room with partitioned tables to minimize visual and social influence [26]. Sessions were scheduled between 10:00 – 12pm and 2:00 - 4:00 pm. Before tasting, participants rinsed their mouths with room-temperature filtered water. A single-blind design was employed, meaning participants were unaware of the identity or composition of the samples. Soup formulations were presented in a randomized, fully counterbalanced order to reduce order effects and sensory adaptation. A mandatory 60-second interval between samples was enforced, accompanied by rinses with filtered water [27]. Upon completion, each participant received a token of appreciation worth MYR 10 (~USD 2.30). The entire procedure lasted approximately 40 minutes per participant.
2.5.2. gLMS and LAM Scale Administration
Participants received verbal and written instructions in English prior to completing two rating scales. The orientation included an explanation of the semantic anchors, guided practice in marking the scales by placing a horizontal line on paper versions, and emphasis on the use of the “greatest imaginable” reference point. Saltiness intensity (hereafter referred to as intensity perception) was assessed using the generalized Labeled Magnitude Scale [28], while hedonic response to the perceived saltiness (hereafter referred to as pleasantness rating) was measured using the Labeled Affective Magnitude (LAM) scale [29].
2.5.3. Preparation of NaCl Solutions
Three suprathreshold NaCl solutions (0.01, 0.1, 1 M), were prepared by dissolving appropriate amounts of chemical-grade NaCl (Sigma, MO) in distilled water [27]. Solutions were freshly prepared and stored under refrigeration for no longer than three days prior to each testing session. For sensory evaluation, 15-ml aliquots of each solution were served at room temperature in white disposable paper cups, labeled with three-digit codes.
2.5.4. Soup Preparation and Formulations
A sodium-free soup base was prepared by dissolving 220 g of Rempah Sup/Soup Powder (Faiza Marketing Sdn. Bhd., Malaysia; containing coriander, cumin, white pepper, cardamom, cloves, star anise; 0 mg Na) in 4.5 cups of water. This mixture was boiled in 54 cups of water on a hot plate (Pensonic Sdn. Bhd., Malaysia) at maximum heat for 20 min. Green onions (25 g), potatoes (25 g), and carrots (25 g) were then added and cooked at medium heat (“5”) for 10 min. The base was filtered twice, cooled to room temperature for 2 hours, refrigerated at 3 ± 2 °C, and stored in 5 L containers until use. Five soup formulations were prepared by adding chemical-grade NaCl (Sigma, MO), KCl (Sigma, MO), and food-grade MSG (Ajinomoto, Malaysia): control (no NaCl, KCl, MSG added), low NaCl (84.375 mM), high NaCl (112.5 mM), low NaCl (84.375 mM) + high KCl (15.525 mM) + high MSG (15.525 mM), and low NaCl (84.375 mM) + low KCl (7.7663 mM) + low MSG (7.763 mM). The concentrations of NaCl, KCl, and MSG used in the soups were selected based on previously optimized combinations established in aqueous solutions. These levels were determined through sensory evaluations conducted with a trained panel (n = 10), following the protocols of a previous study [14]. The soups were prepared in batches, warmed to 40 °C in a water bath, stored in insulated flasks, and served as 15 ml portions in coded white disposable paper cups labelled with three-digit codes to the participants [30]. Participants rated each sample’s saltiness intensity (gLMS) and pleasantness (LAM) on paper scales.
2.6. Data Collection Procedures
2.6.1. Questionnaire
The questionnaire was administered through the OpinionX platform and included participant screening, informed consent, sociodemographic items, attitude measures, and choice-based conjoint (CBC) tasks. The first section focused on sociodemographic characteristics and salt use habits, with questions on age, sex, Malaysian citizenship, ethnicity, highest educational level, and monthly household income.
2.6.2. Attitudes Toward Sodium Intake
Attitudes toward general health, sodium intake, and potassium intake were assessed using a validated ten-item framework adapted from a previous study [14]. The scale was designed to capture broad beliefs and intentions rather than actual behavior under trade-off conditions. Six items were scored on a 7-point Likert scale, ranging from strongly disagree to strongly agree (total score range: 6–42), and categorized into poor, moderate, or good attitudes. The remaining four items captured self-reported salt-related practices, including: frequency of food preparation at home (never, hardly ever, sometimes, regularly, always); timing of salt use during home cooking (none, during, or after cooking); frequency of adding salt before tasting food (never, sometimes, always); frequency of adding salt after tasting food (never, sometimes, always); and frequency of adding salt when eating out or consuming takeout (never, sometimes, always) (Table S1). These items were analyzed descriptively.
2.6.3. Anthropometric and Body Composition Measurements
We collected participants’ anthropometric and body composition data. This included height, assessed using a wall-mounted stadiometer; the waist and hip circumferences were measured with a measuring tape. Measurements were taken at the midpoint between the lower edge of the least palpable rib and the top of the iliac crest for the waist, and at the widest part of the buttocks for the hips [31]. The waist-hip ratio (WHR) and waist-to-height ratio (WHtR) were calculated by dividing the waist circumference by the hip circumference and height, respectively. Body composition parameters were obtained using a bioelectrical impedance scale (Omron HBF-375), which provided measurements for weight, body mass index (BMI; kg/m²), total body fat (TBF; %), visceral fat level (VFL; %), subcutaneous fat (SF; %), skeletal muscle percentage (SM; %), and resting metabolic rate (RM; kcal). The cutoff values used to define body indices were as follows: overweight: ≥23 kg/m² [32], obesity: ≥27.5 kg/m²; high TBF: ≥20% for males or ≥30% for females; VFL: ≥10%; high SF: ≥35.8% for males or ≥28% for females [33]; High WC: ≥90 cm for males or ≥80 cm for females; high WHR: ≥0.90 for males or ≥0.85 for females (World Health Organisation, 2011); and high WHtR: ≥0.50 [34]. BP and pulse measurements were taken twice following a 10-minute rest period, using the Omron SEM-1 automated BP monitor on the right arm.
2.7. Statistical Analysis
All statistical analyses were conducted using R v4.2.0.
2.7.1. Sociodemographic and Attitude Analyses
Associations between attitude category (poor, moderate, good) and categorical sociodemographic variables were evaluated using Pearson’s chi-square tests. For continuous or ordinal variables, including choice-based conjoint (CBC) stated preference scores and age, associations with attitude category were assessed using the Kruskal–Wallis test.
2.7.2. Conjoint Analysis
Part-worth utilities were estimated using a multinomial logit (MNL) model. Categorical variables were dummy-coded; sodium content and price were modelled as continuous variables. Attribute importance was derived from utility ranges.
Preference heterogeneity was examined using LCCMs estimated via Expectation-Maximisation algorithm, with utilities modelled using MNL kernels. Predictor variables for class membership included sociodemographic, anthropometric (dummy-coded), and standardised attitudinal scores. Models with C=2 and C=3 classes were evaluated. Model fit indices (LL, AIC, BIC) were reported. The CBC estimates reflect stated preferences, not actual purchasing behaviour; findings were interpreted accordingly.
2.7.3. Sensory Data Analysis
Sensory outcomes, generalized Labeled Magnitude Scale (gLMS) intensity and Labeled Affective Magnitude (LAM) pleasantness, were analyzed using repeated-measures ANOVA. Post hoc comparisons were conducted with Tukey’s tests to identify significant differences among means, with statistical significance set at p ≤ 0.05. In addition, correlations between sensory intensity and pleasantness ratings were examined using Spearman’s rank correlation.
3. Results
3.1. Descriptive Profile of the Study Population
A total of 211 participants from Sunway University and Sunway College completed both the online CBC tasks and the in-person sensory evaluation. The sample consisted predominantly of females (64.9%) and young adults aged 18–25 years (94.7%), reflecting the convenience sampling frame. More than half of participants identified as Chinese (59.7%), and nearly half were enrolled in pre-university programmes (48.3%). Most respondents were unmarried (97.6%) and reported M20 monthly household income bracket (MYR 4,851–10,970) (44.5%). Anthropometric measures indicated that a high proportion of participants had a normal WHR (86.9 %) and normal SM (61.4 %) (Table 2).
3.2. Attitudes Towards Sodium Intake
Self-reported salt use attitudes indicated that the majority of participants added salt during cooking (83.9%). Nearly half reported sometimes adding salt before tasting food (48.8%), while a larger proportion reported sometimes adding salt after tasting (69.2%). When eating out or consuming takeout, most participants reported either never (40.3%) or sometimes (50.2%) adding salt to their food. Attitudes toward sodium reduction were distributed as follows: poor (20.8%), moderate (52.6%), and good (26.5%). Univariate analyses did not reveal statistically significant associations between attitude category and sex, age, education level, or household income nor meaningfully differentiate stated preferences in the CBC experiment (p > 0.05)
3.3. Relative Importance of Attributes and Attribute-Level Preference
3.3.1. Attribute Importance
CBC results indicated that no single attribute dominated decisions, but several contributed meaningfully to stated choices within this sample. Sodium-related attributes collectively accounted for approximately 36% of total importance, with sodium reduction percentage (21.1%) and absolute sodium content (15.2%) both influencing selections. Flavour (18.1%), labelling claims (15.4%), and price (15.2%) contributed comparably. Additive-related attributes, including MSG (8.1%) and KCl (7.4%), showed smaller relative effects. These results indicate that participants considered multiple product features when making hypothetical choices. Given the nature of stated-preference experiments, these findings represent expressed trade-offs in an online task rather than behavioural purchasing decisions (Figure 2).
3.3.2. Part-Worth Utilities
Mean part-worth utilities (Figure 3, Table 3). showed that certain attribute levels were directionally preferred within the sample. Cream of mushroom flavour, lower absolute sodium levels (0 mg), and lower prices (RM6) displayed positive utilities. Conversely, tomato flavour, higher sodium content (800 mg), and the RM10 price point were associated with negative utilities. Utilities for sodium reduction percentage claims (10–25%) were small and close to zero, suggesting that relative reduction labels exerted a weaker influence compared with absolute sodium values in this stated-choice context. MSG was associated with a negative utility, whereas KCl values were close to neutral. These utilities should be interpreted as indicators of relative preference within the constraints of the CBC design rather than as predictors of real-world choice behaviour.
3.3.3. Latent Class Choice Model (LCCM)
Both two- and three-class latent class models were estimated to explore heterogeneity in stated preferences. The three-class model showed improved log-likelihood and AIC values compared with the two-class model, while the BIC favoured the more parsimonious two-class solution, C=3 (LL = −1344.7; AIC = 2837.4 ) vs. C=2 (LL = −1385.4; AIC = 2842.8). Given the small improvement in fit and clearer substantive interpretation, the three-class solution was retained for exploratory purposes. The three segments represented: Class 1 (40.2%): health-oriented preferences, placing greater weight on sodium information Class 2 (29.6%): additive-sensitive segment, with stronger reactions to MSG and KCl Class 3 (30.1%): flavour-oriented group, attaching relatively greater importance to sensory cues. Predictors such as ethnicity, education level, body composition indicators, and selected attitudinal scores were associated with class membership (Table S2). These associations should be viewed as exploratory patterns rather than confirmatory determinants, given the limited generalizability of the study sample and the stated-preference nature of the CBC design.
3.4. Saltiness Intensity Perception and Pleasantness Ratings
Repeated-measures ANOVA indicated statistically significant differences across soup formulations for both perceived saltiness intensity (F = 262.80, p < 0.001) and pleasantness (F = 56.31, p < 0.001). These effects remained significant following post hoc Tukey’s tests. As expected, formulations containing higher NaCl concentrations produced stronger saltiness perceptions. Pleasantness ratings did not vary linearly with saltiness; instead, moderate saltiness levels, including formulations incorporating partial replacement with KCl and MSG, tended to receive higher hedonic ratings. Extremely salty samples were perceived as intensely salty but not preferred, suggesting a divergence between intensity perception and hedonic liking at high concentration levels (Figure 4).
Correlation analysis (Spearman ρ = 0.30, p < 0.001) indicated a moderate positive association between saltiness intensity and pleasantness overall, with stronger alignment observed at moderate intensity levels. The highest-salt formulation showed weak monotonicity, consistent with reduced liking at extreme intensities (Figure S1). Detailed regression analyses of demographic and body composition correlates have been reported previously [35].
4. Discussion
This study integrated choice-based conjoint analysis, sensory evaluation, and attitudinal assessment, to explore how young adults respond to sodium-reduced soup formulations and related product cues. The combined approach allowed exploration of how nutritional information, flavour attributes, and additives inform hypothetical product selection, while sensory testing provided complementary insight into the hedonic feasibility of sodium-reduction strategies under controlled tasting conditions. Because the sensory evaluation focused specifically on saltiness intensity and pleasantness, not full product acceptability, these findings should be interpreted as evidence of sensory feasibility, rather than as direct indicators of real-world consumption or market behaviour.
Attitudes toward sodium intake
Attitudes toward sodium intake did not meaningfully differentiate stated preferences in the CBC experiment, nor were they strongly patterned along sociodemographic characteristics. Although ethnicity showed a nominal association with attitude category, this did not remain significant after false-discovery-rate correction. These findings align with the well-documented attitude–behaviour gap, wherein stated health motivations do not consistently translate into choice behaviour under trade-off conditions [36]. This underscores the importance of structural approaches, such as stealth reformulation, clear labelling formats, and price parity, in facilitating healthier choices without depending exclusively on individual motivation.
Influence of sodium information, flavour and price on stated choice
Across attributes examined in the CBC experiment, sodium-related information accounted for a substantial proportion of stated decision weight. Young adults appeared responsive to both relative sodium-reduction claims and absolute sodium levels, suggesting that multiple forms of nutritional information are integrated when evaluating packaged foods. This aligns with broader evidence that nutrition labelling influences health-oriented product choices among younger consumers, although responsiveness varies by format and familiarity [37]. Given the simulated nature of CBC choice tasks, these findings reflect expressed preferences under hypothetical trade-off conditions rather than purchasing behaviour.
Flavour remained a strong determinant of stated preference, consistent with longstanding evidence that sensory expectations anchor food evaluation, even in the context of health-motivated reformulation [14,38,39]. The observed preference for cream-based flavours, particularly cream of mushroom, may reflect familiarity and exposure within this specific demographic rather than broader Malaysian preferences [40,41]. Price also exerted a meaningful influence, with clear preference for the lowest price point. This aligns with research showing that affordability strongly shapes food choice among young adults [42,43,44], highlighting potential barriers to acceptance of reformulated products if they are priced at a premium.
Compared with these dominant cues, MSG and KCl exerted smaller influences on stated choice. The negative utility for MSG is consistent with reported negative perceptions in some consumer groups, while the near-neutral response to KCl may reflect limited familiarity [14]. These findings suggest that additive-related cues are less influential during initial product evaluation than flavour, sodium information, and price.
Role of preference heterogeneity
The latent class choice model (LCCM) provided additional insight into heterogeneity in stated preferences within the sample. Although exploratory in nature, the three-class solution suggested the presence of distinct orientation patterns: a health-oriented segment that placed greater weight on sodium information, an additive-sensitive segment responsive to MSG and KCl cues, and a flavour-oriented segment driven primarily by sensory expectations. These patterns highlight that responses to sodium-reduction strategies are not uniform, even within a relatively demographically homogeneous cohort. However, given the convenience sampling frame and stated-preference design, these subgroup structures should be interpreted cautiously and validated in more diverse populations.
Limited role of anthropometric characteristics
Anthropometric and body composition measures, including BMI, adiposity indices, and central obesity markers, were not meaningfully associated with CBC-derived preference patterns. This is consistent with evidence that objective health risk indicators are weak predictors of nutrition-related decision-making in young adult populations, whose choices are more strongly shaped by sensory appeal and convenience [45]. As such, physiological risk factors associated with sodium intake did not translate into distinct stated preferences within this sample.
Sensory perception and hedonic response
Sensory evaluation demonstrated that moderately salty formulations, including those incorporating partial replacement of NaCl with KCl and MSG, generated higher hedonic ratings than either very low-salt or very high-salt samples. These results support prior findings that pleasantness does not increase linearly with saltiness intensity, and that moderate sodium levels often optimise liking [14]. Because testing was conducted in a controlled, single-session context using small sample volumes, these findings should be interpreted as sensory feasibility under test conditions, rather than predictors of habitual consumption.
A notable observation was the contrast between the negative utility for MSG in CBC and the positive sensory contribution of MSG in sodium-reduced formulations. This divergence suggests that MSG may enhance palatability at the point of consumption, yet its presence on a product label may trigger aversion, highlighting the importance of communication strategies or alternative flavour enhancement approaches when formulating sodium-reduced foods.
4.1. Public Health and Policy Implications
The combined CBC and sensory results suggest that sodium-reduced formulations can retain hedonic acceptability, particularly when moderating salt reductions with flavour-enhancing ingredients such as MSG or KCl. However, acceptance at the point of choice appears more sensitive to price, flavour expectations, and label-based sodium cues than to additive presence. These findings emphasise the value of sensory-optimised reformulation, transparent and user-friendly sodium labelling, and maintaining price competitiveness, in promoting sodium-reduced packaged foods. The neutral perception of KCl suggests potential for consumer acceptance, consistent with WHO recommendations promoting potassium-enriched salt substitutes as part of sodium reduction strategies.
4.2. Strengths and Limitations
A key strength of this study is the integration of stated preference methods and direct sensory evaluation, enabling complementary insights into how nutritional cues relate to hedonic responses. The use of latent class modelling further supports exploratory identification of heterogeneity in preference structures. Nevertheless, several limitations warrant consideration. The convenience sample, predominantly young, urban, and highly educated, limits generalisability. The CBC experiment reflects hypothetical decisions and may be affected by framing or social desirability biases. Sensory testing occurred in a controlled, single-session environment, which does not mirror typical eating contexts. Finally, the exploratory LCCM findings should not be interpreted as definitive segmentation but rather as indicative patterns requiring validation in broader populations. Future research should examine sodium-reduction strategies across more diverse demographic groups, test alternative communication strategies to improve understanding of sodium substitutes, and evaluate consumer responses to gradual or stepwise sodium reduction approaches.
5. Conclusions
By integrating sensory evaluation with choice-based conjoint analysis, this study demonstrates that moderately sodium-reduced soup formulations can achieve favourable sensory responses, while consumers’ stated choices remain strongly shaped by flavour expectations, price, and sodium information. These findings highlight the potential for sensory-optimised, transparently labelled, and affordably priced reformulated products to support sodium reduction initiatives among young adults in Malaysia and similar settings.
Supplementary Materials
The following supporting information can be downloaded at the website of this paper posted on Preprints.org. Table S1: Attitude to sodium intake items; Table S2: Class-Membership Model (Log-Odds Relative to Class 1 Baseline) — Selected Predictors; Figure S1: Scatter plot of perception and pleasantness ratings with LOESS trendline.
Author Contributions
Victoria Olubunmi Olarewaju: Writing – original draft, Visualisation, Validation, Investigation, Methodology, Formal analysis, Data curation. Muhamad Adam Razak Hamzah: Investigation, Data Curation. Janice Xin Yi Lim: Investigation, Data Curation. Joshica Kaur Gill Gurcharan Singh: Investigation. Yook Chin Chia: Supervision, Methodology. Yee-How Say: Writing – review & editing, Visualisation, Validation, Supervision, Project administration, Methodology, Funding acquisition, Formal analysis, Data curation, Conceptualisation. All authors have read and agreed to the published version of the manuscript.
Funding
This review was supported by the Sunway University Research Accelerator Grant Scheme (RAGS) No: GRTIN-RAG-DMS-16-2024. The funders had no role in the design of the study; in the collection, analyses, or interpretation of data; in the writing of the manuscript; or in the decision to publish the results.
Institutional Review Board Statement
The study was conducted in accordance with the Declaration of Helsinki and approved by the ethical review board of Sunway University – Sunway University Research Ethics Committee with the approval code: 2024/REC0216. Online written informed consent was obtained from all subjects involved in the study.
Informed Consent Statement
Informed consent was obtained from all subjects involved in the study.
Data Availability Statement
Given that this research is ongoing, the data is available from the corresponding author (YHS) upon reasonable request.
Acknowledgments
We acknowledge the support of our funder and extend sincere appreciation to all the volunteers whose participation made this study possible.
Conflicts of Interest
The authors declare that they have no known competing financial interests or personal relationships that could have appeared to influence the work reported in this paper.
References
- Pan American Health Organisation Mean Salt Intake in Adults Aged 25 Years and Older in the Americas, 1990-2019.; ENLACE Data Portal., 2023. https://www.paho.org/en/enlace/salt-intake.
- World Health Organisation Sodium Reduction; WHO: Geneva, 2023. https://www.who.int/news-room/fact-sheets/detail/sodium-reduction.
- World Health Organisation WHO Global Report on Sodium Intake Reduction; WHO, 2023. https://www.who.int/publications/i/item/9789240069985.
- Abdul Aziz, N.; Ambak, R.; Othman, F.; et al. Risk Factors Related with High Sodium Intake among Malaysian Adults: Findings from the Malaysian Community Salt Survey (MyCoSS) 2017–2018. J Health Popul Nutr 2021, 40, 14. [CrossRef]
- Institute of Public Health National Health and Morbidity Survey (NHMS) 2024 Nutrition-Key Findings; 2025. https://iku.nih.gov.my/images/nhms2024/key_findings_nhms2024.pdf.
- Ahmad, M.H.; Man, C.S.; Othman, F.; He, F.J.; Salleh, R.; Noor, N.S.M.; Kozil, W.N.K.W.; MacGregor, G.; Aris, T. High Sodium Food Consumption Pattern among Malaysian Population. J. Health Popul. Nutr. 2021, 40, 4. [CrossRef]
- Livingstone, K.M.; Lamb, K.E.; Abbott, G.; Worsley, T.; McNaughton, S.A. Ranking of Meal Preferences and Interactions with Demographic Characteristics: A Discrete Choice Experiment in Young Adults. Int. J. Behav. Nutr. Phys. Act. 2020, 17, 157. [CrossRef]
- De Man, W. Technical Brief Food Reformulation for Salt; Institute of Food Science and Technology (IFST), 2023. https://buff.ly/3yKmHCP.
- Tan, H.; Tan, T.; Easa, A.M. The Use of Salt Substitutes to Replace Sodium Chloride in Food Products: A Review. Int. J. Food Sci. Technol. 2022, 57, 6997–7007. [CrossRef]
- Jin, A.; Xie, W.; Wu, Y. Effect of Salt Reduction Interventions in Lowering Blood Pressure in Chinese Populations: A Systematic Review and Meta-Analysis of Randomized Controlled Trials. BMJ Open 2020, 10, e032941. [CrossRef]
- Taylor, C.; Hoek, A.C.; Deltetto, I.; Peacock, A.; Ha, D.T.P.; Sieburg, M.; Hoang, D.; Trieu, K.; Cobb, L.K.; Jan, S.; et al. The Cost-Effectiveness of Government Actions to Reduce Sodium Intake through Salt Substitutes in Vietnam. Arch. Public Health 2021, 79, 32. [CrossRef]
- Antúnez, L.; Giménez, A.; Alcaire, F.; Vidal, L.; Ares, G. Consumers’ Heterogeneity towards Salt Reduction: Insights from a Case Study with White Rice. Food Res. Int. 2019, 121, 48–56. [CrossRef]
- Gao, Z.; Liu, X.; Zhao, S.; et al. Effect of the Partial Substitution of NaCl with Blended KCl, MgCl2, and Arginine on Sensory Profiles and Storage Characteristics of Cooked Marinated Chicken. Food Meas. 17 5948–5958 2023, 17, 5948–5958. [CrossRef]
- Walker, J.C.; Dando, R. Sodium Replacement with KCl and MSG: Attitudes, Perception and Acceptance in Reduced Salt Soups. Foods 2023, 12, 2063. [CrossRef]
- Anca, A.; Anca, U.; Aristides, M.; George, M.; Demetrios, K.; Aris, V.; et al. Review of the Alleged Health Hazards of Monosodium Glutamate. Compr. Rev. Food Sci. Food Saf. 2020, 19, 2330–2330. [CrossRef]
- Food and Drug Administration. Monosodium Glutamate. Questions and Answers on Monosodium Glutamate (MSG); FDA, 2012. https://www.fda.gov/food/food-additives-petitions/questions-and-answers-monosodium-glutamate-msg?ct=40013.
- Green, P.; Srinivasan, V. Conjoint Analysis in Consumer Research: Issues and Outlook. J. Consum. Res. 1978, 5, 103–123. [CrossRef]
- Louviere, J.; Hensher, D.; Swait, J. Stated Choice Methods: Analysis and Application.; Cambridge University Press: Cambridge., 2000. [CrossRef]
- Feltrin, A.; Rios de Souza, V.; Saraiva, C.; Nunes, C.; Pinheiro, A. Sensory Study of Different Sodium Chloride Substitutes in Aqueous Solution. Int. J. Food Sci. Technol. 2014, 50, 730–735. [CrossRef]
- Cheong, S.M.; Ambak, R.; Othman, F.; He, F.J.; Salleh, R.; Mohd Sallehudin, S.; Palaniveloo, L.; Ganapathy, S.S. Knowledge, Perception, and Practice Related to Sodium Intake among Malaysian Adults: Findings from the Malaysian Community Salt Study (MyCoSS). J. Health Popul. Nutr. 2021, 40, 5. [CrossRef]
- Shahrir, S.; Abdul Manaf, M.; Mustapha, F.; Md. Isa, Z. Critical Review on Dietary Sodium Reduction Policies. IFRJ 2019, 26, 33–40.
- Chia, Y.; Say, Y.; Cheng, M.; Chung, F.; Lau, T.; Ooi, P. Reduction of Salt and Sugar Contents in Canteen Foods and Intakes By Students and Staff at a Malaysian Higher Education Institution: Protocol for a Mixed Methods Study JMIR Res Protoc. JMIR Res Protoc 2025, 14, e69610. [CrossRef]
- de Bekker-Grob, E.; Donkers, B.; Jonker, M.; Stolk, E. Sample Size Requirements for Discrete-Choice Experiments in Healthcare: A Practical Guide. Patient-Centered Outcomes Res. 2015, 8, 373–384. [CrossRef]
- Orme, B. Getting Started with Conjoint Analysis: Strategies for Product Design and Pricing Research; Fourth ed.; Research Publishers LLC.: Madison, WI, 2010. https://books.google.com.gh/books/about/Getting_Started_with_Conjoint_Analysis.html?id=u6ehQgAACAAJ&redir_esc=y.
- Street, D.; Burgess, L.; Viney, R.; Louviere, J. Designing Discrete Choice Experiments for Health Care. In: Ryan, M., Gerard, K., Amaya-Amaya, M. (Eds) Using Discrete Choice Experiments to Value Health and Health Care. The Economics of Non-Market Goods and Resources.; Springer.; Dordrecht., 2008; Vol. 11. [CrossRef]
- International Organization for Standardization Sensory Analysis — General Guidance for the Design of Test Rooms.; 2007. https://www.iso.org/obp/ui/en/#iso:std:iso:8589:ed-2:v1:en.
- Balan, S.N.; Chua, L.-S.; Choong, S.S.-Y.; Chang, Y.-F.; Say, Y.-H. Demographic Differences in the Saltiness Intensity Perception and Pleasantness Ratings of Salty Solutions and Foods among Malaysian Subjects. Food Qual. Prefer. 2013, 28, 154–160. [CrossRef]
- Bartoshuk, L.; Duffy, V.; Fast, K.; Green, B.; Prutkin, J.; Synder, D. Labeled Scales (e.g., Category, Likert, VAS) and Invalid across-Group Comparisons: What We Have Learned from Genetic Variation in Taste. Food Qual. Prefer. 2003, 14, 125-138. [CrossRef]
- Schutz, H.; Cardello, A. A Labeled Affective Magnitude (LAM) Scale for Assessing Food Liking/Disliking. J. Sens. Stud. 2001, 16, 117–159. [CrossRef]
- Hayes, J.; Sullivan, B.; Duffy, V. Explaining Variability in Sodium Intake through Oral Sensory Phenotype, Salt Sensation and Liking. Physiol Behav 2010, 100, 369–380. [CrossRef]
- World Health Organisation. Waist Circumference and Waist–Hip Ratio: Report of a WHO Expert Consultation; 2011. https://www.who.int/publications/i/item/9789241501491.
- World Health Organisation. The Asia-Pacific Perspective: Redefining Obesity and Its Treatment.; 200 AD. https://iris.who.int/items/a74d8440-5c1d-4237-9559-3f729058587b.
- Healthcare Omron Instruction Manual Body Composition Monitor, Model HBF-214. Karda Scan.; 2021. https://www.manualslib.com/manual/1152287/Omron-Hbf-214.html.
- Ashley, M.; Hsieh, S. Six Reasons Why the Waist-to-Height Ratio Is a Rapid and Effective Global Indicator for Health Risks of Obesity and How Its Use Could Simplify the International Public Health Message on Obesity. Int. J. Food Sci. Nutr. 2005, 56, 303–307. [CrossRef]
- Hamzah, M.; Lim, J.; Olarewaju, V.; Singh, J.; Letchumanan, G.; Chook, J.; Chia, Y.; Say, Y. Demographic, Anthropometric and Genetic (Salt Taste Receptors SCNN1B and TRPV1) Determinants of Salt Taste Intensity, Pleasantness, and Sodium Intake: Evidence from Young Adults in Malaysia. Food Qual. Prefer. 2026, 137, 105800. [CrossRef]
- Meyer, K.B.; Simons, J. Good Attitudes Are Not Good Enough: An Ethnographical Approach to Investigate Attitude-Behavior Inconsistencies in Sustainable Choice. Foods 2021, 10, 1317. [CrossRef]
- Campos, S.; Doxey, J.; Hammond, D. Nutrition Labels on Pre-Packaged Foods: A Systematic Review. Public Health Nutr. 2011, 14, 1496–1506. [CrossRef]
- Clark, J.E. Taste and Flavour: Their Importance in Food Choice and Acceptance. Proc. Nutr. Soc. 1998, 57, 639–643. [CrossRef]
- Hoppu, U.; Hopia, A.; Pohjanheimo, T.; Rotola-Pukkila, M.; Mäkinen, S.; Pihlanto, A.; Sandell, M. Effect of Salt Reduction on Consumer Acceptance and Sensory Quality of Food. Foods 2017, 6, 103–115. [CrossRef]
- Boo, H.; Kuan, T.; Loo, P. Effect of Cultural Difference on Preference for Popular Malaysian Cuisines. Rev. Tour. 2009, 17. https://psasir.upm.edu.my/id/eprint/14218.
- Poulain, J.; Laporte, C.; Tibère, L.; Mognard, E.; Ari Ragavan, N.; Zadeh, A.; Mohd Noor, I. Malaysian Food Barometer (MFB): A Study of the Impact of Compressed Modernisation on Food Habits. Mal J Nutr 2020, 26, 001–017. [CrossRef]
- Drewnowski, A.; Darmon, N. Food Choices and Diet Costs: An Economic Analysis. J Nutr 2005, 135, 900–904. [CrossRef]
- French, S. Pricing Effects on Food Choices. J Nutr 2003 2003. 133, 841S-843S. [CrossRef]
- Yin, X.; Liu, H.; Webster, J.; Trieu, K.; Huffman, M.; Miranda, J. et.al Availability, Formulation, Labeling, and Price of Low-Sodium Salt Worldwide: Environmental Scan. JMIR Public Health and Surveillance. JMIR Public Health Surveill. 2021, 7, e27423. [CrossRef]
- Livingstone, K.M.; Abbott, G.; Lamb, K.E.; Dullaghan, K.; Worsley, T.; McNaughton, S.A. Understanding Meal Choices in Young Adults and Interactions with Demographics, Diet Quality, and Health Behaviors: A Discrete Choice Experiment. J. Nutr. 2021, 151, 2361–2371. [CrossRef]
Figure 1.
Example of a hypothetical canned soup option presented to respondents.

Figure 2.
Bar chart of product attribute importance.

Figure 3.
Mean part-worth utilities plot by product attribute level.

Figure 4.
Sensory perception and pleasantness ratings to sodium-reduced soup formulations.


Table 1.
Attributes and levels to be investigated in choice-based conjoint analysis.
| Attributes | Levels |
|---|---|
| Flavour | Tomato |
| Cream of Chicken | |
| Cream of Mushroom | |
| Monosodium glutamate (MSG) | No MSG |
| With MSG | |
| Potassium chloride (KCl) | No KCl |
| With KCl | |
| Price (per 100g) | RM6.00 |
| RM8.00 | |
| RM10.00 | |
| Claims | Made with salt substitute |
| Made with salt replacement | |
| None | |
| Sodium content (/serving) | 0 mg |
| 600 mg | |
| 800 mg | |
| Sodium reduction | 10% less sodium |
| 15% less sodium | |
| 20% less sodium | |
| 25% less sodium |
Adapted from: Walker and Dando 2023.
Table 2.
Descriptive profile of study population.
| Variables | Frequency (n = 211) | Percentages (%) |
|---|---|---|
|
Age Median age ± range (IQR); years |
21 ± 3 | 21 ± 3 |
| Sex | ||
| Male | 74 | 35.1 |
| Female | 137 | 64.9 |
| Ethnicity | ||
| Malay | 24 | 11.4 |
| Indian | 24 | 11.4 |
| Chinese | 126 | 59.7 |
| Non-Malaysian Asian | 22 | 10.4 |
| African | 15 | 7.1 |
| Education level | ||
| Secondary | 24 | 11.4 |
| Pre-University | 102 | 48.3 |
| Undergraduate | 81 | 38.4 |
| Postgraduate | 4 | 1.9 |
| Marital Status | ||
| Single | 206 | 97.6 |
| Married | 5 | 2.4 |
| Monthly Household Income | ||
| B40 (< MYR 4,850 or USD 1,065) | 51 | 24.2 |
| M20 (MYR 4,851–10,970 or 1,066–2,406) | 94 | 44.5 |
| T20 (> MYR 10,971 or USD 2,407) | 66 | 31.3 |
| Blood Pressure Class | ||
| Normal (<120) | 141 | 66.8 |
| Pre-hypertension (120-139) | 27 | 12.8 |
| Stage 1 Hypertension (140-159) | 8 | 3.8 |
| Waist Circumference Class | ||
| Normal | 135 | 76.7 |
| High | 41 | 23.3 |
| Waist-to-Hip Ratio Class | ||
| Normal | 153 | 86.9 |
| High | 23 | 13,1 |
| Weight-to-Height Ratio Class | ||
| Normal | 129 | 73.3 |
| High | 47 | 26.7 |
| Total Body Fat Class | ||
| Normal | 102 | 58.0 |
| High | 74 | 42.0 |
| Visceral Fat Level Class | ||
| Normal (0.5-9.5) | 149 | 84.7 |
| High (10.0-14.5) | 27 | 15.3 |
| BMI Class | ||
| Normal (<18.5) | 118 | 67.0 |
| Overweight (23.0-27.5) | 34 | 19.3 |
| Obese (≥ 27.5) | 24 | 13.6 |
| Skeletal Muscle Class | ||
| Normal | 108 | 61.4 |
| High | 68 | 38.6 |
Table 3.
Attribute-level multinomial logit model coefficients.
| Attribute/level | Coefficient | Standard Error | z | p-value | Confidence Interval |
|---|---|---|---|---|---|
| Price | -0.11 | 0.02 | -4.76 | 0.00 | -0.15 – -0.06 |
| MSG | -0.10 | 0.03 | -3.05 | 0.00 | -0.17 - -0.03 |
| KCl | 0.00 | 0.03 | 0.20 | 0.83 | -0.05 – 0.06 |
| Cream of mushroom | 0.33 | 0.05 | 5.77 | 0.00 | 0.22 - 0.45 |
| Tomato | -0.32 | 0.06 | -4.94 | 0.00 | -0.44 - -0.19 |
| Sodium reduction (0 mg) | 0.23 | 0.05 | 4.09 | 0.00 | 0.12 – 0.34 |
| Sodium reduction (600 mg) | 0.05 | 0.05 | 1.10 | 0.26 | -0.04 – 0.15 |
| Sodium content (10%) | 0.02 | 0.05 | 0.40 | 0.68 | -0.09 – 0.14 |
| Sodium content (15%) | 0.08 | 0.06 | 1.4 | 0.15 | -0.03 – 0.20 |
| Sodium content (20%) | -0.01 | 0.06 | -0.21 | 0.83 | -0.13 – 0.11 |
| Made with salt substitute | -0.03 | 0.04 | -0.76 | 0.44 | -0.13 – 0.05 |
| Made with replacement | -0.02 | 0.05 | -0.58 | 0.56 | -0.12 – 0.06 |
Disclaimer/Publisher’s Note: The statements, opinions and data contained in all publications are solely those of the individual author(s) and contributor(s) and not of MDPI and/or the editor(s). MDPI and/or the editor(s) disclaim responsibility for any injury to people or property resulting from any ideas, methods, instructions or products referred to in the content. |
© 2026 by the authors. Licensee MDPI, Basel, Switzerland. This article is an open access article distributed under the terms and conditions of the Creative Commons Attribution (CC BY) license (http://creativecommons.org/licenses/by/4.0/).
Copyright: This open access article is published under a Creative Commons CC BY 4.0 license, which permit the free download, distribution, and reuse, provided that the author and preprint are cited in any reuse.


