
Submitted:
01 March 2026
Posted:
04 March 2026
You are already at the latest version
Abstract
Bulky plant storage organs frequently experience restricted internal oxygen diffusion, yet how such tissues remain metabolically active while accumulating large quantities of storage carbohydrate remains unresolved. In sugarcane, the culm accumulates exceptionally high sucrose concentrations despite sustained respiration, suggesting that storage metabolism operates under specific energetic constraints. We estimated growth and maintenance respiration along developing sugarcane internodes using a composition-based carbon accounting framework across stages representing rapid elongation and mature storage. Growth respiration peaked in elongating internodes (3–6), whereas maintenance respiration increased progressively with maturation and dominated in mature storage tissue (internodes 10–12), demonstrating that mature internodes remain metabolically active despite cessation of structural growth. Despite this sustained metabolic demand, mature tissue accumulates sucrose rather than depleting it. Modelled internal oxygen limitation reduced ATP yield per unit substrate without suppressing metabolic activity. Under severe oxygen limitation the carbohydrate requirement for maintenance metabolism more than doubled in mature internodes, indicating that storage tissue operates with reduced energetic efficiency. We therefore propose that the sugarcane culm operates a pyrophosphate-supported metabolic configuration in which ATP demand is minimised and carbon is conserved. In this framework oxygen limitation alters the energetic currency of metabolism rather than suppressing metabolic activity, allowing cellular maintenance to continue without proportional consumption of stored sucrose. This interpretation is consistent with previously observed extensive recycling between triose-phosphates and hexose-phosphates during sucrose accumulation, suggesting that this cycling represents an ATP-conserving metabolic strategy rather than futile metabolism. These results indicate that sucrose storage in sugarcane reflects an alternative energy economy of an oxygenlimited storage organ, linking respiratory energetics, hypoxia and carbon partitioning in a C4 crop.
Keywords:
respiration
; pyrophosphate
; hypoxia
; sucrose accumulation
1. Introduction
The accumulation of storage carbohydrate in plants presents a physiological paradox. Storage organs must remain metabolically active to sustain cellular maintenance, osmotic regulation and membrane energisation, yet excessive respiration would be expected to consume the stored assimilate. In sugarcane (Saccharum spp.), the culm accumulates exceptionally high concentrations of sucrose while maintaining substantial respiratory activity. Classical explanations for sucrose accumulation have focused primarily on phloem transport, enzyme regulation and compartmentation, but these mechanisms do not address the energetic cost of maintaining a large living storage tissue. We therefore consider whether sucrose storage in sugarcane depends not only on assimilate supply and metabolic control, but also on the energetic efficiency of metabolism within an oxygen-limited storage organ.
Sink organs use a large amount of imported assimilate for respiration [1,2]. So, the sink organ’s strength, as gauged by its growth, isn’t a perfect measure of how much it can take in, but rather gives a misleading impression. The assimilate import rate, which is the total of carbon gain and respiratory loss by the sink, is a more precise measure of actual sink strength [3].
Respiration sits at the center of sink strength. A cyclic (rather than linear) supply–demand architecture places ATP and reduction state at the heart of sucrose movement, cleavage/re-synthesis, and vacuolar storage [4]. Respiration is indispensable for maintaining low cytosolic sucrose to sustain phloem import and thus sink activity. Consistent with this, incoming sucrose in young internodes is rapidly metabolised for respiratory and anabolic needs, whereas older tissue shifts toward storage; respiratory rates drop by roughly half across the transition out of the elongation zone [4]. Substrate cycles and competition for UDP-glucose between cell-wall synthesis, sucrose (re)synthetic fluxes, and catabolic pathways further illustrate how sink demand and carbon partitioning together define sink behaviour.
Despite widespread acknowledgement that respiration is a core component of the sink demand function in sugarcane and a key determinant of culm storage capacity (e.g., supply–demand treatments of sugarcane sinks), explicit, internode-resolved calculations that partition growth and maintenance respiration have not, to our knowledge, been reported for sugarcane internodes. This gap persists even as conceptual and empirical work has emphasised source–sink feedbacks and demand-driven control of assimilation in sugarcane.
In this study we do not treat respiration primarily as a measurement of metabolic rate, but as a determinant of the carbon economy of the culm. In this sense, respiration determines whether the culm functions as a storage organ or a consuming organ. Our central question is therefore not how fast the stem respires, but how the energetic efficiency of respiration constrains the ability of the storage organ to accumulate sucrose. We test whether internal oxygen limitation increases the energetic cost of maintenance metabolism sufficiently to influence sink strength and carbon storage.
The sugarcane culm is capable of accumulating extremely high sucrose concentrations. Explanations for this capacity have traditionally focused on sucrose transport and enzymatic regulation of sucrose synthesis and degradation [5,6]. However, relatively little quantitative information exists regarding sink demand in developing internodes. Carbon partitioning studies have shown substantial flux into respiration and non-sucrose pathways [7,8], but the energetic costs of maintenance and their developmental variation remain poorly defined.
Internal oxygen limitation is a characteristic feature of many bulky plant tissues including storage organs such as fruits, tubers and seeds [9,10,11]. Restricted gas diffusion and sustained respiration create steep internal oxygen gradients, resulting in partial hypoxia in storage parenchyma. Although this phenomenon is well established in plant physiology, its implications for sugarcane culm metabolism have received little attention.
Oxygen limitation is considered here not as a stress response but as a steady-state operating condition of a large storage organ. The hypothesis explored is that reduced oxygen availability primarily alters ATP yield per unit substrate rather than directly suppressing metabolic activity. Consequently, hypoxia is predicted to modify the efficiency of carbon use rather than growth capacity itself.
The scale of the internode, sink size and activity are highly dynamic. Elongation ceases after a relatively small thermal window, yet dry matter continues to accumulate for many hundreds of degree–days thereafter; sucrose levels escalate as elongation ends, while tissue water content declines, and even detached mature internodes remain active sinks that continue to import sucrose to at least balance maintenance respiration and remobilization costs [12,13]. Tracer studies further demonstrate strong, developmentally resolved sink priority along the culm, with most recently supplied carbon moving into a discrete band of internodes below the labelled leaf [14,15].
The anatomical structure and large diameter of the culm strongly suggest restricted oxygen diffusion. If internal hypoxia occurs, oxidative phosphorylation would be limited and ATP production would depend increasingly on glycolysis. The consequences of this increased glycolytic demand for carbon balance and sucrose accumulation have not previously been considered in sugarcane.
Under conditions of reduced ATP availability, plants can utilize pyrophosphate (PPi) as an alternative energy currency [16,17,18]. PPi-dependent phosphofructokinase, vacuolar H+-pyrophosphatase and the pyruvate kinase/pyruvate phosphate dikinase substrate cycle allow metabolism to proceed with reduced ATP consumption [18,19]. These reactions can maintain glycolysis and membrane energisation during oxygen limitation while conserving carbon within central metabolism.
The significance of PPi metabolism in this context is energetic rather than merely biochemical. If ATP production per glucose is reduced under oxygen limitation, maintenance processes would require increased substrate consumption and could deplete stored sucrose. A PPi-dependent metabolic configuration offers a mechanism by which cellular work can continue while reducing ATP requirement and therefore conserving carbon.
In this study we quantify growth and maintenance respiration in developing sugarcane internodes and model the energetic consequences of hypoxia. We then integrate these results with current understanding of PPi metabolism to evaluate whether sucrose accumulation in sugarcane may depend on a PPi-mediated recycling of respiratory intermediates within a chronically hypoxic storage organ.
Maximizing biomass yield in sugarcane requires understanding not only the photosynthetic supply of assimilates but, critically, the strength of sinks that import, use, and store those assimilates. In sugarcane, the source–sink system is best framed within a supply–demand paradigm [20], in which culm biomass accumulation is feasible only when supply exceeds the combined demand for growth and respiration [14,21]. This view emphasizes that demand comprises three interacting components—growth, respiration, and storage—and that feedbacks between source and sink modulate flux through the system (metabolic control). Within this framework, sink strength is commonly defined as the competitive capacity of an organ to import photoassimilate, determined by the product of sink size and sink activity [22].
Moreover, oxygen availability likely modulates sink demand by altering respiratory pathways in the culm. Proteomic evidence indicates that, particularly in developing culm tissue, low internal oxygen can suppress mitochondrial respiration and promote glycolytic and ethanolic fermentation to sustain ATP supply—implying that endogenous hypoxia reshapes the respiratory component of demand as the culm matures. More broadly, work across plant systems shows that hypoxic niches within bulky sink organs drive characteristic metabolic adjustments and transcriptional responses, reinforcing the need to consider oxygen constraints when quantifying sink demand.
Despite extensive study of sucrose transport, enzyme regulation and carbon partitioning in sugarcane, the energetic cost of maintaining the culm storage sink has not been quantitatively resolved. Most previous work has interpreted sucrose accumulation primarily in terms of transport capacity or metabolic control of sucrose synthesis. However, storage tissues must also satisfy the respiratory sink demand required to sustain cellular maintenance, osmotic regulation and membrane energisation. In large parenchymatous organs, this demand may be constrained by oxygen availability, thereby altering the efficiency with which imported assimilate can be stored.
Here we adopt a different approach by quantifying sink demand from biomass composition and separating growth respiration from maintenance respiration at the internode scale. We then evaluate how oxygen limitation alters the carbon cost of sustaining metabolism and whether conventional oxidative respiration alone can account for continued sucrose accumulation. We hypothesise that sugarcane storage metabolism operates as an energy-economy system in which reduced oxygen availability favours pyrophosphate-dependent reactions that minimise ATP requirement and conserve carbon. This framework links respiratory energetics, sink strength and sucrose storage, providing a physiological explanation for how high sucrose concentrations can be maintained in a chronically oxygen-limited culm.
2. Materials and Methods
2.1. Plant Material, Staging, and Sampling
The growth of three sugarcane varieties, KQ228, Q240, and SRA3, was monitored over a plant and ratoon crop. The trial was established at the Salvetti Farming Company, Farm 6207 (17°06′08″S, 145°20′28″E). The experiment was planted in a completely randomised design with three replicate plots per treatment, each consisting of four 10 meter rows of cane. Billets obtained from disease-free stalks were used as planting material. The trial site was fully irrigated. Daily maximum and minimum air temperatures for the entire cropping cycle were obtained from the SILO database (https://www.longpaddock.qld.gov.au/silo/point-data/#responseTab2s) [23]. Thermal time, expressed as growing degree days (GDD) for phyllochron production, was calculated as previously described using a base temperature of 10°C [22].
2.2. Non-Destructive Sampling
Eight primary shoots in each plot were tagged for easy identification. Stalk elongation and phyllochron development were non-destructively measured in-field. This was done to ensure minimal disruption to canopy development by not changing shoot and leaf numbers, leaf production rates, and numbers of senescing leaves. Measurements were done on a two-weekly basis throughout the first six months of crop development and thereafter on a monthly basis.
2.3. Destructive Sampling
Eight culm samples were collected from the field plots approximately 6 and 12 months after planting.The culm samples were disintegrated using either a garden mulcher or Dedini laboratory disintegrator at room temperature. The mulched material was then weighed to determine the fresh weight (FW) and transferred to a paper bag to be dried at 70°C until a constant dry weight (DW) was reached (usually 6 to 7 days).
2.4. Lipids and Ion-Exchange Fractionation of Water-Soluble Constituents
Lipids were extracted from dried tissue (5.0 g) using methanol:chloroform:water (12:5:3, v/v/v) as described by Dickson [24]. Samples were centrifuged (4000 g, 10 min) and the supernatant was collected. Phase separation was induced by addition of chloroform (5 mL) and deionized water (4 mL). The chloroform phase was recovered, dried under vacuum, and weighed to determine lipid content.
The aqueous phase was dried by rotary evaporation (40–50°C) and re-dissolved in 70% (v/v) ethanol prepared with HPLC-grade water. Water-soluble constituents were fractionated by ion-exchange chromatography using Dowex 50W-X8 (H+ form; 5 mL bed volume) and Dowex 1-X8 (formate form; 5 mL bed volume) columns in tandem, with the cation-exchange column positioned upstream of the anion-exchange column [24]. Following sample application, the columns were separated and each column was washed individually prior to elution. Compounds retained on Dowex 50W-X8 (cationic fraction) were eluted with four column volumes of 4 M NH4OH, and compounds retained on Dowex 1-X8 (anionic fraction) were eluted with four column volumes of 4 M formate. The formate eluate was dried by rotary evaporation (40–50°C) and the residue was weighed as the soluble organic acid fraction. Recovery and fractionation performance were verified routinely using mixed standards, confirming effective binding to each resin and quantitative elution under the conditions described.
Total amino acids in the NH4OH eluate were estimated using a ninhydrin assay [25]. Fresh ninhydrin reagent was prepared immediately before use [25]. Samples and reagent were mixed (1:1, v/v), heated in a boiling water bath (10 min), and cooled on ice. Ethanol (50%, v/v) was added (2.5 volumes), mixed thoroughly, and absorbance was recorded at 570 nm. Aspartic acid was used as a standard (0–50 µg mL−1).
2.5. Biomass Compositional Analysis
Biomass compositional analyses were performed by Celignis Analytical (Limerick, Ireland) using the P19 Deluxe package. This package integrates exhaustive water and 95% ethanol extraction of biomass, followed by two-step acid hydrolysis of the extractives-free residue, thereby ensuring that structural carbohydrate values are not inflated by soluble sugars. Lignin was determined as both acid-insoluble (Klason) and acid-soluble fractions according to NREL-style protocols. Water- and ethanol-soluble sugars, as well as polyols, were quantified directly from the solvent extracts as part of the P19 suite, avoiding double counting between extractives and structural polysaccharide pools. Protein in the lignocellulosic fraction was calculated from elemental nitrogen, and ash were also reported.
2.6. Respiration Accounting and Statistical Analysis
Setup and notation.
Internode intervals were defined by successive nodes (1,2, 3, 4, 5, 6, 8, 12). For each phenotype (midseason, end-season), genotype (KQ228, Q240, SRA3), and biological replicate (), trajectories were ordered by internode. Let be the observed number of days in an interval (with interval–mean temperature T). Biomass increase for the interval is ; rate plots use .
Carbon skeleton and growth respiration.
Let (g) be the interval change in the mass of compound class j. Here j indexes the compound classes (carbohydrate, protein, lipid, lignin, organic acids). To avoid netting out turnover, use the positive part .
The constants for calculation [26] used were
2.6.1. Maintenance Respiration
Maintenance respiration was scaled to interval–average supported dry mass W over with a temperature response:
where is reported in glucose–equivalents and converts g CO2 to g glucose. We used and .
2.6.2. Total Sink and Rates
Total sink over the interval is
2.6.3. Oxygen Limitation and PPi Bypass (Scenario Analysis)
Oxygen limitation was explored by scaling energetic terms (leaving the carbon-skeleton term unchanged) and allowing ATP savings via PPi–dependent bypasses. Let and be ATP yield per g glucose under aerobic respiration and fermentation, respectively (defaults , ). With the aerobic ATP fraction, the effective yield is
Decompose ATP demand into growth and maintenance: , , with . Maintenance stress multiplies demand by : . A PPi bypass saves a fraction of growth ATP:
When an O2 flux cap (mmol per interval) is imposed, limit aerobic allocation using complete oxidation stoichiometry (1 g glucose → mmol O2):
Supplied ATP is and , satisfying .
Substrate and CO2 costs.
Given ATP components,
with PPi contributing zero substrate/CO2 (it reduces ATP demand). Rates per day are obtained by dividing interval totals by .
2.7. Statistical Analysis and Data Visualisation
For each phenotype and internode position, replicate measurements were summarised using the median and associated uncertainty estimated by non-parametric bootstrap confidence intervals (95%, 2000 resamples). The median was used because several variables showed non-normal distributions and unequal variances among internodes. To evaluate the metabolic effect of oxygen limitation, paired comparisons were performed between hypoxia and hypoxia+PPi scenarios. Differences were tested using the Wilcoxon signed-rank test, with a sign test applied when sample size or tied values prevented reliable Wilcoxon estimation. Genotypic effects were analysed separately for each phenotype and internode position using one-way analysis of variance (ANOVA). Post hoc comparisons were performed with Tukey’s honestly significant difference (HSD) test, and resulting p-values were adjusted for multiple testing using the Benjamini–Hochberg procedure. Effect sizes are reported as . Graphical summaries were designed to illustrate the energetic balance of respiration. Energy supply was partitioned into aerobic ATP production (ATPaer), anaerobic ATP production (ATPana), and pyrophosphate-associated energy saving (PPi). Plots therefore present (i) total energy demand relative to an aerobic reference and (ii) the proportional contribution of each energy source. Box plots show the interquartile range (IQR) with median lines; whiskers extend to the most extreme non-outlier data; open circles are outliers (Tukey 1.5 IQR rule).
All analyses were conducted in Python using NumPy and Pandas for data handling, Matplotlib for visualisation, and the statsmodels package for ANOVA and post hoc testing.
Supplementary materials: The following supporting information can be downloaded separately: Figure S1: Phyllochron development; Tables S1–S12
3. Results
Statistical comparisons therefore evaluate biological effects (oxygen limitation, genotype and developmental stage) rather than individual replicate measurements.
3.1. Growth and Biomass Production
Discrete phyllochron , the ΔTT, °Cd required to produce the next leaf [27], increased with developmental stage in all three genotypes, indicating a gradual slowing of leaf appearance from leaf 5 to leaf 15 (Table 1, Figure S1). At leaf 5, KQ228 had the shortest ΔTT (55.9 ± 6.7 °Cd) compared with Q240 (61.3 ± 6.3 °Cd) and SRA3 (63.8 ± 8.9 °Cd). The same rank order held at leaf 10, and at leaf 15. Thus, KQ228 consistently produced leaves with less thermal time than Q240 and SRA3, while Q240 and SRA3 did not differ from each other at a given stage (Table 1).
Across all genotypes, the pattern of biomass accumulation followed a typical sigmoidal curve, characterized by an initial lag phase, a rapid exponential phase, and a subsequent plateau as internode growth approached completion (Figure 1). The slopes of these curves differed markedly among genotypes . At mid-season, both Q240 and SRA3 displayed steep slopes and delayed inflection points, indicating an extended period of rapid biomass deposition. In contrast, KQ228 exhibited a shallower slope and an earlier point of saturation, signifying that internode expansion and carbon deposition slowed earlier in development.
By internode 12, Q240 and SRA3 had accumulated substantially more total biomass than KQ228, reflecting their greater sink activity and longer duration of active growth (Figure 1A). The rate-of-accumulation plots further highlight these differences: at mid-season, Q240 and SRA3 reached their maximum rates between internodes 5 and 6, while KQ228 peaked earlier, at internode 4 (Figure 1B).
By the end of the growth cycle, the sigmoidal curves of all three genotypes had flattened, reflecting growth cessation. The overall differences among genotypes were greatly reduced, and the maximum rate of biomass accumulation had shifted to earlier internodes (around internode 4), consistent with the physiological transition from rapid elongation to maturation and storage.
3.2. Biomass Composition
The amount of biomass components were affected by both the total biomass of the internode and the carbon partitioning between the different metabolic pools. It was therefore important to show both changes in total content and partitioning. All quantities are expressed on a dry-matter basis. For downstream analyses, the P19 outputs were partitioned into “soluble” and “structural” pools. The soluble pool () included all water-extractable monosaccharides, disaccharides, oligosaccharides, and polyols reported by Celignis. The structural pool () comprised the anhydro-monomer equivalents of glucan, xylan, mannan, galactan, and arabinan derived from the acid-hydrolysed residue.
Ash was used only in quality control and lignin corrections, not in respiration accounting.
For modelling and mass-balance purposes the carbohydrate, lignin, protein and organic acid levels are reported where:
- Total carbohydrate:
- Total Lignin:
- Total Protein:
- Total Organic acids:
Recovery of biomass in these isolated fractions accounted for more than 93% of the total dry weight (Table S2). No significant differences were found in the recovery of biomass between the genotypes at each stage of development. However, within each genotype differences were observed in the efficiency of recovery at different stages of development (Table S2).
Carbohydrate was the major constituent of internode biomass (Figure 2A,B) and closely follow the increase in total biomass (Figure 2A,C) both at peak growth (mid-season) and end of the season slow growth. The carbohydrate content differed significantly both between the genotypes at each stage of internode development and between internodes within each genotype (Table S3). Lignin is the second most abundant compound and continues to increase throughout internode development while internode biomass increases (Figure 2C,D). The amount of carbohydrate and lignin were significantly higher in the two fast-growing genotypes mid-season (Table S3,S4) but not in cane from slow growth at the end of the season.
In contrast, protein, organic acids and lipid levels reached a peak at the end of internode elongation (Figure 2C,D,E,F,G,H). All three these components decreased significantly after cessation of internode elongation (Table S4,5,6), and especially so when the cane is growing much slower at the end of the season. This decrease in the amount of protein, organic acids and lipid reflect a redistribution of carbon from these metabolic pools to carbohydrate and lignin.
As already evident from the total component levels there were major shifts in carbon partitioning to the different metabolic components. Between 50 and 80% of carbon were allocated to the carbohydrate pool (Figure 3A,B). The slower the rate of growth the more reduced carbon was allocated to the carbohydrate pool. There were no significant differences between carbon allocation to the carbohydrate pool between the genotypes during development of the first 6 internodes in mid-season internodes (Table S8) but significantly during the latter stages of development. Partitioning into carbohydrates varied significantly between young and mature internodes. Partitioning of carbon into lignin increased during internode development (Figure 3C,D) but accelerated after cessation of internode expansion (Figure 3C,D, Table S9).
The increased carbon allocation to carbohydrate were at the expense of protein, organic acids and lipid (Figure 3E,F,G,H,I,J). The decreased carbon allocation to these three metabolic pools were highly significant especially after cessation of internode elongation (internode 5) (Table S10,S11, S12). In the young actively growing internodes more than 30% of total redued carbon were allocated to protein, organic acids and lipid. This allocation significantly decreased after cessation of internode elongation and during carbohydrate and lignin accumulation (Table S10,S11, S12).
3.3. Partitioning Within the Carbohydrate Pool
Cell wall sugars were the major component of the carbohydrate fraction in young elongating internodes (Figure 4A,B). Sucrose accumulation was only evident after elongation terminated (Figure 4C,D). Sucrose accumulated faster in the slow growing genotype (KQ228) (Figure 4C) than in the slower growing genotypes (Q240 and SRA3) in mid-season cane. This difference was more pronounced in the fast growing mid-season cane than at the end of the season (Figure 4C,D). Sucrose as a percentage of total biomass was significantly higher in the slow growing cane at the end of the growth season. The other soluble sugars (dominated by glucose and fructose) decreased when sucrose accumulation started (Figure 4E,F).
3.4. Respiration
Growth respiration rate () (Figure 5A,D), closely tracked the biomass accumulation rate (Figure 1B) during mid-season and end of season growth and peaks between internodes 3 and 6, and collapses during maturation. This demonstrates that () is a construction cost. In contrast, maintenance respiration () increased steadily with internode number (i.e. total biomass) (Figure 5B,E). Therefor mature internodes were not metabolically inactive but rather represented energetically expensive tissue.
For more detailed description five stages of internode development were chosen. Internode 2 (maximum elongation), 4 (end of elongation), 6 (start of sucrose accumulation), 8 (maximum rate of sucrose accumulation) and 12 (end of biomass accumulation).
Both growth respiration () and maintenance respiration () varied strongly with internode developmental stage and seasonal growth conditions (Table 2). Across all genotypes, the two respiration components showed opposite developmental trends.
During the period of rapid culm elongation, growth respiration was highest in the elongating internodes and declined progressively toward mature storage tissue. Maximum values occurred in internodes 4–6, reaching 750–1280 mg glucose equivalents day−1 depending on genotype. In contrast, mature internodes (8–12) exhibited much lower values, typically below 250 mg glucose equivalents day−1 and falling below 100 mg in the oldest internodes.
Maintenance respiration showed the opposite pattern. increased steadily from the youngest internodes toward the base of the culm. In internode 2, maintenance respiration was only 19–29 mg glucose equivalents day−1, whereas in internode 12 it reached 100–197 mg glucose equivalents day−1. Thus, during peak growth the elongation zone was dominated by growth respiration, while mature storage internodes were increasingly dominated by maintenance respiration (Table 3).
Genotype effects were present but smaller than developmental effects. SRA3 generally exhibited the highest in mature tissue, whereas Q240 often showed higher in elongating internodes, but the overall developmental pattern was conserved across all three genotypes.
At the end of the season, growth respiration declined dramatically across the entire culm. In elongating internodes, decreased to approximately 70–230 mg glucose equivalents day−1, and in mature internodes it fell below 20 mg glucose equivalents day−1. Thus, structural biomass formation was strongly reduced.
Maintenance respiration also decreased relative to mid-season values but remained substantial and followed the same developmental gradient. In internode 2, was approximately 5–6 mg glucose equivalents day−1, whereas mature internodes (10–12) still required 30–35 mg glucose equivalents day−1. Consequently, maintenance respiration represented the dominant respiratory component during slow growth.
Tukey comparisons confirmed a consistent shift in respiratory function along the culm. Young internodes were characterized by high and low , whereas mature internodes showed low but relatively high . This transition occurred around internodes 6–8 and was observed in both seasons and all genotypes, indicating that it represents a fundamental feature of sugarcane culm development (Table 3).
3.5. Sink Strength
Defining “sink strength” for sugarcane stems purely by sucrose concentration, total mass, or organ size misses the carbon required to build and maintain that biomass. Classical proxies therefore under-estimate true assimilate demand during internode development and ripening. A more faithful measure is
sink demand = biomass increment + growth respiration + maintenance respiration.
We estimated this directly from internodal composition (structural + soluble fractions) across developmental stages. Growth respiration was computed from compound-specific construction costs (glucose required to supply carbon skeletons and reductant/ATP), while maintenance respiration was scaled to total dry mass with a temperature-dependent Q10 relationship [28]. This composition-based framework [26] captured shifts from structural deposition to soluble storage and the rising maintenance burden as tissues enlarge and age, yielding a stage-resolved, process-based sink metric for C4 storage stems such as sugarcane.
The carbon-skeleton requirement for biomass formation () varied systematically along the culm (Table 4). In elongating internodes (1–6), the construction requirement was close to unity, ranging between 0.99 and 1.14 g glucose g−1 dry-mass gain. These values indicate that biomass accumulation in young tissue primarily reflects polymer synthesis rather than metabolic recycling. Variability was low and genotype effects were minor, suggesting a conserved biosynthetic program during structural growth. Significant phenotype effects were detected at internodes 3 and 6, indicating that growth rate influences construction efficiency during elongation.
In contrast, the mature storage region (internodes 8–12) showed a pronounced increase in construction requirement together with substantially higher variability. Mean values increased to 3.17 at internode 8, 3.90 at internode 10, and 2.44 at internode 12. The large variance, particularly at internode 10, indicates that net dry-mass change in mature tissue is no longer a direct proxy for biosynthesis. Instead, biomass accumulation becomes dominated by metabolic turnover and compositional rearrangement. Significant genotype effects were detected at internodes 8 and 12. Overall, the data reveal a transition along the culm from true growth metabolism in the elongation zone to maintenance-dominated metabolism in the storage zone.
3.5.1. Hypoxia
Two hypoxia scenarios were considered by constraining the fraction of ATP demand met by fully aerobic mitochondrial oxidation (oxidative electron transport). In the 0.75 scenario, 75% of the energy demand is met by oxidative phosphorylation and the remaining 25% is supplied by substrate-level pathways (fermentative metabolism). In the 0.25 scenario, only 25% of ATP demand is met oxidatively and 75% is met via fermentation. These scalars do not represent tissue oxygen concentrations per se; rather, they approximate the effective share of energy provision that can be sustained by the cytochrome pathway when oxygen supply is limiting. Under lower oxidative shares, more glucose must be diverted to respiration to meet the same ATP demand, with partial glycolytic oxidation is required to maintain cytosolic redox balance when mitochondrial oxidation is constrained.
These fractions do not represent measured tissue oxygen concentrations. Instead, they approximate physiologically plausible operating states in which oxygen diffusion limits the proportion of ATP that can be generated through oxidative phosphorylation. The scenarios therefore represent energetic constraints on metabolism rather than environmental treatments.
Because ATP per glucose falls sharply when a greater share of energy is supplied anaerobically, both and require more glucose under hypoxia even when biomass composition and interval duration are unchanged (Figure 5); the increase is graded (Aerobic < mild < severe) at nearly all internodes (Figure 5).
The proportional rise is typically larger for (Figure 5B,E) at later internodes where average supporting mass is higher, so the maintenance share of the sink tends to increase with both stage and hypoxia severity. Where developmental intervals are long (more days at moderate temperature), hypoxia effects are amplified through the , consistent with a mass×duration driver.
When oxygen improves, ethanol requires further metabolism (e.g., via alcohol/aldehyde dehydrogenases), incurring additional carbon and energy costs. This is why , and total sink (biomass gain + respiratory costs) all show progressively larger demands as the oxidative fraction is reduced (Figure 6).
Respiratory energy demand increases under hypoxia but differs between developmental stages. Under aerobic conditions, total respiratory energy demand (growth + maintenance respiration) was greatest in elongating internodes and declined toward mature storage tissue (Figure 7A,B). Simulated oxygen limitation increased glucose consumption required to satisfy the same ATP demand in all internodes. The increase was modest under mild hypoxia but substantial under severe hypoxia.
During mid-season growth (Figure 7A), the largest absolute increase in glucose demand occurred in actively elongating internodes (3–6). In contrast, mature internodes (10–12) showed relatively small absolute changes because their baseline sink demand was low. A similar pattern was observed at the end of the season (Figure 7B), although overall energy demand was reduced.
When expressed relative to the aerobic reference (Figure 7C,D), a different pattern emerged. The proportional energetic penalty of hypoxia increased progressively along the culm and was maximal in mature storage internodes. Severe hypoxia increased respiratory energy cost by approximately 150–300% compared with aerobic metabolism, whereas mild hypoxia produced a much smaller increase (generally <40%). The strong proportional response in mature tissue reflects a decline in energetic efficiency rather than increased metabolic activity.
Thus, oxygen limitation increased carbon consumption in growing internodes but primarily reduced respiratory efficiency in mature storage tissue.
3.6. Energetic Consequences of Hypoxia
Hypoxia increased the glucose demand of the sink () at all internodes (Table 5).
Under mild hypoxia the increase was small in elongating tissue, approximately 2.7–4.3% in internodes 1–6. However, the penalty increased markedly in mature tissue, reaching 4.5% at internode 8, 12.0% at internode 10, and 17.9% at internode 12. Thus even modest oxygen limitation disproportionately affected storage tissue.
Under severe hypoxia the effect became dramatic. The glucose requirement increased by approximately 35–45% in young internodes and exceeded 100% in the storage region, reaching 144% at internode 12. Mature storage tissue therefore required more than double the carbohydrate input to support the same dry-mass gain under severe oxygen limitation. These results demonstrate that the energetic efficiency of sugarcane storage metabolism is strongly oxygen dependent.
4. Discussion
The principal finding of this study is that the sugarcane culm behaves as an energetically constrained storage organ. Rather than sucrose accumulation occurring because respiration is low, our results indicate that respiration in mature tissue is energetically inefficient due to restricted oxygen availability. Consequently, sink demand remains high even in non-growing tissue, and sucrose storage requires mechanisms that minimise ATP consumption rather than mechanisms that simply suppress metabolism.
4.1. The Sugarcane Culm Operates as an Oxygen-Limited Storage Organ
The sugarcane culm is among the largest carbohydrate storage organs in higher plants. Bulky storage tissues commonly develop internal oxygen gradients because respiratory consumption exceeds diffusive oxygen supply [9,11,29,30]. Consequently, storage parenchyma in organs such as tubers, fruits and seeds frequently operates under partial hypoxia.
The developmental trends observed here are consistent with such an oxygen-constrained metabolic system. Growth respiration was maximal in elongating internodes, whereas maintenance respiration increased progressively with internode age and biomass. Mature internodes therefore remained metabolically active and required a continuous energy supply even after structural growth had ceased. This behaviour indicates that mature culm tissue is not passive storage but an actively maintained sink.
Because oxygen diffusion distance increases with culm diameter while respiration continues throughout maturation, the storage parenchyma is expected to experience chronic internal oxygen limitation [11]. The hypoxia scenarios analysed in this study should therefore be regarded as physiologically plausible operating states of the culm rather than extreme stress conditions.
4.2. Maintenance Respiration Defines Sink Demand in Mature Tissue
A key outcome of this work is the separation of growth respiration and maintenance respiration at the internode level. Growth respiration closely followed biomass accumulation and declined rapidly beyond the elongation zone, whereas maintenance respiration increased with supporting dry mass and became the dominant respiratory component in mature internodes.
This finding changes the interpretation of sugarcane sink strength. Sink strength is commonly inferred from sucrose accumulation or biomass gain [4,14,21]. However, our results demonstrate that a substantial fraction of imported carbon is required not for growth but for sustaining existing tissue. Mature storage internodes therefore remain strong sinks even when net structural growth has stopped.
Maintenance respiration likely reflects membrane turnover, ion transport, repair processes and osmotic regulation associated with high intracellular solute concentrations [26]. High sucrose accumulation requires maintenance of steep concentration gradients between vacuole, cytosol and apoplast, processes that impose continuous energetic demand.
Notably, independent metabolic studies of sugarcane culm tissue have reported extensive substrate cycling during sucrose accumulation, including repeated cleavage and resynthesis of sucrose and strong exchange between hexose-phosphate and triose-phosphate pools [8]. Within a purely ATP-optimised metabolic system such behaviour would represent a substantial energetic cost and would be difficult to reconcile with sustained storage. The respiration analysis presented here provides a physiological context for these observations: if ATP production is constrained by oxygen availability, a metabolic configuration that conserves ATP rather than maximises ATP yield becomes advantageous.
4.3. Hypoxia Alters Energetic Efficiency Rather than Growth Capacity
Simulated oxygen limitation increased the glucose consumption required to sustain identical physiological activity across all internodes. The effect was modest in elongating tissue but substantial in mature storage tissue, where maintenance respiration dominates.
At these energetic costs, conventional oxidative respiration alone would be expected to oxidise a substantial fraction of imported sucrose to satisfy maintenance demand. The continued net accumulation of sucrose therefore requires a mechanism that sustains cellular metabolism while reducing ATP requirement.
Importantly, hypoxia did not primarily affect growth rate in our framework; instead it altered the energetic efficiency of respiration. As ATP yield per unit glucose decreased, more carbohydrate was required to support the same metabolic demand. Consequently, effective sink demand increased without any change in biomass production.
4.4. The Carbon Paradox of Sucrose Accumulation
The combination of high maintenance respiration and reduced respiratory efficiency under hypoxia produces a physiological paradox. If respiration in mature internodes relied entirely on ATP generated by oxidative phosphorylation, a large fraction of incoming sucrose would need to be oxidised to meet energetic demand.
However, mature sugarcane internodes accumulate high sucrose concentrations rather than depleting them [5,6]. Therefore, the metabolic system must conserve carbon while maintaining ATP supply. The results presented here indicate that conventional respiratory metabolism alone cannot simultaneously support maintenance respiration and large net sucrose accumulation in an oxygen-limited environment.
4.5. PPi-Dependent Metabolism as a Carbon-Conserving Energy System
The respiration results define the energetic constraints within which culm metabolism must operate. Within these constraints, the metabolic configuration illustrated in Figure 8 provides a mechanistic resolution of the sucrose storage paradox.Several central reactions in plant carbohydrate metabolism can operate using PPi instead of ATP, including PPi-dependent phosphofructokinase, vacuolar H+-pyrophosphatase and the pyruvate kinase/pyruvate phosphate dikinase substrate cycle [9,18,31,32].
Independent experimental observations in sugarcane support this interpretation [8,33]. Previous metabolic studies have shown unusually large substrate cycling between hexose-phosphates and triose-phosphates during sucrose accumulation, involving repeated cleavage and resynthesis of sucrose. In a purely ATP-dependent metabolic framework such extensive cycling would be energetically wasteful and difficult to reconcile with sustained storage. However, within a PPi-supported metabolic system the same behaviour acquires a functional interpretation. PPi-dependent phosphofructokinase allows glycolytic flux to proceed without equivalent ATP expenditure, and the PEP/pyruvate substrate cycle enables carbon to remain within central metabolism while maintaining redox balance. The observed recycling therefore represents not futile metabolism but an energy-buffering mechanism that maintains metabolic activity under oxygen-limited conditions. Rather than consuming stored sucrose, the culm operates a high-flux, low-ATP-cost metabolic loop consistent with the hypoxia-driven energetic constraints quantified here.
In oxygen-limited tissue this metabolic configuration offers two advantages. First, ATP demand is reduced, lowering substrate requirement for respiration. Second, carbon can be recycled through glycolytic intermediates rather than fully oxidised to CO2. The model results are consistent with such a system: hypoxia increases glycolytic flux but does not predict proportional carbon loss if PPi-dependent bypasses are active.
We therefore propose that sucrose accumulation in sugarcane depends on a PPi-mediated metabolic state that maintains energy supply while conserving carbon skeletons. Rather than maximising ATP production, the culm minimises ATP requirement.
4.6. Implications for Sink Strength and Yield Formation
These findings suggest a reinterpretation of sugarcane yield formation. Culm productivity depends not only on photosynthetic supply but also on the energetic efficiency of the storage sink. Oxygen availability and metabolic configuration determine how much assimilate must be respired to support maintenance.
Consequently, variation in respiratory efficiency may influence yield independently of photosynthesis [21]. Genotypes or conditions that reduce maintenance cost or increase PPi utilisation could increase sucrose storage without increasing assimilation. Sink efficiency therefore becomes a potential target for crop improvement.
Sucrose accumulation in sugarcane should therefore be interpreted not as a consequence of low metabolic activity but as the outcome of a regulated, energy-conserving metabolic state adapted to chronic internal oxygen limitation.
5. Conclusions
This study demonstrates that sugarcane culm tissue is an energetically active sink throughout development. During maturation, respiration shifts from growth-associated energy demand to maintenance-dominated metabolism. Hypoxia substantially increases the glycolytic requirement for ATP production, particularly in mature storage tissue.
The model does not imply large net fermentative carbon loss from the culm. Instead, it assumes that glycolytic flux increases to sustain ATP supply while carbon intermediates remain largely within central metabolism. The consequence of oxygen limitation in this framework is therefore reduced energetic efficiency rather than depletion of stored carbon.
The absence of large fermentation product accumulation despite increased glycolytic flux indicates that respiratory carbon is retained within metabolism. We propose that this is achieved through a PPi-dependent metabolic network involving PPi-utilising enzymes, the PK/PPDK substrate cycle and vacuolar H+-pyrophosphatase activity. This network enables recycling of triose-phosphate-derived carbon back to hexose phosphates and sucrose while maintaining redox balance and cellular energy supply.
Sucrose accumulation in sugarcane is therefore not the result of suppressed respiration but of a metabolic strategy that conserves carbon under chronic internal hypoxia. Internal oxygen availability may represent an important but previously overlooked determinant of sink strength, with implications for yield improvement and breeding strategies.
Understanding sugarcane as a hypoxia-adapted storage organ provides a new physiological framework linking respiration, energy metabolism and sucrose accumulation. We therefore propose that the sugarcane culm operates a pyrophosphate-supported metabolic configuration in which ATP demand is minimised and carbon is conserved. In this framework hypoxia alters the energetic currency of metabolism rather than suppressing metabolic activity, allowing cellular maintenance to continue without proportional consumption of stored sucrose
Funding
This research was funded by the CRC for Developing Northern Australia, the University of Queensland, and the Queensland Government.
Data Availability Statement
The datasets used and analyzed during the current study are available from the corresponding author on request
References
- Ho, L.C. Metabolism and Compartmentation of Imported Sugars in Sink Organs in Relation to Sink Strength. Annual Review of Plant Physiology and Plant Molecular Biology 1988, 39, 355–378. [Google Scholar] [CrossRef]
- Farrar, JF. Fluxes of Carbon in Roots of Barley Plants. New Phytologist 1985, 99, 57–69. [Google Scholar] [CrossRef]
- Walker, AJ.; Ho, LC. Carbon Translocation in the Tomato: Carbon Import and Fruit Growth. Annals of Botany 1977, 41, 813–823. [Google Scholar] [CrossRef]
- Botha, F. Advances in Understanding of Sugarcane Plant Growth and Physiology. In Achieving Sustainable Cultivation of Sugarcane; Rott, P., Ed.; Burleigh Dodds Science Publishing: Sawston, United Kingdom, 2018; Vol. 2. [Google Scholar]
- Moore, P.H. Temporal and Spatial Regulation of Sucrose Accumulation in the Sugarcane Stem. Functional Plant Biology 1995, 22, 661–679. [Google Scholar] [CrossRef]
- Komor, E. The Physiology of Sucrose Storage in Sugarcane. In Carbohydrate Reserves in Plants: Synthesis and Regulation; Gupta, A.K., Kaur, N., Eds.; Elsevier: Amsterdam, 2000; pp. 35–53. [Google Scholar]
- Whittaker, A.; Botha, F. Carbon Partitioning during Sucrose Accumulation in Sugarcane Internodal Tissue. Plant Physiology 1997, 115, 1651–1659. [Google Scholar] [CrossRef]
- Bindon, K.A.; Botha, F.C. Carbon Allocation to the Insoluble Fraction, Respiration and Triose-phosphate Cycling in the Sugarcane Culm. Physiologia Plantarum 2002, 116, 12–19. [Google Scholar] [CrossRef]
- Geigenberger, P. Response of Plant Metabolism to Oxygen Availability: Integration of Stress Signals. Journal of Experimental Botany 2003, 54, 1293–1305. [Google Scholar]
- Rolletschek, H.; Koch, K.; Wobus, U.; Borisjuk, L. Positional Cues for the Starch/Lipid Balance in Maize Kernels and Resource Partitioning to the Embryo. The Plant Journal 2005, 42, 69–83. [Google Scholar] [CrossRef] [PubMed]
- Armstrong, W.; Armstrong, J. Plant Internal Oxygen Transport (Diffusion and Convection) and Measuring and Modelling Oxygen Gradients. In Low-Oxygen Stress in Plants: Oxygen Sensing and Adaptive Responses to Hypoxia; van Dongen, J.T., Licausi, F., Eds.; Springer Vienna: Vienna, 2014; pp. 267–297. [Google Scholar] [CrossRef]
- Lingle, S.E.; Thomson, J.L. Sugarcane Internode Composition During Crop Development. BioEnergy Research 2012, 5, 168–178. [Google Scholar] [CrossRef]
- Rae, A.; Bonnett, G.; Karno. Understanding Stem Development and Sucrose Accumulation to Increase CCS. Proceedings Australian Society for Sugarcane Technologists 2006, 28, 2–5. [Google Scholar]
- McCormick, A.; Cramer, M.; Watt, D. Culm Sucrose Accumulation Promotes Physiological Decline of Mature Leaves in Ripening Sugarcane. Field Crops Research 2008, 108, 250–258. [Google Scholar] [CrossRef]
- Botha, F.C.; McDonald, Z.A. Carbon Partitioning in the Sugarcane Stalk. Proceedings Australian Society of Sugar Cane Technologists 2010, 32, 486–496. [Google Scholar]
- Stitt, M. Pyrophosphate as an Energy Donor in the Cytosol of Plant Cells: An Enigmatic Alternative to ATP. Botanica Acta 1998, 111, 167–175. [Google Scholar] [CrossRef]
- Plaxton, W.C. The Organization and Regulation of Plant Glycolysis. Annual Review of Plant Biology 1996, 47, 185–214. [Google Scholar] [CrossRef] [PubMed]
- Igamberdiev, A.U.; Kleczkowski, L.A. Pyrophosphate as an Alternative Energy Currency in Plants. Biochemical Journal 2021, 478, 1515–1524. [Google Scholar] [CrossRef] [PubMed]
- Maeshima, M. Tonoplast Transporters: Organization and Function. Annual Review of Plant Biology 2001, 52, 469–497. [Google Scholar] [CrossRef]
- Hofmeyr, J.H.S.; Cornish-Bowden, A. Regulating the Cellular Economy of Supply and Demand. FEBS Letters 2000, 476, 47–51. [Google Scholar] [CrossRef]
- Watt, D.A.; McCormick, A.J.; Cramer, M.D. Source and Sink Physiology. In Sugarcane: Physiology, Biochemistry, and Functional Biology; Wiley Online Library, 2013; pp. 483–520. [Google Scholar] [CrossRef]
- Botha, F.C.; Marquardt, A. Metabolic Control of Sugarcane Internode Elongation and Sucrose Accumulation. Agronomy 2024, 14, 1487. [Google Scholar] [CrossRef]
- Jeffrey, S.; Carter, J.; Moodie, K.; Beswick, A. Using Spatial Interpolation to Construct a Comprehensive Archive of Australian Climate Data. Environmental Modelling & Software 2001, 16, 309–330. [Google Scholar] [CrossRef]
- Dickson, R.E. Analytical Procedures for the Sequential Extraction of 14C-labeled Constituents from Leaves, Bark and Wood of Cottonwood Plants. Physiologia plantarum 1979, 45, 480–488. [Google Scholar] [CrossRef]
- Sun, S.W.; Lin, Y.C.; Weng, Y.M.; Chen, M.J. Efficiency Improvements on Ninhydrin Method for Amino Acid Quantification. Journal of Food Composition and Analysis 2006, 19, 112–117. [Google Scholar] [CrossRef]
- De Vries, F.P.; Jansen, DM.; Ten Berge, HFM.; Bakema, A. Simulation of Ecophysiological Processes of Growth in Several Annual Crops; Int. Rice Res. Inst., 1989; Vol. 29. [Google Scholar]
- Wilhelm, WW.; McMaster, G.S. Importance of the Phyllochron in Studying Development and Growth in Grasses. Crop science 1995, 35, 1–3. [Google Scholar] [CrossRef]
- Liu, D.; Bull, T. Simulation of Biomass and Sugar Accumulation in Sugarcane Using a Process-Based Model. Ecological Modelling 2001, 144, 181–211. [Google Scholar] [CrossRef]
- van Dongen, J. Oxygen Concentrations in Developing Potato Tubers: Spatial Gradients and Respiration Rates. Planta 2001, 213, 561–569. [Google Scholar]
- van Dongen, J. Plant Mitochondria and Anaerobic Stress. Annals of Botany 2003, 91, 627–640. [Google Scholar]
- Hill, C.B.; Taylor, J.D.; Edwards, J.; Mather, D.; Bacic, A.; Langridge, P.; Roessner, U. Whole-Genome Mapping of Agronomic and Metabolic Traits to Identify Novel Quantitative Trait Loci in Bread Wheat Grown in a Water-Limited Environment. Plant Physiology 2013, 162, 1266–1281. [Google Scholar] [CrossRef] [PubMed]
- Mustroph, A.; Hess, N.; Sasidharan, R. Hypoxic Energy Metabolism and PPi as an Alternative Energy Currency. In Low-Oxygen Stress in Plants: Oxygen Sensing and Adaptive Responses to Hypoxia; van Dongen, J.T., Licausi, F., Eds.; Springer Vienna: Vienna, 2014; pp. 165–184. [Google Scholar] [CrossRef]
- van der Merwe, M.J.; Groenewald, J.H.; Stitt, M.; Kossmann, J.; Botha, F.C. Downregulation of Pyrophosphate: D-fructose-6-phosphate 1-Phosphotransferase Activity in Sugarcane Culms Enhances Sucrose Accumulation Due to Elevated Hexose-Phosphate Levels. Planta 2010, 231, 595–608. [Google Scholar] [CrossRef] [PubMed]
Figure 1.
Total internode dry biomass of sugarcane internodes (A,C) and the rate of biomass accumulation (B,D) at peak growth (Mid-season) and slow growth (end-season). Lines show medians; shaded bands indicate SD across observations for each genotype component within a location.
Figure 1.
Total internode dry biomass of sugarcane internodes (A,C) and the rate of biomass accumulation (B,D) at peak growth (Mid-season) and slow growth (end-season). Lines show medians; shaded bands indicate SD across observations for each genotype component within a location.

Figure 2.
Internode component content across internode development (internodes 1-12) and growth stage. Carbohydrate (A,E), lignin (C,D), protein (E,F), organic acids (G,H) and lipid (I,J). Mid-season (A,C,E,G,I) and end-season (B,D,F,H,J). Curves show genotypes KQ228, Q240 and SRA3 for mid-season and end-season phenotypes. Lines show medians and error bars represents standard deviation.

Figure 3.
Internode carbon partitioning during internode development (internodes 1-12) and growth stage. Carbohydrate (A,E), lignin (C,D), protein (E,F), organic acids (G,H) and lipid (I,J). Mid-season (A,C,E,G,I) and end-season (B,D,F,H,J). Curves show genotypes KQ228, Q240 and SRA3 for mid-season and end-season phenotypes. Lines show medians and error bars represents standard deviation.

Figure 4.
Carbon partitioning within the carbohydrate fraction during internode development (internodes 1–12) and growth stage. Cell wall sugars (A,B), sucrose (C,D), and other water-soluble sugars (E,F). Mid-season (A,C,E) and end-season (B,D,F). Each panel shows grouped boxplots by genotype (KQ228, Q240, SRA3) across the internodes.

Figure 5.
Internode-scale sink demand (glucose equivalents day−1) during mid-season peak growth (A,B,C) and end of season slow growth (D, E, F). Each panel shows grouped boxplots by genotype (KQ228, Q240, SRA3) across the internodes. (A,D) Growth respiration rate (), (B,E) maintenance respiration rate () and (C,F) total sink demand rate (), where is the carbon-skeleton substrate requirement for the observed biomass composition changes.

Figure 6.
The daily respiratory rates across internodes for three conditions (Aerobic, mild_hypoxia, severe_hypoxia) : (A,D) Growth respiration rate (), (B,E) maintenance respiration rate () and (C,F) total sink demand rate (), where is the carbon-skeleton substrate requirement for the observed biomass composition changes. (A–C) = mid-season peak growth and (D-F) end-season slow growth.

Figure 7.
Effect of oxygen limitation on respiratory energy demand along the sugarcane culm. (A,B) Total energetic glucose demand (growth + maintenance respiration) expressed as glucose equivalents per internode per day under aerobic conditions (blue), mild hypoxia (pink) and severe hypoxia (gold). Panels A and B represent mid-season rapid growth and end-season slow growth, respectively. (C,D) Energetic penalty of oxygen limitation expressed as percent increase relative to aerobic respiration.

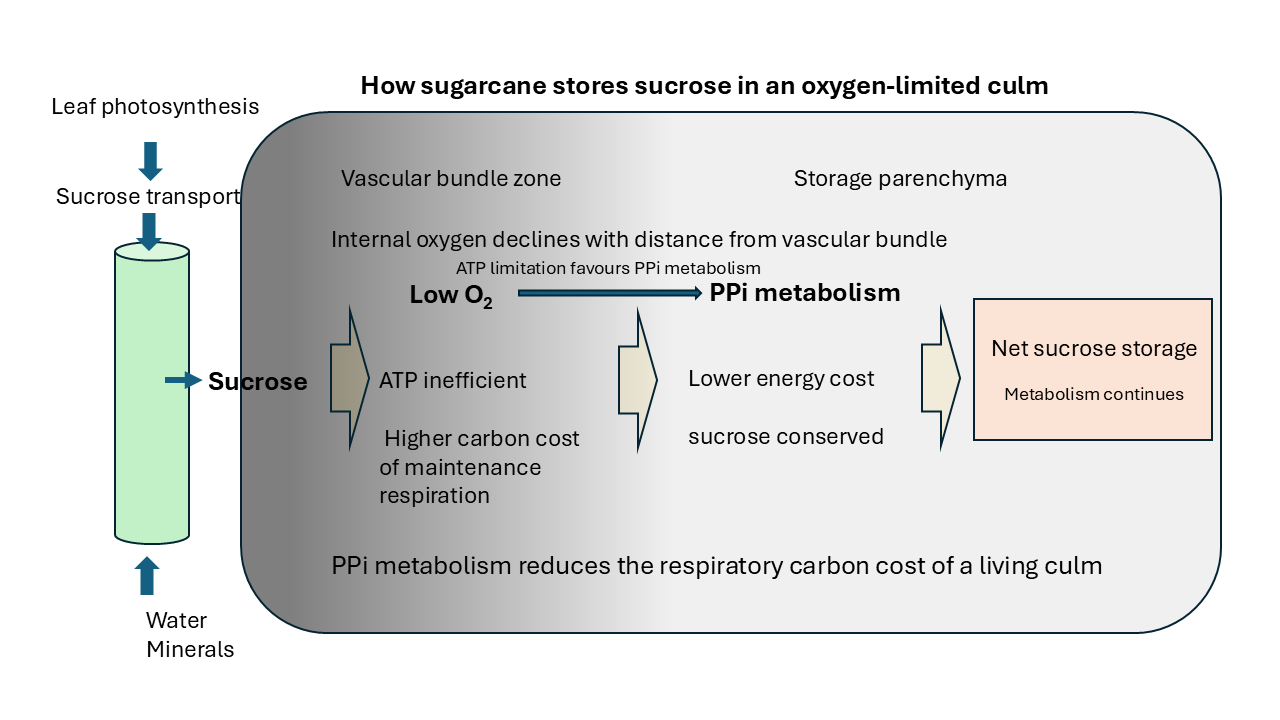
Figure 8.
Model of energy metabolism and sucrose accumulation in the sugarcane culm. The culm likely experiences an internal oxygen gradient associated with distance from vascular bundles. Reduced oxygen availability limits oxidative phosphorylation, increasing the glycolytic requirement for ATP production. Instead of substantial fermentation, pyruvate-derived carbon is proposed to be returned to hexose phosphates via PPi-dependent reactions including the PK/PPDK cycle and PFP activity, while vacuolar H+-pyrophosphatase maintains membrane energisation. This recycling loop regenerates oxidised cofactors and conserves carbon within sucrose, allowing sucrose accumulation under hypoxic conditions.


Table 1.
Discrete phyllochron (thermal time difference, ) at leaves 5, 10 and 15. Values are mean±SD in °Cd, Tukey letters per leaf, and the smallest adjusted p-value across pairwise comparisons for each genotype. Means with the same letter are not significantly different.
Table 1.
Discrete phyllochron (thermal time difference, ) at leaves 5, 10 and 15. Values are mean±SD in °Cd, Tukey letters per leaf, and the smallest adjusted p-value across pairwise comparisons for each genotype. Means with the same letter are not significantly different.
| Phyllochron 5 | Phyllochron 10 | Phyllochron 15 | |||||||
| Genotype | °Cd | adj-p | TUKEY | °Cd | adj-p | TUKEY | °Cd | adj-p | TUKEY |
| KQ228 | 55.9 ± 6.7 | 0.007 | b | 77.8 ± 6.6 | <0.001 | b | 93.9 ± 8.4 | 0.011 | b |
| Q240 | 61.3 ± 6.3 | 0.082 | a | 83.9 ± 4.0 | 0.004 | a | 100.6 ± 7.4 | 0.018 | a |
| SRA3 | 63.8 ± 8.9 | 0.007 | a | 85.4 ± 5.5 | <0.001 | a | 101.1 ± 5.0 | 0.011 | a |
Table 2.
Growth respiration () and maintenance respiration () (mg glucose equivalents per day) of sugarcane internodes of KQ228, Q240 and SRA3 from mid-season and end-of-season samples. Values are median and SD.
Table 2.
Growth respiration () and maintenance respiration () (mg glucose equivalents per day) of sugarcane internodes of KQ228, Q240 and SRA3 from mid-season and end-of-season samples. Values are median and SD.
| KQ228 | Q240 | SRA3 | |||||||||||
| Internode | Parameter | Median | SD | G | D | Median | SD | G | D | Median | SD | G | D |
| Mid-season peak growth | |||||||||||||
| 2 | 480.91 | 46.65 | b | B | 714.81 | 63.46 | a | A | 656.97 | 59.55 | a | B | |
| 4 | 751.52 | 91.69 | a | A | 749.92 | 164.79 | a | A | 957.62 | 55.34 | a | A | |
| 6 | 392.03 | 147.71 | b | B | 727.05 | 244.77 | b | A | 1282.73 | 229.10 | a | A | |
| 8 | 120.31 | 56.24 | a | C | 211.24 | 129.85 | a | B | 240.70 | 79.04 | a | C | |
| 12 | 81.79 | 89.40 | a | C | 138.94 | 165.29 | a | B | 91.71 | 74.07 | a | D | |
| 2 | 18.79 | 1.03 | c | E | 28.77 | 0.87 | a | F | 26.21 | 0.94 | b | G | |
| 4 | 63.73 | 2.56 | c | C | 93.58 | 2.64 | a | D | 88.40 | 2.43 | b | E | |
| 6 | 94.65 | 5.21 | b | A | 144.82 | 7.88 | a | B | 154.82 | 8.51 | a | C | |
| 8 | 100.04 | 7.96 | c | A | 157.24 | 5.40 | b | A | 177.23 | 4.82 | a | B | |
| 12 | 102.57 | 2.99 | c | A | 161.22 | 4.35 | b | A | 197.26 | 12.16 | a | A | |
| End-season slow growth | |||||||||||||
| 2 | 138.70 | 32.89 | a | A | 177.59 | 23.49 | a | A | 172.77 | 18.20 | a | A | |
| 4 | 147.22 | 28.25 | b | A | 217.02 | 31.17 | a | A | 228.49 | 43.36 | a | A | |
| 6 | 137.28 | 81.03 | a | A | 72.42 | 38.51 | a | B | 110.96 | 38.63 | a | B | |
| 8 | 67.25 | 10.74 | a | B | 51.55 | 15.25 | a | C | 45.43 | 22.75 | a | C | |
| 12 | 10.00 | 4.25 | a | B | 17.77 | 5.56 | a | C | 9.58 | 2.26 | a | C | |
| 2 | 5.62 | 0.36 | b | F | 6.19 | 0.26 | a | F | 6.20 | 0.08 | a | G | |
| 4 | 15.12 | 1.99 | b | D | 18.88 | 0.77 | a | D | 18.46 | 0.39 | a | E | |
| 6 | 25.21 | 0.46 | c | C | 26.46 | 0.94 | b | B | 28.12 | 0.58 | a | C | |
| 8 | 29.93 | 1.98 | a | B | 28.82 | 0.98 | b | A | 31.19 | 0.19 | a | B | |
| 12 | 34.94 | 2.63 | a | A | 29.86 | 1.22 | b | A | 34.46 | 0.76 | a | A | |
Notes: Lowercase letters (G) compare genotypes within each internode; UPPERCASE letters (D) compare developmental stages
within each genotype (Tukey HSD, α = 0.05).
Table 3.
Maintenance and growth respiration expressed as a percentage of total sink and biomass gain (), at selected internodes (2, 4, 8, 12) for mid and end season; values are genotype medians. Percentages computed per day. One-way ANOVA across genotypes is shown as p; ⁎ indicates .
Table 3.
Maintenance and growth respiration expressed as a percentage of total sink and biomass gain (), at selected internodes (2, 4, 8, 12) for mid and end season; values are genotype medians. Percentages computed per day. One-way ANOVA across genotypes is shown as p; ⁎ indicates .
| Phenotype | Internode | Metric | KQ228 | Q240 | SRA3 | p | Sig. |
| end-season | 2 | Growth / Sink (%) | 23.9 | 25.0 | 24.5 | 0.106 | |
| 2 | Maintenance / Sink (%) | 1.0 | 0.9 | 0.9 | 0.243 | ||
| 2 | maintenance/total respiration (%) | 24.8 | 25.8 | 25.4 | 0.109 | ||
| end-season | 4 | Growth / Sink (%) | 21.7 | 22.8 | 22.8 | 0.421 | |
| 4 | Maintenance / Sink (%) | 2.4 | 1.9 | 1.8 | 0.029 | * | |
| 4 | maintenance/total respiration (%) | 24.3 | 24.7 | 24.8 | 0.745 | ||
| end-season | 6 | Growth / Sink (%) | 21.2 | 19.6 | 19.4 | 0.521 | |
| 6 | Maintenance / Sink (%) | 3.8 | 9.0 | 5.4 | 0.715 | ||
| 6 | maintenance/total respiration (%) | 24.9 | 29.8 | 25.8 | 0.640 | ||
| end-season | 8 | Growth / Sink (%) | 20.4 | 20.6 | 21.3 | 0.950 | |
| 8 | Maintenance / Sink (%) | 9.1 | 11.4 | 15.2 | 0.286 | ||
| 8 | maintenance/total respiration (%) | 29.6 | 32.0 | 37.3 | 0.236 | ||
| end-season | 12 | Growth / Sink (%) | 5.6 | 15.6 | 6.2 | 0.441 | |
| 12 | Maintenance / Sink (%) | 79.1 | 37.1 | 70.5 | 0.678 | ||
| 12 | maintenance/total respiration (%) | 84.8 | 54.4 | 76.7 | 0.758 | ||
| midseason | 2 | Growth / Sink (%) | 22.7 | 22.7 | 23.2 | 0.359 | |
| 2 | Maintenance / Sink (%) | 0.9 | 0.9 | 1.0 | 0.172 | ||
| 2 | maintenance/total respiration (%) | 23.6 | 23.6 | 24.2 | 0.278 | ||
| midseason | 4 | Growth / Sink (%) | 23.1 | 22.7 | 23.5 | 0.840 | |
| 4 | Maintenance / Sink (%) | 2.0 | 2.7 | 2.1 | 0.026 | * | |
| 4 | maintenance/total respiration (%) | 25.1 | 25.3 | 25.7 | 0.954 | ||
| midseason | 6 | Growth / Sink (%) | 21.8 | 23.9 | 23.0 | 0.332 | |
| 6 | Maintenance / Sink (%) | 5.1 | 4.5 | 2.8 | 0.185 | ||
| 6 | maintenance/total respiration (%) | 26.5 | 27.8 | 25.8 | 0.324 | ||
| midseason | 8 | Growth / Sink (%) | 19.3 | 19.7 | 19.7 | 0.640 | |
| 8 | Maintenance / Sink (%) | 17.8 | 16.0 | 13.6 | 0.553 | ||
| 8 | maintenance/total respiration (%) | 37.6 | 36.0 | 31.7 | 0.514 | ||
| midseason | 12 | Growth / Sink (%) | 20.2 | 15.1 | 12.4 | 0.736 | |
| 12 | Maintenance / Sink (%) | 30.0 | 44.0 | 45.9 | 0.916 | ||
| 12 | maintenance/total respiration (%) | 54.5 | 62.0 | 63.2 | 0.961 |
Table 4.
Carbon-skeleton construction requirement per unit dry-mass gain along the sugarcane culm of genotypes KQ228, Q240 and SRA3. Values represent the glucose-equivalent substrate required to supply the carbon skeleton for net biomass formation (; g glucose g−1 dry-mass increase) for each internode position.Genotype and phenotype p-values are from two-way ANOVA testing the effects of genotype and growth stage (mid-season fast growth vs. end-season slow growth). Significant effects () indicate differences in construction efficiency among genotypes or developmental stages at a given internode.
| Internode | Skel/ΔW+ mean | Skel/ΔW+ SD | Genotype p | Phenotype p | n |
| 1 | 1.079 | 0.071 | 0.040 | 0.881 | 24 |
| 2 | 1.061 | 0.110 | 0.093 | 0.747 | 24 |
| 3 | 1.024 | 0.129 | 0.056 | 0.002 | 24 |
| 4 | 1.047 | 0.176 | 0.944 | 0.088 | 24 |
| 5 | 0.992 | 0.235 | 0.549 | 0.072 | 24 |
| 6 | 1.136 | 0.529 | 0.144 | 0.012 | 24 |
| 8 | 3.174 | 4.248 | 0.006 | 0.189 | 24 |
| 10 | 3.901 | 9.034 | 0.152 | 0.570 | 22 |
| 12 | 2.441 | 2.766 | 0.029 | 0.004 | 18 |
Table 5.
Energetic penalty of reduced oxygen availability on sink demand in sugarcane internodes. Values represent the percentage increase in total glucose requirement per unit dry-mass gain () relative to fully aerobic metabolism. Mild hypoxia assumes that 75% of ATP demand is met by mitochondrial oxidative phosphorylation and 25% by fermentative metabolism, whereas severe hypoxia assumes 25% oxidative and 75% fermentative ATP production. Positive values therefore indicate the additional carbohydrate required to sustain the same physiological activity under reduced oxygen availability. Results are shown as mean ± standard deviation. Genotype and phenotype p-values are from two-way ANOVA testing.
| Internode | % inc mild | % inc severe | n | |||
| 1 | 1.407 | 1.445 | 1.908 | 2.739 | 35.658 | 8 |
| 2 | 1.369 | 1.409 | 1.868 | 2.903 | 36.435 | 8 |
| 3 | 1.309 | 1.348 | 1.785 | 3.029 | 36.419 | 8 |
| 4 | 1.427 | 1.477 | 2.012 | 3.474 | 40.974 | 8 |
| 5 | 1.395 | 1.447 | 1.954 | 3.732 | 40.103 | 8 |
| 6 | 1.691 | 1.763 | 2.447 | 4.271 | 44.725 | 8 |
| 8 | 8.909 | 9.312 | 12.874 | 4.523 | 44.498 | 8 |
| 10 | 19.121 | 21.411 | 38.535 | 11.974 | 101.526 | 6 |
| 12 | 7.311 | 8.618 | 17.811 | 17.867 | 143.600 | 4 |
Disclaimer/Publisher’s Note: The statements, opinions and data contained in all publications are solely those of the individual author(s) and contributor(s) and not of MDPI and/or the editor(s). MDPI and/or the editor(s) disclaim responsibility for any injury to people or property resulting from any ideas, methods, instructions or products referred to in the content. |
© 2026 by the author. Licensee MDPI, Basel, Switzerland. This article is an open access article distributed under the terms and conditions of the Creative Commons Attribution (CC BY) license.
Copyright: This open access article is published under a Creative Commons CC BY 4.0 license, which permit the free download, distribution, and reuse, provided that the author and preprint are cited in any reuse.


