
Submitted:
03 March 2026
Posted:
03 March 2026
You are already at the latest version
Abstract
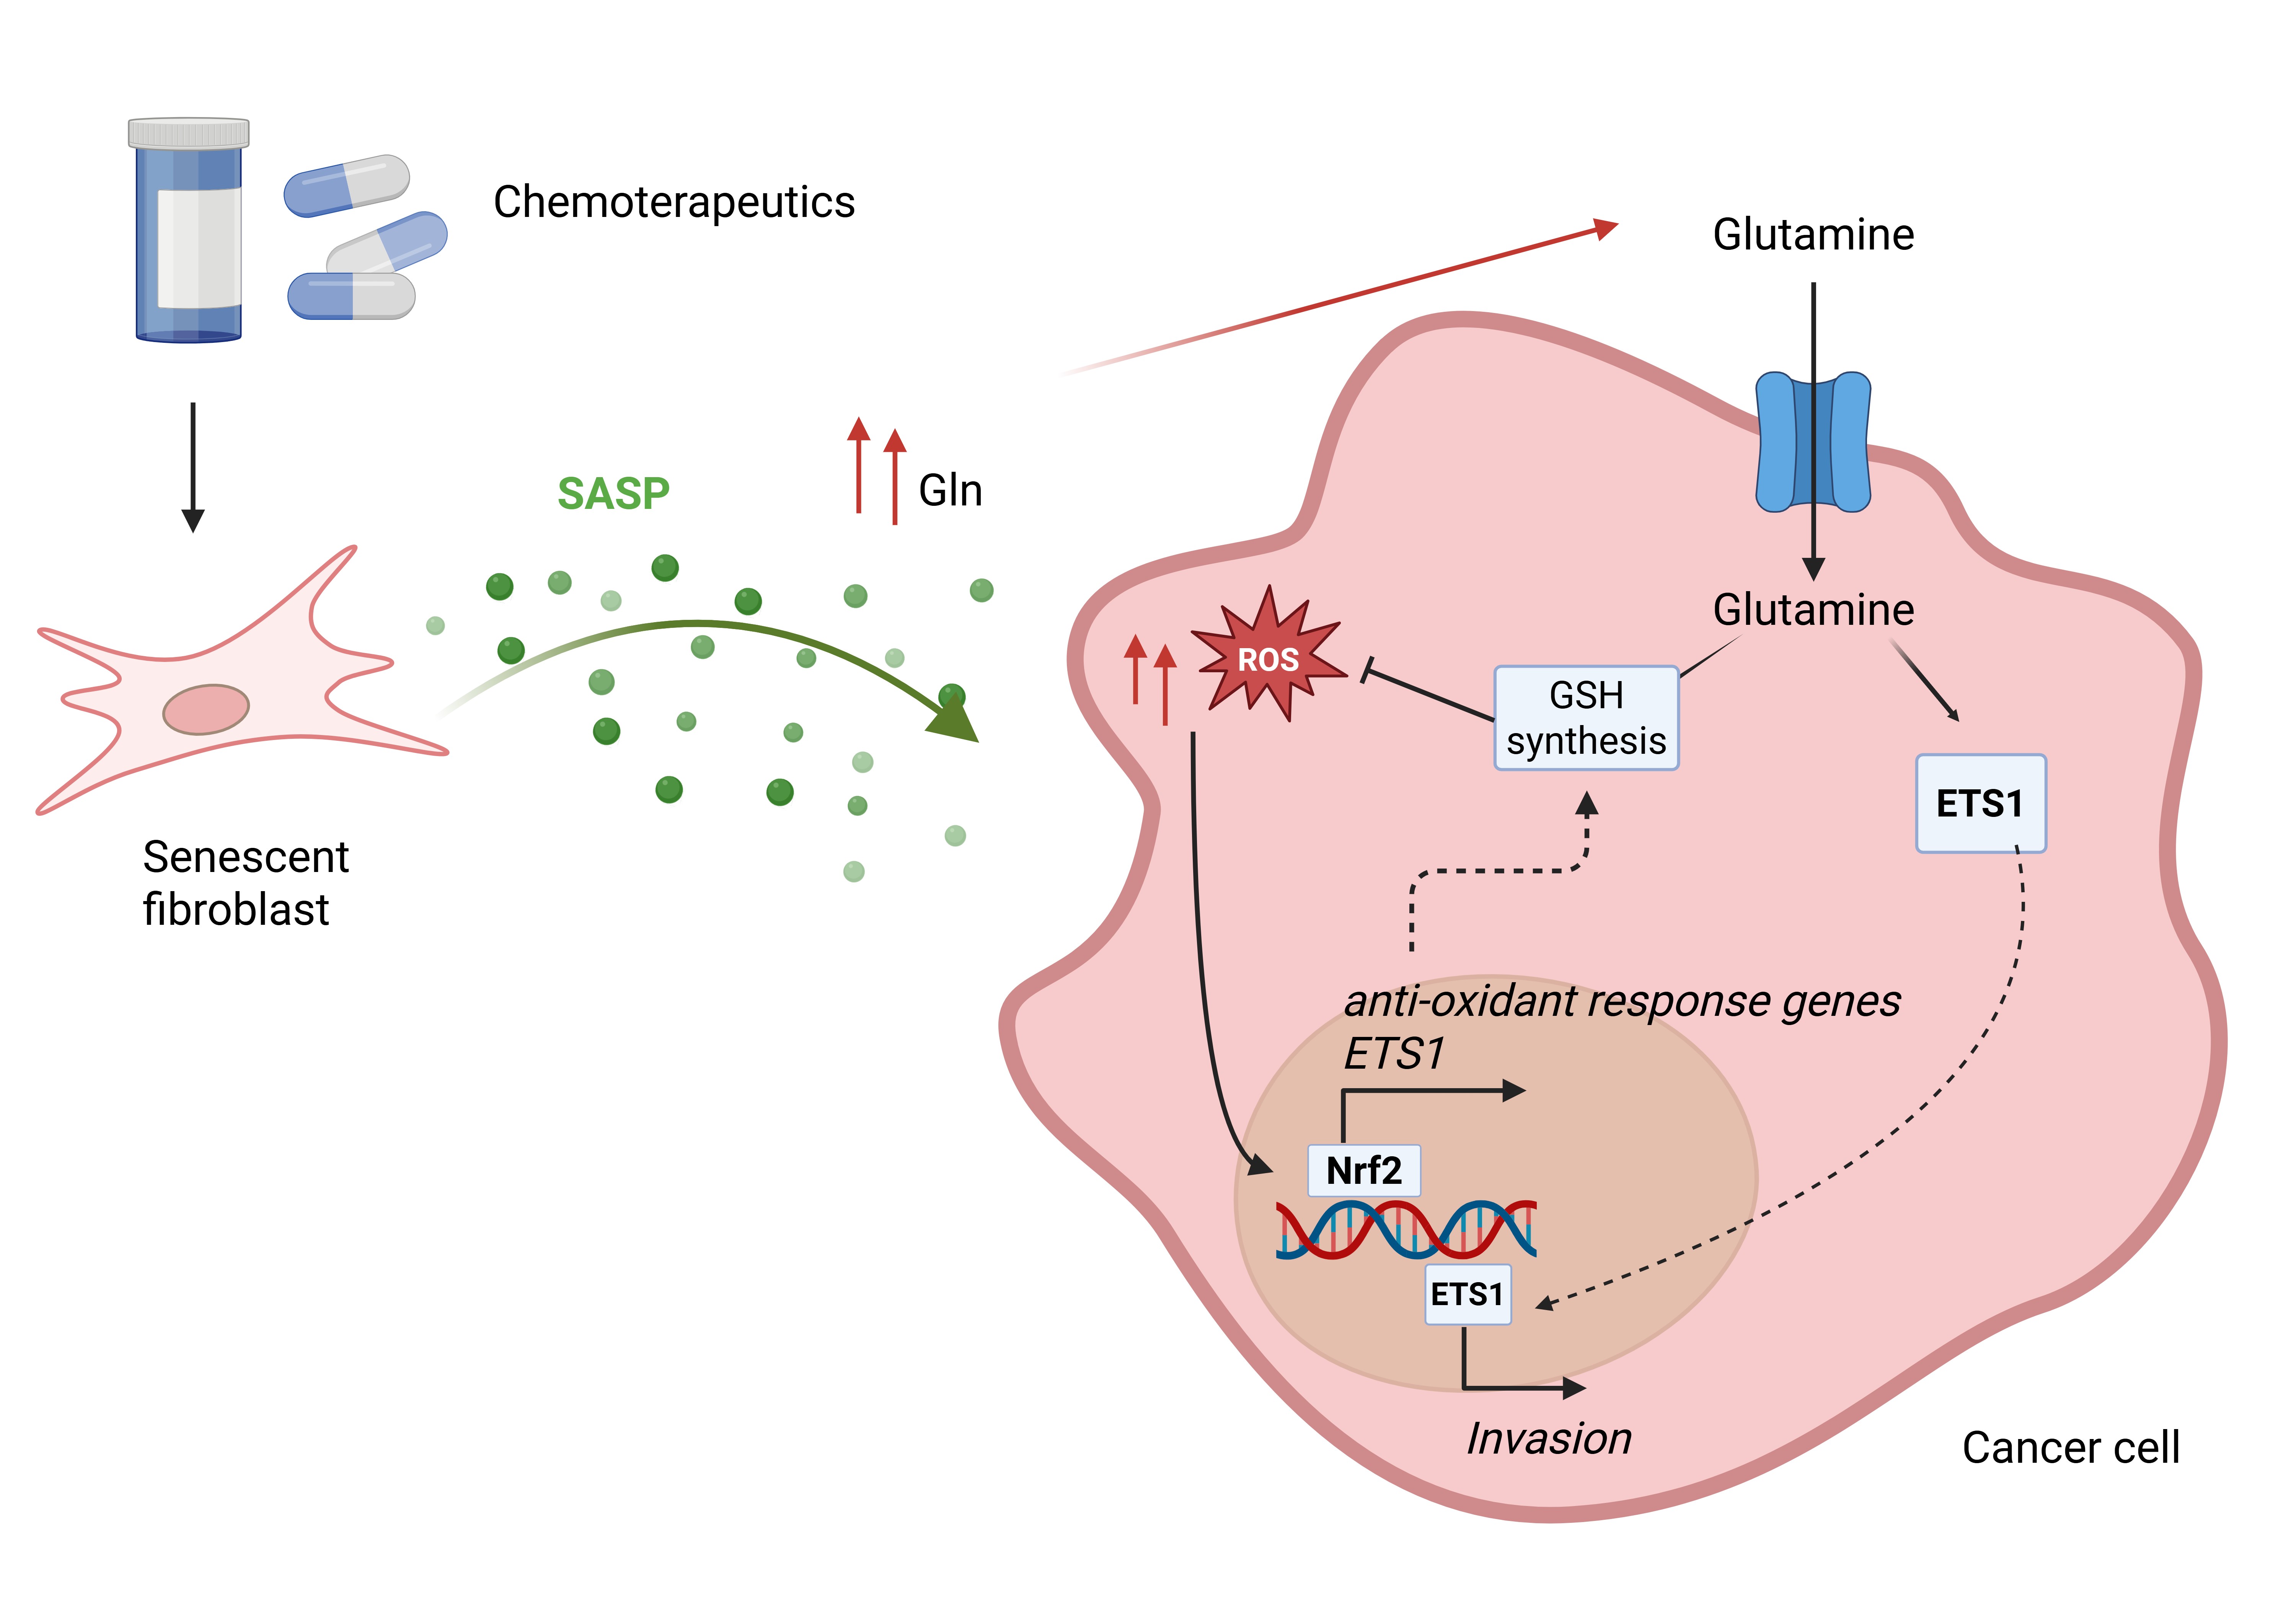
Cancer progression is influenced by the dynamic interplay between tumor cells and the surrounding stromal microenvironment. Therapy-induced senescence (TIS) of stromal fibroblasts represents a common outcome of anticancer treatments, contributing to tumor progression through the senescence-associated secretory phenotype (SASP). While SASP cytokines promote cancer malignancy, the contribution of secreted metabolites from senescent cells remains poorly understood. Here, we investigate the role of senescent stromal metabolism in regulating prostate and ovarian cancer cell invasion. Conditioned media (CM) from TIS-induced human prostate (HPFs) and ovarian fibroblasts (HOFs) promote enhanced invasion of cancer cells. Invasion is partially preserved after exposure to boiled, protein depleted CM, suggesting a role for heat-stable metabolic factors. Metabolomic profiling of senescent fibroblasts-derived CM reveals a significant increase in Glutamine (Gln) levels. Exposure of cancer cells to senescent CM increases Gln uptake, together with upregulation of the transporter SLC1A5 and increased intracellular Gln. This metabolic adaptation is associated with increased malignant phenotype including epithelial-to-mesenchymal transition (EMT) and stemness features. Extracellular Gln depletion, pharmacological inhibition of glutaminase-1 (GLS1) in cancer cells or Gln synthetase (GS) silencing in fibroblasts markedly impair senescent fibroblasts CM-induced invasion, EMT markers expression, and stemness features in cancer cells. Mechanistically, stromal-derived Gln promotes cancer cell invasion through activation of a redox-dependent NRF2/ETS1 signaling axis. Analysis of patient-derived transcriptomic datasets further supports chemotherapy-associated upregulation of Gln metabolism and ETS1 expression. These findings identify senescent stromal-derived Gln as a key metabolic driver of prostate and ovarian cancer aggressiveness, and a potential therapeutic vulnerability in the context of TIS.
Keywords:
therapy-induced senescence
; fibroblasts
; glutamine metabolism
; cancer cell invasion
; NRF2/ETS1 signaling
1. Introduction
Cancer progression is supported by the crosstalk between tumor cells and the surrounding stroma. In this context, it is known that senescent stromal cells contribute to the development of a pro-inflammatory milieu and the acquisition of aggressive traits by cancer cells [1]. In addition to classic senescence inducers, such as telomere shortening, oncogene activation, DNA damage, epigenetic changes, or oxidative stress [2], it has been shown that anticancer treatments can also induce cellular senescence (known as therapy-induced senescence, TIS) in both tumor and non-cancerous cells, thus contributing to many detrimental side effects of therapies [3]. In this context, the senescence-associated secretory phenotype (SASP), which comprises a broad spectrum of cytokines, chemokines, growth factors, proteases, and metabolites, profoundly influences the tumor microenvironment (TME) by modulating inflammation, remodeling the extracellular matrix, and altering the behavior of neighboring cells [4]. While initially senescence acts as a tumor-suppressive mechanism by halting the proliferation of damaged cells, the SASP can paradoxically promote tumor progression at later stages of the disease. In particular, factors released by senescent fibroblasts promote cancer cell proliferation, angiogenesis, immune evasion, enhance phenotypic plasticity, by fostering traits such as epithelial-to-mesenchymal transition (EMT) and stemness, which are associated with metastasis and therapy resistance [5,6].
Previously, we investigated the effects of chemotherapy on the stromal compartment of prostate and ovarian cancers, and demonstrated that anticancer chemotherapeutics, regardless of their specific mechanism of action, induce a senescent phenotype in patient-derived stromal prostate and ovarian fibroblasts sustaining the invasive potential of tumor cells through the SASP [7]. Given that senescent cells undergo intense metabolic reprogramming to support survival and increased secretion of SASP factors [8], here we focused our attention on a possible involvement of SASP-associated metabolic components in regulating tumor progression, which to date has not been extensively investigated. Beyond soluble factors and cytokines, extracellular metabolites released by the tumor stroma are increasingly recognized as key regulators of cancer progression, promoting proliferation, immune escape, and metastases [9,10]. In this context, we found that the amino acid Glutamine (Gln) is enriched in the conditioned media (CM) of TIS senescent stromal cells. Given the established role of Gln in fueling cancer metabolism and supporting anabolic processes [11], we hypothesized that stromal-derived Gln might contribute to the acquisition of aggressive traits in cancer cells. In accordance, we demonstrated that the utilization of senescent-stromal-derived Gln by ovarian and prostate cancer cells plays a pivotal role in supporting increased metastatic potential and stem-like traits. Collectively, our findings uncover a previously uncharacterized role of the metabolic component of the SASP, specifically Gln, in driving cancer cell invasion and stemness. Collectively, these results identify TIS-derived Gln as a critical factor in tumor progression and point to metabolic crosstalk between tumor and stroma as a potential therapeutic vulnerability.
2. Materials and Methods
Cell Lines
Human prostate (PC3) and ovarian (SKOV3) cancer cell lines were obtained from ATCC. Human Prostate Fibroblasts (HPFs) were obtained from tissue samples isolated during surgery from patients (average age 70) who underwent surgical treatment for lower urinary tract symptoms caused by benign prostatic hyperplasia (BPH). Human Ovarian Fibroblasts (HOFs) were extracted from healthy peritoneal tissue samples collected during cytoreductive surgery performed on patients (average age 66) with advanced ovarian cancer. Surgical explants were obtained in accordance with the Ethics Committee of the Azienda Ospedaliera Universitaria Careggi (Florence, Italy), for prostate tissues: num 16583_bio; for ovarian tissues: num 14780.
All cells were cultured in Dulbecco’s Modified Eagle Medium (DMEM) high glucose (4.5 g/L) (Euroclone), supplemented with 10% Fetal Bovine Serum (Euroclone), 2 mM L-Gln (Euroclone), 1% penicillin and streptomycin (Euroclone). Cells were routinely grown at 37°C in humidified atmosphere with 5% CO2.
To obtain HPFs and HOFs, a fragment of surgical explant was transferred into a Petri dish and cut into small pieces about 0.2 cm. Then, tissue fragments were transferred into a new cell culture dish and placed in a central stripe under the pressure of a sterilized slide. DMEM high glucose supplemented with 20% FBS, 2 mM L-Gln, 2% Penicillin/Streptomycin, 100 μg/mL Kanamycin (Merck Sigma) and 2.5 μg/mL Amphotericin B (Euroclone) was added. After 20 days fibroblasts that had formed a monolayer were detached by trypsinization and routinely cultured.
Cell Treatments and Preparation of CM
To induce senescence, HPFs and HOFs were exposed to either 5 nM Docetaxel (MedChemExpress HY-B0011) in dimethyl sulfoxide (DMSO) or 20 μM Cisplatin (Merck Sigma #5663-27-1) in DMSO, respectively for 24h, while DMSO was added in control samples. Then, culture medium was changed, and cells were maintained in complete medium for additional 6 days before experiments were conducted, unless noted otherwise. To collect CM, senescent and control cells obtained as previously described, were incubated for 24h in starvation medium. CM was collected, clarified by centrifugation for 10 min at 1000 rpm and used freshly or stored at -80°C until use. Prostate and ovarian cancer cells were then incubated for 72h with CM from HPFs or HOFs, respectively.
Senescence-Associated β-Galactosidase Staining
Fibroblasts were fixed with 3% paraformaldehyde in PBS for 5 min and washed three times in PBS. Then cells were incubated with Senescence-Associated β-Galactosidase (SA-β-Gal) staining solution (5 mM potassium ferrocyanide, 5 nM potassium ferricyanide, 150 mM NaCl, 2 mM MgCl2, 40 mM citric acid monohydrate, 1 mg/mL 5-bromo-4-chloro-3-indolyl β-D-galactopyranoside, (Merck Sigma #B4252) pH 6.0) for 12 to 18h at 37°C in a non-humidified incubator under atmospheric CO2 conditions. Photos were taken at five randomly chosen fields and cells positive to (SA-β-Gal) staining were detected by the presence of an insoluble blue intracellular precipitate. Total and positive cells were counted using ImageJ imaging system.
Western Blotting
Cells were lysed at 4°C with RIPA buffer (Thermo Fisher Scientific, #89900) and supplemented with protease and phosphatase cocktail inhibitors (Merck Sigma). After 20 min cellular extracts were centrifuged for 10 min at 14000 rpm and protein concentration were quantified using Bicinchoninic Acid (BCA) assay (Euroclone). Then, 20 to 30 μg of total proteins was loaded on SDS-PAGE gels (BioRad) and transferred to PVDF membranes (BioRad). Membranes were blocked for 1h at room temperature in 5% non-fat dry milk (Santa Cruz Biotechnology) in PBS-Tween 0.1% and then incubated overnight at 4°C with primary antibody against p21 (Santa Cruz Biotechnology, sc-271610), p16 (Santa Cruz Biotechnology, sc-56330), Gln synthetase (GS) (Cell Signaling, D203F), NRF2 (Santa Cruz Biotechnology, sc-365949), ETS1 (Cell Signaling, B808A), HSP90 (Santa Cruz Biotechnology, sc-69703), β-Actin (Santa Cruz Biotechnology, sc-47778), Vinculin (Merck Sigma V9264). Then, membranes were incubated for 1h at room temperature with anti-rabbit horseradish peroxidase-conjugated (Santa Cruz Biotechnology #2357) or anti-mouse horseradish peroxidase-conjugated (Santa Cruz Biotechnology #516102). Proteins were visualized using Clarity Western ECL Substrate (BioRad) and images acquired using Amersham Imager 600 (GE Healthcare). HSP90 or β-Actin was used to ensure equal loading. All western blot images are representative of at least three independent experiments.
Invasion Assay
Prostate cancer cells (8x10⁴) and ovarian cancer cells (10x104) were seeded in 200 μL of starvation medium in the upper compartment of 8 μm pore Transwell (Greiner Bio-One) coated with 50 μg/cm2 Matrigel (Corning). In the lower compartment, complete medium containing 10% FBS was added as chemoattractant. After 16h, cells that have invaded toward the lower surface of the filters were fixed and stained with Crystal Violet (Merck Sigma). The values for invasion were expressed as the average number of invading cells per microscopic field over five randomly chosen fields.
Real-Time PCR
Total RNA was extracted from cells using RNeasy Plus Mini Kit (Qiagen #74134) according to the manufacturer’s instruction and quantified with NanoDrop Microvolume Spectrophotometer and Fluorometer (Thermo Fisher Scientific). cDNA synthesis was obtained by incubating 1 μg of total RNA with High-Capacity cDNA Reverse Transcription Kit (Thermo Fisher Scientific) according to the manufacturer’s instructions. mRNA expression levels were quantified by Real-Time PCR using Luna Universal qPCR Master Mix (New England Biolabs).
The nucleotide sequences of the specific primers (Thermo Fisher Scientific) used were: EpCAM-FW 5’-TGTGGTGATAGCAGTTGTTGC-3’, EpCAM-REV 5’-CTATGCATCTCACCCATCTCC-3’; ECAD-FW 5’-AGGCCAAGCAGCAGTACATT-3’, ECAD-REV 5’-ATTCACATCCAGCACATCCA-3’; NCAD-FW 5’-CCTCCAGAGTTTACTGCCATGAC-3’, NCAD-REV 5’-GTAGGATCTCCGCCACTGATTC-3’; VIM-FW 5’-ACACCCTGCAATCTTTCAGACA-3’, VIM-REV 5’-GATTCCACTTTGCGTTCAAGGT-3’; ZEB1-FW 5’-AAGAAAGTGTTACAGATGCAGCTG-3’, ZEB1-REV 5’-CCCTGGTAACACTGTCTGGTC-3’; ZEB2-FW 5’-AGGGACAGA TCAGCACCAAA-3’; ZEB2-REV 5’-GTGCGAACTGTAGGAACCAG-3’; SNAIL-FW 5’-CCTCCCTGTCAGATGAGGAC-3’, SNAIL-REV 5’-CAAGGAATACCTCAGCCTGG-3’; SLUG-FW 5’-ACAGCGAACTGGACACACAT-3’, SLUG-REV 5’-GATGGGGCTGTATGCTCCT-3’; B2M-FW 5’-AGTATGCCTGCCGTGTGAAC-3’, B2M-REV 5’-GCGGCATCTTCAAACCTCCA-3’.
qRT-PCR was performed using CFX96 Real-Time PCR System (BioRad). Data were reported as relative quantity with respect to the reference samples using 2-ΔΔCt. Data were normalized on β2-microglobulin.
Total ROS Quantification
Intracellular reactive oxygen species (ROS) levels were assessed using the fluorescent probe 2′,7′–dichlorofluorescin diacetate (DCFDA, Merck Sigma, #287810). Cells were detached, pelleted by centrifugation, and resuspended in a staining solution containing 5 µM DCFDA. Samples were incubated for 30 min at 37°C protected from light. Following incubation, cells were washed to remove excess dye and resuspended in PBS for recovery. Flow cytometry analysis was performed using a BD FACS Canto II cytometer (BD Biosciences). The viable cell population was gated based on morphological properties using Forward Scatter (FSC) and Side Scatter (SSC). Fluorescence was detected on the FITC channel (488 nm excitation laser; 530/30 nm bandpass filter). Background fluorescence was established using unstained controls to define the threshold for positivity. Data were recorded and analyzed as both the percentage of positive cells and the Mean Fluorescence Intensity (MFI).
Prostate and Ovarian Sphere Formation
Cells were grown in anchoring-independent conditions into poly-hydroxyethylmethacrylate (poly-HEMA)-coated dishes (Merck Sigma, #P3932) with selective serum-free DMEM/F12 medium supplemented with 50X B27 (Gibco), 20 ng/mL bFGF (Bio-Techne), 20 ng/mL EGF (Relia Tech). For PC3 sphere medium was also supplemented with N2 Supplement 100X (Gibco, #17502-048). Briefly, cancer cells were incubated for 72h with CM from HPFs and HOFs, then 700 cells/well (PC3) or 1000 cells/well (SKOV3) were seeded in a 96 well plate precoated with poly-HEMA. After 7 days, photos were taken to determine the volume of spheres. Data were reported as the average volume of formed spheres/field, in at least 5 randomly chosen fields. Spheroids volume was calculated measuring length (L) and height (H) with ImageJ using the following formula: V=(L2*H)/2, as previously reported [12].
Cell Transfection
Control siRNA (SIC001) and GS siRNA (#HS02_00307974) were purchased from Merck Sigma. Senescent cells were transfected with RNAiMAX (Thermo Fisher Scientific) according to manufacturer’s instructions. GS expression was assessed by western blotting 48h after transfection.
Cell Viability
Cells (6x10³) were seeded in 100 μL of complete culture medium in 96-well plates and treated 24h after the seeding. Then, cells were washed with PBS and 5 mmol/L MTT (3-(4,5-Dimethylthiazol 2-yl)-2,5-diphenyltetrazolium bromide, Merck Sigma) was added for 1h at 37°C. The resulting formazan crystals were dissolved in 200 µL of DMSO, and absorbance was measured at 595 nm using a spectrophotometer MULTISKAN FC (Thermo Scientific).
To test the effect of Gln deprivation, 15x104 cells were seeded in 35 mm dishes and incubated with or without 1% Gln (Euroclone) for 72h. Then cells were detached and incubated with LIVE/DEAD Violet Kit (Thermo Fisher Scientific, #L34964A) for 30 min at RT according to the manufacturer’s protocol. The dye was reconstituted in 50 µL of DMSO and diluted 1:500 in PBS to create a working solution. Following a single wash with PBS, samples were analyzed via flow cytometry using a BD FACSCanto II. The violet dye (excitation 405 nm; emission 450 nm) was detected using a BV421/DAPI filter, allowing for clear discrimination between unstained live cells and stained dead cells.
Determination of GSH/GSSG
The intracellular reduced (GSH) and oxidized (GSSG) glutathione levels were measured using the GSH/GSSG-Glo™ Assay (Promega, V6611), according to the manufacturer’s instructions. Briefly, cells were lysed and total glutathione (GSH + GSSG) was quantified through the conversion of a GSH probe, Luciferin-NT, to luciferin by a glutathione S-transferase enzyme. To selectively measure GSSG, GSH was first derivatized using the provided masking reagent, allowing specific detection of GSSG. Luminescence was measured using a Sinergy H1 plate reader (BioTek Winooski, Vermont, USA), and GSH concentrations were calculated from standard curves. Values were normalized to protein content.
Determination of Gln and Ammonium Levels
Gln and ammonium levels were determined using the L-Glutamine/Ammonia Assay Kit (Rapid) (Megazyme, K-GLNAM), according to the manufacturer’s instructions. Briefly, the Gln levels were measured in culture media through an enzymatic conversion of Gln to glutamate (Glu) and ammonium by glutaminase (GLS). Ammonium was subsequently quantified through a glutamate dehydrogenase–coupled reaction by monitoring NADPH consumption as a decrease in absorbance at 340 nm with an uv-1800 shimadzu spectrophotometer.
Gas Chromatography–Mass Spectrometry (GC-MS) Analysis
For total metabolites quantification, media from HPFs and HOFs were collected and 50 μL were mixed with 50 μL of cold 80% methanol in HPLC water containing 1 µg/ml norvaline and 1.25 µg/ml glutaric acid as internal standards.
For tracing experiments, fibroblasts were cultured in MEM (Gibco) supplemented with 1% MEM vitamins (Merck Sigma), 1% penicillin-streptomycin (Euroclone), 0.4 mM glycine (Merck Sigma), 0.4 mM serine (Merck Sigma), and 17 mM [U-13C] glucose (Cambridge Isotope Laboratories, Inc). After 24h, CM was collected. One aliquot of CM was used for metabolites extraction and GC–MS analysis, as described above. Metabolites were also extracted from fibroblast cell lysates. The remaining portion of the labelled CM was used to treat PC3 cells for 24h. Then, metabolites were extracted from PC3 cells for subsequent analysis. To extract intracellular metabolites, fibroblasts and PC3 cells were washed twice with 0.9% NaCl at 4°C and scraped in 400 µL of cold 80% methanol in HPLC water containing 1 µg/ml norvaline and 1.25 µg/ml glutaric acid as internal standards. Samples were sonicated on ice for 5s for three times with a 5s interval at 70% amplitude, centrifugated at 14000 rpm, 4°C for 10 min, and supernatants were collected. Samples were dried by using a vacuum concentrator (Labconco). Dried samples were derivatized with 10 µl of 40 mg/ml methoxyamine hydrochloride (Merck #226904) in pyridine (Merck #270970) for 90 min at 37 °C. Then, 50 µl of N-(tert-butyldimethylsilyl)-N-methyl-trifluoroacetamide, with 1% tert-butyldimethylchlorosilane (Merck Sigma #375934) were added in each sample and incubated for 30 min at 60°C. GC-MS runs were performed by using an Intuvo 9000 GC / 5977B MS System (Agilent Technologies) equipped with an HP-5MS capillary column (30 m x 0.25 mm x 0.25 µm). 1 µl of each sample was injected in splitless mode using an inlet liner temperature of 240°C. GC runs were performed with helium as carrier gas at 1 ml/min. The GC oven temperature ramp was from 70°C to 280°C. The temperature of 70°C was held for 2min. Then, the first temperature ramp was from 70°C to 140°C at 3°C/min. The second ramp was from 140°C to 150°C at 1°C/min. The third temperature ramp was from 150°C to 280°C at 3°C/min. The measurement of metabolites was performed under electron impact ionization at 70 eV using a SIM mode. The ion source and transfer line temperature were set to 230°C and 290°C, respectively.
MS Quantitative Analysis software (Agilent Technologies, version 10.2) was used for determination of relative metabolite abundance: the integrated signal of selected ion for each metabolite was normalized by the signal of the norvaline or glutaric acid and by protein amount. For isotopic labelling experiments, all the measured values were corrected for 13C natural abundance by using IsoCorrectoR [13].
Confocal Immunofluorescence
Sub-confluent PC3 and SKOV3 cells grown on glass coverslips were incubated for 72h with CM from HPFs or HOFs; Bis-2-(5-phenylacetamido-1,2,4-thiadiazol-2-yl) ethyl sulfide (BPTES) 1 µM was added during the final 16h of incubation. Nuclei were stained with DAPI (Sigma Aldrich, D9542) for 20 min at 37 °C. ETS1 protein was stained with rabbit monoclonal anti-ETS1 (1:1000, Cell Signaling, #14069), followed by anti-rabbit Alexa Fluor 568-conjugated secondary antibodies (Thermo Fisher Scientific, #A-11011, red channel). Cell fluorescence was imaged using a Leica TCS SP8 confocal scanning microscope (Leica, Mannheim, DE, USA). Observations were made with a Leica HC PL Apo CS2 X63 oil immersion objective. Images reconstruction and signal fluorescence quantification was obtained using Image J Fiji software [14].
Statistical Analysis
Statistical analysis of the data was performed by unpaired Student t-test or One-way ANOVA for pairwise comparison of groups with GraphPad Prism version 8.0 (GraphPad Software). All data were expressed as the mean ±SEM. A p value ≤ 0.05 was considered statistically significant. All the statistical analyses were carried out on three biological replicates. Statistical analysis of gene expression datasets from patients with ovarian cancer was performed by Wilcoxon paired test.
3. Results
3.1. The Metabolic Composition of CM Derived from Senescent Fibroblasts Supports Ovarian and Prostate Cancer Cell Invasion
As previous reported [7] chemotherapy treatment with Docetaxel (DTX) and Cisplatin (CPT) is able to induce TIS in human fibroblasts isolated from surgical explants of patients affected by benign prostatic hyperplasia (HPFs) or from healthy peritoneal tissues obtained during cytoreductive surgery for ovarian cancer (HOFs) [7]. Here, we extended the analysis to fibroblasts derived from newly established primary cultures obtained from 8 ovarian and 10 prostate cancer patients. All experiments were performed on fibroblasts derived from at least three different patients with prostatic hyperplasia or ovarian cancer. We first confirmed that chemotherapy treatment induces TIS in fibroblasts as shown by SA-β-Gal staining and expression of senescence markers (Figure 1A-B). Moreover, CM from senescent fibroblasts sustain the acquisition of increased invasive abilities (Figure 1C) and increased expression of specific markers of EMT (Figure 1D) in PC3 and SKOV3 cancer cells.
To investigate the involvement of cytokine-independent components of SASP in conferring increased aggressiveness to cancer cells, we excluded the contribution of protein components by boiling senescent fibroblasts-derived CM. Interestingly, we observed that both PC3 and SKOV3 cells partially retain the ability to invade after the incubation with boiled/protein-depleted CM (Figure 1E), suggesting a possible role of a secreted metabolite in the induction of this aggressive trait in cancer cells. To further explore the contribution of stromal-derived metabolites to the pro-tumorigenic effects of senescent CM, we performed a metabolomic profiling of CM derived from senescent and control HPFs and HOFs by GC–MS. This analysis identified a subset of metabolites whose abundance was significantly altered in CM from senescent fibroblasts compared with their non-senescent counterparts (Figure 1F). Notably, some of these metabolites were commonly deregulated across both prostate and ovarian stromal models, indicating the existence of conserved metabolic alterations associated with stromal senescence. Interestingly, among these shared metabolites, Gln emerged as one of the most significantly enriched in senescent cell-derived CM from both cellular models. Given the well-established Gln addiction of multiple tumor types [15], we focused our subsequent analyses on Gln as a potential key metabolic mediator of the pro-invasive and pro-aggressive effects exerted by senescent cell-derived CM on prostate and ovarian cancer cells.
3.2. Availability of Senescent Stroma-Derived Gln Drives Invasive Abilities of PC3 and SKOV3 Cells
We first tested the effect of Gln supplementation on prostate and ovarian cancer cell invasion and we found that it markedly enhanced the invasive properties of PC3 and SKOV3 cells (Figure 2A) to a similar extent as observed following conditioning of cancer cells with CM from senescent cells (Figure 1C), suggesting that Gln alone can really drive the invasive abilities of cancer cells. As a complementary approach, we depleted Gln from senescent fibroblast–derived CM by exploiting the glutaminase activity of L-asparaginase (ASNase) (see Supplementary Figure S1A and [16]) and observed a marked reduction in cancer cell invasion following incubation with ASNase-treated senescent CM (Figure 2B). Notably, we showed that either lack of Gln or ASNase treatment do not affect cell viability as shown in Supplementary Figure S1B-C.
Thus, we hypothesized that senescent stromal derived-Gln could be exploited by cancer cells to fuel their aggressive behavior. To investigate whether Gln released by senescent fibroblasts contributes to cancer cell specific response, we incubated PC3 and SKOV3 cancer cells with senescent cell-derived CM. Subsequently, mRNA levels of the Gln transporter SLC1A5 were quantified by RT-PCR, and intracellular levels of Gln and Glu were measured by GC-MS. We observed that the treatment with CM derived from senescent fibroblasts resulted in increased expression of SLC1A5 (Figure 2C) and enhanced intracellular content of Gln and Glu (Figure 2D). Notably, even if in ovarian cancer cells intracellular Gln was not detectable, we coherently measured a significant increase in Glu abundance.
Moreover, to investigate the role of Gln in tumor cells, we evaluated the effect of incubating cells in the presence of BPTES, which is a specific and selective inhibitor of GLS1 and Gln metabolism [17]. Indeed BPTES, preventing Gln utilization by cancer cells, reduced cell invasion (Figure 2E) without affecting cell viability (see Supplementary Figure S1D). Besides, to confirm the role of senescent stromal-derived Gln on the invasive abilities of prostate and ovarian cancer cells, we incubated PC3 and SKOV3 cells with boiled CM in the presence of the BPTES inhibitor. We found that the impairment of Gln utilization severely decreased the invasive abilities of both cancer cell lines (Figure 2F). Together, these data underline the powerful role of Gln utilization to drive the invasion of cancer cells.
Furthermore, since invasion and the development of the EMT program are closely related to the acquisition of stemness features in cancer cells [18], we analyzed whether senescent stromal-derived Gln could induce a stem cell phenotype in tumor cells. Thus, we evaluated the ability of tumor cells to form prostate and ovarian spheres following incubation with senescent cell-derived CM. As shown in Figure 3A, CM from senescent fibroblasts significantly enhanced the volume of tumor spheres, indicating increased self-renewal capacity. Notably, this effect was markedly impaired by treatment with BPTES (Figure 3B) suggesting the central role of Gln utilization in the achievement of stemness features by cancer cells. Consistently, Gln depletion from the culture medium strongly impaired sphere formation (Figure 3C).
Collectively, these data strongly support that senescent stroma-derived Gln is capable to sustain the aggressiveness of prostate and ovarian cancer cells.
3.3. Senescent Stroma Upregulates Gln Synthetase, Sustaining Gln Metabolism
To gain insight into the molecular mechanisms responsible for the increased Gln production observed in senescent fibroblasts, we investigated whether senescent stroma could reprogram its metabolism to sustain Gln synthesis. Indeed, we observed an increase of Gln synthetase (GS) levels in prostate and ovarian senescent fibroblasts (Figure 4A). To better understand the role of senescent stroma-derived Gln in cancer cells, we inhibited GS expression by small interfering RNA (siRNA) (Figure 4B). CM collected from GS silenced-senescent fibroblasts showed a decreased ability to induce prostate and ovarian cell invasion (Figure 4C) as well as a decreased expression levels of mRNA for EMT markers in cancer cells (Figure 4D). These data provide evidence that senescent stroma really reprograms its metabolism and sustains cancer cell invasion. Moreover, to clarify whether cancer cells upload and exploit stroma-derived Gln, we traced the fate of Gln originating from the stroma. To do this, we treated HPFs with uniformly labelled 13C-glucose and then we followed the destiny of 13C-glucose-derived Gln. In particular, we quantified the amount of labelled Gln that was synthetized by fibroblasts and released into the CM; then, PC3 cells were incubated for 24h with CM and the amount of labelled Gln was analysed by GC-MS. Results show that senescent fibroblasts produced and secreted higher amounts of Gln compared to control fibroblasts, and that labelled Gln is efficiently uploaded by PC3 following conditioning with senescent CM (Figure 5).
3.4. Senescent Stroma-Derived Gln Drives the Invasive Abilities of Cancers Cells via a NRF2/ETS1 Axis
It is well known that Gln plays a key role in the antioxidant defence, serving as a critical precursor for the synthesis of GSH, the major cellular antioxidant defence, thereby counteracting the excessive increase of ROS [19,20]. Unexpectedly, we found that treatment with not-boiled CM collected from senescent fibroblasts induced an increase of ROS in prostate and ovarian cancer cell lines (Figure 6A). Conversely, boiled CM inhibits ROS production, suggesting that the cytokine component is the main determinant of the pro-oxidant effect of CM (Figure 6B). Notably, ASNase-mediated depletion of Gln from the non-boiled CM induces an increase in ROS production (Figure 6B), supporting a protective role of this amino acid against oxidative stress. Similar results are observed upon inhibition of intracellular Gln utilization; as shown in Figure 6C, treatment with BPTES leads to an increase in ROS levels following conditioning. In line with these data, Gln addition elicits an antioxidant response dependent on the expression of the NF-E2-related factor 2 (NRF2) (Figure 6D), a transcription factor involved in the regulation of several antioxidant regulating genes, including those involved in the GSH synthesis [20]. Similarly, increased expression of NRF2 was observed in PC3 and SKOV3 cells following incubation with CM from senescent cells (Figure 6D) and, concordantly, a strong increase of the GSH/GSSG ratio in cancer cells was detected (Figure 6E). Notably, the antioxidant response element (ARE) may recruit NRF2 to promoters of target genes including the ETS1 promoter [21]. ETS1 is a transcription factor whose nuclear translocation is dependent on Gln availability [22] and able to promote transcription of proteins involved in cancer cell migration and invasion, such as matrix metalloproteinases (MMPs) and vimentin [22,23,24]. We found that following either Gln supplementation or treatment with CM from senescent fibroblasts, ETS1 protein levels are upregulated (Figure 6F) and mostly translocated at nuclear level, clarifying, at least in part, the increased invasive abilities of cancer cells, while pre-treatment of cancer cells with BPTES prevented its nuclear translocation, testifying the role of senescent stromal derived Gln in the regulation of the NRF2/ETS1 axis sustaining cell invasion (Figure 6G).
Finally, we evaluated the RNA expression of key enzymes that emerged from this study in independent gene expression datasets from the Gene Expression Omnibus (GEO) database. In particular, we selected dataset GSE71340 including tissue samples of ovarian cancer patients collected before and after platinum-based neoadjuvant chemotherapy (no dataset available for prostate cancer tissues). Actually, public database analyses indicate a significant increase in GLS mRNA expression following treatment and an increased trend of ETS1 (Figure 7). Collectively, these data suggest that chemotherapy-associated induction of Gln metabolism and ETS1 activation is also observed in patient datasets, potentially contributing to senescence-associated stromal-driven tumor aggressiveness.
4. Discussion
Senescent stroma is increasingly recognized as a key player in modulating cancer progression in several tumor types [25]. Although anticancer therapies can initially restrain tumor growth, relapse is unfortunately common, and recurrent tumors often exhibit a more aggressive phenotype characterized by increased invasiveness, therapy resistance, and metastatic potential. Mounting evidence suggests that TIS-fibroblasts significantly contribute to this unfavourable evolution, as they persist in the tumor microenvironment and, through the acquisition of a SASP, create a permissive niche that fosters tumor cell survival and disease progression. While the SASP was originally defined as a complex mixture of secreted proteins, recent evidence indicates that it also includes non-protein factors, such as metabolites and extracellular vesicles, which collectively broaden its impact on the tumor microenvironment.
Here, we identified Gln secreted by TIS fibroblasts as a central non-protein component of the SASP able to enhance invasive and stem-like features in prostate and ovarian cancer cells. Gln is a well-established metabolic driver of tumor progression, with many cancer types described as "Gln-addicted" due to their reliance on this amino acid for energy production, redox balance, and biosynthetic processes [17,26,27]. In addition, Gln metabolism can help cancer cells resist to apoptosis [28] and contribute to generate an immunosuppressive tumor microenvironment [11]. While previous studies have largely focused on tumor-intrinsic Gln metabolism [15,23,29] and stroma-derived Gln in supporting tumor progression [16,30,31], no data are available regarding the contribution of TIS fibroblasts to Gln availability within the TME. Our results highlight TIS fibroblasts as a previously underappreciated source of extracellular Gln in the TME. In this context, Gln may represent a paracrine metabolic determinant originating from a therapy-altered microenvironment. Previous data from our lab disclosed the role of CM from senescent stroma in driving aggressiveness of tumor cells through cytokine-mediated signalling, highlighting the role of canonical SASP components in modulating cancer cell behaviour [7]. In the current study, we extend these findings by uncovering a previously underexplored metabolic dimension of the SASP. Using metabolomic profiling, we identified several metabolites enriched in the CM of senescent fibroblasts, underscoring the multifactorial nature of the senescent secretome, covering both cytokine and metabolic signals which may contribute to the pro-tumorigenic effects of the senescent microenvironment. Among these, Gln emerged as a metabolite consistently produced across both prostate and ovarian senescent stromal models, pointing to its potential as a shared and functionally relevant metabolic mediator of pro-tumoral roles of TIS fibroblasts. Cancer cell dependency from senescent stroma-derived Gln was confirmed by results obtained upon GS silencing in fibroblasts, Gln depletion in CM or pharmacological inhibition of GLS1 in cancer cells which significantly reduce invasive capacity without affecting viability. Mechanistically, senescent CM promotes the expression of the Gln transporter SLC1A5, Gln uptake, and intracellular availability, thereby triggering metabolic reprogramming and inducing EMT and stem-like traits—effects. Moreover, Gln may act as a precursor of GSH: indeed, we observed an increased level of the GSH/GSSG ratio following administration of senescent CM to cancer cells. Thus, in this context, senescent stroma-derived Gln may contribute to maintaining the redox balance in tumor cells. Finally, we identify the NRF2/ETS1 axis [21,32] as a downstream effector pathway that mediates Gln-driven invasion. Senescent CM elevates ROS levels in cancer cells, triggering an antioxidant response via NRF2 activation, which, in turn, promotes ETS1 expression and its nuclear translocation in a Gln-dependent manner [22]. Given that ETS1 is a key driver of EMT, migration, and invasion [33,34], our data suggest that Gln serves as a metabolic regulator of redox-sensitive transcriptional programs that trigger cancer progression. In keeping, BPTES treatment prevents ETS1 nuclear translocation, sustaining the importance of senescent stroma-derived Gln in cancer cell invasion mediated by the NRF2/ETS1 axis. Finally, supporting the clinical relevance of our findings, we show that post-chemotherapy patient tissues from publicly available datasets of ovarian cancers display increased expression of GLS1 and ETS1.
Given the emerging interest in targeting Gln metabolism to halt cancer progression (particularly through glutaminase inhibitors currently in clinical trials) [35], our findings suggest that strategically timed post-chemotherapy interventions aimed at limiting the availability or utilization of stroma-derived Gln may offer a promising therapeutic approach. Such interventions could counteract the pro-tumorigenic effects of therapy-induced senescent stroma and ultimately reduce the risk of tumor relapse.
In this light, future studies should investigate whether post-therapy treatment with GLS1 inhibitors may attenuate the pro-tumorigenic consequences of TIS. Exploring this approach in co-culture or xenograft models and identifying metabolic biomarkers of senescent stroma in patient samples, could pave the way for more effective and targeted therapeutic strategies.
Collectively, these findings provide strong rationale for targeting Gln metabolism—particularly in the context of senescent stromal niches—as a therapeutic strategy to counteract chemotherapy-induced tumor aggressiveness.
5. Conclusions
In summary, our study highlights the contribution of the metabolic component of the senescent stroma to the acquisition of a more invasive phenotype, with a particular involvement of Gln to sustain the aggressive potential of prostate and ovarian cancer cells. These results suggest that the inhibition of glutamine metabolism, in combination with standard chemotherapeutics, may represent a promising strategy to limit tumor relapse and progression.
Supplementary Materials
The following supporting information can be downloaded at the website of this paper posted on Preprints.org, Figure S1.
Author Contributions
Conceptualization, M.L.T. and F.M.; Methodology, G.L., C.M., C.P., D.D.; E.P., A.S., M.L., A.B., A.L.; Formal Analysis, M.B.; Investigation, G.L., C.M., C.P., D.D.; E.P., A.S., M.L., A.B., A.L.; Resources, P.S., F.M.M., F.S., M.F., S.S.; Writing-Original Draft Preparation, M.L.T.; Supervision, M.L.T. and F.M.; Funding Acquisition, M.L.T. G.L. and C.M. contributed equally to this work. All authors read and approved the final manuscript.
Funding
This Research was supported by the Associazione Italiana per la Ricerca sul Cancro (AIRC) grant IG27094 (M.L.T.); and from THE (Tuscany Health Ecosystem) ECS00000017—CUP B83C22003920001 (M.L.T.).
Institutional Review Board Statement
The study was conducted in accordance with the Declaration of Helsinki and approved by the Ethics Committee of Azienda Ospedaliera Universitaria Careggi (Florence, Italy) (protocol code for prostate tissue: 16583_bio; for ovarian tissue: 14780).
Informed Consent Statement
Informed consent was obtained from all subjects involved in the study.
Data Availability Statement
The data presented in this study are available in the article and in the Supplementary Material Section. Data are also available on request from the corresponding authors.
Conflicts of Interest
The authors declare no conflicts of interest.
Abbreviations
The following abbreviations are used in this manuscript:
| ASNase | L-asparaginase |
| CM | Conditioned media |
| CPT | Cisplatin |
| DTX | Docetaxel |
| EMT | Epithelial-to-mesenchymal transition |
| Gln | Glutamine |
| GLS1 | Glutaminase-1 |
| GS | Gln synthetase |
| HOFs | Human ovarian fibroblasts |
| HPFs | Human prostate fibroblasts |
| ROS | Reactive oxygen species |
| SASP | Senescence-associated secretory phenotype |
| TIS | Therapy-induced senescence |
| TME | Tumor microenvironment |
References
- Ye, M.; Huang, X.; Wu, Q.; Liu, F. Senescent Stromal Cells in the Tumor Microenvironment: Victims or Accomplices? Cancers (Basel) 2023, 15. [Google Scholar] [CrossRef]
- Campisi, J.; d'Adda di Fagagna, F. Cellular senescence: when bad things happen to good cells. Nat Rev Mol Cell Biol 2007, 8, 729–740. [Google Scholar] [CrossRef]
- Liu, K.; Huang, H.; Zhang, M.; Chen, S.; Yang, Y.; Fang, C.; Zhong, X. When therapy-induced senescence meets tumors: A double-edged sword: A review. Medicine (Baltimore) 2025, 104, e42886. [Google Scholar] [CrossRef]
- Takasugi, M.; Yoshida, Y.; Hara, E.; Ohtani, N. The role of cellular senescence and SASP in tumour microenvironment. FEBS J 2023, 290, 1348–1361. [Google Scholar] [CrossRef] [PubMed]
- Dong, Z.; Luo, Y.; Yuan, Z.; Tian, Y.; Jin, T.; Xu, F. Cellular senescence and SASP in tumor progression and therapeutic opportunities. Mol Cancer 2024, 23, 181. [Google Scholar] [CrossRef] [PubMed]
- Coppé, J.P.; Desprez, P.Y.; Krtolica, A.; Campisi, J. The senescence-associated secretory phenotype: the dark side of tumor suppression. Annu Rev Pathol 2010, 5, 99–118. [Google Scholar] [CrossRef] [PubMed]
- Pardella, E.; Pranzini, E.; Nesi, I.; Parri, M.; Spatafora, P.; Torre, E.; Muccilli, A.; Castiglione, F.; Fambrini, M.; Sorbi, F.; et al. Therapy-Induced Stromal Senescence Promoting Aggressiveness of Prostate and Ovarian Cancer. Cells 2022, 11. [Google Scholar] [CrossRef]
- Wiley, C.D.; Campisi, J. The metabolic roots of senescence: mechanisms and opportunities for intervention. Nat Metab 2021, 3, 1290–1301. [Google Scholar] [CrossRef]
- Boroughs, L.K.; DeBerardinis, R.J. Metabolic pathways promoting cancer cell survival and growth. Nat Cell Biol 2015, 17, 351–359. [Google Scholar] [CrossRef]
- Aguilar-Cazares, D.; Perez-Medina, M.; Benito-Lopez, J.J.; Galicia-Velasco, M.; Meneses-Flores, M.; Camarena, A.; Lopez-Gonzalez, J.S. The tumor microenvironment: adding pieces to the puzzle. Front Immunol 2025, 16, 1731338. [Google Scholar] [CrossRef]
- Nan, D.; Yao, W.; Huang, L.; Liu, R.; Chen, X.; Xia, W.; Sheng, H.; Zhang, H.; Liang, X.; Lu, Y. Glutamine and cancer: metabolism, immune microenvironment, and therapeutic targets. Cell Commun Signal 2025, 23, 45. [Google Scholar] [CrossRef]
- Mancini, C.; Lori, G.; Mattei, G.; Iozzo, M.; Desideri, D.; Cianchi, F.; Fortuna, L.; Passagnoli, F.; Massi, D.; Ugolini, F.; et al. PHGDH drives 5-FU chemoresistance in colorectal cancer through the Hedgehog signaling. J Exp Clin Cancer Res 2025, 44, 198. [Google Scholar] [CrossRef] [PubMed]
- Heinrich, P.; Kohler, C.; Ellmann, L.; Kuerner, P.; Spang, R.; Oefner, P.J.; Dettmer, K. Correcting for natural isotope abundance and tracer impurity in MS-, MS/MS- and high-resolution-multiple-tracer-data from stable isotope labeling experiments with IsoCorrectoR. Sci Rep 2018, 8, 17910. [Google Scholar] [CrossRef] [PubMed]
- Schindelin, J.; Arganda-Carreras, I.; Frise, E.; Kaynig, V.; Longair, M.; Pietzsch, T.; Preibisch, S.; Rueden, C.; Saalfeld, S.; Schmid, B.; et al. Fiji: an open-source platform for biological-image analysis. Nat Methods 2012, 9, 676–682. [Google Scholar] [CrossRef] [PubMed]
- Li, X.; Peng, X.; Li, Y.; Wei, S.; He, G.; Liu, J.; Yang, S.; Li, D.; Lin, W.; Fang, J.; et al. Glutamine addiction in tumor cell: oncogene regulation and clinical treatment. Cell Commun Signal 2024, 22, 12. [Google Scholar] [CrossRef]
- Yang, L.; Achreja, A.; Yeung, T.L.; Mangala, L.S.; Jiang, D.; Han, C.; Baddour, J.; Marini, J.C.; Ni, J.; Nakahara, R.; et al. Targeting Stromal Glutamine Synthetase in Tumors Disrupts Tumor Microenvironment-Regulated Cancer Cell Growth. Cell Metab 2016, 24, 685–700. [Google Scholar] [CrossRef]
- Jin, J.; Byun, J.K.; Choi, Y.K.; Park, K.G. Targeting glutamine metabolism as a therapeutic strategy for cancer. Exp Mol Med 2023, 55, 706–715. [Google Scholar] [CrossRef]
- Allgayer, H.; Mahapatra, S.; Mishra, B.; Swain, B.; Saha, S.; Khanra, S.; Kumari, K.; Panda, V.K.; Malhotra, D.; Patil, N.S.; et al. Epithelial-to-mesenchymal transition (EMT) and cancer metastasis: the status quo of methods and experimental models 2025. Mol Cancer 2025, 24, 167. [Google Scholar] [CrossRef]
- Matés, J.M.; Campos-Sandoval, J.A.; de Los Santos-Jiménez, J.; Márquez, J. Glutaminases regulate glutathione and oxidative stress in cancer. Arch Toxicol 2020, 94, 2603–2623. [Google Scholar] [CrossRef]
- Sayin, V.I.; LeBoeuf, S.E.; Singh, S.X.; Davidson, S.M.; Biancur, D.; Guzelhan, B.S.; Alvarez, S.W.; Wu, W.L.; Karakousi, T.R.; Zavitsanou, A.M.; et al. Activation of the NRF2 antioxidant program generates an imbalance in central carbon metabolism in cancer. Elife 2017, 6. [Google Scholar] [CrossRef]
- Dittmer, J. The role of the transcription factor Ets1 in carcinoma. Semin Cancer Biol 2015, 35, 20–38. [Google Scholar] [CrossRef] [PubMed]
- Prasad, P.; Roy, S.S. Glutamine regulates ovarian cancer cell migration and invasion through ETS1. Heliyon 2021, 7, e07064. [Google Scholar] [CrossRef] [PubMed]
- Beier, A.K.; Ebersbach, C.; Siciliano, T.; Scholze, J.; Hofmann, J.; Hönscheid, P.; Baretton, G.B.; Woods, K.; Guezguez, B.; Dubrovska, A.; et al. Targeting the glutamine metabolism to suppress cell proliferation in mesenchymal docetaxel-resistant prostate cancer. Oncogene 2024, 43, 2038–2050. [Google Scholar] [CrossRef] [PubMed]
- Ghosh, D.; Pakhira, S.; Ghosh, D.D.; Roychoudhury, S.; Roy, S.S. Ets1 facilitates EMT/invasion through Drp1-mediated mitochondrial fragmentation in ovarian cancer. iScience 2023, 26, 107537. [Google Scholar] [CrossRef]
- Colucci, M.; Sarill, M.; Maddalena, M.; Valdata, A.; Troiani, M.; Massarotti, M.; Bolis, M.; Bressan, S.; Kohl, A.; Robesti, D.; et al. Senescence in cancer. Cancer Cell 2025, 43, 1204–1226. [Google Scholar] [CrossRef]
- Yang, L.; Moss, T.; Mangala, L.S.; Marini, J.; Zhao, H.; Wahlig, S.; Armaiz-Pena, G.; Jiang, D.; Achreja, A.; Win, J.; et al. Metabolic shifts toward glutamine regulate tumor growth, invasion and bioenergetics in ovarian cancer. Mol Syst Biol 2014, 10, 728. [Google Scholar] [CrossRef]
- Zou, W.; Han, Z.; Wang, Z.; Liu, Q. Targeting glutamine metabolism as a potential target for cancer treatment. J Exp Clin Cancer Res 2025, 44, 180. [Google Scholar] [CrossRef]
- Yerbes, R.; Mora-Molina, R.; Fernández-Farrán, F.J.; Hiraldo, L.; López-Rivas, A.; Palacios, C. Limiting glutamine utilization activates a GCN2/TRAIL-R2/Caspase-8 apoptotic pathway in glutamine-addicted tumor cells. Cell Death Dis 2022, 13, 906. [Google Scholar] [CrossRef]
- Fang, L.; Gao, D.; Jiang, Z.; Li, G.; Li, M. Glutamine's double-edged sword: fueling tumor growth and offering therapeutic hope. Front Immunol 2025, 16, 1578940. [Google Scholar] [CrossRef]
- Chen, T.; Xu, Y.; Yang, F.; Pan, Y.; Ji, N.; Li, J.; Zeng, X.; Chen, Q.; Jiang, L.; Shen, Y.Q. Crosstalk of glutamine metabolism between cancer-associated fibroblasts and cancer cells. Cell Signal 2025, 133, 111874. [Google Scholar] [CrossRef]
- Mestre-Farrera, A.; Bruch-Oms, M.; Peña, R.; Rodríguez-Morató, J.; Alba-Castellón, L.; Comerma, L.; Quintela-Fandino, M.; Duñach, M.; Baulida, J.; Pozo, Ó.; et al. Glutamine-Directed Migration of Cancer-Activated Fibroblasts Facilitates Epithelial Tumor Invasion. Cancer Res 2021, 81, 438–451. [Google Scholar] [CrossRef]
- Wilson, L.A.; Gemin, A.; Espiritu, R.; Singh, G. ets-1 is transcriptionally up-regulated by H2O2 via an antioxidant response element. FASEB J 2005, 19, 2085–2087. [Google Scholar] [CrossRef]
- Wang, Y.; Huang, Z.; Sun, M.; Huang, W.; Xia, L. ETS transcription factors: Multifaceted players from cancer progression to tumor immunity. Biochim Biophys Acta Rev Cancer 2023, 1878, 188872. [Google Scholar] [CrossRef]
- Ichikawa, M.K.; Endo, K.; Itoh, Y.; Osada, A.H.; Kimura, Y.; Ueki, K.; Yoshizawa, K.; Miyazawa, K.; Saitoh, M. Ets family proteins regulate the EMT transcription factors Snail and ZEB in cancer cells. FEBS Open Bio 2022, 12, 1353–1364. [Google Scholar] [CrossRef]
- Wang, H.; Li, X.; Hu, H.; Gao, Z. Glutaminase 1 inhibitors: Therapeutic potential, mechanisms of action, and clinical perspectives. Biochem Pharmacol 2025, 242, 117275. [Google Scholar] [CrossRef]
Figure 1.
A metabolic component secreted by senescent HPFs and HOFs is involved in the acquisition of a pro-invasive phenotype in prostate and ovarian cancer cells. A) Quantification of SA-β-Gal staining of human prostate fibroblasts (HPFs) and human ovarian fibroblasts (HOFs) treated for 24h with 5 nM Docetaxel (DTX) and 20 μM cisplatin (CPT) respectively and then incubated in culture media without drugs for further 6 days. For each condition, images were taken from 5 randomly selected fields, and both the total number of cells and the number of blue (SA-β-Gal positive) cells were counted. Bar-graphs represent the average ratio of positive cells to the total cell count. Representative images of the stained cells are shown below the bargraphs (magnification 20X, scale bar 100μm). Data are represented as mean ± SEM of three independent experiments; t-test ** p≤ 0.01). B) Representative immunoblots of p16 and p21 protein levels in DTX-treated HPFs and CPT-treated HOFs. β-actin was used as loading control. C) PC3 and SKOV3 cells were incubated with conditioned media (CM) from senescent and non-senescent (CTRL) fibroblasts for 72h. Then cells were seeded in Boyden chambers pre-coated with Matrigel. Cells were let to invade for 16h. Invading cells were stained with Crystal Violet and counted. Representative images of the filters are shown below the bargraphs (magnification 20X, scale bar 100 μm). Data are represented as mean ± SEM of three independent experiments; t-test ** p≤ 0.01, *** p≤ 0.001). D) mRNA expression level of EMT key genes in PC3 and SKOV3 cells incubated with CM from senescent or CTRL fibroblasts for 72h. Data are represented as mean ± SEM of three independent experiments, t-test *≤ 0.05, ** p≤ 0.01). E) Prostate and ovarian cancer cells were incubated for 72h with boiled and not boiled CM from DTX-treated HPFs and CPT-treated HOFs. Invasion ability was measured with Boyden chamber assay. Representative images of the filters are shown upper the bargraphs (magnification 20X, scale bar 100 μm). Data are represented as mean ± SEM of three independent experiments; t-test * ≤ 0.05, ** p≤ 0.01, φφφ ≤ 0.01, φφφφ ≤ 0.001, $$ ≤ 0.01, $$$ ≤ 0.001. * symbol indicates CM SEN boiled vs SEN non-boiled; φ symbol indicates CM CTRL boiled vs CM CTRL non-boiled; $ symbol indicates CM SEN vs CM CTRL. F) CM from senescent and control HPFs and HOFs were collected and GC-MS analysis were performed to detect secreted metabolites. Data reported are normalized on CM from CTRL fibroblasts. * symbol indicates metabolite levels significantly increased both in senescent CM from HPFs and HOFs. * p≤0.05.

Figure 2.
Gln availability drives invasive ability in PC3 and SKOV3 cells. A) PC3 and SKOV3 cells were incubated for 72h with DMEM in presence or absence of 1% Glutamine (Gln). Invasion ability was measured with Boyden chamber assay. Representative images of the filters are shown below the bargraphs (magnification 20X, scale bar 100 μm). Data are represented as mean ± SEM of three independent experiments; t-test ** ≤0.01, **** ≤0.0001. B) PC3 and SKOV3 were incubated with CM from DTX-treated HPFs and CPT-treated HOFs for 72h and with ASNase 1U/mL during the last 48h. Then cells were seeded in Boyden chambers pre-coated with Matrigel. Data are represented as mean ± SEM of three independent experiments; t-test * ≤0.05, *** ≤0.001, φ ≤0.05, φφ ≤0.01, $ ≤0.05, $$ ≤0.01. * symbol indicates CM SEN + ASNase vs CM SEN; φ symbol indicates CM CTRL + ASNase vs CM CTRL; $ symbol indicates CM SEN vs CM CTRL. C) mRNA expression level of Gln transporter SLC1A5 in prostate and ovarian cancer cells incubated with CM from senescent and CTRL fibroblasts for 72h. Data are represented as mean ± SEM of three independent experiments; t-test * ≤0.05. D) PC3 and SKOV3 cells were incubated for 72h with CM from senescent and CTRL HPFs and HOFs. Then GC-MS analysis was performed to measure Glu acid and Gln intracellular content. Data are represented as mean ± SEM of three independent experiments; t-test ** ≤0.01. E) PC3 and SKOV3 cells were incubated for 72h with DMEM and then detached and seeded in a Boyden chamber in presence or absence of BPTES 1μM for 16h. Invaded cells were stained with Crystal Violet and counted. Representative images of the filters are shown below the bargraphs (magnification 20X, scale bar 100 μm). Data are represented as mean ± SEM of three independent experiments; t-test ** ≤0.01, **** ≤0.0001. F) Prostate and ovarian cancer cells were incubated for 72h with boiled and not boiled CM; BPTES 1 μM was added during the final 16h of incubation. Invasive ability was measured with Boyden chamber assay. Data are represented as mean ± SEM of three independent experiments; t-test ** ≤0.01, *** ≤0.001, **** ≤0.0001; φ ≤0.05, φφ ≤0.01, φφφ ≤0.001; $ ≤0.05, $$$ ≤0.001. * symbol indicates treated CM SEN vs CM SEN, φ symbol indicates treated CM CTRL vs CM CTRL, $ symbol indicates CM SEN vs CM CTRL.

Figure 3.
Gln confers aggressiveness to prostate and ovarian cancer cells. A-B) PC3 and SKOV3 cells were conditioned for 72h with CM from HPFs and HOFs; BPTES 1 μM was added during the final 16h of incubation. Then cells were detached and grown as spheroids for 7 days. Volumes of prostatic and ovarian spheroids were calculated as described in M&M. Representative images of spheroids are shown below the bargraphs (magnification 20X, scale bar 100 μm). Data are represented as mean ± SEM of three independent experiments; t-test **** ≤0.0001. C) Prostate and ovarian cancer cells were incubated for 72h with or without 1% Gln. Then cells were detached and grown as spheroids for 7 days. Volumes of prostatic and ovarian spheroids were calculated as described in M&M. Representative images of spheroids are shown below the bargraphs (magnification 20X, scale bar 100 μm). Data are represented as mean ± SEM of three independent experiments; t-test **** ≤0.0001.

Figure 4.
GS silencing in senescent fibroblasts affects EMT program in prostate and ovarian cancer cells. A) Immunoblot of GS protein levels in senescent and CTRL fibroblasts. Vinculin was used as loading control. B) GS protein levels in senescent HPFs and HOFs following 48h gene silencing. HSP90 immunoblot was performed to ensure equal loading. C) PC3 and SKOV3 cells were incubated for 72h with CM from GS silenced HPFs and HOFs. Then cell invasion was assessed using a Boyden chamber assay. Representative images of filters are shown below the bargraphs (magnification 20X, scale bar 100 μm). Data are represented as mean ± SEM of three independent experiments. t-test *** ≤0.001, **** ≤0.0001. D) mRNA expression level of EMT markers in prostate and ovarian cancer cells after 72h incubation with CM from GS-silenced fibroblasts. Data are represented as mean ± SEM of three independent experiments. t-test, * ≤0.05, ** ≤0.01, **** ≤0.0001.

Figure 5.
Senescent stroma-derived Gln is uploaded by PC3. CTR and senescent HPFs were incubated for 24h with 13C glucose, then cell lysates and CM were collected for GC-MS analysis. PC3 cells were incubated with CM for further 24h and the amount of 13C Gln inside cells was measured. Data are represented as mean ± SEM of three independent experiments. t-test, * ≤0.05.

Figure 6.
Gln-dependent NRF2/ETS1 pathway drives the invasive abilities of cancer cells. A) Total ROS production was measured with DCFDA probe in PC3 and SKOV3 cells after 72h incubation with CM from senescent and CTRL fibroblasts. Data are represented as mean ± SEM of three independent experiments. t-test, * ≤0.05. B) Total ROS production measured with DCFDA probe in PC3 e SKOV3 cells after incubation with boiled and not boiled CM CTRL for 72h in the presence or absence of ASNase 1U/mL during the last 48h. Data are represented as mean ± SEM of three independent experiments. t-test * ≤0.05, ** ≤0.001. C) Total ROS measured as described above, cells were conditioned for 72h, BPTES 1 μM was added during the final 16h of incubation. Data are represented as mean ± SEM of three independent experiments. t-test. t-test * ≤0.05. D) NRF2 protein level in PC3 and SKOV3 cells incubated either with DMEM in presence or absence of 1% Gln or with senescent or CTRL CM. HSP90 immunoblot was performed to ensure equal loading. E) GSH/GSSG ratio in prostate and ovarian cancer cells incubated for 72h with CM from senescent and CTRL fibroblasts. Data are normalized on protein content. Data are represented as mean ± SEM of three independent experiments. t-test, * ≤0.05, ** ≤0.01. F) ETS1 protein level in PC3 and SKOV3 cells incubated either with DMEM in presence or absence of 1% Gln or with senescent or CTRL CM. Actin was used as loading control. G) Tumor cells were incubated for 72h with CM from HPFs or HOFs; BPTES 1 μM was added during the final 16h of incubation. Representative confocal microscopy images show ETS1 nuclear translocation. Bargraphs on the right show the nuclear fluorescence intensity of ETS1 signal. Fluorescence intensity was quantified with ImageJ software (red: ETS1, blue: DAPI; scale bar 44 μm). Data are represented as mean ± SEM of three independent experiments. t-test, * ≤0.05, $$ ≤0.01; ϕ≤0.05. * symbol indicates CM CTRL + BPTES vs CM CTRL, $ symbol indicates CM SEN vs CM CTRL, ϕ symbol indicates CM SEN + BPTES vs CM SEN.

Figure 7.
Platinum-based chemotherapy promotes increased expression of GLS and ETS1 in ovarian cancer patients. Gene expression levels of GLS and ETS1 in ovarian cancer tissues pre and post platinum-based therapy from the public RNAseq dataset (GSE71340). P-values were estimated by Wilcoxon paired test.

Disclaimer/Publisher’s Note: The statements, opinions and data contained in all publications are solely those of the individual author(s) and contributor(s) and not of MDPI and/or the editor(s). MDPI and/or the editor(s) disclaim responsibility for any injury to people or property resulting from any ideas, methods, instructions or products referred to in the content. |
© 2026 by the authors. Licensee MDPI, Basel, Switzerland. This article is an open access article distributed under the terms and conditions of the Creative Commons Attribution (CC BY) license (http://creativecommons.org/licenses/by/4.0/).
Copyright: This open access article is published under a Creative Commons CC BY 4.0 license, which permit the free download, distribution, and reuse, provided that the author and preprint are cited in any reuse.


