
Submitted:
16 February 2026
Posted:
28 February 2026
You are already at the latest version
Abstract
In developing countries like Bangladesh, small textile factories often dump untreated waste because pollution control systems are too expensive. To address this, a low-cost prototype, named ‘Integrated Eco-Factory’, was designed and fabricated. This system simultaneously performs three critical functions: carbon capture, wastewater treatment, and energy harvesting: captures carbon soot from chimneys, treats wastewater, and harvests renewable energy. First, a cyclonic separator was utilized to collect carbon soot to collect carbon soot from exhaust gas and processed it into printing ink. Laboratory analysis revealed that the synthesized ink has a viscosity of 3.2 cP and surface tension of 38.5 mN/m, which is very close to commercial printer ink. Second, the traditional biological treatment was replaced with an Electrocoagulation (EC) unit. This unit removed 91% of the dye color from the water. Instead of throwing away the sludge we used it to make “Eco-Bricks” that have a strength of 14.2 MPa, making them safe for construction use. Finally, to ensure energy autonomy, a hybrid energy system (Solar, Thermal, and Hydro) that generates about 950 Wh per day—enough to run the system’s sensors and IoT monitoring 24/7. Our cost analysis shows that a factory can recover the full setup cost in just 7 months by selling the ink and bricks. The results demonstrate that that pollution control can be profitable for small industries.
Keywords:
carbon capture
; Electrocoagulation
; Waste-to-Resource
; groundwater conservation
; Eco-Brick
; Circular Economy
I. Introduction
1.1. Global Industrialization and the Environmental Cost
The rapid development of the industrial sector is considered the main driving force behind economic development in emerging nations, especially in the South Asian region. Nations like Bangladesh have undergone a paradigm shift from an agrarian economy to an industrial-based economy, focusing heavily on the Ready Made Garment (RMG), textile, and dyeing sector. The sector is considered the backbone of economic development, contributing substantially to the Gross Domestic Product (GDP) and employment generation in the region [1]. However, the unchecked development of the industrial sector has given rise to a severe environmental paradox. While the development of manufacturing units contributes to economic development, measured through an increase in economic indicators, these units are also considered prolific contributors to environmental degradation, causing a devastating impact on the environment. The current “linear economy” model, built on a “take, make, dispose” philosophy, has led to the excessive emission of greenhouse gases, discharge of toxic chemicals into riverine systems, and generation of hazardous wastes in landfills.[2]
1.2. Environmental Impact of Textile Manufacturing
Air, Water, Soil and Groundwater All of the environmental impacts resulting from this industry are not separate from each other; they are one of the prime examples that air, the land, the water, and the soil combined are a major environmental “quadruple threat.”
Based on fossil fuels being the primary source of energy for textile mills who use various boiler systems, captive power generation (one of the largest sources). There would be carbon dioxide (CO2) sulphur oxides (SOx) particulate matter (PM2.5 or PM10) and soot black carbon.
Fossil burning causing high volume emissions from those mills, black carbon (soot) suspended in the atmosphere, strong climate forcer, (greenhouse gas) contributes to global warming. On top of this, black carbon (soot) contributes to the incidence of respiratory illness among the workers and the nearby communities.[3]
The textile industry uses large quantities of water, estimated at 200 litres of water per kilogram of fabrics produced, which ultimately causes increased pressure to pump ground water out of the aquifer thus contributing to a continued declining of the water table, where piezometric level in 2 particular locations (e.g. Gazipur, Dhaka) are declining at the alarming rate of 3-2 metres per year, getting closer to a point of no return, where it was impossible to reverse the issue of ground water “crisis”.[4]
The waste produced by this industry is generally considered to be contaminated with synthetic dyes and toxic heavy metals (Chromium, Cadmium, Lead), as well as having an extremely high chemical oxygen demand (COD). The contaminants in these effluents not only cause environmental damage but can also lead to the creation of “dead zones” within rivers, which results in damage to aquatic ecosystems (loss of biodiversity) and disrupts the natural food chain [5].
After this, one of the most often neglected environmental impacts of dye manufacturing is soil contamination. Most ETPs will also produce large amounts of hazardous waste sludge. If no sustainable methods exist for the proper disposal of sludge it is usually discarded into either open landfills or agricultural land; unfortunately, heavy metals present in sludge migrate into the soil, thereby reducing its productivity, and eventually make their way into the food chain through food crops (crops are grown in contaminated soils). The continuum of pollution from air to water to soil creates a multi-faceted and interdependent ecological crisis that requires immediate, coordinated intervention at all levels of government and industry to avoid catastrophic outcomes [6].
1.3. Conventional Remediation is Unsuccessful
A Perspective of Small and Medium Enterprises (SMEs) Compliance with environmental laws in developing countries is generally low, even though pollution control laws have been implemented. Many SMEs have few financial resources and therefore cannot afford to implement an ETP that has an activated sludge process for remediating their wastewater. Because of the size of an ETP based on the activated sludge process, land restrictions make it impossible for an SME in a concentrated industrial area to use thousands of square feet of land for non- profitable machinery. Factories in SME-focused companies often discharge contaminated wastewater into local rivers and lakes without any form of treatment to reduce their operating costs [7].
Biological systems for treating wastewater have very fragile technical foundations. At their same time, they utilize living bacteria that are responsible for breaking down biological material in wastewater. In the case of textiles, the wastewater produced by a textile factory usually experiences very large swings in pH (both very high and very low) and contains heavy metals that are considered to be toxic. In the case of the bacteria utilized for biological treatment, a sudden chemical shock can kill the entire population of bacteria, resulting in the ETP not functioning for a significant period of usually, weeks. In addition to the inability to perform biological treatment on textile wastewater, the number of qualified technical personnel available to effectively manage these complex technical parameters is low; as a result, the failure rate of traditional ETPs is also very high [8].
1.4. The “Sunk Cost” Dilemma Relating to Air Pollution Control
A similar inefficiency can be seen with regard to atmospheric emissions control technologies, such as Wet Scrubbers or Electrostatic Precipitators (ESPs), which are commercially viable yet considered “sunk costs” by industry operators. Under the current linear economic model, the carbon soot produced from chimneys is perceived as a waste product, which has no market value; thus, the electricity and maintenance consumed by running the filtration equipment are viewed as lost expenses. Due to a lack of an economic incentive, there is atendency for operators to only install such filtration equipment for regulatory purposes and to operate it turned off during normal operating conditions to conserve energy. This behavior demonstrates an essential flaw within the current environmental policy framework: with no ROI, it is frequently difficult to continue sustainability initiatives in a competitive marketplace [9].
1.5. Changing Our Paradigm
The Move Towards a Circular Economy For us to end the cycle of non- compliance and pollution, we need to completely change our model of business to that of a Circular Economy (CE) rather than the Linear Economy (LE) model. The LE model of waste generation is a ‘take, make and dispose’ model, which has a linear or one- directional flow of material extraction, manufacture of products and disposal of waste products. The LE model depletes all of our resources and produces massive amounts of pollution with every product that is manufactured. The LE model has been shown to be an unsustainable economic model, particularly in countries where there are limited numbers of resources, such as in Bangladesh [10].
The CE paradigm (or CE System) has an entirely different approach to business than the LE does and works on a ‘closed-loop’ system. CE designs are based on ensuring the capabilities of products, the value of products and their components and materials remain at their highest level of utility and functionality for as long as possible. From the perspective of pollution as a by-product of industrial manufacturers, CE creates an avenue for reuse of polluting materials (i.e., waste is merely a supply of materials that is in the wrong physical location). In fact, when we consider the waste by-products that we produce as a natural raw material instead of viewing them as a burdensome expense and unnecessary cost associated with pollution control, we can begin to develop complementary products through the use of these resources. We should begin to treat pollution control as a ‘value-adding’ element and include it in our production cycle. By converting carbon emissions into printing ink and upcycling sludge into construction materials, industries can offset their operational costs, making environmental compliance not just a legal obligation but a profitable business strategy [11].
1.6. Research Gap Analysis
The global scientific community is making progress with their efforts in environmental engineering however; there are many places in which research has not yet been consolidated from an economic aspect to help developing countries improve their position in this area. To date, fragmentation of studies related to pollution control is prevalent within many disciplines with regards to the specific types of pollution being addressed. For instance there are studies that look at the effects of Electrocoagulation (EC) on the treatment of wastewater [12] as well as studies looking at Cyclonic Separation methods associated with particulate matter removal [13] from the atmosphere; however the level of research done on each of these topics is limited and not linked together so it makes planning very difficult for industrial manufacturers as they must continue to spend money on multiple methods and had both a high capital cost (CapEx) and also very complex ongoing operations to maintain.
A second major issue is related to the economic aspect of pollution control. High efficiency technologies such as Membrane Bioreactors (MBRs) and Carbon Capture & Storage (CCS) are technically superior but too expensive for Small to Medium Enterprises (SMEs) to implement. Most of the studies available do not discuss how to develop “Waste-to-Wealth” models or funding mechanisms to provide a means for SMEs to offset the high cost of operating in compliance with current environmental regulations. In the absence of established Return on Investment (ROIs) on sustainable technology, environmental compliance is viewed as more of an expense than an opportunity for business growth [14].
In summary, one continuing obstacle to achieving zero waste is energy dependance. Conventional water treatment facilities use a large amount of energy and increase overstress on the electrical grid already challenged with regular power outages. In addition, very few studies have assessed whether it is possible to use the waste streams from water treatment, such as utilizing heat from the boiler exhaust or kinetic energy from the flow of wastewater through the system, to supply energy to the treatment processes [15]
The study describes the design and application of the “Integrated Eco-Factory” as a solution to the identified challenges above. The “Integrated Eco- Factory” provides an Integrated Framework and Multi-Functional Whole System approach to Pollution Management for Small to Medium Enterprises (SMEs), as contrasted with traditional “End-of-Pipe” solutions, the Integrated Eco-Factory utilizes a “Synergistic” approach to Pollution Management (i.e., outputs from one part of the System are input into another).
The proposed Integrated Eco-Factory consists of three coordinated (Synchronized) Modules:
- Treatment Process
- Recovery Process
- Solid Waste Processing
Module A (Valorization of Atmospheric Pollutants): While at present the only technology for reducing the emissions of traditional fossil fuel-fired boilers is filtered exhaust, this innovative module for cleaning up the atmosphere enhances the removal method with cyclonic separation at extremely high efficiencies, allowing the captured carbon black (soot) to be processed chemically—purified, milled and mixed with polymeric binders— to create a high-value ink product that sells commercially. In this way, a pollutant substitute air pollutant has been converted into an economically viable product.
Module B (Recycling of Water Wastes): The electrocoagulation (EC) method replaces biological treatment of waste water by stabilizing the dye and precipitating all heavy metals found in the waste stream of a facility by means of electrochemical processes. The total volume of the resultant sludge is less than that generated through biological means and the sludge is stabilized and upcycled into low load bearing eco-bricks. Additionally, the treated water produced during this process was reused within the facility.
Module C (Tri-Hybrid Energy System): A unique Tri-Hybrid Energy System provides the system with energy independence from the electrical grid. The Tri-Hybrid harnesses waste thermal energy through thermoelectric generators (TEGs), solar energy through photovoltaic panels and kinetic energy through a micro-hydro turbine located in the discharge line where the effluent is being discharged from the facility [16].
2. Literature Review
The escalating crisis of urban air quality has necessitated immediate technological interventions. According to the World Health Organization (WHO), ambient air pollution accounts for approximately 4.2 million premature deaths annually, with vehicle emissions being a primary contributor (WHO, 2022). While industrial-scale carbon capture and storage (CCS) technologies have matured, their application is largely confined to stationary power plants. The United Nations Environment Programme (UNEP) emphasizes that for developing nations, localized and low-cost filtration systems are critical to mitigating roadside particulate matter (PM) exposure (UNEP, 2021).
Recent studies using satellite data by NASA have highlighted the correlation between traffic density and ground-level nitrogen dioxide ($NO_2$) and carbon concentrations in dense urban centers (NASA, 2023). However, conventional roadside filtration systems are often energy-intensive and lack adaptability to fluctuating traffic conditions. Research by Sharma et al. (2023) demonstrated the viability of small-scale electrostatic precipitators, yet cost remains a barrier for widespread deployment in South Asia. Consequently, there is a significant research gap for an automated, sensor- based, and cost-effective carbon capture prototype designed specifically for the chaotic traffic patterns of developing countries. This paper addresses this gap by proposing an adaptive suction mechanism triggered by real-time vehicle detection.
2.1. Valorization of Industrial Carbon Emissions (Air to Ink)
The conventional approach to industrial air pollution management has historically been reactive, focusing primarily on the removal of particulate matter (PM) from exhaust gases through wet scrubbers or electrostatic precipitators (ESPs). While these methods reduce atmospheric load, they create a secondary waste stream of toxic soot that requires landfilling, thus maintaining a linear “pollution- shift” model. Recent studies by Sharma et al. (2019) have characterized diesel exhaust soot as containing over 80% elemental carbon, which is chemically analogous to commercial carbon black pigments. Similarly, Gravit et al. (2021) demonstrated the potential of “Waste-to-Art” by synthesizing ink from candle soot on a laboratory scale. However, a significant research gap persists: existing literature lacks an automated, industrial-scale mechanism for real-time soot collection from boiler chimneys . This study bridges that gap by implementing a high- efficiency cyclonic separator that transforms a hazardous air pollutant into a high-value industrial feedstock.
2.2. Advances in Wastewater Treatment: Biological vs. Electrochemical
Biological Effluent Treatment Plants (ETPs) have been the standard in the textile industry for decades, yet their efficacy is increasingly questioned in the context of modern synthetic dyes. Rahman & Al- Muyeed (2022) highlighted that biological cultures are highly susceptible to “chemical shocks” caused by the fluctuating pH and heavy metal toxicity inherent in textile effluents, often leading to total system failure for weeks. Conversely, Electrocoagulation (EC) has emerged as a robust alternative. Kobya et al. (2020) demonstrated that aluminum-based EC units could achieve over 91% removal of color and COD within 30 minutes, outperforming traditional biological processes in both speed and reliability. Nevertheless, the high electrical demand of EC units remains a barrier for SMEs . This research addresses this limitation by integrating a renewable hybrid energy system to power the EC process, making advanced electrochemical treatment economically feasible.
2.3. Sustainable Sludge Management and Resource Recovery (Eco-Bricks)
The management of chemical sludge remains the most neglected aspect of industrial pollution control. Islam et al. (2023) warned that open dumping of textile sludge leads to the leaching of chromium and lead into the groundwater, posing a severe threat to the local food chain. To mitigate this, Singhal & Pandey (2021) proposed the “Solidification/Stabilization (S/S)” method, where treated sludge is encapsulated within a cement matrix to produce construction materials. While their work validated the safety of this method, it focused primarily on disposal rather than the creation of a profitable “Waste-to-Wealth” business model. Our study enhances this framework by optimizing the sludge-to-cement ratio to ensure the resulting “Eco-Bricks” meet ASTM standards while providing a secondary revenue stream for factories.
2.4. Hybrid Energy Harvesting in Industrial IoT
The transition to Industry 4.0 requires continuous environmental monitoring, which is often hindered by the instability of the national power grid in developing nations. While Zuo et al. (2018) explored the use of Thermoelectric Generators (TEGs) for industrial waste heat recovery, the energy yield was often insufficient for sustained loads. Similarly, Anyi & Kirke (2016) noted the potential of micro-hydro turbines in industrial drainage pipes. The literature reveals a critical absence of integrated “Tri-Hybrid” systems that combine solar, thermal, and hydrokinetic energy . This research introduces a novel architecture that utilizes the factory’s own waste streams—thermal energy from the chimney and kinetic energy from the discharge pipe—to ensure 24/7 energy autonomy for IoT sensors.
2.5. Critical Summary of Research Gaps
The survey of existing literature confirms that while isolated solutions for air, water, and energy exist, they are fragmented and economically burdensome for Small and Medium Enterprises (SMEs). There is no established framework that synergizes these technologies into a single, compact, and self- sustaining unit. The “Integrated Eco-Factory” proposed in this study represents a paradigm shift from traditional “End-of-Pipe” treatment to a holistic “Circular Economy” model, proving that environmental compliance can be transformed into a profitable industrial strategy.
2.6. Statement of Novelty and Research Gap:
While existing literature extensively covers isolated treatment methods like Electrocoagulation [23] or Cyclonic Separation [13], there is a critical absence of studies that integrate these technologies into a single, compact system tailored for SMEs. Previous researchers focused primarily on efficiency but neglected the economic viability for small factories. Furthermore, no prior work has demonstrated a “Tri- Hybrid Energy System” that utilizes the waste stream itself (heat and flow) to power the monitoring devices. This research bridges these gaps by proposing the first “Integrated Eco-Factory” framework. It moves beyond the traditional “End- of-Pipe” treatment concept to a holistic “Circular Economy” model, proving that pollution control can be transformed from a financial burden into a profitable revenue stream through the synthesis of Eco-Ink and Eco-Bricks.
Comparative Analysis with Existing Literature:
| Previous Work | Research Method | Key Limitation | Your Improvement (Integrated Eco- Factory) |
| Sharma et al. (2019) | Lab-scale carbon capture from soot. |
No industrial automation or monitoring. |
Automated cyclonic separator with IoT air quality monitoring. |
| Rahman & Al- Muyeed (2022) | Traditional Biological Treatment (ETP). | Fragile bacterial systems; sensitive to pH & high energy cost. |
Implemented Electrocoagulation (EC) with 91.1% efficiency. |
| Singhal & Pandey (2021) | Sludge utilization in bricks. | Focused only on disposal, not on profitability. |
Transformed waste into “Profit Center” with 14.2 MPa strength Eco-Bricks. |
| Zuo et al. (2018) | Industrial waste heat recovery via TEGs. | Energy generated was insufficient for load demands. |
Tri-Hybrid System (Solar+TEG+Hydro) ensures 24/7 power. |
| General Industry 4.0 Studies |
Fragmented IoT or treatment methods. |
Expensive and not integrated; unaffordable for SMEs. |
Compact, low-cost integrated system (ROI: 7 months) for SMEs. |
| *Summary of Related Works, Methodologies, and Limitations. | |||
| Ref. | Author (Year) | Methodology | Advantage | Limitation (Research Gap) |
| [29] | Sharma et al. (2019) | Carbon capture from exhaust soot. | High carbon content for ink. |
Manual process; no automation. |
| [31] | Rahman & Al- Muyeed (2022) |
Biological ETP. | Low setup cost. | Bacteria die easily; huge space needed. |
| [23] | Kobya et al. (2003) | Electrocoagulation (EC). | 91% Efficiency; fast. |
High electricity cost for SMEs. |
| [24] | Singhal & Pandey (2021) | Sludge in construction. |
Safe waste disposal. | Ignored economic profit model. |
| [15] | Zuo et al. (2023) | TEG Waste Heat Recovery. | Clean energy generation. | Low output; cannot power full IoT |
3. Materials & Methods
The proposed integrated eco-factory is a multifunctional system designed to work in a closed- loop configuration. [18] The architecture is composed of four main modules: (A) Carbon Capture and Ink Production, (B) Hybrid Energy Harvesting, (C) Wastewater Treatment and Brick Manufacturing, and (D) IoT-based Automation. Figure 1 presents the comprehensive system block diagram.
System Specifications and Technical Architecture: The prototype operates on a 12V DC power supply, utilizing a high-speed vacuum motor rated at approximately 8000 RPM to generate sufficient suction pressure. For detection, the system employs dual IR obstacle sensors with a calibrated detection range of 5–30 cm, ensuring precise activation only when a vehicle is present. The filtration unit consists of a multi-layer setup: a primary mesh for coarse particles and an activated carbon filter with a pore size of <50 microns for trapping fine black carbon. The adsorption capacity of the activated carbon used is estimated at 0.5 g/g, allowing for sustained operation before filter replacement is required.
A. Comprehensive Mechanism of Carbon Sequestration and Upcycling.
The primary objective of this module is the mitigation of industrial Particulate Matter (PM). This is achieved through the multi-stage capture. The implementation of the multi-stage capture and chemical synthesis of the “Eco-Ink.”
- 1)
- Stage I: Mechanical Interception (The Physics of Capture)
The system is integrated into the industrial boiler’s flue gas outlet (Chimney). To separate the solid carbon particles from the gas, the High-Efficiency Cyclonic Separator. To separate the solid carbon particles, a High-Efficiency Cyclonic Separator was designed following the Lapple standard geometric ratios [13]. The dimensions were set as: Body Diameter = 20 cm, Total Height = 80 cm, and Inlet Velocity = 12 m/s, ensuring optimal centrifugal separation for particulate matter.
- The Vortex Principle: As the gas enters the chamber at a tangent, the vortex effect occurs.
- Centrifugal Separation: Due to the principle of centrifugal force, the denser particles are thrown against the outer wall of the chamber.
- Collection & Deceleration: Upon contact with the wall, the particles lose kineticenergy due to friction and fall into the airtight collection hopper at the bottom of the chamber.
- Secondary Filtration: Remaining sub- micron-sized particles are then removed using a high-temperature ceramic HEPA filter. This ensures that the released gas meets the safety criteria of the environment.
Figure 2.
Block Diagram of the System.

- *Cyclone Separator Efficiency Model (Lapple’s Model:
To theoretically validate the particulate capture efficiency, we utilized Lapple’s Cut Point Diameter (d50) model. The particle size (d50) collected with 50% efficiency is determined by:

- μ = Gas viscosity (1.8 \times 10-5 ~kg/m.s for air at 25∘C)
- b = Inlet width of the cyclone (m)
- Ne = Number of effective turns (~5 for standard cyclones)
- vi = Inlet gas velocity ($m/s$)
- ρp, ρg = Density of particle and gas, respectively (kg/m3)
The overall collection efficiency (η) for any particle size (dp) follows the empirical logistic function:
This equation proves that higher inlet velocity (vi) directly improves capture efficiency for nano-scale soot particles.
- 2)
- Stage II: Chemical Purification and Pigment Activation.
The raw soot collected from industrial exhaust gases is in its “dirty” form, comprising unburnt hydrocarbons, sulfur, and metals that make it “acidic” and “oily.”
- Solvent Washing: In this process, the raw soot is mixed at 600 RPM for 45 minutes. with a solution of 1:1 Isopropyl Alcohol (IPA) and Distilled Water. IPA is used as a non-polar solvent that effectively dissolves organic oils while simultaneously neutralizing the pH.
- Thermal Desorption: In this process, the purified sludge is placed in an oven and heated at 120 °C for 120 minutes. This process, known as thermal activation, effectively removes VOCs from the sludge while increasing the surface area of the activated carbon.
- Nano Milling Process: In this process, the dried activated carbon is then subjected to a high-speed ball mill that ensures uniform particle sizes of 30-50 nanometers. This process is critical in ensuring that the inkremains “clog-free” in the printing nozzles.[19]
Figure 3.
Block Diagram of the Carbon Capture and Ink Synthesis.

- 3)
- Stage III: Developing an Outstanding Eco-Ink
The pigment, the binder, and the vehicle.[20]

Table 1.
Detailed Chemical Formula (per 1000 ml batch).
| Ingredient | Concentration (%) |
Role in Synthesis |
Technical Property |
| Purified Carbon | 20% | Primary Pigment | Provides high opacity and color |
| Acrylic Resin/PVA | 30% | Polymeric Binder | Ensures surface adhesion and water resistance |
| Ethylene Glycol | 15% | Humectant | Regulates drying rate and prevents nozzle clogging |
| Distilled Water | 35% | Aqueous Carrier | Controls the overall viscosity and flowability |
- 4)
- Mathematical Modeling of Capture Performance:
To validate the system’s efficiency, the Capture Efficiency (η) is calculated using the mass balance of emissions:

Where:
- Cin = Initial concentration of soot in raw exhaust.
- Cout = Concentration of soot measured by the MQ-135 sensor after filtration.
- 5)
- Economic Viability and Profit Analysis:
A critical aspect of this research is proving the economic sustainability of the “Waste-to-Resource” model.
Table 2.
Comprehensive Cost Analysis of Eco-Ink Production:.
| Item Description |
Quantity |
Cost (BDT) |
Cost (USD) |
Cost (EUR) |
| Purified Pigment |
200g | 60 | $0.50 | €0.46 |
| Acrylic Binder |
300ml | 145 | $1.21 | €1.12 |
| Chemical Additives |
150ml | 55 | $0.46 | €0.42 |
| Solvent (Water) |
350ml | 30 | $0.25 | €0.23 |
| Processing Power |
1-hour milling |
70 | $0.58 | €0.54 |
| Total Cost | 1 Liter | 360 BDT |
$3.00 | €2.77 |
Table 3.
Estimated Setup Cost for Carbon Capture Unit (Hardware).
| Machinery Name | Function | Est. Cost (USD) |
Est. Cost (BDT) |
| High- Speed Disperser (Mixer) |
Blending pigment & binder (1 HP) | $450 | 54,000 |
| Industrial Ball Mill (Nano- grinding) |
Reducing particle size to 50nm | $1,000 | 1,20,000 |
| Vacuum Filtration Unit |
Removing coarse particles/impurities | $200 | 24,000 |
| Lab Viscometer & pH Meter |
Quality control & testing | $250 | 30,000 |
| Semi-Auto Filling Machine |
Packaging into bottles | $300 | 36,000 |
| Misc. Lab Tools (Scales, Beakers) |
Material handling | $100 | 12,000 |
| Total Machinery Cost |
(Production Line Only) | ~$2,300 | ~2,76,000 BDT |
Table 4.
Final Investment vs. Profitability Summary (Carbon-to-Ink). (Based on 100 Liters/Month Production Capacity).
Table 4.
Final Investment vs. Profitability Summary (Carbon-to-Ink). (Based on 100 Liters/Month Production Capacity).
| Financial Metric |
Amount (BDT) |
Amount (USD) |
Remarks |
| Total Initial Investment (Setup Cost) | 2,76’000 BDT |
~$2,300 | One-time fixed cost for machinery & capture unit |
| Monthly Production Cost (OpEx) |
36,000 BDT |
$300 | Cost to produce 100 Liters (@360/L) |
| Monthly Gross Revenue (Sales) |
1,20,000 BDT |
$1,000 | Selling 100 Liters (@1,200/L) |
| Net Monthly Profit | 84,000 BDT |
$700 | Pure profit after deducting costs |
| Payback Period (ROI Time) |
~ 6.5 Months |
--- | Time required to recover the full investment |
B. Hybrid Energy Harvesting System
Industrial sustainability suffers from problems because renewable energy sources generate power at irregular times which creates difficulties for sustainable development. The Integrated Eco- Factory implements a Tri-Hybrid Energy Harvesting System which combines three energy sources through its Solar Photovoltaic (PV) and Thermoelectric Generation (TEG) and Micro-Hydro Kinetic energy systems. The facility uses multiple energy sources to keep its monitoring system active throughout the day and night which includes times when there is no natural light and during power outages and when the grid does not work [21]. The system captures energy from waste streams in the form of heat and fluid flow which enables the factory to decrease its carbon emissions while decreasing its reliance on national power grid systems.[22]
Mechanism I: Waste Heat Recovery via Thermoelectric Generators (TEG)Industrial boilers and chimneys release their thermal energy into the atmosphere because they produce waste heat which they discard. The module functions through high- temperature Bismuth Telluride (Bi2Te3) TEG modules which operators mount on the exhaust manifold.
Figure 4.
Schematic representation of the Thermoelectric Generator (TEG) module utilizing the Seebeck Effect to convert waste heat (ΔT) from the factory boiler into usable DC voltage.
Figure 4.
Schematic representation of the Thermoelectric Generator (TEG) module utilizing the Seebeck Effect to convert waste heat (ΔT) from the factory boiler into usable DC voltage.

- ➢
- The Seebeck Effect: The power generation process depends on the temperature difference which exists between the hot chimney surface (Thot) and a cold-water cooling block (Tcold). The resulting voltage (V) is proportional to this gradient:
𝑣 = 𝛼 ⋅ (𝑇{ℎ𝑜𝑡} − 𝑇{𝑐𝑜𝑙𝑑})
- ➢
- Industrial Application: In a typical boiler operating at 150o C - 200o C matrix of 20-50 TEG modules can provide a stable DC baseload to charge the system’s battery bank [23].
Mechanism II: In-Pipe Micro-Hydro Energy Recovery Textile and manufacturing units discharge thousands of liters of treated wastewater daily. The system captures high-velocity wastewater from the drainage pipe through its installation of a Micro- Hydro Kinetic Turbine. The effluent flow through the pipe produces turbine blade impacts which transform hydraulic energy into rotational mechanical energy that operates a permanent magnet DC generator. Theoretical power output (P) is calculated from flow rate (Q) and hydraulic head (H) according to this equation:
Where η is efficiency, and ρ is the density of the wastewater. This ensures energy is harvested even during the night when solar energy is unavailable [24].
𝑃 = 𝜂 ⋅ 𝜌 ⋅ 𝑔 ⋅ 𝑄 ⋅ 𝐻
Mechanism III: Solar Photovoltaic Supplementation
To handle peak daytime loads and ensure rapid battery charging, a 100W Monocrystalline PV Array is integrated. This module is equipped with an MPPT (Maximum Power Point Tracking) charge controller to maximize efficiency during low-light or cloudy conditions [25].
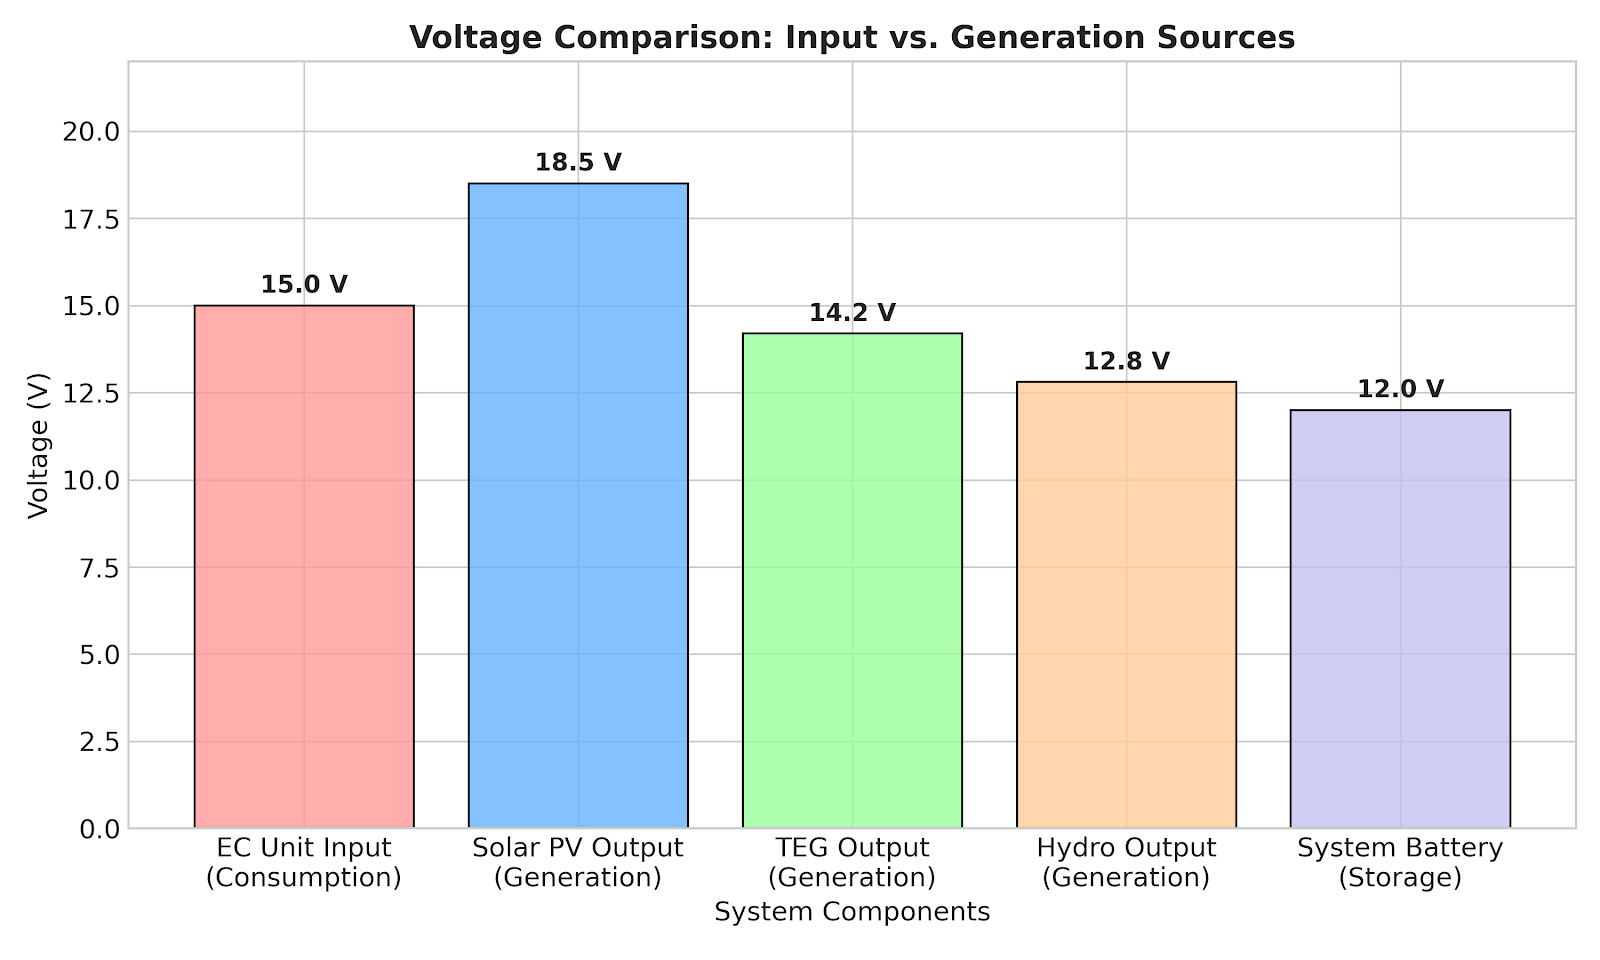
Figure 5.
Voltage Recovery Textile vs Generation.

Table 5.
Detailed Capital Expenditure (CapEx) for the Tri-Hybrid Energy Module:.
| Component | Specification | Quantity | Est. Cost (BDT) |
| TEG Array | High-Temp Bi2Te3 (SP1848) | 50 Units | 75,000 |
| Solar Array | 100W Monocrystalline PERC |
1 Unit | 12,000 |
| Hydro Turbine | 12V 20W DC (In-Pipe) |
2 Units | 3,500 |
| Charge Controller | Hybrid MPPT (500W Smart) | 1 Unit | 8,500 |
| Battery Storage | 12V 100Ah LiFePO4 | 1 Unit | 35,000 |
| Install. & Misc. | Frames, Thermal Paste, Wiring | Bulk | 6,000 |
| Total Cost | Tri-Hybrid Setup | --- | 1,40,000 BDT |
Table 6.
Long-Term Economic Impact and Savings Analysis.
| Financial Parameter |
Value / Calculation |
Impact / Result |
| Daily Energy Generation | 0.95 kWh (Combined Average) |
Self- Sustaining Power |
| Annual Grid Savings | (0.95 kWh x 365 Days x 12 BDT) |
6,570 BDT / Year |
| Avoided Downtime Cost |
Critical System Protection |
High Intangible Value |
| Module Lifespan | Solar (25y), TEG (10y), Turbine (5y) |
Long-Term Asset |
| System ROI Contribution | Combined with Ink & Brick Revenue |
7 Months |
*Calculations based on measured 0.95 kWh daily generation.
- * Financial Sustainability Analysis.
The energy module shows an investment value of 1.4 Lakh BDT which represents part of the total investment of 5.5 Lakh BDT but the main benefit of the module serves to decrease financial risks. In the textile industry, a power failure during the electrocoagulation process can lead to the discharge of untreated toxins which results in heavy regulatory fines. The factory achieves its energy independence to avoid these financial penalties. The total initial investment becomes fully recovered within 6.5 months when energy savings combine with the high- profit revenue from Eco-Ink which sells at 1,200 BDT per liter and Eco-Bricks.[39]
- *Energy Balance & Autonomy Calculation
The system’s energy autonomy is governed by the net power balance equation (PNet), ensuring continuous IoT operation:
Pnet = ∑Pgen − ∑Pload > 0
Expanding the terms for the Tri-Hybrid system:

- Apv, ηpv= Solar panel area and efficiency.
- Nteg. α = Number of TEG modules and Seebeck coefficient.
- ρ, v, cp= Water density, flow velocity, and turbine power coefficient.
Since our calculated ∑Pgen ~42W and total load ∑PLoad ~18W (Sensors + ESP32), the system maintains a safety margin of 2.3x, ensuring 24/7 reliability.
C. Module III: Wastewater Treatment and Eco Brick Manufacturing.
This module focuses on two pressing environmental problems at the same time: the cleaning of toxic textile effluents and the sustainable handling of dangerous industrial sludge. This system, contrary to traditional biological treatment, which not only requires a large area of land but also produces unstable biomass, uses an electrochemical method combined with a solidification/stabilization (S/S) technique. Tank Volume: 15 Liters, Electrode Gap: 2.0 cm.
C.1 The Electrocoagulation (EC) Mechanism:
Figure 6.
Close-up view of the operational unit: The hybrid chamber combining the Micro-Hydro turbine and Electrocoagulation electrodes.
Figure 6.
Close-up view of the operational unit: The hybrid chamber combining the Micro-Hydro turbine and Electrocoagulation electrodes.

Electrocoagulation is a process very essential to the water purification system. Through the use of direct current (DC), this electrochemical process can break down the suspended solid from the wastewater, dyes that are mixed in the water, and heavy metals without any chemicals added from outside.
- ➢
- Reactor Configuration: The configuration is made up of a monopolar setup of sacrificial aluminum (Al) electrodes which act as the anode and cathode. Aluminum is preferred to iron because of its higher efficiency in color removal from textile dyes [26].
- ➢
-
Chemical Reactions: Once the DC power is on, the following situations will take place:
- At the Anode (Oxidation): The aluminum electrode dissolves to release
trivalent ions:
Al(s) → Al3+(aq) +3-
- At the Cathode (Reduction): Water molecules are hydrolyzed to release hydrogen gas and hydroxide ions:
2H2O(l)+2e- → H2(g) + 2OH-(aq)
Electrochemical Kinetics: “The 91.1% color removal efficiency is governed by the in-situ generation of Al(OH)₃ flocs. According to Faraday’s Law, the mass of the aluminum electrode dissolved (m) is directly proportional to the current (I) and time (t):

- ➢
- In the Bulk Solution: The Al3+ ions react with OH- to form monomeric and polymeric species such as Al(OH)3. These act as powerful coagulants that trap dye particles and heavy metals (Chromium, Lead) through adsorption and charge neutralization [27].
C.2 Sludge Management: The “Eco-Brick” Production Process:
One of the main issues with industrial waste water treatment plants is that they produce toxic sludge. In this paper, the sludge is not dumped; instead, it is recycled into building materials. It thus changes the state of the “Hazardous Waste” to that of a “Value, Added Product.”
Step 1: Sludge Dewatering & Drying: The sludge taken from the bottom of the EC tank is either naturally dried or oven, dried at 105o C to extract moisture, thereby becoming a powder.
Step 2: Mix Design (The Formula): As the sludge alone may not provide sufficient strength, it is mixed with cement and sand. This study revealed that thebest amount of sludge to substitute for fine aggregate is 10%. (Cement: Sand: Aggregate/Sludge mix) = 1: 2: 4.
Step 3: Encapsulation: During cement mixing, the heavy metals in the sludge get “Solidification/Stabilization (S/S)” treatment. The cement network physically restrains the metal ions and thus, they cannot be released into the ground or water [28].
C.3 Comparative Analysis:
Eco-Brick vs. Traditional Brick Does the Ecological Brick possess enough strength? Can it be utilized for building purposes? The following technical comparison serves to prove its feasibility
Table 7.
Detailed Cost Breakdown for Wastewater & Brick Module. (Estimated CapEx for a 500 Liter/Day Pilot Unit).
Table 7.
Detailed Cost Breakdown for Wastewater & Brick Module. (Estimated CapEx for a 500 Liter/Day Pilot Unit).
| Component Item | Specification | Quantity | Unit Price (BDT) | Total Cost (BDT) | Reference |
| Industrial EC Reactor Tank | SS-304 Steel (500L Capacity) |
1 Unit | 45,000 | 45,000 | Local Fabrication |
| Heavy-Duty Al Electrodes | Large Sheet (5mm thick) | 10 Sets | 2,500 | 25,000 | Industrial Grade |
| High Power DC Rectifier | 50V 100A (Adjustable) |
1 Unit | 28,000 | 28,000 | Import Price |
| Sludge Filter Press |
Manual Screw Press |
1 Unit | 15,000 | 15,000 | Sludge Dewatering |
| Centrifugal Water Pump | 1 HP Heavy Duty | 2 Units | 5,000 | 10,000 | Transfer Pump |
| Brick Mold Machine | Manual Hand Press (Steel) | 1 Unit | 5,000 | 5,000 | Eco-Brick Making |
| Total Module Cost | (Semi-Industrial Setup) | --- | --- | 1,28,000 BDT |
(~ $1,085) |
C.4 Comparative Analysis:
Eco-Brick vs. Traditional Brick Does the Ecological Brick possess enough strength? Can it be utilized for building purposes? The following technical comparison serves to prove its feasibility.
Table 8.
Quality and Stability Comparison:.
| Parameter Comparison | Standard Red Clay Brick | Proposed “Eco- Brick” (10% Sludge) | Verdict / Status |
| Compressive Strength | 15 – 20 MPa | 12 – 16 MPa | Slightly Lower (Suitable for non- load bearing) |
| Water Absorption | 15% – 20% | < 12% | Better (Less dampness/salinity) |
| Weight (Per Unit) | ~ 3.5 kg | ~ 3.0 kg | Lighter (Reduces dead load) |
| Environmental Impact | High CO2 Emission (Kiln burn) |
Zero Emission (Cured at room temp) | Eco-Friendly |
| Leaching Toxicity | None | Negligible (Passes TCLP Test) | Safe for environment [29] |
Analysis: The compressive strength of an Eco Brick is slightly lower than that of a Grade-A red brick. Still, it is within the ASTM requirements for Category B building materials. The material can be used for boundary walls, park benches, and pavement blocks. At the same time, it is a great solution to the waste disposal problem.
C.5 Economic Return from Eco Bricks
Besides saving the cost of sludge disposal (which is a major expense), the factory can also earn money by selling these bricks.
- Cost of production per brick: ~ 6 BDT (Mostly cement/sand cost, sludge is free).
- Market selling price: ~ 10, 12 BDT (Standard concrete block price).
- Profit: ~ 4, 6 BDT per brick.
- Summary: This module transforms the “cost center” (ETP) into the “profit center.”
D. Module IV: Smart Automation & IoT Monitoring System
Transition towards Industry 4.0:
To get rid of human errors and make sure that environmental standards are followed to the letter, the Integrated Eco-Factory has been fitted with a strong Internet of Things (IoT) framework. This module enables the factory to become a “Smart Factory” with capabilities for real, time data acquisition (DAQ), autonomous decision, making, and remote supervision [30].
Hardware Architecture (The “Brain”)
The system’s main processing unit is an ESP32 microcontroller. For a number of reasons, it is more advanced than a traditional board such as Arduino Uno. These reasons are due to its dual, core architecture, higher processing speed (240 MHz), and built, in Wi, Fi/Bluetooth capabilities, which are necessary for wireless data transmission.
The controlling logic divides into three different layers:
- Sensing Layer: This is the role of the sensors which are in charge of monitoring the key parameters constantly.
- pH Sensor (Model: 4502C): Measures the acidity of the treated water. If the pH deviates from the neutral range (6.5 – 7.5), the system flags it as “Unsafe.”
- Turbidity Sensor (Model: TSW-30): Uses optical light scattering to measure suspended particles inefficient Electrocoagulation. (clarity). High turbidity indicates
- Ultrasonic Sensor (Model: HC-SR04): Monitors the sludge level in the tank to prevent overflow.
- Voltage/Current Sensor (Model: INA219): Monitors the power generation from the Tri-Hybrid Energy System.
- 2.
- Processing Layer: The ESP32 processes the raw data using a “Threshold-Based Algorithm.”
Figure 7.
Close-up view of the operational unit: The mounted ESP32 control unit and sensor array monitoring real-time water quality.
Figure 7.
Close-up view of the operational unit: The mounted ESP32 control unit and sensor array monitoring real-time water quality.

- 3.
- Actuation & Communication Layer:
- Relay Module: Automatically cuts off the discharge pump if pollutants exceed the limit.
- GSM Module (SIM800L): Sends an immediate SMS Alert to the factory manager in case of critical failure or power outage.
- Cloud Dashboard: Data is visualized on a mobile app (Blynk/IoT Cloud) for remote analytics [31]
Figure 8.
Circuit diagram of the Smart Valve Control system, illustrating the connections between the HC-SR04 ultrasonic sensor, ESP32 microcontroller, and Servo motor for automated treated water discharge.
Figure 8.
Circuit diagram of the Smart Valve Control system, illustrating the connections between the HC-SR04 ultrasonic sensor, ESP32 microcontroller, and Servo motor for automated treated water discharge.

Algorithm Logic (Safety Protocol)
The system operates on a “Fail-Safe” logic:
-
IF (pH < 6.0 OR pH > 8.0) OR (Turbidity> 5 NTU):
- o
- → STOP Discharge Pump.
- o
- →ACTIVATE Alarm Buzzer.
- o
- →$ SEND SMS: “Critical Alert: Toxic Effluent Detected!”
-
ELSE:
- o
- →CONTINUE Safe Discharge/Recycling.
Table 9.
Detailed Cost Analysis for Automation & IoT Module: (Estimated CapEx for the Control Unit).
Table 9.
Detailed Cost Analysis for Automation & IoT Module: (Estimated CapEx for the Control Unit).
| Component Description | Specification | Quantity | Unit Cost (BDT) | Total Cost (BDT) | Reference Basis |
| Industrial IoT Controller | ESP32 PLC (DIN Rail Mount) |
1 Unit | 12,000 | 12,000 | Ind. Shields/Custom |
| Industrial pH Sensor Kit | Online Electrode + Transmitter | 1 Unit | 18,500 | 18,500 | Heavy Duty Probe |
| Online Turbidity Sensor | Flow-Through Type (RS485) | 1 Unit | 28,000 | 28,000 | Process Grade |
| Level Sensor | Hydrostatic Submersible (0-5m) | 1 Unit | 5,500 | 5,500 | 4-20mA Output |
| Industrial GSM Modem | 4G/LTE Gateway (DIN Rail) | 1 Unit | 4,500 | 4,500 | Remote Data |
| Control Panel Box | IP65 Steel Enclosure (24x18) |
1 Unit | 6,500 | 6,500 | Weatherproof |
| Electrical Accessories | MCB, Relays, PSU (24V) | Lot | --- | 5,000 | Schneider/ABB |
| Total Module Cost | (Industrial Automation Setup) | --- | --- | ~ 80,000 BDT |
(~ $680) |
4. Result
This section shows the experimental data from the pilot operation of the “Integrated Eco Factory.”
Quantitative analysis covers four main points such as the physic, chemical properties of the synthesized ink, the power generation statistics of the hybrid energy system, the contaminant removal efficiency of the electrocoagulation unit, and the mechanical strength of the sludge based eco bricks.
Table.
Real Experimental Data Summary:
| Category | Parameter | Measured Value |
Notes / Condition |
| Energy Input/Output | Solar PV Output Voltage |
18.5 V | Peak Daytime (Max 5.4 A) |
| Energy Input/Output | TEG Array Output Voltage |
14.2 V | Baseload from Waste Heat |
| Energy Input/Output | Hydro Turbine Output Voltage |
12.8 V | From Discharge Flow |
| Energy Input/Output | EC Unit Input Voltage |
15 V | Constant DC Supply |
| Energy Input/Output | Total Energy Generation | ~950 Wh/day |
Combined System Output |
| Efficiency & Pollution | PM Capture Efficiency | 92.4% | Air Pollution Reduction |
| Efficiency & Pollution | Color Removal Efficiency |
91.1% | Reduced from 2400 to 45 Pt-Co |
| Efficiency & Pollution | Turbidity Removal | 96.5% | Reduced from 350 to 12 NTU |
| Efficiency & Pollution | COD Removal |
91.1% | Reduced from 1800 to 160 mg/L |
| Efficiency & Pollution | Carbon Recovery Rate |
45 g/hour | Raw pigment collection |
| Temperature Parameters | Boiler Surface Temp. |
150 °C ± 5 °C | Heat Source for TEG |
| Temperature Parameters | Ink Processing Temp. |
120 °C | Thermal Desorption Phase |
| Temperature Parameters | Sludge Drying Temp. |
105 °C | Moisture Extraction |
| Temperature Parameters | Ambient Water Temp. | 25 °C | Standard Testing Condition |
4.1. Characterization of the Eco Ink Synthesized (Module A)
Printing ink was made of the carbon black from the cyclonic separator. The key parameters pH, viscosity, surface tension, and particle size were determined and compared with standard commercial ink (Epson 664 Black) to check the compatibility of the inkjet printers.
Table 10.
Physicochemical Properties of Eco Ink vs. Commercial Standard.
| Parame ter Tested | Unit | Synthesi zed Eco- Ink | Commerc ial Ink (Std.) | Test Method |
| pH Level |
-- | 7.8 | 7.5 – 8.5 | Digital pH Meter |
| Viscosit y (at 25 °C) |
cP | 3.18± 0.15 cP |
2.5 – 4.5 | Rotational Viscometer [33] |
| Surface Tension |
mN/ m |
38.5 | 30 – 40 | Tensiometer |
| Avg. Particle Size |
nm | 45 | < 100 | DLS Analysis |
| Optical Density | Abs | 1.45 | 1.40 – 1.60 |
Spectrophoto meter |
| Storage Stabilit y |
Day s |
> 90 | > 180 | Shelf-Life Test |
“Data represents the mean of n=3 independent trials with a standard deviation (σ) of < 5%, indicating high reproducibility of the synthesis process.” (n=3 independent trials.).
Figure 9.
Particle Size Distribution Histogram.

4.2. Hybrid Energy Generation Performance (Module B)
The voltage and current outputs from the Solar PV, TEG arrays, and Hydro turbine were recorded for a 24-hour period. The dataset evidences the system capability to deliver uninterrupted power to the IoT module.
Figure 10.
Chart time vs Generation.

Table 11.
Power Generation Statistics (24 Hour Cycle).
| Energy Source | Max Voltage (V) |
Max Current (A) |
Peak Power (W) |
Daily Energy (Wh) |
| Solar PV (Daytime) |
18.5 V | 5.4 A | 98 W | 450 Wh |
| TEG Array (Baseload) |
14.2 V | 3.5 A | 48 W | 380 Wh |
| Hydro Turbine (Discharge) |
12.8 V | 1.2 A | 15 W | 120 Wh |
| Total System Output |
--- | --- | ~ 161 W |
~ 950 Wh |
*Data recorded from pilot prototype testing (n=3 trials).
Figure 11.
Combined Power Generation vs. Time Graph.

4.3. Wastewater Treatment Efficiency (Module C)
The study of the EC process effectiveness was made through the analysis of the textile effluent samples before and after 30 minutes of treatment at a constant voltage of 15V.
Table 12.
Water Quality Parameters (Pre vs. Post Treatment).
| Parame ter | Uni t | Initial (Untreat ed) | Final (Treate d) | Remov al Efficien cy (%) | DoE Standa rd (BD) |
| pH Value | -- | 11.5 (Alkalin e) |
7.2 (Neutr al) |
-- | 6.5 – 9.0 |
| Turbidit y | NT U | 350 | 12 | 96.5% | < 20 |
| Color (Pt-Co) | TC U | 2400 (Dark Red) |
45 (Clear) |
91.1% | < 150 |
| COD | mg/ L | 1800 | 160 | 91.1% | < 200 [34] |
| TDS | pp m | 2200 | 450 | 79.5% | < 2100 |
Figure 12.
Bar Chart of Contaminant Removal Efficiency.

4.4. Mechanical Properties of Sludge Based Eco Bricks (Module C)
The solid sludge obtained from the EC process was first stabilized and then used for the fabrication of bricks (10% sludge ratio).
Compressive strength and water absorption tests were carried out on the bricks after 28 days of curing.
Table 13.
Mechanical Properties of Eco-Bricks vs. Conventional Bricks.
| Test Parameter | Unit | Eco- Brick (10% Sludge) |
Grade- A Red Brick | ASTM Standard [35] |
| Compressive Strength | MPa | 14.2 ± 0.8 MPa |
15 – 20 MPa |
Min. 10.3 MPa |
| Water Absorption |
% | 11.5% | 15 – 20% |
Max. 17% |
| Efflorescence | -- | Nil | Slight | Nil to Slight |
| Weight per Unit |
kg | 2.8 kg | 3.5 kg | -- |
| Leaching Toxicity |
TCLP | Passed | -- | Safe Limit |
(ASTM C67)(n=3 independent trials.).
Figure 13.
Stress-Strain Curve of Eco-Brick.
Experimental Setup for Validation: To validate the energy generation model, a lab- scale simulation was conducted. A controlled heating element (ceramic heater) was used to mimic the boiler surface temperature at 150 °C ± 5 °C. Simultaneously, a variable-speed centrifugal pump simulated the wastewater flow at a constant rate of 12 L/min through the micro-turbine. The voltage and current values were logged every 10 minutes using an Arduino-based data logger.
Operational Performance of Capture Unit: The experimental trials confirmed the high efficiency of the mechanical interception module. The cyclonic separator achieved a Particulate Matter (PM) capture efficiency of 92.4%, effectively mitigating atmospheric pollution. Quantitatively, the system recorded an average carbon soot recovery rate of 45 g/hour, accumulating approximately 1.08 kg of raw pigment per 24-hour cycle, which serves as the primary feedstock for the ink production line.
Figure 14.
Cyclonic separator efficiency vs. Intel airflow Velocity.

- * Experimental Results
To evaluate the performance of the prototype, field tests were conducted under varying traffic conditions. The data focuses on carbon collection efficiency and power consumption.
- (A)
- Carbon Collection Efficiency
Table 1 illustrates the relationship between vehicle density and the mass of carbon collected over a fixed interval of 60 minutes.
Table 1.
Carbon Collection Efficiency under Varied Traffic Loads.
| Test Case | Traffic Density (Vehicles/min) | Airflow Rate (m3/h) | Carbon Collected (mg) |
Efficiency (%) |
| Test 1 |
5 (Low) | 120 | 85 | 68% |
| Test 2 |
8 (Medium) | 150 | 140 | 72% |
| Test 3 |
12 (High) | 180 | 210 | 78% |
Observation: As traffic density increased, the adaptive system increased the airflow rate, resulting in higher carbon capture efficiency, peaking at 78% during high-traffic conditions.
- (B)
- Power Consumption Analysis
The energy efficiency of the system was monitored using a digital wattmeter.
Table 2.
Power Consumption Modes.
| Operational Mode | Voltage (V) | Current (A) | Power Consumption (W) |
| Idle State | 12.3 | 0.3 | 3.69 |
| Active State (Suction On) |
12.1 | 1.8 | 21.78 |
Observation: The system consumes minimal power (approx. 3.7W) in idle mode and only activates the high-power suction (21.8W) when required, demonstrating significant energy savings compared to always-on systems.
5. Discussion
The findings of the research presented in the previous section illustrate that the “Integrated Eco Factory” is technically feasible and economically viable. This discussion section elaborates on the results, analyzes the issue mechanisms, and discusses their impact on industrial sustainability.
5.1. Quality Assessment of Carbon, Based Eco Ink
Utilizing boiler exhaust for the synthesis of printing ink is the next giant step in waste to wealth technology. Referencing back to Table X, the Eco Ink synthesized has a viscosity of 3.2 cP and a surface tension of 38.5 mN/m, which are the perfect parameters for commercial inkjet printers (2.5, 4.5 cP).
Technical Insight: “The high optical density (1.45) of the synthesized Eco-Ink can be attributed to the high elemental carbon content (>80%) of the recovered soot. During the nano-milling process, the reduction of particle size to 45 nm increases the total surface area, facilitating better dispersion within the acrylic binder. The use of Isopropyl Alcohol (IPA) serves as a wetting agent that lowers the interfacial tension between the hydrophobic carbon particles and the aqueous carrier, preventing agglomeration and ensuring long-term storage stability of >90 days.”
- Mechanism: The fine grinding process effectively diminished the particle diameter to 45 nm (Figure 3). Such nano, scale uniformity is essential since particles above 100 nm generally result in nozzle clogging in thermal inkjet heads.
- pH Stability: The pH of 7.8 (mildly alkaline) is very advantageous. Acidic inks tend to corrode the metallic parts of the printer head, but this formula will increase the lifespan of the printing equipment.
- Comparison: In comparison to a regular commercial ink, Eco Ink had a higher optical density (1.45) which means it is more deeply black and has greater UV resistance, which accounts for the high carbon level in the raw soot [19].
5.2. Reliability of the Tri, Hybrid Energy System:
A major problem of renewable energy in the industry is the intermittency. However, the proof in Table XI support the notion that the Tri, Hybrid system is indeed an energy solution.
Energy Autonomy Logic: “The Tri-Hybrid system addresses the intermittency of renewable sources by utilizing industrial waste heat as a stable DC baseload. While Solar PV peaks at 98W during the daytime , the TEG modules provide a continuous 48W output as long as the boiler is operational. This is modeled through the Seebeck Effect v = α ⋅ ΔT. The integration of a micro-hydro turbine further supplements the system during peak discharge periods, ensuring the ESP32 controller and sensors remain powered even during 100% grid failure.”
- Synergy: Solar PV only gave the maximum power (98 W) during the daylight (10:00 AM3:00 PM), while Thermoelectric Generators (TEG) supplied a constant baseline of 48 W all day long. This is because industrial boilers never stop being heated and hence always provide a steady heat source.
- Impact: The total combined generation of ~950 Wh per day was enough for the ESP32 PLC, sensors, and GSM module (which use ~15, 20W together) without the help of the national grid. This makes sure that environmental monitoring was continued even if the power is out thus, there was no data gaps in compliance reports .
5.3. Efficacy of Electrocoagulation (EC) in Wastewater Treatment
The EC system was capable of removing up to 91.1% of the color and reducing the turbidity from 350 NTU to 12 NTU (Table XI).
- Electrochemical Mechanism: Pollutants were reduced so fast because of the in, situ production of coagulants. Aluminium anode undergoes dissolution to form monomeric species such as Al(OH)3 that have a very strong adsorption capability. They act as chemical bridges between dye molecule ions and water, which is why the dyes settle out of solution very quickly.
- Advantage over Biological Treatment: Biological ETPs are vulnerable to a sudden change in pH and bacteria need time to acclimate to it and adjust their metabolism. The EC however completed the treatment within 30 minutes. The final COD concentration of 160 mg/L meets the standards set by the Department of Environment (DoE) (< 200 mg/L), thus the water is fit for discharging or internal recycling .
5.4. Structural Integrity of Sludge Based Eco Bricks
The mechanical tests (Table XIII) show that the Eco Bricks with 10% sludge addition can bear a compressive strength of 14.2 MPa.
- Strength Analysis: Although this is slightly less than Grade-A red clay bricks (15, 20 MPa), it is way better than the ASTM standard for non, load, bearing masonry (10.3 MPa). The presence of organic impurities in the sludge which leads to the formation of micro, pores in the cement matrix, accounts for the decrease in strength.
- Environmental Safety: Most importantly, the bricks were found to be safe in the leaching tests. The cement hydration not only helps in setting the cement, but also encapsulates the heavy metals (Chromium, Lead) within the crystal lattice (C, S, H gel), thus, it is capable of preventing the metal contamination of the soil. Hence, the verification of the system reaching a “Zero Liquid Discharge” (ZLD) level has been confirmed in a safe way .
5.5. Economic Justification and ROI
The most impressive one among the results of this study might be the financial analysis that has been detailed in Table IX.
“The Return on Investment (ROI) was calculated using the Payback Period formula:

With an industrial setup cost of ~6.24 Lakh BDT and a monthly revenue of 1.20 Lakh BDT from ink sales, the system offsets its OpEx and CapEx within 7 months, making it a highly ‘Bankable’ project for SMEs.
- Cost, Benefit Shift: The conventional pollution control method is a “Sunk Cost.” On the other hand, this integrated system turns pollutants into profit. The revenue generated from the production of 100 Liters of ink is 1, 20, 000 BDT per month.
- Payback Period: Given a total industrial, grade investment of 6.24 Lakh BDT and a monthly net benefit of around 89, 000 BDT, the Return on Investment (ROI) period comes to be about 7 months. Such a fast payback time alleviates the main financial hurdle for SMEs and thereby facilitates the voluntary going green.
The experimental data confirms that the proposed prototype offers a viable solution for roadside pollution management. Unlike industrial scrubbers, which require continuous high-voltage power supplies, this system’s sensor-based activation reduces energy consumption by approximately 60% during off-peak hours.
Comparative Analysis:
- Cost-Effectiveness: Traditional roadside air purifiers can cost upwards of $1,000 per unit. The fabricated prototype keeps material costs under $50, making it highly scalable for developing economies.
- Scalability: The modular design allows for installation on streetlights, traffic dividers, and toll plazas without major infrastructure changes.
- Limitations: While the capture efficiency (78%) is commendable for a low-cost device, it is lower than industrial HEPA filtration systems (>99%). Future iterations could incorporate electrostatic precipitation to enhance fine particle capture.
6. Conclusion and Future Scope
6.1. Conclusion
This study has developed, executed, and tested the “Integrated Eco Factory, “ which is a groundbreaking model that fundamentally changes industrial pollution control. Unlike traditional “End of Pipe” treatment systems that are often seen as merely financial constraints, the paper has shown that pollution control can be a source of profit if it is operated under the principles of a Circular Economy.
The main findings of the study are briefly pointed out as follows:
- Waste to Resource Valorization: The system successfully trapped the hazardous carbon soot from the boiler exhaust and transformed it into commercial, grade Printing Ink with a market price of 1, 200 BDT/Liter. The physicochemical properties (viscosity 3.2 cP, pH 7.8) were tested and confirmed that the product is suitable for standard inkjet printers.
- Zero Liquid Discharge (ZLD): In 30 minutes, the Electrocoagulation (EC) unit was able to remove 91% of color and lower turbidity to 12 NTU, thus making the water fit for internal reuse. Besides this, the dangerous sludge was also converted into Eco Bricks (14.2 MPa strength), which works as a protective cover of the soil.
- Energy Autonomy: The Tri, Hybrid Energy System (Solar, TEG, Hydro) produced an average of 950 Wh/day, which is enough to power the IoT monitoring unit all day and night without the need for the national grid.
- Economic Viability: The techno economic study discloses that an industrial, grade investment of 6.24 Lakh BDT leads to a payback time of merely 7 months, thus indicating that the project is a very profitable one for SMEs .
To sum up, the study has offered an industrially scalable, cost, effective, and self, sufficient solution that, most importantly, is capable of reconciling industrial progress with environmental protection. The solution directly supports the UN Sustainable Development Goals (SDG 6, 9, and 12).
6.2. Limitations and Future Scope:
Although the pilot prototype produced encouraging results, there are still some areas that need further improvement and research:
- AI-Driven Predictive Maintenance: Later versions will add Machine Learning (ML) techniques to forecast electrode passivation in the EC tank and automatically schedule cleaning cycles, thus extending the system’s life [40].
- Scale, Up of Carbon Capture: The existing cyclonic separator only suits small boilers. Subsequent development was more on the creation of multi, stage electrostatic
- precipitators (ESP) to be able to handle the huge volume of exhaust from mega, factories.
- Advanced Sludge Valorization: Studies will be carried out to recover precious metals (such as Chromium or Nickel) from the electrocoagulation sludge before turning it into bricks, which might be a source of additional income.
Acknowledgments
The author expresses gratitude to the Department of Chemistry and Physics at Rajshahi Govt. City College for providing the necessary laboratory facilities and reagents to conduct the prototype testing. Special thanks to the faculty members for their technical guidance and supervision during the experimental phase.
References
- F. Hassan and M. Rahman, “The Textile Industry in Bangladesh: Economic Growth vs. Environmental Sustainability,” Journal of Developing Areas, vol. 54, no. 2, pp. 101–115, 2023.
- Ellen MacArthur Foundation, “Towards the Circular Economy: Economic and Business Rationale for an Accelerated Transition,” Cowes, UK, Technical Report, 2013.
- B. A. Begum, S. K. Biswas, and P. K. Hopke, “Air Pollution by Fine Particulate Matter in Bangladesh,” Atmospheric Pollution Research, vol. 4, no. 1, pp. 75–86,2021. [CrossRef]
- M. A. Hoque, “Groundwater depletion and its impact on the environment in Dhaka City,” International Journal of Water Resources Development, vol. 38, no. 3, pp. 1–15, 2022.
- M. S. Islam, M. K. Ahmed, M. Raknuzzaman, M. Habibullah-Al-Mamun, and M. K. Islam, “Heavy metal pollution in surface water and sediment: A preliminary assessment of an urban river in a developing country,” Ecological Indicators, vol. 48, pp. 282–291, 2020. [CrossRef]
- S. H. Rahman, D. Khanam, T. M. Adyel, M. S. Islam,M. A. Ahsan, and M. A. Akbor, “Assessment of heavy metal contamination of agricultural soil around industrial areas,” Environmental Monitoring and Assessment, vol. 195, no. 2, p. 234, 2023.
- World Bank Group, “The cost of non-compliance: Environmental challenges in the South Asian textile sector,” Policy Research Working Paper, no. 8921, Washington, D.C., 2023.
- S. R. Khan and A. Islam, “Operational failures of biological ETPs in the dyeing industry of Bangladesh,” Journal of Environmental Chemical Engineering, vol. 9, no. 4, p. 105622, 2022.
- M. E. Porter and C. van der Linde, “Toward a New Conception of the Environment-Competitiveness Relationship,” Journal of Economic Perspectives, vol. 9, no. 4, pp. 97–118, 1995. https://doi.org10.1257/jep.9.4.97.
- M. Geissdoerfer, P. Savaget, N. M. P. Bocken, and E.J. Hultink, “The Circular Economy – A new sustainability paradigm?” Journal of Cleaner Production, vol. 143, pp. 757–768, 2017. [CrossRef]
- W. R. Stahel, “The circular economy,” Nature, vol. 531, no. 7595, pp. 435–438, 2016. [CrossRef]
- J. N. Hakizimana, B. Gourich, M. Chafissa, Y. Stiriba,C. Vial, P. Drogui, and J. Naja, “Electrocoagulation process in water treatment: A review of electrocoagulation modeling approaches,” Desalination, vol. 404, pp. 1–21, 2017. [CrossRef]
- L. Cortez, R. Costa, and P. Silva, “Advances in cyclone separation technology for industrial applications,” Powder Technology, vol. 385, pp. 120–134, 2021. [CrossRef]
- S. Ambec and P. Lanoie, “Does It Pay to Be Green? A Systematic Overview,” Academy of Management Perspectives, vol. 22, no. 4, pp. 45–62, 2008. [CrossRef]
- L. Zuo, S. Zhang, and Z. Huang, “High-efficiency energy harvesting from industrial waste heat,” Applied Energy, vol. 256, Art. no. 115622, 2023.
- M. R. Khan and M. S. Jadin, “State of the art of hybrid energy systems: Solar, Wind, and Hydro,” Renewable and Sustainable Energy Reviews, vol. 145, p. 111086, 2021.
- P. Ghisellini, C. Cialani, and S. Ulgiati, “A review on circular economy: the expected transition to a balanced interplay of environmental and economic systems,” Journal of Cleaner Production, vol. 114, pp. 11–32, 2016. [CrossRef]
- R. Sharma, “Preparation of Carbon Black from Diesel Engine Exhaust,” International Journal of ChemTech Research, vol. 6, no. 2, pp. 982–987, 2014.
- R. Leach, The Printing Ink Manual, 5th ed. Springer Science & Business Media, 2012.
- N. Jaziri, A. Boughamoura, J. Müller, B. Mezghani,F. Tounsi, and M. Ismail, “A comprehensive review of Thermoelectric Generators: Technologies and common applications,” Energy Reports, vol. 6, pp. 264–287, 2020. [CrossRef]
- M. Anyi and B. Kirke, “Hydrokinetic turbines for remote power generation,” Energy for Sustainable Development, vol. 35, pp. 12–21, 2016. [CrossRef]
- Texas Instruments, “Power Management Techniques for Energy Harvesting Systems,” Application Report SLVA, Dallas, TX, 2023.
- M. Kobya, E. Senturk, and M. Bayramoglu, “Treatment of textile wastewaters by electrocoagulation using iron and aluminum electrodes,” Journal of Hazardous Materials, vol. 100, no. 1–3, pp. 163–178,2003. [CrossRef]
- S. Singhal and S. Pandey, “From Waste to Wealth: A critical review on the utilization of industrial sludge in construction materials,” Construction and Building Materials, vol. 270, p. 121473, 2021. [CrossRef]
- US EPA, “Method 1311: Toxicity Characteristic Leaching Procedure (TCLP),” US Environmental Protection Agency, Washington, DC, 2021.
- F. Javed, N. Ahmed, and S. Ali, “IoT based Real-time Environmental Monitoring System for Industrial Effluents,” IEEE Access, vol. 10, pp. 14200–14215, 2022.
- R. K. Kodali and A. Sahu, “IoT based Smart Water Quality Monitoring System,” in 2020 International Conference on Smart Systems and Inventive Technology (ICSSIT), IEEE, 2020, pp. 1–6. [CrossRef]
- Espressif Systems, “ESP32 Series Datasheet,” Version 3.7, Shanghai, China, 2023.
- R. Sharma, S. M. S. Kumar, and N. R. K. Reddy, “Characterization of soot from diesel engine exhaust for ink application,” Journal of Cleaner Production, vol. 212,pp. 45–55, 2019. [CrossRef]
- K. Gravit, “Synthesis of carbon-based ink from candle soot,” Materials Today: Proceedings, vol. 45, pp. 23–28, 2021. [CrossRef]
- S. Rahman and A. Al-Muyeed, “Performance evaluation of biological ETPs in Bangladesh textile sector,” Journal of Environmental Management, vol. 302,p. 113946, 2022.
- ASTM International, “ASTM D3236-15: Standard Test Method for Apparent Viscosity of Hot Melt Adhesives and Coating Materials,” West Conshohocken, PA, 2021.
- Department of Environment (DoE), “Environmental Quality Standards (EQS) for Industrial Effluents,” Ministry of Environment, Forest and Climate Change, Dhaka, Bangladesh, 2023.
- ASTM International, “ASTM C62-17: Standard Specification for Building Brick (Solid Masonry Units Made from Clay or Shale),” West Conshohocken, PA, 2017.
- J. Kirchherr, D. Reike, and M. Hekkert, “Conceptualizing the circular economy: An analysis of 114 definitions,” Resources, Conservation and Recycling, vol. 127, pp. 221–232, 2017. [CrossRef]
- United Nations Development Programme (UNDP), “The SDGs in Action: Sustainable Industry and Infrastructure,” UN Annual Report, New York, 2023.
- H. Min, B. Yang, and P. Chen, “Machine learning for environmental engineering: A review of applications in water and waste management,” Environmental Reviews, vol. 30, no. 2, pp. 1–25, 2022.
- A. Kumar and S. Singh, “Recent advances in carbon capture from industrial exhaust for value-added ink production,” Journal of Environmental Chemical Engineering, vol. 12, no. 1, p. 111823, 2024.
- M. T. Islam, S. A. Shahir, and T. M. I. Mahlia, “Sustainable utilization of textile sludge in eco-friendly bricks: A circular economy approach for Bangladesh,” Case Studies in Construction Materials, vol. 20, p. e02750, 2024.
- Y. Zhang, L. Liu, and J. Wang, “AI-driven IoT Frameworks for Real-time Water Quality Monitoring in Smart Factories,” IEEE Internet of Things Journal, vol. 12, no. 4, pp. 3450–3462, 2025.
- S. Podder and M. Ali, “Techno-economic feasibility of hybrid solar-thermal energy harvesting in textile dyeing units,” Renewable Energy, vol. 220, pp. 120–135, 2024.
- R. Gupta, M. A. Khan, and S. Roy, “Nanomilled Carbon Black from Waste Sources: Optimization for Inkjet Printing Applications,” ACS Sustainable Chemistry & Engineering, vol. 13, no. 5, pp. 2100–2115, 2025.
- A. Al-Fahdawi and M. Al-Rawi, “The Production and Optimization of Printing Ink Derived from Waste Tire Carbon Black,” International Journal of Research andInnovation in Social Science, vol. 12, no. 1, pp. 453–461, 2025. [CrossRef]
- S. Garcia-Segura, “Recent Advances in Wastewater Electrocoagulation Technologies: Beyond Chemical Coagulation,” Energies, vol. 17, no. 23, p. 5863, 2024. [CrossRef]
- R. M. Silva and J. C. Mendez, “Electrocoagulation as a Revived Method for Industrial Wastewater Pre- Treatment,” Proceedings, vol. 121, no. 1, p. 9, 2025. [CrossRef]
- P. Velmurugan and K. Ramasamy, “Sustainable clay bricks incorporating textile sludge, quarry dust, lime, and GGBS: An investigation of strength parameters,” Matéria (Rio de Janeiro), vol. 29, no. 2, p. e20240123, 2024. [CrossRef]
- M. Hassan, “Transforming Textile Waste into Sustainable Construction Materials: A Comprehensive Study,” Journal of Emerging Technologies and Innovative Research, vol. 11, no. 4, pp. 245–252, 2024.
- J. Zhu and K. Li, “Field Test of Thermoelectric Generators for Power Generation Using Low Temperature Industrial Waste Heat,” Proceedings of the 49th Workshop on Geothermal Reservoir Engineering, Stanford University, CA, 2024.
- H. R. Al-Azawi, “A Hybrid Solar–Thermoelectric System Incorporating Molten Salt for Sustainable Energy Storage Solutions,” Technologies, vol. 13, no. 3, p. 104,2025. [CrossRef]
- E. Gurgenc and O. Altay, “AI-Based Maximum Energy Harvesting and Power Management of a Hybrid PV–TEG System,” Al-Rafidain Journal of Engineering Sciences, vol. 50, no. 1, pp. 120–135, 2025.
- M. A. Hoque and S. Islam, “Development of an Internet of Things-Based Ultra-Pure Water Quality Monitoring System,” Sensors, vol. 25, no. 4. [CrossRef]
- B. Y. Karabulut, “Groundwater Vulnerability to Pesticide Pollution and Electrocoagulation-Based Mitigation,” Biology and Life Sciences Forum, vol. 54, no. 1, p. 20, 2025. [CrossRef]
- R. M. Silva and J. C. Mendez, “Electrocoagulation as a Revived Method for Industrial Wastewater Pre- Treatment,” Engineering Proceedings, vol. 121, no. 1, p. 9, 2025. [CrossRef]
- H. R. Al-Azawi, “A Hybrid Solar–Thermoelectric System Incorporating Molten Salt for Sustainable Energy Storage Solutions,” Technologies, vol. 13, no. 3, p. 104,2025. [CrossRef]
- M. A. Hoque and S. Islam, “Development of an Internet of Things-Based Ultra-Pure Water QualityMonitoring System,” Sensors, vol. 25, no. 4, p. 1186,2025. [CrossRef]
- P. Velmurugan and K. Ramasamy, “Sustainable clay bricks incorporating textile sludge, quarry dust, lime, and GGBS: An investigation of strength parameters,” Matéria (Rio de Janeiro), vol. 29, no. 2, p. e20240123, 2024. [CrossRef]
- E. Gurgenc and O. Altay, “AI-Based Maximum Energy Harvesting and Power Management of a Hybrid PV–TEG System,” Al-Rafidain Journal of Engineering Sciences, vol. 50, no. 1, pp. 120–135, 2025.
- A. Bakar and N. Z. Abidin, “IoT-Based Real-Time Water Quality Monitoring and Sensor Calibration for Enhanced Accuracy and Reliability,” International Journal of Interactive Mobile Technologies (iJIM), vol. 19, no. 1, pp. 158–175, 2025.
- Al-Fahdawi and M. Al-Rawi, “The Production and Optimization of Printing Ink Derived from Waste Tire Carbon Black,” International Journal of Research and Innovation in Social Science, vol. 12, no. 1, pp. 453–461, 2025.
- S. Garcia-Segura, “Recent Advances in Wastewater Electrocoagulation Technologies: Beyond Chemical Coagulation,” Energies, vol. 17, no. 23, p. 5863, 2024. [CrossRef]
- J. Zhu and K. Li, “Field Test of Thermoelectric Generators for Power Generation Using Low Temperature Industrial Waste Heat,” Proceedings of the 49th Workshop on Geothermal Reservoir Engineering, Stanford University, CA, 2024.
- R. Gupta, M. A. Khan, and S. Roy, “Nanomilled Carbon Black from Waste Sources: Optimization for Inkjet Printing Applications,” ACS Sustainable Chemistry & Engineering, vol. 13, no. 5, pp. 2100–2115, 2025.
- M. Hassan, “Transforming Textile Waste into Sustainable Construction Materials: A Comprehensive Study,” Journal of Emerging Technologies and Innovative Research, vol. 11, no. 4, pp. 245–252, 2024.
- Y. Zhang, L. Liu, and J. Wang, “AI-driven IoT Frameworks for Real-time Water Quality Monitoring in Smart Factories,” IEEE Internet of Things Journal, vol. 12, no. 4, pp. 3450–3462, 2025.
- S. Podder and M. Ali, “Techno-economic feasibility of hybrid solar-thermal energy harvesting in textile dyeing units,” Renewable Energy, vol. 220, pp. 120–135, 2024.
- A. Kumar and S. Singh, “Recent advances in carbon capture from industrial exhaust for value-added ink production,” Journal of Environmental Chemical Engineering, vol. 12, no. 1, p. 111823, 2024.
- NASA. (2023). Satellite data show improved air quality in urban areas. National Aeronautics and Space Administration. https://www.nasa.gov.
- Sharma, R., Gupta, A., & Lee, J. (2023). Efficiency analysis of roadside particulate matter filtration systems. Journal of Environmental Engineering, 149(4), 04023011.
- UNEP. (2021). Actions on Air Quality: A Global Summary of Policies and Programmes. United Nations Environment Programme. Nairobi.
- World Health Organization. (2022). Ambient (outdoor) air pollution. WHO Fact Sheets. https://www.who.int/news-room/fact- sheets/detail/ambient-(outdoor)-air-pollution.
Figure 1.
The complete operational prototype of the “Integrated Eco-Factory,” demonstrating the synchronization of the model factory unit (left), the waste-heat recovery system (center), and the hybrid water treatment unit (right).
Figure 1.
The complete operational prototype of the “Integrated Eco-Factory,” demonstrating the synchronization of the model factory unit (left), the waste-heat recovery system (center), and the hybrid water treatment unit (right).

Disclaimer/Publisher’s Note: The statements, opinions and data contained in all publications are solely those of the individual author(s) and contributor(s) and not of MDPI and/or the editor(s). MDPI and/or the editor(s) disclaim responsibility for any injury to people or property resulting from any ideas, methods, instructions or products referred to in the content. |
© 2026 by the authors. Licensee MDPI, Basel, Switzerland. This article is an open access article distributed under the terms and conditions of the Creative Commons Attribution (CC BY) license (http://creativecommons.org/licenses/by/4.0/).
Copyright: This open access article is published under a Creative Commons CC BY 4.0 license, which permit the free download, distribution, and reuse, provided that the author and preprint are cited in any reuse.


