
Submitted:
26 February 2026
Posted:
27 February 2026
You are already at the latest version
Abstract
Soil microbiomes play a central role in nutrient cycling and ecosystem stability in forestry ecosystems. We performed a high-resolution amplicon-based analysis of rhizosphere soils from eucalyptus plantations in two ecologically distinct Brazilian regions. Following ASV inference and phylogenetic reconstruction, we observed pronounced taxonomic divergence: Eldorado do Sul (ES) showed higher richness (1,221 vs. 755 ASVs) and phylogenetic diversity, whereas Três Lagoas (TL) exhibited greater evenness. Beta diversity revealed strong compositional dissimilarity (Jaccard = 0.915; Bray–Curtis = 0.843), largely driven by site-specific rare taxa, with only 8.1% of ASVs forming a shared core microbiome. Despite this turnover, PICRUSt2-based functional prediction indicated substantial conservation of dominant metabolic pathways. Core MetaCyc pathways were highly similar across sites and centered on central carbon metabolism, amino acid biosynthesis, and energy production, while weighted UniFrac distances were low (0.067), indicating phylogenetic similarity among abundant taxa. Region-specific metabolic enrichments were detected: ES showed greater predicted potential for chitin degradation, purine turnover, and nitrifier denitrification, whereas TL was enriched in alternative TCA variants, glyoxylate pathways, menaquinol biosynthesis, and aromatic compound degradation. These findings demonstrate the coexistence of pronounced taxonomic turnover with a relatively conserved predicted functional framework across contrasting eucalyptus systems.
Keywords:
soil microbiome
; eucalyptus plantations
; plant growth‐promoting bacteria
; biocontrol
; functional diversity
; PICRUSt2
1. Introduction
Soil microbial communities are fundamental drivers of ecosystem functioning, particularly in agricultural and forestry systems, where they regulate nutrient cycling and organic matter turnover, thereby influencing soil health and plant performance [1,2]. Within the rhizosphere, the narrow soil interface directly influenced by root exudates, microorganisms mediate key ecological processes, including nitrogen transformation and phosphorus mobilization, and contribute to plant health and disease suppression [3]. This intricate and dynamic microbial assemblage, often described as the plant’s “second genome” [4], encompasses mutualistic, commensal, and antagonistic organisms competing for resources and ecological niches [5].
Accumulating evidence demonstrates that plants actively shape their rhizosphere microbiomes through selective recruitment mechanisms influenced by genotype, developmental stage, and environmental conditions [4]. Even under identical soil conditions, distinct plant species, or even genotypes within the same species, can assemble divergent microbial consortia, reflecting complex host–microbe interactions and genotype-specific microbial specialization [6]. Among these communities, plant growth-promoting bacteria (PGPB) have received particular attention due to their ability to enhance plant performance through biological nitrogen fixation, phosphate solubilization, siderophore production, phytohormone synthesis, and modulation of stress responses via ACC deaminase activity [7,8,9].
Such interactions contribute not only to plant vigor but also to long-term soil fertility and ecosystem stability, forming a cornerstone of sustainable agriculture and silviculture [8,10]. The application of microbial inoculants, particularly ecologically diverse consortia, has demonstrated potential to increase biomass production, nutrient acquisition efficiency, and tolerance to abiotic stressors such as drought and salinity [11,12]. Consequently, rhizosphere engineering has emerged as a promising strategy to mitigate soil degradation and enhance sustainability in intensive land-use systems [5,10].
While the applied dimension of microbiome management has advanced rapidly, an important conceptual question remains: to what extent does taxonomic diversity translate into functional capacity under real field conditions [13]? Numerous studies have documented pronounced differences in soil microbial composition across climatic gradients, land-use types, and edaphic conditions [1,14,15]. However, comparatively few investigations have simultaneously integrated taxonomic structure, phylogenetic relationships, and predicted metabolic potential within a unified analytical framework [13,16]. Ecological theory further suggests that microbial communities may exhibit substantial functional redundancy, whereby distinct taxa perform overlapping metabolic roles, stabilizing ecosystem processes despite compositional turnover [16,17]. Under this perspective, strong taxonomic divergence does not necessarily entail functional disruption.
In forest systems, studies have often emphasized either compositional diversity or specific functional traits [18,19]. Despite advances in microbial functional ecology, integrative analyses simultaneously evaluating taxonomic turnover, phylogenetic structure, and predicted functional capacity across contrasting environmental contexts remain scarce [13,16]. Consequently, comparative studies explicitly testing whether taxonomic turnover coexists with functional conservation across agroecological contexts are still limited, despite growing recognition that functional redundancy may buffer ecosystem processes against compositional shifts [17].
An additional layer of complexity arises from the structure of the “rare biosphere”, composed of low-abundance taxa that contribute substantially to total richness but may exert limited influence on dominant ecosystem processes [20,21]. Shifts in rare lineages can inflate compositional beta diversity while leaving the dominant functional backbone relatively conserved [20]. Distinguishing between turnover driven primarily by rare taxa and changes affecting abundant, metabolically influential groups is therefore essential for interpreting microbiome stability and resilience under field conditions, given their differential contributions to ecosystem multifunctionality and community assembly dynamics [22].
These questions are particularly relevant in large-scale forestry systems based on fast-growing species such as Eucalyptus spp., widely cultivated across diverse Brazilian agroecological zones. Whether taxonomic variation translates into functional reorganization remains a central issue in microbial ecology [16,17]. While several studies support substantial functional redundancy within microbial communities, where distinct taxa sustain overlapping metabolic roles [16,17], other investigations demonstrate that compositional shifts can directly influence ecosystem process rates, particularly when changes involve functionally influential or abundant taxa [22,23,24]. Clarifying this relationship is essential for predicting soil ecosystem responses under contrasting environmental conditions.
Eucalyptus plantations impose environmental filters that can alter soil chemical properties and nutrient availability [25], while broader regional variation in climate, soil type, and management intensity may further shape community assembly. In these systems, soil microbiota directly influence nutrient use efficiency and nitrogen cycling dynamics, thereby affecting broader biogeochemical processes and long-term ecosystem functioning [26]. Yet comparative studies integrating taxonomic diversity, phylogenetic structure, core microbiome analysis, and functional inference across contrasting eucalyptus-growing regions remain limited.
In this context, the present study conducted a comparative high-resolution amplicon-based analysis of rhizosphere soils from eucalyptus plantations located in two ecologically distinct Brazilian regions. By integrating ASV-level taxonomic inference, phylogenetic reconstruction, alpha and beta diversity metrics, core microbiome assessment, and functional prediction using PICRUSt2 [27], we tested whether pronounced taxonomic divergence across contrasting environmental contexts may coexist with conservation of dominant phylogenetically structured functional pathways.
Rather than attempting to generalize national-scale microbiome patterns or identify specific environmental drivers, this study adopts a comparative ecological framework focused on structural community organization. Specifically, we examine whether strong compositional turnover, potentially driven by rare and region-specific taxa, can occur alongside functional stability supported by dominant, phylogenetically related lineages. We further assess whether region-specific metabolic enrichments reflect context-dependent ecological filtering within eucalyptus plantation systems. By addressing this conceptual question, the study contributes to a broader understanding of microbiome resilience, functional redundancy, and metabolic specialization in intensively managed forest ecosystems.
2. Materials and Methods
2.1. Sample Collection
Soil samples were collected from commercial eucalyptus plantations during the vegetative growth stage in two contrasting Brazilian regions. In Eldorado do Sul (ES), Rio Grande do Sul (30°10′11″ S, 51°33′22″ W), soil was collected on 15 October 2022 from an area cultivated with Eucalyptus saligna. In Três Lagoas (TL), Mato Grosso do Sul (20°47′15″ S, 51°42′15″ W), soil was collected on 14 September 2022 from a plantation established with Eucalyptus grandis × E. urophylla.
At each site, rhizosphere soil was sampled following guidelines for soil sampling in forest and tree-based production systems [28]. Briefly, ten subsamples were collected along the planting line in a zig-zag pattern within the selected plot, at depths appropriate for perennial crops (20–40 cm), using sterilized tools. Subsamples (~50 g each) were homogenized to generate a single composite sample representative of each plantation site. The composite samples were kept refrigerated (4 °C) during transport and stored at 4 °C until DNA extraction.
2.2. DNA Extraction and Sequencing
Total microbial DNA was extracted from 0.25 g of each homogenized soil sample using the DNeasy® PowerSoil® Kit (QIAGEN, Hilden, Germany), following the manufacturer’s instructions, as commonly applied in soil metabarcoding studies [29]. DNA concentration was quantified using the Qubit™ dsDNA BR Assay Kit (Thermo Fisher Scientific, Waltham, MA, USA), and purity was assessed spectrophotometrically using a NanoDrop™ spectrophotometer (Thermo Fisher Scientific).
For bacterial community profiling, the V3–V4 hypervariable regions of the 16S rRNA gene were amplified using universal primers targeting conserved flanking regions [30]. Amplicons were purified using magnetic bead-based cleanup to remove residual primers and short fragments. Sequencing libraries were prepared according to the Illumina 16S Metagenomic Sequencing Library Preparation protocol [31], including dual-indexing to enable multiplexing.
High-throughput sequencing was performed on the Illumina MiSeq platform (Illumina Inc., San Diego, CA, USA) using paired-end chemistry (2 × 250 bp), generating overlapping reads suitable for high-resolution amplicon sequence variant (ASV) inference [32].
2.3. Soil Physicochemical Characterization
Soil physicochemical properties were determined by routine agronomic analysis performed by a certified analytical laboratory (Ideelab Biotecnologia, https://ideelab.com.br). Parameters included clay content, electrical conductivity, soil organic matter, total nitrogen (when available), available phosphorus and potassium, exchangeable calcium and magnesium, sulfur, and micronutrients (Cu, Fe, Mn, and Zn). Results are presented in Table 1. All analyses were conducted according to standard Brazilian agronomic soil testing protocols.
2.4. QIIME 2 Processing and Denoising
Raw Illumina MiSeq reads targeting the V3-V4 region of the bacterial 16S rRNA gene were processed using QIIME 2 (version 2026.1) [33]. Paired-end demultiplexed FASTQ files were imported into QIIME 2 as SampleData [PairedEndSequencesWithQuality] using a manifest file and assuming Phred+33 quality encoding. Per-base quality profiles were inspected with qiime demux summarize and used to define truncation and trimming parameters.
Primer sequences were removed using the q2-cutadapt plugin [34] prior to denoising to prevent retention primer-derived errors and to improve downstream variant inference. Error correction, chimera removal, and inference of amplicon sequence variants (ASVs) were performed with the DADA2 plugin (qiime dada2 denoise-paired) [32]. Forward and reverse reads were truncated at 240 bp and 200 bp, respectively, and no additional fixed-length 5′ trimming was applied after cutadapt-based primer removal. Maximum expected error thresholds were set to 2.0 for forward and reverse reads (--p-max-ee-f 2 and --p-max-ee-r 2). Chimeras were removed using DADA2’s consensus method (--p-chimera-method consensus). The denoising step generated a feature table of ASVs, representative sequences, and per-sample denoising statistics, which were inspected to evaluate read retention and chimera removal.
2.5. Assignment and Descriptive Taxonomic Profiles
Taxonomic classification of ASVs was performed using the QIIME 2 feature-classifier plugin with a pre-trained Naive Bayes classifier based on the SILVA 138.2 reference database clustered at 99% identity and trimmed to the 515F–806R region [35,36]. The classify-sklearn method was applied to representative sequences [37], and the resulting data artifact provided hierarchical annotations from kingdom to species level. The overall taxonomic composition of each sample was initially assessed using QIIME 2 taxonomic bar plots [33].
Further taxonomic analyses and visualizations were conducted in R (version 4.5.2) [38]. The ASV count table, taxonomic annotations, and sample metadata were imported and combined into a phyloseq object [39]. Empty or missing annotations were labeled as “Unassigned”. To reduce the influence of non-bacterial sequences and artefacts, ASVs classified as Eukaryota, as well as chloroplast and mitochondrial sequences, were removed. In addition, rare ASVs were filtered by retaining only those with ≥ 10 total reads in at least one sample, thereby reducing extremely low-abundance features likely to reflect sequencing or amplification noise.
ASV counts were transformed to relative abundances within each sample so that the total abundance summed to 100%. Observed ASV richness per sample was calculated using the estimate_richness function in phyloseq [39], and sequencing depth was summarized as the total number of reads per sample. These metrics were used to describe overall coverage and diversity.
To obtain compositional profiles at different taxonomic levels, ASVs were agglomerated by taxon at the phylum, family, and genus ranks. Relative abundances were summarized for each combination of sample and taxon, and visualized using stacked bar plots and comparative bar graphs implemented in ggplot2 [40]. For clarity, only the most abundant taxa were shown explicitly in the main figures, while remaining groups were pooled as “Others”, and unclassified taxa were labelled as “Unclassified”. In addition to stacked bar plots, Cleveland-style dot plots were generated to compare relative abundances between samples at phylum, family, and genus levels. These plots were ordered by the absolute difference in relative abundance between samples and, where indicated, annotated with the magnitude of this difference (Δ%), thereby emphasizing taxa showing the largest compositional shifts between sites. All plots were generated using ggplot2 [40].
2.6. Phylogenetic Reconstruction and Diversity Analyses
Phylogenetic relationships among amplicon sequence variants (ASVs) were inferred using the q2-phylogeny plugin in QIIME 2 (v. 2026.1). Representative ASV sequences were aligned using MAFFT via align-to-tree-mafft-fasttree [41], and highly variable or ambiguously aligned positions were masked. A midpoint-rooted phylogenetic tree was subsequently constructed using FastTree [42] to enable phylogenetic diversity calculations.
The resulting ASV table, taxonomy, and rooted phylogenetic tree were imported into R and integrated using the phyloseq package [39]. To account for variation in sequencing depth, samples were rarefied to 26,000 reads per sample via random subsampling without replacement. This depth was selected because rarefaction curves reached an asymptote at or before this threshold. Quantitative assessment of the curve slopes at the final depth confirmed saturation, yielding negligible discovery rates of new ASVs per additional read (5.16 × 10⁻¹⁰ for ES and1.85 × 10⁻⁸ for TL), ensuring sufficient coverage of microbial diversity while retaining all samples (Figure S1).
Alpha diversity was calculated on the rarefied dataset using complementary indices: (i) observed ASV richness, (ii) Shannon diversity, (iii) Simpson diversity, and (iv) Faith’s phylogenetic diversity (computed using the picante package) [43]. Metrics were summarized per sample and visualized as faceted bar plots in ggplot2 [40]. Given the presence of only two samples, formal statistical comparisons (e.g., parametric or non-parametric tests) were not performed, and differences are described descriptively.
Compositional dissimilarity between soil samples was evaluated using both taxonomic (Bray-Curtis and Jaccard) and phylogenetic (unweighted and weighted UniFrac) beta diversity metrics [44,45]. Pairwise distances between ES and TL were extracted, tabulated, and visualized to qualitatively assess community divergence. As with alpha diversity, multivariate statistical tests were not conducted due to sample size constraints. All data processing, diversity computations, and visualizations were performed in R using phyloseq, dplyr, and ggplot2 [39,46].
2.7. Functional Prediction of Microbial Communities
Functional profiles of the bacterial communities were inferred from 16S rRNA gene amplicon data using PICRUSt2 (Phylogenetic Investigation of Communities by Reconstruction of Unobserved States, v. 1.1.4) [27]. Representative ASV sequences and their corresponding abundance tables, derived from the QIIME 2 pipeline, were processed using the standard picrust2_pipeline.py script. The pipeline predicted the abundances of Enzyme Commission (EC) numbers, KEGG Orthologs (KOs) [47], and MetaCyc metabolic pathways [48]. Human-readable descriptions were subsequently appended to the unstratified output tables using the add_descriptions.py utility.
Data matrices were imported into R and converted to relative abundances to standardize functional profiles across ES and TL soils. Downstream exploratory analyses focused primarily on MetaCyc pathways and KOs. The top 30 most abundant pathways and KOs across both samples were identified and visualized using heatmaps (pheatmap package v.1.0.13) [49] to assess baseline functional signatures. Furthermore, pathways associated with key soil biogeochemical processes, specifically carbon (e.g., glycolysis, TCA cycle) and nitrogen cycling (e.g., nitrification, denitrification), were filtered by keyword and compared between sites using horizontal bar charts.
To evaluate functional divergence, absolute differences and log2 fold-changes in relative abundances between the ES and TL samples were calculated. The top 30 pathways exhibiting the largest abundance contrasts were visualized using comparative bar plots and scatter plots to highlight site-specific functional enrichment. All data wrangling and visualization were performed in R using dplyr, tidyr, and ggplot2 [46]. Consistent with the pilot scale of the study (n = 2), functional variation is reported descriptively.
Due to logistical constraints, only two geographically distinct sites were sampled, limiting statistical replication and preventing broad inferential generalization. Additionally, edaphic and climatic variables were not directly measured, precluding causal attribution of observed microbiome differences to specific environmental drivers. Functional inference was performed using PICRUSt2 [27], which relies on phylogenetic proximity to reference genomes and provides predictive estimates of metabolic potential rather than direct measurements of gene expression or activity. The absence of shotgun metagenomic sequencing further limits functional resolution.
3. Results
A total of 175,319 raw paired-end reads were generated from the two soil samples (ES and TL). Following quality filtering using DADA2 in QIIME 2, 84.3% of reads from ES (97,659 out of 115,820) and 81.8% of reads from TL (48,662 out of 59,499) were retained (Table S1). Subsequent denoising and read merging yielded 77,802 reads for ES (67.2% of input) and 35,599 merged reads for TL (59.8% of input). After chimera removal, 66,092 reads (57.1% of the original input) remained for ES and 28,870 reads (48.5% of the original input) for TL, which were used for downstream analyses (Table S1).
The initial ASV table included 2,937 features across both samples. Non-bacterial and organellar sequences (Eukaryota, chloroplasts, and mitochondria) were excluded, along with low-abundance ASVs (retaining only those with >10 reads in at least one sample), resulting in 1,828 ASVs for further analysis (62.2% of initial features). The final dataset comprised 62,491 reads for ES and 26,415 reads for TL, encompassing 1,221 and 755 observed ASVs, respectively.
3.1. Taxonomic Composition of the Soil Microbiomes
At the phylum level, bacterial communities in both soils were characterized by a limited number of dominant groups. The ten most abundant phyla accounted for the majority of sequences, with Actinomycetota (mean relative abundance, 35.2%) and Pseudomonadota (26.8%) predominating (Figure 1). Substantial contributions were also observed for Acidobacteriota (12.5%) and Bacillota (10.3%), followed by Verrucomicrobiota (4.1%) and Chloroflexota (3.5%). Less abundant but consistently detected phyla included Myxococcota, Gemmatimonadota, Bacteroidota, and the candidate phylum RCP2-54, each representing less than 2% on average (Figure 1).
Differences between the soils emerged primarily in the relative abundances of specific phyla. For instance, Actinomycetota was markedly less abundant in ES (26.5%) than in TL (44.0%), while Acidobacteriota and Verrucomicrobiota were enriched in ES (16.5% and 7.2%, respectively) compared to TL (8.4% and 1.0%). In contrast, Pseudomonadota and Bacillota maintained similar proportions across samples (approximately 10% and 27%, respectively), and Chloroflexota remained stable at around 3.5%. Unassigned bacterial reads were minimal in both soils (2.7% in ES and 1.3% in TL) (Figure 2 and Figure S2).
A Cleveland dot plot ordered by absolute difference underscored Actinomycetota, Acidobacteriota, and Verrucomicrobiota as exhibiting the most pronounced shifts between sites (Figure 3).
Shifting to the family level, the communities were likewise dominated by a relatively small set of bacterial groups (Figure 4). Across samples, the most abundant annotated families were Streptomycetaceae, Xanthobacteraceae, and Solirubrobacteraceae, together with Bacillaceae, Pseudonocardiacea,e and Nocardiaceae, all belonging to Actinomycetota or Bacillota. Marked differences between soils were evident for some of these dominant families. Streptomycetaceae was highly enriched in ES (19.63%) but nearly absent in TL (0.43%), making it the most abundant family in ES. Conversely, Solirubrobacteraceae (0.56% in ES vs. 8.10% in TL), Pseudonocardiaceae (0.15% vs. 5.11%), Nocardiaceae (0.40% vs. 4.38%), and Beijerinckiaceae (0.06% vs. 1.62%) were substantially more prevalent in TL.
Other families, including Bacillaceae, Xanthobacteraceae, Planococcaceae, Ktedonobacteraceae, Sphingomonadaceae, Azospirillaceae, Elsteraceae, Nocardiopsidaceae, and Ruminococcaceae, displayed milder variations, typically differing by 1–3 percentage points (Figure S3).
Unassigned sequences together comprised a substantial fraction of reads in both soils (20.2% in ES and 21.0% in TL), highlighting a considerable proportion of taxa unresolved at the family level. The Cleveland dot plot ordered by absolute difference confirms Streptomycetaceae, Solirubrobacteraceae, Pseudonocardiaceae, and Nocardiaceae as the families exhibiting the largest compositional contrasts between soils (Figure 5).
At the genus level, dominance by a few bacterial groups persisted, albeit with pronounced site-specific variation (Figure 6). Unclassified sequences represented the largest share overall (mean 38.7%), indicating limited taxonomic resolution for many reads. A substantial fraction of ASVs remained unresolved at the genus level. This limitation likely reflects the inherent constraints of 16S rRNA amplicon resolution and the incomplete representation of soil taxa in current reference databases such as SILVA. Therefore, the presence of “Unclassified” taxa should not be interpreted as an absence of ecological relevance, but rather as an indicator of unresolved microbial diversity typical of complex soil environments.
Among classified genera, Streptantibioticus was the most abundant (mean 9.4%), with strong enrichment in ES (18.6%) relative to its near absence in TL (0.22%). By contrast, TL featured higher abundances of Paraconexibacter (0.56% in ES vs. 6.6% in TL), Bailinhaonella (0.84% vs. 3.39%), and Rugosimonospora (0.09% vs. 1.28%). Genera such as Variibacter (4.25% in ES vs. 4.49% in TL), Nitrobacter (2.97% vs. 4.15%), and Candidatus Udaeobacter (4.09% in ES vs. 0.64% in TL) were abundant in both soils, albeit with moderate shifts in relative contribution between sites (Figure S4 and Figure S5).
A subset of genera was essentially restricted to ES, including Faecalibacterium (1.02% in ES, absent in TL) and UC5-1-2E3 (1.01% in ES, absent in TL). In contrast, others, such as Sinosporangium, Thermoleophilum, and Rubrobacter, were detected almost exclusively in TL at lower relative abundances (<0.4% each). The Cleveland dot plot ordered by absolute difference highlights Streptantibioticus, the unclassified fraction, Paraconexibacter, Candidatus Udaeobacter, and Bailinhaonella as the genera exhibiting the largest compositional contrasts between soils (Figure S6). Collectively, these findings indicate that although phylum-level profiles are broadly similar, the soils harbor distinct dominant genera within shared higher-level lineages.
3.2. Alpha and Beta Diversity Analyses
Alpha diversity analysis revealed distinct structural patterns between the two soil microbiomes (Figure 6). The ES sample exhibited substantially higher microbial richness, harboring 1,221 observed ASVs compared to 755 in TL (a 61.7% increase). Consistent with this greater taxonomic richness, evolutionary diversity measured by Faith’s Phylogenetic Diversity (PD) was also higher in ES (56.0 vs. 37.2). Conversely, diversity indices incorporating both richness and evenness displayed an inverse pattern. The TL sample yielded slightly higher Shannon and Simpson indices. Despite its greater absolute richness, the ES microbiome exhibited lower evenness, suggesting dominance by a subset of highly abundant taxa. In contrast, TL, although harboring fewer ASVs overall, displayed higher Shannon and Simpson values, indicating a more even distribution of taxon abundances.
Beta diversity was evaluated to characterize ecological divergence between sites using complementary distance metrics (Figure S7). Taxonomic dissimilarity was high, with a Jaccard distance of 0.915 and a Bray–Curtis dissimilarity of 0.843, indicating limited ASV overlap between ES and TL. Similarly, the unweighted UniFrac distance was elevated (0.768), suggesting that unshared taxa belonged to phylogenetically distinct lineages. In contrast, abundance-weighted phylogenetic dissimilarity (weighted UniFrac) was low (0.067). This pattern is consistent with structured community assembly: while rare or low-abundance taxa were largely distinct and phylogenetically divergent between sites, the dominant lineages remained closely related across microbiomes.
To examine the drivers of beta diversity, a core microbiome analysis was conducted to partition shared and site-specific taxa. Only 8.1% of ASVs (148 features) constituted the core microbiome shared between soils. This limited overlap was consistent with the high Jaccard dissimilarity observed. The majority of ASV richness was site-specific, with ES containing 1,073 unique ASVs (58.7%) and TL harboring 607 unique ASVs (33.2%), reinforcing the higher absolute richness observed in ES.
Although representing a small fraction of total ASV richness, the core microbiome was structured by globally distributed soil lineages. Shared ASVs were predominantly assigned to Pseudomonadota (50 ASVs), Actinomycetota (42 ASVs), Bacillota (20 ASVs), and Acidobacteriota (15 ASVs). The conservation of these major lineages across sites is consistent with the low weighted UniFrac distance and suggests that while the rare biosphere (91.9% of ASVs) was largely site-specific, the dominant phylogenetic framework remained comparable between microbiomes.
3.3. Predicted Functional Profiles of the Soil Microbiomes
To investigate whether the observed taxonomic divergence translated into distinct ecological roles, functional potential was predicted using PICRUSt2. The analysis identified a total of 536 MetaCyc metabolic pathways, 8,404 KEGG Orthologs (KOs), and 2,811 Enzyme Commission (EC) numbers across the dataset.
Despite the high taxonomic dissimilarity driven by the rare biosphere, predicted functional profiles of ES and TL were largely conserved, particularly among the most abundant metabolic pathways (Figure 7).
The top 30 MetaCyc pathways, represent the core predicted functional repertoire, exhibited highly similar relative abundances between sites (Table S2). The functional landscape was dominated by essential housekeeping and biomass degradation processes. Specifically, phytol degradation (PWY66-389) and peptidoglycan maturation (PWY0-1586) were the most abundant predicted pathways in both soils, accounting for approximately 1.45% and 1.48% of the mean relative abundance, respectively (Figure 7 and Table S2). Other highly represented functions included carbon metabolism and energy acquisition (e.g., fatty acid salvage, fatty acid β-oxidation, and the pentose phosphate pathway), as well as amino acid biosynthesis (e.g., L-valine, L-serine, glycine, and L-isoleucine) (Table S2).
Carbon metabolism pathways constituted a substantial portion of the predicted functional profiles and exhibited a combination of conserved and site-specific features (Figure 8A).
Core energy-yielding processes, including glycolysis (variants I-III) and TCA cycle V, were highly abundant and showed close similarity between ES and TL, consistent with baseline functional redundancy. However, alternative carbon pathways displayed differential enrichment. The ES soil showed modest enrichment in glycolysis IV and C4 photosynthetic carbon assimilation pathways. In contrast, TL exhibited greater relative abundance of alternative TCA cycle variants, including TCA cycle IV (2-oxoglutarate decarboxylase), TCA cycle VI, and the partial TCA cycle associated with obligate autotrophs (Figure 8A).
Nitrogen cycling pathways were generally less abundant than carbon metabolism pathways but exhibited clear differences between sites (Figure 8B). Assimilatory nitrate reduction (nitrate reduction VI) was the dominant nitrogen-related pathway in both soils, with higher relative abundance in ES. In contrast, denitrification-associated pathways (nitrate reduction I and VII) were enriched in TL. The ES soil also showed greater relative abundance of the nitrifier denitrification pathway. These patterns indicate distinct predicted nitrogen transformation profiles between microbiomes under their respective environmental conditions (Figure 8B).
To highlight functional differences beyond the shared core metabolism, we examined the top 30 MetaCyc pathways exhibiting the largest absolute differences in relative abundance between microbiomes (Figure 9; Table S3). The ES microbiome exhibited a distinct enrichment profile characterized by complex carbohydrate degradation and nucleotide metabolism (Figure 9A, green bars). Chitin degradation II showed the largest shift toward ES, indicating greater predicted potential for processing this recalcitrant biopolymer. Additionally, pathways associated with purine and adenosine nucleotide metabolism, as well as L-serine and glycine biosynthesis, were more abundant in ES (Figure 9B).
Conversely, the TL microbiome was enriched in alternative energy metabolism and specific degradation pathways (Figure 9A, orange bars). TCA cycle IV (2-oxoglutarate decarboxylase) exhibited the greatest positive difference in TL, alongside higher relative abundances of TCA cycle VI and the glyoxylate cycle. Furthermore, TL showed increased representation of multiple menaquinol biosynthesis variants, key electron carriers in bacterial respiration, as well as pathways involved in aromatic biogenic amine and serotonin degradation.
To complement the pathway-level analysis, we evaluated the most abundant KEGG Orthologs (KOs) across microbiomes (Table S4). Consistent with the overall conservation of core functional potential, the dominant KO profile was composed primarily of genes involved in environmental sensing and nutrient acquisition. The RNA polymerase sigma-70 factor (ECF subfamily, K03088) was the most abundant ortholog (0.44% mean abundance), reflecting shared regulatory capacity related to extracytoplasmic stress responses. Moreover, the top 10 KOs included multiple components of ABC transport systems (e.g., K01990, K01992, K02035), indicating substantial predicted allocation of functional potential toward substrate uptake and transport in both soils (Table S4).
4. Discussion
4.1. Taxonomic Turnover and Rare Biosphere Effects
The comparative analysis of eucalyptus rhizosphere soils from Três Lagoas (TL) and Eldorado do Sul (ES) revealed a consistent ecological pattern: pronounced taxonomic divergence coexisting with substantial predicted functional conservation. Beta diversity metrics demonstrated strong compositional differentiation between sites in both presence–absence and abundance-weighted comparisons, indicating region-specific microbial assemblages. Such compositional turnover across environmental gradients is widely documented in soil systems and is influenced by edaphic properties, including pH, texture, nutrient availability, and organic matter content, which act as environmental filters shaping microbial community assembly [1,14,15]. In forest and plantation ecosystems, variation in soil chemistry and management intensity further modulates microbial assembly processes [18,26].
Core microbiome analysis further supports this pattern. Only 8.1% of ASVs were shared between sites, reflecting high site-specific richness. However, these shared taxa belonged predominantly to major, globally distributed soil phyla, including Pseudomonadota, Actinomycetota, Bacillota, and Acidobacteriota. These lineages consistently dominate terrestrial and rhizospheric environments worldwide [1,14,15] and form the structural backbone of soil bacterial communities [50,51].
The compositional divergence observed between sites was largely associated with low-abundance taxa, consistent with the disproportionate contribution of rare lineages to overall phylogenetic diversity [21]. The predominance of site-specific rare taxa underscores the ecological relevance of the rare biosphere, which contributes substantially to total richness and beta diversity but may exert limited influence on dominant metabolic functions [20]. Rare taxa may serve as a reservoir of genetic and metabolic potential, potentially becoming functionally relevant under environmental perturbations [20]. The decoupling between taxonomic richness and abundance-weighted functional similarity observed here is consistent with this ecological framework [16].
4.2. Functional Redundancy and Metabolic Backbone Stability
In contrast to the pronounced taxonomic turnover, the low weighted UniFrac distance observed between regions suggests that dominant bacterial lineages remain phylogenetically related despite compositional shifts. Phylogenetic clustering of abundant taxa may reflect conservation of broad ecological strategies and functional capabilities within major clades [13,52]. This apparent paradox is consistent with the framework of functional redundancy, whereby phylogenetically related taxa maintain overlapping metabolic functions, potentially buffering ecosystem processes against compositional change [16,17].
This interpretation aligns with the mass-ratio hypothesis, which posits that ecosystem processes are primarily driven by the traits of the most abundant taxa [53], even when rare lineages contribute disproportionately to diversity patterns [20]. Such dominance-driven functional structuring has been described as a characteristic feature of resilient microbial ecosystems [54].
Functionally, both soils were characterized by high relative abundances of central carbon metabolism pathways, amino acid biosynthesis, fatty acid turnover, and regulatory and transport systems. Core pathways such as glycolysis and the tricarboxylic acid (TCA) cycle constitute the metabolic backbone sustaining soil ecosystem functioning [13,14]. The prevalence of ABC transporters and sigma-70 transcriptional regulators further supports shared strategies of substrate acquisition and environmental sensing in rhizosphere environments [5,55]. Collectively, these findings suggest that the foundational metabolic architecture predicted for eucalyptus rhizosphere remains broadly conserved across contrasting environmental contexts.
4.3. Ecological Filtering and Regional Metabolic Specialization
These findings align with community assembly theory. Microbial communities are structured by the interplay of deterministic processes (environmental filtering, niche-based selection) and stochastic processes (dispersal limitation, ecological drift) [56,57,58,59]. In soil ecosystems, edaphic properties such as pH, nutrient availability, texture, and electrical conductivity function as environmental filters [14,15]. The contrasting clay content and micronutrient profiles observed between ES and TL may have contributed to the pronounced taxonomic divergence. Additionally, the two sites were cultivated with distinct Eucalyptus species, which may also contribute to rhizosphere differentiation through host-specific microbial recruitment. However, given the comparative design and absence of replicated environmental gradients, causal attribution cannot be inferred.
Despite overall conservation of the metabolic backbone, regional differences in predicted functional potential were evident. The ES microbiome displayed greater predicted representation of chitin degradation, purine turnover, and nitrifier denitrification pathways. Chitin degradation is commonly associated with fungal biomass turnover and bacterial-fungal interactions in soil [9,14]. Variation in predicted nitrogen transformation routes may influence nitrogen retention efficiency and gaseous losses [23,24]. These region-specific enrichments are consistent with context-dependent ecological filtering shaping metabolic specialization.
Conversely, the TL microbiome showed higher relative abundance of alternative TCA cycle variants, glyoxylate cycle pathways, menaquinol biosynthesis, and aromatic compound degradation. The glyoxylate shunt is known to enhance carbon-use efficiency under nutrient and stress conditions by bypassing CO₂-releasing steps of the TCA cycle [60,61]. Enrichment of aromatic compound degradation pathways may reflect adaptation to complex plant-derived metabolites typical of eucalyptus litter inputs [5].
4.4. Implications for Management
Importantly, the detection of genera traditionally associated with plant growth promotion, such as Bradyrhizobium, Streptomyces, and Bacillus [7,8,9], did not correspond to disproportionate enrichment of specific functional pathways at the community level. As emphasized in rhizosphere ecology, taxonomic presence alone does not guarantee ecological service delivery [5,24]. Functional expression depends on abundance, activation state, and competitive interactions within the microbiome [16,17].
From a management perspective, the coexistence of functional redundancy and regional specialization suggests both resilience and context dependency. The conserved metabolic backbone is consistent with intrinsic stability of eucalyptus rhizosphere microbiomes across agroecological zones. However, divergence in nitrogen and carbon utilization strategies suggests that microbial interventions may benefit from regional customization. Bioinoculant consortia [11,12] may be more effective when aligned with local environmental filters and existing metabolic frameworks, consistent with emerging principles of rhizosphere engineering [24,55].
4.5. Limitations and Future Directions
This study has several limitations. The analysis was restricted to two sites and a single sampling time point, limiting statistical generalization and temporal inference [58]. Importantly, the comparison involved distinct Eucalyptus species (Eucalyptus saligna in ES and a E. grandis × E. urophylla in TL), precluding separation of host plant effects from regional environmental influences. Functional potential was inferred using PICRUSt2, which predicts gene content based on phylogenetic proximity and reflects metabolic potential rather than realized activity [27]. While predictive approaches are widely used, they do not substitute for metagenomic, metatranscriptomic, or metabolomic validation [16].
Although soil physicochemical differences were documented, the absence of integrated longitudinal edaphic and climatic measurements precludes robust causal inference [14,15]. Consequently, the patterns described here should be interpreted as comparative and exploratory rather than mechanistic.
Future studies integrating replicated environmental gradients, common-garden experimental designs controlling for host genotype, longitudinal sampling, and multi-omics approaches will be necessary to disentangle realized functional activity from predicted metabolic potential and to quantify ecosystem-level process rates [16,23].
5. Conclusions
This comparative analysis of eucalyptus rhizosphere soils from two contrasting Brazilian regions reveals a consistent structural pattern in soil microbiome organization: pronounced taxonomic turnover, largely driven by rare and site-specific taxa, coexisting with a relatively conserved predicted functional framework supported by dominant, phylogenetically related lineages. The coexistence of compositional divergence and functional stability suggests that rhizosphere microbial communities in commercial eucalyptus systems may sustain ecosystem-level metabolic resilience by conserving core functional guilds, even under distinct environmental filters.
At the same time, region-specific enrichments in carbon and nitrogen transformation pathways indicate that metabolic specialization can emerge within this conserved backbone, reflecting context-dependent ecological filtering. Collectively, these findings advance ecological understanding of how microbial communities balance redundancy and specialization in managed forest systems. From an applied perspective, the identification of conserved metabolic functions alongside region-specific adaptations provides a conceptual basis for microbiome-informed management strategies tailored to local agroecological contexts.
Future research integrating environmental metadata, longitudinal sampling, controlled host comparisons, and multi-omics approaches will be necessary to move from predictive functional inference toward mechanistic understanding of microbial contributions to nutrient cycling and plantation productivity.
Supplementary Materials
The following supporting information can be downloaded at the website of this paper posted on Preprints.org, Figure S1. Rarefaction curves for the analyzed soil samples. Figure S2. Relative abundance of dominant bacterial phyla in soil samples ES and TL. Figure S3. Mean relative abundance of dominant bacterial families (top 20) in soil samples ES and TL. Figure S4. Mean relative abundance of dominant bacterial genera (top 20) in soil samples ES and TL. Figure S5. Genus-level composition of soil bacterial communities (top 20 genera). Figure S6. Genus-level differences between soils. Figure S7. Beta diversity distances between the ES and TL soil microbiomes. Table S1. Summary of sequencing output and DADA2 quality filtering for soil samples ES (Eldorado do Sul) and TL (Três Lagoas). Table S2. Top 30 predicted MetaCyc metabolic pathways in ES and TL soil microbiomes. Table S3. Top 30 MetaCyc pathways with the largest abundance contrasts between ES and TL microbiomes. Table S4. Top 30 KEGG Orthologs (KOs) ranked by relative abundance in the ES and TL soil microbiomes.
Author Contributions
Conceptualization: P.R.D.C., U.J.B.S., F.S.C., and R.L.F.; Methodology: P.R.D.C., U.J.B.S., and F.S.C.; Software and Formal Analysis: P.R.D.C., U.J.B.S., and F.S.C.; Investigation: P.R.D.C., U.J.B.S., and F.S.C.; Data Curation: P.R.D.C., U.J.B.S., and F.S.C.; Visualization: P.R.D.C., U.J.B.S., and F.S.C.; Writing—Original Draft Preparation: P.R.D.C., U.J.B.S., and F.S.C.; Writing—Review and Editing: P.R.D.C., U.J.B.S., T.G.Z., N.B.J., E.E.G., F.S.C., and R.L.F.; Supervision: T.G.Z., N.B.J., E.E.G., F.S.C. and R.L.F.; Project Administration: T.G.Z., N.B.J., E.E.G., F.S.C. and R.L.F.; Funding Acquisition: T.G.Z., N.B.J., E.E.G., F.S.C. and R.L.F. All authors have read and agreed to the published version of the manuscript.
Funding
This research was funded by the Suzano S.A.
Institutional Review Board Statement
Not applicable.
Informed Consent Statement
Not applicable.
Data Availability Statement
All data generated or analyzed during this study are included in this article and its Supplementary Materials.
Acknowledgments
The authors gratefully acknowledge Suzano S.A. for the financial support of the experimental phase of this study and for the postdoctoral fellowship granted to P.R.D. The authors also acknowledge the support provided by CMPC do Brasil. F.S.C. is a CNPq Research Fellow (process number 304358/2024-0). In addition, F.S.C. acknowledges support from the Fulbright Program as a Visiting Scholar at Cornell University (Ithaca, NY, USA). U.J.B.d.S. was awarded a post-doctoral scholarship (DCR) from the National Council for Scientific and Technological Development (CNPq) and the Research Support Foundation of the State of Goiás (FAPEG).:
Conflicts of Interest
The authors declare no conflicts of interest.
Abbreviations
The following abbreviations are used in this manuscript:
| ASV | Amplicon Sequence Variant |
| BR | Broad Range |
| C4 | C4 Photosynthetic Carbon Assimilation Cycle |
| DNA | Deoxyribonucleic Acid |
| EC | Enzyme Commission |
| ES | Eldorado do Sul |
| FASTQ | Sequencing Read File Format |
| KEGG | Kyoto Encyclopedia of Genes and Genomes |
| KO | KEGG Ortholog |
| MAFFT | Multiple Alignment using Fast Fourier Transform |
| MetaCyc | Metabolic Pathway Database |
| MiSeq | Illumina MiSeq Sequencing Platform |
| OTU | Operational Taxonomic Unit |
| PCR | Polymerase Chain Reaction |
| PD | Phylogenetic Diversity |
| PGPB | Plant Growth-Promoting Bacteria |
| PICRUSt2 | Phylogenetic Investigation of Communities by Reconstruction of Unobserved States 2 |
| QIIME 2 | Quantitative Insights Into Microbial Ecology 2 |
| rRNA | Ribosomal Ribonucleic Acid |
| SILVA | Ribosomal RNA Database Project |
| TCA | Tricarboxylic Acid Cycle |
| TL | Três Lagoas |
| UniFrac | Unique Fraction (Phylogenetic Distance Metric) |
References
- Naylor, D.; McClure, R.; Jansson, J. Trends in Microbial Community Composition and Function by Soil Depth. Microorganisms 2022, 10, 540. [CrossRef]
- van der Heijden, M.G.; Bardgett, R.D.; van Straalen, N.M. The unseen majority: soil microbes as drivers of plant diversity and productivity in terrestrial ecosystems. Ecol Lett. 2008, 11, 296-310. [CrossRef]
- Qiao, X.; Yan, X.; Dong, C.; Tao, L.; Aili, A.; Waheed, A. From microbiome collapse to recovery: A roadmap for microbiome-informed grassland restoration under global change. Front. Microbiol. 2026, 17, 1741287. [CrossRef]
- Berendsen, R.L.; Pieterse, C.M.J.; Bakker, P.A.H.M. The rhizosphere microbiome and plant health. Trends Plant Sci. 2012, 17, 478–486. [CrossRef]
- Mendes, R.; Garbeva, P.; Raaijmakers, J.M. The rhizosphere microbiome: significance of plant beneficial, plant pathogenic, and human pathogenic microorganisms. FEMS Microbiol. Rev. 2013, 37, 634–663. [CrossRef]
- Eck, J.L.; Stump, S.M.; Delavaux, C.S.; Mangan, S.A.; Comita, L.S. Evidence of within-species specialization by soil microbes and the implications for plant community diversity. Proc. Natl. Acad. Sci. USA 2019, 116, 7371–7376. [CrossRef]
- Ambrosini, A.; Passaglia, L.M.P. Plant growth-promoting bacteria (PGPB): Isolation and screening of PGP activities. Curr. Protoc. Plant Biol. 2017, 2, 190–209. [CrossRef]
- Ercole, T.G.; Bonotto, D.R.; Hungria, M.; Kava, V.M.; Galli, L.V. The role of endophytic bacteria in enhancing plant growth and health for sustainable agriculture. Antonie Van Leeuwenhoek 2025, 118, 88. [CrossRef]
- Souza, R.; Ambrosini, A.; Passaglia, L.M.P. Plant growth-promoting bacteria as inoculants in agricultural soils. Genet. Mol. Biol. 2015, 38, 401–419. [CrossRef]
- Phour, M.; Sindhu, S.S. Mitigating Abiotic Stress: Microbiome Engineering for Improving Agricultural Production and Environmental Sustainability. Planta 2022, 256, 85. [CrossRef]
- Li, M.; Wang, J.; Yao, T.; Wang, Z.; Zhang, H.; Li, C. Isolation and Characterization of Cold-Adapted PGPB and Their Effect on Plant Growth Promotion. J. Microbiol. Biotechnol. 2021, 31, 1218–1230. [CrossRef]
- Wang, Q.; Zhou, Q.; Huang, L.; Xu, S.; Fu, Y.; Hou, D.; Feng, Y.; Yang, X. Cadmium Phytoextraction through Brassica juncea L. under Different Consortia of Plant Growth-Promoting Bacteria from Different Ecological Niches. Ecotoxicol. Environ. Saf. 2022, 237, 113541. [CrossRef]
- Escalas, A.; Hale, L.; Voordeckers, J.W.; Yang, Y.; Firestone, M.K.; Alvarez-Cohen, L.; Zhou, J. Microbial functional diversity: From concepts to applications. Ecol. Evol. 2019, 9, 12000–12016. [CrossRef]
- Delgado-Baquerizo, M.; Oliverio, A.M.; Brewer, T.E.; Benavent-González, A.; Eldridge, D.J.; Bardgett, R.D.; Maestre, F.T.; Singh, B.K.; Fierer, N. A global atlas of the dominant bacteria found in soil. Science 2018, 359, 320–325. [CrossRef]
- Fierer, N.; Jackson, R.B. The diversity and biogeography of soil bacterial communities. Proc. Natl. Acad. Sci. USA 2006, 103, 626–631. [CrossRef]
- Louca, S.; Polz, M.F.; Mazel, F.; Albright, M.B.N.; Huber, J.A.; O’Connor, M.I.; Ackermann, M.; Hahn, A.S.; Srivastava, D.S.; Crowe, S.A.; Doebeli, M.; Parfrey, L.W. Function and functional redundancy in microbial systems. Nat. Ecol. Evol. 2018, 2, 936–943. [CrossRef]
- Allison, S.D.; Martiny, J.B.H. Colloquium paper: Resistance, resilience, and redundancy in microbial communities. Proc. Natl. Acad. Sci. USA 2008, 105, 11512–11519. [CrossRef]
- Chen, X.; Xiang, M.; Yao, L.; Ai, X.; Zhu, J.; Guo, Q.; Zhang, K.; Zhang, Q. Functional trait identity regulates productivity better than tree diversity and structural complexity in subtropical mixed-species forests. PLoS ONE 2025, 20, e0324541. [CrossRef]
- Williams, P.T.; Thomas, V.A.; Wynne, R.H.; Huemmrich, K.F.; Harding, D.J.; Ranson, K.J.; Campbell, P.K.; Middleton, E.M. Characterizing the influence of varying functional traits from remotely sensed data on forest productivity acquired from selected NEON sites. Sci. Remote Sens. 2025, 12, 100262. [CrossRef]
- Jousset, A.; Bienhold, C.; Chatzinotas, A.; Gallien, L.; Gobet, A.; Kurm, V.; Küsel, K.; Rillig, M.C.; Rivett, D.W.; Salles, J.F.; van der Heijden, M.G.; Youssef, N.H.; Zhang, X.; Wei, Z.; Hol, W.H. Where less may be more: How the rare biosphere pulls ecosystem strings. ISME J. 2017, 11, 853–862. [CrossRef]
- Sogin, M.L.; Morrison, H.G.; Huber, J.A.; Mark Welch, D.; Huse, S.M.; Neal, P.R.; Arrieta, J.M.; Herndl, G.J. Microbial diversity in the deep sea and the underexplored “rare biosphere”. Proc. Natl. Acad. Sci. USA 2006, 103, 12115–12120. [CrossRef]
- Zhang, Z.; Lu, Y.; Wei, G.; Jiao, S. Rare species-driven diversity–ecosystem multifunctionality relationships are promoted by stochastic community assembly. mBio 2022, 13, e00449-22. [CrossRef]
- Kuypers, M.M.M.; Marchant, H.K.; Kartal, B. The microbial nitrogen-cycling network. Nat. Rev. Microbiol. 2018, 16, 263–276. [CrossRef]
- Philippot, L.; Raaijmakers, J.M.; Lemanceau, P.; van der Putten, W.H. Going back to the roots: The microbial ecology of the rhizosphere. Nat. Rev. Microbiol. 2013, 11, 789–799. [CrossRef]
- Islam, M.S.; Ahmed, S.; Miah, M.M.U.; Mahiddin, N.A.; Al Bakky, A.; Ismail, Z.; Sahlabji, T.; Idris, A.M. Assessing the impact of eucalyptus trees on soil chemical properties in rice fields. Sci. Rep. 2025, 15, 16262. [CrossRef]
- Qu, Z.-L.; Liu, B.; Zhang, Y.-M.; Huang, L.; Ming, A.-G.; Sun, H. Impacts of near-natural management in eucalyptus plantations on soil bacterial community assembly and function related to nitrogen cycling. Funct. Ecol. 2022, 36, 1912–1923. [CrossRef]
- Douglas, G.M.; Maffei, V.J.; Zaneveld, J.R.; Yurgel, S.N.; Brown, J.R.; Taylor, C.M.; Huttenhower, C.; Langille, M.G.I. PICRUSt2 for prediction of metagenome functions. Nat. Biotechnol. 2020, 38, 685–688. [CrossRef]
- Schroth, G.; Sinclair, F.L. (Eds.) Trees, Crops and Soil Fertility: Concepts and Research Methods; CABI Publishing: Wallingford, UK, 2003.
- Delavaux, C.S.; Bever, J.D.; Karppinen, E.M.; Bainard, L.D. Keeping It Cool: Soil Sample Cold Pack Storage and DNA Shipment up to 1 Month Does Not Impact Metabarcoding Results. Ecol. Evol. 2020, 10, 4652–4664. [CrossRef]
- Klindworth, A.; Pruesse, E.; Schweer, T.; Peplies, J.; Quast, C.; Horn, M.; Glöckner, F.O. Evaluation of general 16S ribosomal RNA gene PCR primers for classical and next-generation sequencing-based diversity studies. Nucleic Acids Res. 2013, 41, e1. [CrossRef]
- Illumina, Inc. 16S Metagenomic Sequencing Library Preparation: Preparing 16S Ribosomal RNA Gene Amplicons for the Illumina MiSeq System; Part No. 15044223 Rev. B; Illumina, Inc.: San Diego, CA, USA, 2013. Available online: https://support.illumina.com/documents/documentation/chemistry_documentation/16s/16s-metagenomic-library-prep-guide-15044223-b.pdf (accessed on 10 October 2022).
- Callahan, B.J.; McMurdie, P.J.; Rosen, M.J.; Han, A.W.; Johnson, A.J.; Holmes, S.P. DADA2: High-resolution sample inference from Illumina amplicon data. Nat. Methods 2016, 13, 581–583. [CrossRef]
- Bolyen, E.; Rideout, J.R.; Dillon, M.R.; Bokulich, N.A.; Abnet, C.C.; Al-Ghalith, G.A.; et al. Reproducible, interactive, scalable and extensible microbiome data science using QIIME 2. Nat. Biotechnol. 2019, 37, 852–857. [CrossRef]
- Martin, M. Cutadapt removes adapter sequences from high-throughput sequencing reads. EMBnet.journal 2011, 17, 10–12. [CrossRef]
- Quast, C.; Pruesse, E.; Yilmaz, P.; Gerken, J.; Schweer, T.; Yarza, P.; Peplies, J.; Glöckner, F.O. The SILVA ribosomal RNA gene database project: Improved data processing and web-based tools. Nucleic Acids Res. 2013, 41, D590–D596. [CrossRef]
- Yilmaz, P.; Parfrey, L.W.; Yarza, P.; Gerken, J.; Pruesse, E.; Quast, C.; Schweer, T.; Peplies, J.; Ludwig, W.; Glöckner, F.O. The SILVA and “All-species Living Tree Project (LTP)” taxonomic frameworks. Nucleic Acids Res. 2014, 42, D643–D648. [CrossRef]
- Pedregosa, F.; Varoquaux, G.; Gramfort, A.; Michel, V.; Thirion, B.; Grisel, O.; Blondel, M.; Prettenhofer, P.; Weiss, R.; Dubourg, V.; VanderPlas, J.; Passos, A.; Cournapeau, D.; Brucher, M.; Perrot, M.; Duchesnay, É. Scikit-learn: Machine learning in Python. J. Mach. Learn. Res. 2011, 12, 2825–2830.
- R Core Team. R: A language and environment for statistical computing; R Foundation for Statistical Computing: Vienna, Austria, 2022. Available online: https://www.R-project.org/ (accessed on 21 February 2026).
- McMurdie, P.J.; Holmes, S. phyloseq: An R package for reproducible interactive analysis and graphics of microbiome census data. PLoS ONE 2013, 8, e61217. [CrossRef]
- Wickham, H. ggplot2: Elegant Graphics for Data Analysis; Springer: New York, NY, USA, 2009; [CrossRef]
- Katoh, K.; Standley, D.M. MAFFT multiple sequence alignment software version 7: Improvements in performance and usability. Mol. Biol. Evol. 2013, 30, 772–780. [CrossRef]
- Price, M.N.; Dehal, P.S.; Arkin, A.P. FastTree 2—approximately maximum-likelihood trees for large alignments. PLoS ONE 2010, 5, e9490. [CrossRef]
- Kembel, S.W.; Cowan, P.D.; Helmus, M.R.; Cornwell, W.K.; Morlon, H.; Ackerly, D.D.; Blomberg, S.P.; Webb, C.O. Picante: R tools for integrating phylogenies and ecology. Bioinformatics 2010, 26, 1463–1464. [CrossRef]
- Lozupone, C.; Knight, R. UniFrac: A new phylogenetic method for comparing microbial communities. Appl. Environ. Microbiol. 2005, 71, 8228–8235. [CrossRef]
- Lozupone, C.A.; Hamady, M.; Kelley, S.T.; Knight, R. Quantitative and qualitative beta diversity measures lead to different insights into factors that structure microbial communities. Appl. Environ. Microbiol. 2007, 73, 1576–1585. [CrossRef]
- Wickham, H.; Averick, M.; Bryan, J.; Chang, W.; McGowan, L.D.; François, R.; Grolemund, G.; Hayes, A.; Henry, L.; Hester, J.; Kuhn, M.; Pedersen, T.L.; Miller, E.; Bache, S.M.; Müller, K.; Ooms, J.; Robinson, D.; Seidel, D.P.; Spinu, V.; Takahashi, K.; Vaughan, D.; Wilke, C.; Woo, K.; Yutani, H. Welcome to the tidyverse. J. Open Source Softw. 2019, 4, 1686. [CrossRef]
- Kanehisa, M.; Goto, S. KEGG: Kyoto encyclopedia of genes and genomes. Nucleic Acids Res. 2000, 28, 27–30. [CrossRef]
- Caspi, R.; Billington, R.; Keseler, I.M.; Kothari, A.; Krummenacker, M.; Midford, P.E.; Ong, W.K.; Paley, S.; Subhraveti, P.; Karp, P.D. The MetaCyc database of metabolic pathways and enzymes—A 2019 update. Nucleic Acids Res. 2020, 48, D445–D453. [CrossRef]
- Kolde, R. pheatmap: Pretty heatmaps. R Package Version 1.0.12; The R Foundation for Statistical Computing: Vienna, Austria, 2019. Available online: https://CRAN.R-project.org/package=pheatmap (accessed on 21 February 2026).
- Shade, A.; Handelsman, J. Beyond the Venn diagram: The hunt for a core microbiome. Environ. Microbiol. 2012, 14, 4–12. [CrossRef]
- Toju, H.; Peay, K.G.; Yamamichi, M.; Narisawa, K.; Hiruma, K.; Naito, K.; Fukuda, S.; Ushio, M.; Nakaoka, S.; Onoda, Y.; et al. Core microbiomes for sustainable agroecosystems. Nat. Plants 2018, 4, 247–257. [CrossRef]
- Webb, C.O.; Ackerly, D.D.; McPeek, M.A.; Donoghue, M.J. Phylogenies and community ecology. Annu. Rev. Ecol. Evol. Syst. 2002, 33, 475–505. [CrossRef]
- Grime, J.P. Benefits of plant diversity to ecosystems: Immediate, filter and founder effects. J. Ecol. 1998, 86, 902–910. [CrossRef]
- Griffiths, B.S.; Philippot, L. Insights into the resistance and resilience of the soil microbial community. FEMS Microbiol. Rev. 2013, 37, 112–129. [CrossRef]
- Venturi, V.; Keel, C. Signaling in the rhizosphere. Trends Plant Sci. 2016, 21, 187–198. [CrossRef]
- Nemergut, D.R.; Schmidt, S.K.; Fukami, T.; O'Neill, S.P.; Bilinski, T.M.; Stanish, L.F.; Knelman, J.E.; Darcy, J.L.; Lynch, R.C.; Wickey, P.; Ferrenberg, S. Patterns and processes of microbial community assembly. Microbiol. Mol. Biol. Rev. 2013, 77, 342–356. [CrossRef]
- Stegen, J.C.; Lin, X.; Konopka, A.E.; Fredrickson, J.K. Stochastic and deterministic assembly processes in subsurface microbial communities. ISME J. 2012, 6, 1653–1664. [CrossRef]
- Vellend, M. Conceptual synthesis in community ecology. Q. Rev. Biol. 2010, 85, 183–206. [CrossRef]
- Zhou, J.; Ning, D. Stochastic community assembly: Does it matter in microbial ecology? Microbiol. Mol. Biol. Rev. 2017, 81, e00002-17. [CrossRef]
- Dolan, S.K.; Welch, M. The glyoxylate shunt, 60 years on. Annu. Rev. Microbiol. 2018, 72, 309–330. [CrossRef]
- Kornberg, H.L. The role and control of the glyoxylate cycle in Escherichia coli. Biochem. J. 1966, 99, 1–11. [CrossRef]
Figure 1.
Top 10 dominant bacterial phyla across soil samples. Horizontal bars represent the mean relative abundance (%) of each phylum across both samples, ordered from most to least abundant.
Figure 1.
Top 10 dominant bacterial phyla across soil samples. Horizontal bars represent the mean relative abundance (%) of each phylum across both samples, ordered from most to least abundant.
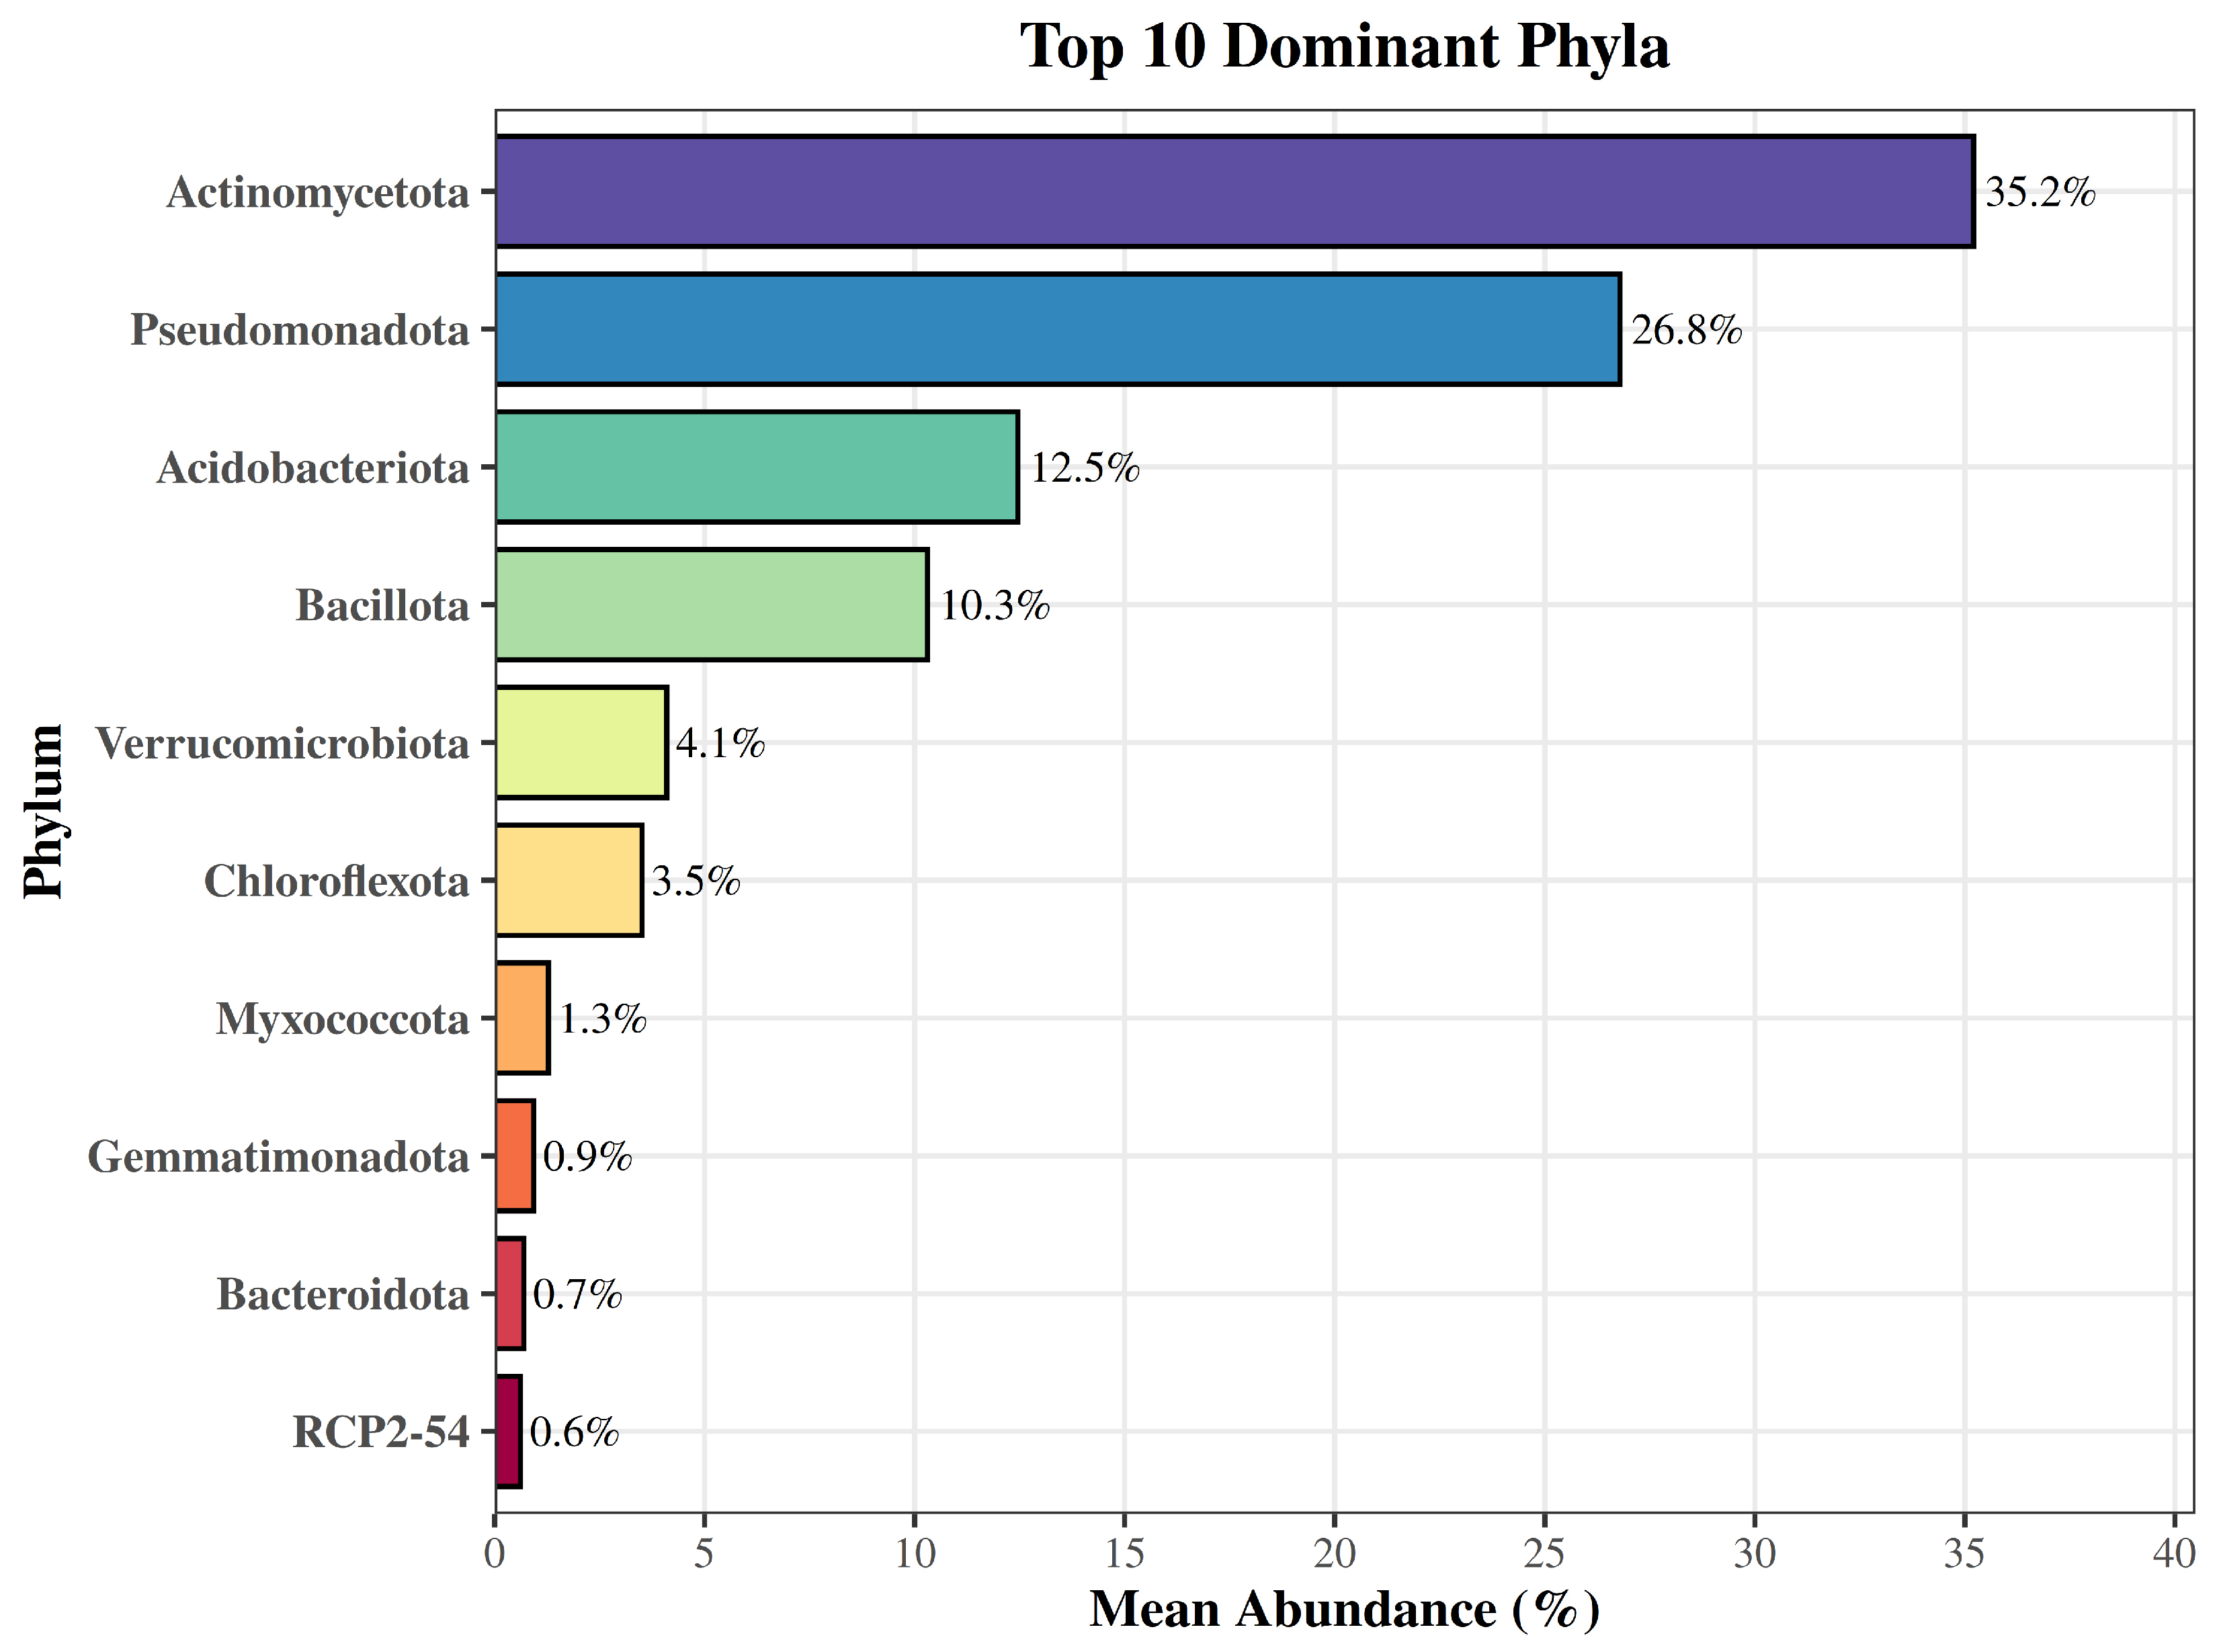
Figure 2.
Taxonomic composition of soil bacterial communities at the phylum level. Stacked bar plots depict the relative abundance (%) of the top 10 phyla in samples ES and TL; less abundant taxa are grouped as “Others”, and sequences without confident assignment are labelled as “Unclassified”.
Figure 2.
Taxonomic composition of soil bacterial communities at the phylum level. Stacked bar plots depict the relative abundance (%) of the top 10 phyla in samples ES and TL; less abundant taxa are grouped as “Others”, and sequences without confident assignment are labelled as “Unclassified”.
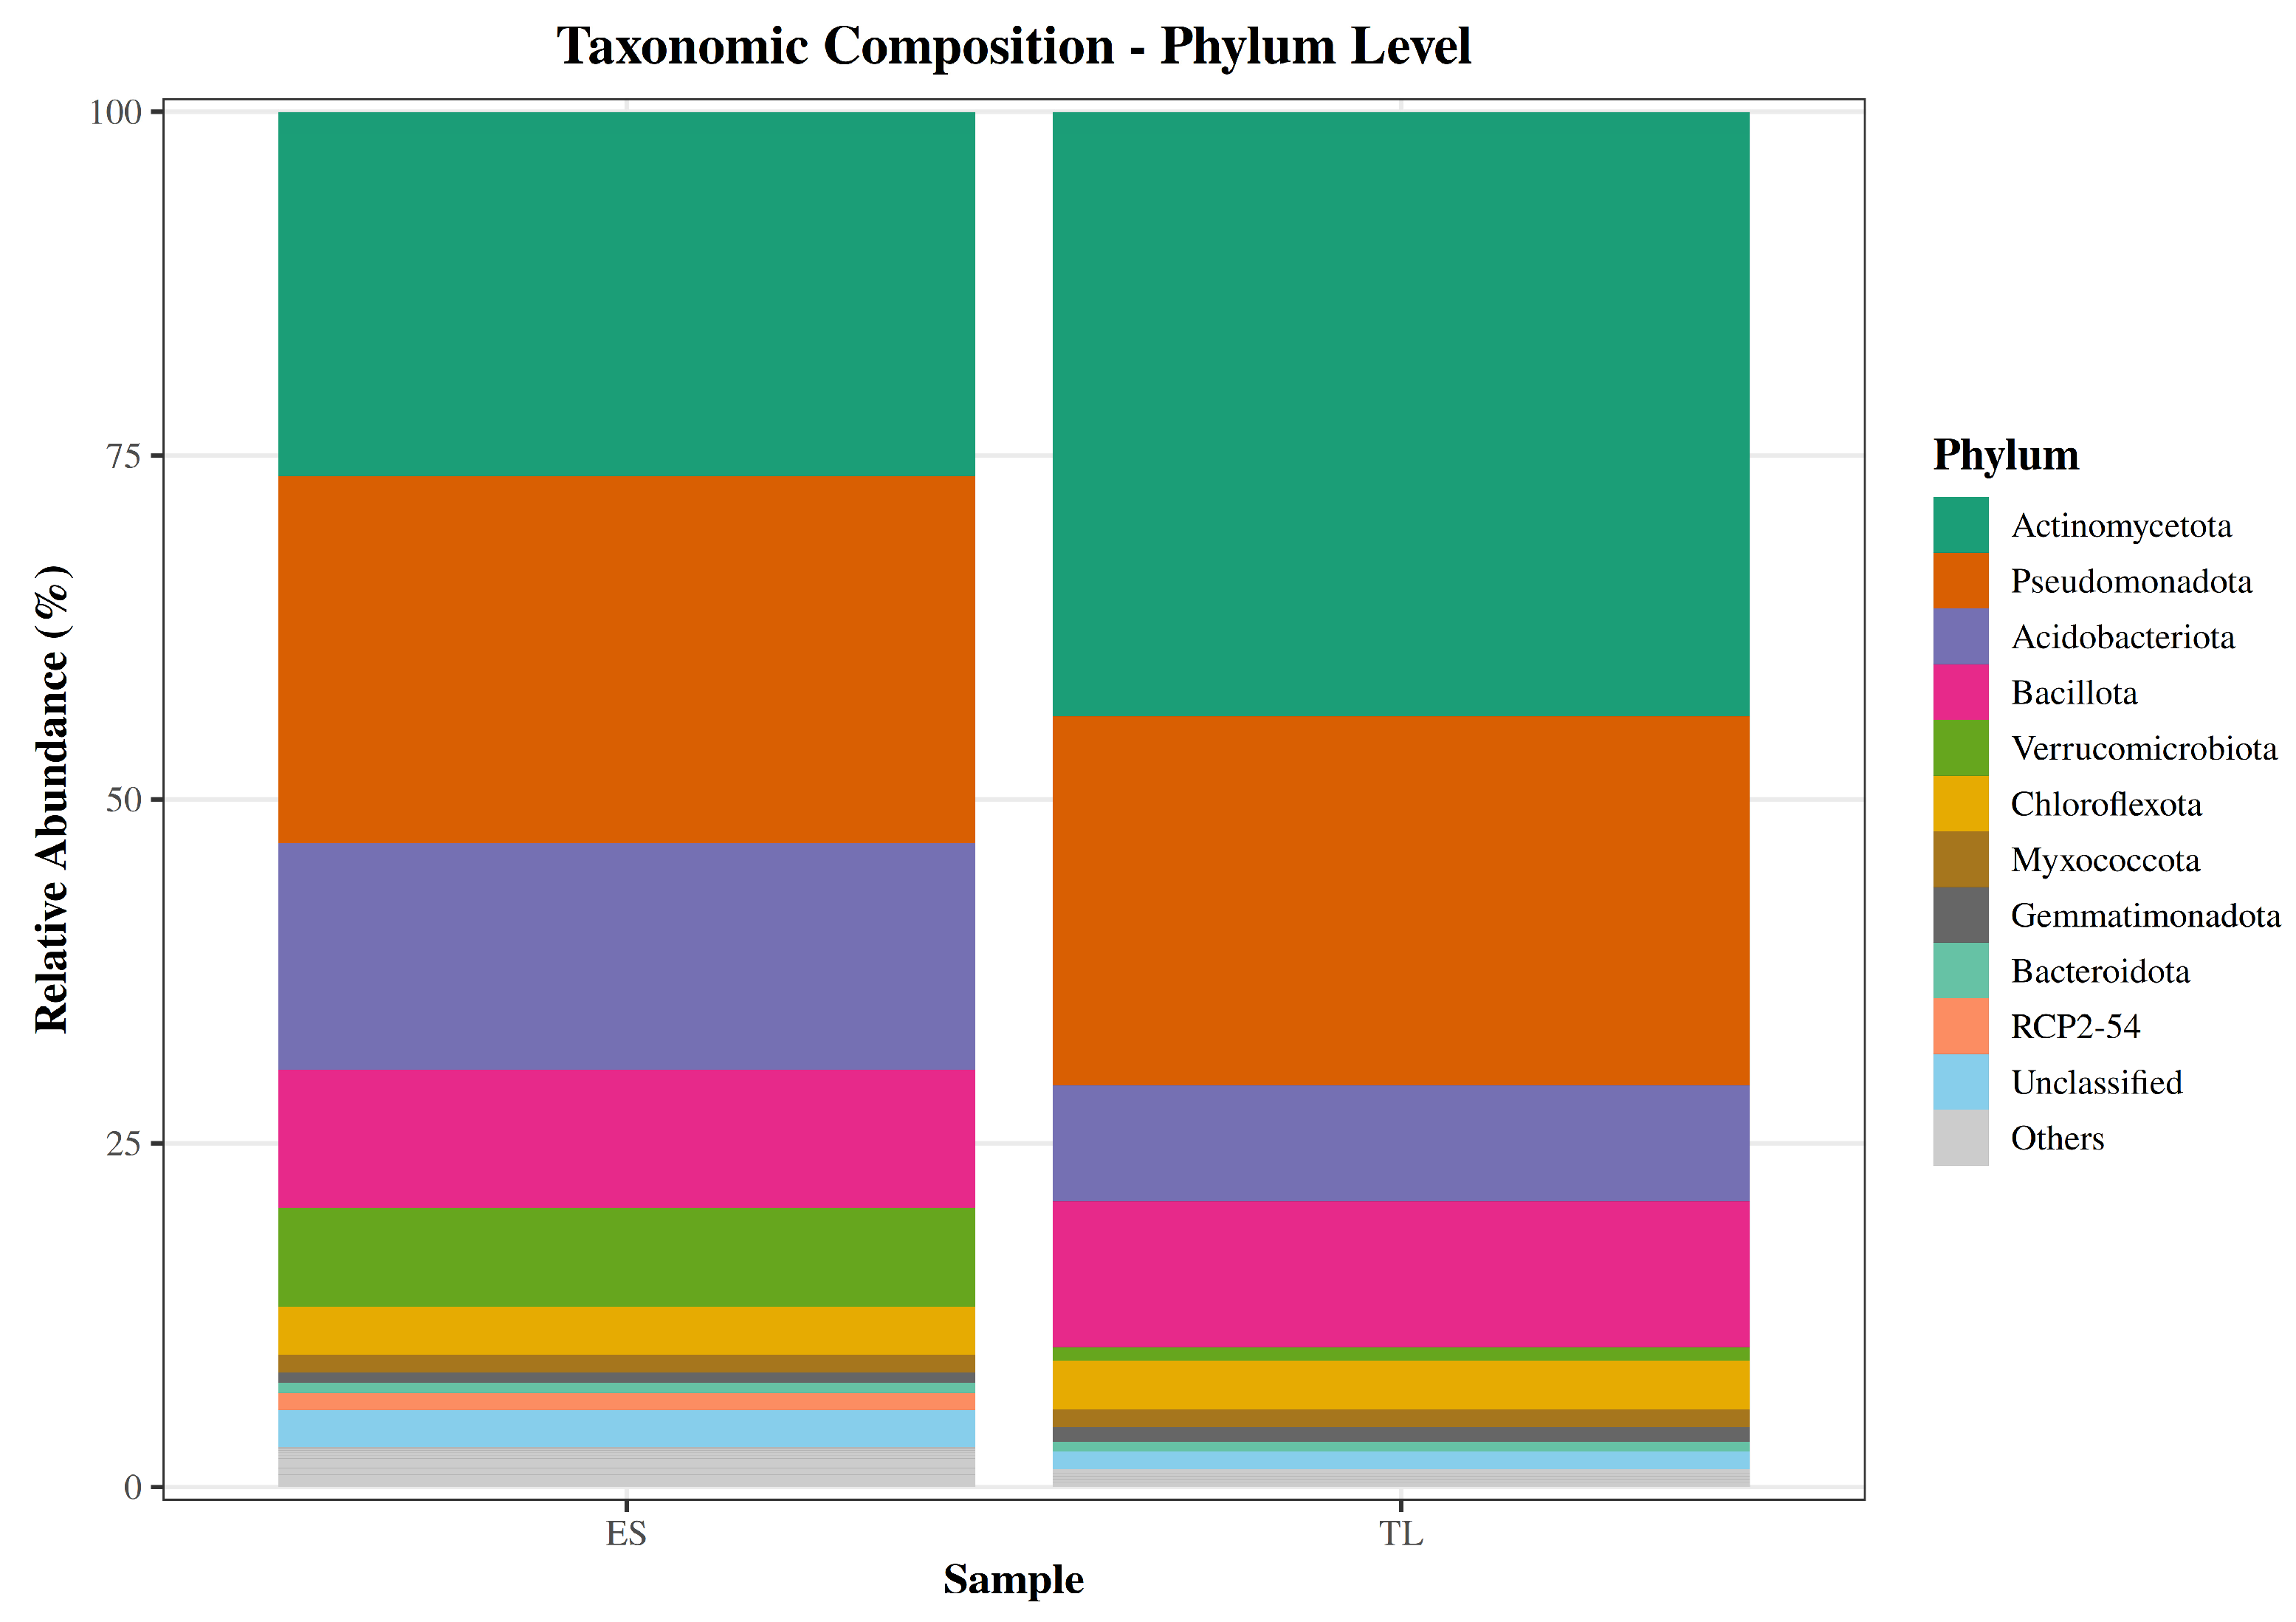
Figure 3.
Phylum-level abundance comparison between soil samples ordered by difference. Cleveland-style dot plot showing the relative abundance (%) of each phylum in ES and TL. Phyla are ordered by absolute difference between samples, with connecting lines illustrating the magnitude of compositional shifts.
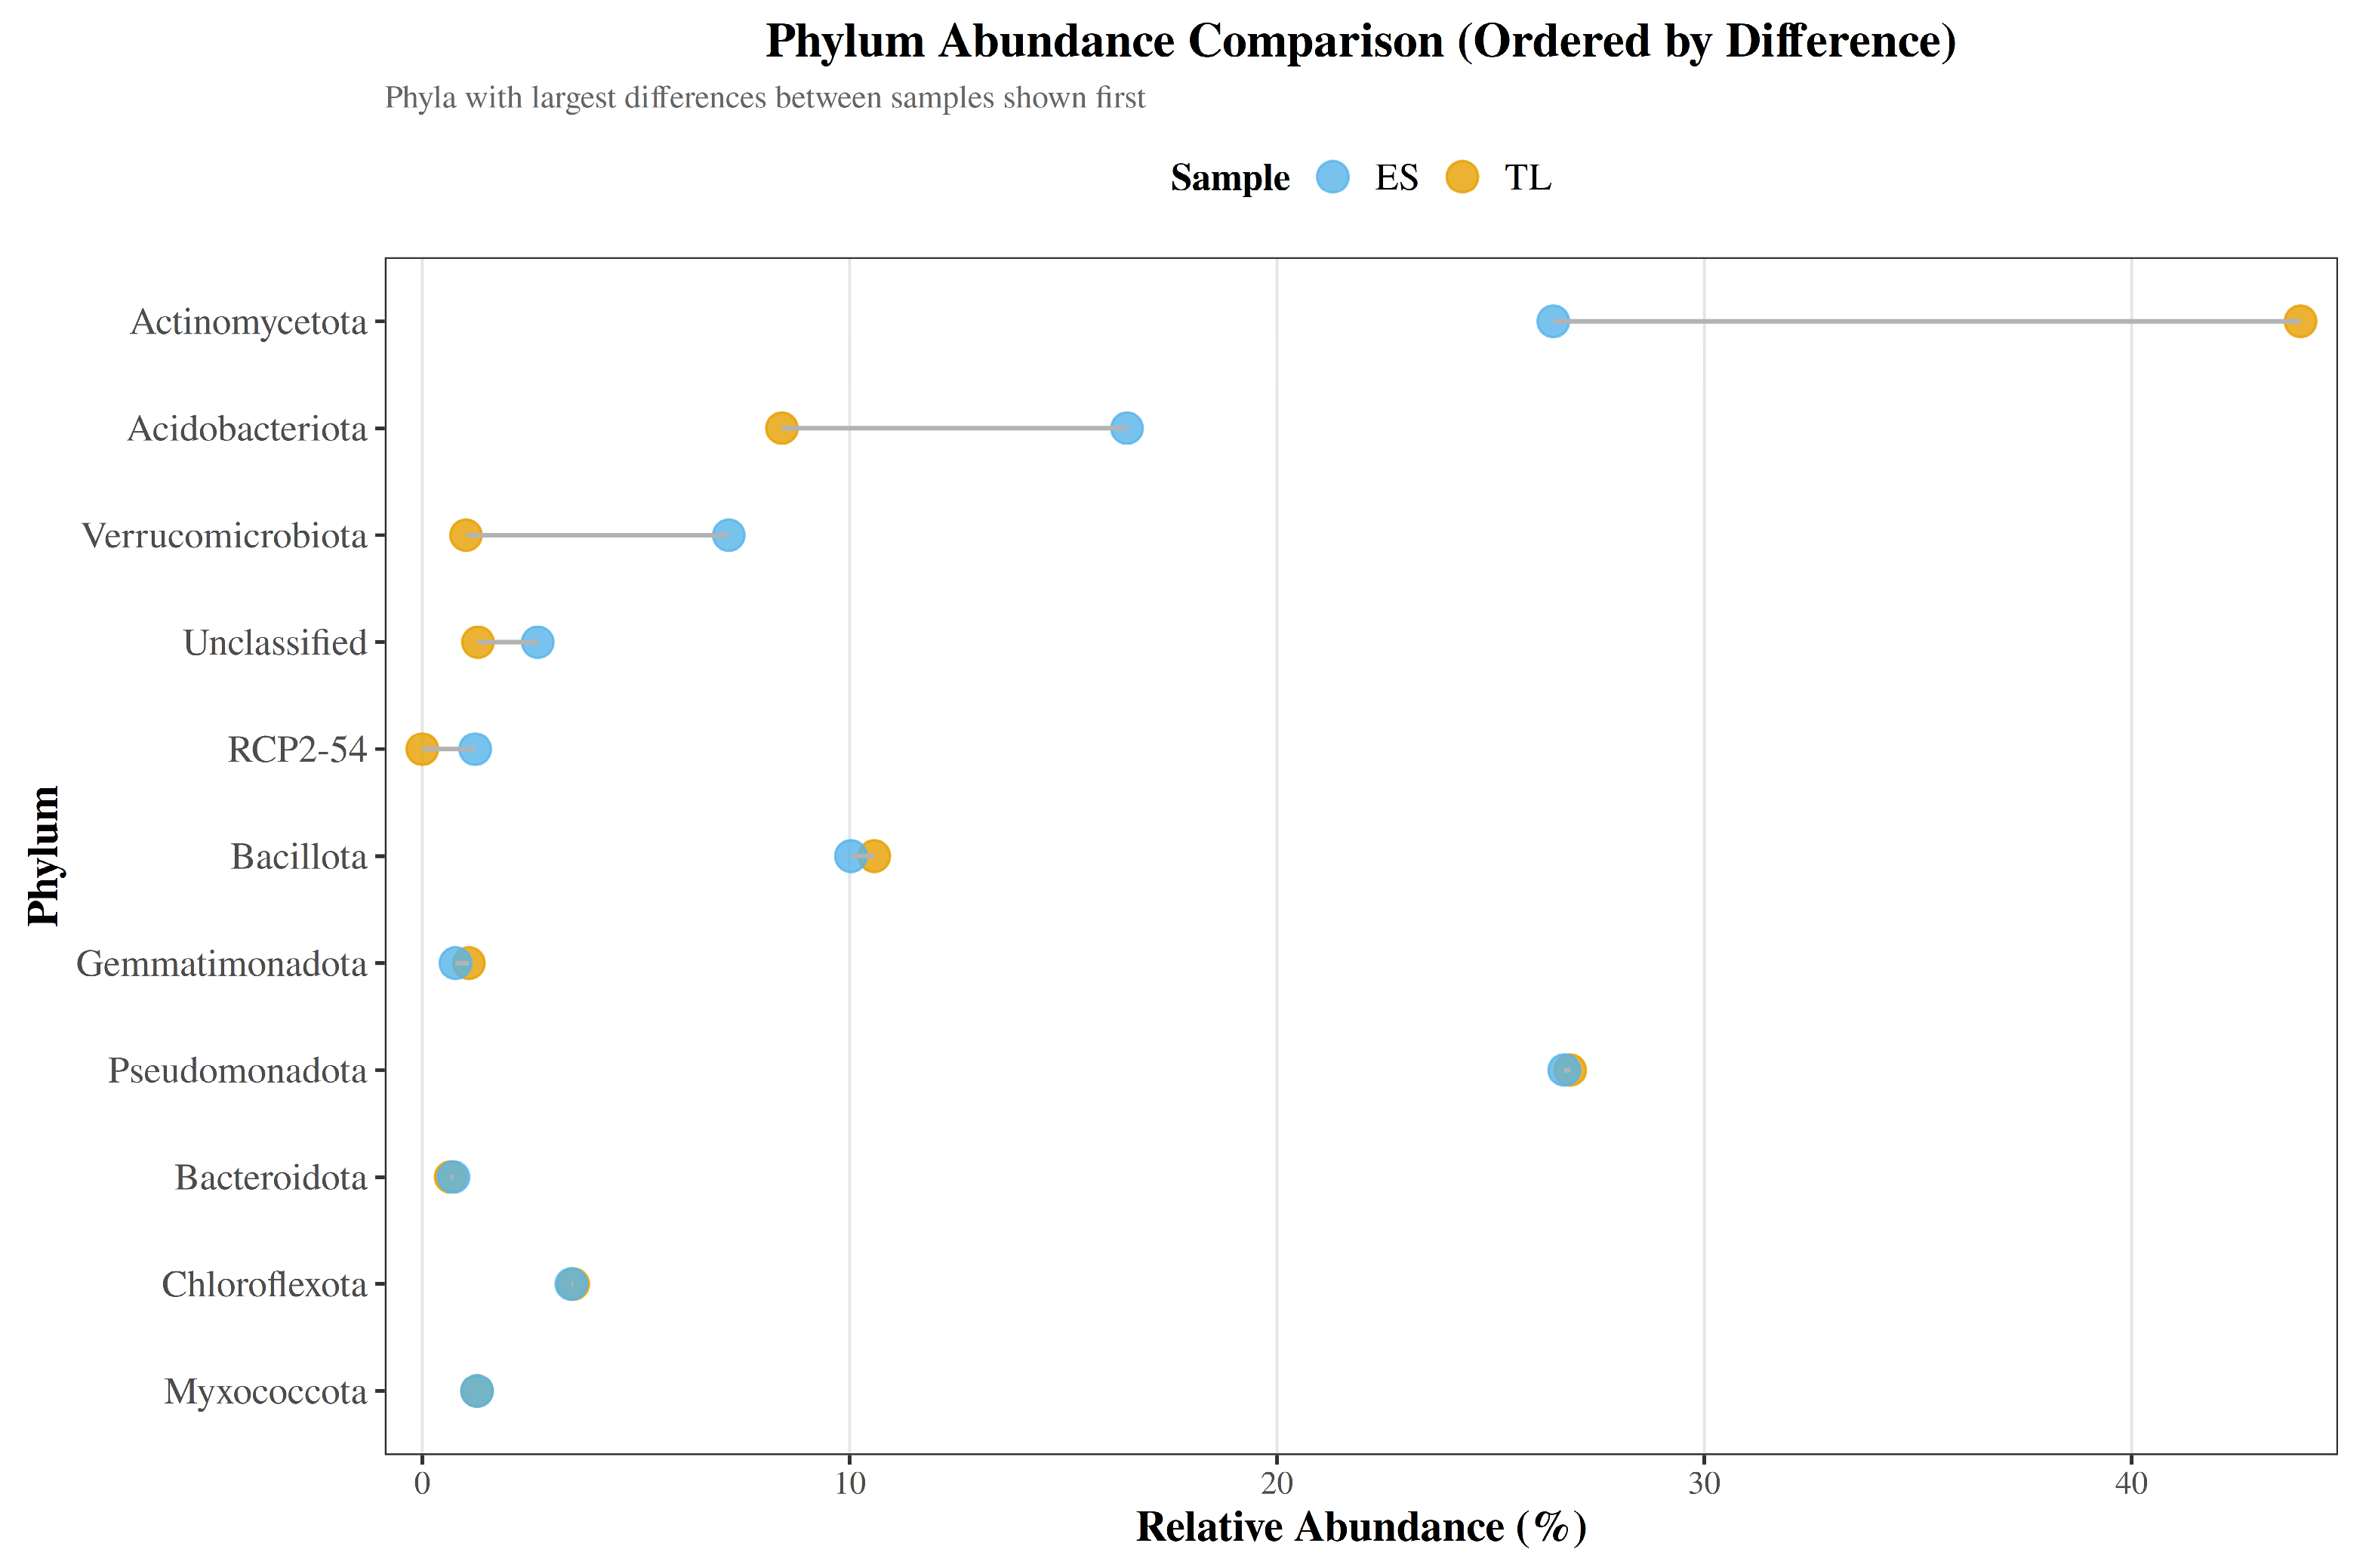
Figure 4.
Family-level composition of soil bacterial communities (top families). Stacked bar plots depicting the relative abundance (%) of the most abundant bacterial families in soil samples ES and TL.
Figure 4.
Family-level composition of soil bacterial communities (top families). Stacked bar plots depicting the relative abundance (%) of the most abundant bacterial families in soil samples ES and TL.
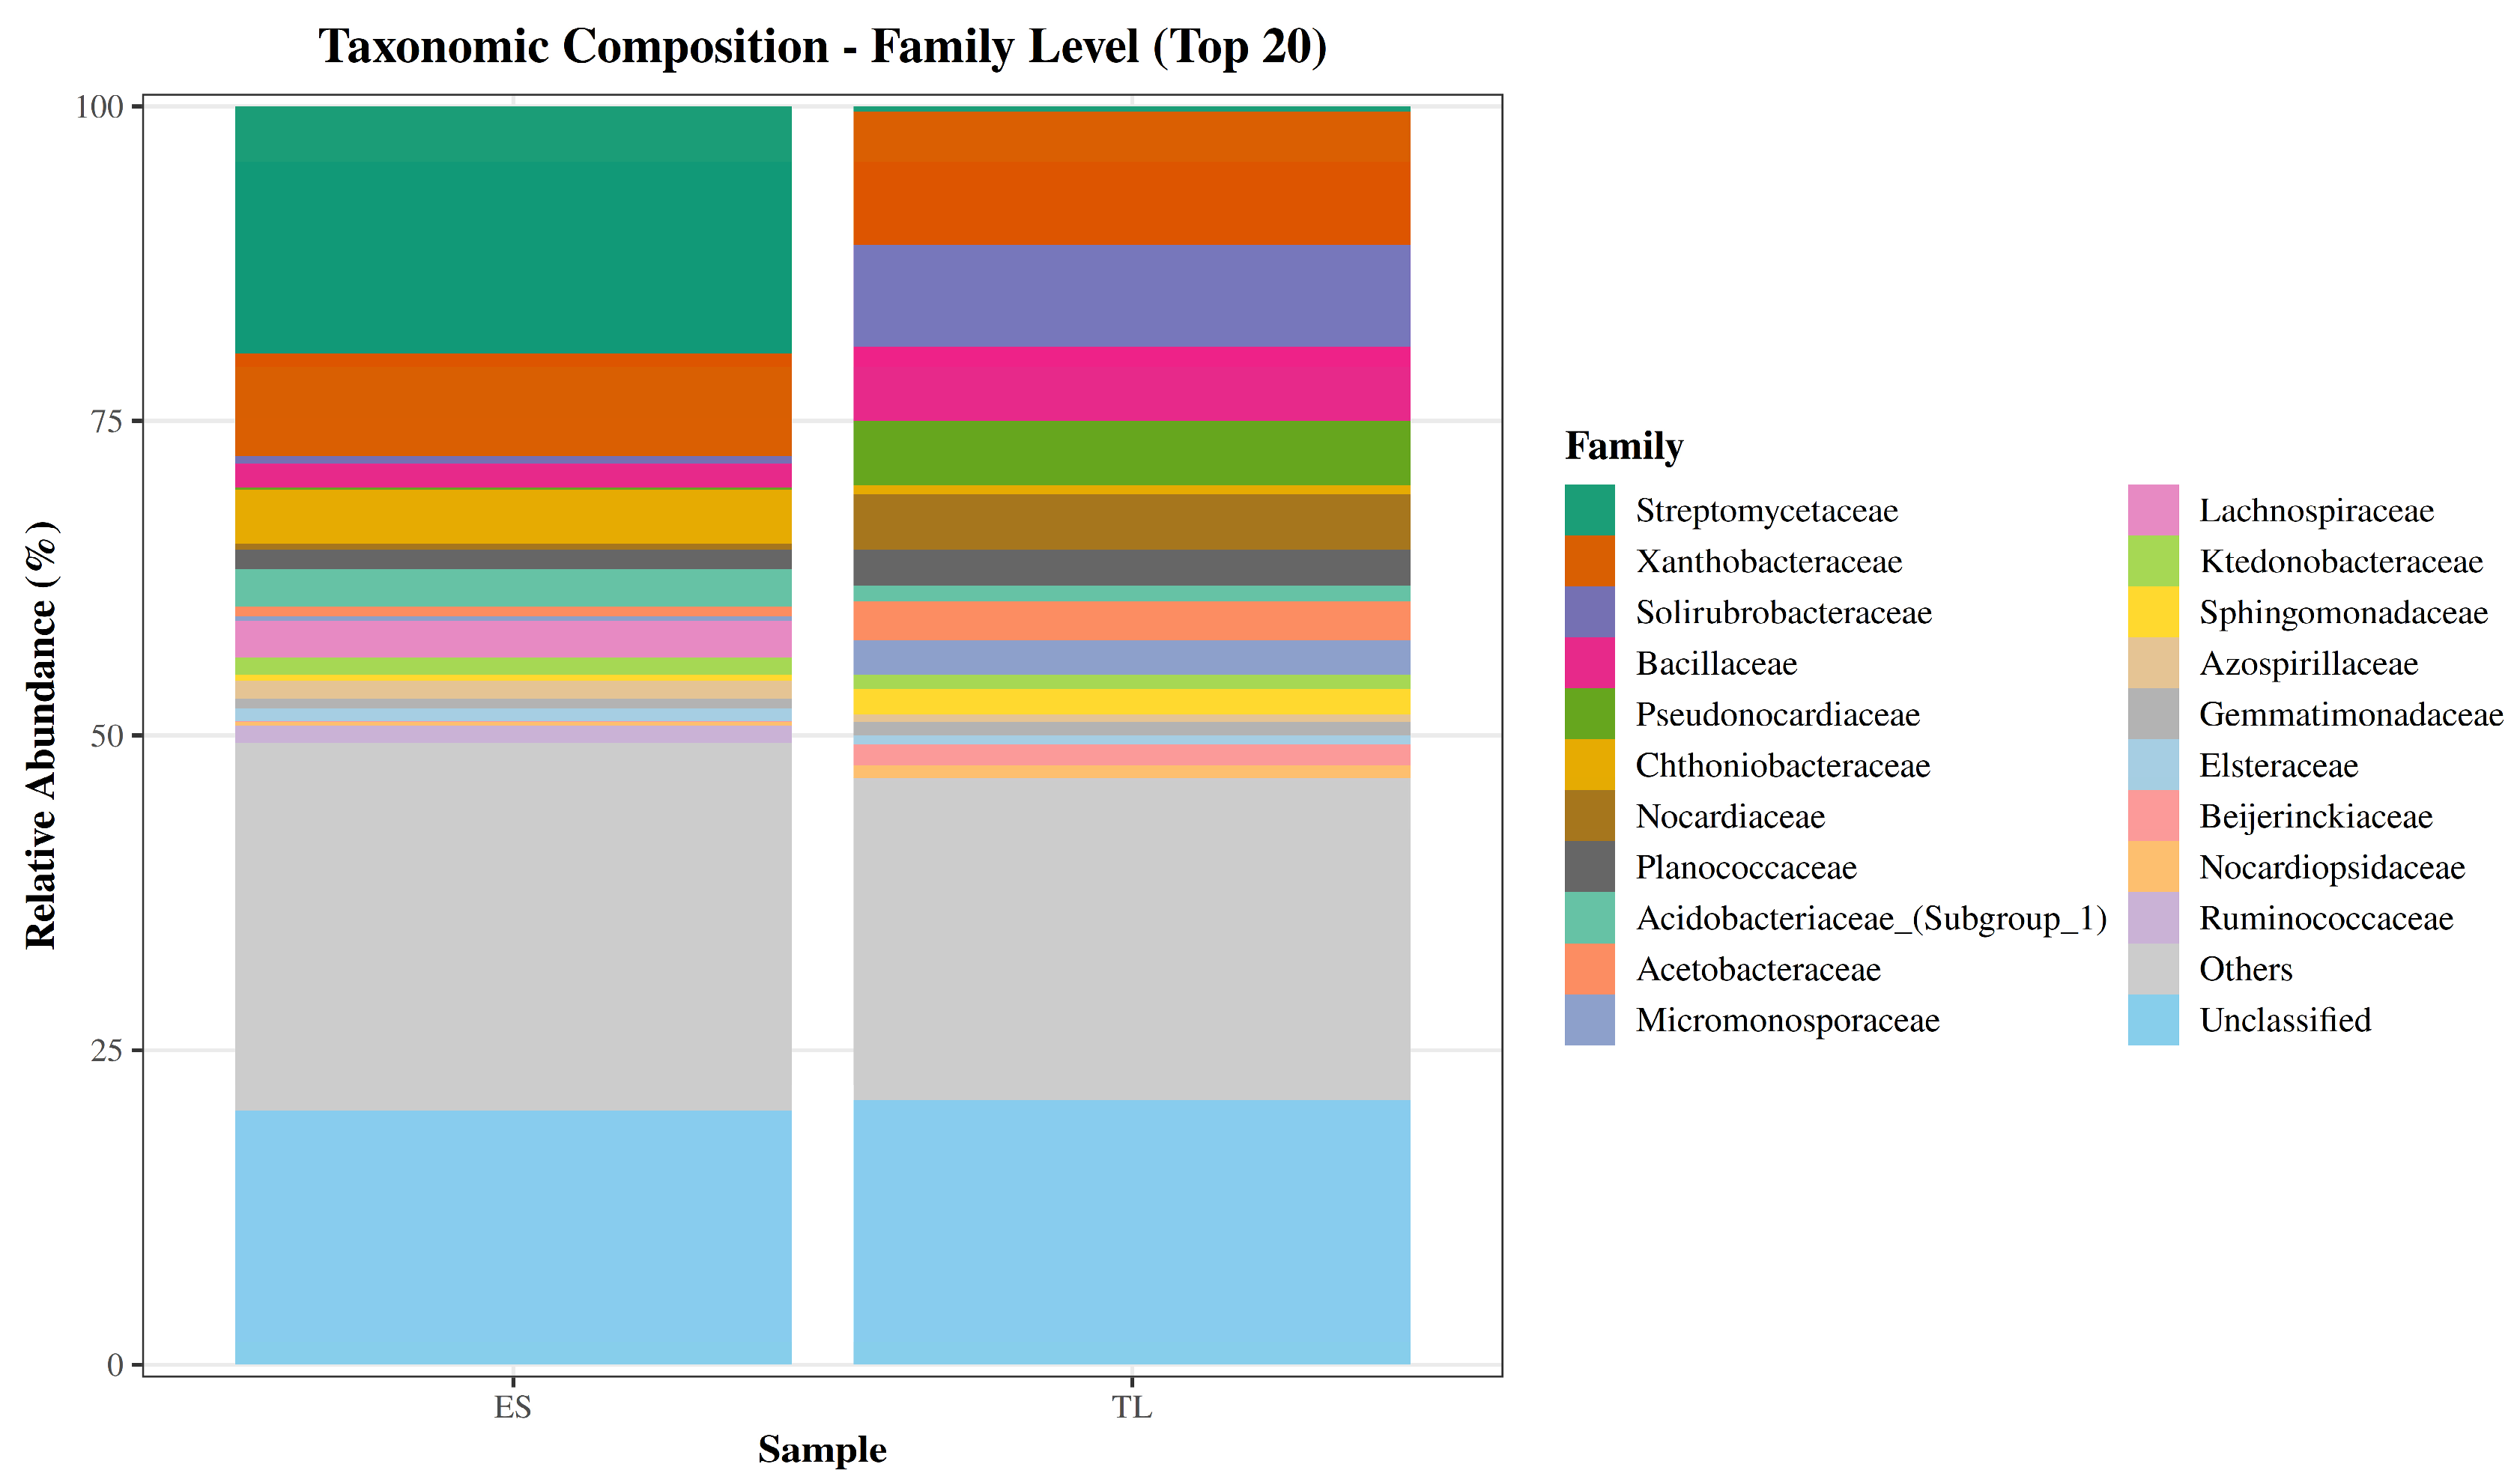
Figure 5.
Family-level abundance differences between ES and TL soils. Cleveland dot plot showing the relative abundance (%) of the 15 bacterial families with the largest compositional differences between sites. Families are ranked by absolute difference in relative abundance, with ES represented in blue and TL in yellow. The plot highlights the strong enrichment of Streptomycetaceae in ES, as well as the higher relative abundances of Solirubrobacteraceae, Pseudonocardiaceae, Nocardiaceae, and Beijerinckiaceae in TL.
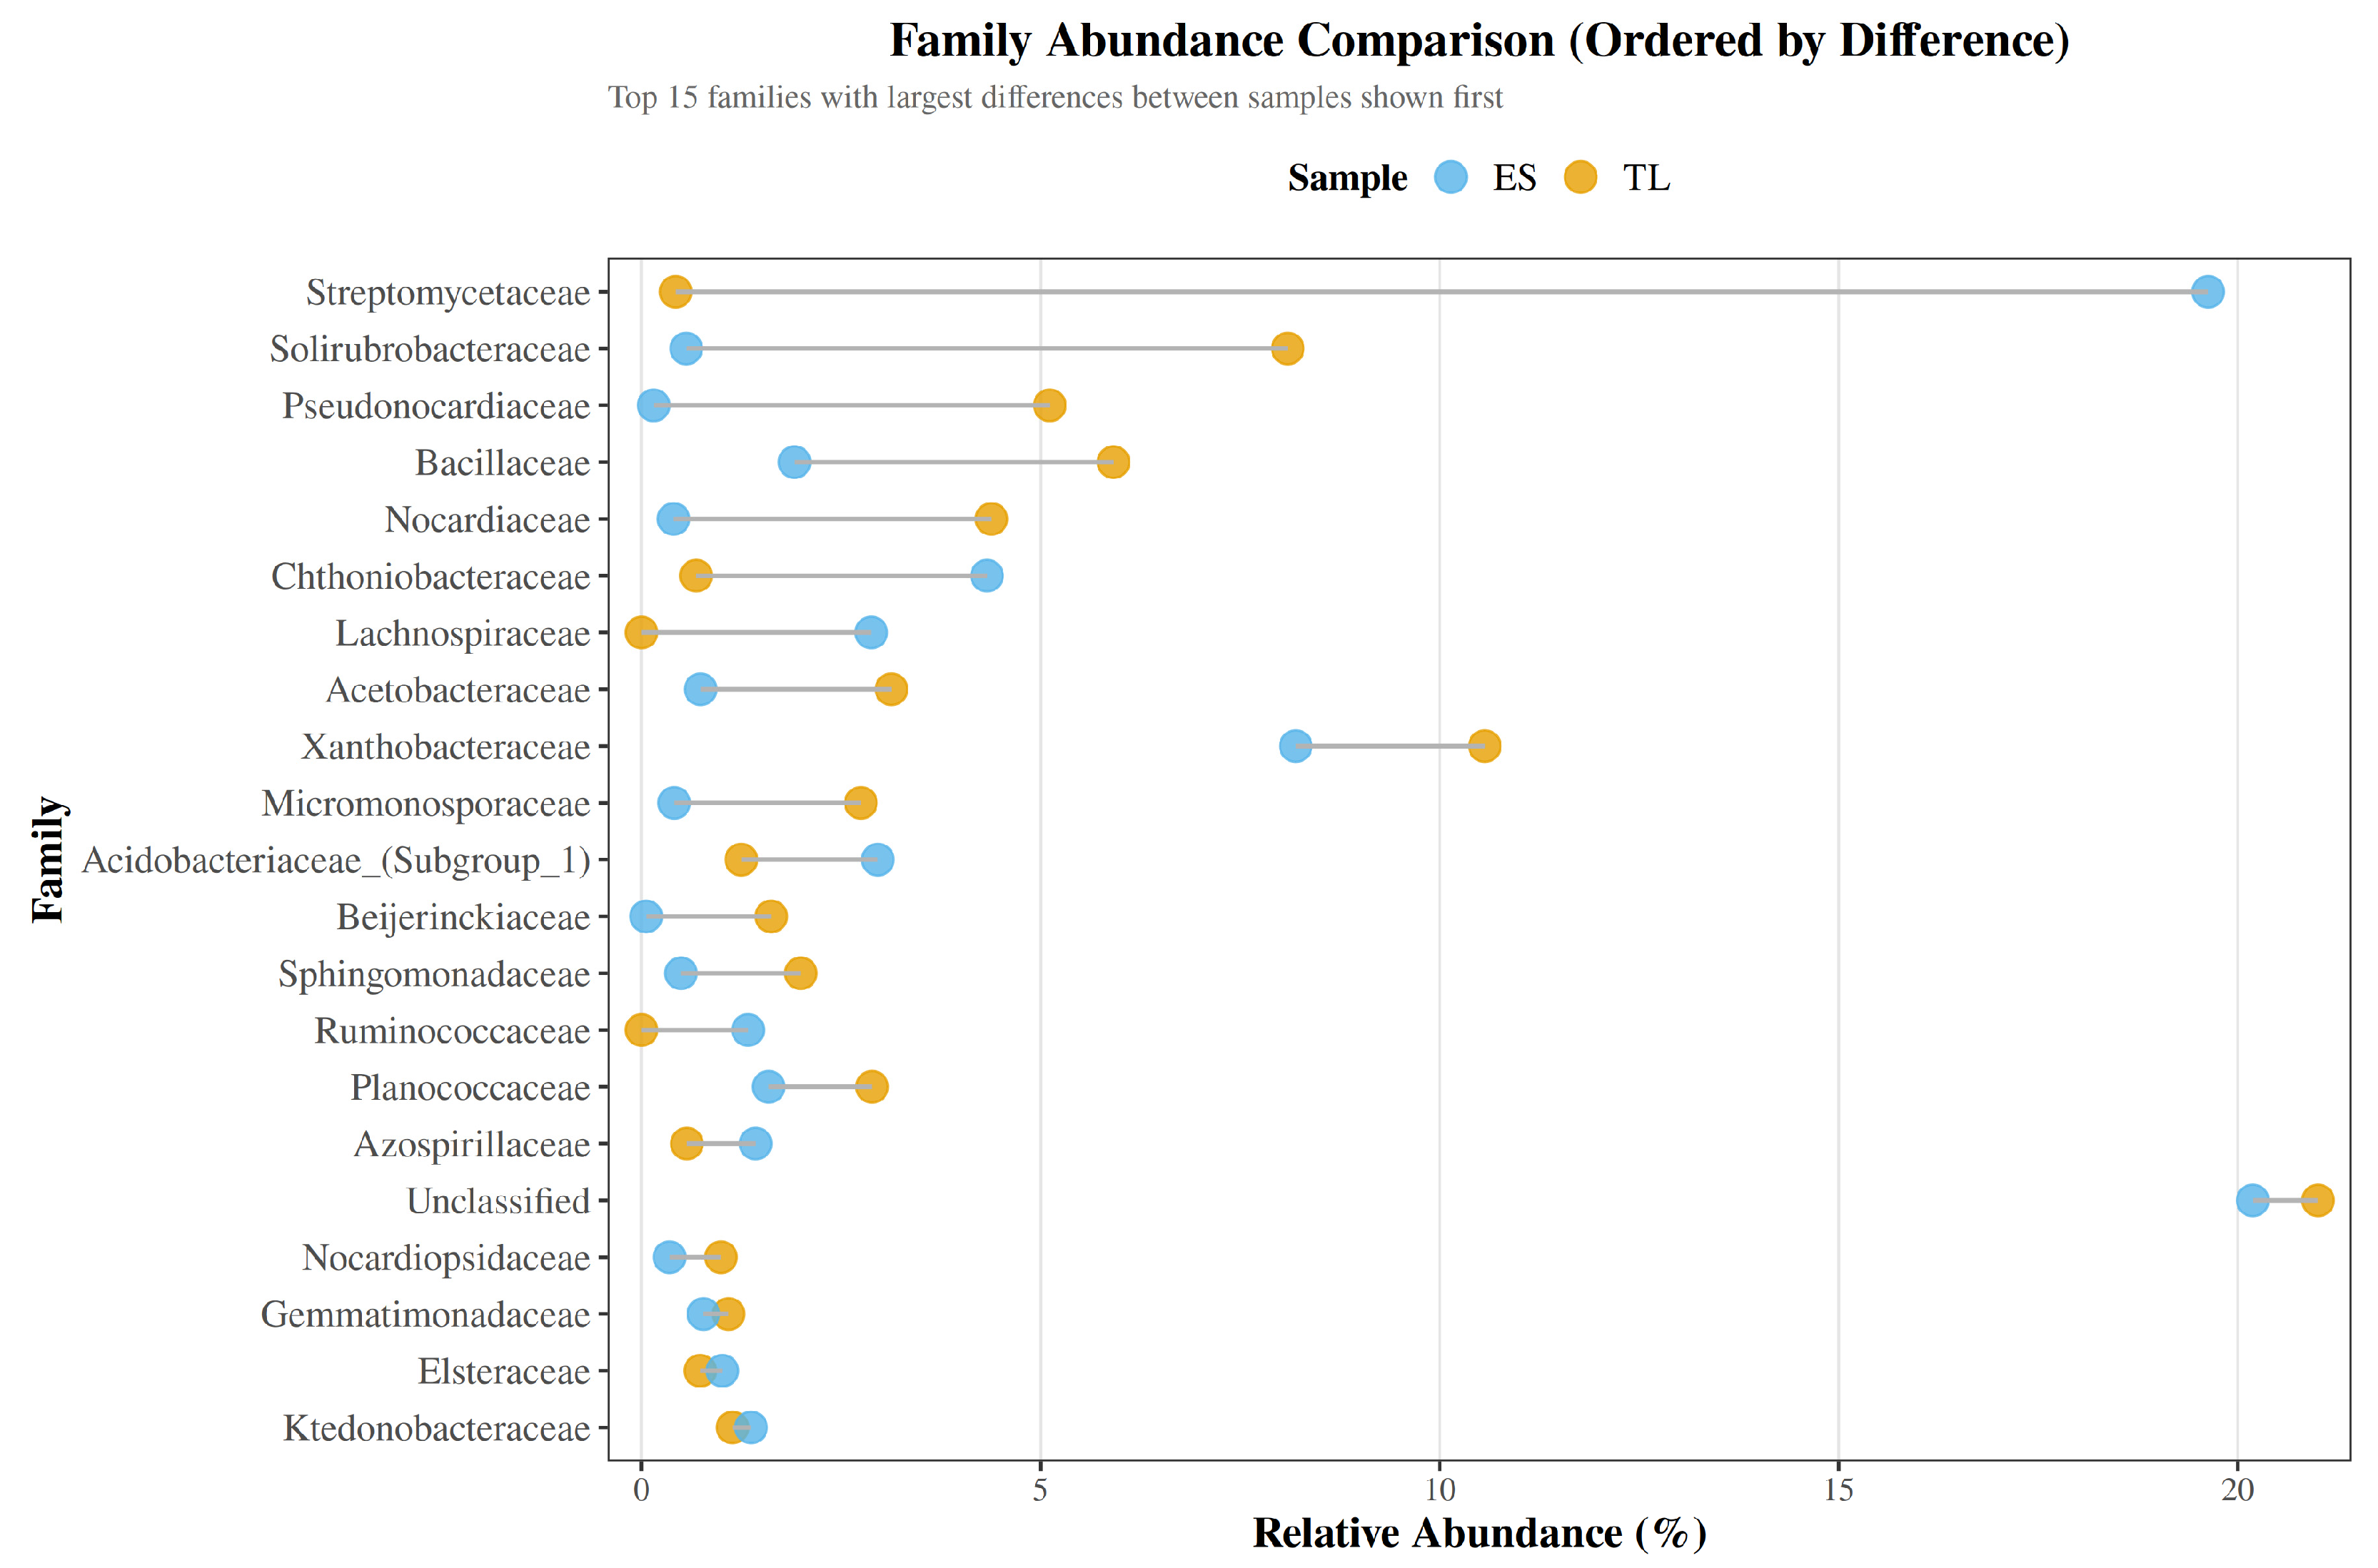
Figure 6.
Alpha diversity patterns of the soil microbiomes. Bar plots depicting four complementary diversity metrics for ES (blue) and TL (yellow): taxonomic richness (Observed ASVs), diversity and evenness (Shannon and Simpson indices), and phylogenetic diversity (Faith’s PD).
Figure 6.
Alpha diversity patterns of the soil microbiomes. Bar plots depicting four complementary diversity metrics for ES (blue) and TL (yellow): taxonomic richness (Observed ASVs), diversity and evenness (Shannon and Simpson indices), and phylogenetic diversity (Faith’s PD).
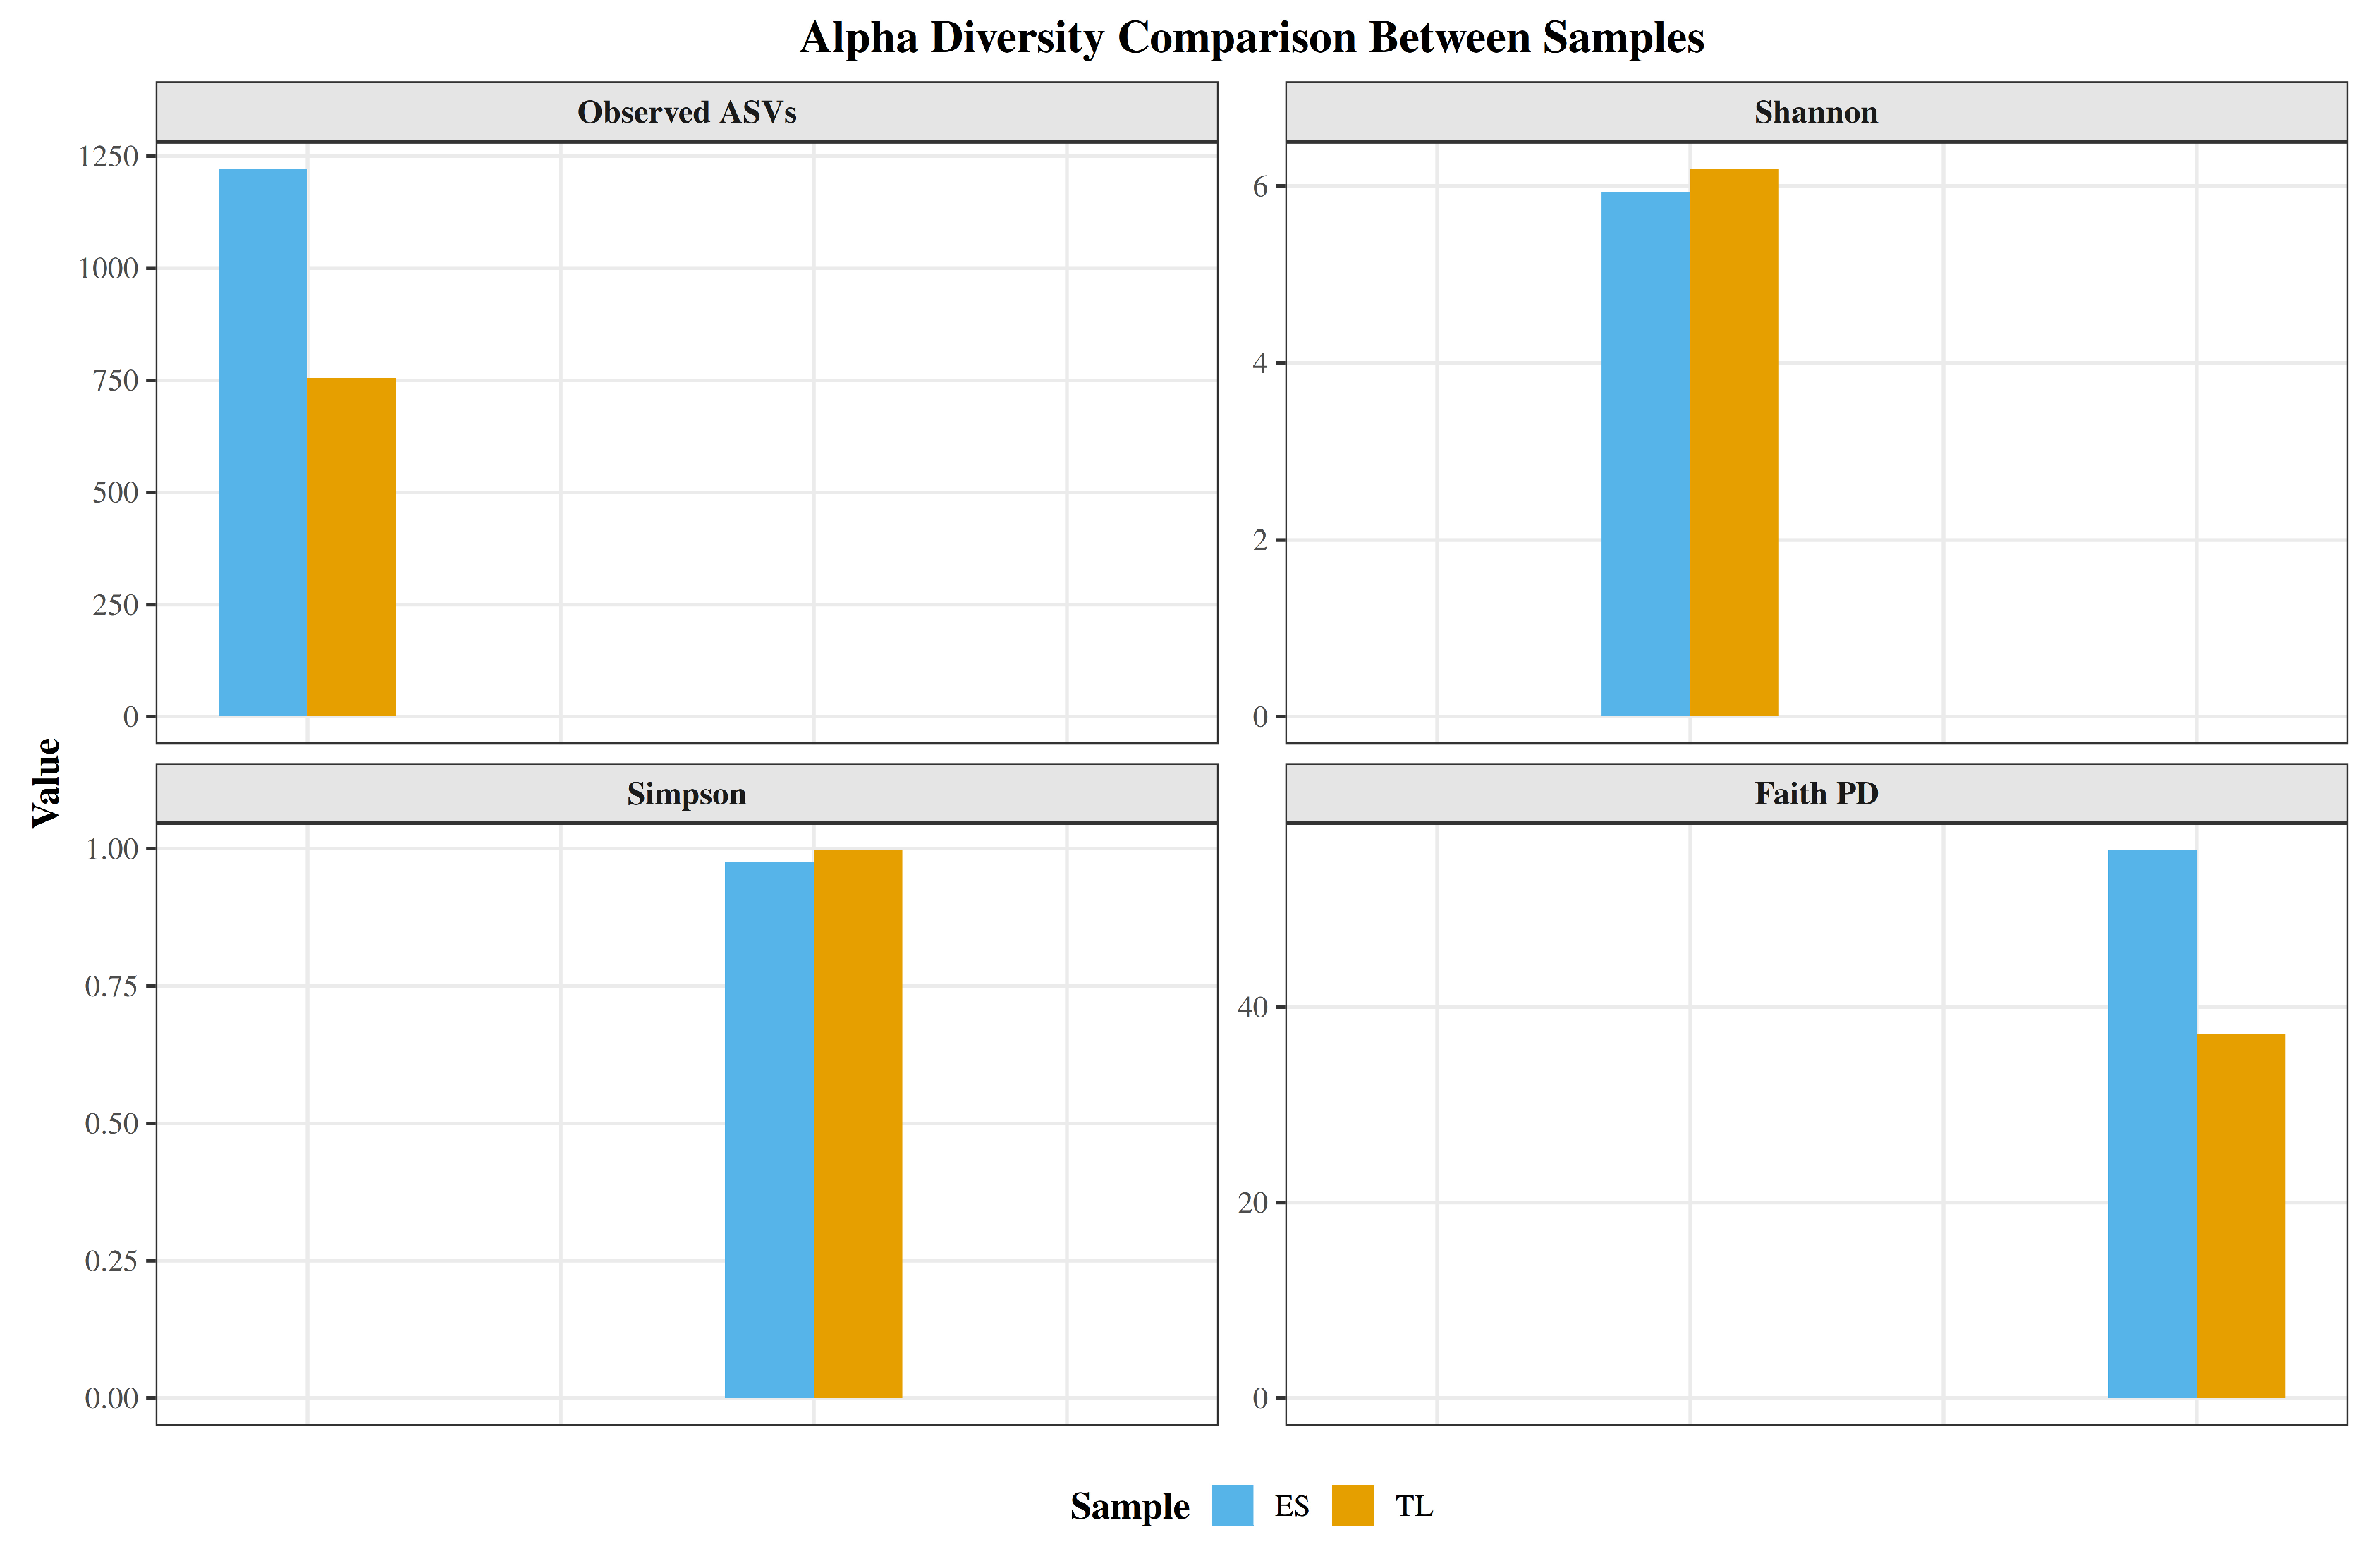
Figure 7.
Top 30 predicted MetaCyc metabolic pathways in ES and TL soil microbiomes. The heatmap displays relative abundance (%) of the most represented predicted pathways across samples. Rows correspond to individual MetaCyc pathways, and columns to soil samples. The color gradient (light yellow to dark brown) reflects increasing relative abundance.
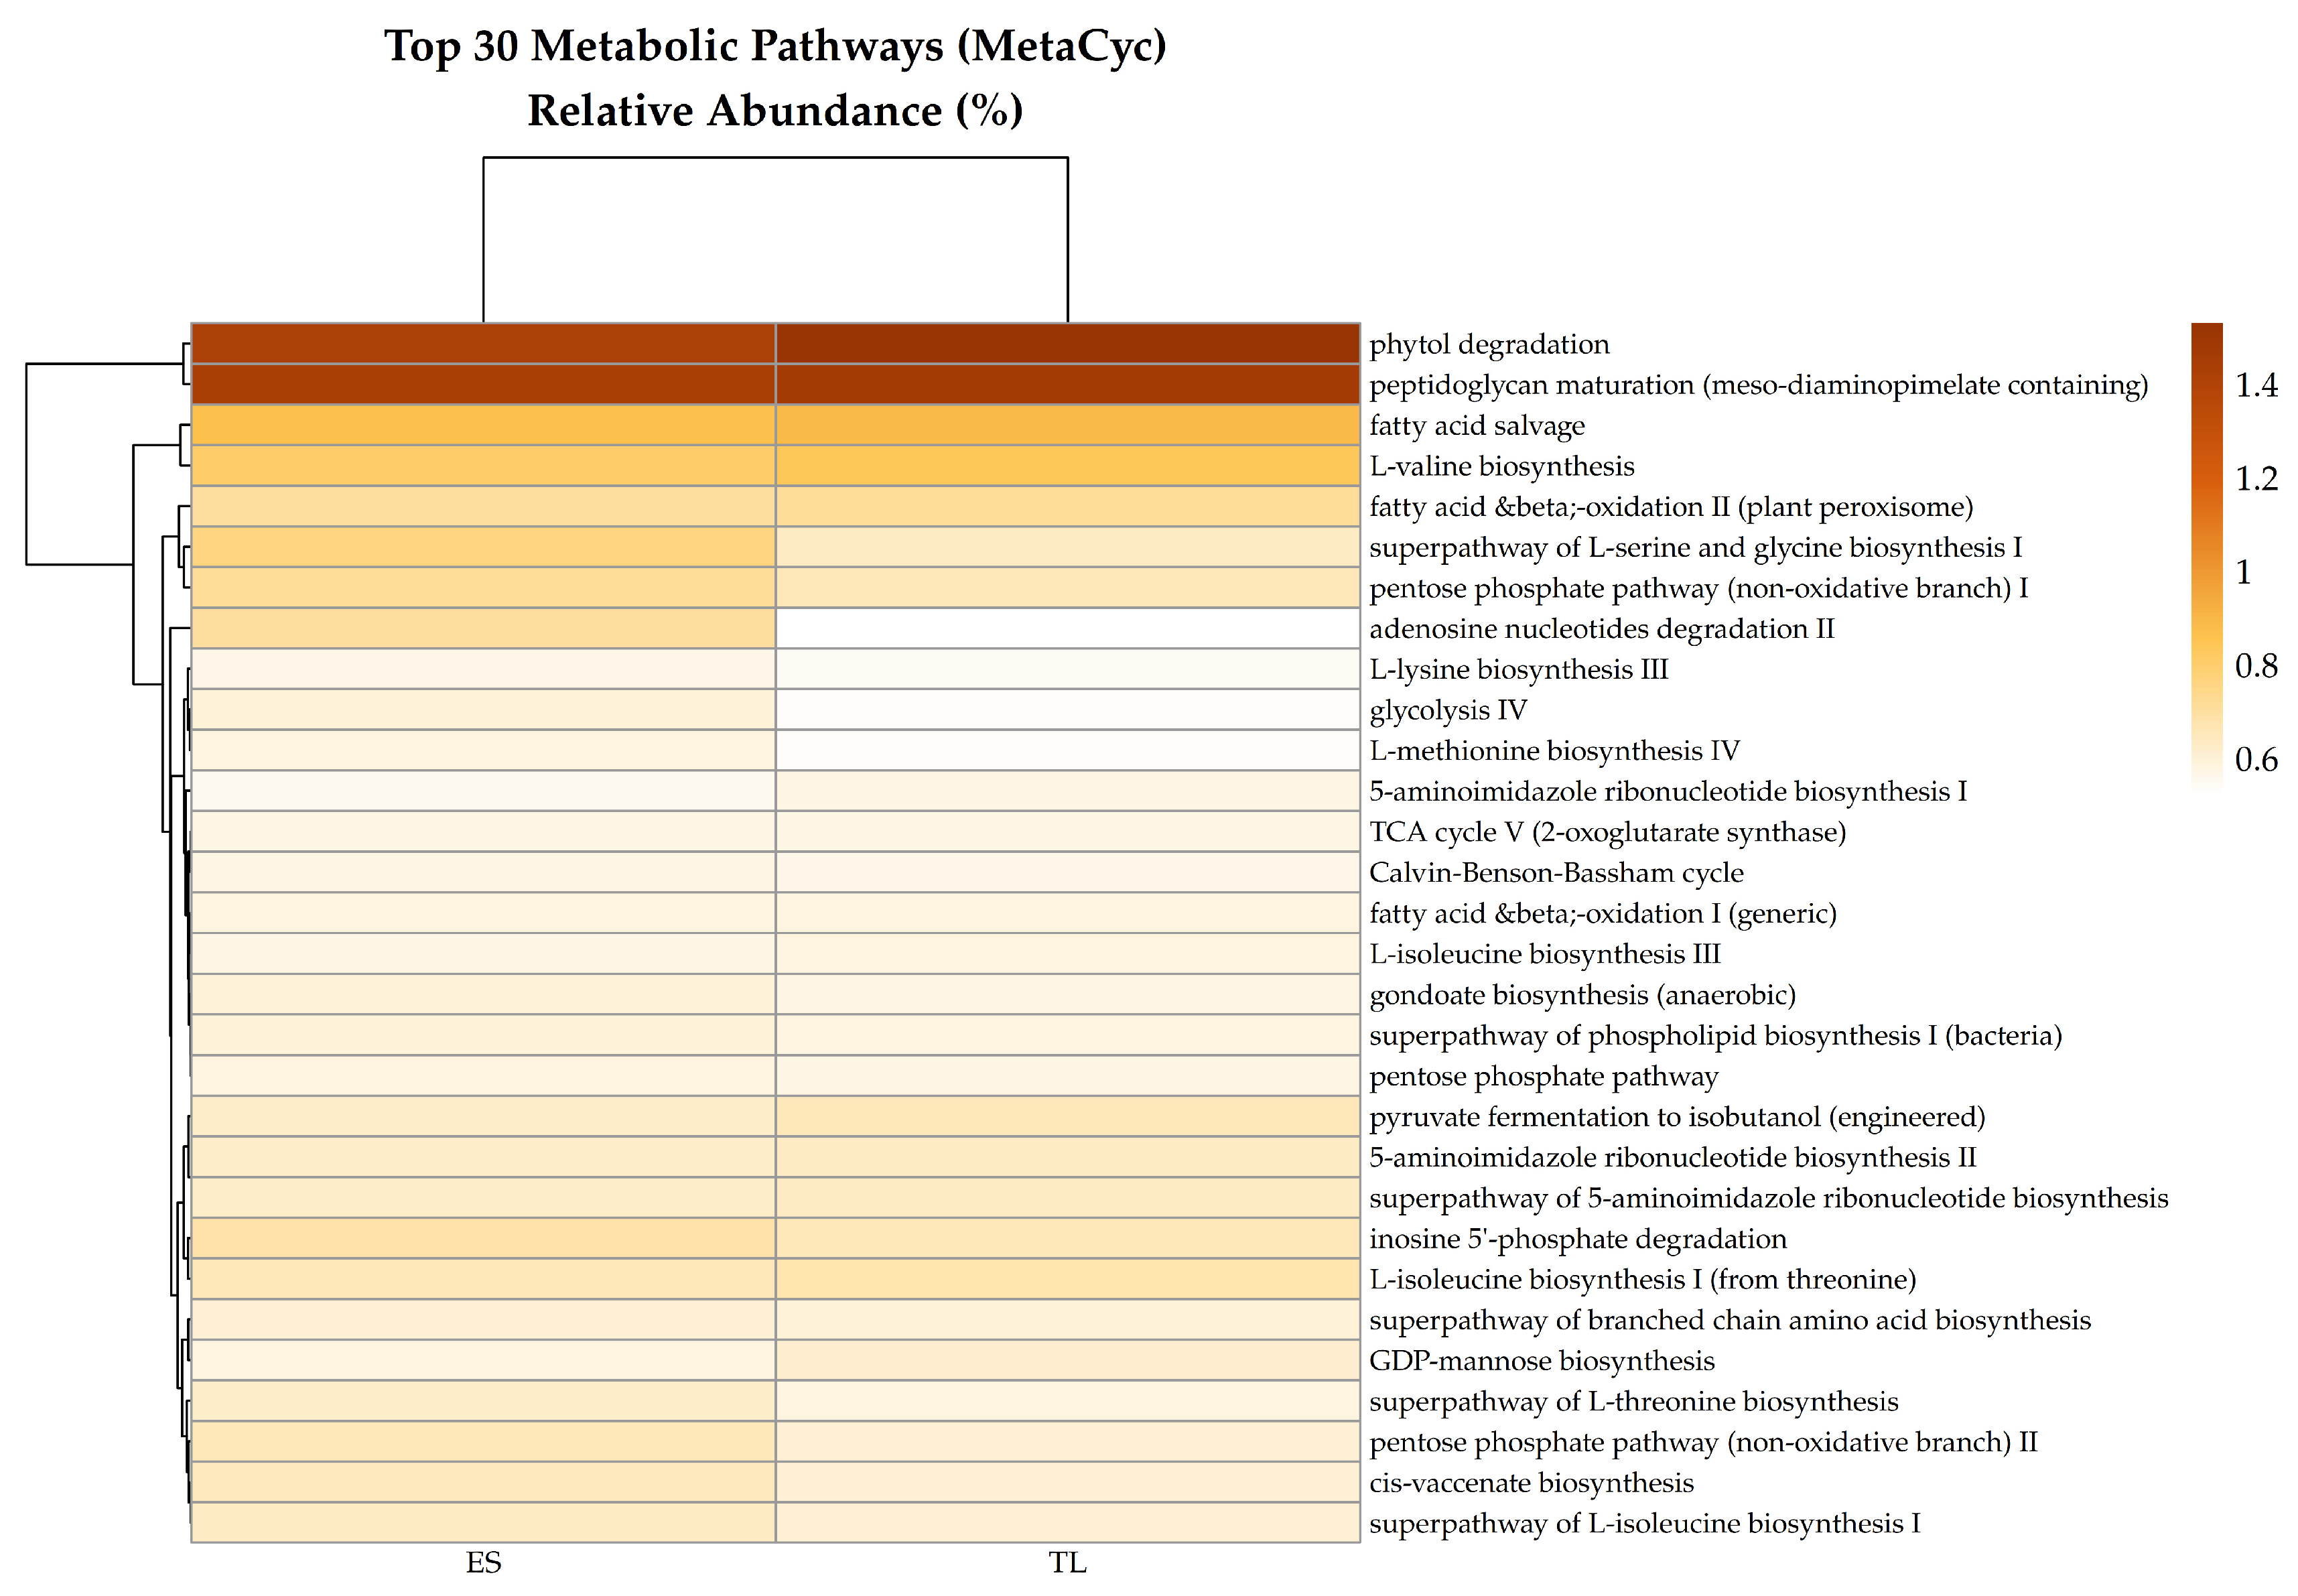
Figure 8.
Predicted functional potential for carbon and nitrogen cycling in ES and TL soil microbiomes. Horizontal bar plots compare the relative abundances (%) of MetaCyc pathways associated with (A) carbon metabolism and (B) the nitrogen cycling. ES is shown in green and TL in orange.
Figure 8.
Predicted functional potential for carbon and nitrogen cycling in ES and TL soil microbiomes. Horizontal bar plots compare the relative abundances (%) of MetaCyc pathways associated with (A) carbon metabolism and (B) the nitrogen cycling. ES is shown in green and TL in orange.
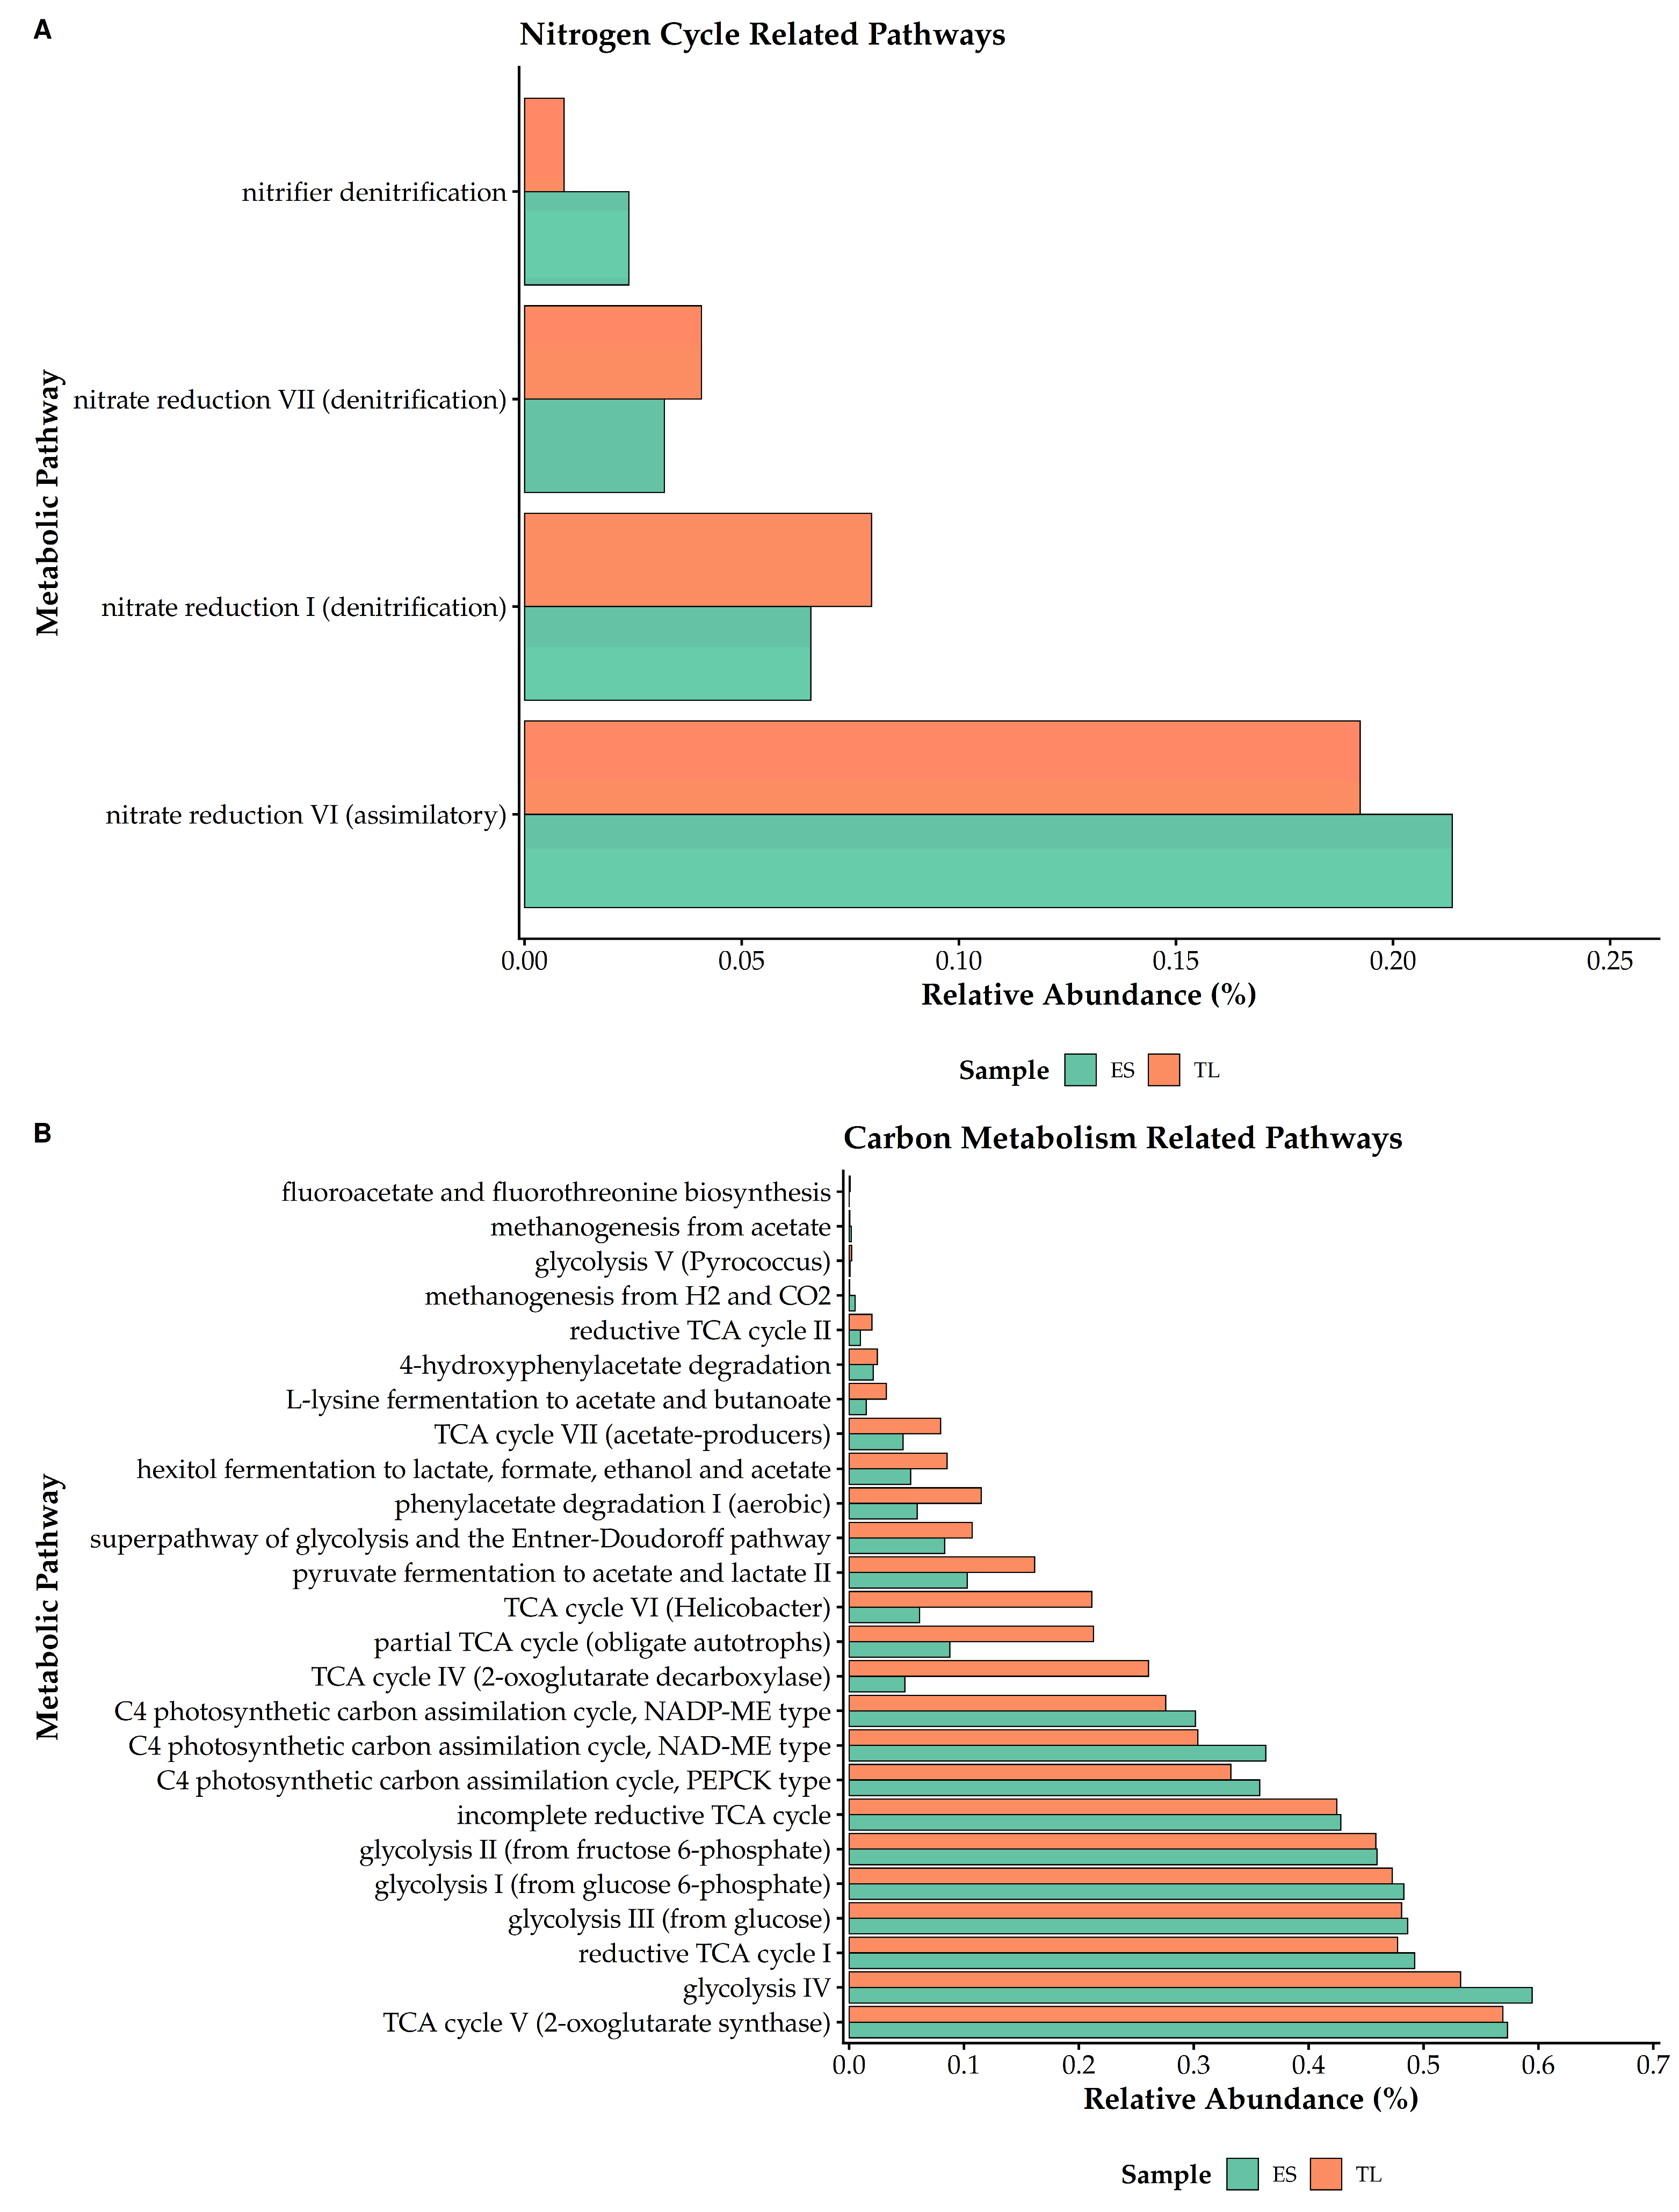
Figure 9.
Top 30 MetaCyc pathways with the largest abundance contrasts between ES and TL microbiomes. (A) Divergence bar plot illustrating the difference in relative abundance (ES – TL) for the 30 most variable pathways. Green bars indicate enrichment in ES, while orange bars indicate enrichment in TL. (B) Paired bar plots showing the relative abundance (%) of these pathways in ES (green) and TL (orange).
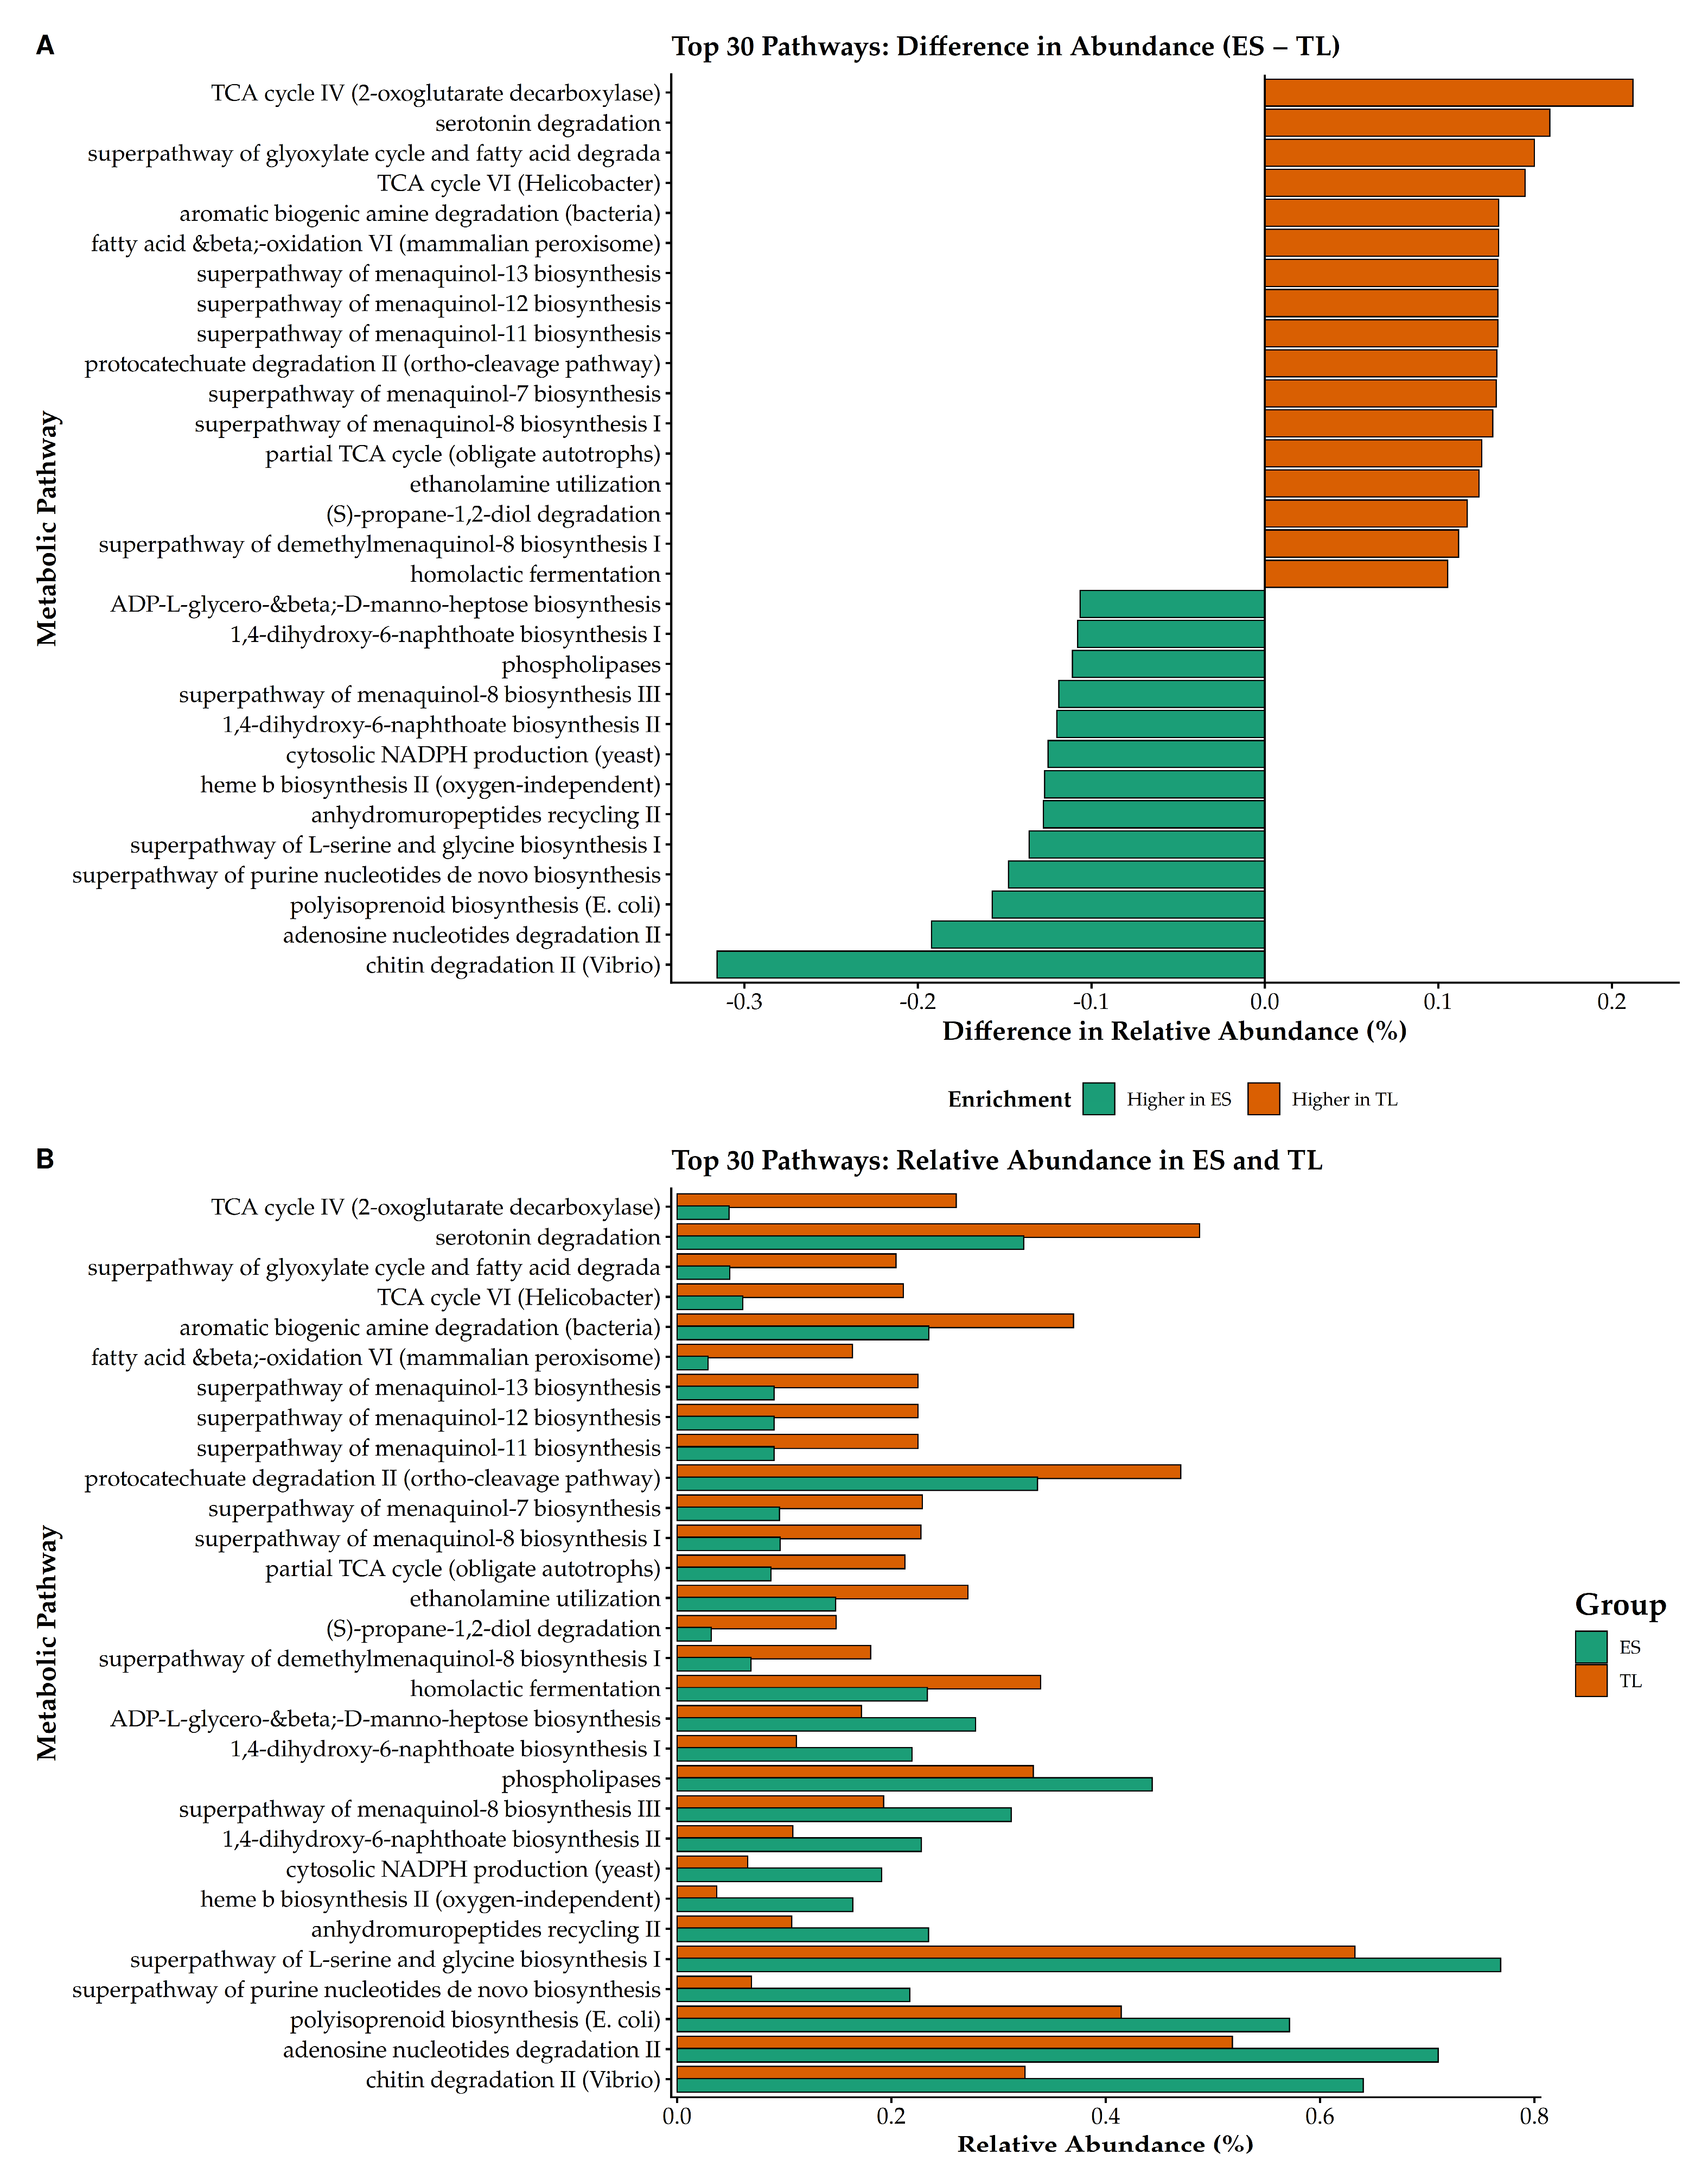

Table 1.
Physicochemical characteristics of soils from eucalyptus plantations in Três Lagoas (TL) and Eldorado do Sul (ES).
Table 1.
Physicochemical characteristics of soils from eucalyptus plantations in Três Lagoas (TL) and Eldorado do Sul (ES).
| Parameter | Três Lagoas (TL) | Eldorado do Sul (ES) |
| Clay (%) | 45.0 | 25.0 |
| Electrical Conductivity (mS/m) | 1.1724 | 0.8837 |
| Organic Matter (g/kg) | 22.0 | 20.1 |
| Total Nitrogen (g/kg) | 1.5 | 1.0 |
| Available P (mg/dm³) | 5.3 | 9.8 |
| Available K (cmolc/dm³) | 0.14 | 0.24 |
| Ca (cmolc/dm³) | 1.0 | 1.7 |
| Mg (cmolc/dm³) | 2.0 | 1.3 |
| S (mg/dm³) | 10.0 | 15.62 |
| Cu (mg/dm³) | 1.10 | 1.07 |
| Fe (mg/dm³) | 24.0 | 62.55 |
| Mn (mg/dm³) | 42.0 | 24.12 |
| Zn (mg/dm³) | 3.5 | 2.93 |
Disclaimer/Publisher’s Note: The statements, opinions and data contained in all publications are solely those of the individual author(s) and contributor(s) and not of MDPI and/or the editor(s). MDPI and/or the editor(s) disclaim responsibility for any injury to people or property resulting from any ideas, methods, instructions or products referred to in the content. |
© 2026 by the authors. Licensee MDPI, Basel, Switzerland. This article is an open access article distributed under the terms and conditions of the Creative Commons Attribution (CC BY) license (http://creativecommons.org/licenses/by/4.0/).
Copyright: This open access article is published under a Creative Commons CC BY 4.0 license, which permit the free download, distribution, and reuse, provided that the author and preprint are cited in any reuse.


