Submitted:
26 February 2026
Posted:
27 February 2026
You are already at the latest version
Abstract
Clinically robust molecular biomarkers for depression have remained elusive, despite extensive transcriptomic research. This gap is consequential: depression is prevalent and heterogeneous, yet objective measures to quantify burden, stratify patients, and track recovery remain limited. Here we review evidence that intron retention (IR) can serve as a homeostatic state variable—and therefore a sensitive biomarker—reporting stress adaptation and recovery at an upstream regulatory layer, often preceding or outperforming differential gene expression (DEG) readouts. Mechanistically, IR enables bidirectional fine-tuning of effective gene output: increased IR (IncIR) can throttle output under overload, whereas decreased IR (DecIR) releases this brake to restore gene output. Because these shifts are reversible and treatment-responsive, IR signatures can function not only as disease markers but also as pharmacodynamic metrics for blood-based monitoring of drug response and recovery. To evaluate the clinical utility of IR, we use depression as a proof-of-concept and focus on two interventions: (i) the Kampo formula hangekobokuto (HKT), which is associated with IR normalization consistent with reduced peripheral inflammatory load. and (ii) ketamine, where IR patterns measured before ketamine treatment in non-responders are linked to stronger innate-immune/antiviral activity, suggesting a higher inflammatory load that may limit treatment benefit. Finally, we discuss transdiagnostic extensions using early cognitive decline as a concrete example. Although peripheral blood may only indirectly reflect the primary drivers of MCI-stage dementia risk—potentially yielding smaller IR/DI effect sizes than in depression—consistent group-level shifts can still emerge in adequately powered cohorts, supporting IR as a practical blood-based readout even when causal pathology lies outside the blood.
Keywords:
intron retention
; homeostasis
; stress
; ketamine
; nonresponder
; Kampo
1. Introduction: The Unmet Need for Actionable Biomarkers of Depression
Major depressive disorder (MDD) remains among the most disabling illnesses worldwide, yet clinical decision-making still relies predominantly on symptom-based assessments and trial-and-error treatment selection. A central bottleneck is the lack of actionable molecular biomarkers that can (i) quantify disease burden in an individual, (ii) stratify biologically distinct subtypes, and (iii) track recovery trajectories during treatment. This gap persists despite decades of transcriptomic, proteomic, inflammatory, and imaging studies, suggesting that the prevailing biomarker paradigm may be targeting the wrong molecular “layer” [1,2].
Blood transcriptomics has been attractive because it is scalable and minimally invasive, and because peripheral immune/inflammatory states plausibly contribute to depressive symptoms in at least a subset of patients [3,4,5,6,7,8,9]. However, the dominant approach—differential gene expression (DEG)—often yields signatures that are cohort-fragile, sensitive to sampling context, and difficult to transfer across studies [10,11,12]. Whole blood is a heterogeneous mixture of immune subsets whose proportions vary across individuals and time; lifestyle, circadian timing, subclinical infection, comorbidities, and medication history further shape steady-state mRNA abundance. Even when statistically significant, DEGs frequently represent downstream outputs: the end products of multiple regulatory steps rather than the upstream control settings that govern adaptation and recovery [1,13,14,15].
These considerations motivate a shift from “downstream abundance endpoints” to upstream state variables—molecular readouts that reflect upstream regulatory mechanisms and therefore generalize better across cohorts while remaining sensitive to within-individual changes. In this review, we focus on intron retention (IR) and argue that it can serve as a homeostatic state variable—and therefore a sensitive biomarker—reporting stress adaptation and recovery at an upstream regulatory layer, often preceding or outperforming conventional DEG readouts (Figure 1A) [1]. We further emphasize that this property makes IR not only a disease marker but also a pharmacodynamic instrument for evaluating treatment efficacy and recovery kinetics [16,17,18,19].
Our recent IJMS review (in press) proposed the “IR-Homeostat” hypothesis: intron retention/detained intron (IR/DI) switching is an evolutionarily conserved, switchable fine-tuning layer that couples homeostatic inputs to tunable gene-output states [1]. That article focused on the mechanistic and evolutionary rationale—why IR is well positioned to implement feedback-like control of effective gene output across diverse stressors.
Here, we write a complementary, application-centered review. Rather than revisiting the full conceptual foundation, we focus on how IR can be used as a practical pharmacodynamic readout to quantify drug response and recovery in vivo, using depression datasets (the Kampo medicine hangekobokuto (HKT) and ketamine) as proof-of-concept. We highlight analysis motifs and robustness criteria (e.g., directional IR recovery patterns, cross-cohort overlap, and outlier-aware interpretation) that are immediately useful for biomarker development and translational deployment.
To make this argument concrete, we build the main narrative around two complementary clinical datasets. First, a Kampo medicine intervention (hangekobokuto; HKT) demonstrates drug-responsive normalization of IR programs (Figure 2, from Figure 6 in ref. 20). Second, ketamine response heterogeneity shows how IR can provide a molecular characterization of clinically defined responders versus non-responders and generate mechanistic hypotheses for non-response (Figure 4, from Figure 3 in ref. 21). Finally, we address outliers, arguing that they often reflect clinically meaningful heterogeneity rather than noise. Notably, the impulse to treat outliers as artifacts is largely inherited from DEG-based workflows; IR-based analyses do not require this premise and can incorporate biological extremes as part of the signal (Section 5) [20,21]. We close by briefly extending this pharmacodynamic logic beyond depression, highlighting early cognitive decline (MCI) as a setting where baseline case–control IR separation may be modest, but within-individual IR trajectories could still provide a sensitive readout of treatment engagement and recovery.
2. Conceptual Framework: Ir as an Upstream “Throttle” on Effective Gene Output
Intron retention (IR) occurs when an intron remains within a transcript that would otherwise be fully spliced. Retained (or detained) introns can influence transcript fate through nuclear retention/detention, altered export, changes in translation competence, or decay routes, depending on locus architecture and cellular context. Importantly, multiple systems indicate that IR can be regulated, switchable, and reversible, rather than merely a splicing error [1,19,22,23].
A useful translational abstraction is to treat IR as a post-transcriptional throttle controlling effective gene output—the supply of mature, export-competent mRNAs that can be translated. Within this throttle model (Figure 1B), IncIR (increased intron retention) functions as a reversible brake that dampens effective output when the system experiences overload or when energetic and proteostatic capacity is constrained; DecIR (decreased intron retention) releases this brake, enabling rapid restoration of output during recovery. This “brake/accelerator” logic aligns naturally with a homeostatic view of regulation: cells must prevent overshoot, allocate limited processing capacity, and coordinate recovery programs without requiring complete transcriptional rewiring [18,24].
This conceptual layer matters for biomarker design. Differential gene expression (DEG) is often an endpoint readout that reflects the combined effects of many upstream decisions as a net abundance change. By contrast, IR reports an upstream RNA-processing layer that can change earlier and may generalize better because it is tied to regulated processing decisions. This premise is consistent with the broader “IR-Homeostat” concept discussed in our recent IJMS review (in press) [1], in which IR/DI switching is treated as a conserved regulatory layer that links homeostatic inputs to tunable gene-output states [18,25,26,27,28].
An empirical hallmark of an upstream state variable is cross-cohort reproducibility (Figure 1C). In our depression blood analyses [20], IR-defined programs (IncIR+DecIR) showed strong overlap across independent cohorts, including Japanese cohort, Caucasian cohort (Cathomas et al. [29]), and Chinese cohort (Zhang et al. [30]), with overlaps enriched well above random expectation (fold enrichment ~2.5–3.2; Figure 1C(left), adapted from Figure 8DE in ref. 20). In contrast, the corresponding DEG sets (up+down) exhibited weak or even depleted overlap across the same cohorts (fold enrichment ~0.6–0.8), yielding only a minimal shared core (Figure 1C(right), adapted from Figure 8E in ref. 20). This contrast is consistent with IR capturing a more conserved, upstream RNA-processing layer, whereas DEGs more often reflect downstream, context- and composition-sensitive outputs in whole blood.
With this conceptual framing, we next examine two intervention-based proof-of-concept datasets—hangekobokuto (HKT) and ketamine—to illustrate how IR can function as a pharmacodynamic readout of recovery and a molecular lens for interpreting response heterogeneity.
3. Case Study 1
A decisive test for any candidate biomarker is whether it behaves as a pharmacodynamic readout—i.e., whether it not only distinguishes states but also moves in the correct direction with effective treatment. In our previous study [20], we analyzed RNA-seq data from PBMC in controls and subjects sampled before and after administration of the Kampo formula hangekobokuto (HKT) and mapped IR changes across conditions.
3.1. Recovery Patterns Reveal “V-Shape” and “Reverse-V-Shape” Ir Loci
Figure 2A (i) & (ii) (from Figure 6A in ref. 20) highlights two reciprocal recovery trends, respectively: loci that show increased intron retention in subjects before treatment relative to controls (IncIR; CON→BMT) tend to shift back toward control-like levels after treatment (BMT→AMT), whereas loci that display decreased intron retention before treatment (DecIR; CON→BMT) tend to increase toward control-like levels after treatment (BMT→AMT). Importantly, Figure 2B,C (from Figure 6B,C in ref.20) formalize these trends as two interpretable recovery motifs:
- Reverse V-shape: loci that increase in IR before treatment (vs control) and decrease after treatment (IncIR → recovery).
- V-shape: loci that decrease in IR before treatment and increase after treatment (DecIR → recovery).
These patterns are not merely descriptive; they provide a practical way to define treatment-responsive IR loci that encode the directionality of homeostatic restoration. In a pharmacodynamic framework, such loci serve as quantitative “dials” for recovery.
3.2. The Recovered Ir Program Is Enriched for Inflammation-Linked Biology
A striking aspect of Figure 2D is the functional composition of the IR loci that normalize with HKT. Table S1 shows updated classification of 64 protein-coding recovery IR genes. The recovered set shows strong representation of inflammation/immune-related categories, alongside cilia, mitochondria, hematopoiesis, and DNA repair/recombination. This supports a coherent mechanistic narrative: HKT improves symptoms and the molecular state, plausibly by dampening peripheral inflammatory/innate immune activation, and IR captures the associated upstream shift in regulated RNA-processing states. This point is particularly valuable for a feature review aimed at “drug response and recovery monitoring.” Rather than asserting a single pathway, the IR readout allows one to frame recovery as multi-layer normalization with a clearly visible inflammatory axis—a biologically plausible route for symptom improvement in an inflammation-linked subtype of depression. This observation naturally raises the next question: do these IR recovery signatures align with the physiological anti-inflammatory and innate-immune–modulating effects previously reported for HKT/BHT in independent experimental systems? [20].
3.3. Convergent Evidence: Ir Recovery Aligns with Physiological Normalization Reported for Hkt/bht
A key question is whether the IR recovery motifs observed after HKT reflect a biologically meaningful restoration of physiological state. Although our dataset does not directly quantify all inflammatory mediators, multiple independent studies report that HKT/BHT dampens inflammatory and innate-immune activation—such as reduced iNOS/NO signaling [31], decreased pro-inflammatory cytokines [32], and suppression of inflammasome-related pathways [33]. Notably, the recovered IR genes include nodes that map onto these axes (e.g., NOSIP for the NO axis, CXCL2 for leukocyte recruitment, IL17RB for IL-17–related inflammatory tone, and OAS2 for innate antiviral programs), and re-annotation of the former “Others” in Figure 6D in ref. 20 further highlights endomembrane/glycosylation themes consistent with inflammatory regulation. Table 1 summarizes representative mechanistic reports and their correspondence to recovered IR genes. Notably, ~18% (13/72) of the recovered IR genes functionally map to innate-immune/inflammatory or NO-related axes, supporting cross-study concordance with reported HKT/BHT-mediated dampening of inflammatory and innate-immune activation. Taken together, these cross-study concordances provide convergent support for the view that IR normalization can serve as a physiologically informative pharmacodynamic readout of recovery, while encouraging future prospective studies that measure IR alongside physiological markers in the same cohort to assess how closely they track and whether they predict outcomes [31,32,33,59,60,61].
3.4. Ir Outperforms Degs as A Recovery Readout in the Same Dataset (With Fold-Enrichment Quantification)
Figure 2E shows recovery signals captured by conventional differential gene expression (DEG), which is compared with those captured by intron retention (IR) (Figure 2B,C) in the same dataset. IR defines sizable, directionally interpretable recovery sets (V-shape and reverse V-shape), whereas the analogous DEG “recovery” sets (up in disease and down after treatment, or the reverse) are comparatively small and show limited concordance. To quantify this contrast beyond visual inspection, we report fold enrichment (observed/expected overlap) for IR- and DEG-defined recovery sets using the expressed gene universe in this dataset as background, with significance assessed by Fisher’s exact test (Figure 2E). Across recovery definitions, IR overlaps (32.55~40.67) are enriched better than DEG overlaps (10.96~10.74), indicating that IR captures a more coherent recovery program within the same sampling and intervention framework [20].
Importantly, the recovered IR gene set and the recovered DEG set show little to no direct gene-level overlap, which is consistent with a layered interpretation rather than a contradiction: IR can modulate effective gene output through RNA-processing decisions without requiring a large net change in steady-state mRNA abundance, while DEGs preferentially report downstream, context- and composition-sensitive outputs in whole blood (Figure 1A). This dataset-level contrast motivates the next question addressed below—how IR-defined state nodes and DEG-defined output genes are coupled within shared biological axes.
3.5. Network Coupling Between Ir-Defined State Nodes and Deg-Defined Outputs (Cytoscape/String)
To visualize potential bridges between IR-defined state nodes and DEG-defined output genes, we constructed a protein–protein interaction network in Cytoscape using STRING, combining recovered IR genes (n = 64) and recovered DEGs (n = 17) (Figure 3). At medium confidence (STRING combined score ≥ 0.4; Figure.3A), recovered IR genes form coherent multi-gene modules that recapitulate major recovery axes highlighted elsewhere in this review, including (i) a mitochondria/ER-linked cluster (e.g., MFN2–ERLIN1–SPG7 with POLR3A–NDUFA5–FOXRED1) [36,37,38], (ii) a genome-integrity cluster (e.g., ZWINT–SMC4–CENPT/REC8 with UBE2T/DDX5) [39,40,41,42], and (iii) a ciliogenesis-related cluster (e.g., AHI1–CEP104–NPHP1) [43,44,45]. In contrast, most recovered DEGs appear peripheral or disconnected at this threshold, consistent with their role as downstream, more context-dependent outputs rather than reusable upstream state-control nodes [34,35].
Notably, a small number of cross-layer links persist even at score ≥ 0.4, providing concrete examples of axis-level coupling. For example, the immune/innate axis is captured by a CXCL2-centered neighborhood that connects to the recovered DEG G0S2 and to OAS2, consistent with chemokine- and interferon-inducible antiviral programs [46,47] and aligning with the “immune/innate” correspondence summarized in our DEG–IR mapping table (Table 2). Similarly, a cytoskeletal/adhesion output gene (DOCK6) connects to an IR-recovered node (EOGT) within the same broader axis [48,49]. These bridges support the view that IR and DEG layers may be coupled through shared pathways even when direct gene overlap is minimal.
To make this correspondence explicit, Table 2 provides a compact DEG–IR cross-walk, mapping recovered DEGs to the nearest IR-recovered module(s) in the STRING network and listing representative IR nodes that define each recovery axis. Only medium-confidence bridges that remain at STRING combined score ≥ 0.4 (Figure 3A) are treated as concrete cross-layer links; lower-confidence edges (Figure 3B) are used only as hypothesis-generating context.
When the threshold is relaxed (score ≥ 0.2; Figure 3B), additional DEG–IR connections emerge. Because these edges are lower-confidence, we treat them as hypothesis-generating and do not base key conclusions on them; however, they can be useful for prioritizing mechanistic follow-up (e.g., testing whether actomyosin-related IR nodes connect to cytoskeletal output genes under specific immune-cell states). Overall, the network analysis complements the fold-enrichment results by providing a structural explanation for a layered architecture: IR changes preferentially mark upstream state-control modules, whereas DEGs report selective downstream outputs, with limited direct overlap but detectable coupling within shared biological axes [1].
This layered view also fits well with the “commander–soldier” analogy we discussed in our recent Research Square preprint [50], in which IRGs behave as multi-process “command-tier” nodes while DEGs more often reflect task-specific downstream outputs. In that study, a Cytoscape/STRING network highlighted the IRG Ucp2 as a layer-bridging node positioned upstream of multiple downstream DEG neighborhoods (Figure 6 in that paper), consistent with an IR-defined homeostatic regulator linking to diverse output routes. This emphasis on Ucp2 is biologically plausible: UCP2 is required for sustained efferocytosis by phagocytes, enabling continued clearance of apoptotic cells and limiting inflammatory spillover that could perturb immune-educational microenvironments such as the thymus [51,52,53]. Accordingly, an IR event on Ucp2 represents a plausible post-transcriptional throttle on efferocytosis-linked immune homeostasis. Complementarily, a gene–concept network (cnetplot) showed that IRGs exhibit higher functional connectivity than DEGs—IRGs more frequently link to multiple GO terms, whereas DEGs tend to occupy more term-restricted neighborhoods (Figure 7 in that paper; e.g., 51.1% vs 27.6% multi-term overlap in our analysis). Together with the present depression recovery network, these observations support a general architectural principle: IR preferentially marks upstream “command-tier” state nodes, whereas DEGs report more selective, context-dependent downstream programs [1].
5. Outliers Are Not Always “Noise”: General Guidance for Ir-Centered Biomarker Analyses
Real-world blood transcriptomes inevitably contain outliers. While some reflect technical failures, others represent biologically meaningful extremes (e.g., infection-like innate activation), as exemplified by PB100 in Figure 4D–F. Importantly, outlier handling can markedly reshuffle DEG-based interpretations, whereas IR recovery motifs/modules often remain directionally interpretable with or without such samples, supporting IR as a robust pharmacodynamic readout in heterogeneous clinical cohorts. This motivates a pragmatic approach for IR-centered biomarker analyses [13]:
- Remove clear technical failures (mapping/QC anomalies, batch artifacts).
- Do not automatically discard biological extremes; treat them as potentially informative heterogeneity.
- Report sensitivity analyses (with and without outliers) and prioritize readouts that remain interpretable under both settings.
- Use IR modules/motifs to interpret outliers, rather than assuming “outlier = noise,” a premise often inherited from DEG-centric workflows.
- Beyond depression: why a homeostatic state variable should generalize to other disorders (including MCI)
Although the evidence base reviewed here is depression-focused, the underlying logic is inherently transdiagnostic: many disorders characterized by chronic stress load, immune–metabolic imbalance, and delayed recovery should manifest measurable deviations in homeostatic regulation. If IR functions as an upstream throttle on effective gene output, it provides a general and mechanistically interpretable biomarker layer for tracking disease burden and therapeutic normalization across conditions.
A particularly stringent test case is early cognitive decline, where sensitive biomarkers are required at the MCI stage to detect risk, monitor progression, and quantify intervention effects before irreversible damage accrues. Critically, MCI is also a setting where peripheral blood is unlikely to directly mirror the primary CNS drivers, making it an ideal stress test for whether IR remains useful when the sampled tissue is biologically distal. We therefore performed a side-by-side DEG and IR re-analysis of a whole-blood RNA-seq MCI cohort (Emory Vascular study; MCI n=99 vs cognitively normal controls n=101) (Figure 5) [62].
In this cohort, DEG analysis produced a strong cross-sectional contrast (>500 DEGs), and enrichment consistently pointed to coordinated repression of ribosome/translation-related programs (Figure 5A,B), aligning with large-scale Japanese blood transcriptome studies from the National Center for Geriatrics and Gerontology reporting early shifts in ribosome/translation modules at the CN→MCI transition [63,64]. By contrast, IR differences were fewer and smaller in amplitude, as expected when blood acts as an indirect reporter rather than the primary site of pathology. However—and this is the key translational point—IR signals were nonetheless robustly detectable when statistical power was adequate: even in this distal context, we still identified 26 significant IR loci (typically ~1–3% ΔIR) (Figure 5C). Moreover, the IR-positive genes mapped to plausible upstream “control knobs” that could gate downstream outputs (e.g., immune signalling: IRF9/STAT6/ICAM3; RNA handling: RBM39/DDX39A; metabolic/mitochondrial control: DGAT1/RHOT2/FTH1).
Together, these results establish a practical, clinically important boundary condition. Depression—where peripheral inflammation can be proximal to pathophysiology—can yield larger and more numerous blood IR signals even in smaller cohorts. In contrast, MCI—where blood is biologically distal—produces weaker IR effects, but these effects become reliably measurable once cohort size is sufficient. This directly supports the central claim that IR/DI profiling remains clinically usable even for disorders in which causality cannot be assigned to blood: what matters is not that blood is the disease’s origin, but that IR captures a quantifiable deviation in systemic/homeostatic regulation that can be detected and tracked (Figure 1B, 5).
6. Concluding Perspective
The central message emerging from the HKT and ketamine case studies is that IR behaves like a controllable homeostatic state variable: it deviates in disease, it normalizes with effective intervention, it stratifies response heterogeneity, and it can reveal plausible mechanistic axes (notably inflammation/innate immune activation) that explain non-response. These properties position IR as an unusually practical biomarker layer for drug response and recovery monitoring in depression, and they motivate broader deployment across disorders where homeostatic dysregulation is central. For broader applications such as MCI-stage cognitive decline—where peripheral blood is a more distal reporter and cross-sectional IR/DI effects may be modest—adequately powered cohorts can still detect reproducible IR/DI shifts, while the greatest clinical value will likely emerge in longitudinal, within-individual monitoring that quantifies intervention engagement and recovery trajectories rather than relying on baseline case–control separation alone.
Supplementary Materials
The following supporting information can be downloaded at the website of this paper posted on Preprints.org.
Author Contributions
N.O.: conceptualization, funding acquisition, project administration, validation, visualization, writing—review & editing. K.O.: data curation, formal analysis, methodology, writing of methods. A.M.: formal analysis, methodology, A.N: formal analysis, methodology, Y.K.: project administration.
Funding
This study was supported by a research grant from Tsumura and Co. to N.O.
Data Availability Statement
The raw RNA-seq datasets used in this study can be downloaded from the DDBJ Sequence Read Archive under accession numbers DRR540207–; DRR540228, which are linked to the BioProject accession number PRJDB17815 (Okada et al. 2024), the NCBI Gene Expression Omnibus (GEO) under accession number GSE185855 (Okada et al. 2025), and https://www.synapse.org/Synapse:syn18909507 (Emory Vascular study).
Conflicts of Interest
N.O., K.O., and A.M. were supported by a research grant from Tsumura & Co. A.N is an employee of Tsumura & Co. The remaining author declares that the research was conducted in the absence of any commercial or financial relationships that could be construed as potential conflicts of interest.
References
- Okada, N; Maruko, A; Oshima, K; Nishi, A; Kobayashi, Y. The IR-Homeostat Hypothesis: Intron Retention as an Evolutionarily Conserved Fine-Tuning Layer and a Reversible Blood Biomarker of Homeostatic Dysregulation in Mood Disorders. Int. J. Mol. Sci. 2026. [Google Scholar]
- World Health Organization. Depression and other common mental disorders: global health estimates; World Health Organization: Geneva, 2017. [Google Scholar]
- Howren, MB; Lamkin, DM; Suls, J. Associations of depression with C-reactive protein, IL-1, and IL-6: a meta-analysis. Psychosom Med. 2009, 71, 171–186. [Google Scholar] [CrossRef]
- Dowlati, Y; Herrmann, N; Swardfager, W; Liu, H; Sham, L; Reim, EK; et al. A meta-analysis of cytokines in major depression. Biol Psychiatry 2010, 67, 446–457. [Google Scholar] [CrossRef] [PubMed]
- Haapakoski, R; Mathieu, J; Ebmeier, KP; Alenius, H; Kivimaki, M. Cumulative meta-analysis of interleukins 6 and 1beta, tumour necrosis factor alpha and C-reactive protein in patients with major depressive disorder. Brain Behav Immun. 2015, 49, 206–215. [Google Scholar] [CrossRef] [PubMed]
- Bullmore, E. The Inflamed Mind: A Radical New Approach to Depression; Short Books: London, 2018. [Google Scholar]
- Khandaker, GM; Pearson, RM; Zammit, S; Lewis, G; Jones, PB. Association of serum interleukin 6 and C-reactive protein in childhood with depression and psychosis in young adult life: a population-based longitudinal study. JAMA Psychiatry 2014, 71, 1121–1128. [Google Scholar] [CrossRef]
- Prather, AA; Rabinovitz, M; Pollock, BG; Lotrich, FE. Cytokine-induced depression during IFN-alpha treatment: the role of IL-6 and sleep quality. Brain Behav Immun. 2009, 23, 1109–1116. [Google Scholar] [CrossRef]
- Raison, CL; Rutherford, RE; Woolwine, BJ; Shuo, C; Schettler, P; Drake, DF; et al. A randomized controlled trial of the tumor necrosis factor antagonist infliximab for treatment-resistant depression: the role of baseline inflammatory biomarkers. JAMA Psychiatry 2013, 70, 31–41. [Google Scholar] [CrossRef]
- Hori, H; Sasayama, D; Teraishi, T; Yamamoto, N; Nakamura, S; Ota, M; et al. Blood-based gene expression signatures of medication-free outpatients with major depressive disorder: integrative genome-wide and candidate gene analyses. Sci Rep. 2016, 6, 18776. [Google Scholar] [CrossRef]
- Begley, CG; Ellis, LM. Drug development: Raise standards for preclinical cancer research. Nature 2012, 483, 531–533. [Google Scholar] [CrossRef]
- Baker, M. 1,500 scientists lift the lid on reproducibility. Nature 2016, 533, 452–454. [Google Scholar] [CrossRef]
- Leek, JT; Scharpf, RB; Bravo, HC; Simcha, D; Langmead, B; Johnson, WE; et al. Tackling the widespread and critical impact of batch effects in high-throughput data. Nat Rev Genet. 2010, 11, 733–739. [Google Scholar] [CrossRef] [PubMed]
- Jaffe, AE; Irizarry, RA. Accounting for cellular heterogeneity is critical in epigenome-wide association studies. Genome Biol. 2014, 15, R31. [Google Scholar] [CrossRef]
- Houseman, EA; Accomando, WP; Koestler, DC; Christensen, BC; Marsit, CJ; Nelson, HH; et al. DNA methylation arrays as surrogate measures of cell mixture distribution. BMC Bioinformatics 2012, 13, 86. [Google Scholar] [CrossRef]
- Okada, N; Oshima, K; Iwasaki, Y; Maruko, A; Matsumura, K; Iioka, E; et al. Intron retention as a new pre-symptomatic marker of aging and its recovery to the normal state by a traditional Japanese multi-herbal medicine. Gene 2021, 794, 145752. [Google Scholar] [CrossRef]
- Vu, TD; Ito, N; Oshima, K; Maruko, A; Nishi, A; Mizoguchi, K; Odaguchi, H; Kobayashi, Y; Okada, N. Intron retention is a stress response in sensor genes and is restored by Japanese herbal medicines: A basis for future clinical applications. Gene 2022, 830, 146496. [Google Scholar] [CrossRef]
- Wong, JJL; Schmitz, U. Intron retention: importance, challenges, and opportunities. Trends Genet. 2022, 38, 789–792. [Google Scholar] [CrossRef]
- Monteuuis, G; Wong, JJL; Bailey, CG; Schmitz, U; Rasko, JEJ. The changing paradigm of intron retention: regulation, ramifications and recipes. Nucleic Acids Res. 2019, 47, 11497–11513. [Google Scholar] [CrossRef]
- Okada, N; Oshima, K; Maruko, A; Sekine, M; Ito, N; Wakasugi, A; et al. Intron retention as an excellent marker for diagnosing depression and for discovering new potential pathways for drug intervention. Front Psychiatry 2024, 15, 1450708. [Google Scholar] [CrossRef] [PubMed]
- Okada, N; Oshima, K; Maruko, A; Kobayashi, Y. Intron retention: a novel method for evaluating the response to ketamine in patients with treatment-resistant depression. npj Ment Health Res. 2025, 4, 44. [Google Scholar] [CrossRef] [PubMed]
- Boutz, PL; Bhutkar, A; Sharp, PA. Detained introns are a novel, widespread class of post-transcriptionally spliced introns. Genes Dev. 2015, 29, 63–80. [Google Scholar] [CrossRef]
- Mauger, O; Lemoine, F; Scheiffele, P. Targeted intron retention and excision for rapid gene regulation in response to neuronal activity. Neuron 2016, 92, 1266–1278. [Google Scholar] [CrossRef]
- Tan, ZW; Fei, G; Paulo, JA; Bellaousov, S; Martin, SES; Duveau, DY; et al. O-GlcNAc regulates gene expression by controlling detained intron splicing. Nucleic Acids Res. 2020, 48, 5656–5669. [Google Scholar] [CrossRef] [PubMed]
- Wong, JJL; Ritchie, W; Ebner, OA; Selbach, M; Wong, JWH; Huang, Y; et al. Orchestrated intron retention regulates normal granulocyte differentiation. Cell. 2013, 154, 583–595. [Google Scholar] [CrossRef] [PubMed]
- Pimentel, H; Parra, M; Gee, SL; Mohandas, N; Pachter, L; Conboy, JG. A dynamic intron retention program enriched in RNA processing genes regulates gene expression during terminal erythropoiesis. Nucleic Acids Res. 2016, 44, 838–851. [Google Scholar] [CrossRef]
- Naro, C; Jolly, A; Di Persio, S; Bielli, P; Setterblad, N; Alberdi, AJ; et al. An orchestrated intron retention program in meiosis controls timely usage of transcripts during germ cell differentiation. Dev Cell. 2017, 41, 82–93.e4. [Google Scholar] [CrossRef]
- Ullrich, S; Guigó, R. Dynamic changes in intron retention are tightly associated with regulation of splicing factors and proliferative activity during B-cell development. Nucleic Acids Res. 2020, 48, 1327–1340. [Google Scholar] [CrossRef]
- Cathomas, F; Bevilacqua, L; Ramakrishnan, A; Kronman, H; Costi, S; Schneider, M; et al. Whole blood transcriptional signatures associated with rapid antidepressant response to ketamine in patients with treatment resistant depression. Transl Psychiatry 2022, 12, 12. [Google Scholar] [CrossRef]
- Zhang, D; Ji, Y; Chen, X; Chen, R; Wei, Y; Peng, Q; et al. Peripheral blood circular RNAs as a biomarker for major depressive disorder and prediction of possible pathways. Front Neurosci. 2022, 16, 844422. [Google Scholar] [CrossRef] [PubMed]
- Endo, M; Oikawa, T; Tonooka, M; Hanawa, T; Odaguchi, H; Hori, M. Hangekobokuto, a traditional Japanese herbal medicine, ameliorates postoperative ileus through its anti-inflammatory action. J Smooth Muscle Res. 2022, 58, 78–88. [Google Scholar] [CrossRef]
- Liu, L; Zhang, R; Chen, C; Xia, C; Yao, G; He, X; et al. The effect of Banxia-houpo decoction on CUMS-induced depression by promoting M2 microglia polarization via TrkA/Akt signalling. J Cell Mol Med. 2023, 27, 3339–3353. [Google Scholar] [CrossRef]
- Jia, KK; Zheng, YJ; Zhang, YX; Liu, JH; Jiao, RQ; Pan, Y; Kong, LD. Banxia-houpu decoction restores glucose intolerance in CUMS rats through improvement of insulin signaling and suppression of NLRP3 inflammasome activation in liver and brain. J Ethnopharmacol. 2017, 209, 219–229. [Google Scholar] [CrossRef] [PubMed]
- Shannon, P; Markiel, A; Ozier, O; Baliga, NS; Wang, JT; Ramage, D; Amin, N; Schwikowski, B; Ideker, T. Cytoscape: a software environment for integrated models of biomolecular interaction networks. Genome Res. 2003, 13, 2498–2504. [Google Scholar] [CrossRef]
- Szklarczyk, D; Gable, AL; Nastou, KC; Lyon, D; Kirsch, R; Pyysalo, S; Doncheva, NT; Legeay, M; Fang, T; Bork, P; Jensen, LJ; von Mering, C. The STRING database in 2021: customizable protein-protein networks, and functional characterization of user-uploaded gene/measurement sets. Nucleic Acids Res. 2021, 49(D1), D605–D612. [Google Scholar] [CrossRef]
- de Brito, OM; Scorrano, L. Mitofusin 2 tethers endoplasmic reticulum to mitochondria. Nature 2008, 456, 605–610. [Google Scholar] [CrossRef]
- Gao, X; Bonzerato, CG; Wojcikiewicz, RJH. Binding of the erlin1/2 complex to the third intralumenal loop of IP3R1 triggers its ubiquitin-proteasomal degradation. J Biol Chem. 2022, 298, 102026. [Google Scholar] [CrossRef]
- Fassone, E; Duncan, AJ; Taanman, JW; et al. FOXRED1, encoding an FAD-dependent oxidoreductase complex-I-specific molecular chaperone, is mutated in infantile-onset mitochondrial encephalopathy. Hum Mol Genet. 2010, 19, 4837–4847. [Google Scholar] [CrossRef] [PubMed]
- Machida, YJ; Machida, Y; Chen, Y; et al. UBE2T is the E2 in the Fanconi anemia pathway and undergoes negative autoregulation. Mol Cell. 2006, 23, 589–596. [Google Scholar] [CrossRef]
- Seo, DW; You, SY; Chung, WJ; et al. Zwint-1 is required for spindle assembly checkpoint function and kinetochore-microtubule attachment during oocyte meiosis. Sci Rep. 2015, 5, 15431. [Google Scholar] [CrossRef]
- Freeman, L; Aragon-Alcaide, L; Strunnikov, A. The condensin complex governs chromosome condensation and mitotic transmission of rDNA. J Cell Biol. 2000, 149, 811–824. [Google Scholar] [CrossRef]
- Huis In't Veld, PJ; Volkov, VA; Stender, ID; et al. Molecular basis of outer kinetochore assembly on CENP-T. eLife 2016, 5, e21007. [Google Scholar] [CrossRef]
- Hsiao, YC; Tong, ZJ; Westfall, JE; et al. Ahi1, whose human ortholog is mutated in Joubert syndrome, is required for Rab8a localization, ciliogenesis and vesicle trafficking. Hum Mol Genet. 2009, 18, 3926–3941. [Google Scholar] [CrossRef]
- Frikstad, KAM; Molinari, E; Thoresen, M; et al. A CEP104-CSPP1 complex is required for formation of primary cilia competent in Hedgehog signaling. Cell Rep. 2019, 28, 1907–1922.e6. [Google Scholar] [CrossRef] [PubMed]
- Hildebrandt, F; Zhou, W. Nephronophthisis-associated ciliopathies. J Am Soc Nephrol. 2007, 18, 1855–1871. [Google Scholar] [CrossRef] [PubMed]
- Capucetti, A; Albano, F; Bonecchi, R. Multiple roles for chemokines in neutrophil biology. Front Immunol. 2020, 11, 1259. [Google Scholar] [CrossRef]
- Schwartz, SL; Conn, GL. RNA regulation of the antiviral protein 2'-5'-oligoadenylate synthetase. Wiley Interdiscip Rev RNA 2019, 10, e1534. [Google Scholar] [CrossRef] [PubMed]
- Miyamoto, Y; Yamauchi, J; Sanbe, A; Tanoue, A. Dock6, a Dock-C subfamily guanine nucleotide exchanger, has the dual specificity for Rac1 and Cdc42 and regulates neurite outgrowth. Exp Cell Res. 2007, 313, 791–804. [Google Scholar] [CrossRef]
- Müller, R; Jenny, A; Stanley, P. The EGF Repeat-Specific O-GlcNAc-Transferase Eogt Interacts with Notch Signaling and Pyrimidine Metabolism Pathways in Drosophila. PLoS ONE 2013, 8, e62835. [Google Scholar] [CrossRef]
- Okada, N; Oshima, K; Maruko, A; Miki, R; Iwasaki, Y; Kobayashi, Y. Intron retention resolves microgravity and non-gravitational stress programs across immune organs in spaceflight. Research Square [Preprint]. [CrossRef]
- Park, D; Han, CZ; Elliott, MR; et al. Continued clearance of apoptotic cells critically depends on the phagocyte Ucp2 protein. Nature 2011, 477, 220–224. [Google Scholar] [CrossRef]
- Klein, L; Kyewski, B; Allen, PM; Hogquist, KA. Positive and negative selection of the T cell repertoire: what thymocytes see (and don't see). Nat Rev Immunol. 2014, 14, 377–391. [Google Scholar] [CrossRef]
- Zhou, TA; et al. Thymic macrophages consist of two populations with distinct localization and origin. Elife 2022, 11, e75148. [Google Scholar] [CrossRef] [PubMed]
- Freedman, JE. The aspirin resistance controversy: clinical entity or platelet heterogeneity? Circulation 2006, 113, 2865–2867. [Google Scholar] [CrossRef] [PubMed]
- Fitzgerald, R; Pirmohamed, M. Aspirin resistance: effect of clinical, biochemical and genetic factors. Pharmacol Ther. 2011, 130, 213–225. [Google Scholar] [CrossRef]
- da Silva, GF; Lopes, BM; Moser, V; Ferreira, LE. Impact of pharmacogenetics on aspirin resistance: a systematic review. Arq Neuropsiquiatr. 2023, 81, 62–73. [Google Scholar] [CrossRef]
- Maree, AO; Curtin, RJ; Chubb, A; et al. Cyclooxygenase-1 haplotype modulates platelet response to aspirin. J Thromb Haemost. 2005, 3, 2340–2345. [Google Scholar] [CrossRef]
- Li, CX; Sun, LC; Wang, YQ; et al. The associations of candidate gene polymorphisms with aspirin resistance in patients with ischemic disease: a meta-analysis. Hum Genomics 2024, 18, 135. [Google Scholar] [CrossRef]
- Mihara, T; Mikawa, S; Kaji, N; Endo, M; Oikawa, T; Jan, TR; Ozaki, H; Hori, M. Therapeutic action of honokiol on postoperative ileus via downregulation of iNOS gene expression. Inflammation 2017, 40, 1331–1341. [Google Scholar] [CrossRef]
- Yang, HN; Peng, Q; Shuang, R; Guo, Z; Yang, H; Chen, C; Tao, W; Liu, L. Banxia Houpo Decoction reduces lysosomal leakage of prefrontal astrocytes through the OGT-CTSB-NLRP3 pathway to improve depressive-like behaviors. J Ethnopharmacol. Epub. 2026, 359, 121024. [Google Scholar] [CrossRef]
- Kwon, HJ; Seung, HB; Tran, KN; Yang, IJ; Kim, SH. Efficacy and mechanism of Chinese herbal medicine Banxia-Houpo-Tang for depression: a meta-analysis and network pharmacology analysis. Tradit Med Res. 2025, 10, 26. [Google Scholar] [CrossRef]
- AD Knowledge Portal. The Emory_Vascular Study (Emory_Vascular; syn18909507). Available online: https://adknowledgeportal.synapse.org/Explore/Studies/DetailsPage/StudyDetails?Study=syn18909507 (accessed on 2026 Feb 18).
- Yamakawa, A; Suganuma, M; Mitsumori, R; Niida, S; Ozaki, K; Shigemizu, D; et al. Alzheimer’s disease may develop from changes in the immune system, cell cycle, and protein processing following alterations in ribosome function. Sci Rep. 2025, 15, 3838. [Google Scholar] [CrossRef] [PubMed]
- Shigemizu, D; Mori, T; Akiyama, S; Higaki, S; Watanabe, H; Sakurai, T; Niida, S; Ozaki, K. Identification of potential blood biomarkers for early diagnosis of Alzheimer’s disease through RNA sequencing analysis. Alzheimers Res Ther. 2020, 12, 87. [Google Scholar] [CrossRef] [PubMed]
Figure 1.
Conceptual framework for intron retention (IR) as a homeostatic state variable for pharmacodynamic monitoring, and its cross-cohort robustness relative to DEG outputs. (A) Positioning of IR relative to conventional differential gene expression (DEG): IR reports an upstream RNA-processing layer that shapes effective gene output, whereas DEGs represent downstream abundance outputs that are often more context- and composition-sensitive in whole blood. (B) The “throttle/IR-Homeostat” model: increased intron retention (IncIR) acts as a reversible brake on effective gene output by reducing the pool of mature, export- and translation-competent mRNAs, while decreased intron retention (DecIR) releases this brake to facilitate recovery of gene output. (C) Cross-cohort reproducibility of IR programs: Venn diagram showing overlap of IR genes defined as IncIR+DecIR across three independent depression blood RNA-seq cohorts (this study and two external cohorts), with fold enrichment (observed/expected overlap) and Fisher’s exact test p-values (left). Corresponding cross-cohort overlap analysis for DEGs (up+down) across the same cohorts, showing markedly weaker or depleted overlap relative to expectation (right). Abbreviations: IR, intron retention; DEG, differential gene expression; IncIR, increased intron retention; DecIR, decreased intron retention. Source/License: Panels D–E are adapted from Okada et al., Frontiers in Psychiatry (2024) 15:1450708, doi:10.3389/fpsyt.2024.1450708 (original Figure.8D–E), used under the Creative Commons Attribution (CC BY 4.0)license. Panels A–C were created for this review.
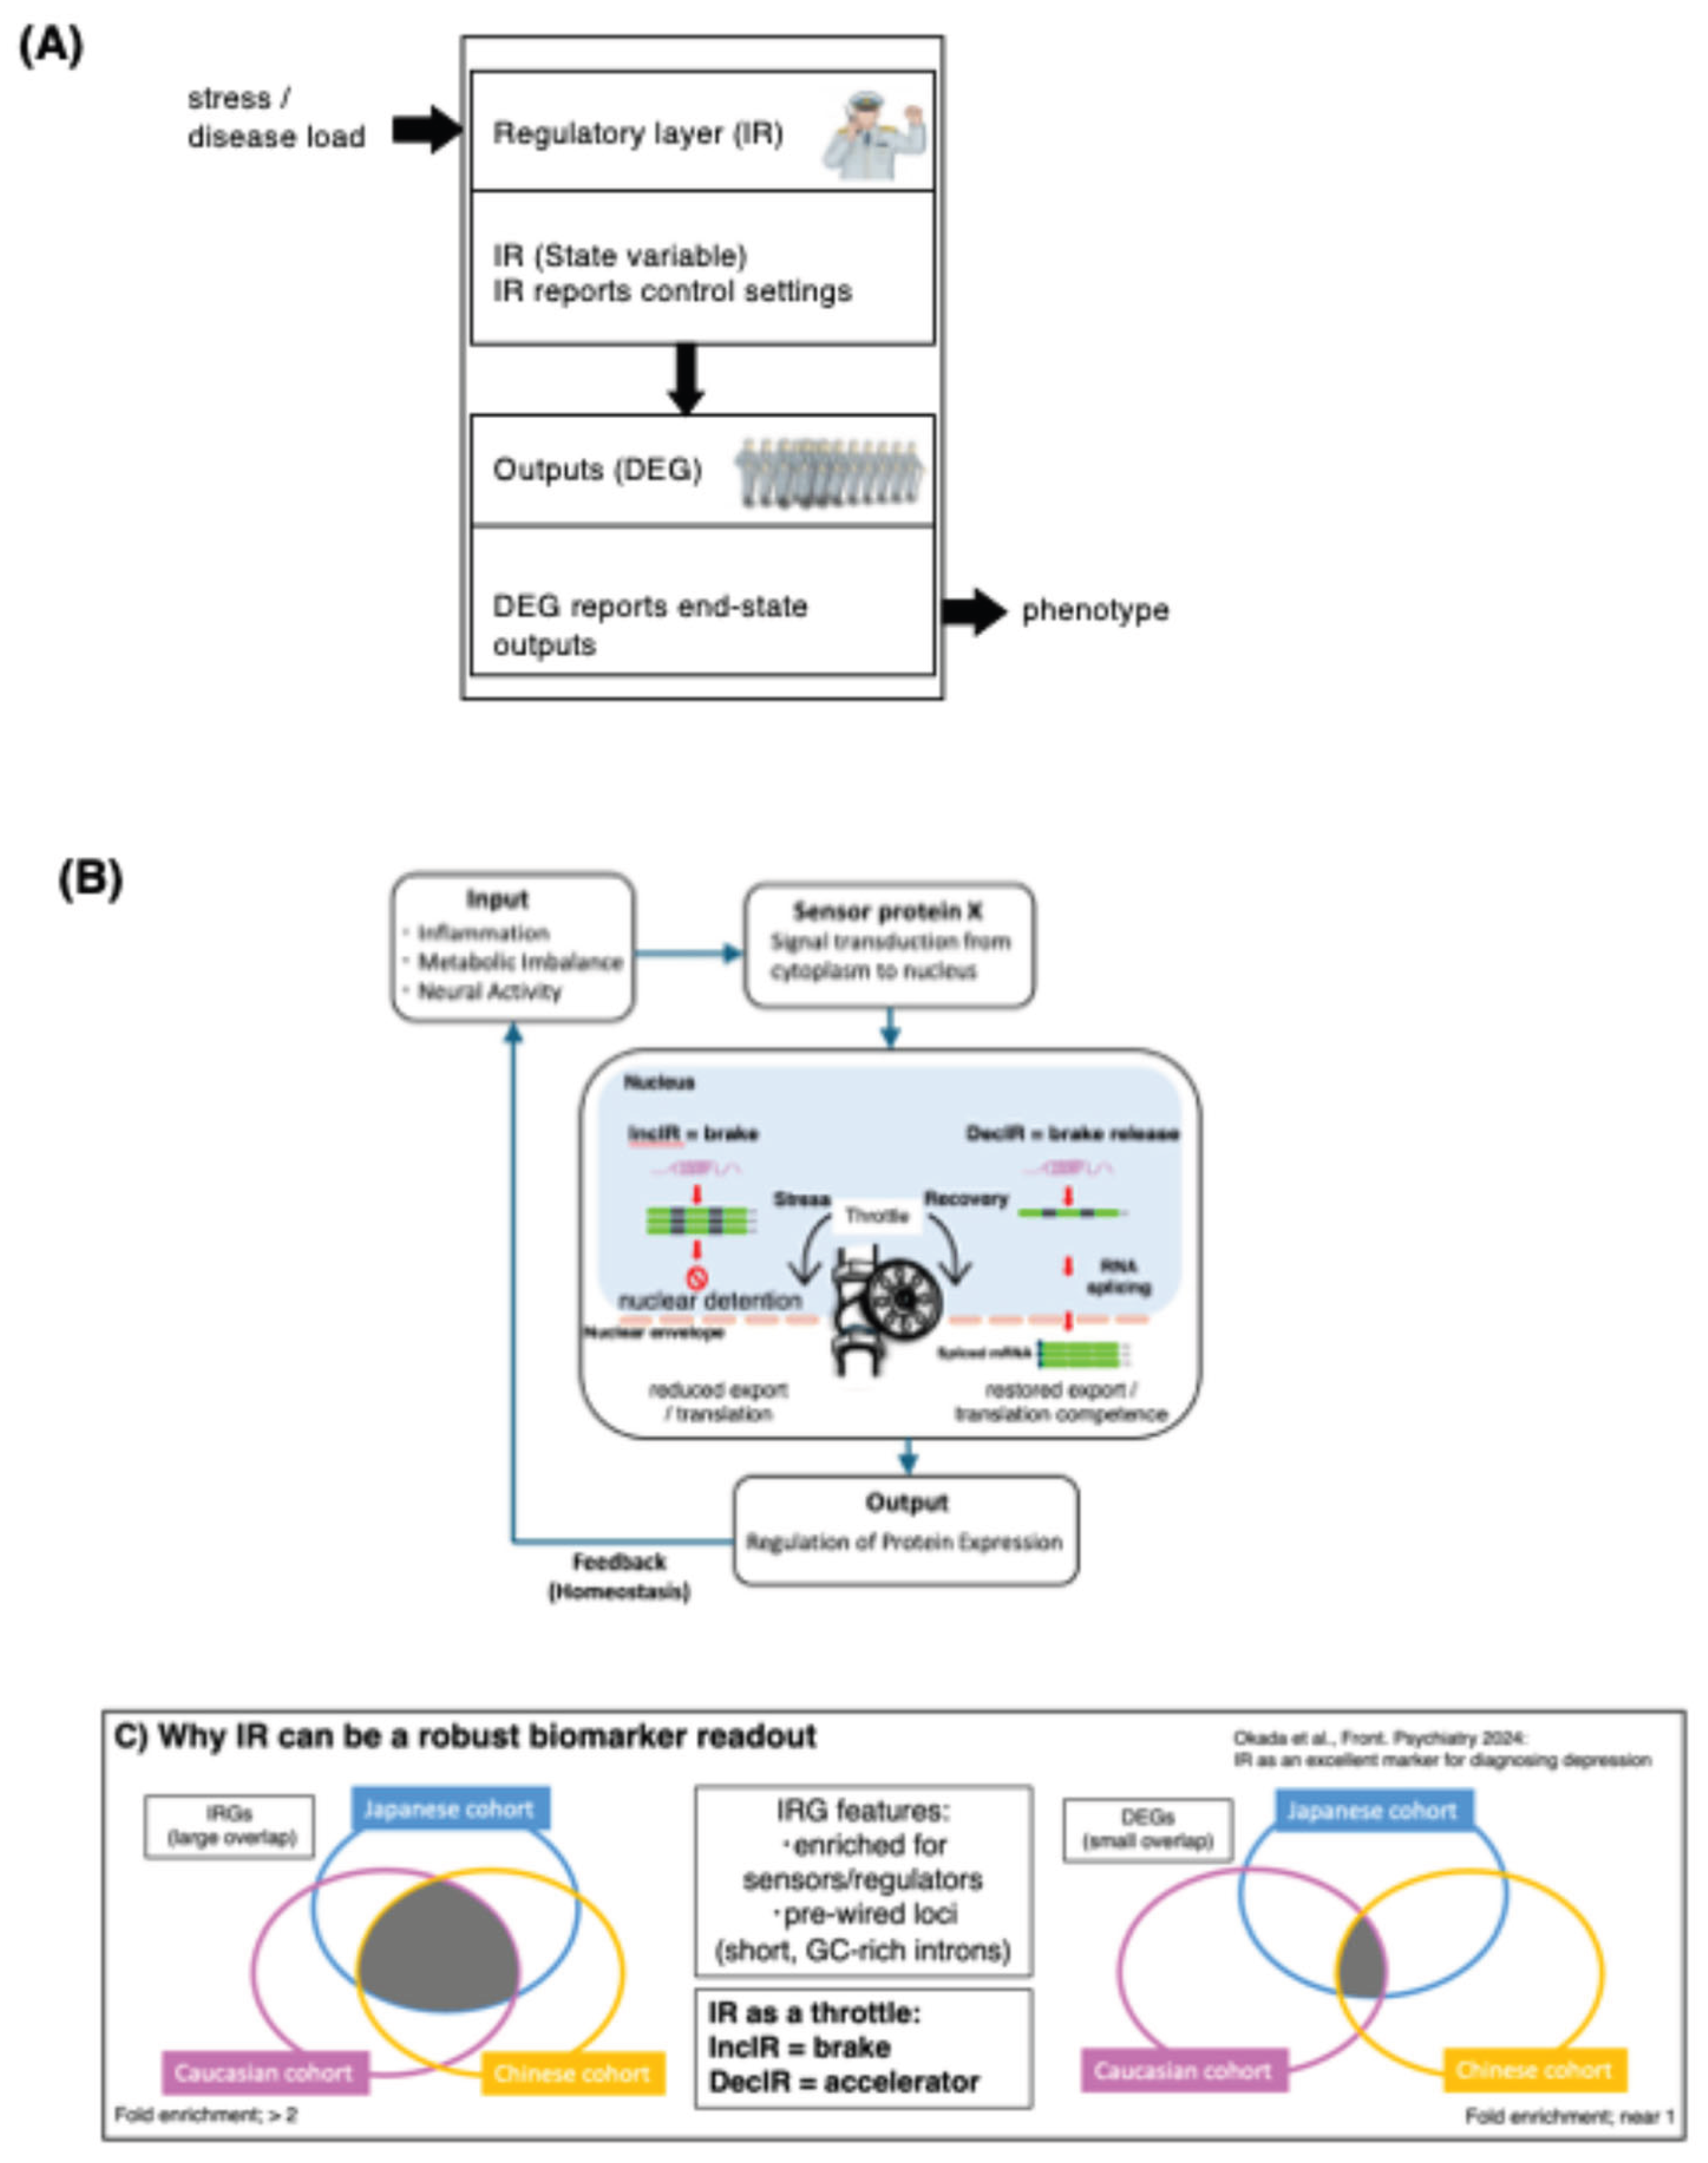
Figure 2.
The Kampo formula hangekobokuto (HKT) normalizes intron-retention programs in peripheral blood and defines directional IR recovery motifs. (A) Global recovery trends across significant IR loci. Loci showing increased intron retention in patients before treatment relative to controls (IncIR; CON→BMT) (i) and loci showing decreased intron retention (DecIR; CON→BMT) (ii) are tracked across CON, BMT, and AMT. Grey lines indicate individual loci; boxplots summarize distributions of relative intron-ratio changes. (B) Reverse V-shaped recovery loci. Venn diagram showing overlap between IncIR loci (CON→BMT) and loci that show decreased IR after treatment (BMT→AMT); the overlap defines reverse V-shaped recovery loci. Gene symbols are listed, and a representative PSI summary across CON/BMT/AMT with a schematic motif is shown. (C) V-shaped recovery loci. Venn diagram showing overlap between DecIR loci (CON→BMT) and loci that show increased IR after treatment (BMT→AMT); the overlap defines V-shaped recovery loci. Gene list, PSI summary, and motif schematic are shown as in (B). (D) Functional breakdown of recovered protein-coding IR genes (n = 64; 30 from reverse V-shape + 34 from V-shape), categorized by literature-based annotation (DNA repair/recombination, hematopoiesis, mitochondria, cilia, inflammation, and others). Inset: updated annotation of genes previously grouped as “Others” (n = 23), partitioned into genome integrity, ciliogenesis-support (Golgi/glycosylation/trafficking), antiviral/innate-immune, and residual categories (percentages shown within the ‘Others’ subset). (E) Comparison with differential gene expression (DEG) recovery. Venn diagrams identify protein-coding DEGs exhibiting reciprocal “recovery” patterns across CON/BMT/AMT, and a heatmap shows z-scored expression of representative recovery DEGs across samples/groups. Where indicated, fold enrichment was calculated as the observed overlap divided by the expected overlap under independence (|A|×|B|/N), using the total number of evaluated loci/genes (N) in the corresponding analysis as background; p-values were assessed by Fisher’s exact test. Abbreviations: CON, controls; BMT, before medication/treatment (pre-treatment); AMT, after medication/treatment (post-treatment); IR, intron retention; IncIR, increased intron retention; DecIR, decreased intron retention; PSI, percent spliced in; DEG, differentially expressed gene. Source/License: Adapted from Okada et al., Frontiers in Psychiatry (2024) 15:1450708 (original Figure.6), used under the Creative Commons Attribution (CC BY 4.0) license.
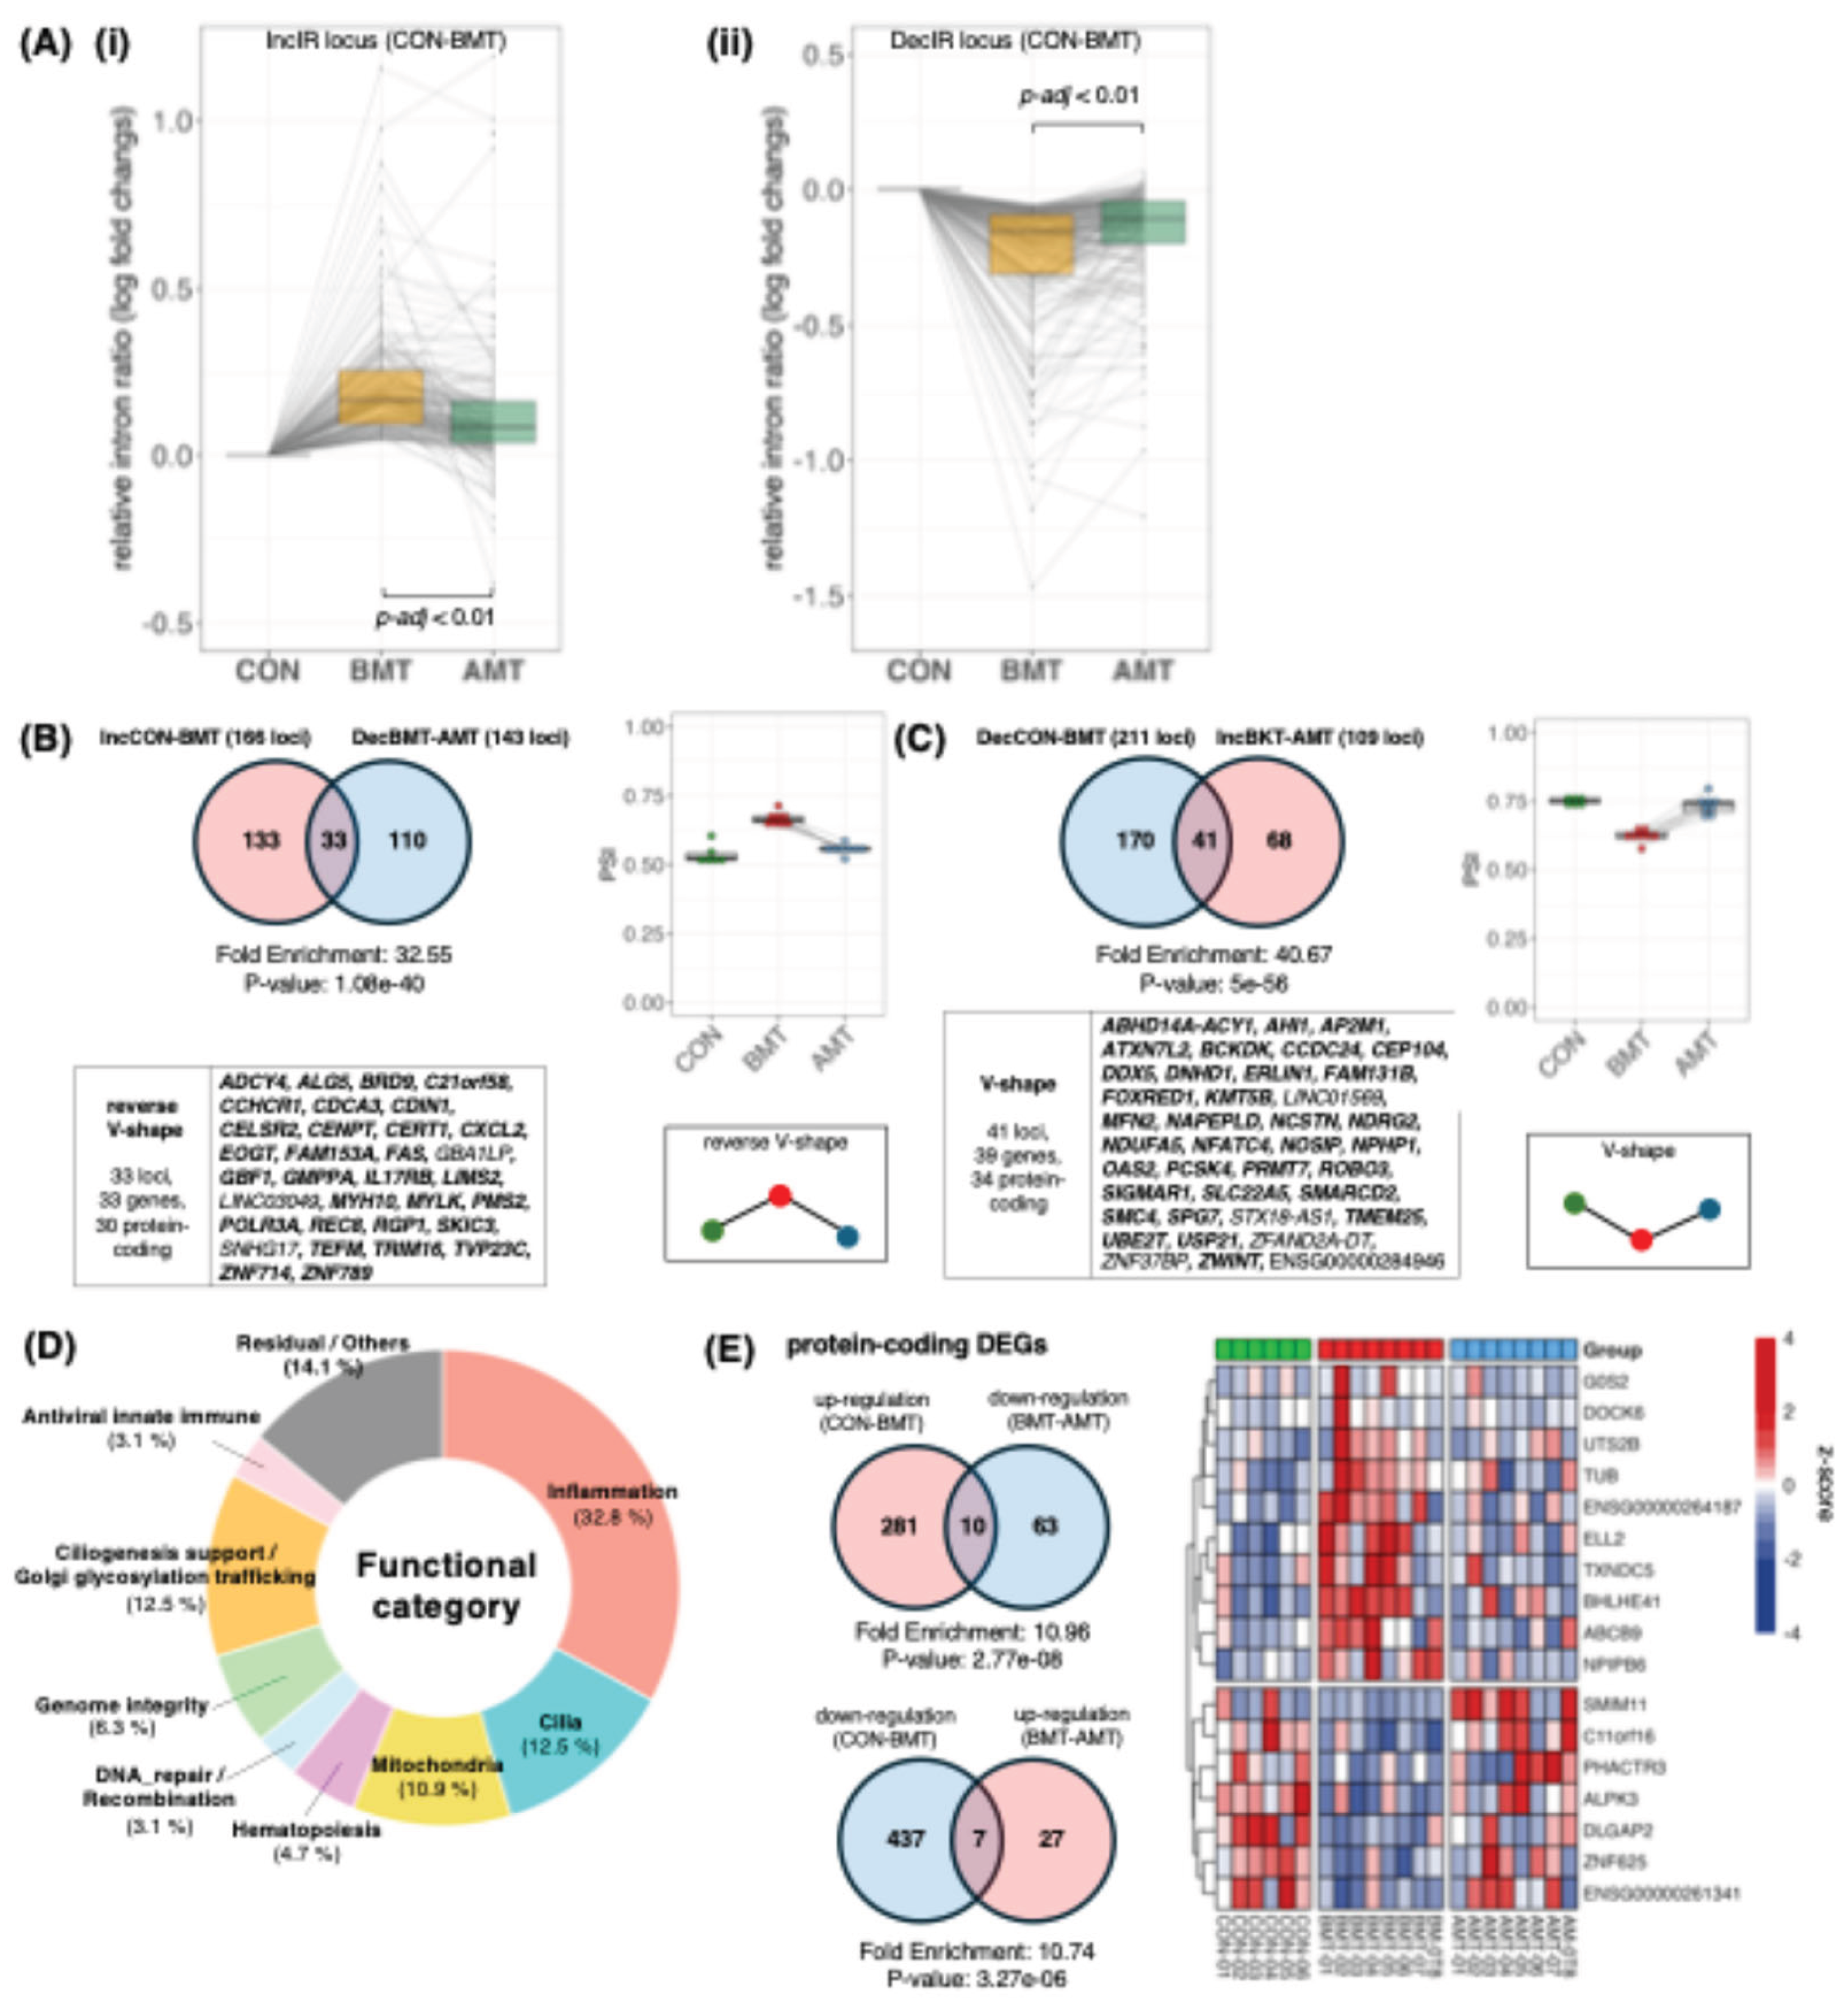
Figure 3.
Cytoscape/STRING network linking recovered IR genes and recovered DEGs. Protein–protein interaction (PPI) networks were constructed in Cytoscape using STRING (Homo sapiens) from the union of recovered IR genes (n = 64, protein-coding recovery IRGs from Figure.2B–C) and recovered DEGs (n = 17, recovery DEGs from Figure.2E). Node size indicates gene class (large nodes, recovered IRGs; small nodes, recovered DEGs). Node color denotes the recovery motif (reverse V-shape vs V-shape, as defined in Figure.2B–C and Figure.2E). Edges indicate STRING functional associations (combined score threshold as specified). (A) Network at combined score ≥ 0.4(primary, medium-confidence view). (B) Network at combined score ≥ 0.2 (expanded, low-confidence view) shown for exploratory context; interactions unique to (B) should be interpreted as hypothesis-generating. Isolated nodes are displayed to indicate recovered genes without STRING-supported connections at the corresponding threshold. Abbreviations: IRG, intron-retention gene; DEG, differentially expressed gene; PPI, protein–protein interaction; STRING, Search Tool for the Retrieval of Interacting Genes/Proteins.
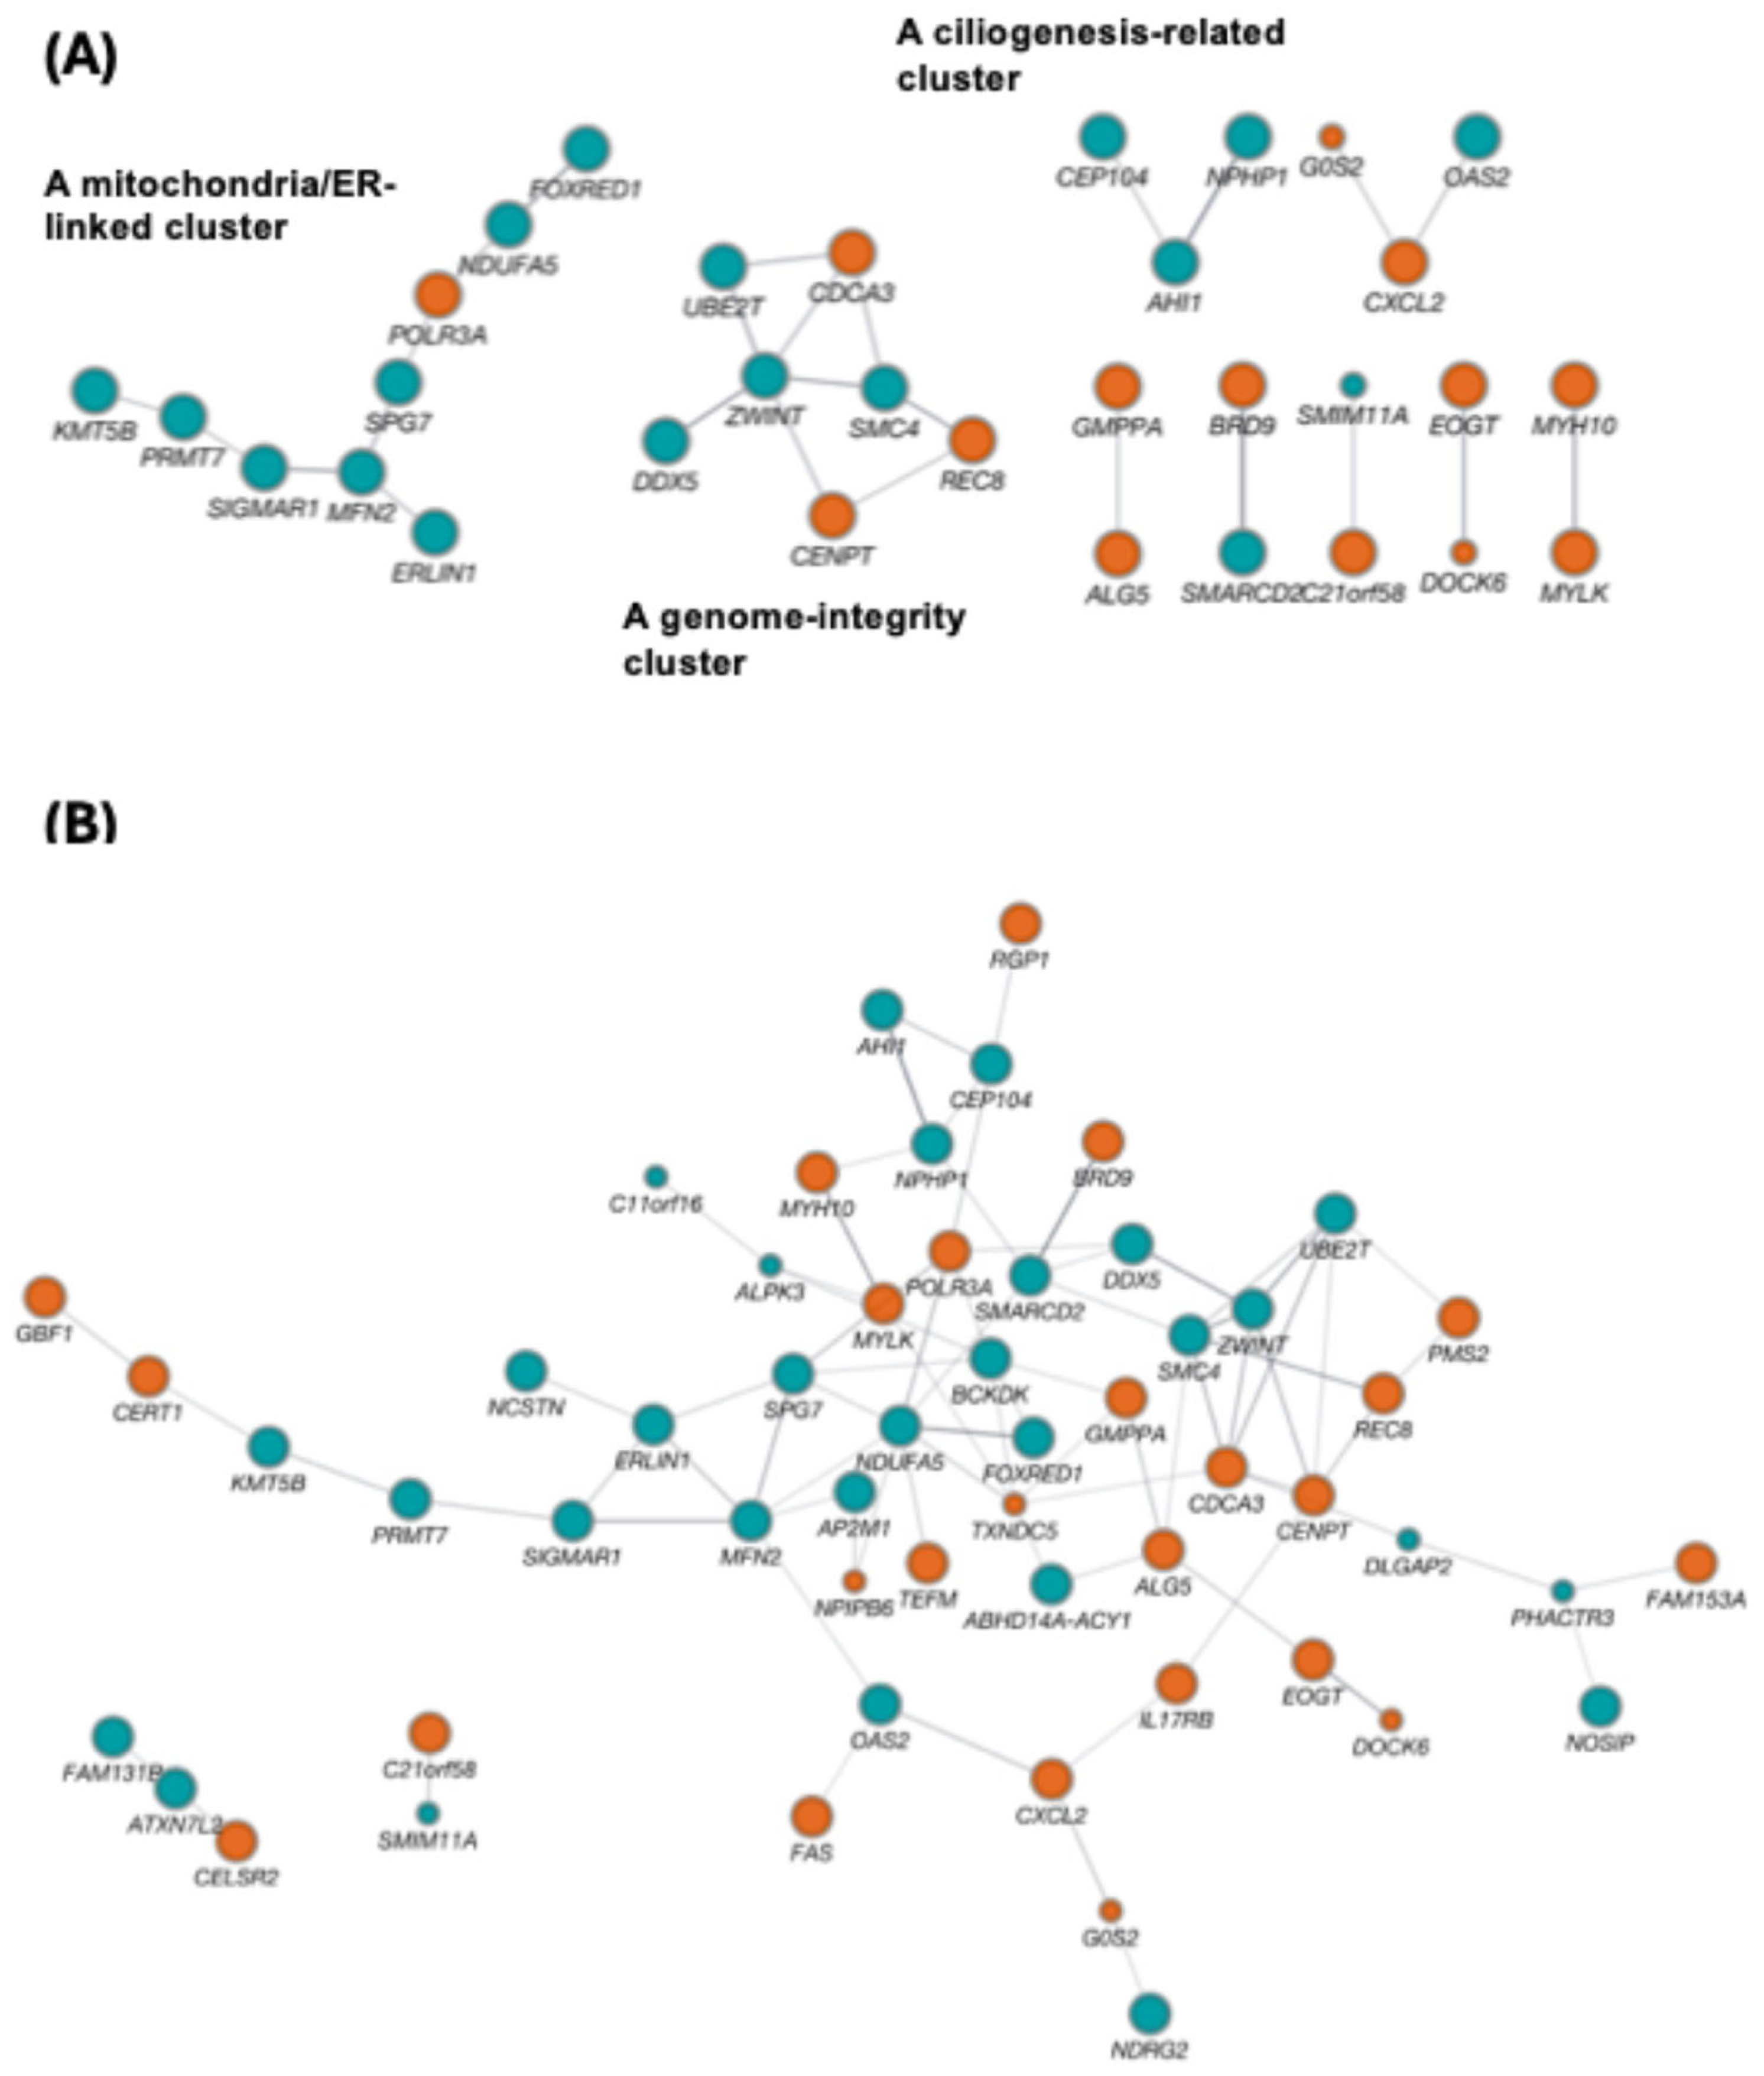
Figure 4.
Ketamine dataset: IR pathway enrichment, IR recovery dynamics, recovery-motif definitions, and outlier sensitivity of expression versus IR readouts. (A) GO Biological Process and KEGG enrichment of merged IncIR+DecIR genes at PRE vs CON for clinically defined non-responders (top) and responders (bottom); bars indicate −log10(p-value) (GO in blue, KEGG in orange; innate-immunity–related terms are bolded as shown). (B) Box-and-whisker plots showing distributions of relative intron-ratio changes for IncIR loci (CON→PRE) and DecIR loci (CON→PRE) across CON, PRE, and POST, shown separately for non-responders and responders; lines indicate individual loci and adjusted p-values are indicated. (C) Venn diagrams defining recovery motifs in each clinical group: reverse V-shaped recovery (IncPRE vs CON intersecting DecPOST vs PRE) and V-shaped recovery (DecPRE vs CON intersecting IncPOST vs PRE), with counts shown. (D) Expression heatmap across individuals highlighting a non-responder outlier sample (PB100; labeled “non-Responder_PB100”) with 47 genes showing z-score > 3 in both PRE and POST (gene list shown). (E) Left, enrichment analysis of the 47 PB100–upregulated genes. Right, Venn diagrams comparing overlaps before and after excluding PB100 for expression-based DEGs and IR-based gene sets. Abbreviations: CON, healthy controls; PRE, pre-treatment (before ketamine); POST, post-treatment (after ketamine); IR, intron retention; IncIR, increased intron retention; DecIR, decreased intron retention; GO, Gene Ontology; DEG, differentially expressed gene.
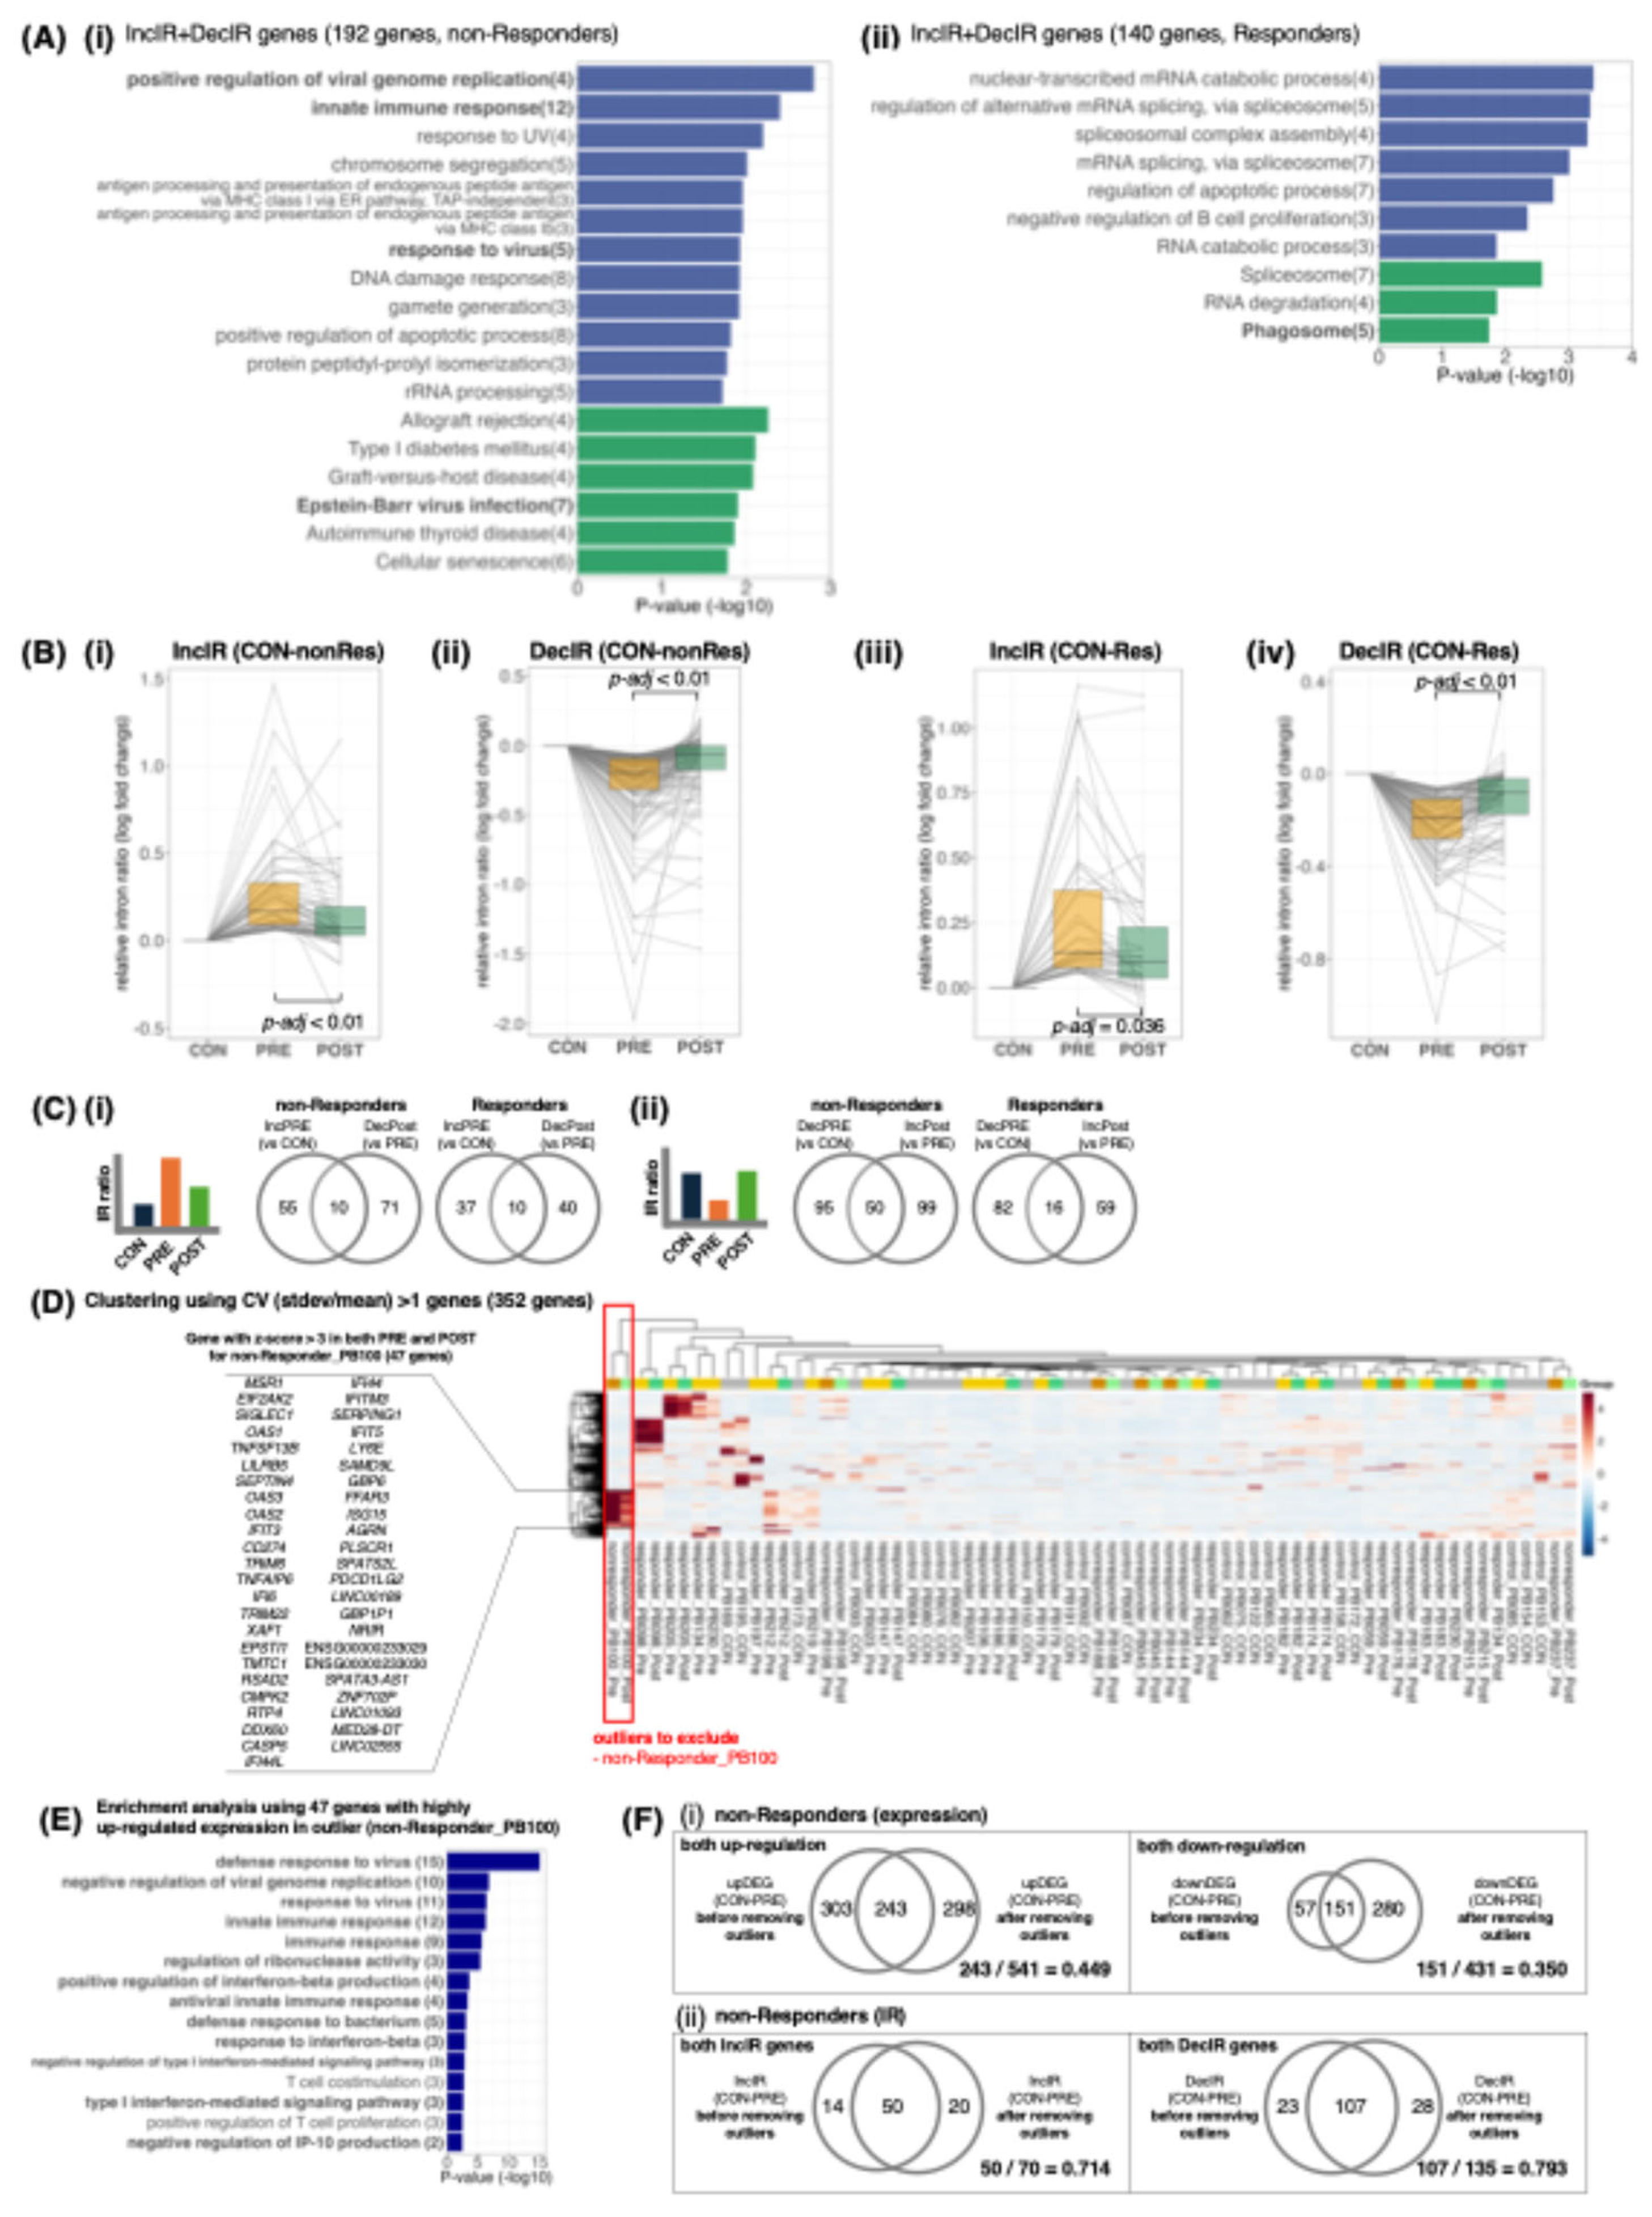
Figure 5.
Emory Vascular whole-blood RNA-seq MCI cohort: IR signals were robustly detectable, although they are subtle, motivating longitudinal pharmacodynamic use of IR/DI. (A) Volcano plot for MCI (n=99) versus cognitively normal controls (n=101): 514 DEGs (326 up, 188 down) at nominal P<0.05 and |FC|>1.2. (B) GSEA of ranked DEGs highlights significantly repressed gene sets related to ribosome/translation (e.g., ribosome biogenesis, ribonucleoprotein complex biogenesis, cytoplasmic translation, and rRNA processing; negative NES with adjusted P values). (C) IR events detected under a lenient cutoff (nominal P<0.05, minCov>10, |ΔIR|>0.01): 20 IncIR and 6 DecIR loci (typically ~1–3% ΔIR); the bar plot shows top IncIR events (largest ΔIR) and all DecIR events. Data source: Emory_Vascular study via the AD Knowledge Portal [62]. Abbreviations: CN, cognitively normal controls; MCI, mild cognitive impairment; DEG, differentially expressed gene; GSEA, gene set enrichment analysis; NES, normalized enrichment score; IR, intron retention; IncIR, increased intron retention; DecIR, decreased intron retention; ΔIR, difference in IR ratio (MCI minus CN); PD, pharmacodynamic.
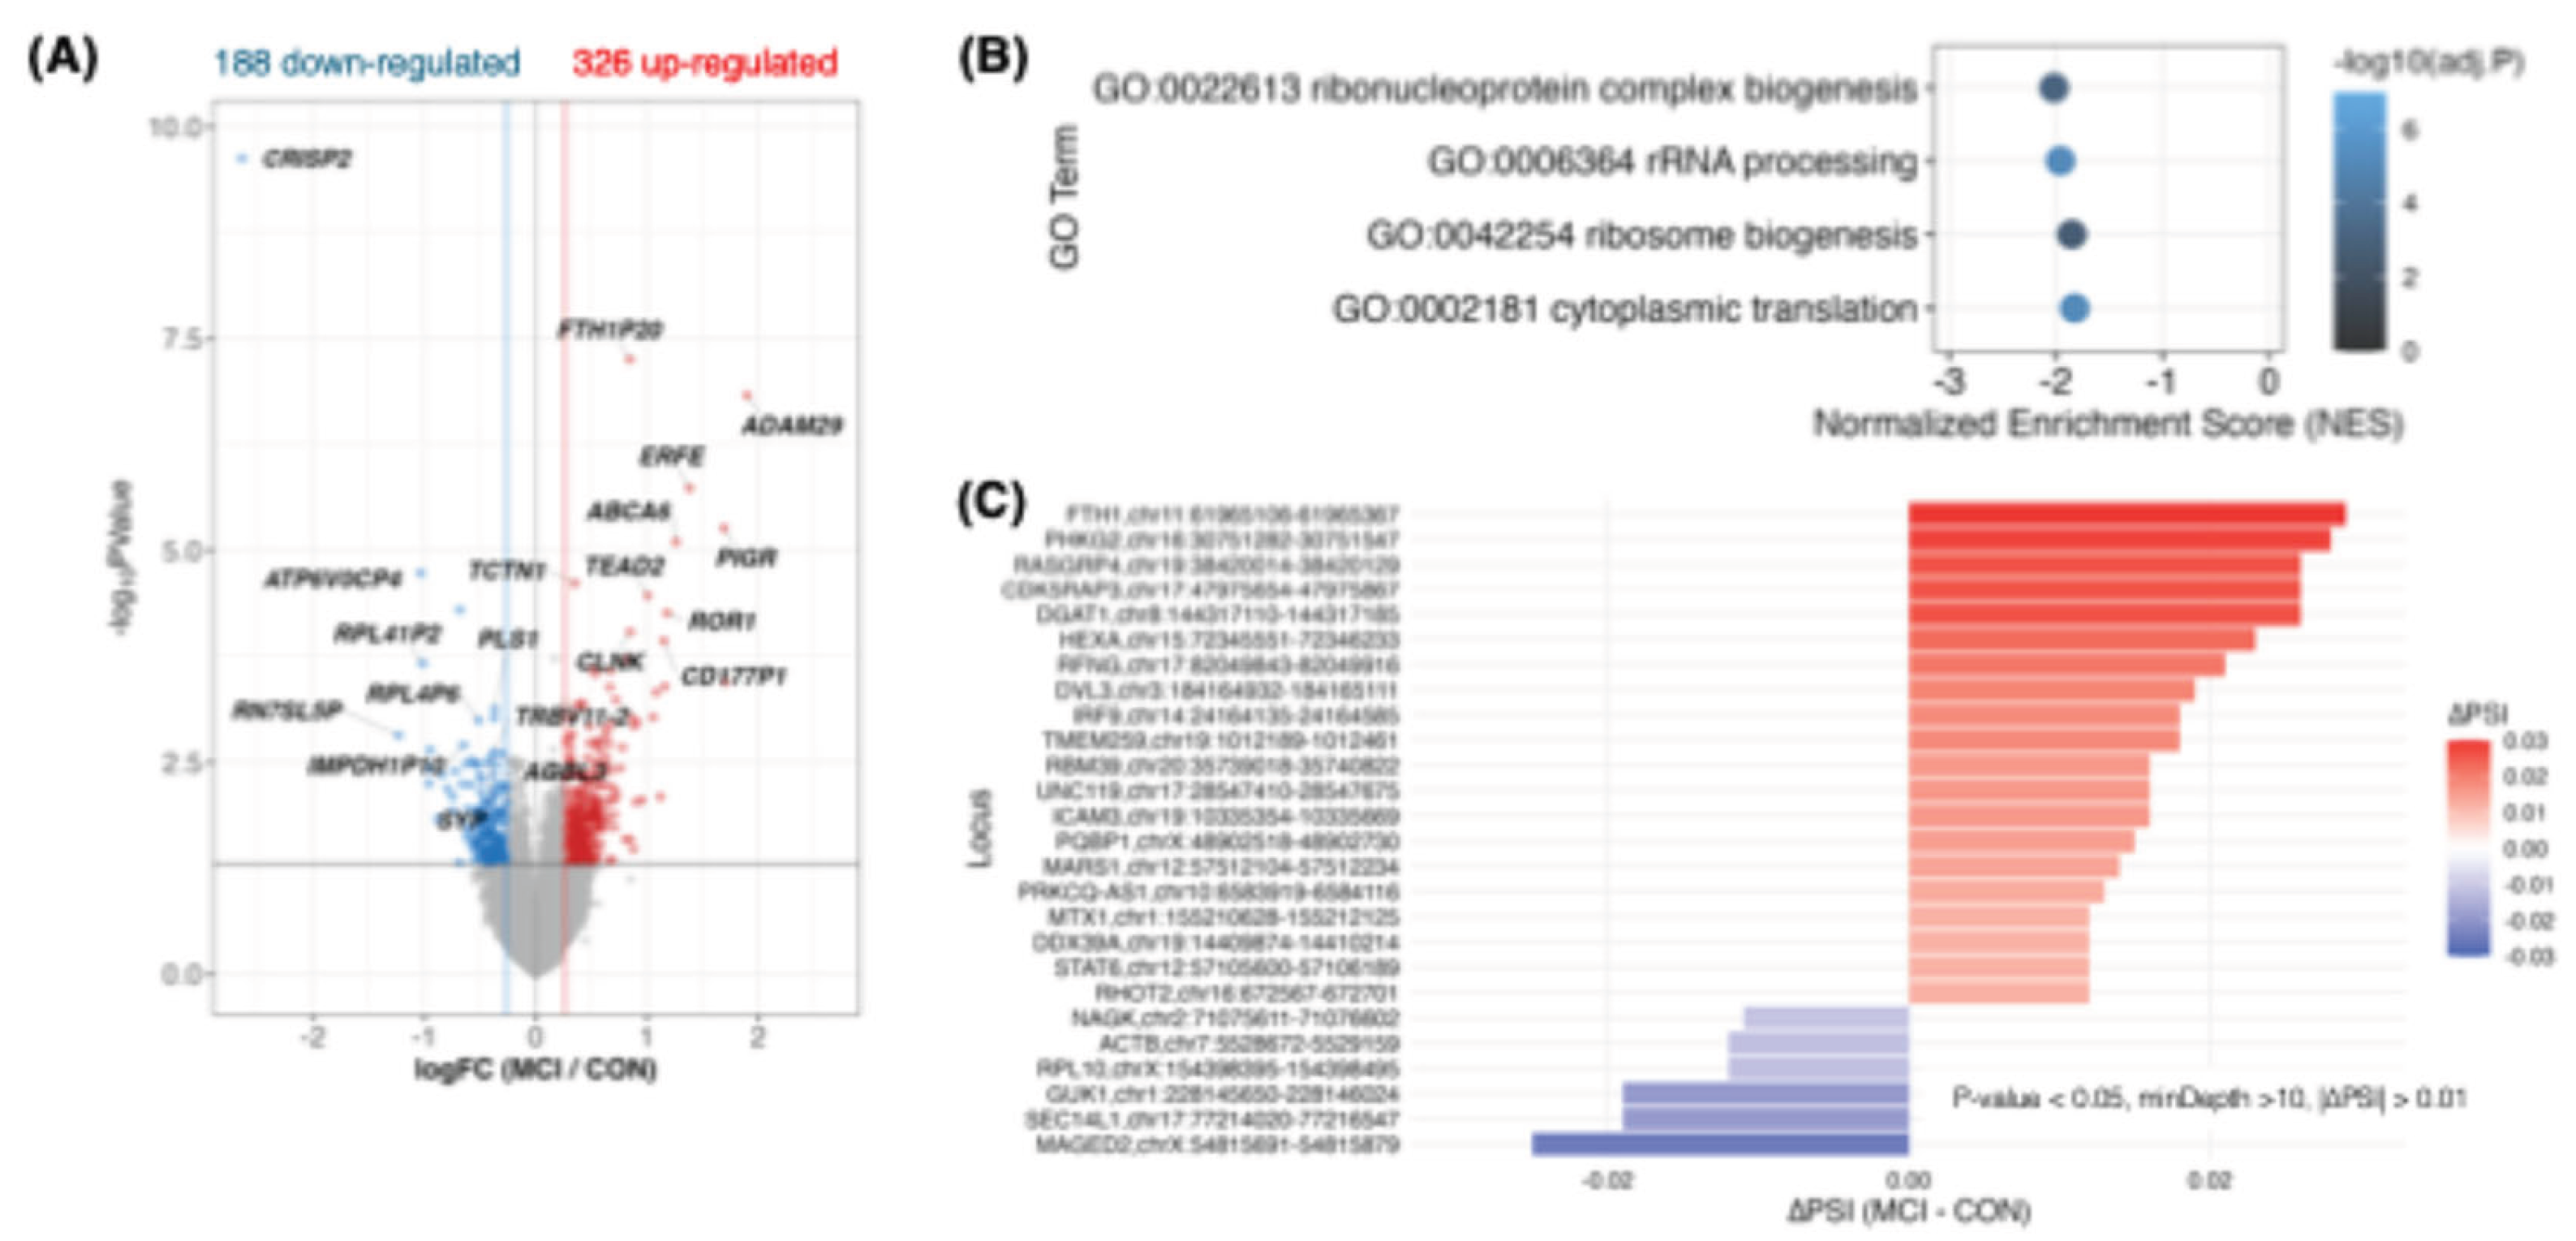

Table 1.
Mechanistic literature supporting hangekobokuto/BHT and correspondence to recovered IR genes.
Table 1.
Mechanistic literature supporting hangekobokuto/BHT and correspondence to recovered IR genes.
| Ref | Formula / model | Key reported mechanism (very short) | Corresponding recovered IR genes (motif; tag) |
|---|---|---|---|
| Endo M et al. (J Smooth Muscle Res. 2022;58:78-88) [31] | HKT; POI model | ↓ neutrophil/macrophage infiltration; ↓ iNOS; ↓ NF-κB; ↑ NGF | NOSIP (V; NO axis); CXCL2 (rev-V; Chemokine recruitment); FAS (rev-V; Death signaling) |
| Mihara T et al. (Inflammation. 2017;40(4):1331-1341) [59] | Honokiol (Magnolia component); inflammation/POI context | ↓ cytokines; ↓ iNOS | NOSIP (V; NO axis); CXCL2 (rev-V; Chemokine recruitment); TRIM16 (rev-V; Inflammasome control) |
| Liu L et al. (J Cell Mol Med. 2023;27:3339-3353) [32] | BHT/BXHPD; CUMS depression | ↓ IL-6/TNF-α/IL-1β; ↑ IL-10/IL-4; ↓ microglia activation; ↑ M2 polarization | IL17RB (rev-V; IL-17 axis); NFATC4 (V; Immune TF); OAS2 (V; Innate antiviral); TRIM16 (rev-V; Inflammasome control) |
| Jia KK et al. (J Ethnopharmacol. 2017;209:219-229) [33] | BHT/BXHPD; CUMS + metabolic/inflammasome | ↓ NLRP3 inflammasome activation; improved metabolic signaling | TRIM16 (rev-V; Inflammasome control); ERLIN1 (V; ER homeostasis); CERT1 (rev-V; Ceramide transport) |
| Yang HN et al. (J Ethnopharmacol. 2026;359:121024) [60] | BXHPD; OGT–CTSB–NLRP3 axis | ↓ OGT/CTSB O-GlcNAc; ↓ ROS/LMP; ↓ NLRP3 activation | ALG5 (rev-V; N-glycan); GMPPA (rev-V; N-glycan); RGP1 (rev-V; Golgi trafficking); TVP23C (rev-V; Golgi trafficking); AP2M1 (V; Clathrin endocytosis) |
| Kwon HJ et al. (Tradit Med Res. 2025;10(5):26) [61] | BHT; meta-analysis / network pharmacology | Neuroinflammation emphasis; IL-17 signaling suggested | IL17RB (rev-V; IL-17 axis); NOSIP (V; NO axis); CXCL2 (rev-V; Chemokine recruitment); OAS2 (V; Innate antiviral); TRIM16 (rev-V; Inflammasome control) |
Table 2.
DEG–IR cross-walk linking IR-defined recovery axes (state layer) to recovered DEG outputs (output layer) in the HKT cohort. Representative IR nodes are listed for each axis; recovery patterns (V-shape, reverse V-shape) follow the definitions in Figure 2E.
Table 2.
DEG–IR cross-walk linking IR-defined recovery axes (state layer) to recovered DEG outputs (output layer) in the HKT cohort. Representative IR nodes are listed for each axis; recovery patterns (V-shape, reverse V-shape) follow the definitions in Figure 2E.
| Recovered DEG (output) | Recovery pattern | Axis label | Representative recovered IR nodes (state) | Network evidence (STRING/Cytoscape) |
|---|---|---|---|---|
| G0S2 | reverse V-shape | Immune/innate | CXCL2 (rev-V), OAS2 (V), IL17RB (rev-V), TRIM16 (rev-V), NFATC4 (V), FAS (rev-V), NOSIP (V) | STRING ≥0.4: CXCL2-centered neighborhood connects to G0S2 and OAS2 (Figure.3A) |
| DOCK6 | reverse V-shape | Cytoskeleton/adhesion | EOGT (rev-V), MYH10 (rev-V), MYLK (rev-V), LIMS2 (rev-V), CELSR2 (rev-V) | STRING ≥0.4: DOCK6–EOGT link (Figure.3A) |
| UTS2B | reverse V-shape | Peptide signaling / other | — | No stable DEG–IR edge at STRING ≥0.4 |
| TUB | reverse V-shape | Cilia / ciliary trafficking | AHI1 (V), CEP104 (V), NPHP1 (V), CCDC24 (V), DNHD1 (V) | Axis-level alignment; no highlighted DEG–IR edge at STRING ≥0.4 |
| ENSG00000264187 | reverse V-shape | Unannotated / non-coding (ID) | — | No stable DEG–IR edge at STRING ≥0.4 |
| ELL2 | reverse V-shape | Transcription / RNA-processing | DDX5 (V), PRMT7 (V), SMARCD2 (V), KMT5B (V), SMC4 (V), ZWINT (V) | Axis-level alignment; no highlighted DEG–IR edge at STRING ≥0.4 |
| TXNDC5 | reverse V-shape | ER / proteostasis | ERLIN1 (V), MFN2 (V), SPG7 (V), NDUFA5 (V), FOXRED1 (V), TEFM (rev-V), SIGMAR1 (V) | Axis-level alignment; no highlighted DEG–IR edge at STRING ≥0.4 |
| BHLHE41 | reverse V-shape | Immune/innate-associated TF | NFATC4 (V), CXCL2 (rev-V), IL17RB (rev-V) | Axis-level alignment; no highlighted DEG–IR edge at STRING ≥0.4 |
| ABCB9 | reverse V-shape | Endomembrane / lysosome / trafficking | AP2M1 (V), GBF1 (rev-V), ALG5 (rev-V), GMPPA (rev-V), RGP1 (rev-V), TVP23C (rev-V), CERT1 (rev-V) | Axis-level alignment; no highlighted DEG–IR edge at STRING ≥0.4 |
| NPIPB6 | reverse V-shape | Unannotated / unclear | — | No stable DEG–IR edge at STRING ≥0.4 |
| SMIM11 | V-shape | Hematopoiesis / composition | — | No stable DEG–IR edge at STRING ≥0.4 |
| C11orf16 | V-shape | Hematopoiesis / composition | — | No stable DEG–IR edge at STRING ≥0.4 |
| PHACTR3 | V-shape | Cytoskeleton/actin regulation | MYH10 (rev-V), MYLK (rev-V), LIMS2 (rev-V) | Axis-level alignment; no highlighted DEG–IR edge at STRING ≥0.4 |
| ALPK3 | V-shape | Cytoskeleton/contractile signaling | MYH10 (rev-V), MYLK (rev-V) | Axis-level alignment; no highlighted DEG–IR edge at STRING ≥0.4 |
| DLGAP2 | V-shape | Other / unclear | — | No stable DEG–IR edge at STRING ≥0.4 |
| ZNF625 | V-shape | Chromatin / transcription | BRD9 (rev-V), KMT5B (V), ZNF714 (rev-V), ZNF789 (rev-V) | Axis-level alignment; no highlighted DEG–IR edge at STRING ≥0.4 |
| ENSG00000261341 | V-shape | Unannotated / non-coding (ID) | — | No stable DEG–IR edge at STRING ≥0.4 |
Disclaimer/Publisher’s Note: The statements, opinions and data contained in all publications are solely those of the individual author(s) and contributor(s) and not of MDPI and/or the editor(s). MDPI and/or the editor(s) disclaim responsibility for any injury to people or property resulting from any ideas, methods, instructions or products referred to in the content. |
© 2026 by the authors. Licensee MDPI, Basel, Switzerland. This article is an open access article distributed under the terms and conditions of the Creative Commons Attribution (CC BY) license (http://creativecommons.org/licenses/by/4.0/).
Copyright: This open access article is published under a Creative Commons CC BY 4.0 license, which permit the free download, distribution, and reuse, provided that the author and preprint are cited in any reuse.


