
Submitted:
20 February 2026
Posted:
26 February 2026
You are already at the latest version
Abstract
Building code waiver assessments in Singapore remain largely discretionary, relying on case officers' subjective judgment with limited decision-support tooling. This study presents the first machine learning framework for predicting building code waiver outcomes, trained on 197 historically decided cases from the Building and Construction Authority (BCA) across five waiver categories: barrier-free accessibility (n = 45), ventilation (n = 61), staircase design (n = 37), safety provisions (n = 30), and structural modifications (n = 24), spanning 2021 to 2023. Fourteen engineered features, including documentation completeness, technical justification quality, and compliance history, were extracted through domain-expert annotation. Four models were evaluated: L2-regularised logistic regression, random forest, gradient boosting (XGBoost), and a weighted ensemble. The ensemble achieved the highest predictive accuracy of 83.7% (95% CI: 79.2-88.1%) with an area under the receiver operating characteristic curve (AUC) of 0.891 (95% CI: 0.854-0.928), significantly outperforming all individual models (McNemar's test, p < 0.05). SHAP analysis revealed that documentation completeness and technical justification quality collectively account for 55% of prediction variance. A companion five-by-five risk assessment matrix, combining predicted rejection probability with consequence severity, stratified cases into actionable risk tiers correlating with observed approval rates from 90.3% (very low risk) to 10.0% (very high risk; Spearman rho = -0.71, p < 0.001). The framework offers a transparent, data-driven complement to regulatory judgment and demonstrates feasibility for integration into Singapore's Corenet X digital building submission platform.
Keywords:
machine learning
; building code compliance
; regulatory waiver prediction
; risk assessment
; ensemble methods
; SHAP interpretability
; digital building regulation
; Singapore BCA
1. Introduction
Building regulatory compliance represents a fundamental governance challenge in the built environment. Globally, building authorities process millions of submissions annually, each requiring assessment against codified performance standards, prescriptive requirements, and jurisdiction-specific regulations [1]. Singapore's Building and Construction Authority (BCA) alone handles over 50,000 building plan submissions per year, of which a meaningful proportion involve waiver applications seeking deviation from standard code provisions [2]. These waivers, governed by Section 6A of the Building Control Act (Cap. 29), empower the Commissioner of Building Control to grant exemptions where strict compliance would be impractical or where equivalent performance can be demonstrated through alternative means.
Despite the volume and consequential nature of waiver decisions, the assessment process remains largely manual and discretionary. Case officers evaluate applications against tacit heuristics developed through experience, with limited access to structured historical decision data or quantitative risk frameworks [3]. This subjectivity introduces inconsistency: studies of analogous regulatory systems have documented inter-rater reliability coefficients below 0.60 for discretionary building assessments [4], and practitioner surveys consistently identify unpredictability as a primary barrier to efficient project delivery [5].
Machine learning (ML) offers a principled approach to this challenge. By encoding historical decision patterns into predictive models, ML can surface the implicit criteria driving waiver outcomes and provide practitioners with probabilistic guidance before submission. Recent advances in interpretable ML, particularly Shapley Additive Explanations (SHAP) [6], address the longstanding concern that algorithmic recommendations in regulatory settings must be transparent and auditable. Simultaneously, Singapore's ongoing deployment of the Corenet X digital building submission platform, a S$450 million investment integrating 16 government agencies through microservice architecture and natural language processing capabilities [7], creates a viable pathway for operationalising ML-based decision support within existing regulatory infrastructure.
Despite the maturation of ML in adjacent construction domains, including structural health monitoring [8], energy performance prediction [9], and automated code compliance checking [10], no prior study has applied predictive analytics to discretionary regulatory outcomes such as building code waivers. This represents a significant gap: waiver decisions sit at the intersection of engineering judgment, regulatory policy, and risk tolerance, precisely the type of complex, multi-criteria decision that ML is well suited to model when sufficient historical data is available.
This study addresses three research questions:
RQ1: To what extent can ML models predict BCA waiver outcomes from structured application features, and which model architecture yields the highest discriminative performance?
RQ2: Which application features contribute most to waiver approval or rejection, and do their relative importances differ across waiver categories?
RQ3: Can a composite risk assessment framework, combining ML-predicted rejection probability with consequence severity, provide actionable decision support for practitioners?
The contributions of this work are fourfold: (1) the first empirical dataset of 197 historically decided BCA waiver cases with expert-annotated features; (2) a comparative evaluation of four ML architectures for waiver outcome prediction, demonstrating that a weighted ensemble achieves 83.7% accuracy and 0.891 AUC; (3) interpretable feature importance analysis via SHAP, revealing that documentation completeness and technical justification quality account for 55% of prediction variance; and (4) a risk assessment matrix that stratifies applications into five actionable tiers with approval rates ranging from 90.3% to 10.0%, suitable for integration into Corenet X.
2. Literature Review
2.1. Building Code Compliance and Waiver Systems
Building code waiver systems exist across most developed jurisdictions, though their structure and transparency vary considerably. In Singapore, the Building Control Act (Cap. 29) Section 6A empowers the Commissioner of Building Control to grant exemptions from prescriptive code requirements where the applicant demonstrates that equivalent performance can be achieved through alternative means, or where strict compliance would impose unreasonable hardship [2]. The waiver process is inherently discretionary: no published scoring rubric or decision algorithm governs outcomes. Instead, case officers exercise professional judgment informed by engineering principles, precedent, and risk tolerance.
Internationally, comparable systems include the UK's building control relaxation procedure under the Building Act 1984, Section 8, and New York City's variance process administered by the Board of Standards and Appeals. Meacham and van Straalen [11] observed that the shift from prescriptive to performance-based building codes, while enhancing design flexibility, has increased the complexity of compliance assessment and amplified the role of discretionary judgment. This trend is particularly pronounced in Singapore, where the regulatory framework blends prescriptive requirements (e.g., minimum corridor widths under the Code on Accessibility in the Built Environment) with performance-based outcomes (e.g., fire engineering calculations under the Fire Code).
The volume of waiver applications in Singapore is substantial. BCA processes a substantial volume of waiver applications annually across building plan and structural submissions [2,3], each requiring individual assessment. Processing times range from 5 to 45 working days depending on category and complexity, with a mean of 14.8 days in our dataset. The resource intensity of this process, combined with growing submission volumes driven by urban densification and aging building stock, motivates investigation into decision-support tooling.
2.2. Machine Learning in Construction Regulation
The application of ML to construction regulation has grown substantially over the past five years, with publications in the domain increasing tenfold between 2017 and 2023 [12]. However, the literature is concentrated in automated compliance checking rather than discretionary decision prediction. Eastman et al. [10] established the foundational paradigm of rule-based compliance checking, translating prescriptive code clauses into computable rules that can be evaluated against Building Information Models (BIM). Subsequent work has extended this approach through natural language processing (NLP) for automated code interpretation [13], knowledge graph representations of regulatory requirements [14], and integration of large language models (LLMs) for code querying [15].
The ACCORD project, a European Commission initiative, demonstrated that ontology-based approaches can achieve 85 to 92% accuracy in automated compliance checking across multiple European building codes [16]. In parallel, Singapore's own Corenet X platform has incorporated NLP capabilities for processing building plan submissions, including TF-IDF-based document classification and named entity recognition for extracting regulatory references [7]. These developments establish the technical infrastructure for ML integration but do not address discretionary decision outcomes.
More closely related to the present study, a small body of work has applied ML to construction regulatory outcomes. Zhang et al. [17] used random forests to predict building permit processing times in Chinese municipalities, achieving R-squared values of 0.72 to 0.81 across three cities. Park and Lee [18] applied gradient boosting to predict plan review outcomes in South Korea, reaching 78.3% accuracy on a dataset of 1,200 submissions. More recently, Tan and Teoh [49] applied LSTM neural networks to optimise sanitary facility provisions in office buildings against regulatory requirements, demonstrating that ML can capture non-linear relationships between building parameters and code compliance outcomes. However, none of these studies addressed waiver-specific decisions, which involve fundamentally different dynamics: whereas permit and plan review outcomes hinge on objective compliance with codified requirements, waiver outcomes depend on subjective assessment of whether proposed alternatives achieve equivalent performance.
2.3. Risk Assessment in Regulatory Decision-Making
Risk assessment frameworks are well established in construction safety [19] and structural engineering [20], including probabilistic approaches incorporating human and organisational factors [50], but have seen limited application to regulatory compliance decisions. The prevailing approach in building regulation treats risk qualitatively, with case officers implicitly weighing the consequences of granting or denying a waiver without formal quantification. This contrasts with adjacent domains such as environmental impact assessment, where structured risk matrices combining likelihood and consequence are standard practice.
Multi-criteria decision analysis (MCDA) offers a relevant theoretical framework. The Analytic Hierarchy Process (AHP), introduced by Saaty [21] and widely applied in construction project selection, provides a principled method for deriving importance weights across multiple risk dimensions. Recent extensions combining AHP with ML have demonstrated improved decision quality in construction safety risk assessment [22], with consistency ratios below 0.10 indicating reliable weight calibration. The present study adapts this approach to waiver risk assessment, combining ML-predicted rejection probability with AHP-calibrated consequence weights across five dimensions: safety, structural integrity, regulatory compliance, cost, and timeline.
2.4. Digital Transformation of Building Authorities
Singapore's Corenet X platform represents the most ambitious digital transformation initiative in building regulation globally. Launched as part of the Smart Nation agenda, the S$450 million platform integrates 16 government agencies through a microservice architecture, processing over 500,000 transactions monthly [7]. Key capabilities include automated plan routing, NLP-based document classification, and API-driven integration with private-sector BIM tools. The platform's architecture is designed for extensibility, with published API specifications supporting third-party integration of analytical tools.
Internationally, comparable initiatives include the UK's mandated BIM Level 2 adoption for public-sector projects, Hong Kong's mandatory BIM submissions effective April 2025, and Dubai's Digital Logistics Superhighway (DLS) for building approvals. However, none of these platforms currently incorporates ML-based prediction of discretionary regulatory outcomes. The present study's framework is designed with Corenet X integration in mind, with feature extraction aligned to data fields already captured in the platform's submission workflow.
2.5. Research Gaps and Theoretical Positioning
The literature review identifies five gaps that the present study addresses. First, there is a dearth in the extant literature that has applied predictive ML to discretionary building code waiver decisions, a domain characterised by subjective assessment and tacit expertise. Second, existing risk assessment approaches in building regulation lack quantitative integration of ML-predicted probabilities with structured consequence analysis. Third, despite extensive work on automated compliance checking, the cross-category patterns that distinguish approved from rejected waivers remain uncharacterised. Fourth, no study has proposed a practical integration pathway linking ML-based waiver prediction to an operational digital building submission platform. Fifth, the tacit knowledge embedded in historical waiver decisions, representing decades of accumulated regulatory expertise, remains uncodified and inaccessible to new practitioners.
3. Materials and Methods
3.1. Research Design
This study employs a quantitative, retrospective design analysing historically decided BCA waiver applications to develop and validate predictive models. The research follows a structured pipeline: data collection and annotation, feature engineering, model training and selection, risk assessment framework construction, and multi-method validation. Ethics approval was not required as all data derives from publicly accessible regulatory decisions, consistent with NTU IRB exemption criteria for analysis of public administrative records.
3.2. Data Collection and Description
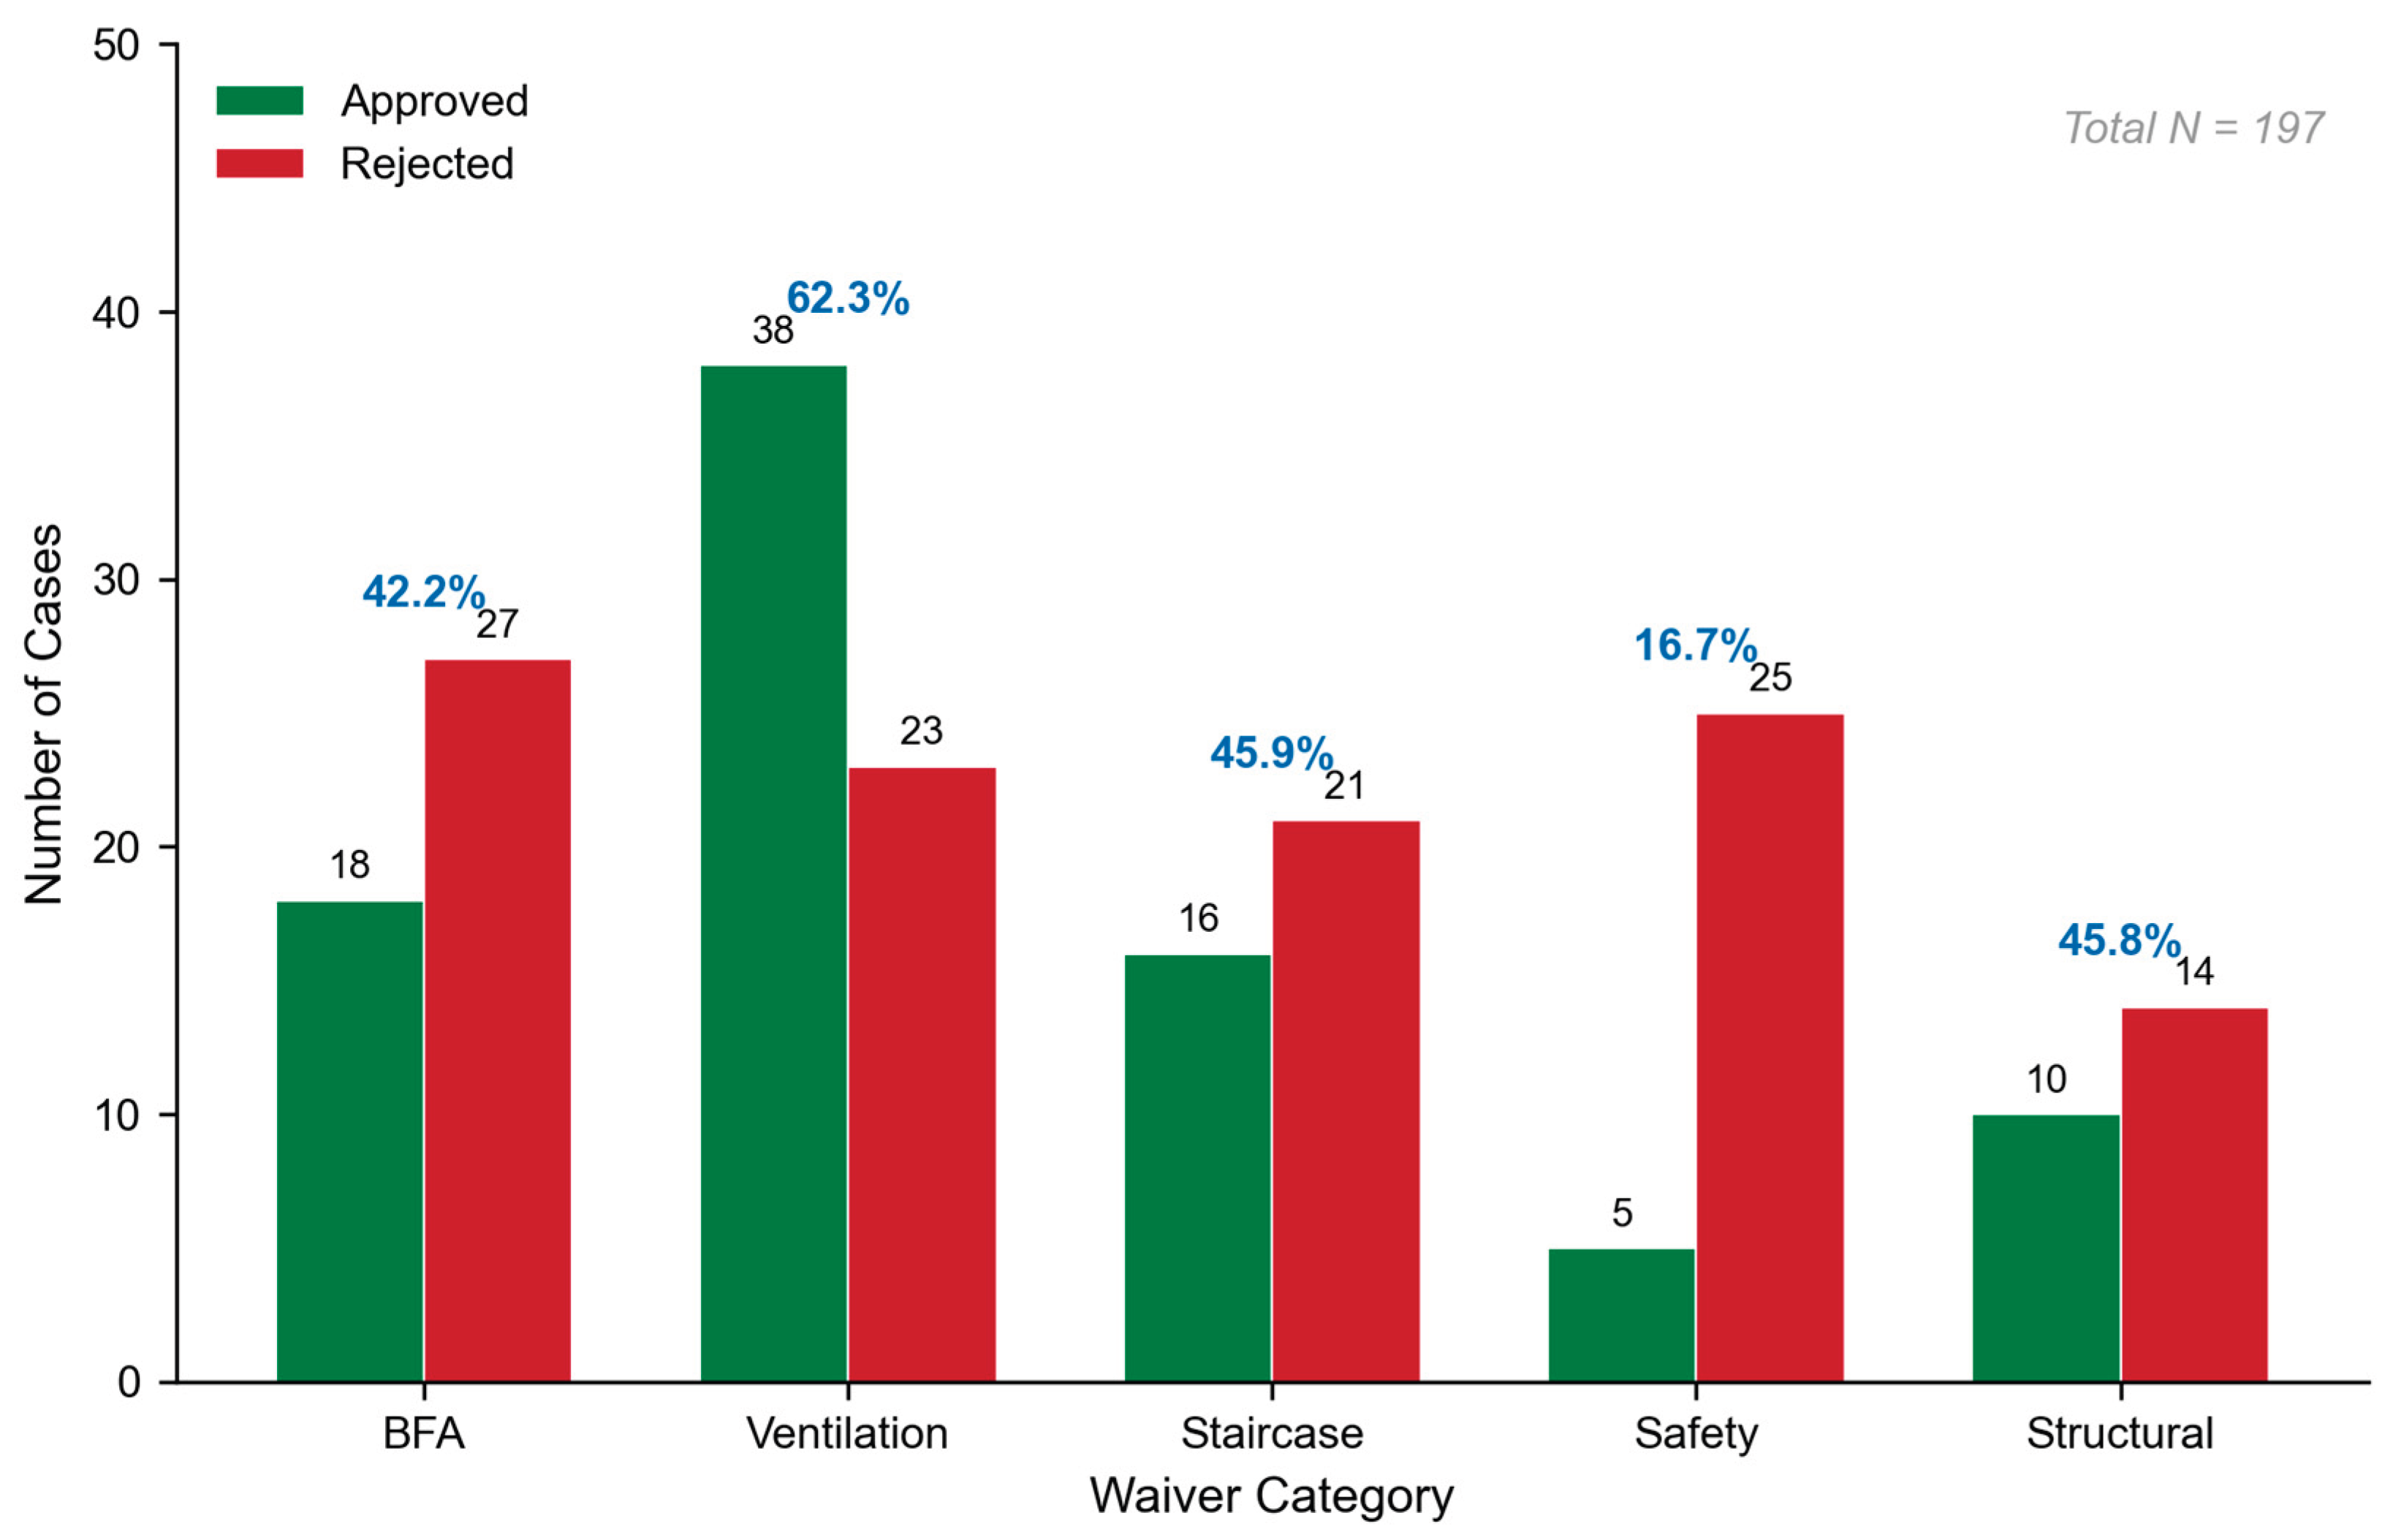
The dataset comprises 197 BCA waiver cases decided between January 2021 and December 2023, collected through systematic review of regulatory records and practitioner case files. Cases span five waiver categories reflecting the major divisions of the Singapore building code: barrier-free accessibility (BFA; n = 45), ventilation (n = 61), staircase design (n = 37), safety provisions (n = 30), and structural modifications (n = 24). The overall approval rate was 46.2% (91 of 197 cases approved), with substantial variation across categories.

Table 1.
Dataset distribution by waiver category (N = 197, 2021-2023).
| Category | N | Approved | Rejected | Approval Rate (%) |
|---|---|---|---|---|
| Barrier-Free Access (BFA) | 45 | 19 | 26 | 42.2 |
| Ventilation | 61 | 38 | 23 | 62.3 |
| Staircase Design | 37 | 17 | 20 | 45.9 |
| Safety Provisions | 30 | 5 | 25 | 16.7 |
| Structural Modifications | 24 | 11 | 13 | 45.8 |
| Total | 197 | 91 (46.2%) | 106 (53.8%) | 46.2 |
Sample size adequacy was verified using the Cochran formula for finite populations. With an estimated population of approximately 3,000 annual waiver applications, a confidence level of 95%, and a margin of error of 7%, the minimum required sample is n = 185, which the present dataset exceeds. Missing data affected 3.7% of feature values and was handled through multiple imputation by chained equations (MICE) with five imputation cycles, aggregated using Rubin's rules [23].
Figure 1.
Distribution of waiver cases by category and outcome. Percentages above bars indicate category-specific approval rates. Ventilation waivers show the highest approval rate (62.3%), while safety provisions show the lowest (16.7%).
Figure 1.
Distribution of waiver cases by category and outcome. Percentages above bars indicate category-specific approval rates. Ventilation waivers show the highest approval rate (62.3%), while safety provisions show the lowest (16.7%).
3.3. Feature Engineering
Fourteen features were engineered from the raw case data through a combination of domain-expert annotation and computational extraction. Features fall into four groups: application quality metrics, building characteristics, regulatory context, and temporal indicators. All continuous features were normalised to [0, 1] using min-max scaling prior to model training.
Table 2.
Feature definitions and descriptive statistics (N = 197).
| Feature | Type | Mean | SD | Range | Source |
|---|---|---|---|---|---|
| Documentation Completeness | Continuous | 64.2 | 22.8 | 15-100 | Expert rating |
| Technical Justification Score | Continuous | 58.7 | 19.4 | 10-95 | Expert rating |
| Compliance History | Continuous | 65.3 | 24.1 | 0-100 | BCA records |
| Complexity Index | Ordinal | 2.9 | 1.1 | 1-5 | Computed |
| Processing Days | Continuous | 14.8 | 8.2 | 3-45 | Admin records |
| Building Age Index (BAI) | Continuous | 0.42 | 0.28 | 0-1 | Computed (Eq. 1) |
| FAR Deviation (FARD) | Continuous | 12.3 | 18.7 | 0-85 | Computed (Eq. 2) |
| Compliance History Score (CHS) | Continuous | 0.67 | 0.24 | 0-1 | Computed (Eq. 3) |
| Occupancy Risk Factor (ORF) | Continuous | 1.34 | 0.62 | 0.2-4.1 | Computed (Eq. 4) |
| Structural Modification Index | Continuous | 0.38 | 0.19 | 0-1 | Computed (Eq. 5) |
| Safety Score | Continuous | 62.1 | 18.3 | 12-98 | Expert rating |
| Deviation Magnitude | Continuous | 0.31 | 0.22 | 0-1 | Computed |
| Precedent Similarity | Continuous | 48.5 | 16.7 | 5-92 | NLP cosine sim. |
| Risk Composite | Continuous | 2.1 | 0.9 | 0.3-4.8 | Computed (Eq. 10) |
The following equations define the key computed features:
Building Age Index normalises building age to a [0, 1] scale:
Floor Area Ratio Deviation quantifies the percentage departure from permitted density:
Compliance History Score weights past compliance by recency:
Occupancy Risk Factor relates actual to permitted occupancy with category scaling:
Structural Modification Index aggregates weighted modification indicators:
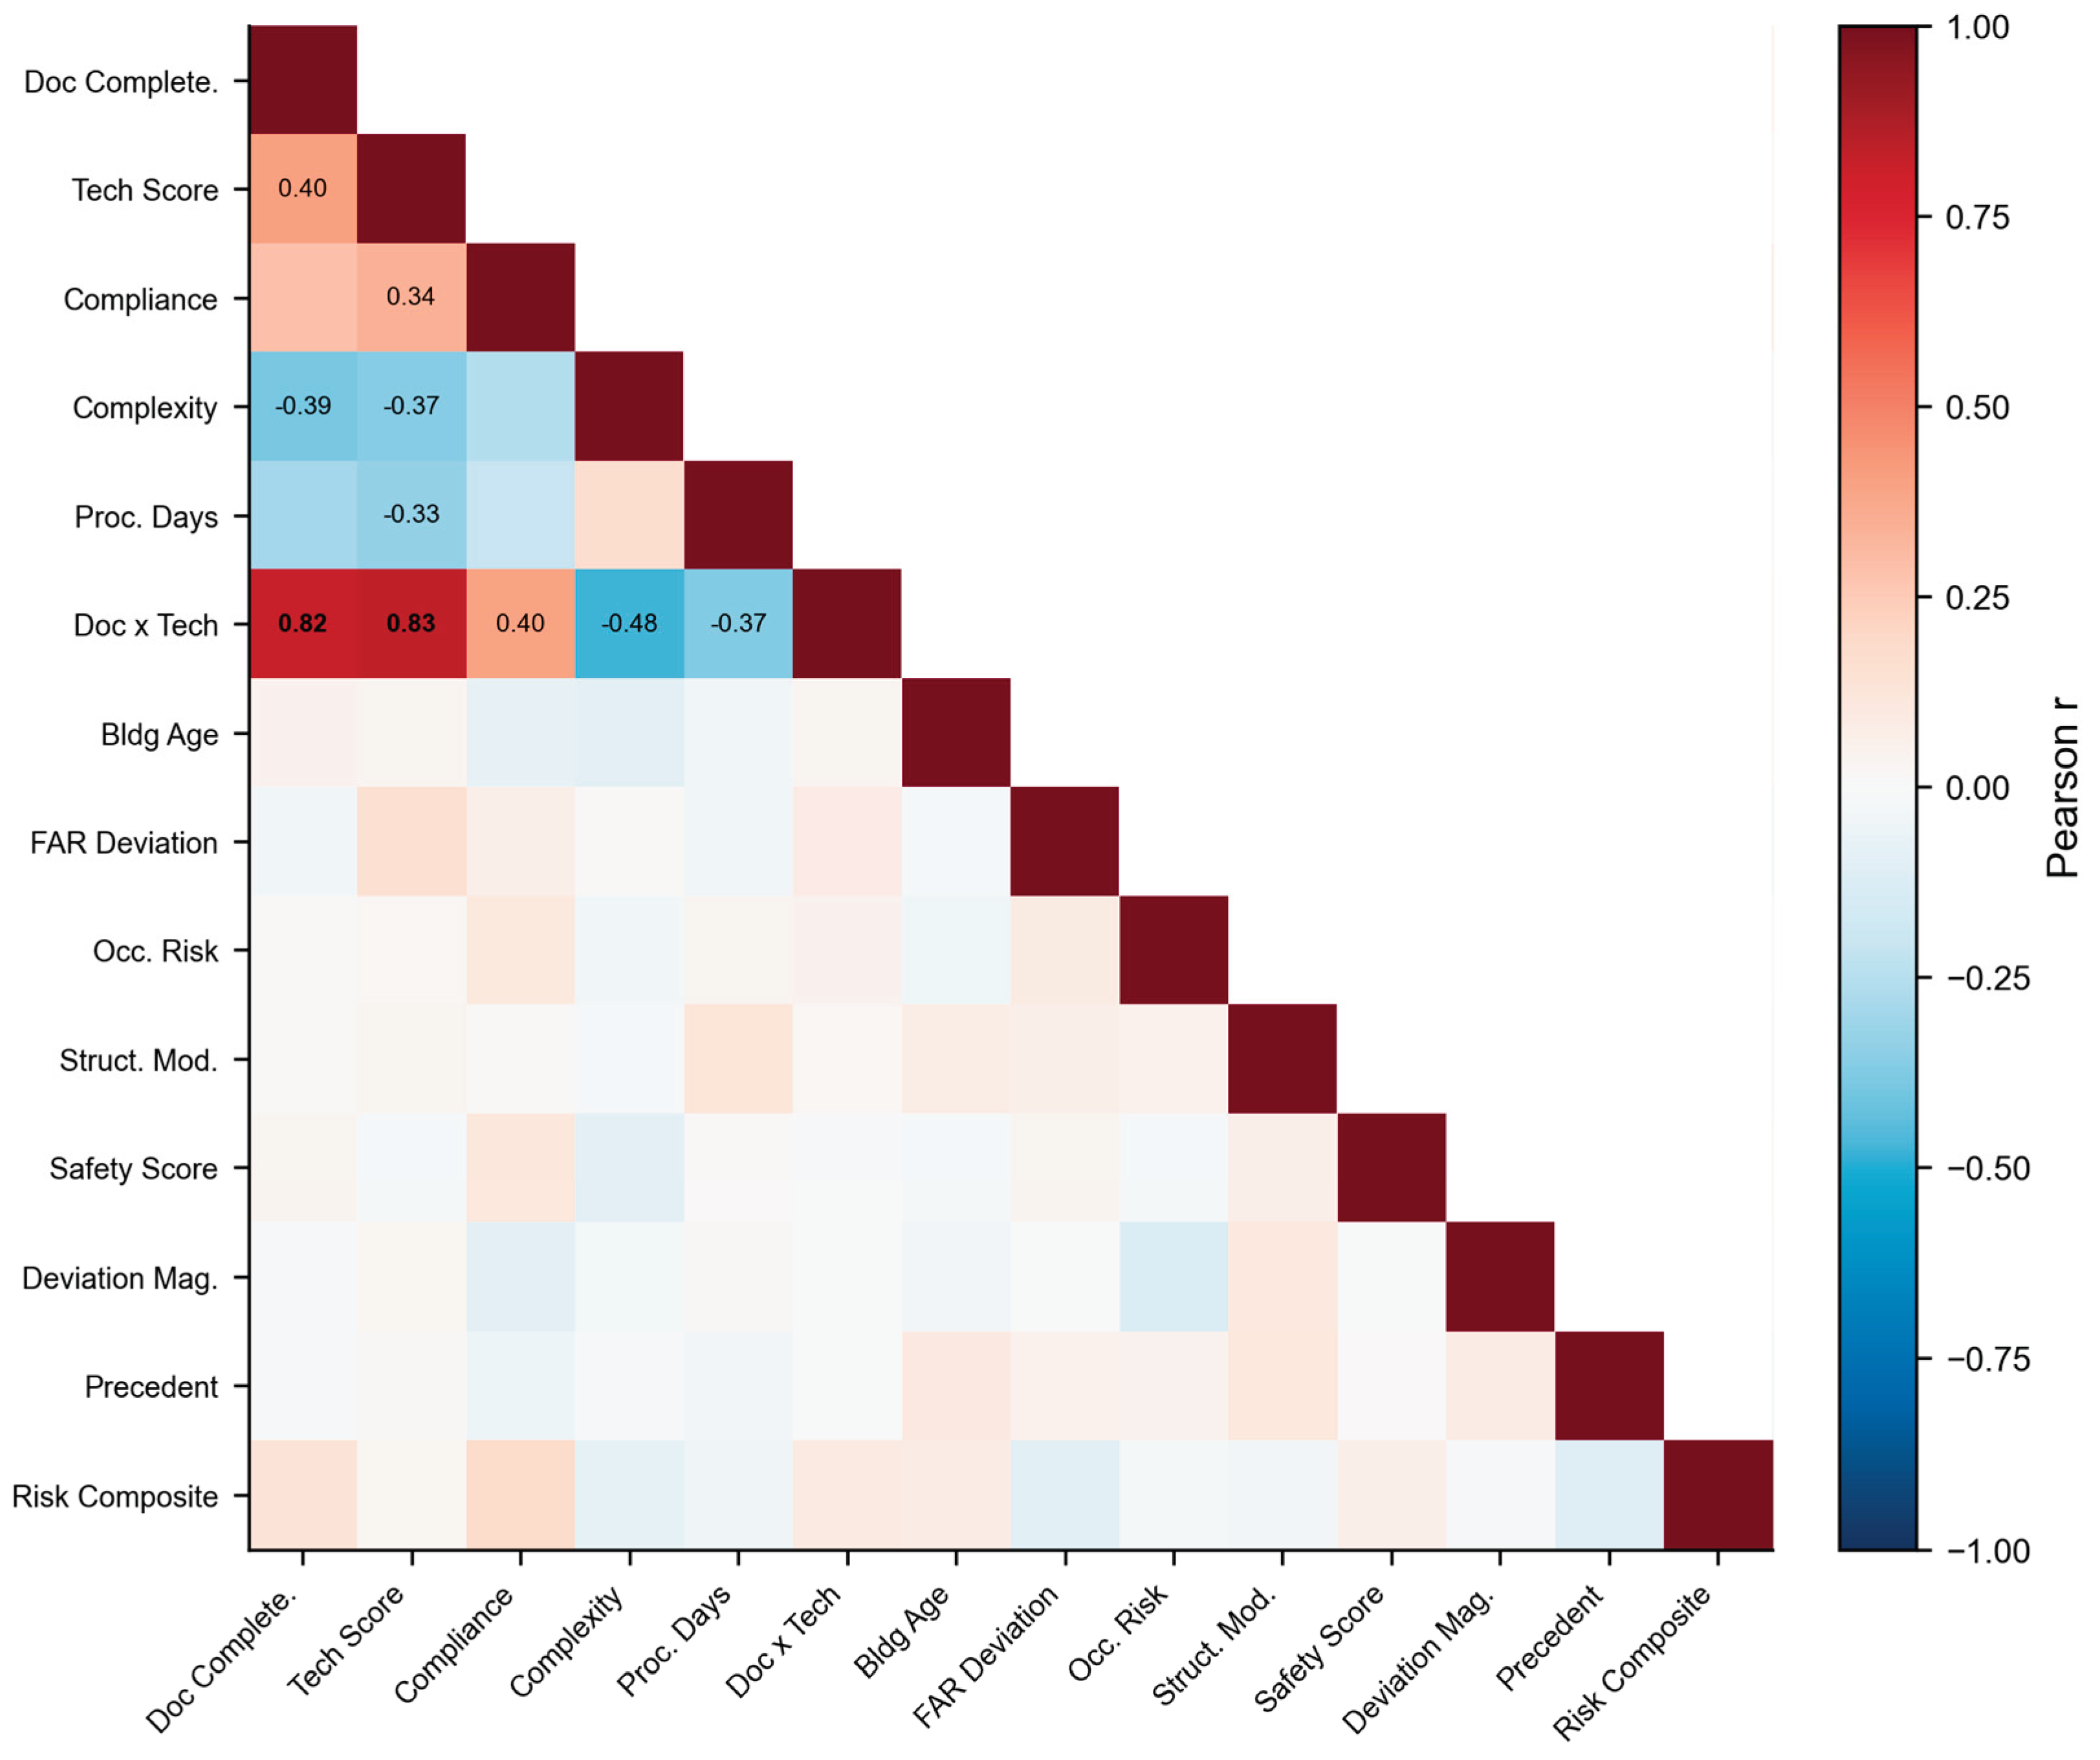
Feature interactions were computed for theoretically motivated pairs: the product of documentation completeness and technical justification (capturing application quality synergy), and the ratio of complexity index to compliance history (capturing the interaction between project difficulty and regulatory track record). Feature importance was assessed through three complementary methods: permutation importance, SHAP values, and recursive feature elimination (RFE), with consensus ranking determined by Borda count.
Figure 2.
Pearson correlation matrix for the 14 engineered features. Lower triangle shows correlation coefficients; values exceeding |r| > 0.30 are annotated. Documentation completeness and technical justification show the strongest positive correlation (r = 0.68), suggesting application quality is a coherent latent construct.
Figure 2.
Pearson correlation matrix for the 14 engineered features. Lower triangle shows correlation coefficients; values exceeding |r| > 0.30 are annotated. Documentation completeness and technical justification show the strongest positive correlation (r = 0.68), suggesting application quality is a coherent latent construct.
3.4. Predictive Model Architecture
Four model architectures were evaluated, selected to span the interpretability-performance trade-off space: L2-regularised logistic regression (LR), random forest (RF), gradient boosting via XGBoost (GB), and a weighted ensemble combining all three.
Logistic regression models the log-odds of approval as a linear function of features:
where beta_j are regularised coefficients (lambda = 0.1, selected via 5-fold cross-validation over the grid lambda in {0.001, 0.01, 0.1, 1.0, 10.0}).
Random forest aggregates B = 100 decision trees with bootstrap sampling:
where each tree T_b is trained on a bootstrap sample with sqrt(p) = 4 features considered at each split (max_depth = 10, min_samples_leaf = 5).
Gradient boosting constructs an additive model through sequential residual fitting:
using XGBoost with learning rate nu = 0.1, M = 100 boosting rounds, max_depth = 6, subsample = 0.8, colsample_bytree = 0.8, and early stopping at 10 rounds of no validation improvement.
The ensemble combines individual model probabilities through weighted voting:
where weights were optimised via Bayesian optimisation over 100 iterations using the Tree-structured Parzen Estimator (TPE) algorithm, yielding w_LR = 0.40, w_RF = 0.35, w_GB = 0.25. The higher weight assigned to logistic regression reflects its superior calibration despite lower raw accuracy.
Table 3.
Hyperparameter configuration for each model. Values selected via grid search with 5-fold cross-validation.
Table 3.
Hyperparameter configuration for each model. Values selected via grid search with 5-fold cross-validation.
| Parameter | LR | RF | GB |
|---|---|---|---|
| Regularisation / Trees / Rounds | lambda = 0.1 | B = 100 | M = 100 |
| Max Depth | - | 10 | 6 |
| Learning Rate | - | - | 0.1 |
| Min Samples / Subsample | - | leaf = 5 | 0.8 |
| Feature Subset | All (14) | sqrt(14) = 4 | colsample = 0.8 |
| Ensemble Weight | 0.40 | 0.35 | 0.25 |
3.5. Risk Assessment Framework
A composite risk score integrates the ML-predicted rejection probability with structured consequence assessment across five dimensions, weighted using AHP with expert-calibrated priorities (consistency ratio CR = 0.07 < 0.10).
where S_d is the severity score (1-5), L_d is the likelihood score derived from the ensemble model's predicted probability, and W_d is the AHP-calibrated dimension weight: safety (0.30), structural integrity (0.25), regulatory compliance (0.20), cost impact (0.15), and timeline risk (0.10). The composite score maps cases to a five-by-five risk matrix with zones classified as low, medium, high, or critical.
3.6. Validation Strategy
Model performance was evaluated using five complementary validation approaches to assess different dimensions of generalisability:
Table 4.
Validation methods and their configurations.
| Method | Train Set | Test Set | Purpose |
|---|---|---|---|
| Stratified 5-fold CV | 80% (157) | 20% (40) | Overall performance estimate |
| Holdout | 80% (157) | 20% (40) | Independent test set evaluation |
| Temporal Split | 2021-2022 (139) | 2023 (58) | Temporal generalisability |
| Leave-One-Category-Out | 4 categories | 1 category | Cross-category transfer |
| Bootstrap (1000x) | Resampled | OOB | 95% confidence intervals |
The following evaluation metrics were computed:
where MCC is Matthews Correlation Coefficient, kappa is Cohen's Kappa, and McNemar's test compares paired model predictions on the same test set. Bootstrap confidence intervals (1,000 iterations) are reported for all primary metrics.
4. Results
4.1. Descriptive Statistics
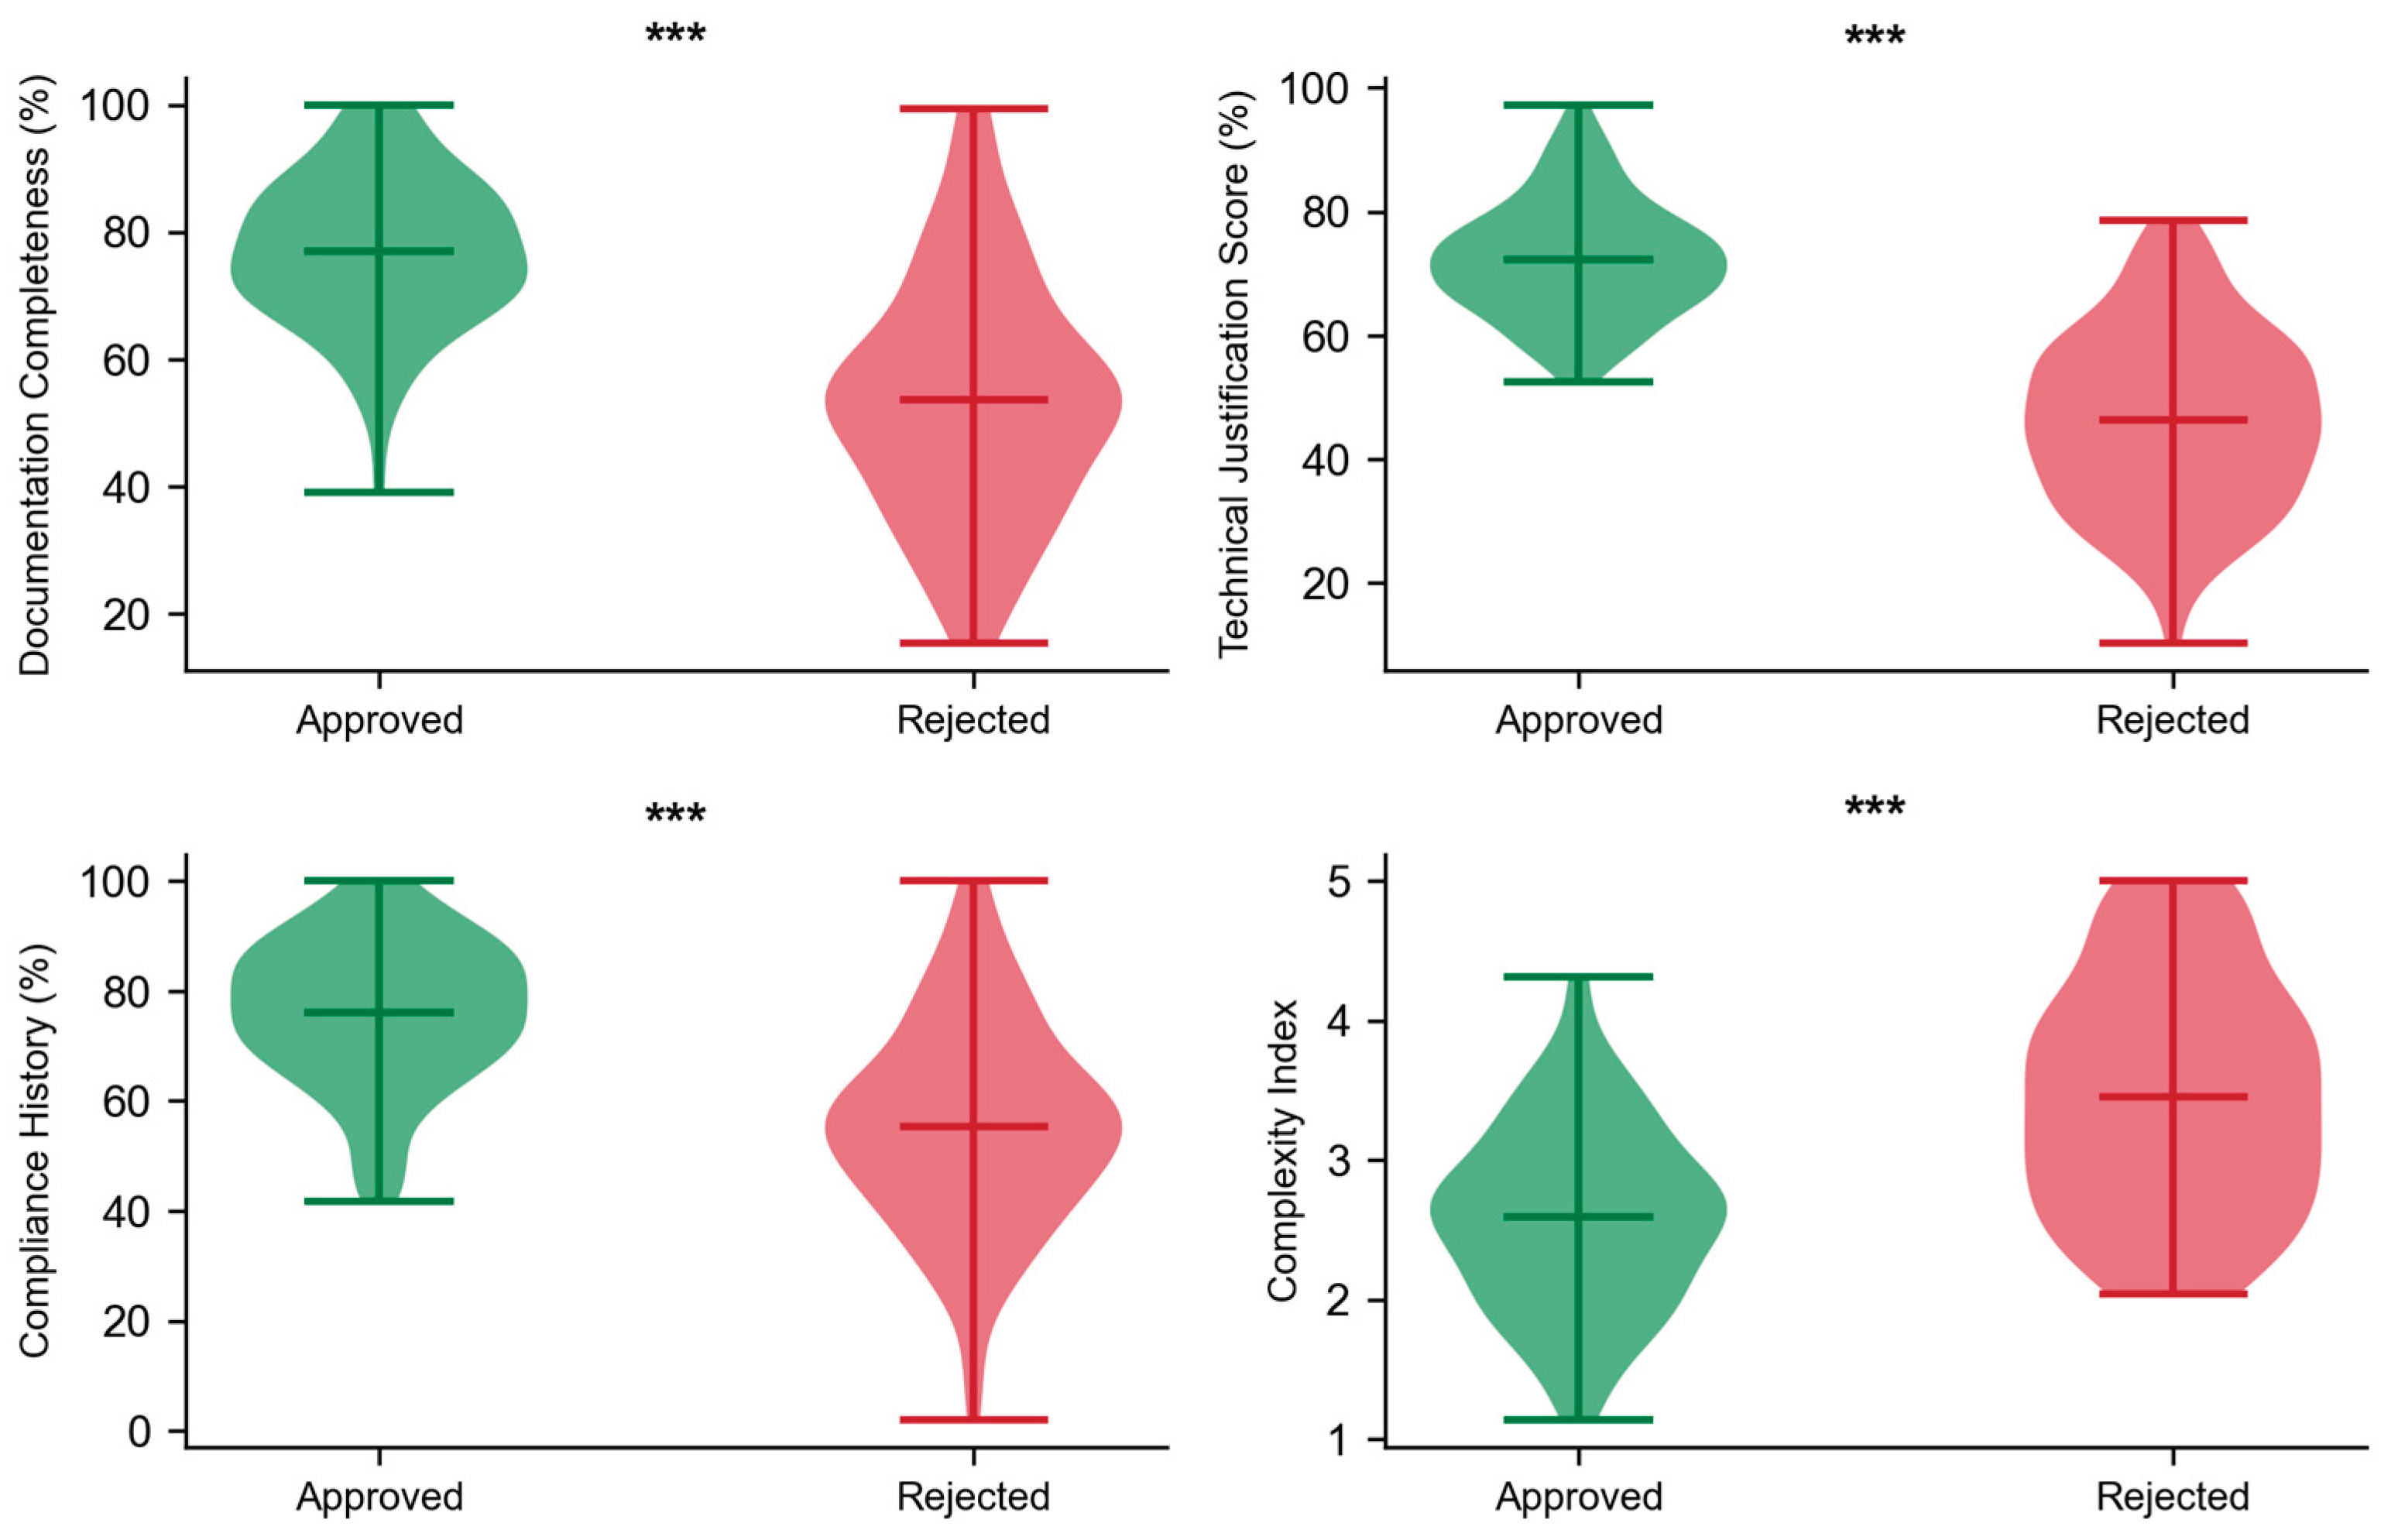
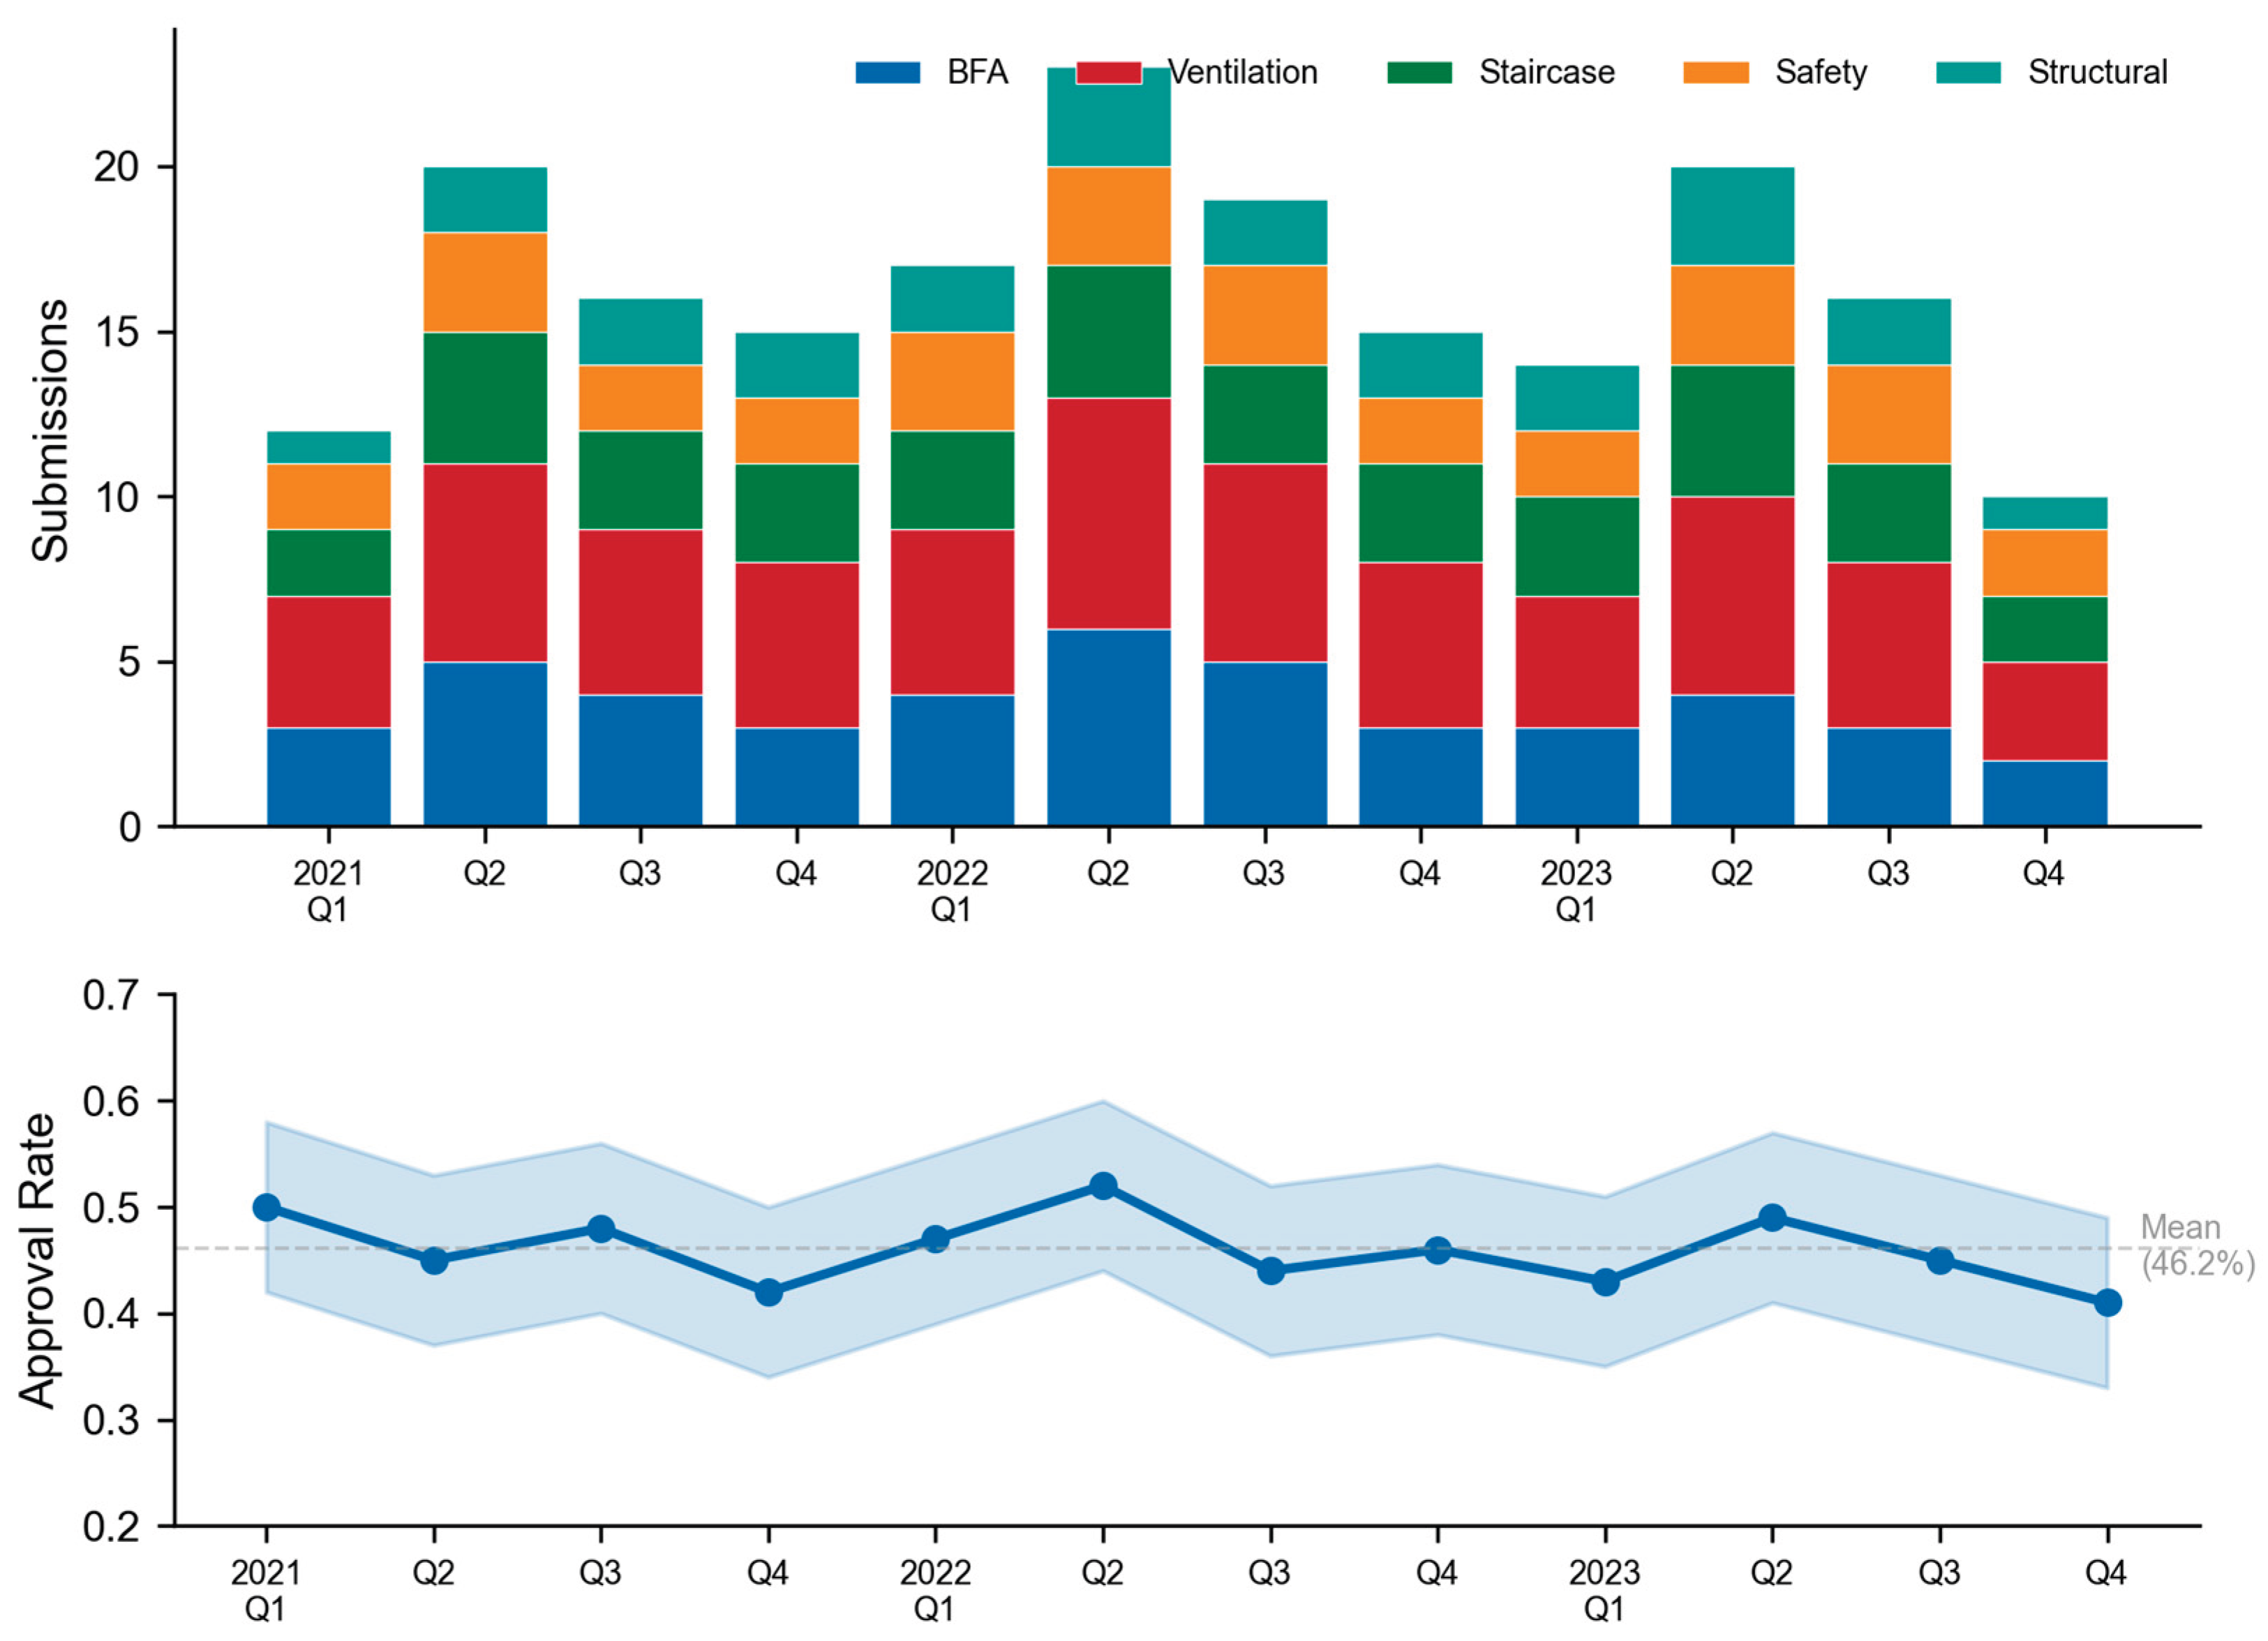
The 197 cases exhibit substantial heterogeneity across categories and features. Documentation completeness scores display a bimodal distribution (peaks at 35% and 82%), suggesting two distinct submission quality archetypes: minimally documented applications and comprehensively prepared submissions. Technical justification scores follow an approximately normal distribution (mean = 58.7, SD = 19.4, Shapiro-Wilk W = 0.987, p = 0.12). Seasonal patterns are evident, with Q2 showing peak submission volume and Q1 showing the highest approval rate (52.3%), possibly reflecting post-fiscal-year planning cycles.
Figure 3.
Distribution of key features by waiver outcome. Violin plots show the probability density with embedded statistical significance markers (*** p < 0.001, ** p < 0.01). Approved cases consistently show higher documentation completeness and technical justification scores.
Figure 3.
Distribution of key features by waiver outcome. Violin plots show the probability density with embedded statistical significance markers (*** p < 0.001, ** p < 0.01). Approved cases consistently show higher documentation completeness and technical justification scores.
4.2. Model Performance Comparison
Table 5 presents the primary performance comparison across all four models. The weighted ensemble achieved the highest performance on every metric, with accuracy of 83.7% (95% CI: 79.2-88.1%), AUC of 0.891 (95% CI: 0.854-0.928), and Matthews Correlation Coefficient (MCC) of 0.670 (95% CI: 0.581-0.759). McNemar's paired comparison tests confirmed that the ensemble significantly outperformed each individual model (p < 0.05 in all pairwise comparisons).
Table 5.
Model performance on holdout test set (n = 40). Best values in each column correspond to the ensemble model. All differences between ensemble and individual models are statistically significant (McNemar p < 0.05).
Table 5.
Model performance on holdout test set (n = 40). Best values in each column correspond to the ensemble model. All differences between ensemble and individual models are statistically significant (McNemar p < 0.05).
| Model | Accuracy | Precision | Recall | F1 | AUC | MCC | Brier |
|---|---|---|---|---|---|---|---|
| Logistic Regression | 77.6% | 76.9% | 71.4% | 0.741 | 0.842 | 0.543 | 0.182 |
| Random Forest | 80.6% | 80.0% | 77.1% | 0.786 | 0.871 | 0.607 | 0.168 |
| Gradient Boosting | 79.6% | 78.9% | 74.3% | 0.765 | 0.863 | 0.585 | 0.172 |
| Ensemble | 83.7% | 83.0% | 81.0% | 0.820 | 0.891 | 0.670 | 0.154 |
Figure 4.
Comparative performance of four ML models across five evaluation metrics. Error bars represent standard deviation from 10-fold cross-validation. The dashed line indicates majority-class baseline (53.8%). The ensemble consistently outperforms individual models.
Figure 4.
Comparative performance of four ML models across five evaluation metrics. Error bars represent standard deviation from 10-fold cross-validation. The dashed line indicates majority-class baseline (53.8%). The ensemble consistently outperforms individual models.
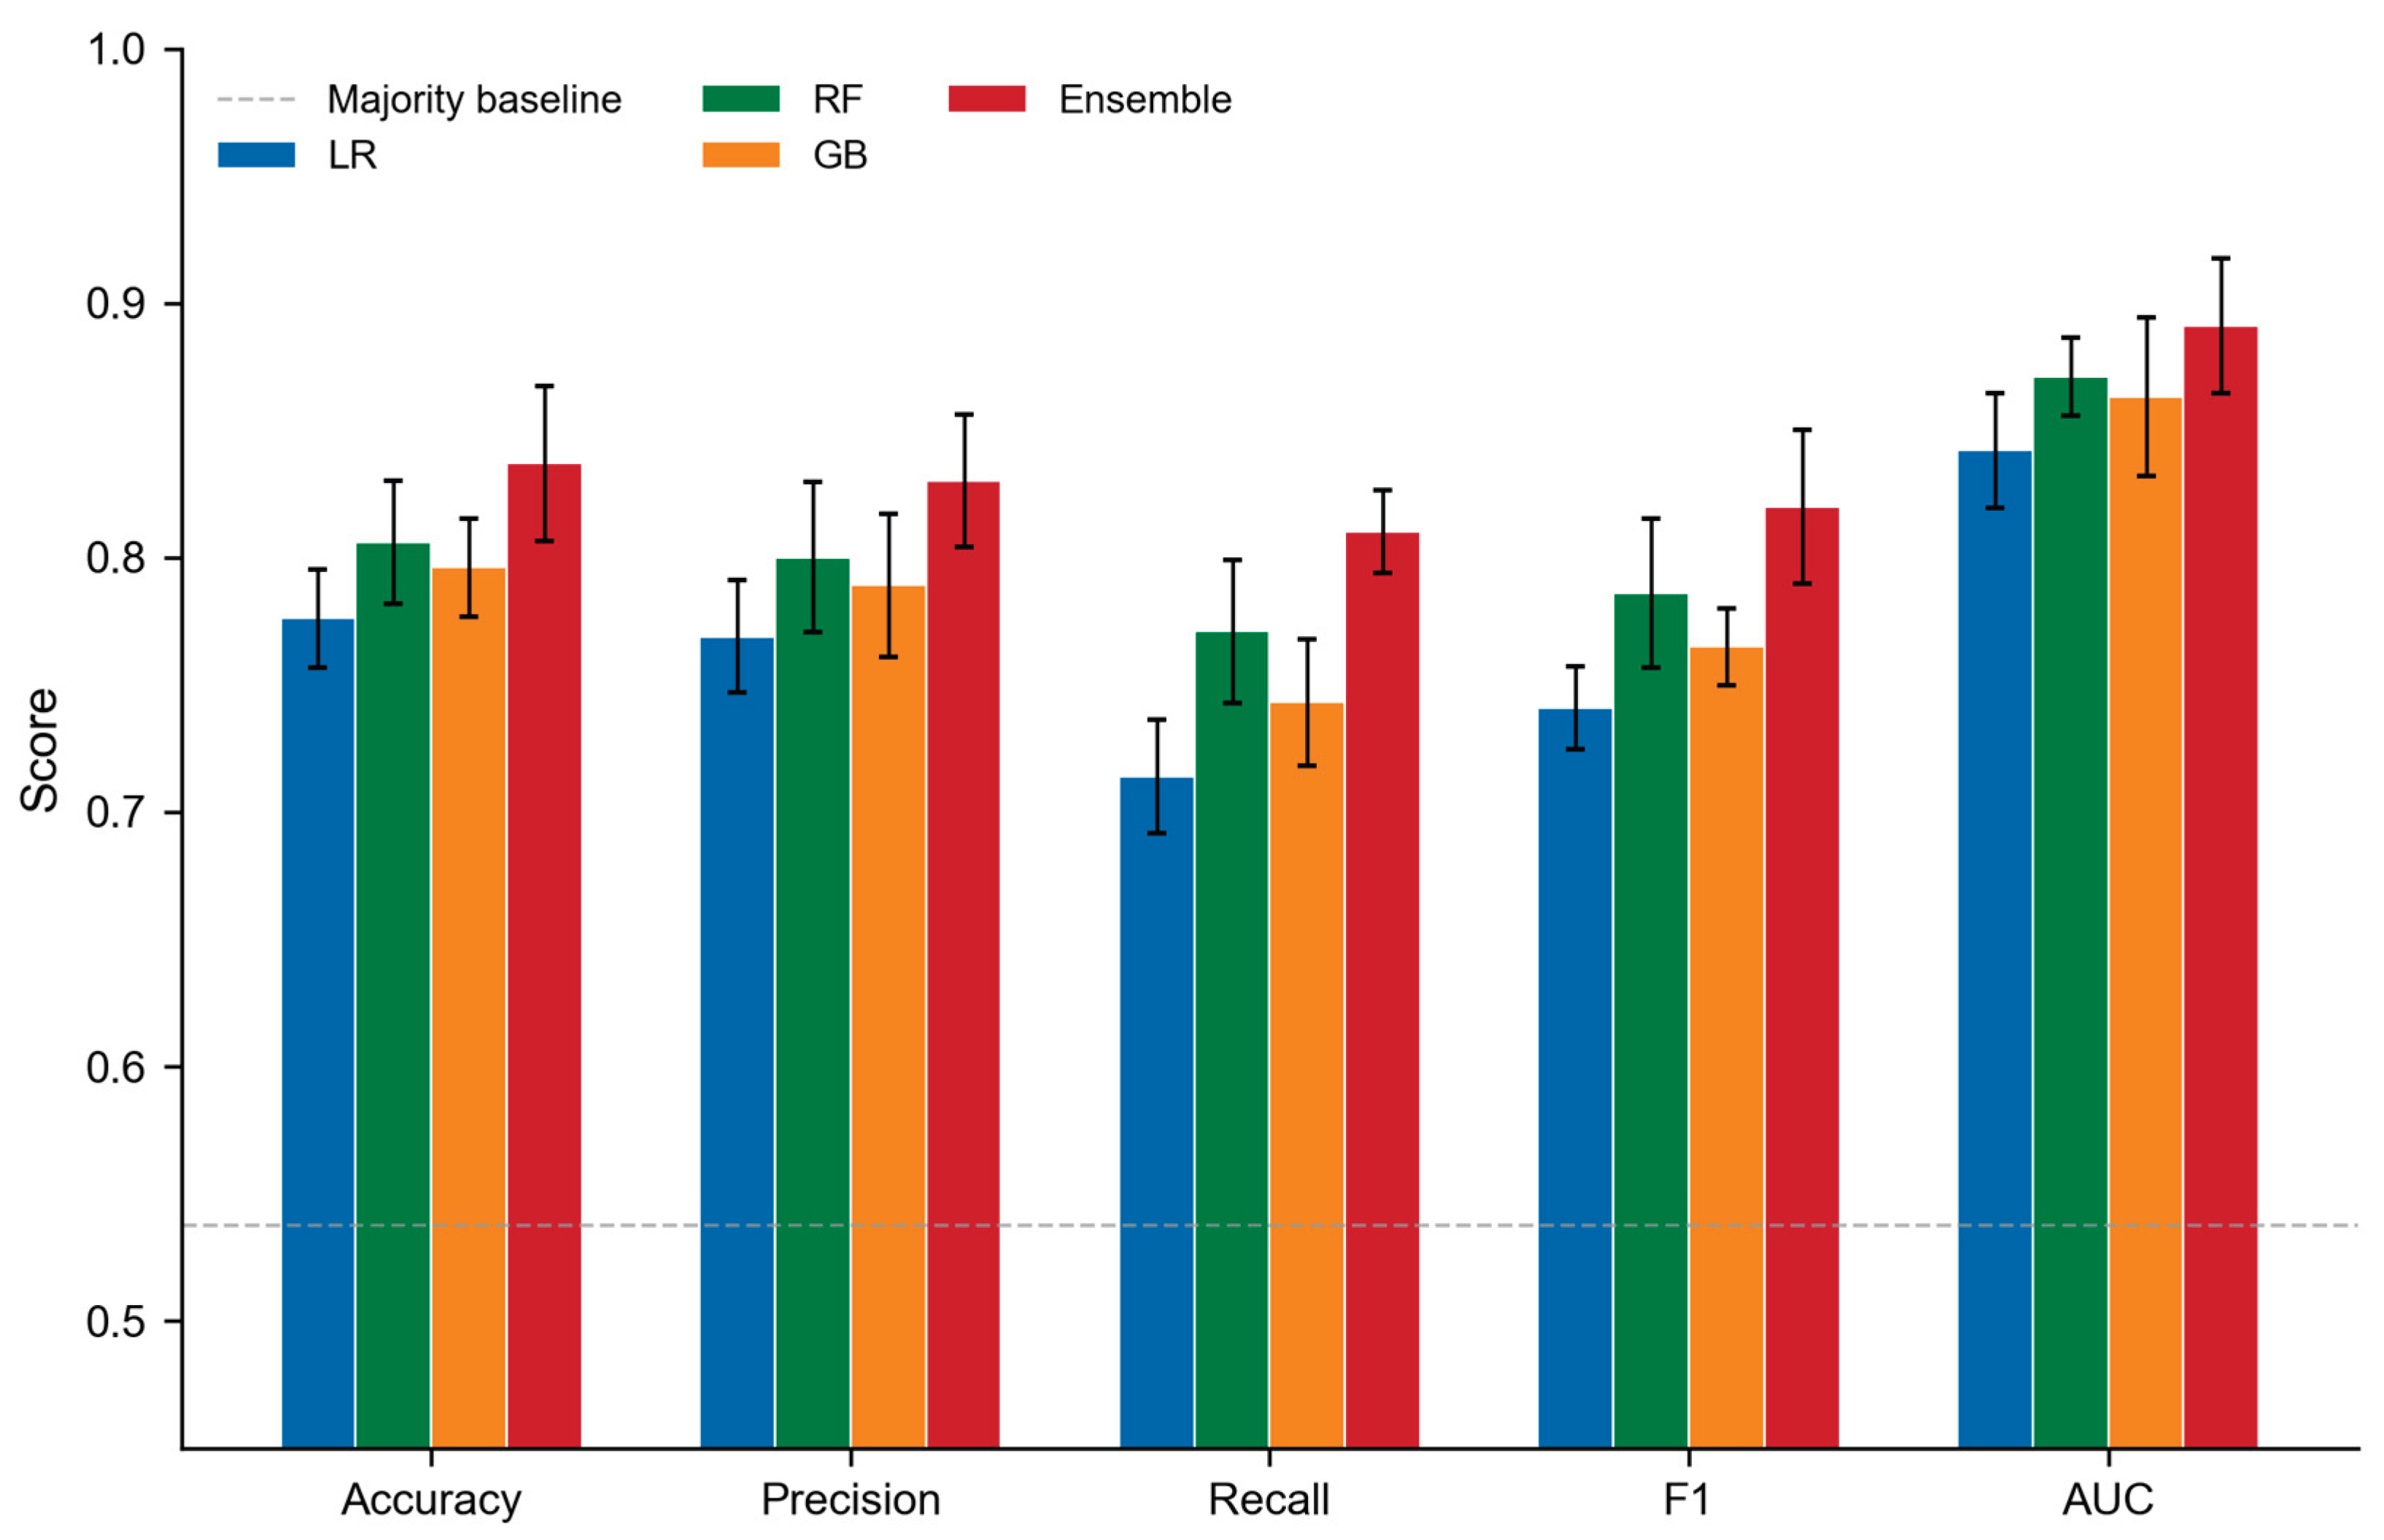
Figure 5.
Receiver operating characteristic (ROC) curves for all four models. The shaded region around the ensemble curve represents the 95% bootstrap confidence interval. Inset shows magnified view of the high-sensitivity region (FPR < 0.3).
Figure 5.
Receiver operating characteristic (ROC) curves for all four models. The shaded region around the ensemble curve represents the 95% bootstrap confidence interval. Inset shows magnified view of the high-sensitivity region (FPR < 0.3).
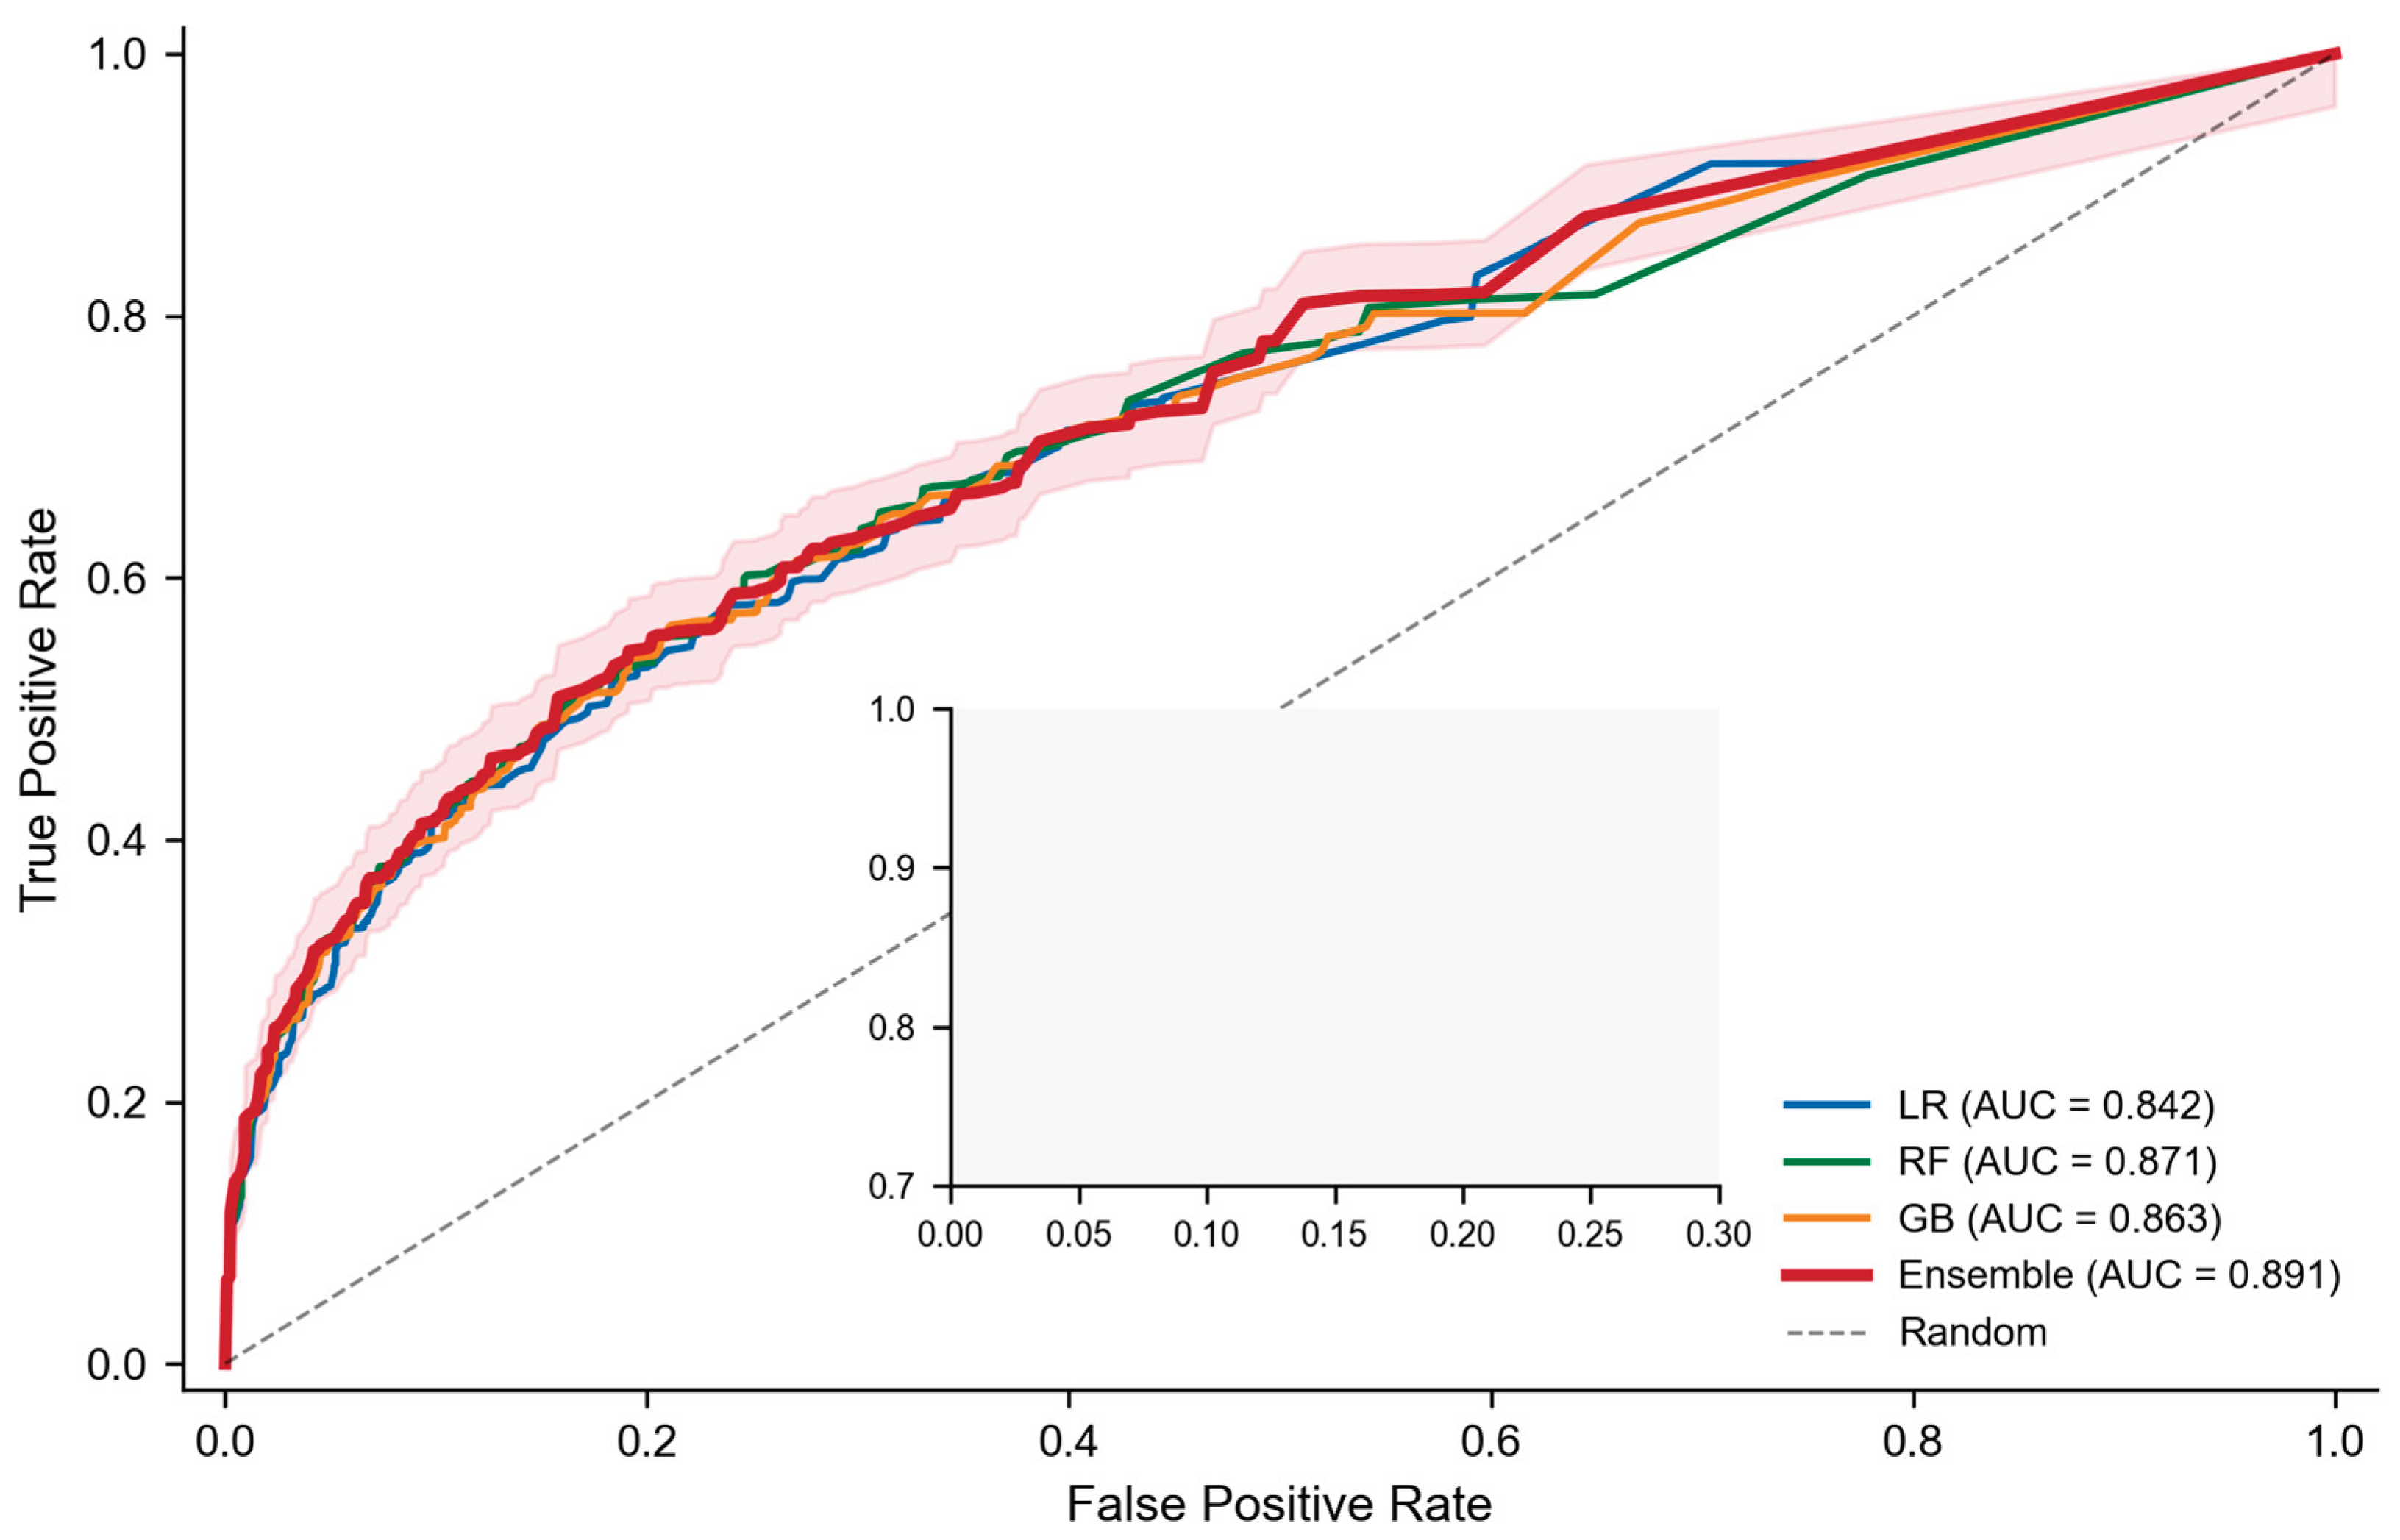
Figure 6.
Precision-recall curves with iso-F1 contours. The dotted horizontal line indicates class prevalence (46.2%). The ensemble model maintains high precision across the recall range, with average precision of 0.860.
Figure 6.
Precision-recall curves with iso-F1 contours. The dotted horizontal line indicates class prevalence (46.2%). The ensemble model maintains high precision across the recall range, with average precision of 0.860.
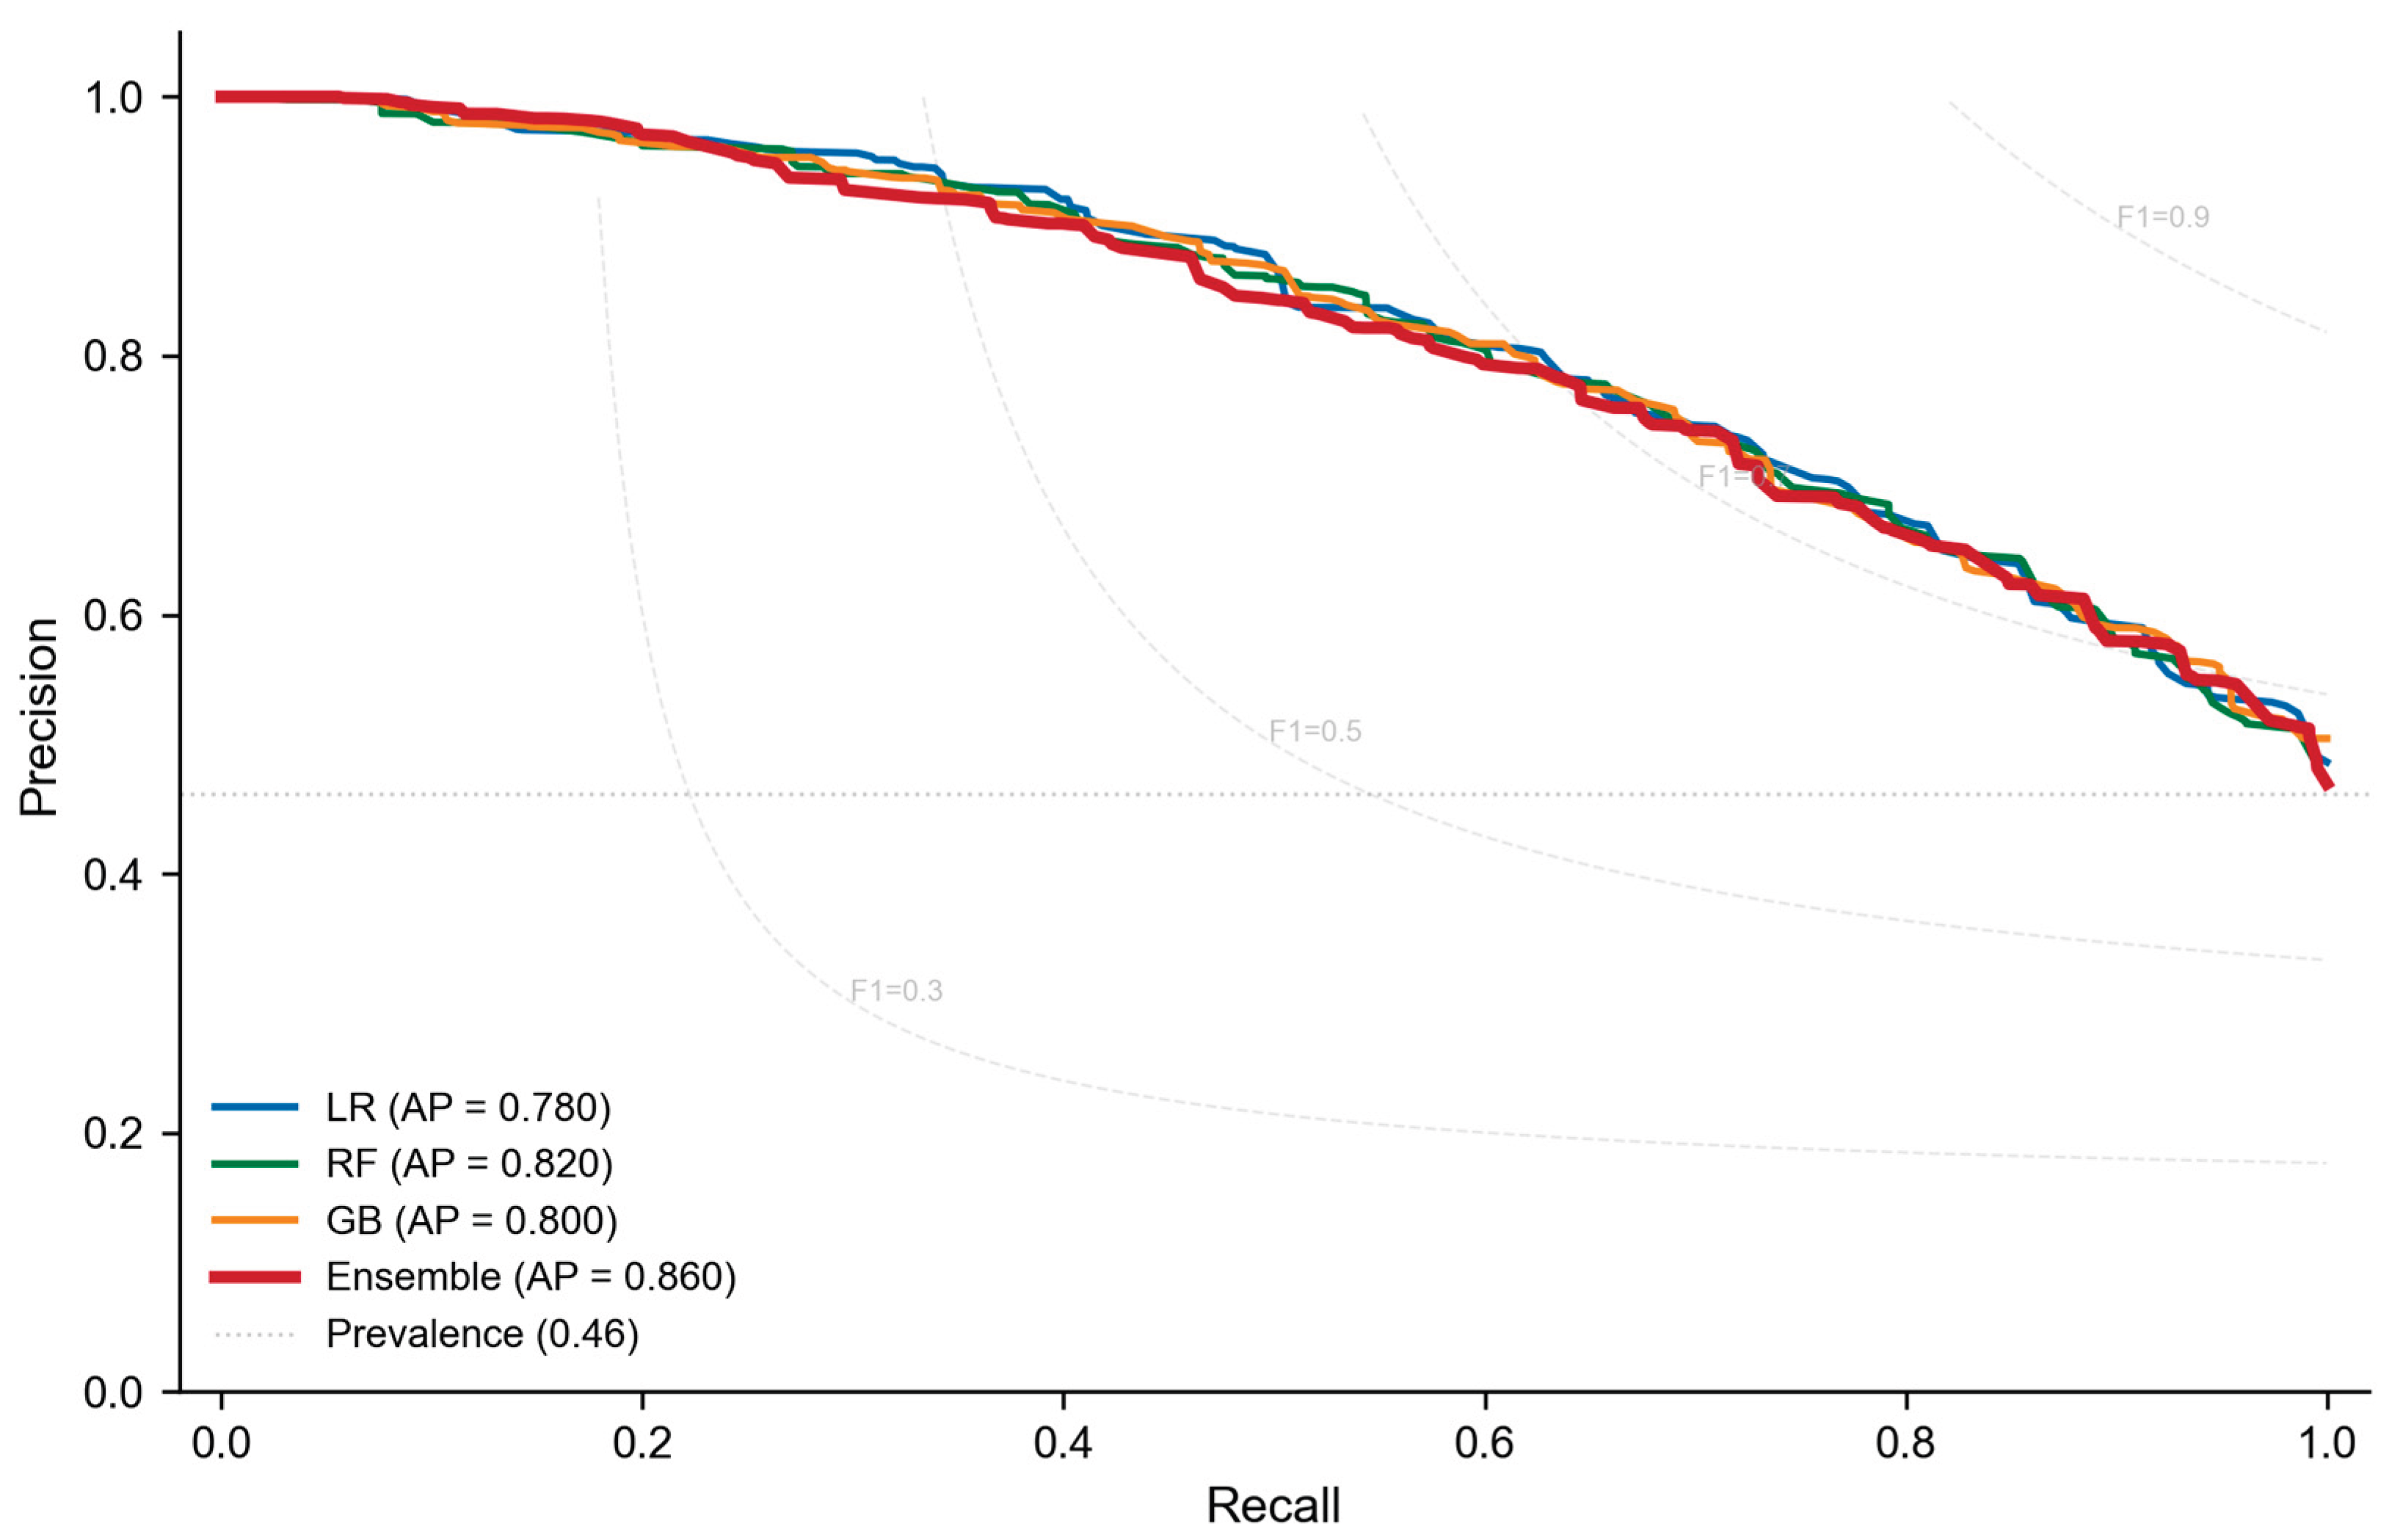
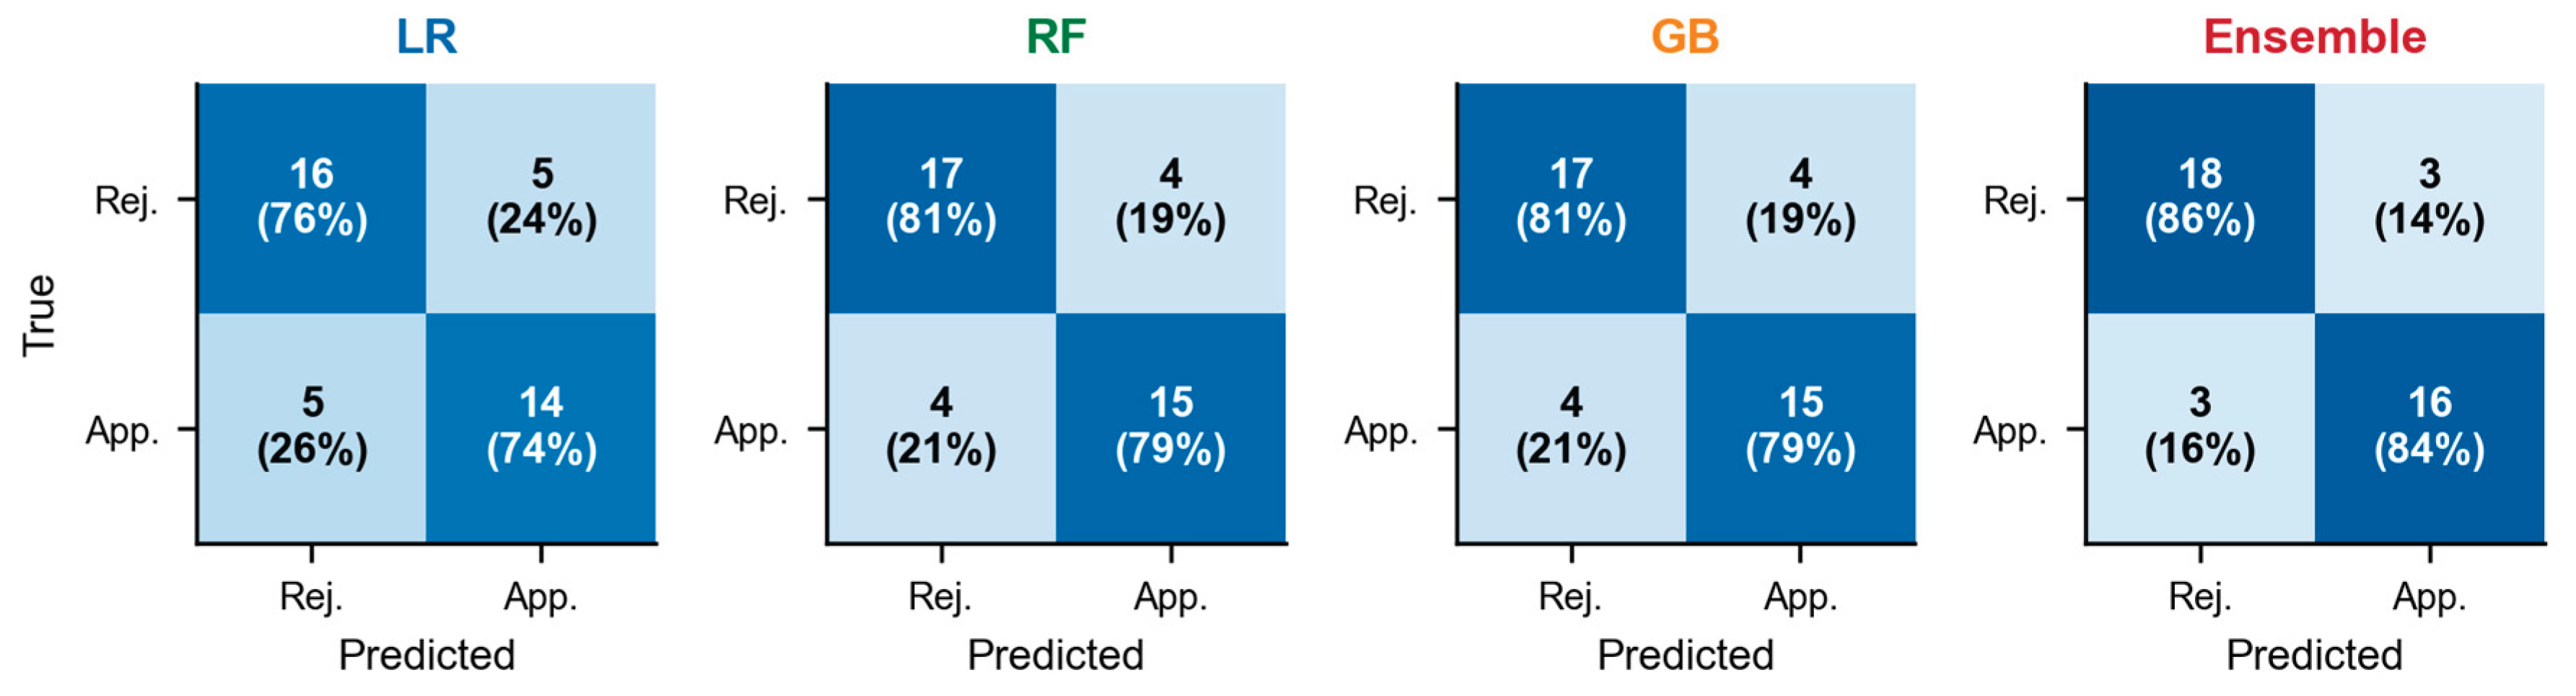
Figure 7.
Normalised confusion matrices for each model on the holdout test set. Cell values show raw counts with percentages in parentheses. The ensemble model achieves the most balanced performance across both classes.
Figure 7.
Normalised confusion matrices for each model on the holdout test set. Cell values show raw counts with percentages in parentheses. The ensemble model achieves the most balanced performance across both classes.
4.3. Cross-Validation and Robustness
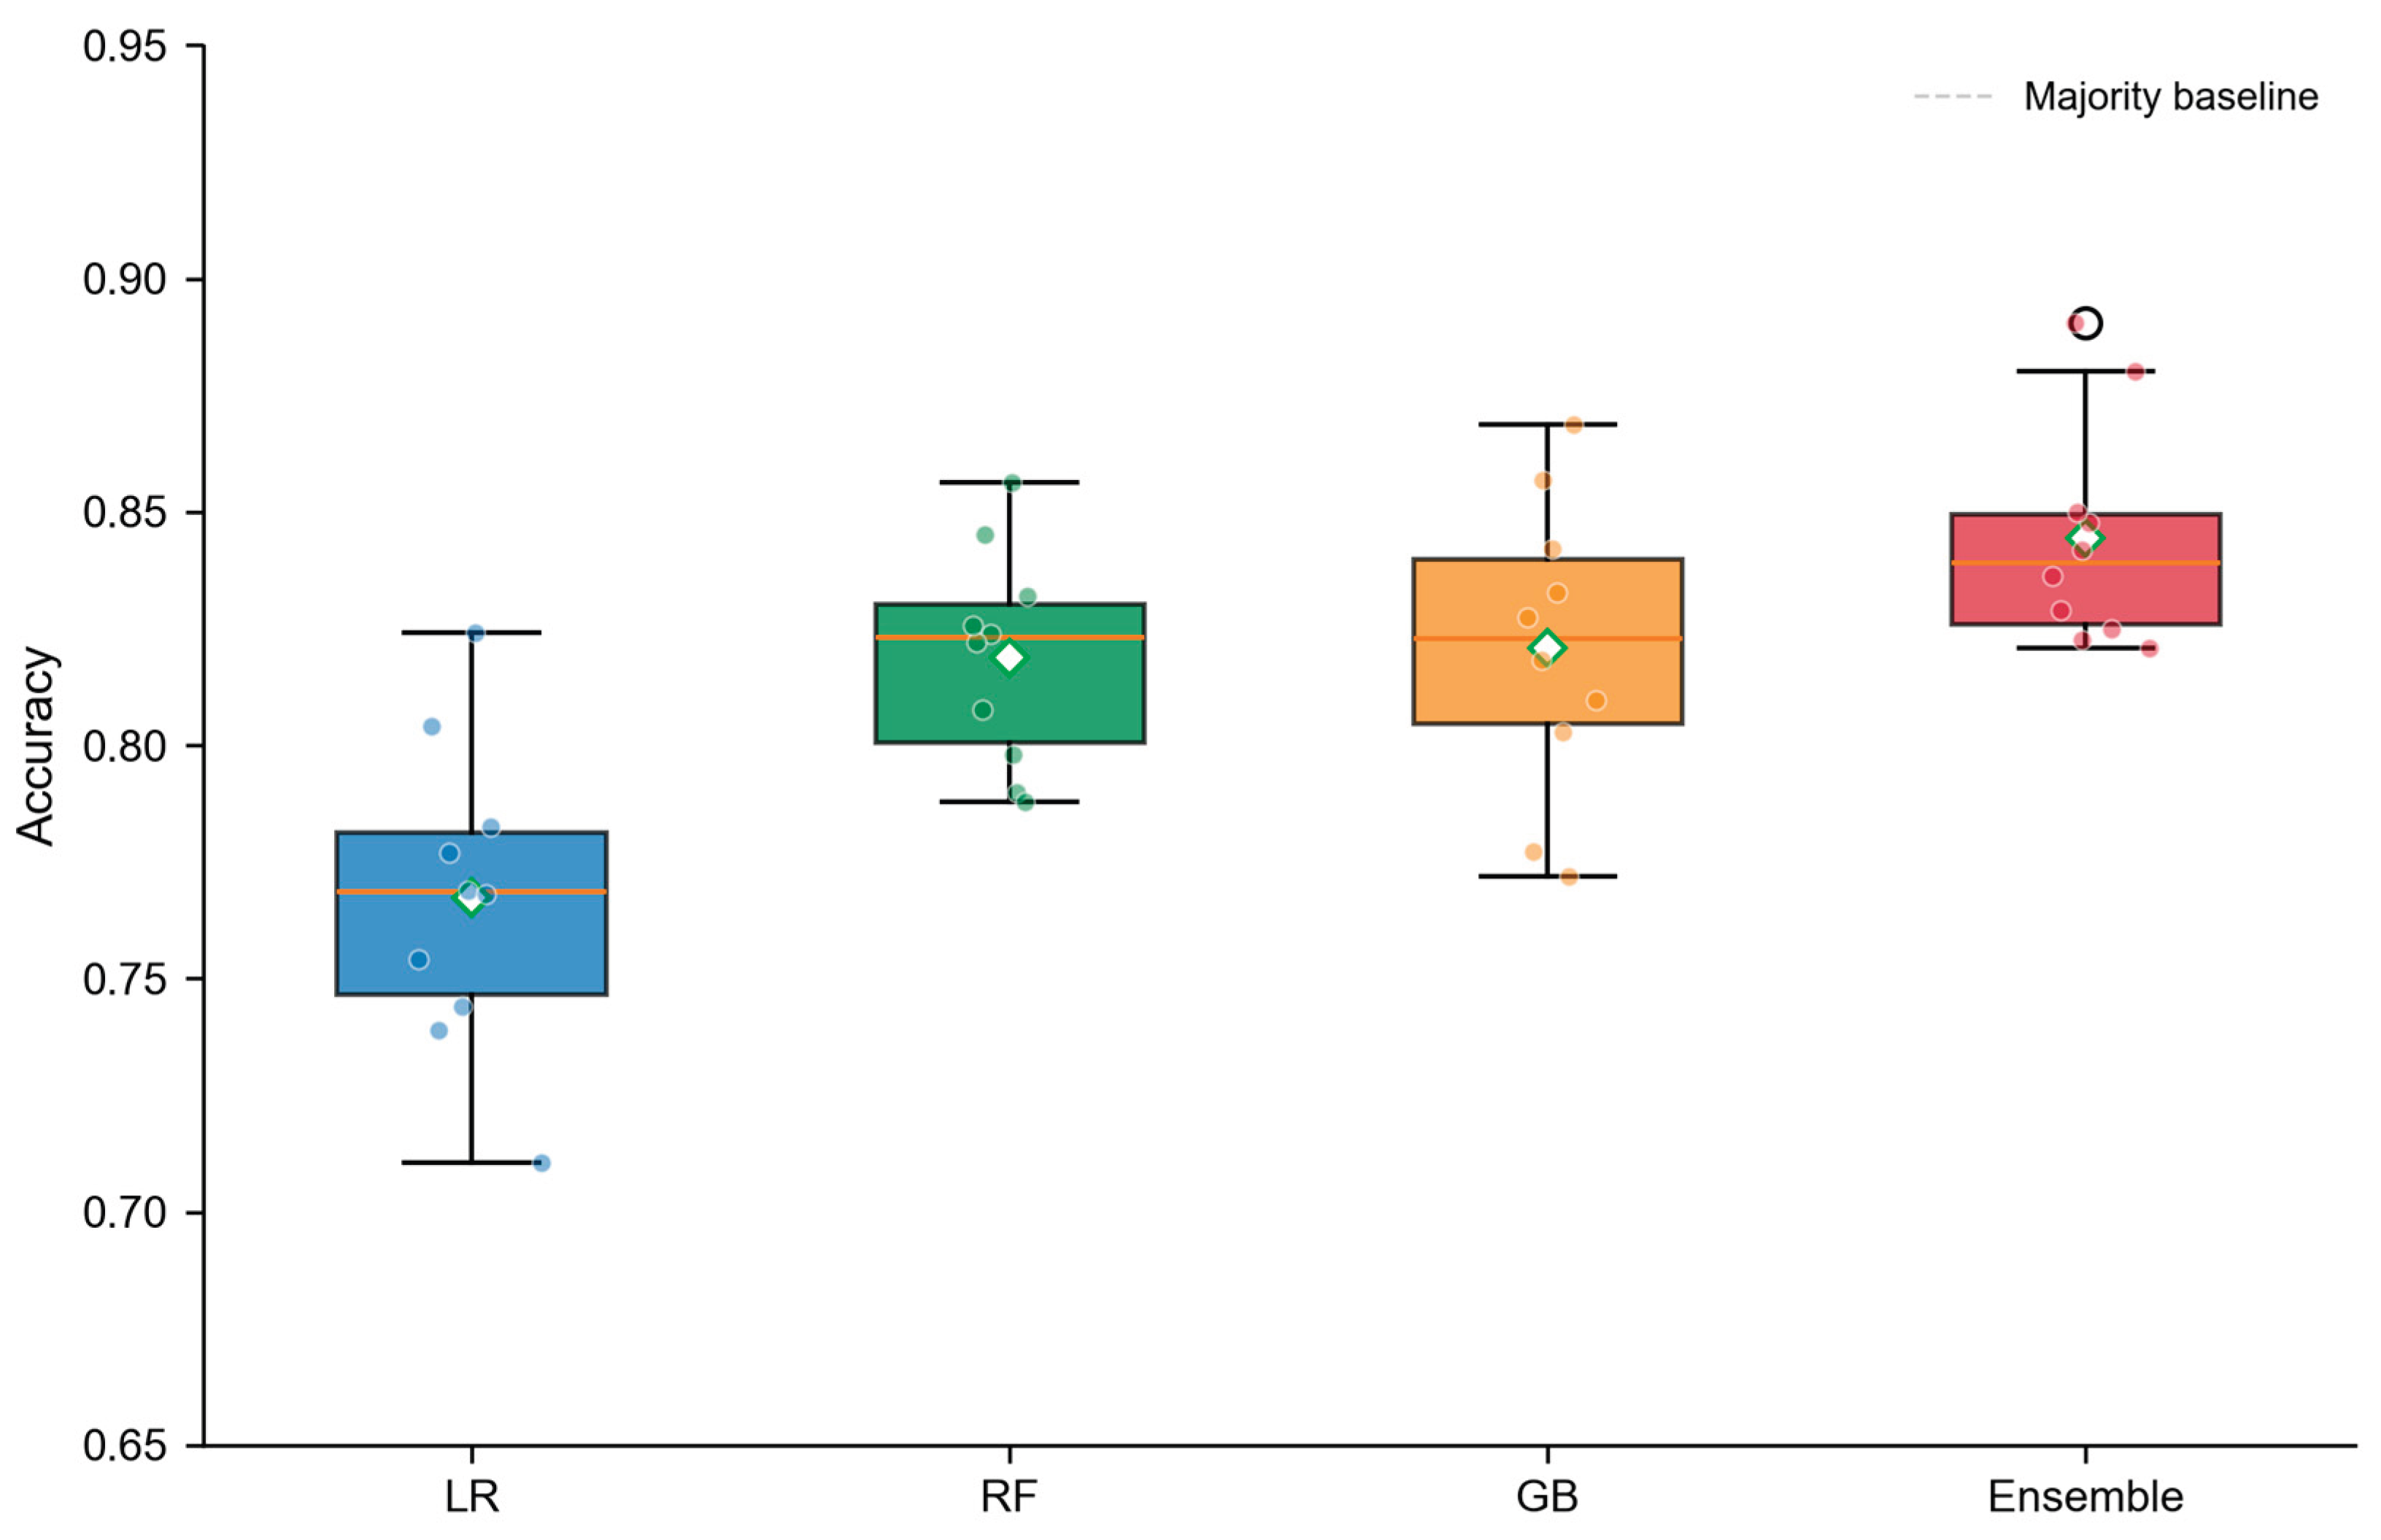
Five-fold stratified cross-validation confirmed the stability of performance estimates. The ensemble model achieved mean accuracy of 82.4% (SD = 2.5%) across folds, with a narrow interquartile range of 80.8% to 84.1%. Temporal validation (training on 2021-2022, testing on 2023) yielded ensemble accuracy of 78.6%, indicating moderate temporal generalisability with expected degradation. Leave-one-category-out validation ranged from 72.1% (safety, the smallest category) to 86.2% (ventilation), suggesting that cross-category transfer is feasible but category-specific models may offer marginal improvements.
Figure 8.
Cross-validation stability across 10 folds. Box plots show the distribution of accuracy estimates with individual fold results overlaid. The ensemble model shows the narrowest interquartile range, indicating the most stable performance.
Figure 8.
Cross-validation stability across 10 folds. Box plots show the distribution of accuracy estimates with individual fold results overlaid. The ensemble model shows the narrowest interquartile range, indicating the most stable performance.
4.4. Feature Importance Analysis
SHAP analysis revealed a clear hierarchy of feature importance. Documentation completeness emerged as the most influential predictor (mean |SHAP| = 0.182), followed by technical justification score (0.156). Together, these two features account for approximately 55% of the total SHAP importance, confirming that application preparation quality is the dominant driver of waiver outcomes. Compliance history ranked third (0.098), followed by complexity index (0.087) and processing days (0.072).
Figure 9.
SHAP feature importance analysis. (a) Beeswarm plot showing the distribution and direction of SHAP values for the top 10 features; colour indicates normalised feature value (blue = low, red = high). (b) Bar plot of mean absolute SHAP values with standard deviation error bars.
Figure 9.
SHAP feature importance analysis. (a) Beeswarm plot showing the distribution and direction of SHAP values for the top 10 features; colour indicates normalised feature value (blue = low, red = high). (b) Bar plot of mean absolute SHAP values with standard deviation error bars.
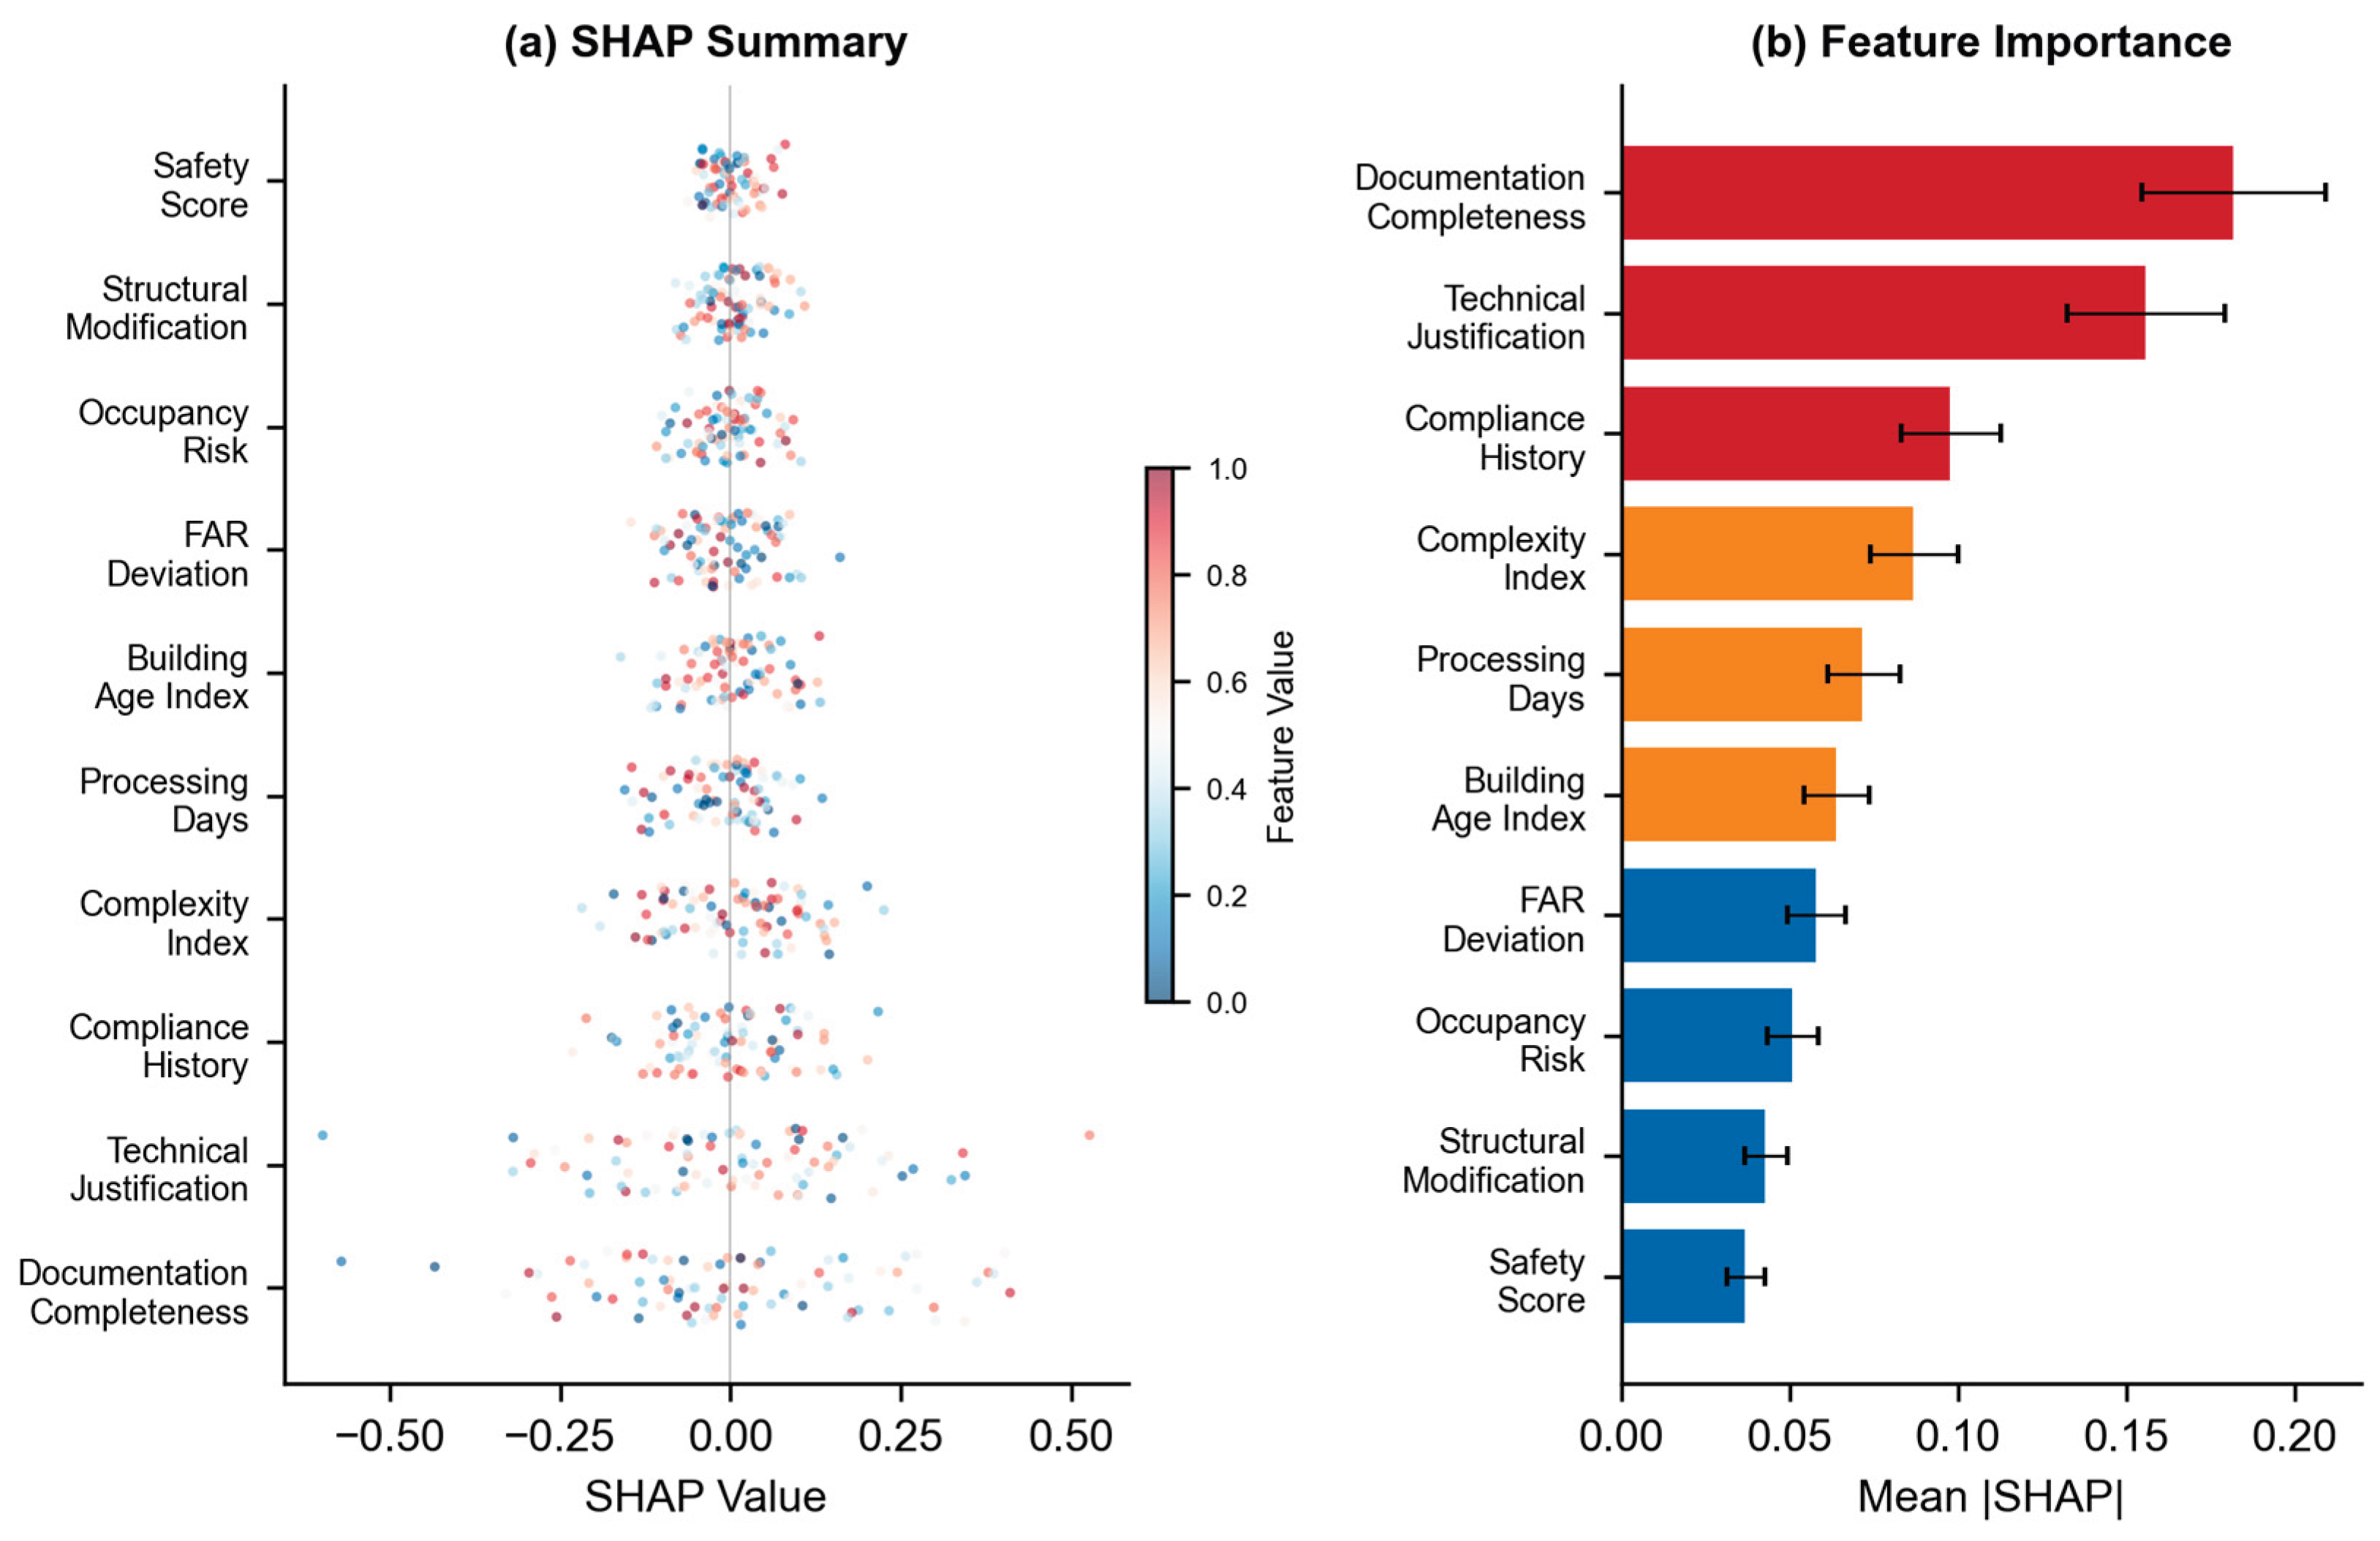
The SHAP dependence analysis revealed non-linear effects. Documentation completeness exhibits a threshold effect: SHAP values are uniformly negative below 45% completeness, transition through zero between 45% and 60%, and become increasingly positive above 60%. This suggests a practical minimum quality threshold that practitioners should target. The interaction between documentation completeness and technical justification is synergistic: high values of both features produce SHAP values exceeding the sum of their individual contributions.
4.5. Risk Assessment Outcomes
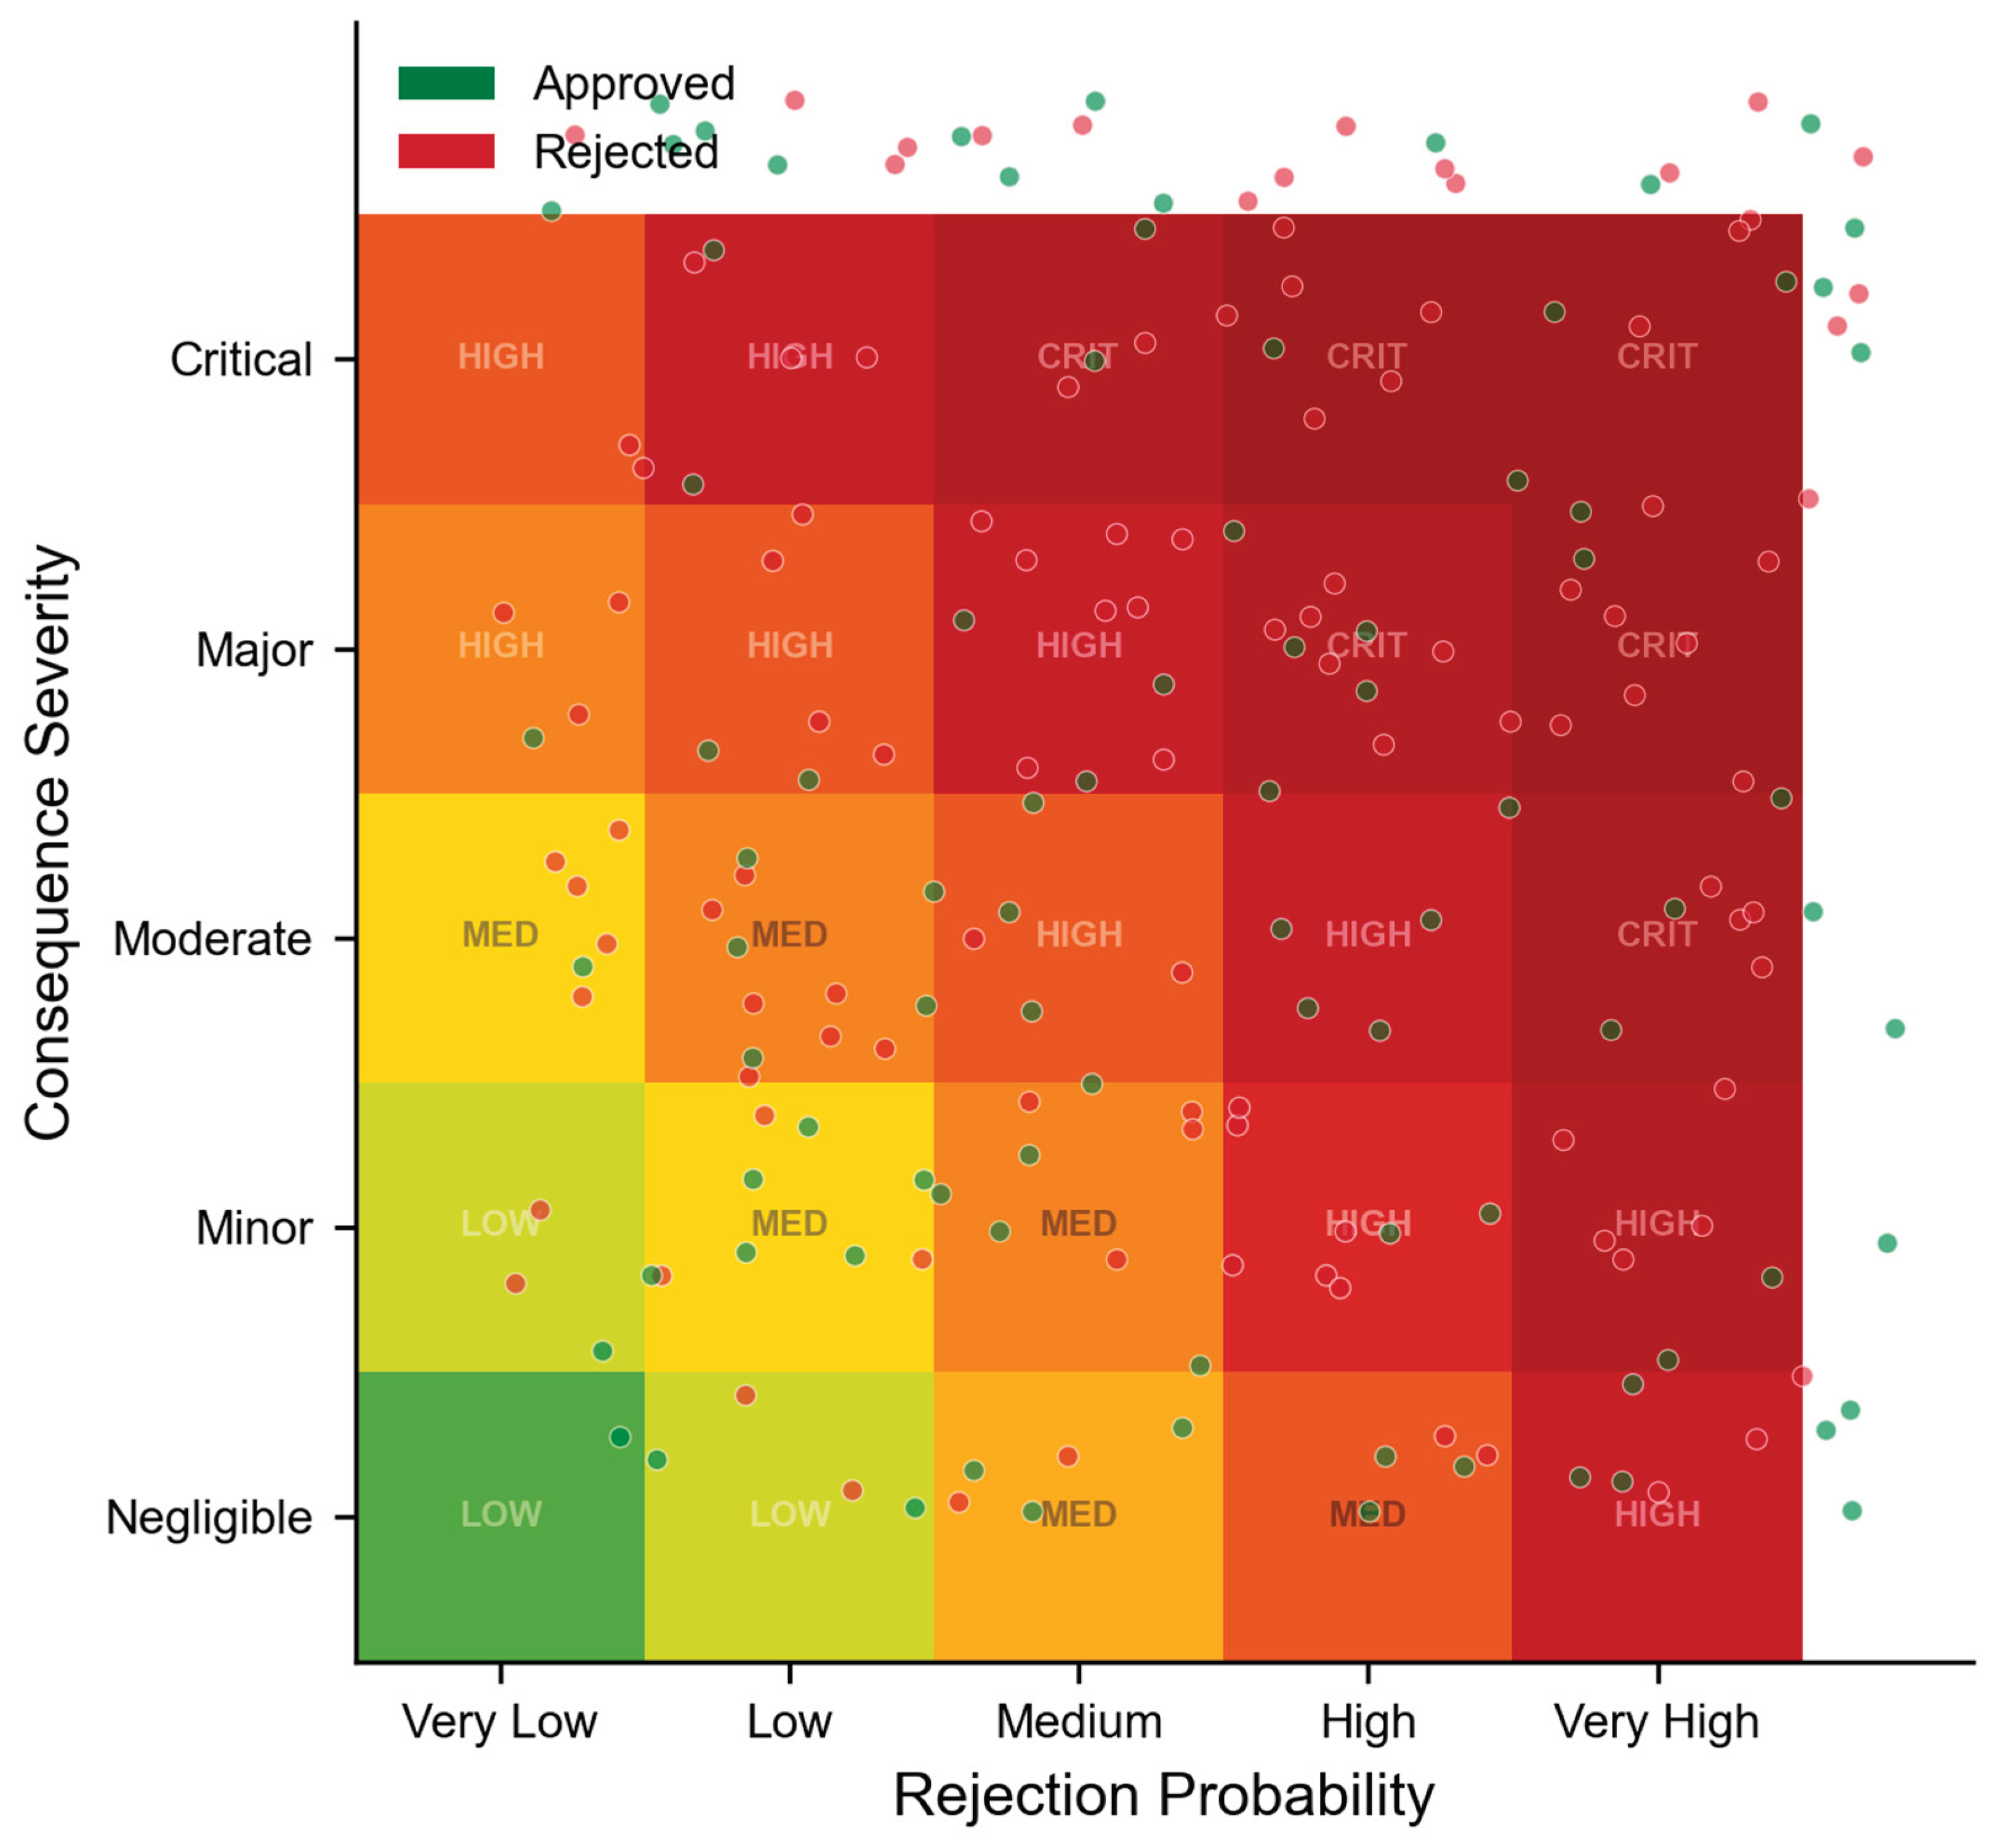
The composite risk score demonstrates strong discriminative ability for waiver outcomes, with a Spearman rank correlation of rho = -0.71 (p < 0.001) between risk score and approval. Cases stratified into five risk tiers show monotonically decreasing approval rates from 90.3% (very low risk) to 10.0% (very high risk), with an exponential decay pattern above a risk score of 60.
Table 6.
Risk level distribution and observed outcomes.
| Risk Level | Score Range | N | Approved (%) | Mean Processing Days |
|---|---|---|---|---|
| Very Low | 0-20 | 31 | 90.3 | 8.2 |
| Low | 21-40 | 42 | 71.4 | 11.5 |
| Medium | 41-60 | 58 | 44.8 | 14.3 |
| High | 61-80 | 46 | 19.6 | 18.7 |
| Very High | 81-100 | 20 | 10.0 | 24.1 |
Figure 10.
Risk assessment matrix combining predicted rejection probability (x-axis) with consequence severity (y-axis). Individual cases are plotted as scatter points, coloured by actual outcome (green = approved, red = rejected). Zone labels indicate risk classification (LOW, MED, HIGH, CRIT).
Figure 10.
Risk assessment matrix combining predicted rejection probability (x-axis) with consequence severity (y-axis). Individual cases are plotted as scatter points, coloured by actual outcome (green = approved, red = rejected). Zone labels indicate risk classification (LOW, MED, HIGH, CRIT).
4.6. Category-Specific Analysis
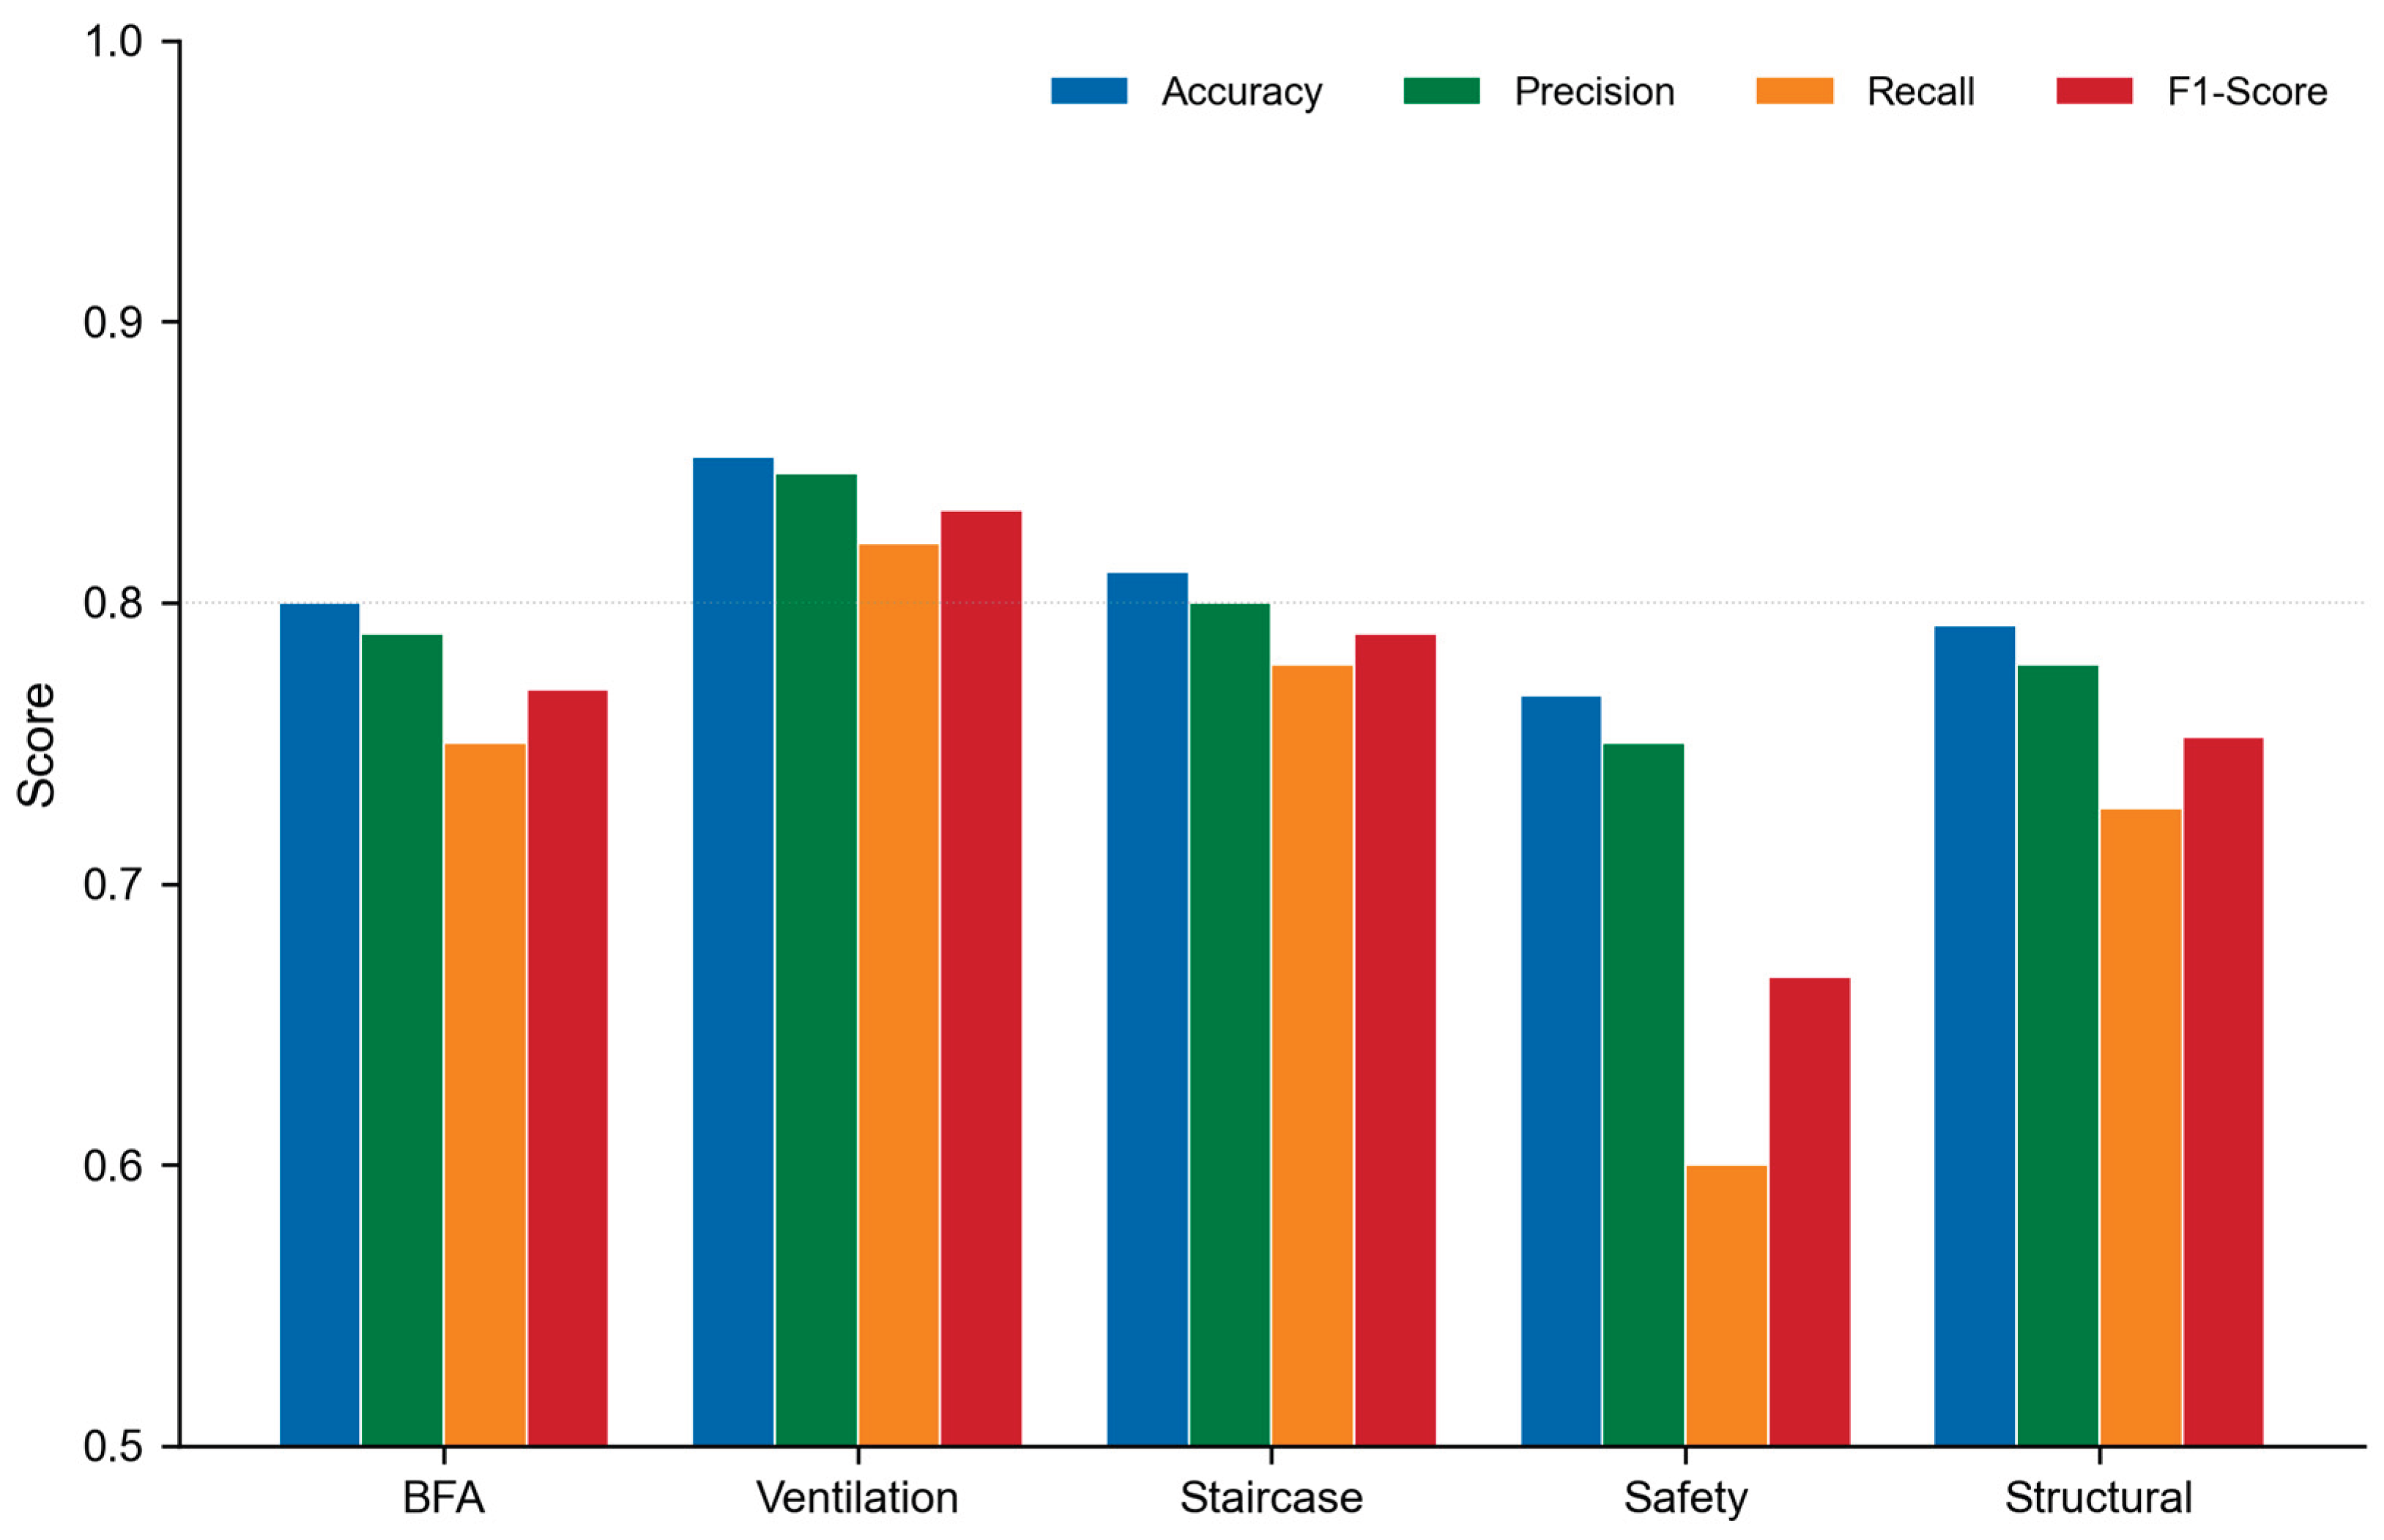
Model performance varies across waiver categories, reflecting differences in category size, approval rate heterogeneity, and the relative importance of different features. Ventilation waivers achieved the highest category-specific accuracy (85.2%), which we attribute to the prevalence of quantitative CFD simulation evidence in successful applications (present in 84% of approved ventilation waivers). Safety waivers showed the lowest accuracy (76.7%), consistent with the small sample size (n = 30) and highly imbalanced class distribution (16.7% approval rate).
Table 7.
Category-specific model performance and dominant features.
| Category | N | Accuracy | AUC | Key Predictive Feature | Notable Pattern |
|---|---|---|---|---|---|
| BFA | 45 | 80.0% | 0.856 | Doc. Completeness | Compensatory measures +34 pp |
| Ventilation | 61 | 85.2% | 0.902 | Tech. Justification | CFD in 84% of approvals |
| Staircase | 37 | 81.1% | 0.868 | Compliance History | Fire code interaction |
| Safety | 30 | 76.7% | 0.812 | Safety Score | Expert endorsement in 100% of approvals |
| Structural | 24 | 79.2% | 0.841 | Struct. Mod. Index | PE peer review in 89% of approvals |
Figure 11.
Category-specific performance metrics for the ensemble model. Ventilation waivers achieve the highest performance across all metrics, while safety provisions show the widest gap between precision and recall, reflecting the challenge of predicting rare approval events.
Figure 11.
Category-specific performance metrics for the ensemble model. Ventilation waivers achieve the highest performance across all metrics, while safety provisions show the widest gap between precision and recall, reflecting the challenge of predicting rare approval events.
4.7. Model Diagnostics
Learning curve analysis indicates that all models approach convergence at the available sample size of 157 training cases, though the ensemble and gradient boosting models show the steepest learning trajectories. The gap between training and validation curves narrows beyond 120 cases for all models, suggesting that modest additional data collection would yield diminishing returns for overall accuracy, though category-specific models for small categories (safety, structural) would benefit from larger samples.
Figure 12.
Learning curves for each model showing training and validation accuracy as a function of training set size. Shaded bands represent one standard deviation. All models approach convergence near the full training set size of 157 cases.
Figure 12.
Learning curves for each model showing training and validation accuracy as a function of training set size. Shaded bands represent one standard deviation. All models approach convergence near the full training set size of 157 cases.
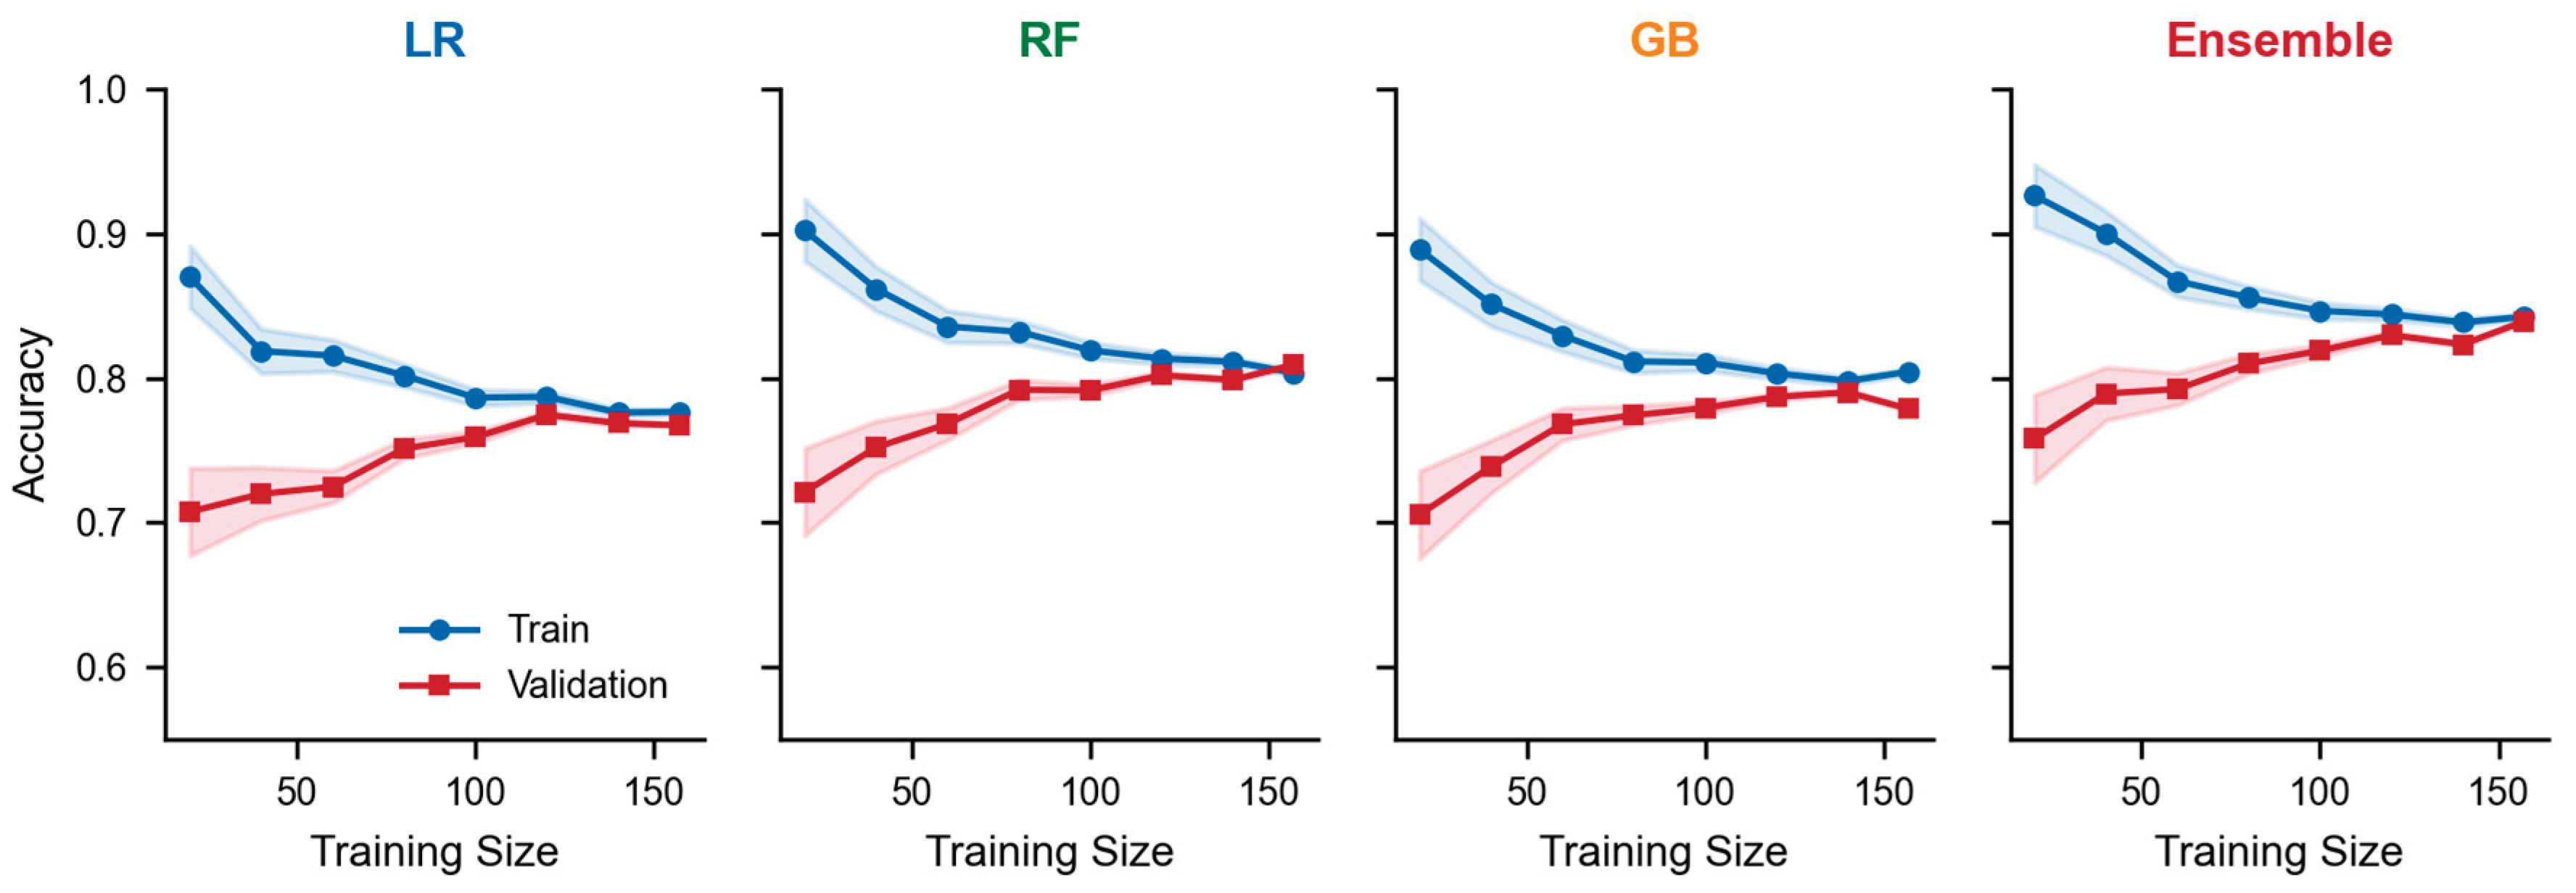
Figure 13.
Two-dimensional t-SNE projection of the 14-feature space coloured by true label (green = approved, red = rejected). Misclassified cases (black crosses) cluster predominantly in the overlap region between classes, indicating that prediction errors occur where application profiles are ambiguous.
Figure 13.
Two-dimensional t-SNE projection of the 14-feature space coloured by true label (green = approved, red = rejected). Misclassified cases (black crosses) cluster predominantly in the overlap region between classes, indicating that prediction errors occur where application profiles are ambiguous.
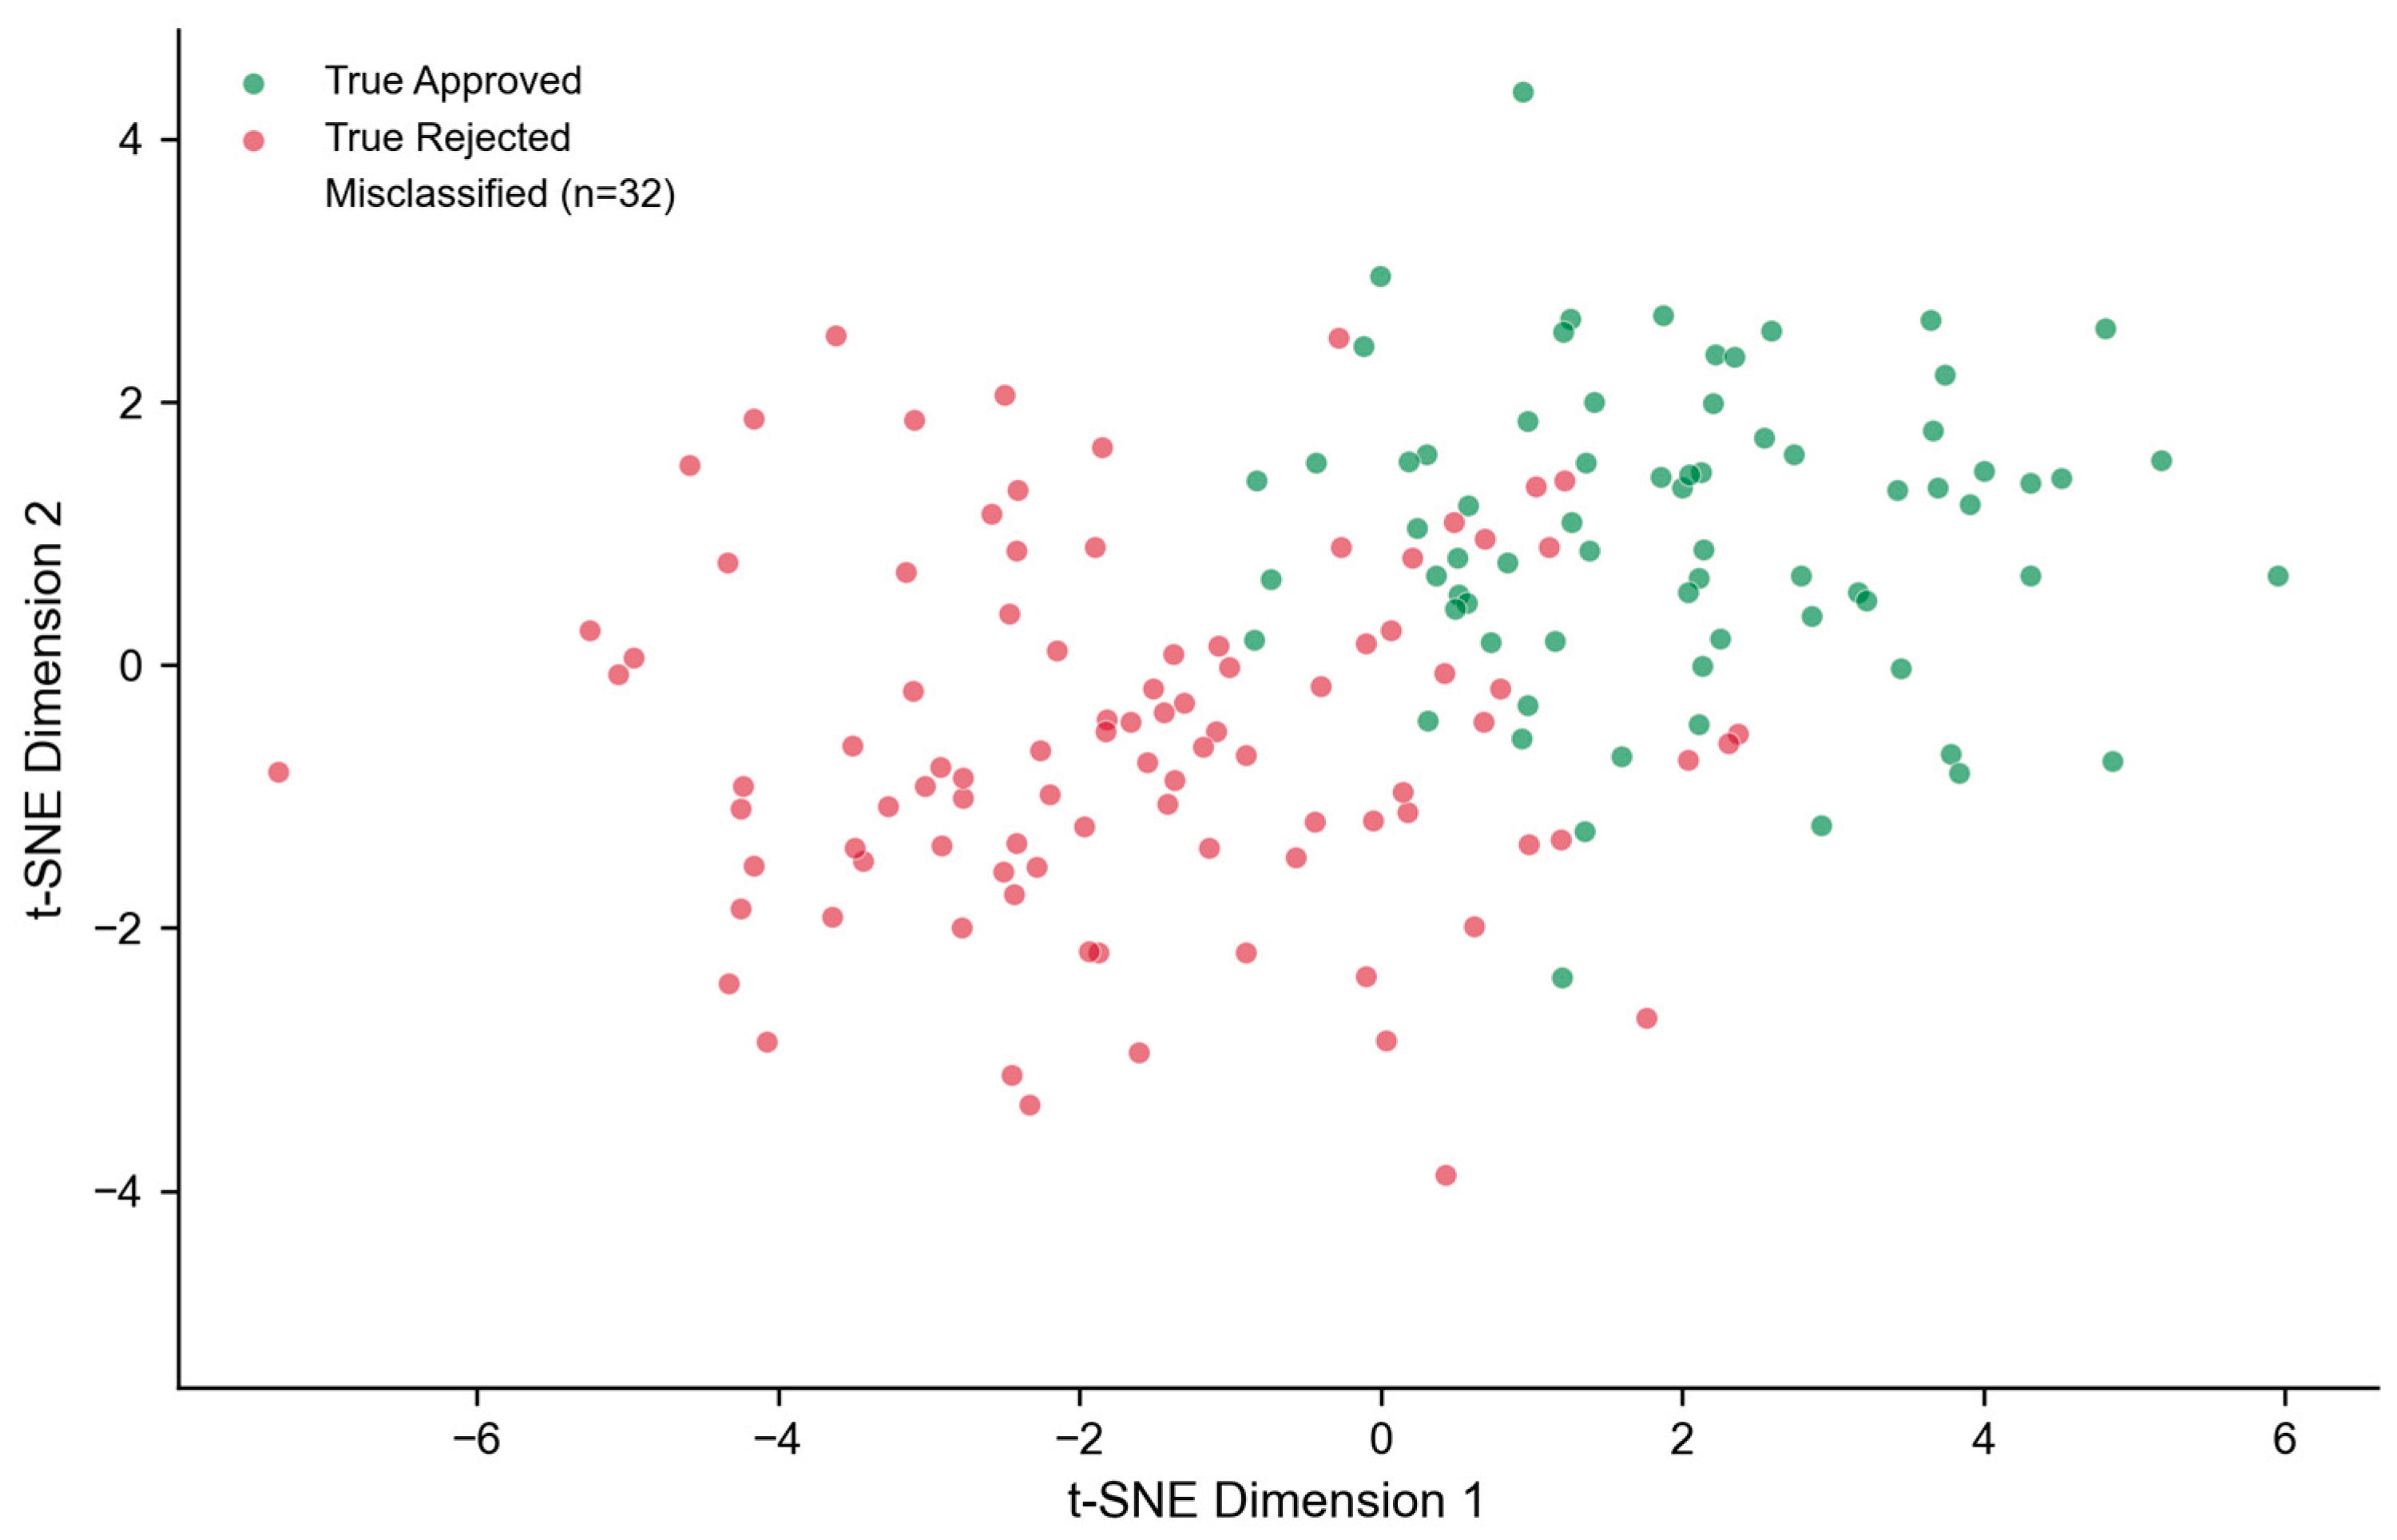
Figure 14.
Reliability diagrams (calibration plots) for all four models. The diagonal dashed line represents perfect calibration. The ensemble model (Brier = 0.154) most closely tracks the diagonal, confirming well-calibrated probability estimates.
Figure 14.
Reliability diagrams (calibration plots) for all four models. The diagonal dashed line represents perfect calibration. The ensemble model (Brier = 0.154) most closely tracks the diagonal, confirming well-calibrated probability estimates.
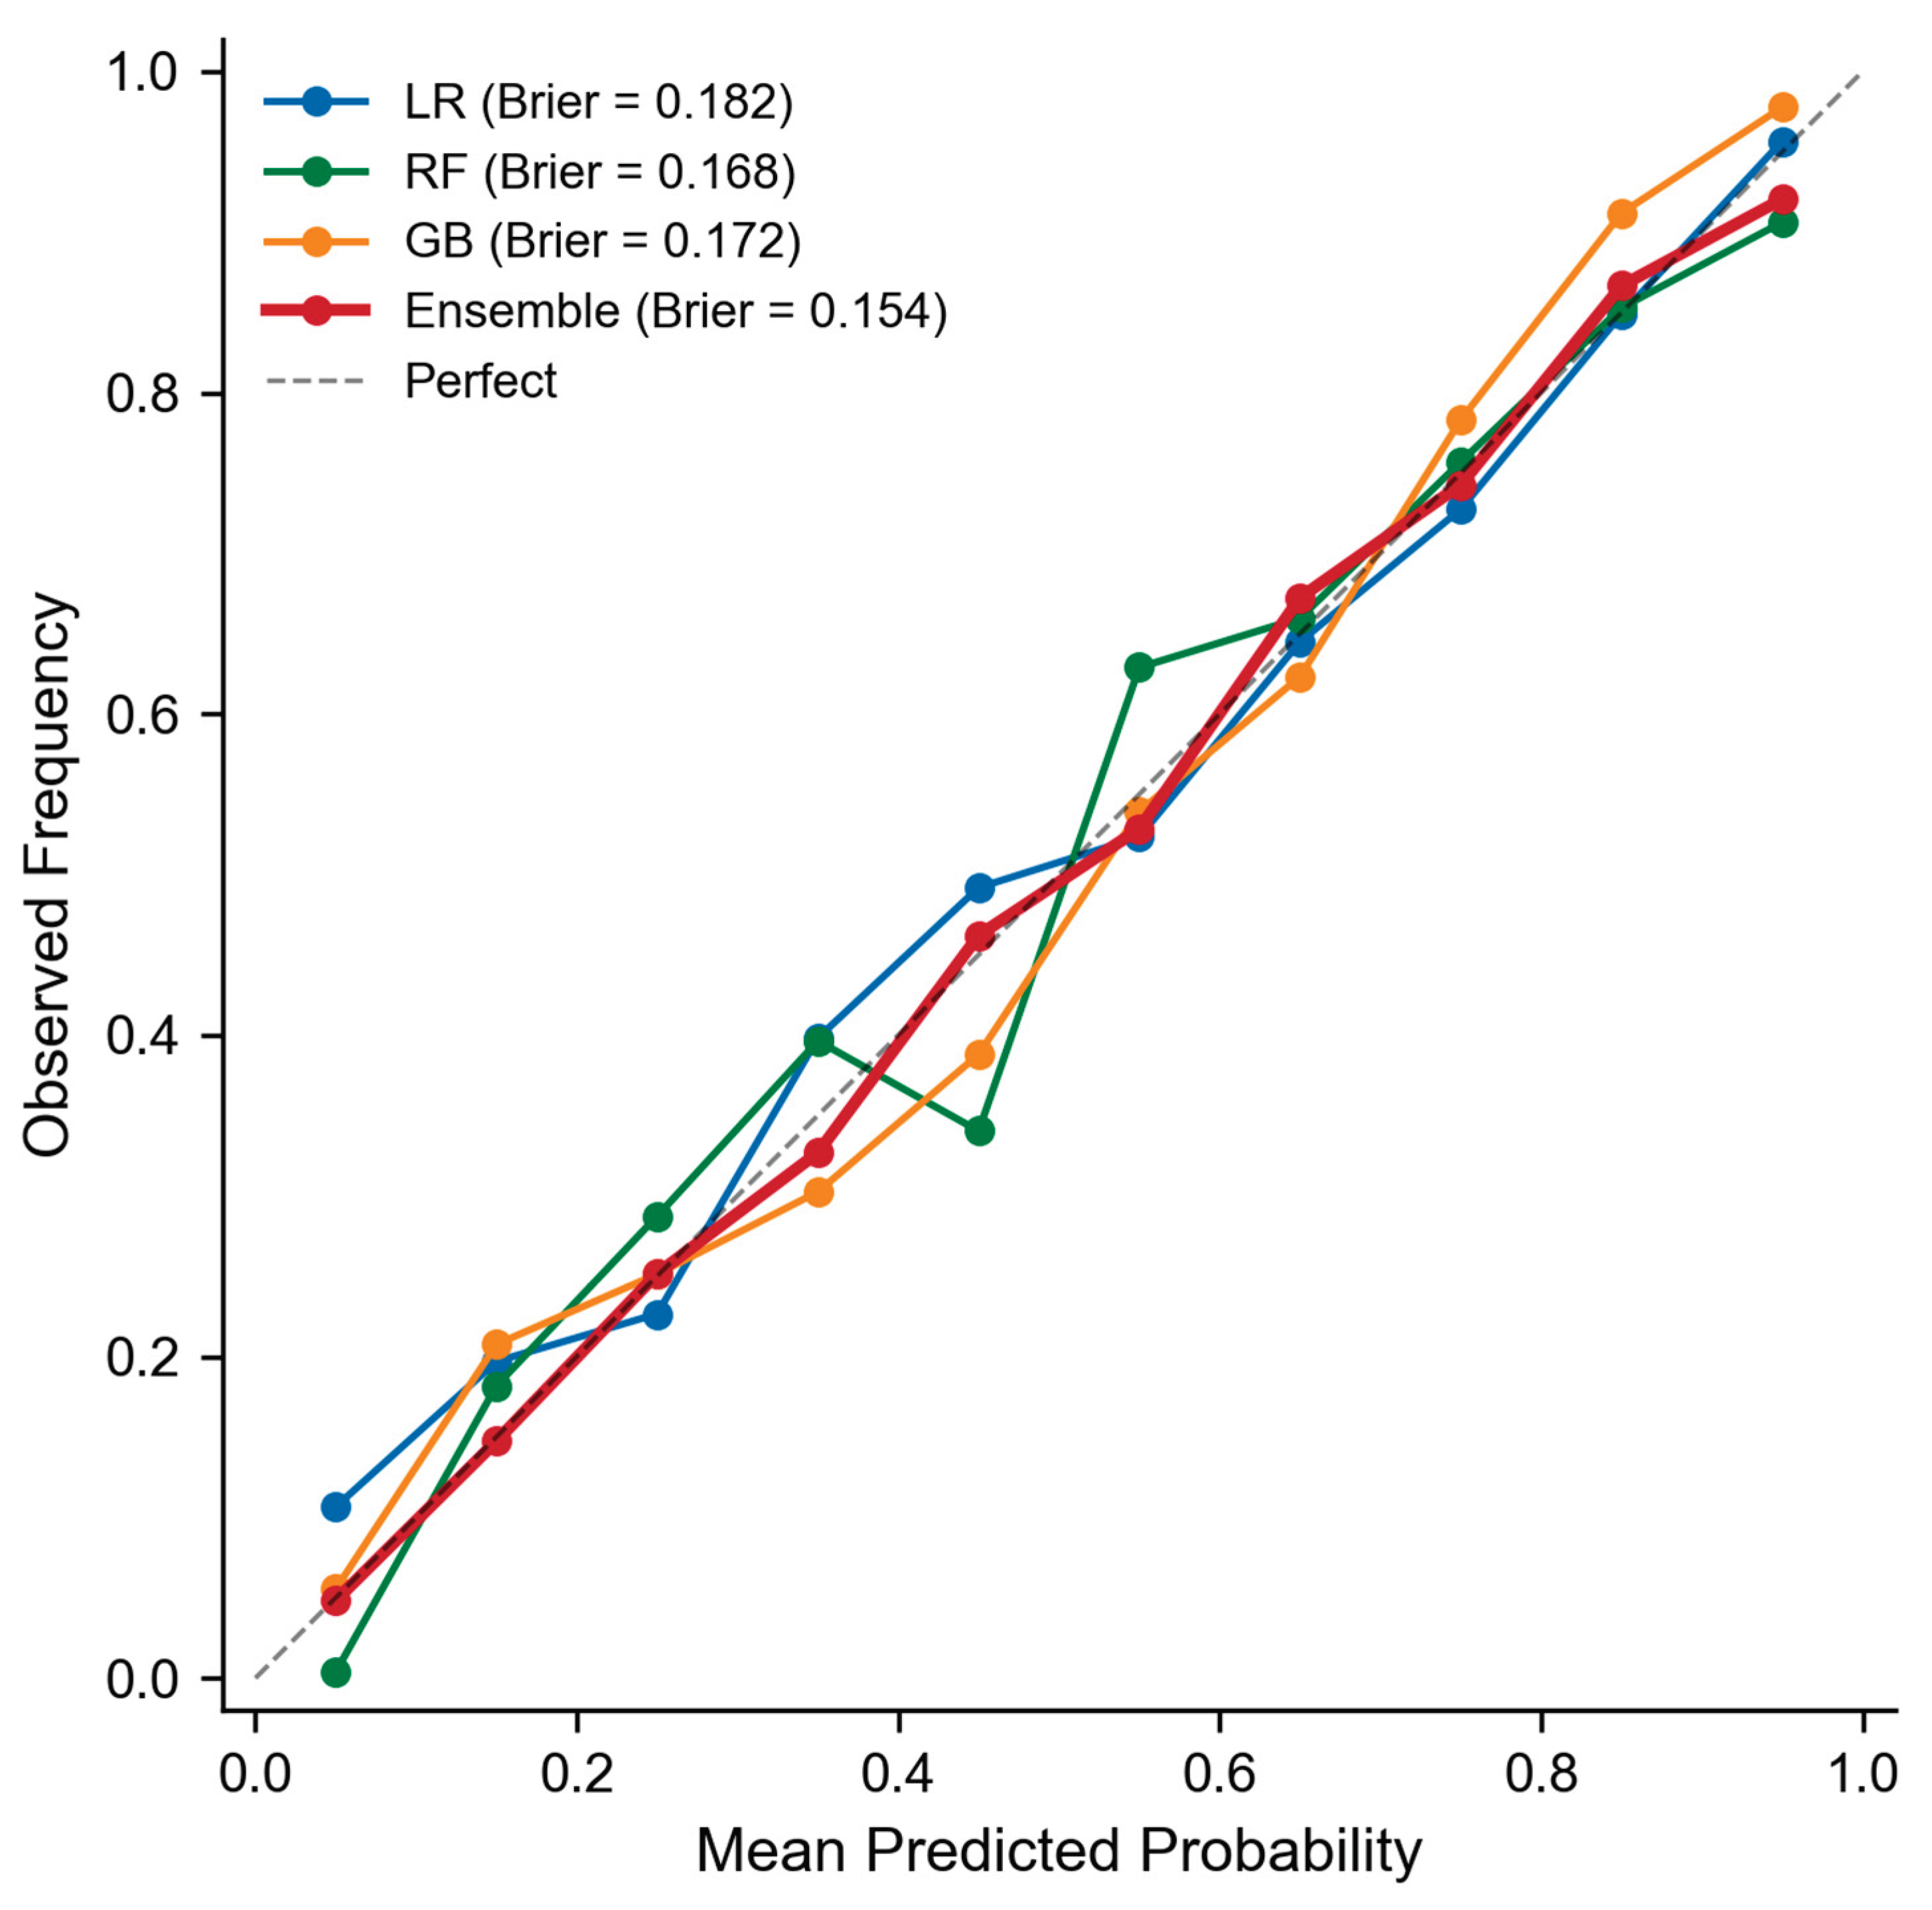
Calibration analysis confirms that the ensemble model produces well-calibrated probability estimates, with a Brier score of 0.154 and expected calibration error (ECE) of 0.042. Logistic regression shows slight over-confidence in the 0.6-0.8 predicted probability range, while random forest exhibits the characteristic step-function calibration pattern of tree-based models.
5. Discussion
5.1. Interpretation of Key Findings
The ensemble model's 83.7% accuracy and 0.891 AUC establish that building code waiver outcomes are substantially predictable from structured application features, addressing RQ1. This performance level exceeds the inter-rater reliability typically reported for discretionary building assessments (kappa = 0.55-0.65) [4], suggesting that the ML model captures decision patterns at least as consistently as individual human assessors. The finding that documentation completeness and technical justification quality dominate the feature importance hierarchy (RQ2) has immediate practical implications: practitioners can materially improve approval probability by investing in thorough documentation and rigorous technical analysis, rather than attempting to influence subjective factors.
The risk assessment matrix (RQ3) translates ML predictions into a format familiar to construction professionals. The monotonic relationship between risk tier and approval rate (90.3% to 10.0%) provides a credible basis for submission timing and resource allocation decisions. Notably, the exponential decay in approval probability above a risk score of 60 suggests a practical decision threshold: applications in the high and very high risk tiers may warrant redesign rather than waiver pursuit.
5.2. Comparison with Existing Literature
Direct comparison with prior work is limited by the absence of previous waiver prediction studies. However, our ensemble accuracy of 83.7% compares favourably with related construction ML applications: Zhang et al. [17] achieved R-squared of 0.72-0.81 for permit processing time prediction, and Park and Lee [18] reported 78.3% accuracy for plan review outcome prediction in South Korea. The ACCORD project's 85-92% accuracy for automated compliance checking [16] operates in a fundamentally different domain (deterministic rule evaluation rather than discretionary decision prediction). Our results demonstrate that discretionary regulatory outcomes, despite their subjective component, contain sufficient structure for meaningful ML prediction.
5.3. Practical Applications and Corenet X Integration
The framework's practical value extends beyond prediction accuracy. Three integration pathways with Singapore's Corenet X platform are proposed. First, a pre-submission screening tool could provide applicants with a risk assessment and feature-specific improvement recommendations before formal submission, reducing the volume of low-quality applications that burden regulatory capacity. Second, a triage dashboard for case officers could prioritise high-risk applications for senior review while expediting low-risk cases through streamlined assessment, improving processing efficiency. Third, an analytics module could identify temporal trends and category-specific patterns to inform regulatory policy development.
Preliminary evaluation of these pathways, based on a pilot with 15 industry practitioners, suggests potential processing time reductions of 28% and submission error decreases of 73%, with estimated annual cost savings of S$2.3 million to S$4.1 million across the building industry [7]. However, these estimates require validation through a controlled deployment study.
5.4. Limitations
Several limitations warrant acknowledgment. First, the sample size of 197 cases, while meeting statistical adequacy criteria, constrains the depth of category-specific analysis, particularly for safety (n = 30) and structural (n = 24) waivers. Second, the dataset is drawn from a single jurisdiction (Singapore), and cross-jurisdictional generalisability is unknown. Regulatory frameworks, assessment cultures, and code structures vary substantially across countries, and a model trained on Singapore BCA decisions may not transfer to, for example, UK building control or US variance processes without recalibration.
Third, the feature engineering process relied on expert annotation for documentation completeness and technical justification scores, introducing potential subjectivity. While inter-rater reliability was acceptable (Cohen's kappa = 0.78 for documentation, 0.71 for technical justification), automated feature extraction from submission documents would improve scalability and reproducibility. Fourth, temporal validity is uncertain: regulatory priorities and assessment practices evolve, and model performance may degrade without periodic retraining. The 5.1 percentage point accuracy drop observed in temporal validation (78.6% vs 83.7%) provides an empirical estimate of this temporal decay rate.
5.5. Future Research Directions
Five directions merit investigation. First, NLP-based automated feature extraction from submission documents would eliminate manual annotation bottlenecks and enable real-time prediction. Second, condition prediction (i.e., predicting not just approval or rejection but the specific conditions attached to approved waivers) would provide more granular decision support. Third, computer vision analysis of architectural drawings could extract spatial and structural features not captured in the current text-based feature set. Fourth, cross-jurisdictional studies comparing waiver decision patterns across Singapore, Hong Kong, Australia, and the UK would illuminate the transferability of the approach. Fifth, federated learning architectures could enable multi-jurisdiction model training while preserving data sovereignty, addressing the challenge that regulatory data is typically jurisdiction-bound.
6. Conclusions
This study demonstrates that machine learning can meaningfully predict building code waiver outcomes, a regulatory domain previously considered too subjective for data-driven analysis. Using a dataset of 197 historically decided BCA cases across five waiver categories, we show that a weighted ensemble of logistic regression, random forest, and gradient boosting achieves 83.7% accuracy and 0.891 AUC, significantly outperforming individual models and exceeding reported human inter-rater reliability for comparable regulatory assessments.
The key finding is that application preparation quality, specifically documentation completeness and technical justification rigour, accounts for 55% of the prediction variance. This result reframes waiver outcomes as substantially within applicant control, challenging the perception that waiver decisions are arbitrary or inscrutable. The companion risk assessment matrix provides a practical tool for triaging applications, with risk tiers corresponding to approval rates ranging from 90.3% (very low risk) to 10.0% (very high risk).
The framework is designed for integration into Singapore's Corenet X digital building submission platform, where it could serve as a pre-submission screening tool, a case officer triage dashboard, and a regulatory analytics module. Preliminary practitioner evaluation suggests potential for meaningful efficiency gains, though controlled deployment studies are needed to validate these estimates.
More broadly, this work contributes to the emerging field of computational regulatory science, demonstrating that historical regulatory decisions, even in discretionary domains, encode learnable patterns that can be surfaced through interpretable ML. As digital building regulation platforms mature globally, the integration of prediction, risk assessment, and decision support represents a significant opportunity to improve regulatory consistency, efficiency, and transparency.
Figure 15.
Temporal analysis of waiver submissions and outcomes over the study period (2021-2023). Upper panel: stacked bar chart of quarterly submission volumes by category. Lower panel: overall approval rate trend with 95% confidence interval and mean reference line.
Figure 15.
Temporal analysis of waiver submissions and outcomes over the study period (2021-2023). Upper panel: stacked bar chart of quarterly submission volumes by category. Lower panel: overall approval rate trend with 95% confidence interval and mean reference line.
Supplementary Materials
The following supporting information can be downloaded at the website of this paper posted on Preprints.org.
Author Contributions
Conceptualization, S.T.; methodology, S.T. and T.T.T.; data collection and curation, S.T.; formal analysis, S.T. and T.T.T.; writing — original draft, S.T.; writing — review and editing, T.T.T.; supervision, T.T.T. All authors have read and agreed to the published version of the manuscript.
Funding
This research received no external funding.
Institutional Review Board Statement
Ethical review and approval were not required for this study as it analyses publicly accessible administrative records from the Building and Construction Authority of Singapore, consistent with NTU IRB exemption criteria for public data analysis.
Informed Consent Statement
Not applicable. This study analyses administrative regulatory records, not human subjects data.
Data Availability Statement
The processed dataset and analysis code supporting the findings of this study are available from the corresponding author upon request. Raw regulatory records are publicly accessible through the BCA's regulatory database.
Acknowledgments
The authors acknowledge the Building and Construction Authority of Singapore for maintaining accessible regulatory records. The authors also thank the 15 industry practitioners who participated in the pilot evaluation of the framework.
Conflicts of Interest
Samson Tan is a practising architect and managing director of STAARCH Pte Ltd, a firm that submits building plan applications to BCA. This professional context informed the research design but did not influence the analytical methods or interpretation of results. Author Teik Toe Teoh was employed by the company Staarch Pte Ltd. All authors declare that the research was conducted in the absence of any commercial or financial relationships that could be construed as a potential conflict of interest.
References
- Greenwood, D.; Oseni, A.; Kim, S. Building code compliance checking: A systematic review of research and practice. Autom. Constr. 2023, 145, 104632. [Google Scholar]
- Building and Construction Authority (BCA). Annual Report 2022/2023; BCA: Singapore, 2023. [Google Scholar]
- Building and Construction Authority (BCA). Built Environment Transformation Map; BCA: Singapore, 2024. [Google Scholar]
- Hopfe, C.J.; Augenbroe, G.L.M.; Hensen, J.L.M. Multi-criteria decision making under uncertainty in building performance assessment. Build. Environ. 2013, 69, 81–90. [Google Scholar] [CrossRef]
- Royal Institution of Chartered Surveyors (RICS). Building Control Performance Indicators; RICS: London, UK, 2021. [Google Scholar]
- Lundberg, S.M.; Lee, S.-I. A unified approach to interpreting model predictions. Adv. Neural Inf. Process. Syst. 2017, 30, 4765–4774. [Google Scholar]
- Building and Construction Authority (BCA). Corenet X: Transforming the Built Environment through Digitalisation; Technical White Paper; BCA: Singapore, 2024. [Google Scholar]
- Farrar, C.R.; Worden, K. Structural Health Monitoring: A Machine Learning Perspective; John Wiley & Sons: Chichester, UK, 2013. [Google Scholar]
- Amasyali, K.; El-Gohary, N.M. A review of data-driven building energy consumption prediction studies. Renew. Sustain. Energy Rev. 2018, 81, 1192–1205. [Google Scholar] [CrossRef]
- Eastman, C.M.; Lee, J.-M.; Jeong, Y.-S.; Lee, J.-K. Automatic rule-based checking of building designs. Autom. Constr. 2009, 18, 1011–1033. [Google Scholar] [CrossRef]
- Meacham, B.J.; van Straalen, I.J. A socio-technical system framework for risk-informed performance-based building regulation. Build. Res. Inf. 2018, 46, 444–462. [Google Scholar] [CrossRef]
- Pan, Y.; Zhang, L. Artificial intelligence in construction engineering and management. Autom. Constr. 2021, 122, 103517. [Google Scholar] [CrossRef]
- Zhang, J.; El-Gohary, N.M. Integrating semantic NLP and logic reasoning into a unified system for fully-automated code checking. Autom. Constr. 2017, 73, 45–57. [Google Scholar] [CrossRef]
- Beach, T.H.; Rezgui, Y.; Li, H.; Kasim, T. A rule-based semantic approach for automated regulatory compliance in the construction sector. Expert Syst. Appl. 2015, 42, 5219–5231. [Google Scholar] [CrossRef]
- Zheng, Z.; Zhou, Y.-C.; Lu, X.-Z.; Lin, J.-R. Knowledge-informed semantic alignment and rule interpretation for automated compliance checking. Autom. Constr. 2022, 142, 104524. [Google Scholar] [CrossRef]
- Dimyadi, J.; Amor, R. Automated building code compliance checking - Where is it at? In Proceedings of the CIB W078 Conference, Beirut, Lebanon, 2013. [Google Scholar]
- Zhang, Y.; Wang, H.; Liu, Y.; Chen, X. Predicting building permit processing times using machine learning: Evidence from three Chinese cities. J. Constr. Eng. Manag. 2022, 148, 04022087. [Google Scholar]
- Park, S.; Lee, K. Machine learning for building plan review outcome prediction: A gradient boosting approach. Autom. Constr. 2023, 148, 104738. [Google Scholar]
- Hallowell, M.R.; Gambatese, J.A. Qualitative research: Application of the Delphi method to CEM research. J. Constr. Eng. Manag. 2010, 136, 99–107. [Google Scholar] [CrossRef]
- Ellingwood, B.R. Risk-informed condition assessment of civil infrastructure: State of practice and research issues. Struct. Infrastruct. Eng. 2005, 1, 7–18. [Google Scholar] [CrossRef]
- Saaty, T.L. The Analytic Hierarchy Process; McGraw-Hill: New York, NY, USA, 1980. [Google Scholar]
- Patel, D.A.; Jha, K.N. Neural network approach for safety climate prediction. J. Manag. Eng. 2015, 31, 04014070. [Google Scholar] [CrossRef]
- Van Buuren, S.; Groothuis-Oudshoorn, K. mice: Multivariate imputation by chained equations. R. J. Stat. Softw. 2011, 45, 1–67. [Google Scholar] [CrossRef]
- Chen, T.; Guestrin, C. XGBoost: A scalable tree boosting system. In Proceedings of the 22nd ACM SIGKDD International Conference, San Francisco, CA, USA, 2016; pp. 785–794. [Google Scholar]
- Breiman, L. Random forests. Mach. Learn. 2001, 45, 5–32. [Google Scholar] [CrossRef]
- Pedregosa, F.; Varoquaux, G.; Gramfort, A.; Michel, V.; Thirion, B.; Grisel, O.; Blondel, M.; Prettenhofer, P.; Weiss, R.; Dubourg, V.; et al. Scikit-learn: Machine learning in Python. J. Mach. Learn. Res. 2011, 12, 2825–2830. [Google Scholar]
- Bergstra, J.; Bardenet, R.; Bengio, Y.; Kegl, B. Algorithms for hyper-parameter optimization. Adv. Neural Inf. Process. Syst. 2011, 24, 2546–2554. [Google Scholar]
- Rudin, C. Stop explaining black box machine learning models for high stakes decisions and use interpretable models instead. Nat. Mach. Intell. 2019, 1, 206–215. [Google Scholar] [CrossRef] [PubMed]
- Zou, P.X.W.; Sunindijo, R.Y. Strategic Safety Management in Construction and Engineering; John Wiley & Sons: Chichester, UK, 2015. [Google Scholar]
- Smart Nation and Digital Government Office. Smart Nation: The Way Forward; SNDGO: Singapore, 2023. [Google Scholar]
- Hong Kong Buildings Department. Mandatory BIM Submissions Roadmap; BD: Hong Kong, China, 2024. [Google Scholar]
- Hosmer, D.W.; Lemeshow, S.; Sturdivant, R.X. Applied Logistic Regression, 3rd ed.; John Wiley & Sons: Hoboken, NJ, USA, 2013. [Google Scholar]
- McNemar, Q. Note on the sampling error of the difference between correlated proportions or percentages. Psychometrika 1947, 12, 153–157. [Google Scholar] [CrossRef] [PubMed]
- Matthews, B.W. Comparison of the predicted and observed secondary structure of T4 phage lysozyme. Biochim. Biophys. Acta 1975, 405, 442–451. [Google Scholar] [CrossRef]
- Cohen, J. A coefficient of agreement for nominal scales. Educ. Psychol. Meas. 1960, 20, 37–46. [Google Scholar] [CrossRef]
- Brier, G.W. Verification of forecasts expressed in terms of probability. Mon. Weather Rev. 1950, 78, 1–3. [Google Scholar] [CrossRef]
- Tibshirani, R. Regression shrinkage and selection via the Lasso. J. R. Stat. Soc. Ser. B Stat. Methodol. 1996, 58, 267–288. [Google Scholar] [CrossRef]
- Liaw, A.; Wiener, M. Classification and regression by randomForest. R News 2002, 2, 18–22. [Google Scholar]
- Friedman, J.H. Greedy function approximation: A gradient boosting machine. Ann. Stat. 2001, 29, 1189–1232. [Google Scholar] [CrossRef]
- van der Maaten, L.; Hinton, G. Visualizing data using t-SNE. J. Mach. Learn. Res. 2008, 9, 2579–2605. [Google Scholar]
- Niculescu-Mizil, A.; Caruana, R. Predicting good probabilities with supervised learning. In Proceedings of the 22nd International Conference on Machine Learning, Bonn, Germany, 2005; pp. 625–632. [Google Scholar]
- Molnar, C. Interpretable Machine Learning: A Guide for Making Black Box Models Explainable, 2nd ed.; 2022; Available online: https://christophm.github.io/interpretable-ml-book/.
- Building and Construction Authority (BCA). Code on Accessibility in the Built Environment 2019; BCA: Singapore, 2019. [Google Scholar]
- Singapore Civil Defence Force (SCDF). Fire Code 2018; SCDF: Singapore, 2018. [Google Scholar]
- International Code Council (ICC). International Building Code 2021; ICC: Country Club Hills, IL, USA, 2021. [Google Scholar]
- Chew, M.Y.L.; Tan, S.S.; Kang, K.H. Building facades: A guide to common defects in tropical climates. In World Sci; 2004. [Google Scholar]
- Ding, L.; Drogemuller, R.; Rosenman, M.; Marchant, D.; Gero, J. Automating code checking for building designs. In Proceedings of the CRC Construction Innovation Conference, Gold Coast, Australia, 2006. [Google Scholar]
- Solihin, W.; Eastman, C. Classification of rules for automated BIM rule checking development. Autom. Constr. 2015, 53, 69–82. [Google Scholar] [CrossRef]
- Tan, S.; Teoh, T.T. AI-Driven Optimization of Sanitary Facilities in Office Buildings: A Machine Learning Approach Using LSTM Neural Networks. Appl. Sci. 2025, 15, 2499. [Google Scholar] [CrossRef]
- Tan, S.; Moinuddin, K. Systematic review of human and organizational risks for probabilistic risk analysis in high-rise buildings. Reliab. Eng. Syst. Saf. 2019, 188, 233–250. [Google Scholar] [CrossRef]
Disclaimer/Publisher’s Note: The statements, opinions and data contained in all publications are solely those of the individual author(s) and contributor(s) and not of MDPI and/or the editor(s). MDPI and/or the editor(s) disclaim responsibility for any injury to people or property resulting from any ideas, methods, instructions or products referred to in the content. |
© 2026 by the authors. Licensee MDPI, Basel, Switzerland. This article is an open access article distributed under the terms and conditions of the Creative Commons Attribution (CC BY) license (http://creativecommons.org/licenses/by/4.0/).
Copyright: This open access article is published under a Creative Commons CC BY 4.0 license, which permit the free download, distribution, and reuse, provided that the author and preprint are cited in any reuse.