
Submitted:
23 February 2026
Posted:
25 February 2026
You are already at the latest version
Abstract
Background: The presence of alkali species in ground-based spectra of comets is complex. The observed abundance ratios deviate from solar composition, suggesting alkali ejection from phenoxides reacting with carbon dioxide at the nucleus surface. Methods: Here we search for the emissions of the alkali in spectra of the coma and of the trail of Comet C/2023 A3 (Tsuchinshan-ATLAS) exploiting the double-fiber entrance of the very high resolution PEPSI spectrograph at the 8.4m Large Binocular Telescope. Results: Spectra sampling the nucleus yield $Na/K$ ratios about four times higher than the solar value, and even higher ratios sampling the trail. This fact excludes photodesorption as the main sodium source, leaving phenoxilation at the surface of the main nucleus and the trail mininuclei as the primary sodium source. Conclusions: The C/2023 A3 nucleus temperature and the faint KI line exclude potassium phenoxylation. For the first time, KI is detected in the trail of a Oort cloud comet, being potassium photodesorbed from the trail mininuclei. Sodium phenoxylation is at least six times more efficient than sodium photodesorption if the $Na/K$ ratio in the C/2023 A3 nuclei is chondritic. Trails composed of sub-km-sized mininuclei may be common features of Oort cloud comets.
Keywords:
comets: general
; comets: C/2023 tsuchinshan-ATLAS
; oort cloud
; molecular processes
; techniques: spectroscopic
1. Introduction
This study examines the sources and abundances of the alkali elements sodium (Na), potassium (K) and lithium (Li) in comets. Sodium emission has been widely reported in cometary comae and tails [1,2,3,4,5], whereas potassium detections remain comparatively rare, having been identified only in comets C/1965 S1 [6], C/2011 L4 [7], C/2012 S1 [5], C/2020 F3 and C/2024 G3 [8]. In all cases, the atomic ratio significantly exceeds the chondritic value of [9]. The detection of the KI line in cometary spectra allowed Fulle [8] to predict that a potassium tail should be observable in future comets.
To date, lithium has not been directly detected in cometary spectra. In contrast, in situ mass spectrometry of dust particles from comet 81P/Wild 2, collected by the Stardust mission, revealed Li, Na, and K abundances exceeding chondritic levels all within a factor of two [10]. The Li upper limit for comet C/2020 F3 is very stringent with , a factor of 34 greater than the chondritic . Li is synthesized during standard Big Bang nucleosynthesis, and further enriched by novae to present values [11]. The value found in C/2020 F3 implies a Li abundance below the primordial value, a fact that lead to the formulation of a new mechanism for alkali ejection in comets due to phenoxilation, namely the chemical reaction between alkali phenoxides and carbon dioxide inside the dust particles located at the nucleus surface [8].
In this paper we focus on spectra of Comet C/2023 A3 (Tsuchinshan-ATLAS) taken at the heliocentric distances au (Table 1). Alkali phenoxilation is activated when the cometary nucleus exceeds a limit temperature, which is 370 K for sodium and 470 K for potassium [12]. Available measurements of the surface temperature of the nucleus of Comet 67P/Churyumov-Gerasimenko (67P hereafter) by means of the VIRTIS instrument onboard the Rosetta mission showed that Hapi, the most active region during the inbound orbit, reached the gray-body temperatures, with the most probable value of 213 K at au [13]. It follows that an active nucleus at au reaches gray-body temperatures of 440 K, consistent with sodium phenoxilation and inconsistent with potassium phenoxilation. The Water Enriched Block model [8,14,15] suggests lower equilibrium temperatures of 340 K at au for a water-driven active nucleus. However, the VIRTIS-Rosetta data show that the surface dust particles where carbon dioxide reacts with alkali phenoxides maintain higher non-equilibrium temperatures much closer to the gray-body ones.
Therefore, the detection of faint KI lines in high resolution spectra of C/2023 A3 would imply that potassium is ejected by photodesorption only, being thermal desorption much less probable [4]. On the other hand, the detection of NaI lines would imply two sources for sodium: photodesorption and phenoxilation. The requirement that the ratio of cometary nuclei is chondritic [10,16] will allow us to determine the efficiency of sodium phenoxilation with respect to sodium photodesorption.
2. Observations and Data Analysis
Comet C/2023 A3 (Tsuchinshan-ATLAS) is a Oort Cloud comet discovered by The Asteroid Terrestrial impact Last Alert System (ATLAS) on February 2023, and was observed on 26 and 27 October 2024 with the PEPSI spectrograph at the Large Binocular Telescope [17] in monocular mode (8.4 m), with a spectral coverage from 380 to 900 nm at a resolving power of . A fiber was located on the nucleus and another at the distance of 5600 and 5800 km and position angle of 239.8 and 238.3 deg, respectively (Table 1).
The comet was receding from Earth with a radial velocity of 58.02 and 58.80 km s−1 at a geocentric distance of 0.77 and 0.81 au in the nights of the 26 and 27 October 2024, respectively. The comet was also receding from the Sun with a heliocentric radial velocity of 33.64 and 33.61 km s−1 at a heliocentric distance of 0.81 and 0.83 au, respectively (Table 1). The solar reflected and cometary emitted radial velocities were calculated by using JPL SPK solar system and C/2023 A3 bsp ephemeris files. On 26 October, the comet was observed from 2h05m UT to 2h37m UT in three couples (each per fiber) of different exposures at different Cross Disperser (CD), with sequence CD6 CD5 CD4 at airmass increasing from 1.9 to 2.4; on 27 October, the comet was observed from 1h28m to 3h00m UT in three couples of different exposures, with sequence CD5 CD4 CD6 at airmass increasing from 1.6 to 2.9: this observing procedure implies night-dependent different atmospheric reddening at different spectrum orders. The photometric standard star HR7950 was observed just after, at airmass of 1.4 being fifty degrees east of the comet.
The spectra were reduced as described in Strassmeier [18] and calibrated by means of the spectra of the standard star HR7950. The spectra were divided by the telluric synthetic TAPAS spectrum calculated for the time of observations and local atmospheric profile [19], and then offset to the solar reflected rest frame. A Phoenix solar spectrum was used to correct the comet ones [20], thus providing the calibrated average values of the dust continuum, after the correction of the different reddening at different spectrum orders. This procedure increases the local continuum noise and introduces emission artifacts, due to the high observation airmasses. Therefore, we measured the line intensities on flux calibrated raw spectra, the dust continuum of which is expected to be constant (within 20%) from the NaI to KI wavelengths as observed in comet C/2011 L4 [7], because the spectral slope of the solar spectrum is balanced by the spectral reddening of cometary dust within 20% [21]. Therefore, the raw spectra were flux calibrated by normalizing them to the computed dust continuum, and offset to the rest frame of the comet, so that the standard air wavelength scale corresponds to atomic/molecular species (Figure 1, Figure 2, Figure 3, Figure 4 and Figure 5). The dust continuum increases of 30% from 26 to 27 October, consistent with possible one-day changes of the total dust cross section both on the nucleus-centered coma and at the distance , which is covered in less than one day if the dust velocity is m s−1.
After the subtraction of the continuum, each emission line was fitted by a gaussian, the FWHM of which varied from 60 to 80 mÅ, and converted to the intensities I (Table 2) by dividing each gaussian area by 70 mÅ, thus making easy a comparison with the lines in Figure 1, Figure 2, Figure 3, Figure 4 and Figure 5. The ratios provide the increase of the sunlit nucleus cross section due to its rotation, which is higher than the continuum increase during the same period because the wide dust velocity dispersion dumps the brightness variations of the nucleus-centered dust coma. The abundances of sodium related to another atom x, (Table 2), are independent of the absolute value of a flat continuum, depend on the g-factor at 1 au computed by Fulle [7] and are obtained from the line intensity I by means of the relationship
3. Discussion
As in all previous comets with a measured ratio (Table 3), of C/2023 A3 largely exceeds the chondritic value (Table 2), with a factor of four higher than chondritic. The uncertainties affecting the ratios are higher than the spectral slope error % of the continuum. Munaretto [22] analyzed the same spectra finding values a factor 2-3 higher than those shown in Table 2, with a similar uncorrected factor between the Na and K continuum, due to the color bias of a flux calibration not correcting the different atmospheric reddening of the comet and of the standard star HR7950.
The sunward distance excludes that the spectra outside the nucleus are polluted by alkali atoms ejected from the main nucleus towards the Sun, reaching the maximum sunward distance , where a is the antisunward acceleration due to the solar radiation pressure (Table 1) and km s−1 at K is the atom ejection velocity from the inner coma [23]. We get km for both sodium and potassium (Table 1), thus ruling out the alkali tail model [7] as a possible explanation of .
All these facts exclude that sodium is ejected by thermal or photodesorption only, which are expected to maintain a chondritic value both on the nucleus and on the coma dust, i.e., the same refractories mainly composing the nucleus itself. The observed huge ratios suggest that sodium is mainly produced by phenoxilation, which is more efficient than photodesorption. In this case, the alkali source should have a volume big enough to produce carbon dioxide, corresponding to sizes of some tens of meters [8], i.e., mininuclei populating a trail, as observed in comets C/2006 P1 and C/2024 G3 [8] and consistent with the location of the fiber outside the nucleus (Table 1). On 8-11 October 2024, the SOHO spacecraft observed C/2023 A3 at an angle of 3-8 deg between the comet orbital plane and the line of sight (versus 63 deg of C/2024 G3 on mid January 2025), preventing the detection of any sodium trail because projected on the much brighter dust tail. Here we check if such a scenario is consistent with all the available data.
The very faint KI lines (a factor of fainter than all other previous KI detections, which occurred at au) suggest potassium photodesorption. In all previous KI observations, potassium phenoxilation was the main source of potassium atoms, because photodesorption could have been more efficient than in C/2023 A3 of a factor of (given by the squared ratio of the observation heliocentric distances) times the ratio of the respective nucleus cross sections, which is . The KI lines are as intense as the continuum on the trail (Figure 5), but much less intense than the continuum on the nucleus (Figure 3), where some contribution from the nucleus added to that from the dust would imply the opposite if potassium were photodesorbed from dust. A reliable continuum-independent source of potassium is photodesorption from the trail mininuclei, the volume of which can be estimated because photodesorption depends on the sunlit cross section of the source. We compute that the trail mininuclei had a total sunlit cross section % of the main nucleus on 26 October, and % on 27 October, consistent both with the storage of CO2 ice inside them and with the expected size of trail mininuclei [8] at the distance from the main nucleus (Table 1).
Sodium phenoxilation depends on the nucleus and mininuclei surface area with K, rather than on their sunlit cross section. Let’s assume that sodium phenoxilation is a factor more efficient than photodesorption in ejecting sodium atoms. In order to explain the highest ratio in Table 2, namely , it is sufficient that % of the average mininuclei surface had K. If the whole mininuclei surface had K, then , namely from phenoxilation and from photodesorption. It follows that the lower limit of the efficiency ratio between sodium phenoxilation and photodesorption is , which provides the highest possible area fraction of trail mininuclei at K: % on 26 October and % on 27 October. For the main nucleus, the highest possible area fraction at K is %, consistent with the expected source of carbon dioxide, i.e., the water-poor nucleus matrix covering about 90% of 67P nucleus surface [14,15]. The trail mininuclei, much smaller than the main nucleus, may have very different shape and temperature distribution, i.e., more variable ratios.
As in all previous spectra of comets, lithium was not detected, because the expected ratio is in case of photodesorption, and in case of phenoxilation [8], both higher than the measured lower limit (Table 2), which was improved averaging the values measured on 26 and 27 October. The lower limits measured on the trail are lower than . The measured lower limit of comet C/2020 F3 Neowise [8] is still consistent with lithium photodesorption if during those observations. The release of potassium should also build-up an atomic tail, providing information on the distribution of this cometary component.
4. Conclusions
- We detect NaI and KI emission lines in very high resolution LBT-PEPSI spectra measured on the nucleus and on the trail of C/2023 A3 (Tsuchinshan-ATLAS) on October 2024.
- The C/2023 A3 nucleus was too cold to allow potassium phenoxilation, but warm enough to allow sodium phenoxilation.
- The KI line is a factor fainter than all previous detections, consistent with potassium ejection by photodesorption.
- The ratios of potassium KI lines intensities allow us to estimate the sizes of the trail mininuclei ejecting alkali atoms. These sizes are consistent with the production of carbon dioxide reacting with sodium phenoxides.
- The ratios measured on the nucleus are a factor of four higher than the chondritic value, and even higher on the trail, thus excluding photodesorption as the main sodium source.
- A chondritic ratio in the nucleus of C/2023 A3 is consistent with all the performed measurements if the sodium phenoxilation is at least a factor of six more efficient than sodium photodesorption in ejecting neutral sodium atoms.
- As predicted by the alkali phenoxilation model, lithium emission LiI was not detected in the spectra of C/2023 A3.
- A trail of mininuclei big enough to allow alkali phenoxilation may be a common feature of Oort cloud comets.
Author Contributions
Conceptualization, M.F. and P.M.; methodology, M.F.; software, I.I.; validation, M.F., P.M. and I.I.; writing—original draft preparation, M.F.; writing—review and editing, P.M. and I.I. All authors have read and agreed to the published version of the manuscript.
Funding
This research received no external funding.
Informed Consent Statement
Not applicable.
Data Availability Statement
Data are available at the Large Binocular Telescope Archive https://archive.lbto.org.
Conflicts of Interest
The authors declare no conflicts of interest.
References
- Combi, M. R.; Di Santi, M. A.; Fink, U. The Spatial Distribution of Gaseous Atomic Sodium in the Comae of Comets: Evidence for Direct Nucleus and Extended Plasma Sources. Icarus 1997, 130, 336–354. [Google Scholar] [CrossRef]
- Rauer, H.; Arpigny, C.; Manfroid, J.; Cremonese, G.; Lemme, C. The spatial sodium distribution in the coma of comet Hale-Bopp (C/1995 O1). Astron. Astrophys. 1998, 334, L61–L64. [Google Scholar]
- Watanabe, J.-i.; Kawakita, H.; Furusho, R.; Fujii, M. Heliocentric Dependence of the Sodium Emission of Comet 153P/Ikeya-Zhang. Astrophys. J. 2003, 585, L159–L162. [Google Scholar] [CrossRef]
- Leblanc, F.; Fulle, M.; Lopez Ariste, A.; Cremonese, G.; Doressoundiram, A; Sainz Dalda, A.; Gelly, B. Comet McNaught C/2006 P1: Observation of the sodium emission by the solar telescope THEMIS. Astron. Astrophys. 2008, 482, 293–298. [Google Scholar] [CrossRef]
- McKay, A.; Cochran, A.; Dello Russo, N.; Weaver, H.; Vervack, R.; Harris, W.; Kawakita, H.; DiSanti, M.; Chanover, N.; Tsvetanov, Z. Evolution of fragment-species production in comet C/2012 S1 (ISON) from 1.6 au to 0.4 au. In Proceedings of the Asteroids, Comets, Meteors 2014 Conference, Helsinki, Finland, 30 June - 4 July, 2014. [Google Scholar]
- Preston, G. W. The spectrum of Ikeya-Seki (1965f). Astrophys. J. 1967, 147, 718–742. [Google Scholar] [CrossRef]
- Fulle, M.; Molaro, P.; Buzzi, L.; Valisa, P. Potassium Detection and Lithium Depletion in Comets C/2011 L4 (Panstarrs) and C/1965 S1 (Ikeya-Seki). Astrophys. J. Lett. 2013, 771, L21. [Google Scholar] [CrossRef]
- Fulle, M.; Molaro, P.; Rotundi, A.; Tonietti, L.; Aletti, A.; Buzzi, L.; Valisa, P. Alkali phenoxides in comets. Astron. Astrophys. 2025, 699, A10. [Google Scholar] [CrossRef]
- Lodders, K. Solar System Abundances and Condensation Temperatures of the Elements. Astrophys. J. 2003, 591, 1220–1247. [Google Scholar] [CrossRef]
- Flynn, G. J.; Bleuet, P.; Borg, J.; Bradley, J. P.; Brenker, F. E.; Brennan, S.; Bridges, J.; Brownlee, D. E.; Bullock, E. S.; Burghammer, M.; et al. Elemental Compositions of Comet 81P/Wild 2 Samples Collected by Stardust. Science 2006, 314, 1731. [Google Scholar] [CrossRef]
- Molaro, P. The problem of Lithium and the other Light Elements Deuterium, Beryllium and Boron. Mem. SAIt 2023, 94, 22. [Google Scholar]
- Kojčinović, A.; Blaž, L.; Grilc, M. Mechanism, Kinetics and Modelling of Phenol Carboxylation Reactions with CO2. Int. J. Mol. Sci. 2024, 25, 12923. [Google Scholar] [CrossRef]
- Ciarniello, M.; Fulle, M.; Tosi, F.; Mottola, S.; Capaccioni, F.; Bockelée-Morvan, D.; Longobardo, A.; Raponi, A.; Filacchione, G.; Rinaldi, G.; Rotundi, A.; De Sanctis, M. C.; Formisano, M.; Magni, G. Comparison of a pebbles-based model with the observed evolution of the water and carbon dioxide outgassing of comet 67P/Churyumov-Gerasimenko. Mon. Not. Roy. Astr. Soc. 2023, 523, 5841–5852. [Google Scholar] [CrossRef]
- Fulle, M.; Blum, J.; Rotundi, A.; Gundlach, B.; Güttler, C.; Zakharov, V. How comets work: Nucleus erosion versus dehydration. Mon. Not. Roy. Astr. Soc. 2020, 493, 4039–4044. [Google Scholar] [CrossRef]
- Ciarniello, M.; Fulle, M.; Raponi, A.; Filacchione, G.; Capaccioni, F.; Rotundi, A.; Rinaldi, G.; Formisano, M.; Magni, G.; Tosi, F.; et al. Macro and micro structures of pebble-made cometary nuclei reconciled by seasonal evolution. Nature Astr. 2022, 6, 546–553. [Google Scholar] [CrossRef]
- Wurz, P.; Rubin, M.; Altwegg, K.; Balsiger, H.; Berthelier, J.-J.; Bieler, A.; Calmonte, U.; De Keyser, J.; Fiethe, B.; Fuselier, S. A.; et al. Solar wind sputtering of dust on the surface of 67P/Churyumov-Gerasimenko. Astron. Astrophys. 2015, 583, A22. [Google Scholar] [CrossRef]
- Strassmeier, K. G.; Ilyin, I.; Järvinen, A.; Weber, M.; Woche, M.; Barnes, S. I.; Bauer, S.-M.; Beckert, E.; Bittner, W.; Bredthauer, R.; et al. PEPSI: The high-resolution échelle spectrograph and polarimeter for the Large Binocular Telescope. Astron.. Nach. 2015, 336, 324. [Google Scholar] [CrossRef]
- Strassmeier, K. G.; Ilyin, I.; Steffen, M. PEPSI deep spectra. I. The Sun-as-a-star. Astron. Astrophys. 2018, 612, A44. [Google Scholar] [CrossRef]
- Lallement, R.; Bertaux, J. L.; Ferron, S.; Boonne, C.; Richard, E.; Lefèvre, F.; Smoker, J. V. Transmission of the AtmosPhere for AStronomical data: TAPAS upgrade. Astron. Astrophys. 2025, 701, A200. [Google Scholar] [CrossRef]
- Hauschildt, P. H.; Barman, T.; Baron, E.; Aufdenberg, J. P.; Schweitzer, A. The NewEra model grid. Astron. Astrophys. 2025, 698, A47. [Google Scholar] [CrossRef]
- Bertini, I.; La Forgia, F.; Tubiana, C.; Güttler, C.; Fulle, M.; Moreno, F.; Frattin, E.; Kovacs, G.; Pajola, M.; Sierks, H.; et al. The scattering phase function of comet 67P/Churyumov-Gerasimenko coma as seen from the Rosetta/OSIRIS instrument. Mon. Not. Roy. Astr. Soc. 2017, 469, S404–S415. [Google Scholar] [CrossRef]
- Munaretto, G.; Cremonese, G.; Cambianica, P.; Brunetto, R.; Aléon, J.; Aléon-Toppani, A.; Mura, A.; Ilyin, I.; Cusano, F.; Kuhn, O.; et al. High Resolution Spectroscopy of Comet C/2023 A3 (Tsuchinshan-ATLAS): Insight into Sodium, Potassium and Lithium abundances. In Proceedings of the EPSC-DPS Joint Meeting 2025 (EPSC-DPS2025), Helsinki, Finland, 7 - 12 September; 2025, p. 1369.
- Zakharov, V. V.; Rodionov, A. V.; Fulle, M.; Ivanovski, S. L.; Bykov, N. Y.; Della Corte, V.; Rotundi, A. Practical relations for assessments of the gas coma parameters. Icarus 2021, 354, 114091. [Google Scholar] [CrossRef]
Figure 1.
Nucleus spectra of comet C/2023 A3 in the NaI region taken on 26 (red line, continuum of erg cm−2 s−1 Å−1) and 27 October 2024 (blue line, continuum of erg cm−2 s−1 Å−1). The spectrum is corrected for the geocentric receding velocity so that the local telluric Na emission line is blue-shifted by 58 km s−1 while the solar Na absorption line is red-shifted by 34 km s−1.
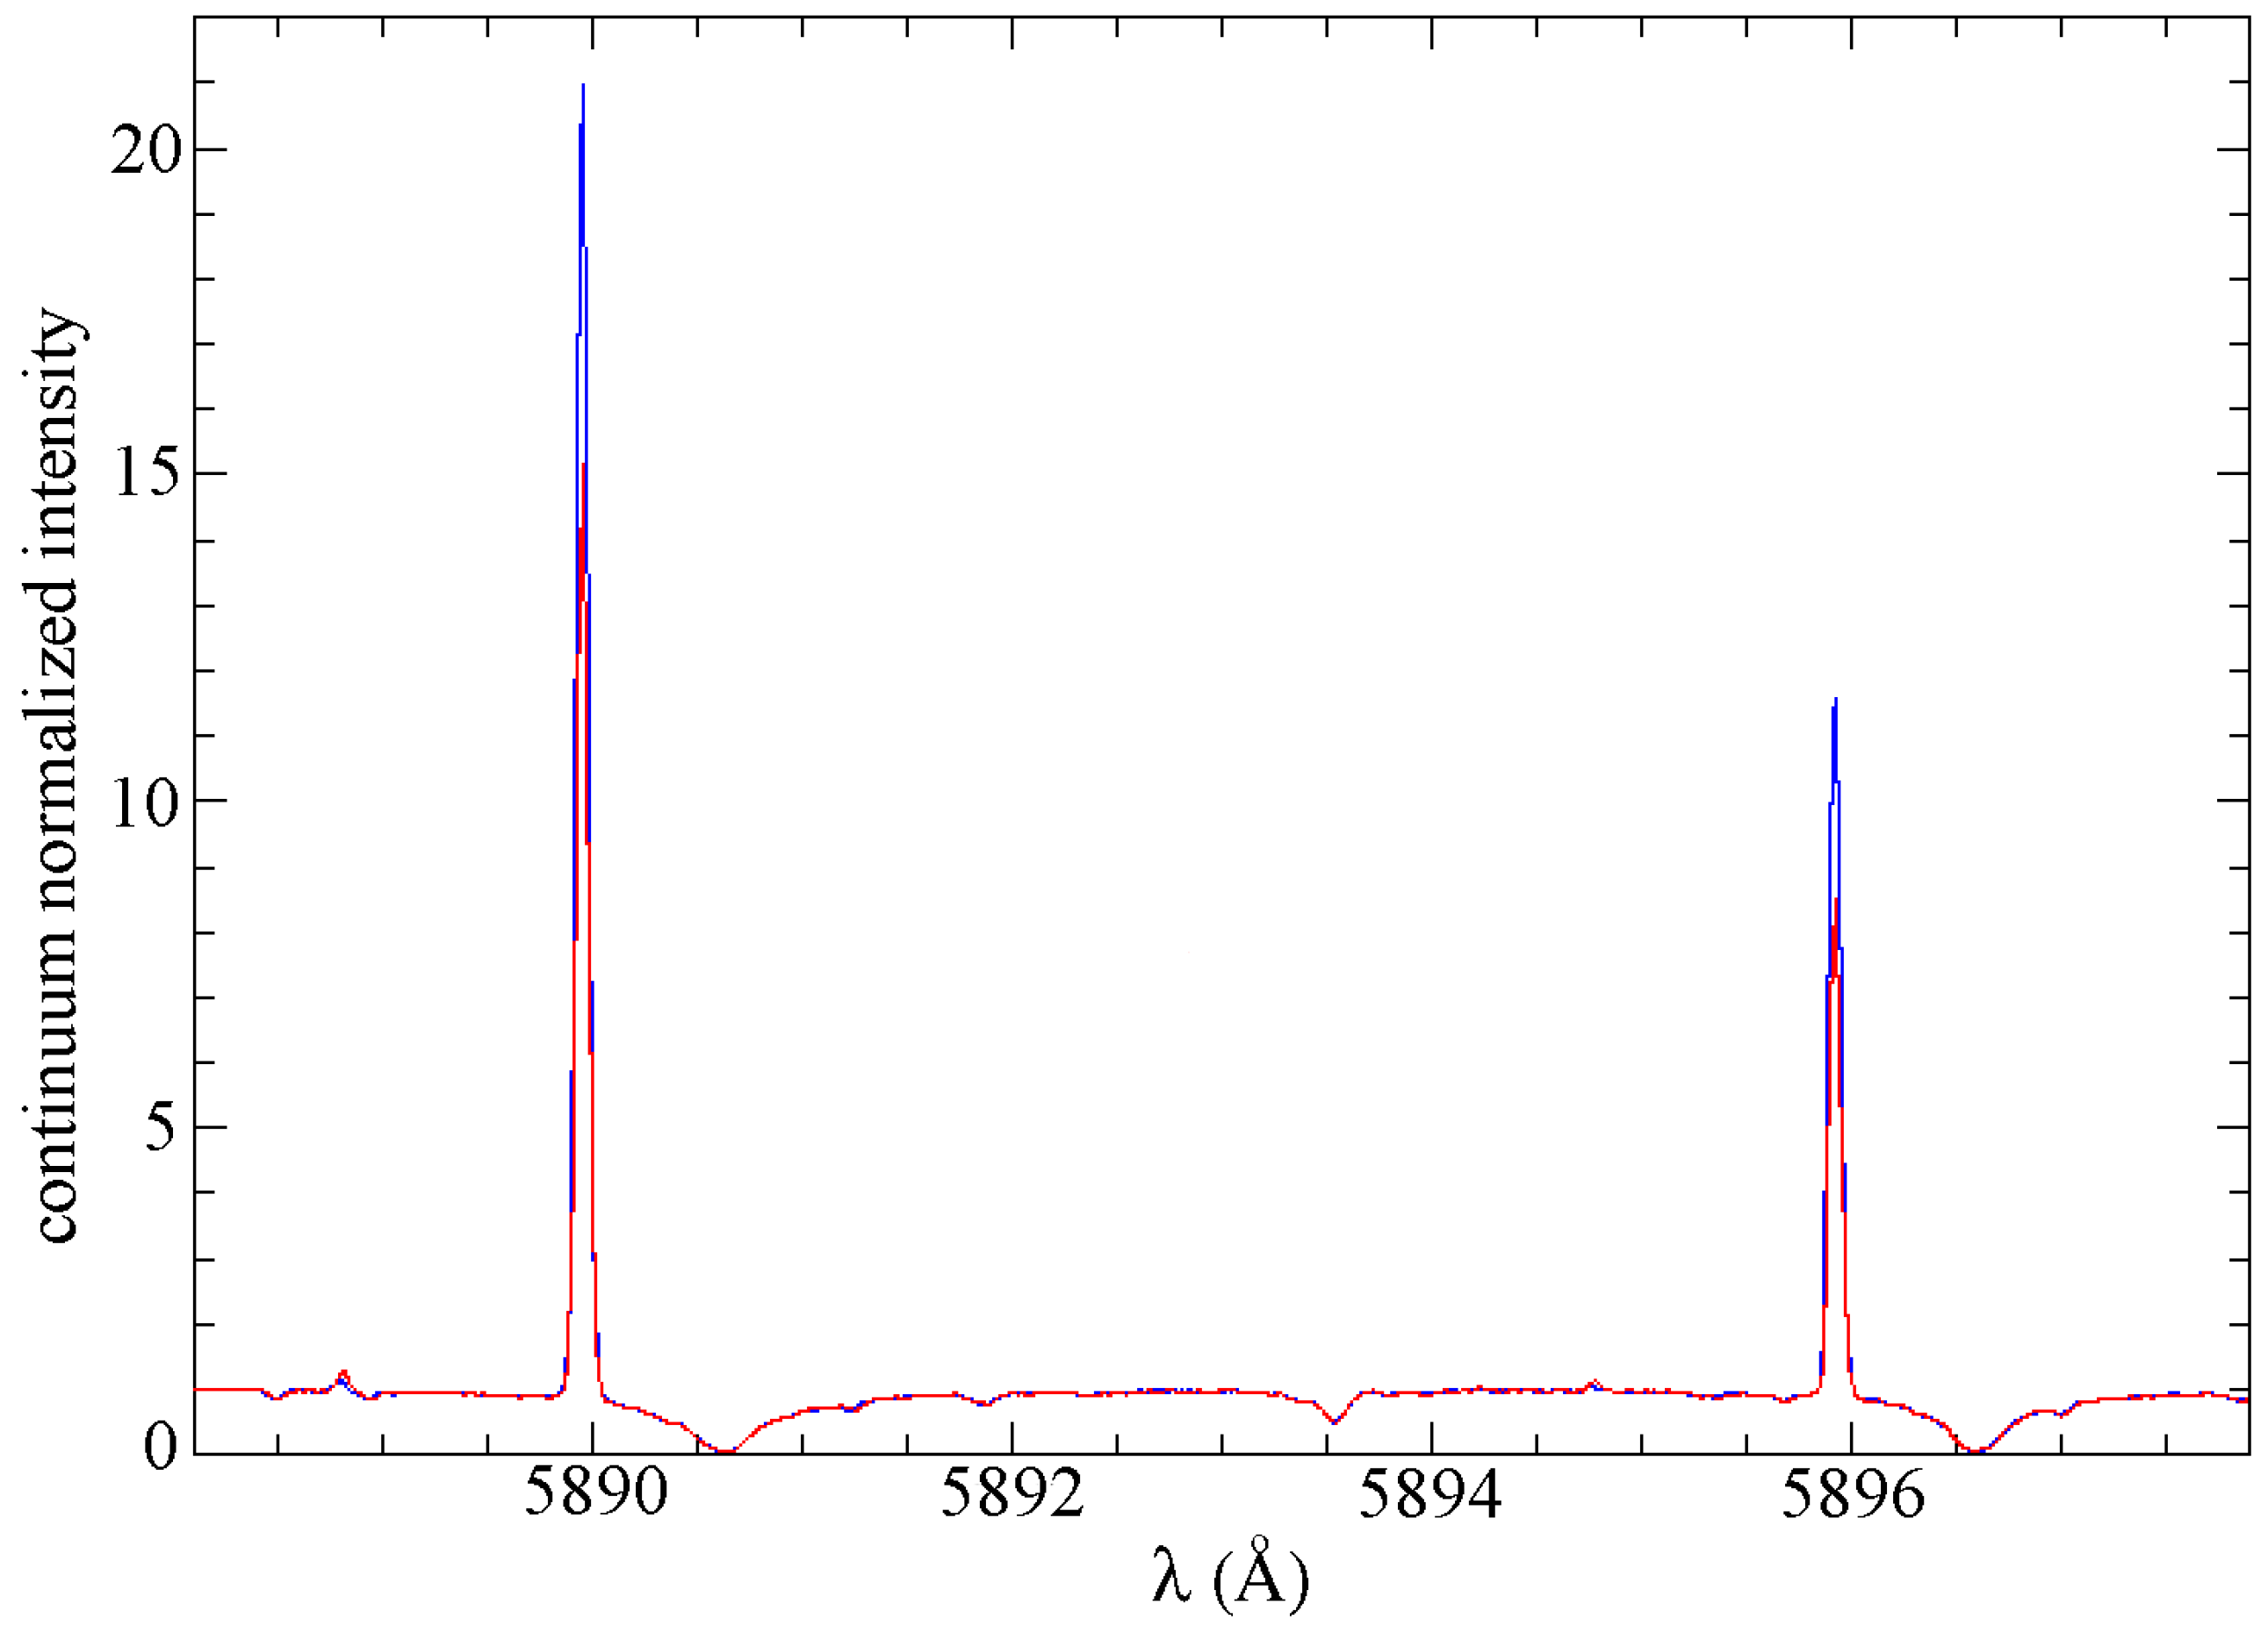
Figure 2.
Nucleus spectra of comet C/2023 A3 in the LiI region taken on 26 (red line, continuum of erg cm−2 s−1 Å−1) and 27 October 2024 (blue line, continuum of erg cm−2 s−1 Å−1). The FeI solar absorption line at 6707.43 Å is red-shifted of 34 km s−1.
Figure 2.
Nucleus spectra of comet C/2023 A3 in the LiI region taken on 26 (red line, continuum of erg cm−2 s−1 Å−1) and 27 October 2024 (blue line, continuum of erg cm−2 s−1 Å−1). The FeI solar absorption line at 6707.43 Å is red-shifted of 34 km s−1.
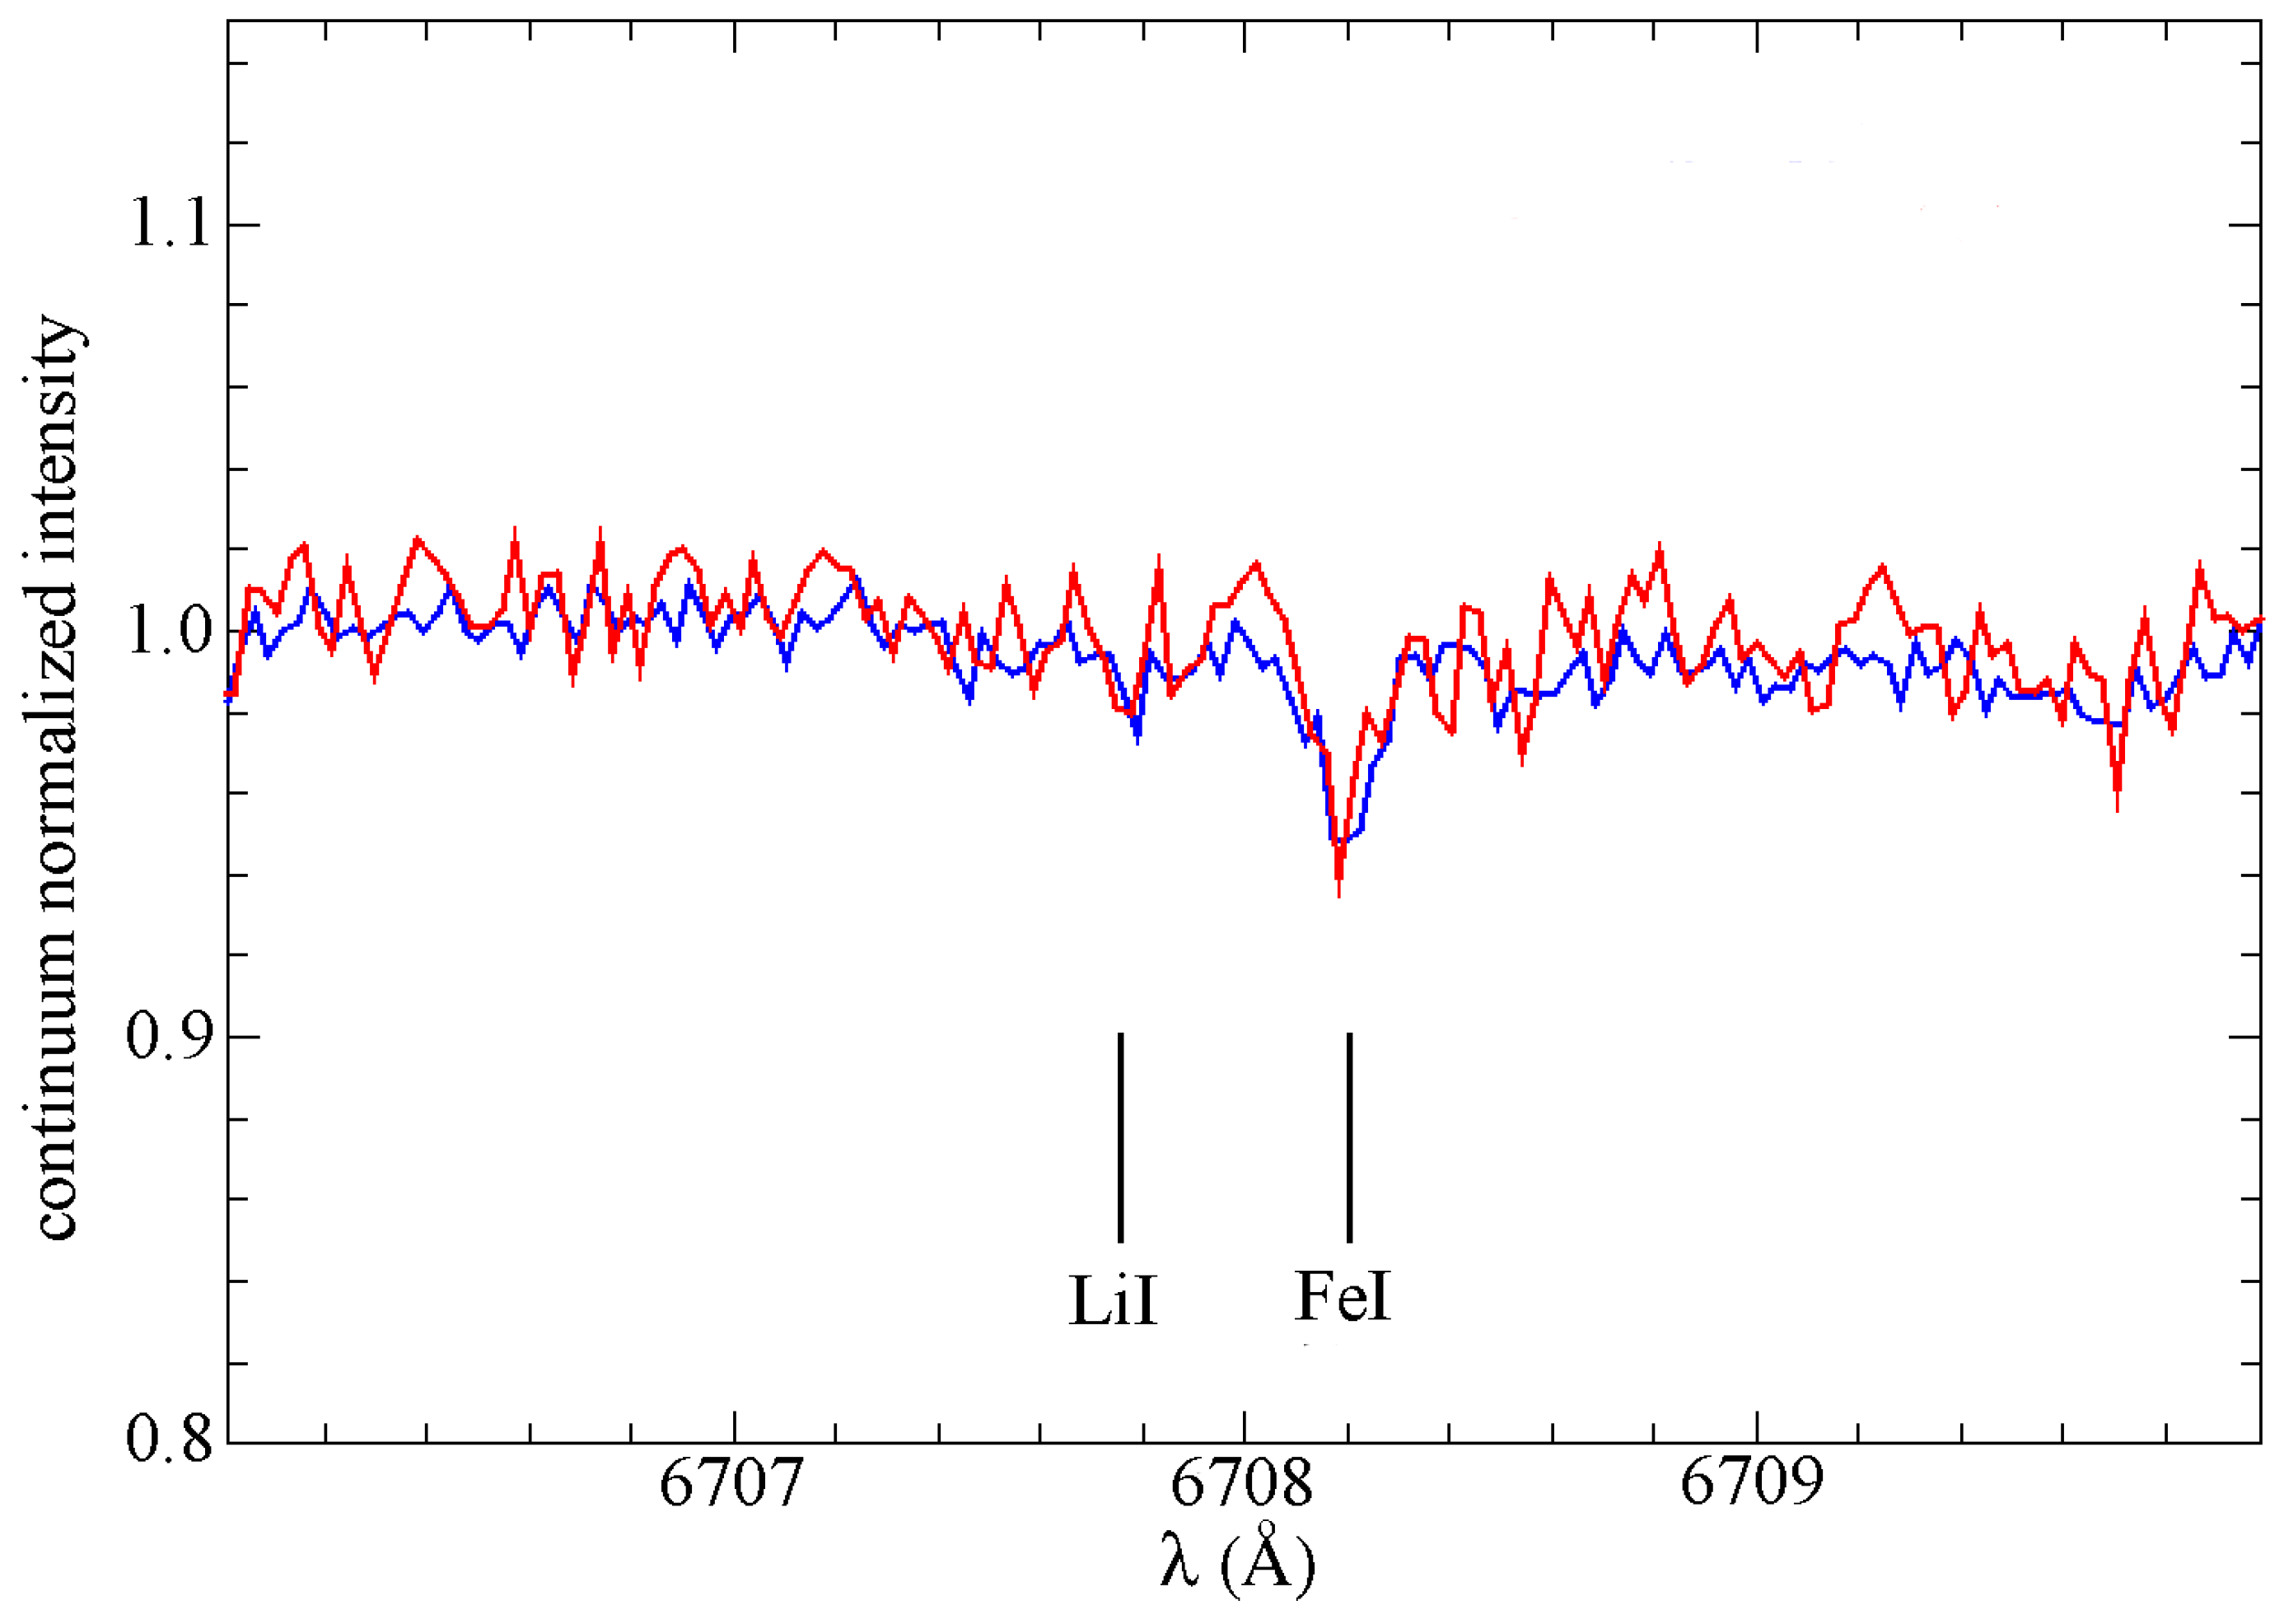
Figure 3.
Nucleus spectra of comet C/2023 A3 in the KI region taken on 26 (red line, continuum of erg cm−2 s−1 Å−1) and 27 October 2024 (blue line, continuum of erg cm−2 s−1 Å−1). The solar KI absorption line is red-shifted of 34 km s−1. The solar FeI absorption line at 7664.4 Å is red-shifted of 34 km s−1 and falls between the comet KI emission line and the solar KI absorption line. The strong absorption line at 7664.4 Å is a O2 atmospheric line of the A band, which is slightly different between the two nights due to the different airmass.
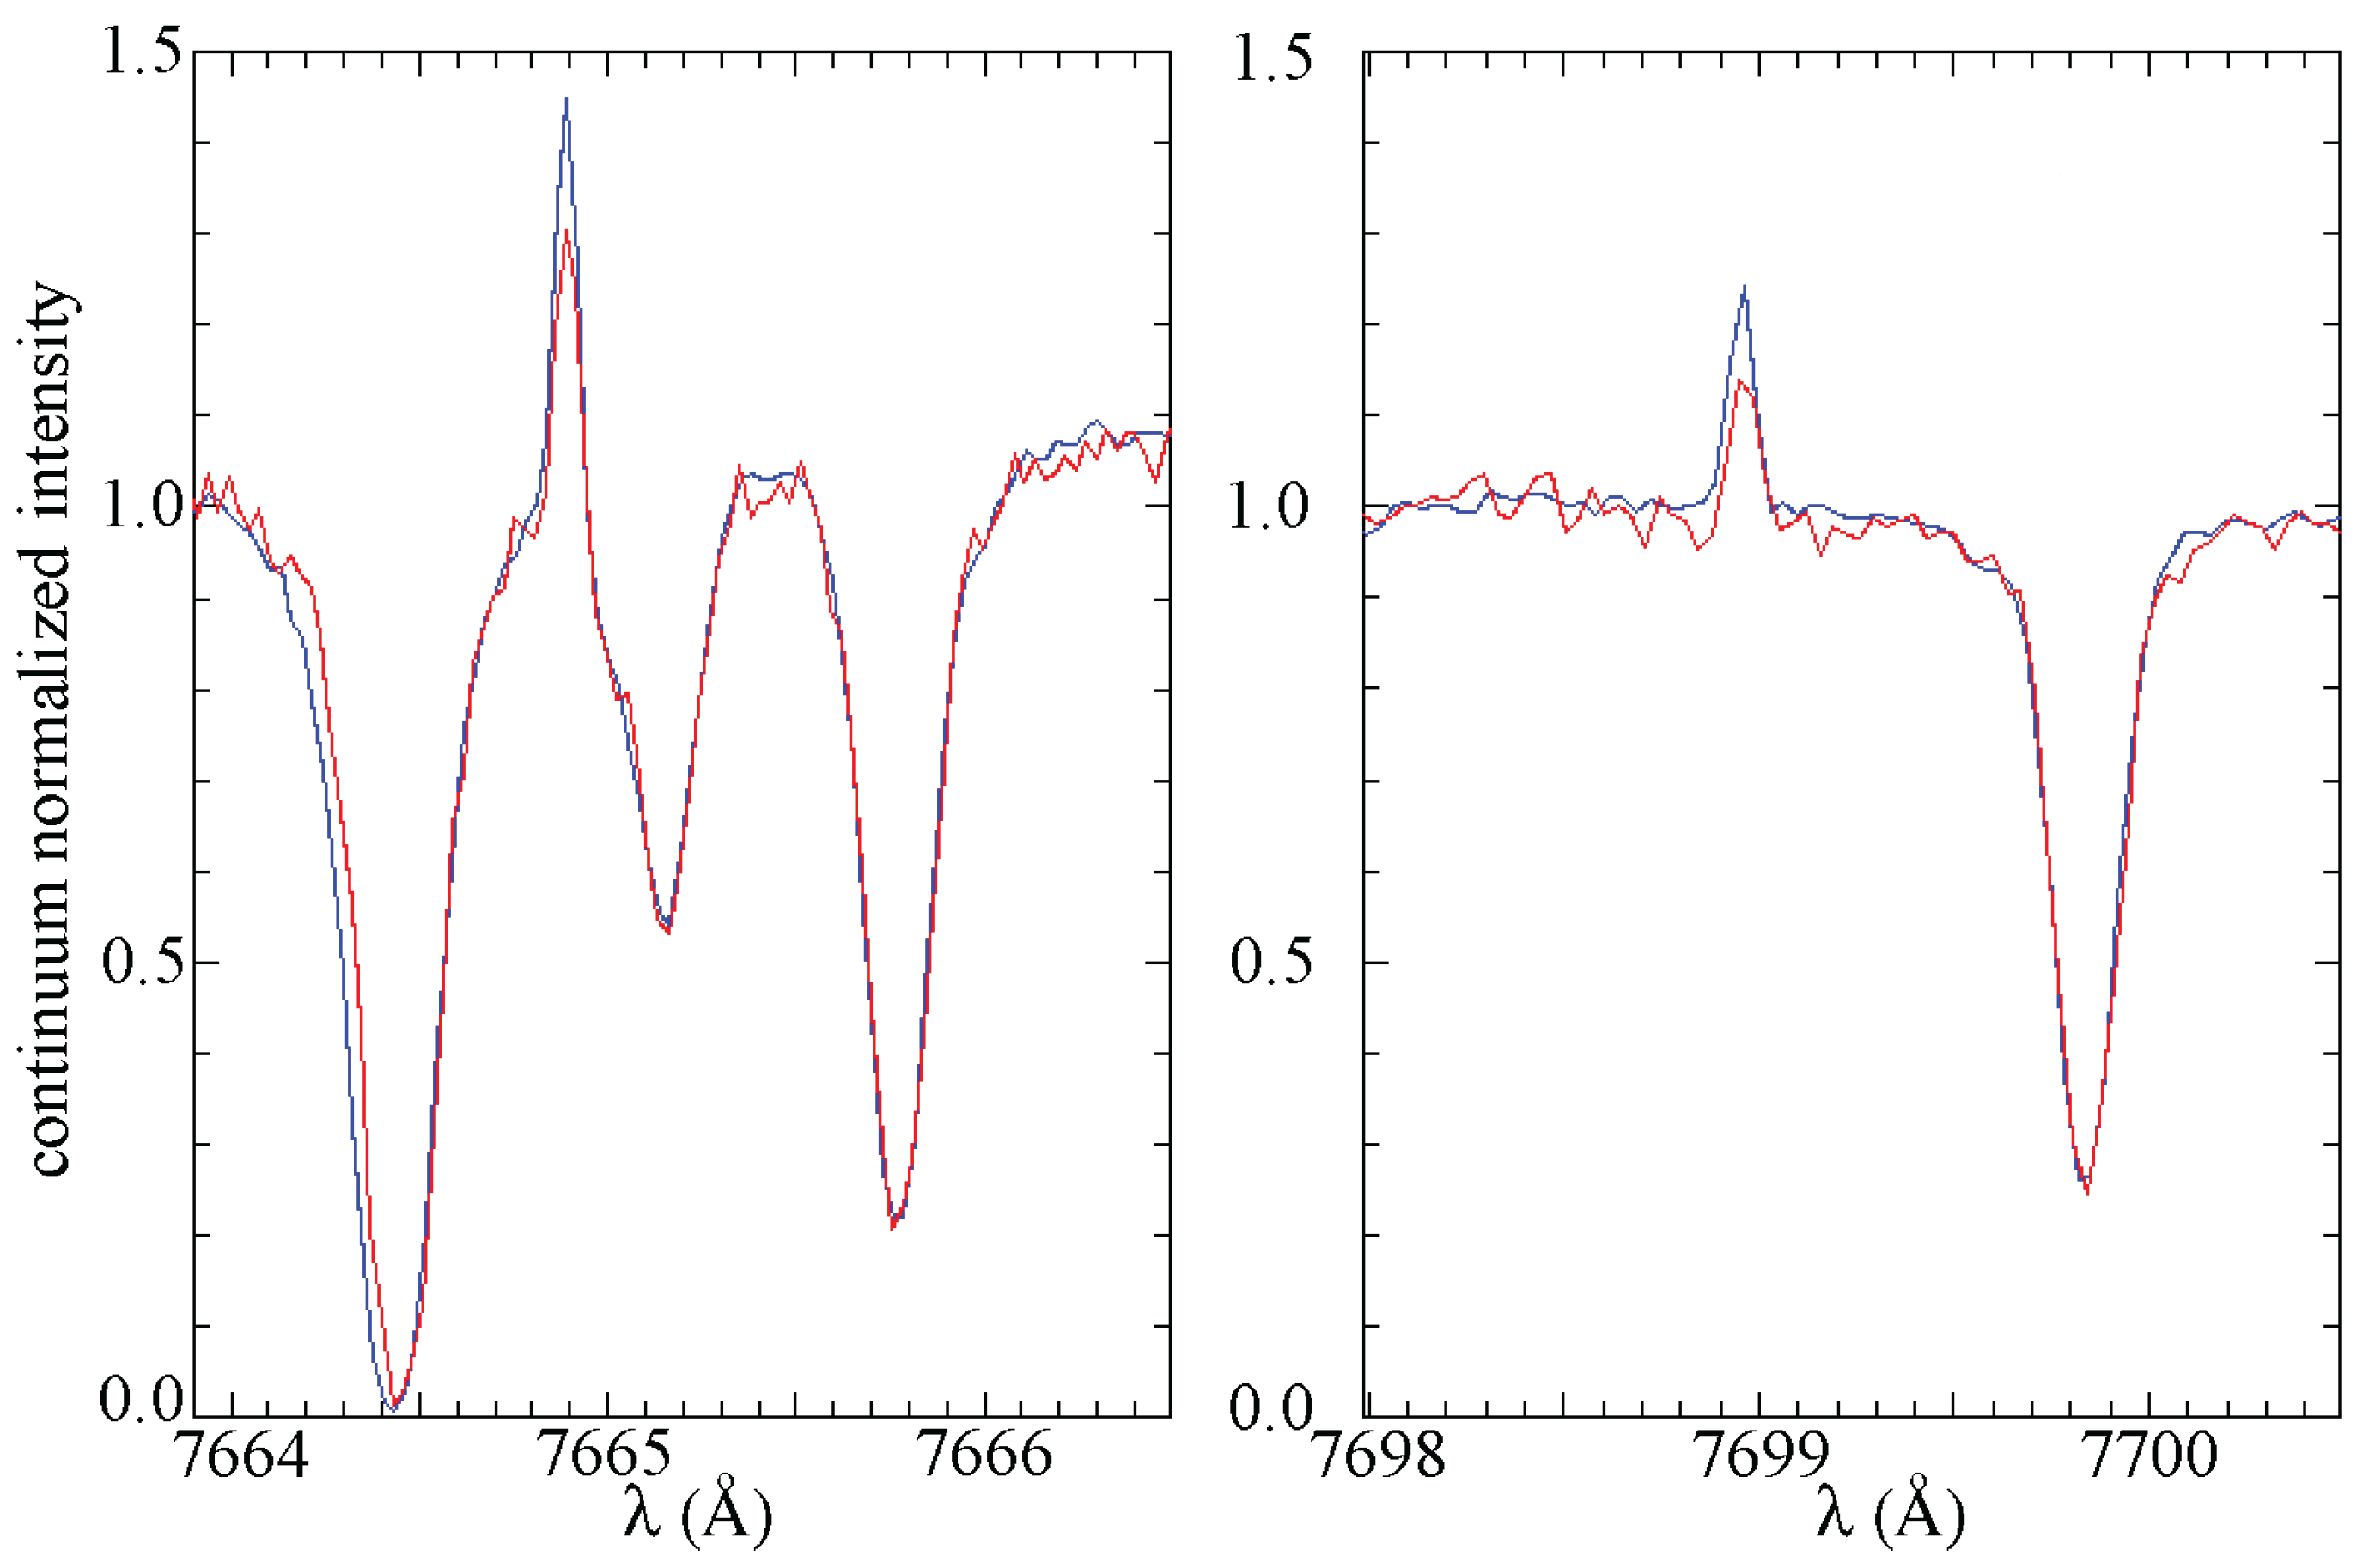
Figure 4.
Trail spectra of comet C/2023 A3 in the NaI region taken on 26 (red line, continuum of erg cm−2 s−1 Å−1) and 27 October 2024 (blue line, continuum of erg cm−2 s−1 Å−1). The telluric Na emission line is blue-shifted of 58 km s−1.
Figure 4.
Trail spectra of comet C/2023 A3 in the NaI region taken on 26 (red line, continuum of erg cm−2 s−1 Å−1) and 27 October 2024 (blue line, continuum of erg cm−2 s−1 Å−1). The telluric Na emission line is blue-shifted of 58 km s−1.
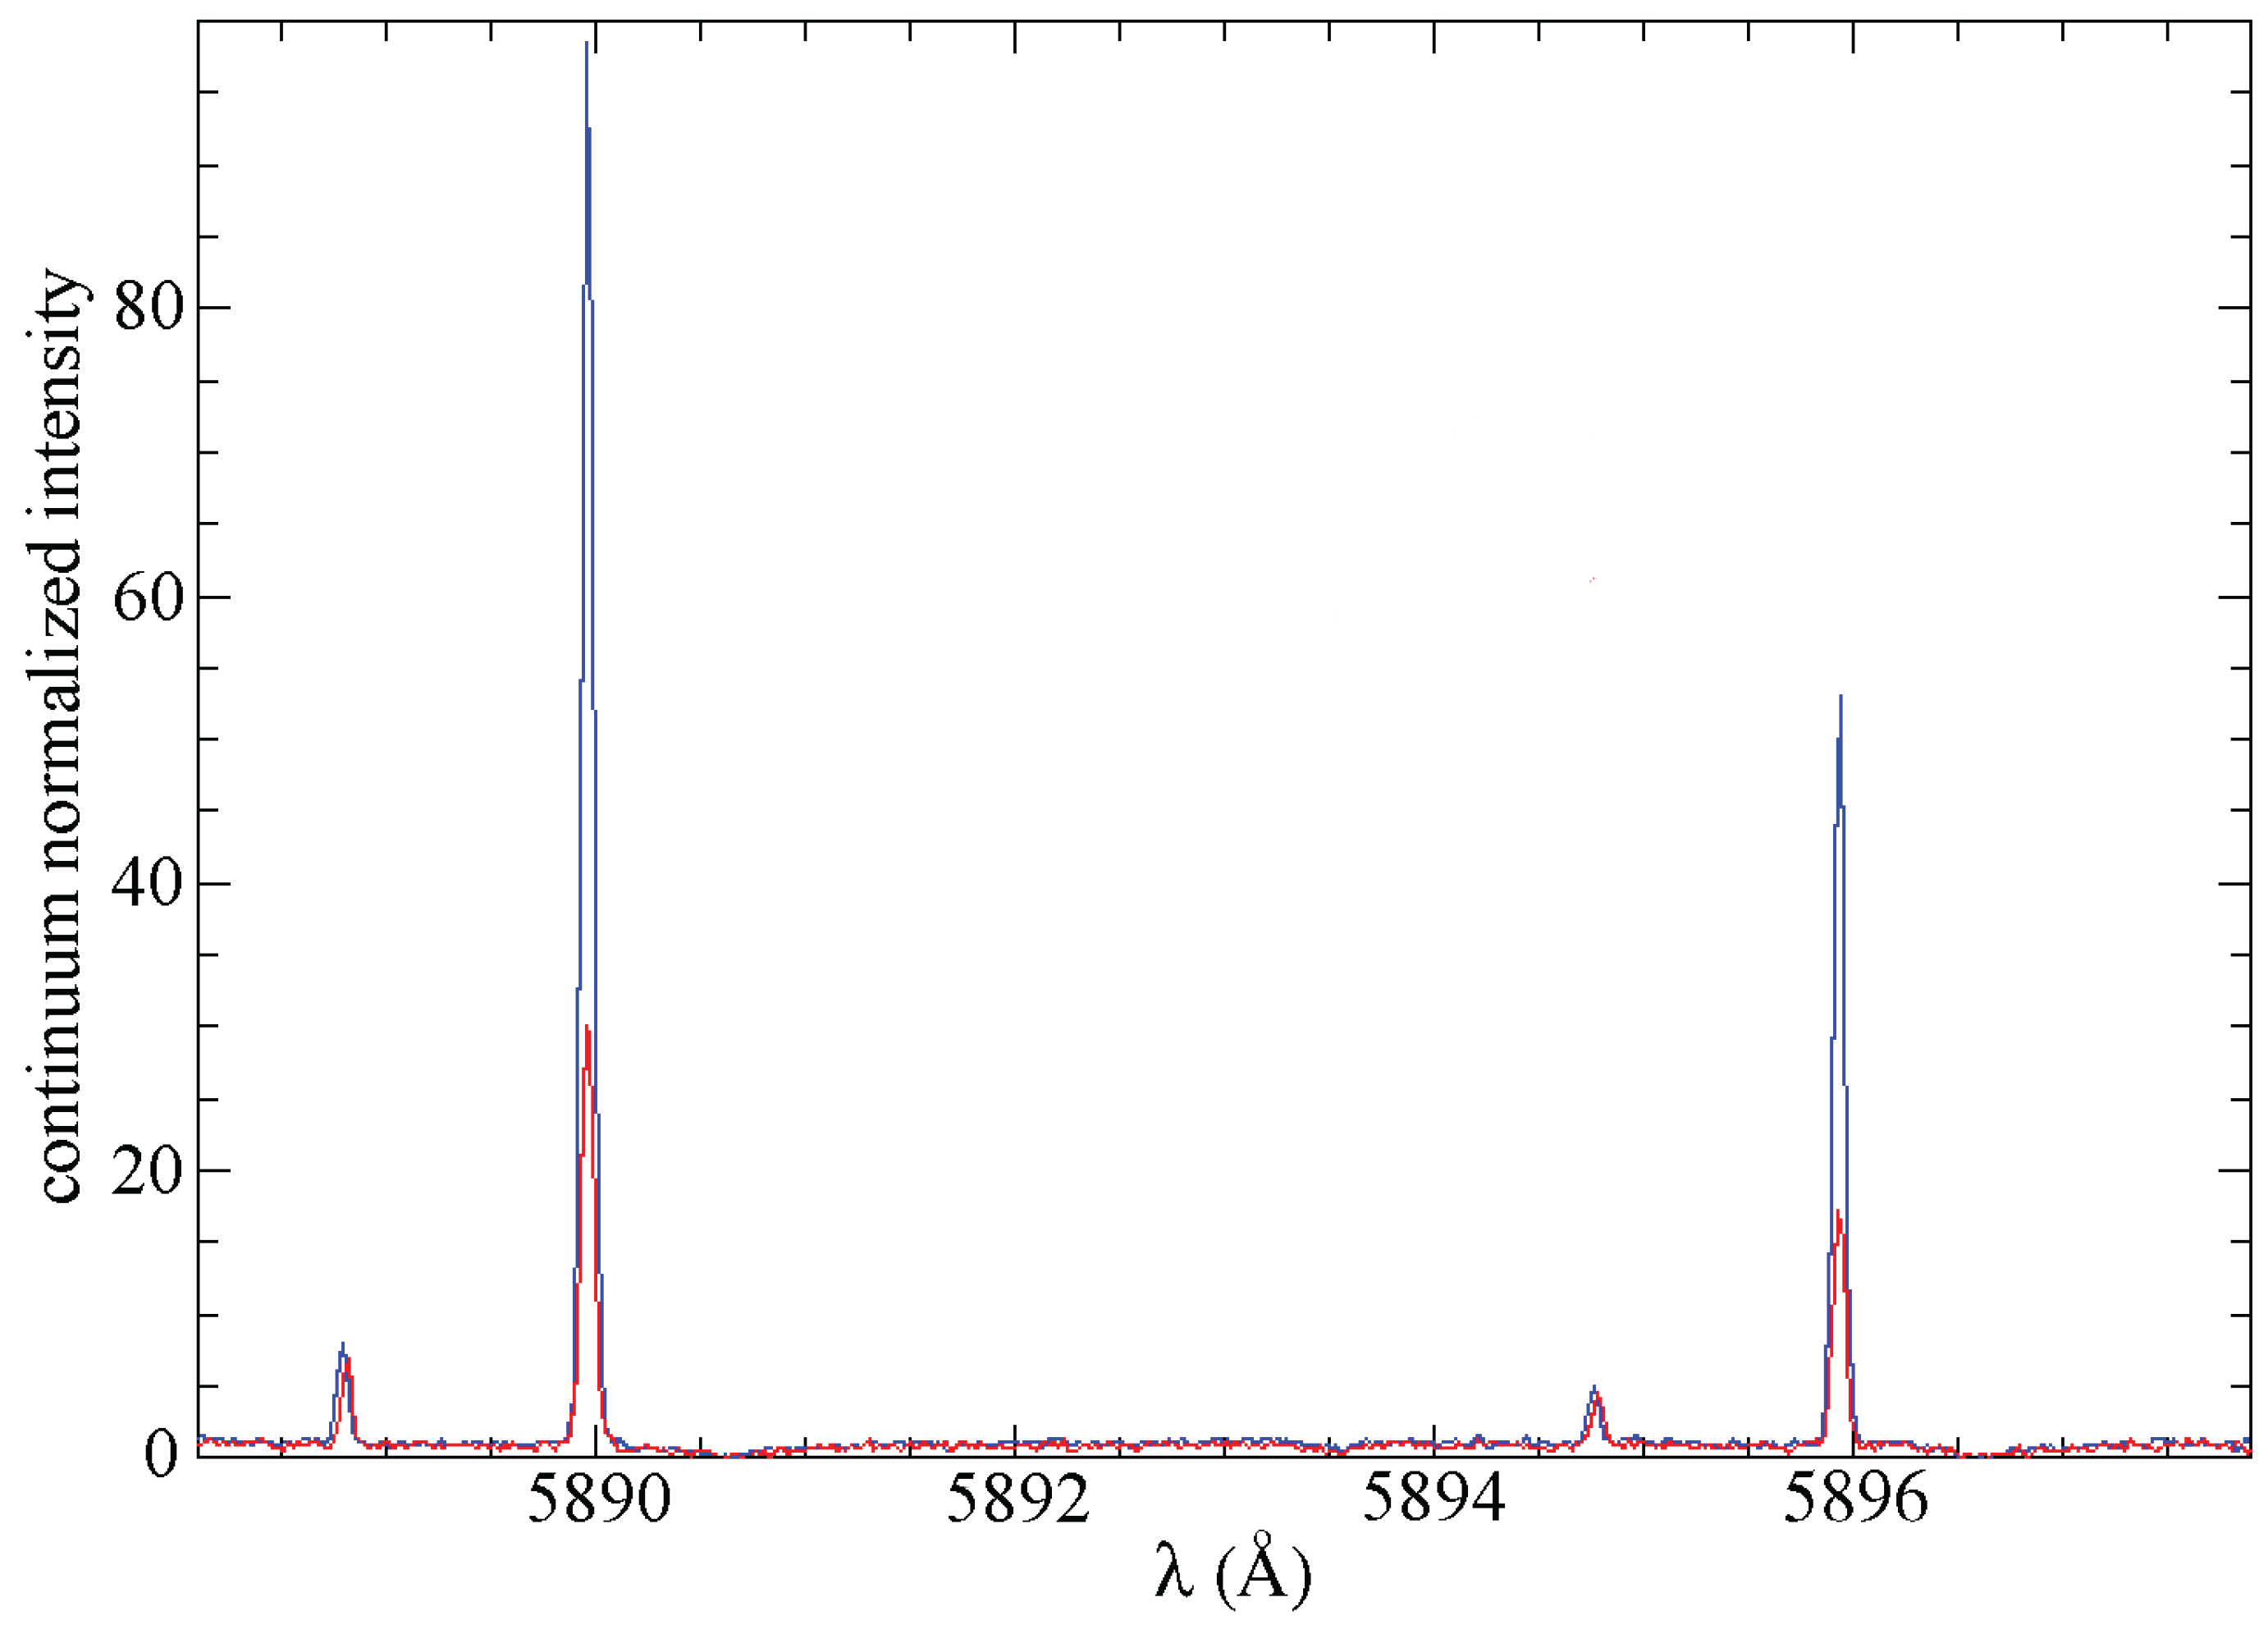
Figure 5.
Trail spectra of comet C/2023 A3 in the KI region taken on 26 (red line, continuum of erg cm−2 s−1 Å−1) and 27 October 2024 (blue line, continuum of erg cm−2 s−1 Å−1). The solar KI absorption line is red-shifted of 34 km s−1.
Figure 5.
Trail spectra of comet C/2023 A3 in the KI region taken on 26 (red line, continuum of erg cm−2 s−1 Å−1) and 27 October 2024 (blue line, continuum of erg cm−2 s−1 Å−1). The solar KI absorption line is red-shifted of 34 km s−1.
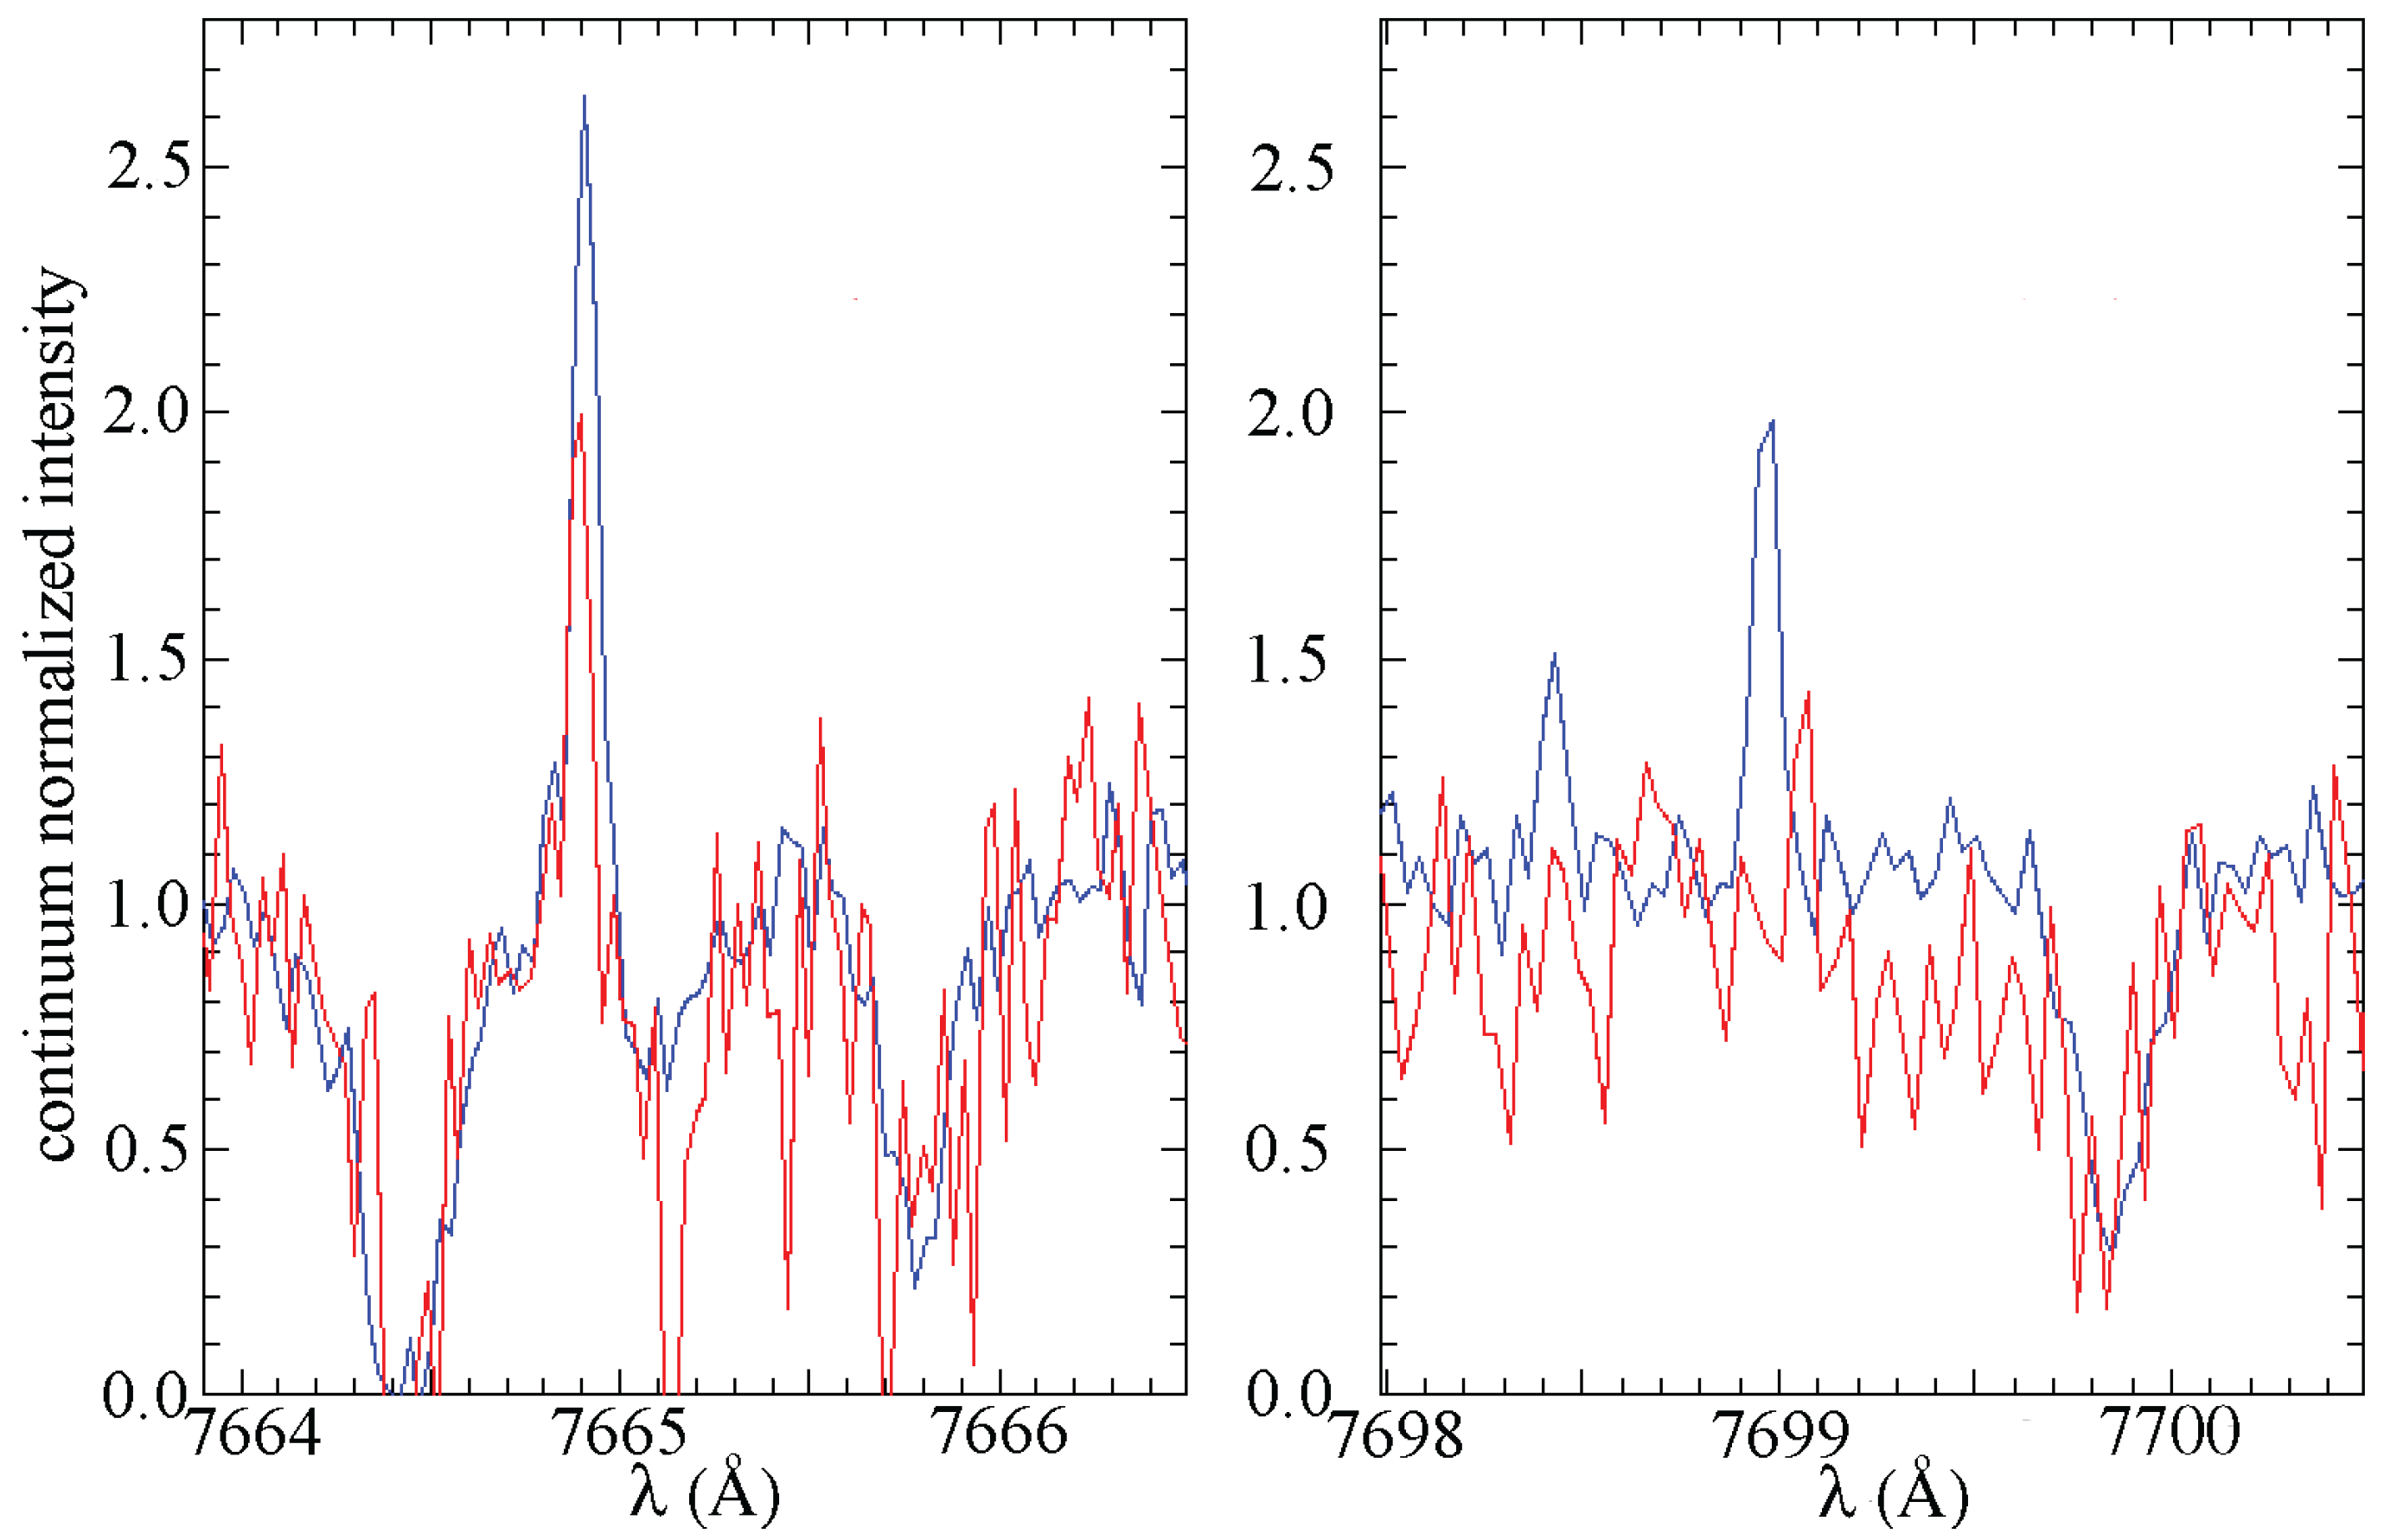

Table 1.
Log of observations, with one fiber located on the nucleus and another on the trail.
| UT | exposure | air | r | ||||||||||
| Oct 2024 | sec | mass | au | au | km/s | km/s | deg | deg | deg | deg | km | m/s2 | m/s2 |
| 26.09-26.11 | 1.9-2.4 | 0.812 | 0.774 | +33.64 | +58.02 | 77.6 | 71.6 | 239.8 | 225.1 | 5600 | 0.65 | 0.48 | |
| 27.06-27.12 | 1.6-2.9 | 0.831 | 0.808 | +33.61 | +58.80 | 74.6 | 71.4 | 238.3 | 225.2 | 5800 | 0.62 | 0.46 |
r and : heliocentric and geocentric distances. : phase angle. and : Position Angles of the antisolar and trailing orbit directions. and : Position Angle and distance from the nucleus of the trail observation. and : alkali acceleration due to solar radiation pressure.
Table 2.
Line intensities and elemental abundances in C/2023 A3.
| Atom | (Å) | () | () | () | () | ||||
| Li | 6707.78 | ||||||||
| Na | 5889.95 | 1 | 1 | 1 | 1 | ||||
| Na | 5895.92 | 1 | 1 | 1 | 1 | ||||
| K | 7664.90 | ||||||||
| K | 7698.96 |
Intensities I are in erg cm−2 s−1 Å−1 units. specifies the intensities measured on the October day and on the nucleus () or on the trail (). specifies the average of the potassium intensities. specifies the averages of the four nucleus values.
Table 3.
Alkali abundances in comets.
| Comet | r | |||
| au | ||||
| C/2024 G3 | ||||
| C/2020 F3 | ||||
| C/2011 L4 | ||||
| C/2023 A3 |
Disclaimer/Publisher’s Note: The statements, opinions and data contained in all publications are solely those of the individual author(s) and contributor(s) and not of MDPI and/or the editor(s). MDPI and/or the editor(s) disclaim responsibility for any injury to people or property resulting from any ideas, methods, instructions or products referred to in the content. |
© 2026 by the authors. Licensee MDPI, Basel, Switzerland. This article is an open access article distributed under the terms and conditions of the Creative Commons Attribution (CC BY) license (http://creativecommons.org/licenses/by/4.0/).
Copyright: This open access article is published under a Creative Commons CC BY 4.0 license, which permit the free download, distribution, and reuse, provided that the author and preprint are cited in any reuse.


