
Submitted:
23 February 2026
Posted:
25 February 2026
You are already at the latest version
Abstract
Sea urchin gonads (“roe”) are a valuable seafood product and a chemically complex matrix whose composition varies with physiology and environment. We present a biphasic extraction and ¹H NMR workflow to build a reusable reference inventory of polar metabolites and apolar lipid features in Paracentrotus lividus. Gonads from 37 adults (23 males, 14 females) collected at two sites (Alicante and Jávea–Dénia, Spain; October 2024) were lyophilized, extracted with methanol/chloroform/water, and analysed by 400 MHz ¹H NMR in buffered aqueous solution (polar) and CDCl₃ (apolar). Polar metabolite identification combined 1D patterns with database matching and ¹H–¹³C HSQC confirmation on representative samples, yielding 71 annotated resonances corresponding to 37 metabolites spanning amino acids, osmolytes/quaternary amines, carbohydrates/aminosugars, and nucleoside/purine-related compounds. Polar fingerprints enabled supervised modelling: PLS-LDA separated sexes with low cross-validated error, and SPA/COSS ranking highlighted glycine, alanine, creatine and osmolyte-associated signals as key discriminants; pathway mapping supported enrichment of amino-acid and one-carbon/purine networks. Apolar spectra were annotated at motif level and used for lipid-index estimation, indicating substantial unsaturation but low DHA and modest sex effects. The curated peak lists and reporting framework facilitate reproducible NMR annotation and future comparative studies of P. lividus gonads.
Keywords:
1H NMR
; metabolomics
; lipidomics
; Paracentrotus lividus
; sea urchin gonads
1. Introduction
Sea urchin gonads (“roe”, or “uni”) are a high-value seafood product and are increasingly studied as a reservoir of nutritionally and biologically relevant small molecules, spanning free amino acids and nucleotide-related compounds (linked to taste and freshness), osmolytes, and complex lipids. In the edible Mediterranean species Paracentrotus lividus, gonadal biochemical composition is not static: it varies with key biological and environmental drivers, including sex, season and gametogenic stage, with direct implications for quality traits and valorization. Accordingly, gonads constitute a chemically information-rich matrix for integrative characterization and for downstream studies in physiology, quality control and resource management [1,2,3].
From an analytical perspective, metabolomics provides an efficient route to describe the small-molecule composition of biological samples in a comprehensive yet information-dense manner. Among the main platforms, nuclear magnetic resonance (NMR) spectroscopy is particularly attractive because it is inherently quantitative, highly reproducible, and typically requires limited sample manipulation; in addition, structural information is encoded in chemical shifts, J-couplings, and signal multiplicities, which supports both profiling and metabolite identification. However, the same features that make 1H NMR efficient for complex mixtures—especially its narrow chemical-shift dispersion—also create practical challenges: extensive peak overlap and matrix-dependent effects can lead to ambiguous assignments if identification relies only on 1D spectra or incomplete reference matching [4]. For this reason, community guidance on metabolomics minimum reporting standards and NMR best practices emphasizes transparent documentation of sample preparation and key acquisition/processing parameters, together with explicit, evidence-graded metabolite identification (e.g., 2D confirmation and/or spiking where needed) to ensure reproducibility and cross-study comparability [5,6].
Recent work shows that sea urchin gonadal metabolomes can capture coherent physiological strategies rather than isolated biomarkers. For example, 1H HR-MAS NMR applied to intact gonads of two sympatric Mediterranean sea urchins (Arbacia lixula and Paracentrotus lividus) revealed systematic, species-linked contrasts consistent with different allocations between osmolyte/redox pools and amino-acid-enriched anabolic reserves [7]. In parallel, complementary “omics” and food-chemistry studies continue to expand the biochemical landscape of edible gonads; in particular, LC–MS lipidomics can now resolve hundreds to thousands of lipid molecular species and identify sex- and quality-related lipid patterns in sea urchins [8,9]. Together, these advances reinforce both the biological relevance and chemical complexity of gonadal tissue—and they also underline a practical bottleneck for NMR-based studies: the need for carefully curated, clearly evidenced peak assignments that enable confident identification (or explicit uncertainty) for each reported feature.
To strengthen metabolite annotation in NMR metabolomics, reference databases such as the Human Metabolome Database (HMDB) and the Biological Magnetic Resonance Data Bank (BMRB) provide curated compound information together with spectral and chemical-shift resources that support candidate generation and sanity checks in complex mixtures. In parallel, open metabolomics repositories such as MetaboLights enable deposition of raw data and rich metadata, facilitating reuse, reanalysis, and transparent benchmarking of annotation strategies across laboratories [10].
Here, we present an integrated 1H NMR characterization of Paracentrotus lividus gonads using paired polar and apolar extracts to capture both water-soluble metabolites and lipid-dominated spectral features. Adult individuals were collected at two Mediterranean coastal sites (Alicante and Jávea–Dénia, SE Spain) in early October 2024, yielding 34 gonad samples (18 males and 16 females). Building on current metabolomics reporting guidance and NMR best practices [4,5,6], our main aim is to deliver a curated, reusable reference inventory of gonadal features detectable under the described conditions: (i) evidence-graded annotation of polar metabolites across the aliphatic (0.5–5.5 ppm) and aromatic (6.0–9.0 ppm) regions, and (ii) annotation of characteristic apolar lipid motifs (including sterol- and glycerolipid-related signatures), with explicit flagging of overlap-prone segments. Candidate assignments were supported by database resources and 2D-NMR-assisted identification frameworks (HMDB/BMRB and COLMARm-type workflows) [11]. As a biological proof-of-concept for the utility of the curated profiles, we also show that the polar fingerprint contains robust sex-linked signatures, whereas apolar lipid-motif variation is comparatively modest in this dataset. Finally, by aligning the deliverables (annotated peak lists, confidence notes, and metadata) with open-data practices, the study is designed to facilitate transparent reuse and benchmarking in future work on seasonality, diet, environmental stressors, and processing/valorization of P. lividus gonads [10].
The main output of this study is a curated, evidence-graded 1H NMR peak list for P. lividus gonads, reporting chemical shifts and multiplicities for polar metabolites together with a practical annotation of apolar lipid motifs [12,13,14,15,16]. By explicitly documenting overlap-prone regions and assigning confidence levels, the resource is intended to be directly citable and reusable as a reference for peak interpretation and cross-study comparison in sea urchin gonad metabolomics [4,6].
Beyond annotation, the curated framework enables hypothesis-driven reuse: it provides a baseline to test how gonad chemistry shifts with seasonality, gametogenic stage, diet, habitat quality, and environmental stressors, and it supports transparent benchmarking of annotation strategies across laboratories. In line with open metabolomics practice, the reporting structure is designed to facilitate data and metadata deposition and subsequent reanalysis in public repositories.
2. Materials and Methods
2.1. Biological Material and Study Design
Adult Paracentrotus lividus specimens were collected by snorkel diving at 1–6 m depth along the Mediterranean coast of Alicante Province (SE Spain). Two habitat types (natural vs. artificial) were initially considered at each locality, although habitat/location stratification was not pursued further due to the lack of consistent effects in downstream analyses. Individuals (>40 mm test diameter) were transported alive to the laboratory in aerated seawater. Upon arrival, specimens were euthanized by freezing, biometrically recorded (size and wet weight), sexed after dissection, and gonads were excised and stored frozen until processing.
Gonadal tissues used in this study originated from the same specimen collection framework previously employed for gonad profiling in P. lividus [17]. A total of 37 gonad samples were analyzed (23 males, 14 females).
2.2. Lyophilization and Sample Preparation
Frozen gonadal tissues were lyophilized for 24 h. Lyophilized material was homogenized to a fine powder. For each specimen, 50 mg of powdered gonad was transferred into a 1.5 mL microcentrifuge tube for biphasic extraction.
2.3. Biphasic Extraction of Polar and Apolar Metabolites
Polar and apolar metabolites were extracted using a methanol/chloroform/water biphasic protocol [18]. Briefly, 400 µL of methanol and 85 µL of water were added to each tube (note: methanol was used; NaOH was not used in this step). Samples were vortex-mixed for 60 s at maximum speed and sonicated for 10 min. Then, 200 µL chloroform was added, followed by vortex mixing (60 s). Samples were incubated on ice for 5 min and sonicated again for 10 min. Subsequently, an additional 200 µL chloroform and 200 µL water were added, vortexed (60 s), and sonicated (10 min). Phase separation was achieved by centrifugation at 12,000×g for 10 min at 4 °C, yielding an upper polar (aqueous) phase and a lower apolar (organic) phase.
The lower apolar phase was collected using disposable syringes and transferred into labeled tubes. The upper polar phase was transferred using a micropipette into labeled tubes. Both fractions were dried to completeness in a SpeedVac system (apolar fraction at ~30 °C with open caps; polar fraction to complete removal of aqueous solvent).
2.4. NMR Sample Preparation
For the apolar fraction, dried extracts were reconstituted in 500 µL deuterated chloroform (CDCl3) and transferred into 5 mm NMR tubes, sealed to avoid solvent evaporation.
For the polar fraction, dried extracts were reconstituted in 600 µL phosphate buffer (50 mM) containing sodium azide, and 60 µL D2O was added for field locking. After a brief centrifugation (3 min at 12,000 rpm), supernatants were transferred to 5 mm NMR tubes and sealed.
2.5. 1H NMR Data Acquisition
All 1H NMR experiments were performed on a Bruker Avance 400 MHz spectrometer equipped with a 5 mm HBB13C TBI probe and actively shielded z-gradients (Bruker, Rheinstetten, Germany). One-dimensional 1H spectra were acquired at 298 K using a recycle delay of 2 s, 32,768 time-domain points, an acquisition time of 2.556 s, and 64 scans per sample. Spectra were apodized with an exponential line broadening of 0.3 Hz prior to Fourier transformation. For polar extracts, spectra were referenced to TSP (0.5 mM) at 0.00 ppm. For apolar extracts in CDCl3, spectra were referenced to the residual solvent signal (as applicable for chloroform-based NMR).
2.6. Spectral Processing and Data Handling
Raw NMR data were processed in TopSpin 4.3.0 (Bruker, Rheinstetten, Germany) and exported as text files. Spectra were adjusted to a consistent chemical shift window (11.0 to −0.5 ppm) prior to multivariate handling. Processed datasets were imported into MATLAB version 2024 (MathWorks, Natick, MA, USA) for downstream preprocessing and statistical analysis.
2.7. Metabolite Annotation Strategy
Metabolite assignments were performed primarily from 1H chemical shift patterns, multiplicities, and coupling information, supported by public reference databases (e.g., HMDB ( https://hmdb.ca/, accessed on 18 February 2026)) and BMRB (http://bmrb.io/, accessed on 18 February 2026)) and relevant literature comparisons. When peak overlap or ambiguity prevented confident assignment from 1D 1H spectra alone, signals were conservatively left unassigned (and flagged for future confirmation by 2D NMR if required).
2.8. Statistical Analysis and Chemometric Modelling
Processed 1H NMR datasets (polar and apolar fractions) were handled in MATLAB (MathWorks, Natick, MA, USA). For multivariate analysis of the polar fraction, the full spectral matrix (intensity vs. chemical shift) was built from the exported 1D spectra after consistent referencing and windowing. Prior to modelling, spectra were inspected for artefacts and, when appropriate, narrow regions dominated by non-informative signals (e.g., residual solvent/standard peaks) were excluded to avoid undue leverage on supervised models. Data were mean-centred and scaling was evaluated as part of model validation (Pareto scaling and autoscaling, as specified in the corresponding validation outputs).
Supervised classification was performed using Partial Least Squares–Linear Discriminant Analysis (PLS-LDA) implemented with the libPLS workflow in MATLAB (https://www.libpls.net/, accessed on 18 February 2026). In this framework, PLS latent variables (LVs) were computed using the NIPALS algorithm and class separation was obtained by applying linear discriminant analysis (LDA) to the latent-variable scores. Model dimensionality (optimal number of LVs) and predictive performance were assessed using internal validation routines, including cross-validation and Monte Carlo cross-validation (MCCV). Model quality was summarised using standard classification metrics (misclassification error, sensitivity, specificity) and ROC-derived AUC values [19].
To move from full-spectrum discrimination to an interpretable set of candidate markers, a Subwindow Permutation Analysis (SPA) was applied to the peak-level dataset derived from the curated polar resonance table (Supplementary Table S1). SPA is a supervised Monte-Carlo variable-selection approach that repeatedly builds PLS-LDA sub-models on randomly sampled subsets of samples and variables, and evaluates the statistical contribution of each variable by comparing prediction errors between the original and permuted datasets. For each variable, SPA provides a nominal p-value and the corresponding Conditional Synergistic Score (COSS = −log10 p). Unless otherwise stated, variables meeting the nominal criterion p < 0.05 were retained as statistically supported contributors for downstream reporting and visualization [20,21].
For univariate group comparisons (e.g., selected peak intensities/integrals and apolar lipid indices), a two-sided Mann–Whitney U test was used given the non-guaranteed normality of metabolomics readouts. Exact p-values are reported. Boxplots (where shown) were generated using the standard convention: centre line = median, box = interquartile range (IQR), whiskers = 1.5×IQR, and individual points represent sample-level values.
2.9. Pathway Analysis (MetaboAnalyst)
Pathway analysis was carried out using MetaboAnalyst v. 6.0 (Pathway Analysis module; www.metaboanalyst.ca, accessed on 18 February 2026) in “compound list” mode with the KEGG pathway library. Metabolite names were mapped to KEGG identifiers using the built-in name matching tools [22,23]. Enrichment was assessed by over-representation analysis (hypergeometric test), and pathway topology was evaluated using relative betweenness centrality to compute pathway impact scores.
Importantly, the input compound list comprised all metabolites identified in the 1H NMR spectra of the polar extracts across the complete dataset (i.e., considering both males and females), in order to summarise the biochemical landscape represented in the polar gonadal metabolome under the present analytical conditions. For each pathway, MetaboAnalyst outputs (where available) included: Total compounds, Expected hits, Observed hits, Raw p-value, −log10(p), multiple-testing adjusted p-values (Holm) and FDR, together with pathway impact. Complete pathway statistics are reported in the Supplementary Materials table associated with the MetaboAnalyst output.
2.10. Apolar Extract Quantification and Lipid Index Calculation
For the apolar fraction (CDCl3), lipid-class indices were computed from integrals of diagnostic spectral regions using the balance-equation scheme described by Bratu et al. [24]. Briefly, integrals were obtained by numerical integration of predefined chemical shift windows corresponding to characteristic lipid motifs (e.g., terminal methyls, methylene envelope, allylic/bis-allylic methylenes, olefinic protons, and DHA-associated sub-regions). In this work, a narrower F′ window (2.37–2.40 ppm) was used to better isolate DHA-related contributions. The resulting system of equations yields molar estimates for total unsaturated and saturated fractions, ω-3 content, and DHA, with internal constraints enabling automated flagging of spectra that violate expected bounds. Spectra failing internal consistency checks were excluded from downstream comparisons.
Sex-stratified comparisons of the derived apolar indices were performed using two-sided Mann–Whitney testing. When multivariate separability of the apolar indices was assessed, classification performance was evaluated under cross-validation to avoid optimistic estimates.
3. Results
3.1. 1H NMR Spectral Overview and Metabolite Annotation (Polar Extracts)
Representative 1H NMR spectra of the polar extracts obtained from Paracentrotus lividus gonads (males and females) showed a consistent metabolomic fingerprint dominated by low–molecular-weight metabolites, with the expected distribution of resonances across the aliphatic (≈0.8–3.0 ppm), carbohydrate/heteroatom-rich (≈3.0–5.5 ppm) and aromatic (≈6.0–9.0 ppm) regions. Metabolite assignment was supported by 2D NMR experiments (including 1H–13C HSQC on representative samples) and by comparison with reference databases and literature patterns. The complete list of assigned resonances, chemical shifts, multiplicities and moiety-level annotations is provided in Supplementary Table S1, while a summary figure with labelled signals is included as Figure 1 (polar fraction).
Using the curated peak table, a total of 71 resonances were annotated, corresponding to 37 unique polar metabolites (64 peaks assigned; remaining peaks left as unassigned due to overlap or insufficient 2D support). The identified metabolite space covered major biochemical categories relevant to gonadal physiology, including: (i) free amino acids and nitrogen carriers (e.g., alanine, valine/isoleucine, threonine, arginine, lysine, glutamate, glutamine, glycine, histidine, phenylalanine, tyrosine and tryptophan); (ii) osmolytes and quaternary amines (taurine, betaine, choline, trimethylamine and trimethylamine N-oxide); (iii) energy-buffer and related metabolites (creatine); (iv) carbohydrates and aminosugars (trehalose, N-acetylglucosamine); (v) nucleotide-related metabolites (uridine/uracil, inosine, hypoxanthine, xanthine, adenosine monophosphate and 3,7-dimethyluric acid); and (vi) aromatic and diet-/microbiota-linked compounds (e.g., trigonelline, kynurenine, vanillic acid), together with small one-carbon/methylated species detected in the low-ppm region (methanol, methylamine).
Overall, these assignments establish a chemically coherent polar metabolite panel suitable for (a) untargeted multivariate modelling using the full 1H NMR spectral profiles, and (b) targeted/semi-targeted analyses based on peak heights or integrations of the annotated metabolites (Section 3.2, Section 3.3 and Section 3.4).
3.2. PLS-LDA Model
To assess whether male and female Paracentrotus lividus gonads can be discriminated based on the polar-fraction 1H NMR fingerprints, a Partial Least Squares–Linear Discriminant Analysis (PLS-LDA) model was built using the full spectral dataset (Figure 2). The PLS-LDA implementation followed the libPLS framework, in which PLS scores are obtained by the NIPALS algorithm after data pretreatment, and class separation is achieved by applying linear discriminant analysis to the latent variables; model outputs include VIP scores and ROC-derived metrics (AUC, sensitivity, specificity) [19].
An exploratory fit computed up to six latent variables returned R2X = [0.1837, 0.3028, 0.0641, 0.0515, 0.0423, 0.0427] and R2Y = [0.7525, 0.0479, 0.0830, 0.0504, 0.0189, 0.0075], showing that class-related variance was captured predominantly by LV1 (R2Y = 0.7525). When focusing on the dimensionality supported by validation, the first two latent variables already accounted for R2X(cum) = 0.4865 and R2Y(cum) = 0.8004, indicating that a compact latent space was sufficient to encode most sex-associated information.
The PLS score plot (PLS-1 vs PLS-2) showed a clear separation between groups, with female samples (red diamonds) clustering at negative PLS-1 values and male samples (blue circles) at positive PLS-1 values (Figure 2.B). Apparent (training) performance for the fitted model yielded error = 0, sensitivity = 1, specificity = 1 and AUC = 1. However, to provide a more conservative estimate of predictive performance, cross-validation (CV) and Monte Carlo cross-validation (MCCV) were carried out. Under CV (pareto scaling), the optimal model complexity was optLV = 2, achieving error_min = 0.0294 (≈2.94% misclassification across n = 34 samples), with sensitivity = 1, specificity = 0.9375, and AUC = 1. Under MCCV (autoscaling), the optimal complexity was again optLV = 2, with error_min = 0.0793. Overall, both validation approaches supported that the discrimination between sexes is robust and is achieved with a low number of latent variables, mitigating overfitting concerns while preserving separation.
The corresponding VIP profile (Figure 2.A) highlighted the spectral regions contributing most strongly to discrimination, with the largest VIP features concentrated in the 3.0–4.2 ppm range (carbohydrate/heteroatom-rich region), alongside additional contributions from aliphatic and aromatic resonances. These VIP-enriched regions guided the subsequent targeted variable selection and biomarker ranking by Subwindow Permutation Analysis (SPA) and COSS (Section 3.3 and Section 3.4) [19,20,21].
3.3. SPA-Based Variable Selection and COSS Ranking
To move from untargeted discrimination (full-spectrum PLS-LDA) to a more interpretable set of sex-discriminant markers, Subwindow Permutation Analysis (SPA) was applied to the peak-level dataset derived from the curated polar 1H NMR resonance table (Suplementary Table S1). SPA evaluates the statistical contribution of each variable to the predictive performance of the classification model by iteratively permuting local subwindows, yielding a variable-wise p-value and the associated Conditional Synergistic Score (COSS), commonly defined as COSS = −log10(p) [21].
Based on the SPA output, a total of 14 variables met the nominal significance criterion p < 0.05 (corresponding to COSS > 1.30) and were retained as the most informative spectral features for sex discrimination (Figure 3). The highest-ranked marker was the glycine resonance at δH = 3.5648 ppm (p = 7.41×10⁻¹⁸; COSS = 17.13), followed by alanine at δH = 1.4715 ppm (p = 3.16×10⁻¹⁴; COSS = 13.50) and creatine at δH = 3.9323 ppm (p = 2.32×10⁻⁹; COSS = 8.63). Additional significant variables clustered predominantly in the 3.0–3.6 ppm region, consistent with the VIP-enriched zone observed in the full-spectrum PLS-LDA model, and included signals assigned to histidine (δH = 3.1273 ppm), lysine (δH = 3.0362 ppm; plus a lysine-associated aliphatic signal at 1.9052 ppm), and multiple osmolyte/quaternary-amine-related resonances such as betaine (δH = 3.2298 ppm), TMAO (tentative) (δH = 3.2488 ppm), and a choline-related feature (δH = 3.5101 ppm). A statistically supported contribution from the aromatic region was also detected for purine riboside/ribonucleotide-like resonances (δH = 8.2351 ppm), pointing to nucleotide-related metabolism as part of the discriminatory signature.
Notably, several high-ranking SPA variables corresponded to currently unassigned or partially overlapped resonances (e.g., δH ≈ 3.5042 and 3.9800 ppm), indicating that part of the discriminant information resides in crowded regions where attribution remains uncertain; these features were nonetheless kept in the ranked list to preserve predictive signal and were treated cautiously in biological interpretation. Overall, SPA/COSS ranking corroborated the main VIP-driven spectral zones and provided a statistically grounded short-list of candidate biomarkers for downstream visualization and group-wise comparison (Section 3.4).
3.4. Pathway Analysis of Sex-Discriminatory Polar Metabolites
To contextualize the sex-related metabolic differences observed in the polar gonadal extracts, the set of discriminatory metabolites was analysed using the MetaboAnalyst Pathway Analysis module (KEGG library; compound list mode), combining over-representation analysis with pathway topology metrics. The resulting bubble plot (Figure 4) summarizes pathway significance (–log10 of the raw p-value) versus pathway impact, where bubble size reflects the number of matched metabolites and colour encodes the enrichment p-value.
Pathway analysis highlighted a predominant involvement of amino-acid networks. The most significant pathways were valine/leucine/isoleucine biosynthesis (3 hits out of 8; raw p = 5.89×10⁻⁴; FDR = 0.0316) and glycine/serine/threonine metabolism (5/34; raw p = 8.33×10⁻⁴; FDR = 0.0316), indicating that differences in free amino-acid pools and closely connected reactions contribute strongly to the separation between female and male gonadal samples. Several additional pathways showed consistent enrichment trends, including phenylalanine/tyrosine/tryptophan biosynthesis (2/4; raw p = 0.00306; impact = 1.00), histidine metabolism (3/14; raw p = 0.00348; impact = 0.271), and arginine biosynthesis (3/15; raw p = 0.00429; impact = 0.253). Pathways related to nitrogen handling and central amino-acid interconversion were also represented, such as nitrogen metabolism (2/6; raw p = 0.00742), and alanine/aspartate/glutamate metabolism (3/23; raw p = 0.0147; impact = 0.440). Finally, pathways linked to biosynthetic capacity and turnover, including one-carbon pool by folate (3/26; raw p = 0.0206) and purine metabolism (5/71; raw p = 0.0213), suggested additional contributions from C1 transfer reactions and nucleotide-related processes to the observed sex discrimination.
3.5. 1H NMR Spectral Overview and Metabolite Annotation (Apolar Extracts)
The apolar extracts recorded in CDCl3 showed spectra dominated by lipid resonances, consistent with a mixture of neutral lipids (primarily triacylglycerols, TAG, and diacylglycerols, DAG), fatty acyl chains (FA), and membrane-associated glycerophospholipids (PL). The aliphatic region (≈0.6–2.3 ppm) was characterized by intense terminal methyl signals (≈0.88–0.98 ppm) and the methylene envelope of long acyl chains (≈1.26–1.32 ppm), together with β-methylene contributions (≈1.60–1.70 ppm) and allylic methylenes (≈2.02–2.08 ppm) indicative of unsaturated fatty acids. The α-methylene to the carbonyl group appeared around ≈2.31 ppm, with a distinct narrow sub-region at ≈2.37–2.40 ppm used as the diagnostic F′ window for DHA-related acyl contributions in the Bratu scheme. Bis-allylic methylenes of polyunsaturated chains were observed at ≈2.77–2.84 ppm, while the olefinic region around ≈5.28–5.37 ppm reflected the overall unsaturation and included contributions from TAG glycerol (sn-2 CH) and –CH=CH– protons.
In the heteroatom-rich region (≈3.5–4.4 ppm), several resonances supported the presence of glycerol backbones and phospholipid moieties. Signals in the ≈4.10–4.33 ppm interval correspond to CH2–O–CO motifs typical of TAG/DAG, whereas broader features at ≈3.78–3.95 ppm and near ≈4.38 ppm are consistent with phospholipid-associated –CH2–O–P– and related glycerophospholipid fragments, as reported in recent lipid NMR annotation frameworks (Figure 5) [13,14,15,16]. Overall peak assignments, chemical shifts (corrected), and moiety-to-lipid-class mapping are summarized in Supplementary Table S2, providing a coherent annotation layer for subsequent equation-based lipid class estimations [24].
3.6. Lipid Class Estimation Using Bratu Equations and Comparison with Fish Oils
To enable a direct comparison with published fish-oil datasets, lipid class metrics were calculated using the set of nine balance equations described by Bratu et al., based on integrals of diagnostic windows (Figure X, apolar integration map), including the narrower F′ region (2.37–2.40 ppm) adopted here to better isolate DHA-associated contributions in our spectra. The method yields molar percentages for total unsaturated (n), saturated (s), ω-3 fatty acids (ω3), and DHA (h), together with internal constraints (e.g., mass-balance relationships) that allow automated flagging of spectra violating the expected bounds. After excluding three spectra flagged as out-of-range, sea urchin gonad apolar extracts displayed a median unsaturated fraction of 61.6 mol% (IQR 55.8–71.6) and a complementary saturated fraction of 38.4 mol% (IQR 28.4–44.2). The ω-3 fraction reached a median of 20.7 mol% (IQR 18.5–24.0), while DHA showed consistently low levels with a median of 1.71 mol% (IQR 1.40–1.93; range 0.91–2.83) [24].
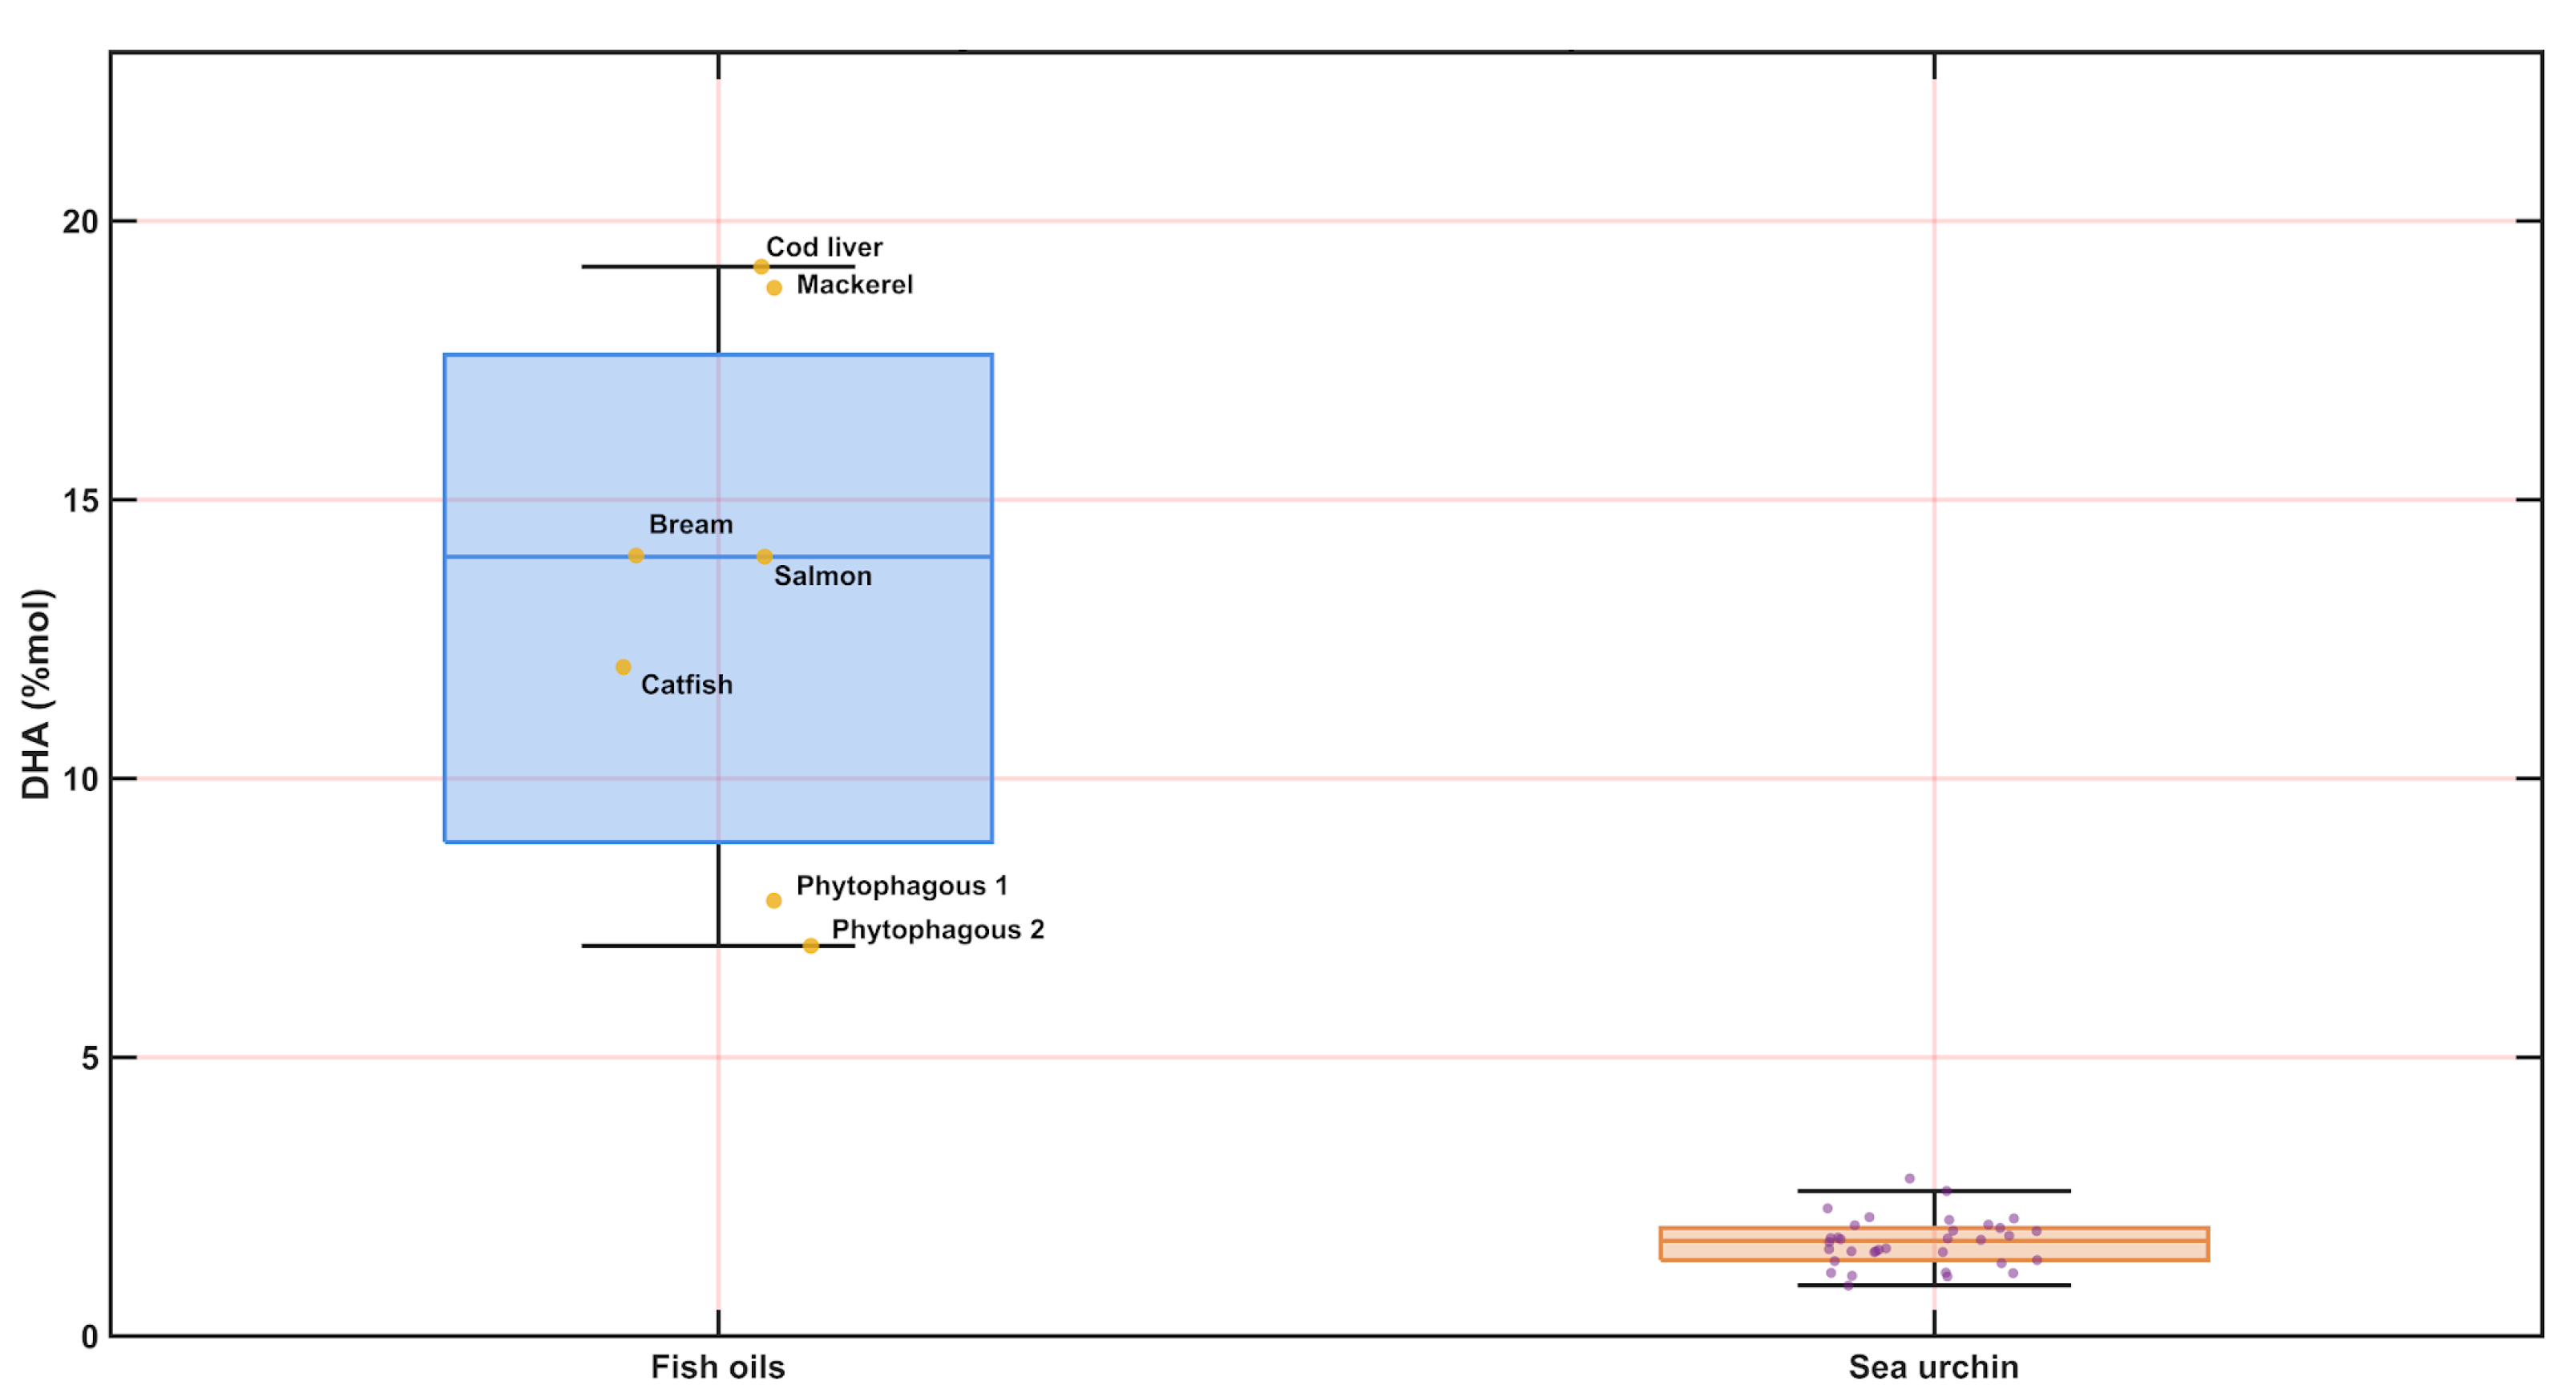
When benchmarked against the fish oils reported by Bratu et al. (Table 3 in that study) [24], sea urchin gonad extracts overlapped partially in global unsaturation but diverged strongly in DHA enrichment (Figure 6). In the fish oils, DHA spans approximately 7.0–19.2 mol% (median ~14.0 mol%), i.e., about one order of magnitude higher than in the sea urchin gonads, whereas ω-3 totals in fish oils (≈20.9–35.7 mol%; median ~26.7 mol%) remain systematically above the sea urchin distribution. Collectively, these results indicate that Paracentrotus lividus gonad apolar extracts are comparatively depleted in DHA relative to fish oils, despite maintaining substantial overall unsaturation typical of lipid-rich tissues.
3.7. Sex-Related Differences and Multivariate Separability (Apolar Metrics)
Sex-stratified comparisons of the Bratu-derived metrics (QC-filtered dataset) indicated broadly similar lipid-class composition between females and males. Mann–Whitney testing showed no significant differences for total unsaturation (Female median 57.9 vs Male 66.6 mol%; p=0.141), saturation (Female 42.1 vs Male 33.4 mol%; p=0.141), or DHA (Female 1.52 vs Male 1.74 mol%; p=0.357). The ω-3 fraction showed a modest shift (Female 19.4 vs Male 21.6 mol%; p=0.0247), but the effect size is limited and does not translate into robust multivariate separation. Consistently, linear discriminant analysis applied to the apolar feature set yielded only moderate cross-validated discrimination, supporting the conclusion that—within the resolution of these global lipid-class estimates—male and female gonads display largely overlapping apolar lipid profiles.
4. Discussion
Overall, the results indicate that the polar gonad metabolome contains robust sex-linked 1H NMR signatures, while apolar lipid-motif variation is comparatively modest in this dataset; together with the curated peak list, this establishes a reproducible reference point for future comparative and applied studies on P. lividus roe composition.
4.1. Multivariate Evidence of Robust Sex Separation and Model Validation
Using the full 1H NMR spectral space from polar extracts, the supervised PLS-LDA model achieved a clear discrimination between female and male gonads (Figure 2B), with high explained variance in Y (R2Y dominated by the first latent variable) and an apparent absence of misclassification in the training set. While such perfect or near-perfect class separation can occur when sex is a strong biological driver, it is also a well-known scenario where overfitting may inflate performance if validation is not sufficiently rigorous. For this reason, the cross-validation strategy and diagnostic statistics are critical [25,26]. In this context, the consistently low error rates observed under cross-validation and Monte-Carlo cross-validation (MCCV), together with strong sensitivity/specificity and ROC-derived AUC values, support that the model captures a stable sex-associated signal rather than a purely chance configuration of latent variables [25,27]. As a recommended strengthening step (particularly when AUC approaches 1), metabolomics best practice commonly includes label-permutation testing and/or double cross-validation to further bound the risk of overfitting and to document that class structure is not recoverable after class randomization [25,26,27].
4.2. Discriminant Variables Converge on Osmolyte Balance, Amino-Acid Pools, and Energy Buffering
A complementary, peak-level strategy (subwindow permutation analysis, SPA, with COSS ranking) prioritized a small set of resonances that best classify sex (Figure 3). This supervised Monte-Carlo variable-selection framework is specifically designed to identify variables with reproducible predictive contribution across repeated resampling/permutation cycles, thereby improving interpretability beyond full-spectrum discrimination [20]. Importantly, the SPA/COSS shortlist converges with the overall VIP structure (Figure 2A), indicating that separation is supported by coordinated variation across multiple metabolite families rather than by a single narrow region.
Among the top discriminant peaks, glycine (3.5648 ppm) and alanine (1.4715 ppm) are prominent, alongside creatine (3.9323 ppm) and lysine signatures. In marine invertebrates, free amino acids are frequently major contributors to osmotic balance, nitrogen handling, and tissue remodeling; accordingly, shifts in glycine/alanine pools are consistent with sex-dependent differences in osmolyte budgeting and/or the relative contribution of somatic versus gametic compartments within gonads [28,29]. Conversely, betaine (3.2298 ppm) and TMAO (3.2488 ppm, tentative) also appear among the strongest discriminant signals. These quaternary amines are classical compatible/counteracting osmolytes that stabilize macromolecules and modulate protein–solvent interactions, making them plausible drivers of coherent sex-linked separation in the polar metabolome [29]. The creatine signal is also biologically interpretable in echinoderms, which rely on phosphagen systems (arginine kinase/creatine kinase-type buffering) to match variable energetic demand; differences in phosphagen pools can therefore reflect divergent energy buffering requirements during gametogenesis [30].
4.3. Pathway Analysis: Strong Amino-Acid and One-Carbon Signatures, with an Important Caveat on Directionality
When the full set of annotated polar metabolites is queried in MetaboAnalyst pathway analysis (compound-list mode; KEGG library), the over-representation results are dominated by amino-acid metabolism (e.g., glycine/serine/threonine; histidine; alanine/aspartate/glutamate; arginine-related routes), with additional representation of one-carbon-associated and nucleotide-linked pathways (purine/pyrimidine) (Figure 4) [22,23]. This configuration is biologically plausible for gonadal tissue, where metabolic investment in amino-acid trafficking, osmolyte control, and biosynthetic precursors is expected to be substantial across sexes.
However, because the pathway analysis was performed using a combined compound inventory (metabolites detected across both males and females), these results should be interpreted strictly as pathway representation/coverage under the current analytical conditions, not as sex-specific directionality (i.e., not “up-regulated in females” or “up-regulated in males”) [22]. Directionality in the present study is instead provided by the univariate patterns and boxplots for discriminant metabolites (Figure 3). A high-value refinement for the final version would be to run two additional pathway analyses using female-enriched vs male-enriched metabolite subsets (or ranked lists derived from effect size + significance), enabling a more explicit sex-linked functional narrative while keeping the current “inventory/landscape” analysis as a reference baseline [22].
4.4. Integrating Sex Biology of P. lividus Gonads with the Observed Metabolite Shifts
Sex differences in P. lividus gonads must be interpreted against a background of strong biological modulation by reproductive stage, seasonality, habitat, and diet, all of which can reshape gonadal resource allocation and biochemical composition [31,32,33]. This is directly relevant here because the polar metabolome integrates both (i) osmotic/energetic homeostasis of gonadal somatic tissue and (ii) biosynthetic demand from gametes, whose relative proportions may shift with sex and maturity. In this context, the betaine/TMAO axis aligns with a broader osmolyte strategy framework typical of marine invertebrates, while coordinated variation in free amino acids supports sex-linked differences in nitrogen/osmolyte budgeting rather than isolated single-metabolite effects [28,29]. Notably, sex-dependent chemical fingerprints in P. lividus gonads have also been recovered using complementary chemistry/chemometrics approaches, reinforcing that sex can be a detectable organizing factor even when other ecological drivers contribute substantial inter-individual variance [3,17].
4.5. Interpretive Scope, Limitations, and Recommended Confirmatory Steps
Two limitations should be stated explicitly. First, because gonadal metabolite pools can vary strongly with reproductive stage and season in P. lividus, the absence of histological staging (or a robust proxy such as gonadosomatic index coupled to maturity scoring) limits mechanistic attribution of sex effects versus maturity effects and their interaction [31,32,33]. Second, some top discriminant resonances remain unassigned or tentative, so follow-up confirmation by targeted spiking and/or 2D NMR (HSQC/TOCSY-type support) would increase confidence in metabolite identity and downstream pathway interpretation. From a chemometrics perspective, given the near-perfect separation observed in score space, it is also recommended to document permutation testing and/or double cross-validation as an additional safeguard against overfitting, even when MCCV performance is excellent. Overall, the convergence of (i) full-spectrum PLS–LDA discrimination (Figure 2), (ii) SPA/COSS-prioritized biomarkers (Figure 3), and (iii) pathway-level representation (Figure 4) supports a robust sex-linked structure in the polar gonad metabolome dominated by amino-acid pools, osmolyte strategies, and biosynthetic precursor pathways—while also defining clear next steps for a higher-confidence mechanistic narrative.
4.6. Interpreting Apolar 1H NMR Lipid Signatures in Paracentrotus lividus Gonads: Ecological Drivers, Limitations, and Next Steps
Apolar 1H NMR features and biological interpretation. The apolar extracts of Paracentrotus lividus gonads displayed a lipid-dominated 1H NMR profile consistent with complex mixtures of acyl-chain signals (terminal –CH3, methylene envelope, allylic and bis-allylic –CH2–, and olefinic resonances) together with glycerol/ester-related features (Figure 5). While the dominant pattern is compatible with triacylglycerol-rich neutral lipids, the additional presence of resonances attributable to phospholipid-associated moieties suggests that membrane lipids contribute measurably to the apolar fraction and may vary, at least in part, independently from storage triacylglycerols. This interpretation is consistent with prior evidence that P. lividus gonads contain multiple phospholipid classes (including PI, PS, PE, PC and SM) and that, over the reproductive cycle, gonadal lipid extracts are typically TAG-dominated while phospholipids and DAGs occur at comparatively low abundance yet may still exhibit biologically meaningful dynamics [32,34,35].
Using the Bratu-type integral framework [24], the gonadal lipid composition was broadly similar between sexes for global indices of saturation/unsaturation and DHA. In the Bratu-derived subset (n = 34; 23 males, 11 females), three female samples were excluded because values fell outside the validity bounds of the Bratu model [24]. After exclusion, female and male medians remained close for unsaturated and saturated fractions (Mann–Whitney p ≈ 0.14 for both), and DHA %mol showed no statistically supported sex effect (p ≈ 0.36). In contrast, ω-3%mol exhibited a modest but significant difference (p ≈ 0.025), suggesting that any sex-associated shift—if present—may be more readily captured by an aggregate ω-3 descriptor than by a DHA-specific estimate. At the same time, it should be noted that (i) the post-filtering female sample size is smaller (n = 11), which limits power to detect subtle effects, and (ii) these NMR-derived indices intentionally compress compositional information into a small number of integrals and assumptions; therefore, they should be interpreted as robust, reproducible “coarse-grained” descriptors rather than a replacement for lipid-class or molecular-species resolution.
Ecological drivers likely dominate inter-individual lipid variability. In P. lividus, gonadal lipid pools are strongly shaped by reproductive stage and seasonal forcing, with documented annual dynamics in total lipids and fatty-acid profiles linked to temperature/photoperiod and maturation state [33,34,36]. Habitat and diet further modulate lipid availability and provisioning: field evidence shows contrasting lipid metabolism between habitats with different food sources, alongside selective storage of key LC-PUFAs (notably EPA and ARA) and their precursors, consistent with retention and/or bioconversion processes that are not trivially predicted by bulk diet composition [32]. Collectively, these mechanisms provide a coherent explanation for observing limited separability between sexes in Bratu-derived indices while still detecting meaningful inter-individual dispersion—particularly in ω-3-related metrics—within a mixed field dataset.
Scope, limitations, and recommended additions. The present apolar readout is informative but mechanistically underdetermined: (i) the dataset represents a cross-sectional snapshot and does not explicitly model gonadal stage (histology/GSI) or short-term diet history; (ii) 1H NMR lipid indices cannot resolve lipid molecular species (TAG/PL subclasses, positional distributions, oxidized lipids) and therefore cannot directly attribute ω-3 shifts to specific biochemical routes; and (iii) the Bratu model requires validity constraints, as reflected by the exclusion of out-of-range spectra [24]. To strengthen a high-confidence mechanistic narrative, the most impactful additions would be: targeted fatty-acid profiling (GC-FID/GC–MS) and/or LC–MS/MS lipidomics to resolve lipid classes and species; explicit staging of gonads (GSI + histology) to disentangle maturation effects; and, where feasible, controlled feeding/conditioning experiments to map diet-driven changes in gonadal PUFA pools and to test sex-by-diet interactions under defined inputs [37,38].
5. Conclusions
This study provides a reproducible 1H NMR-based framework to characterise both polar metabolites and apolar lipid motifs in Paracentrotus lividus gonads. For the polar fraction, we deliver a curated resonance inventory (chemical shifts and annotations) that captures the major biochemical classes expected in gonadal tissue—free amino acids and nitrogen carriers, compatible osmolytes/quaternary amines, energy-buffer metabolites, carbohydrates/aminosugars, and nucleotide-related compounds—thereby offering a practical reference for future sea urchin metabolomics, quality studies, and comparative surveys. Supervised chemometric modelling of polar fingerprints supports robust sex-linked differentiation, and SPA/COSS prioritisation converges on coherent biochemical themes centred on amino-acid pools, osmolyte budgeting, and energy buffering, with pathway mapping reinforcing the prominent contribution of interconnected amino-acid and one-carbon/nucleotide networks.
In the apolar fraction, lipid-dominated spectra were consistent with mixtures of neutral lipids and membrane-associated glycerolipids, and equation-based lipid indices revealed high overall unsaturation and measurable ω-3 content but low DHA when benchmarked against fish oils, highlighting species- and tissue-specific lipid signatures relevant to nutritional context and valorisation perspectives. Overall, the combined polar–apolar profiling strategy, together with transparent reporting and curated annotation layers, establishes a solid baseline for subsequent work addressing seasonality, diet, habitat, reproductive stage, and processing-related effects on sea urchin gonad chemistry.
Supplementary Materials
The following supporting information can be downloaded at the website of this paper posted on Preprints.org.
Author Contributions
Funding obtained: F.C.M.-E. and P.S.-J. Conceived and designed the experiments: R.I.-C., E.C.-G., F.C.M.-E. and P.S.-J. Performed the analysis: R.I.-C., E.C.-G., S.A.-T. and F.C.M.-E. Performed the figures: R.I.-C., E.C.-G. and F.C.M.-E. Analyzed the data: R.I.-C., E.C.-G. and F.C.M.-E. Wrote the manuscript: F.C.M.-E. Reviewed the manuscript: R.I.-C., E.C.-G., F.C.M.-E. and P.S.-J. Collected the urchin samples: E.C.-G. and P.S.-J. All authors have read and agreed to the published version of the manuscript.
Funding
This research was funded by CONVOCATORIA DEL PROGRAMA PROPIO DEL CENTRO DE GASTRONOMÍA DEL MEDITERRÁNEO (Gasterra 2024–25) UA_DENIA PARA EL FOMENTO DE LA I+D+i EN EL ÁMBITO DE LA GASTRONOMÍA (GASTERRA 2025).
Institutional Review Board Statement
This study was conducted under the framework of the GASTERRA projects (2024-2025) and received ethical approval from the Research Ethics Committee of the University of Alicante (Reference: UA-2024-10-24_2).
Informed Consent Statement
Not applicable.
Data Availability Statement
The data presented in this study is available on request from the corresponding author.
Acknowledgments
The authors would like to thank Emilio Lorenzo SSTTI UA for technical assistance with NMR experiments. This work forms part of the PhD thesis of Ricardo Ibanco-Cañete at Universidad de Alicante (Spain) / Programa de Doctorado en Ciencias Experimentales y Biosanitarias.
Conflicts of Interest
The authors declare no conflicts of interest.
References
- Baião, L.F.; Moura, A.P.; Rocha, C.; Valente, L.M.P.; Cunha, L.M. Dimensions for the valorisation of sea urchin (paracentrotus lividus) gonads production through the eyes of experienced chefs. International Journal of Gastronomy and Food Science 2021, 26, 100438. [Google Scholar] [CrossRef]
- Camacho, C.; Correia, T.; Teixeira, B.; Mendes, R.; Valente, L.M.P.; Pessoa, M.F.; Nunes, M.L.; Gonçalves, A. Nucleotides and free amino acids in sea urchin paracentrotus lividus gonads: Contributions for freshness and overall taste. Food Chem 2023, 404, 134505. [Google Scholar] [CrossRef]
- Rocha, F.; Peres, H.; Diogo, P.; Ozório, R.; Valente, L.M.P. The effect of sex, season and gametogenic cycle on gonad yield, biochemical composition and quality traits of paracentrotus lividus along the north atlantic coast of portugal. PeerJ 2019, 7. [Google Scholar] [CrossRef]
- Powers, R.; Andersson, E.R.; Bayless, A.L.; Brua, R.B.; Chang, M.C.; Cheng, L.L.; Clendinen, C.S.; Cochran, D.; Copié, V.; Cort, J.R.; et al. Best practices in nmr metabolomics: Current state. Trends Analyt Chem 2024, 171. [Google Scholar] [CrossRef]
- Sumner, L.W.; Amberg, A.; Barrett, D.; Beale, M.H.; Beger, R.; Daykin, C.A.; Fan, T.W.M.; Fiehn, O.; Goodacre, R.; Griffin, J.L.; et al. Proposed minimum reporting standards for chemical analysis. Metabolomics 2007, 3, 211–221. [Google Scholar] [CrossRef]
- Nagana Gowda, G.A.; Raftery, D. Quantitative nmr methods in metabolomics. Handb Exp Pharmacol 2023, 277, 143–164. [Google Scholar] [CrossRef] [PubMed]
- Carbonell-Garzón, E.; Ibanco-Cañete, R.; Sanchez-Jerez, P.; Egea, F.C.M. Osmolytes vs. Anabolic reserves: Contrasting gonadal metabolomes in two sympatric mediterranean sea urchins. metabo 2025, 15, 787. [Google Scholar] [CrossRef]
- Wang, H.; Zhao, W.; Ding, B.; Zhang, Y.; Huang, X.; Liu, X.; Zuo, R.; Chang, Y.; Ding, J. Comparative lipidomics profiling of the sea urchin, strongylocentrotus intermedius. Comp Biochem Physiol Part D Genomics Proteomics 2021, 40, 100900. [Google Scholar] [CrossRef]
- Amai, S.; Yuki, K.; Gowda, S.G.B.; Gowda, D.; Hui, S.-P. Lipidomic profiling of edible japanese sea urchins by lc–ms. foods 2025, 14, 2268. [Google Scholar] [CrossRef]
- Haug, K.; Cochrane, K.; Nainala, V.C.; Williams, M.; Chang, J.; Jayaseelan, K.V.; O’Donovan, C. Metabolights: A resource evolving in response to the needs of its scientific community. Nucleic Acids Research 2020, 48, D440–D444. [Google Scholar] [CrossRef]
- Bingol, K.; Li, D.W.; Zhang, B.; Brüschweiler, R. Comprehensive metabolite identification strategy using multiple two-dimensional nmr spectra of a complex mixture implemented in the colmarm web server. Anal Chem 2016, 88, 12411–12418. [Google Scholar] [CrossRef] [PubMed]
- Badaoui, W.; Marhuenda-Egea, F.C.; Valero-Rodriguez, J.M.; Sanchez-Jerez, P.; Arechavala-Lopez, P.; Toledo-Guedes, K. Metabolomic and lipidomic tools for tracing fish escapes from aquaculture facilities. ACS Food Science & Technology 2024, 4, 871–879. [Google Scholar] [CrossRef]
- Aursand, M.; Standal, I.B.; Gribbestad, I.S.; Martinez, I. Omega-3 fatty acid content of intact muscle of farmed atlantic salmon (salmo salar) examined by 1h mas nmr spectroscopy; 2018; pp. 1917–1925. [Google Scholar] [CrossRef]
- Igarashi, T.; Aursand, M.; Sacchi, R.; Paolillo, L.; Nonaka, M.; Wada, S. Determination of docosahexaenoic acid and n-3 fatty acids in refined fish oils by h-1-nmr spectroscopy: Iupac interlaboratory study. Journal of Aoac International 2002, 85, 1341–1354. [Google Scholar] [CrossRef]
- Cravero, B.H.; Prez, G.; Lombardo, V.A.; Guastaferri, F.V.; Delprato, C.B.; Altabe, S.; de Mendoza, D.; Binolfi, A. A high-resolution 13c nmr approach for profiling fatty acid unsaturation in lipid extracts and in live caenorhabditis elegans. Journal of Lipid Research 2024, 65, 100618. [Google Scholar] [CrossRef]
- Nieva-Echevarría, B.; Goicoechea, E.; Manzanos, M.J.; Guillén, M.D. Usefulness of 1h nmr in assessing the extent of lipid digestion. Food Chemistry 2015, 179, 182–190. [Google Scholar] [CrossRef] [PubMed]
- Ibanco-Cañete, R.; Carbonell-Garzón, E.; Sanchez-Jerez, P.; Egea, F.C.M. Identification of sex-dependent aroma compounds in gonads of commercially valuable sea urchins: Implications for gastronomical use of Paracentrotus lividus. Jmse 2025, 13, 2160. [Google Scholar] [CrossRef]
- Bligh, E.G.; Dyer, W.J. A rapid method of total lipid extraction and purification. Canadian Journal of Biochemistry and Physiology 1959, 37, 911–917. [Google Scholar] [CrossRef]
- Li, H.D.; Xu, Q.S.; Liang, Y.Z. Libpls: An integrated library for partial least squares regression and linear discriminant analysis. Chemometrics and Intelligent Laboratory Systems 2018, 176, 34–43. [Google Scholar] [CrossRef]
- Li, H.-D.; Zeng, M.-M.; Tan, B.-B.; Liang, Y.-Z.; Xu, Q.-S.; Cao, D.-S. Recipe for revealing informative metabolites based on model population analysis. Metabolomics 2010, 6, 353–361. [Google Scholar] [CrossRef]
- Wang, Q.; Li, H.-D.; Xu, Q.-S.; Liang, Y.-Z. Noise incorporated subwindow permutation analysis for informative gene selection using support vector machines. Analyst 2011, 136, 1456–1463. [Google Scholar] [CrossRef] [PubMed]
- Pang, Z.; Lu, Y.; Zhou, G.; Hui, F.; Xu, L.; Viau, C.; Spigelman, A.F.; MacDonald, P.E.; Wishart, D.S.; Li, S.; et al. Metaboanalyst 6.0: Towards a unified platform for metabolomics data processing, analysis and interpretation. Nucleic Acids Research 2024, 52, W398–W406. [Google Scholar] [CrossRef]
- Kanehisa, M.; Goto, S. Kegg: Kyoto encyclopedia of genes and genomes. Nucleic Acids Research 2000, 28, 27–30. [Google Scholar] [CrossRef] [PubMed]
- Bratu, A.; Mihalache, M.; Hanganu, A.; Chira, N.; Todasca, C.; Rosca, S. Quantitative determination of fatty acids from fish oils using gc-ms method and 1h-nmr spectroscopy. UPB Scientific Bulletin, Series B: Chemistry and Materials Science 2013, 75, 23–32. [Google Scholar]
- Szymańska, E.; Saccenti, E.; Smilde, A.K.; Westerhuis, J.A. Double-check: Validation of diagnostic statistics for pls-da models in metabolomics studies. Metabolomics 2012, 8, 3–16. [Google Scholar] [CrossRef] [PubMed]
- Broadhurst, D.I.; Kell, D.B. Statistical strategies for avoiding false discoveries in metabolomics and related experiments. Metabolomics 2006, 2, 171–196. [Google Scholar] [CrossRef]
- Westerhuis, J.A.; Hoefsloot, H.C.J.; Smit, S.; Vis, D.J.; Smilde, A.K.; van Velzen, E.J.J.; van Duijnhoven, J.P.M.; van Dorsten, F.A. Assessment of plsda cross validation. Metabolomics 2008, 4, 81–89. [Google Scholar] [CrossRef]
- Podbielski, I.; Schmittmann, L.; Sanders, T.; Melzner, F. “Acclimation of marine invertebrate osmolyte systems to low salinity: A systematic review & meta-analysis.” Frontiers in Marine Science Volume 9 - 2022 (2022): https://www.frontiersin.org/journals/marine-science/articles/10.3389/fmars.2022.934378.
- Yancey, P.H. Organic osmolytes as compatible, metabolic and counteracting cytoprotectants in high osmolarity and other stresses. Journal of Experimental Biology 2005, 208, 2819–2830. [Google Scholar] [CrossRef]
- Ellington, W.R. Arginine kinase and creatine kinase appear to be present in the same cells of an echinoderm muscle. Journal of Experimental Biology 1991, 158, 591–597. [Google Scholar] [CrossRef]
- Martínez-Pita, I.; García, F.J.; Pita, M.-L. The effect of seasonality on gonad fatty acids of the sea urchins paracentrotus lividus and arbacia lixula (echinodermata: Echinoidea). Journal of Shellfish Research 2010, 29, 517–525. [Google Scholar] [CrossRef]
- Anedda, R.; Siliani, S.; Melis, R.; Loi, B.; Baroli, M. Lipid metabolism of sea urchin paracentrotus lividus in two contrasting natural habitats. Scientific Reports 2021, 11, 14174. [Google Scholar] [CrossRef] [PubMed]
- Siliani, S.; Melis, R.; Loi, B.; Guala, I.; Baroli, M.; Sanna, R.; Uzzau, S.; Roggio, T.; Addis, M.F.; Anedda, R. Influence of seasonal and environmental patterns on the lipid content and fatty acid profiles in gonads of the edible sea urchin paracentrotus lividus from sardinia. Marine Environmental Research 2016, 113, 124–133. [Google Scholar] [CrossRef] [PubMed]
- Sanna, R.; Siliani, S.; Melis, R.; Loi, B.; Baroli, M.; Roggio, T.; Uzzau, S.; Anedda, R. The role of fatty acids and triglycerides in the gonads of paracentrotus lividus from sardinia: Growth, reproduction and cold acclimatization. Marine Environmental Research 2017, 130, 113–121. [Google Scholar] [CrossRef]
- Rodrı́guez-Bernaldo de Quiros, A.; López-Hernández, J.; Simal-Lozano, J. Separation of phospholipid classes in sea urchin, paracentrotus lividus by high-performance liquid chromatography. Journal of Chromatography B 2002, 770, 71–75. [Google Scholar] [CrossRef]
- Montero-Torreiro, M.F.; Garcia-Martinez, P. Seasonal changes in the biochemical composition of body components of the sea urchin, paracentrotus lividus, in lorbé (galicia, north-western spain). Journal of the Marine Biological Association of the United Kingdom 2003, 83, 575–581. [Google Scholar] [CrossRef]
- Raposo, A.I. G.; Ferreira, S.M.F.; Ramos, R.; Santos, P.M.; Anjos, C.; Baptista, T.; Tecelão, C.; Costa, J.L.; Pombo, A. Effect of three diets on the gametogenic development and fatty acid profile of paracentrotus lividus (lamarck, 1816) gonads. Aquaculture Research 2019, 50, 2023–2038. [Google Scholar] [CrossRef]
- Baião, L.F.; Rocha, F.; Costa, M.; Sá, T.; Oliveira, A.; Maia, M.R.G.; Fonseca, A.J.M.; Pintado, M.; Valente, L.M.P. Effect of protein and lipid levels in diets for adult sea urchin paracentrotus lividus (lamarck, 1816). Aquaculture 2019, 506, 127–138. [Google Scholar] [CrossRef]
Figure 1.
Representative 1H NMR spectra of polar extracts from Paracentrotus lividus gonads (female (orange line) and male (blue line) examples), acquired at 400 MHz and 298 K in phosphate buffer and referenced to TSP (0.00 ppm). Key annotated metabolites across the aliphatic (0.5–5.5 ppm) and aromatic (6.0–9.0 ppm) regions are indicated; assignments prioritise reproducible signals and highlight overlap-prone areas retained as unassigned for future 2D confirmation.
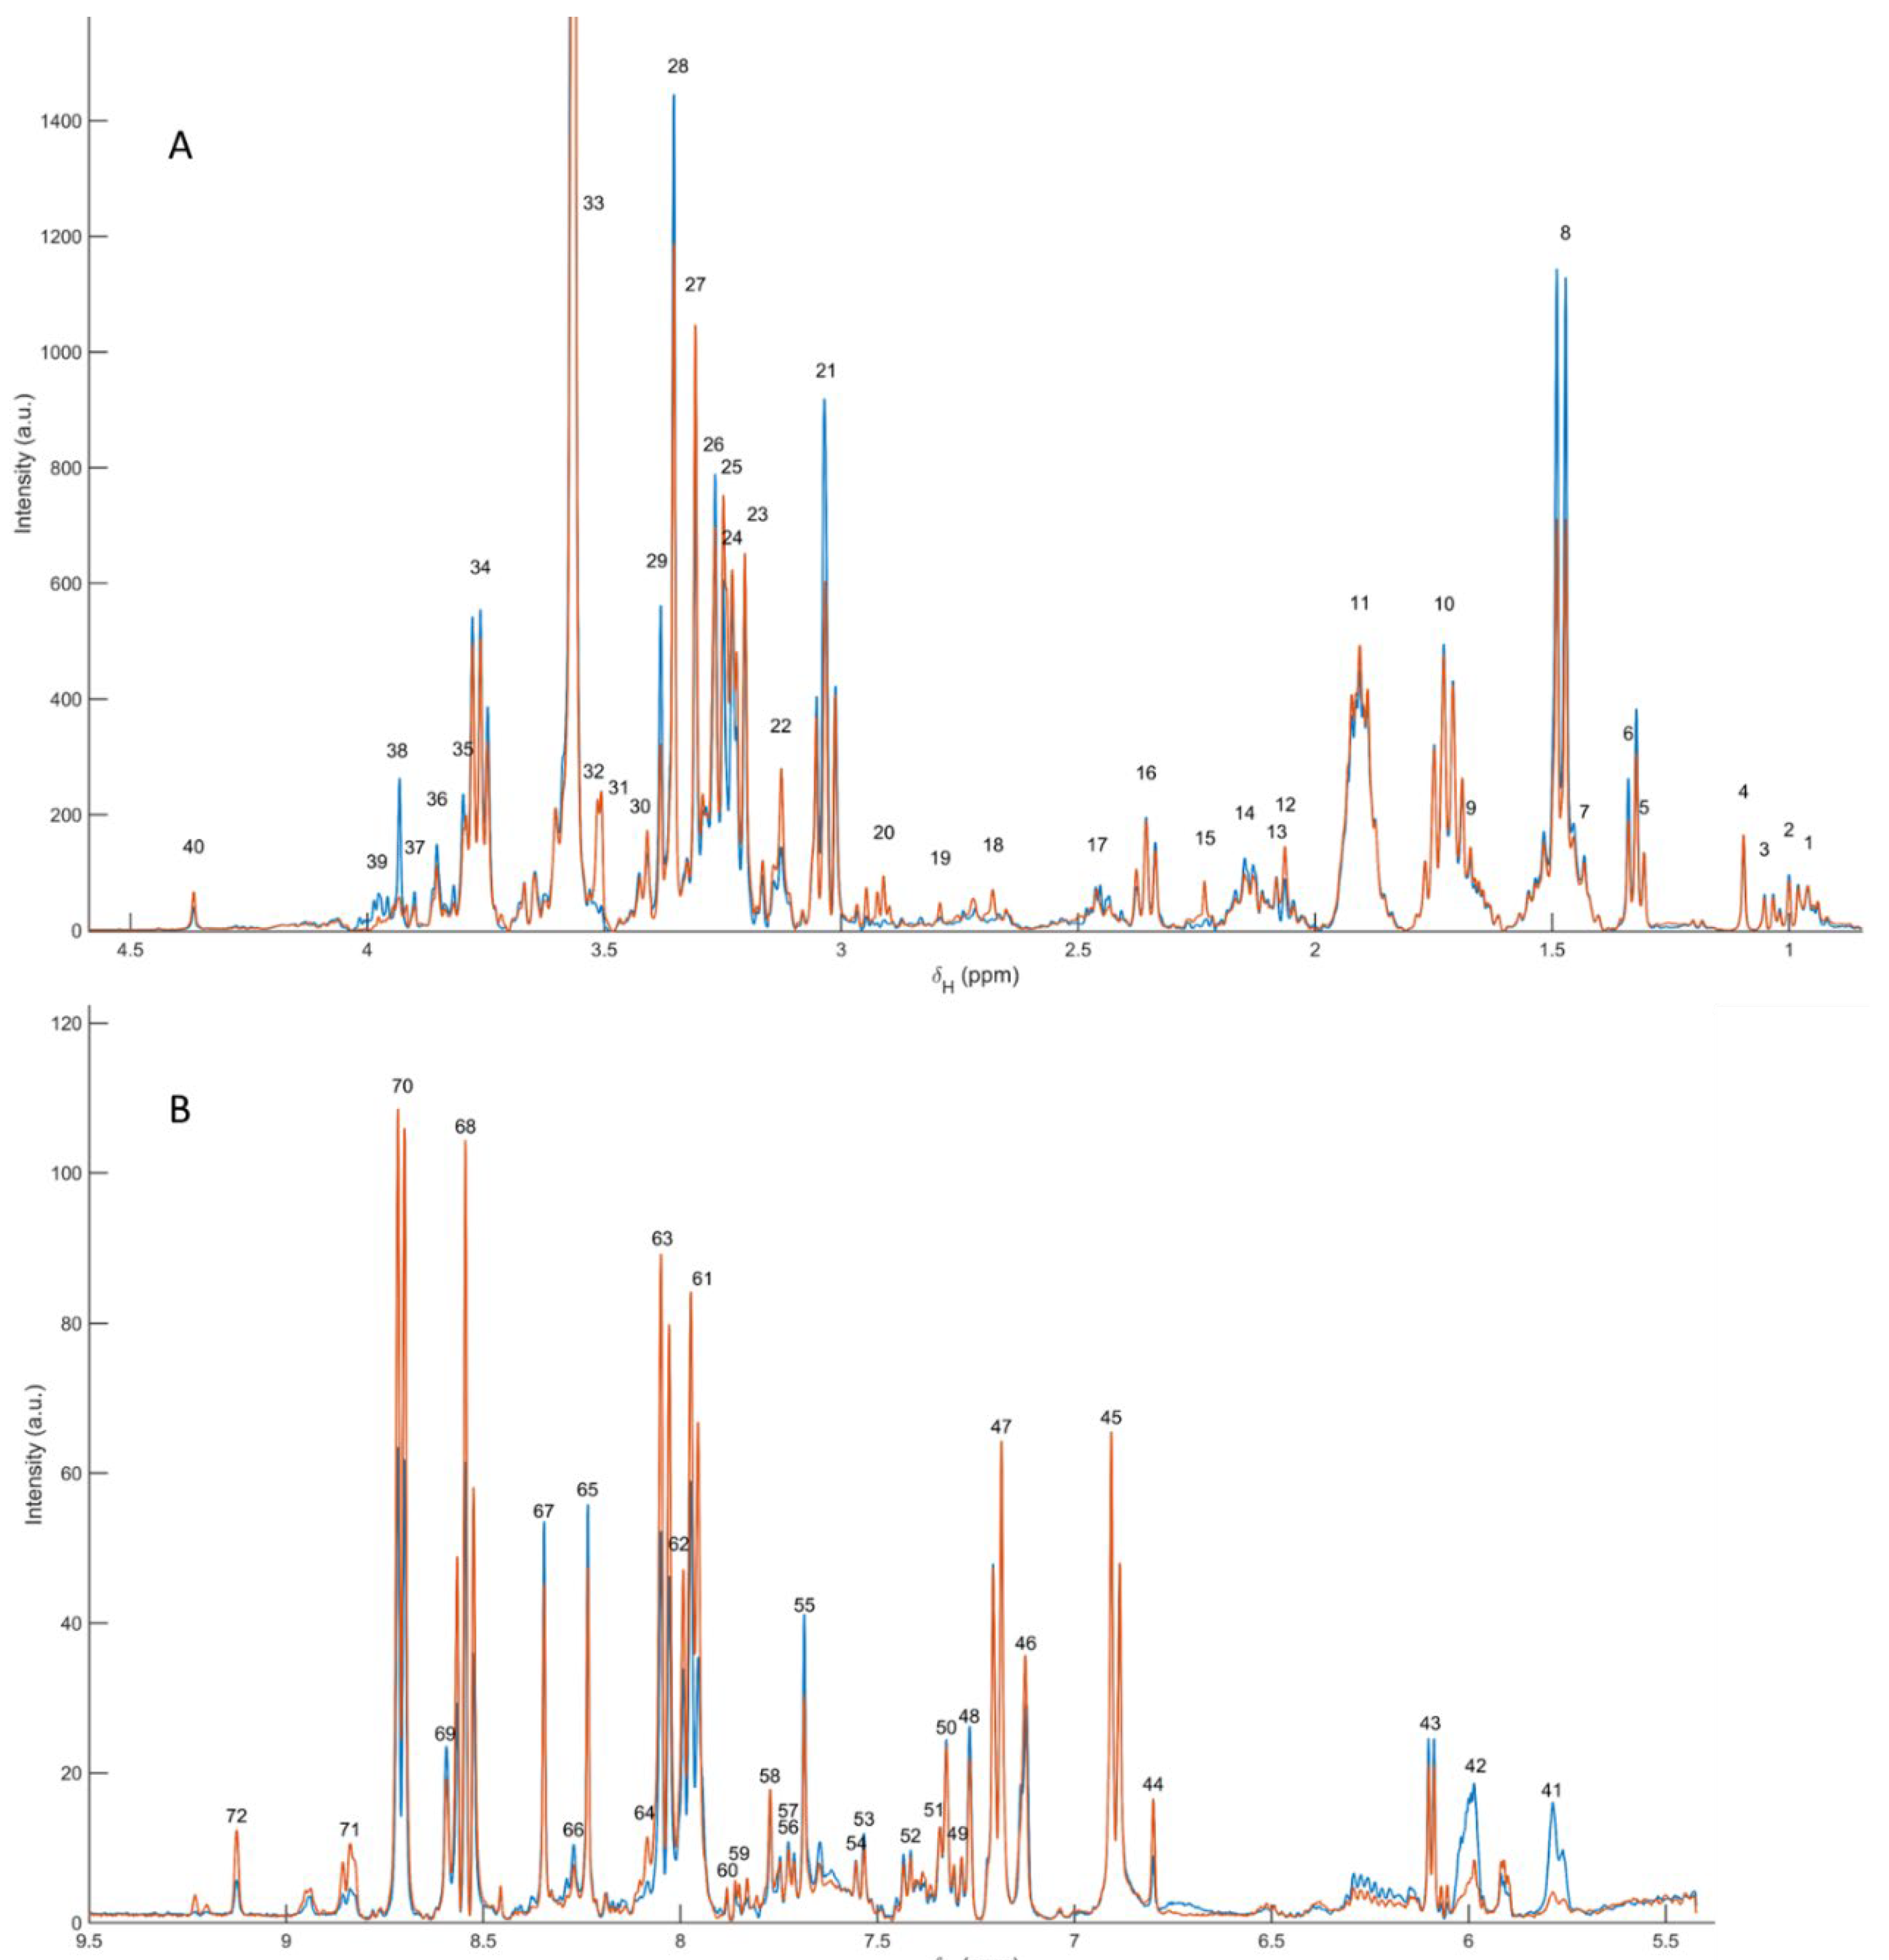
Figure 2.
(A) VIP profile obtained from the PLS-LDA analysis of polar-extract 1H NMR spectra from male and female Paracentrotus lividus gonads. Peaks/regions with the highest VIP values indicate the spectral variables with the strongest discriminatory power between sexes and were used to guide downstream SPA-based ranking. (B) PLS-LDA score plot (LV1 vs. LV2) showing sample clustering by sex. The continuous line corresponds to the linear discriminant boundary of the PLS-LDA model; ellipses indicate the 95% confidence regions for each group.
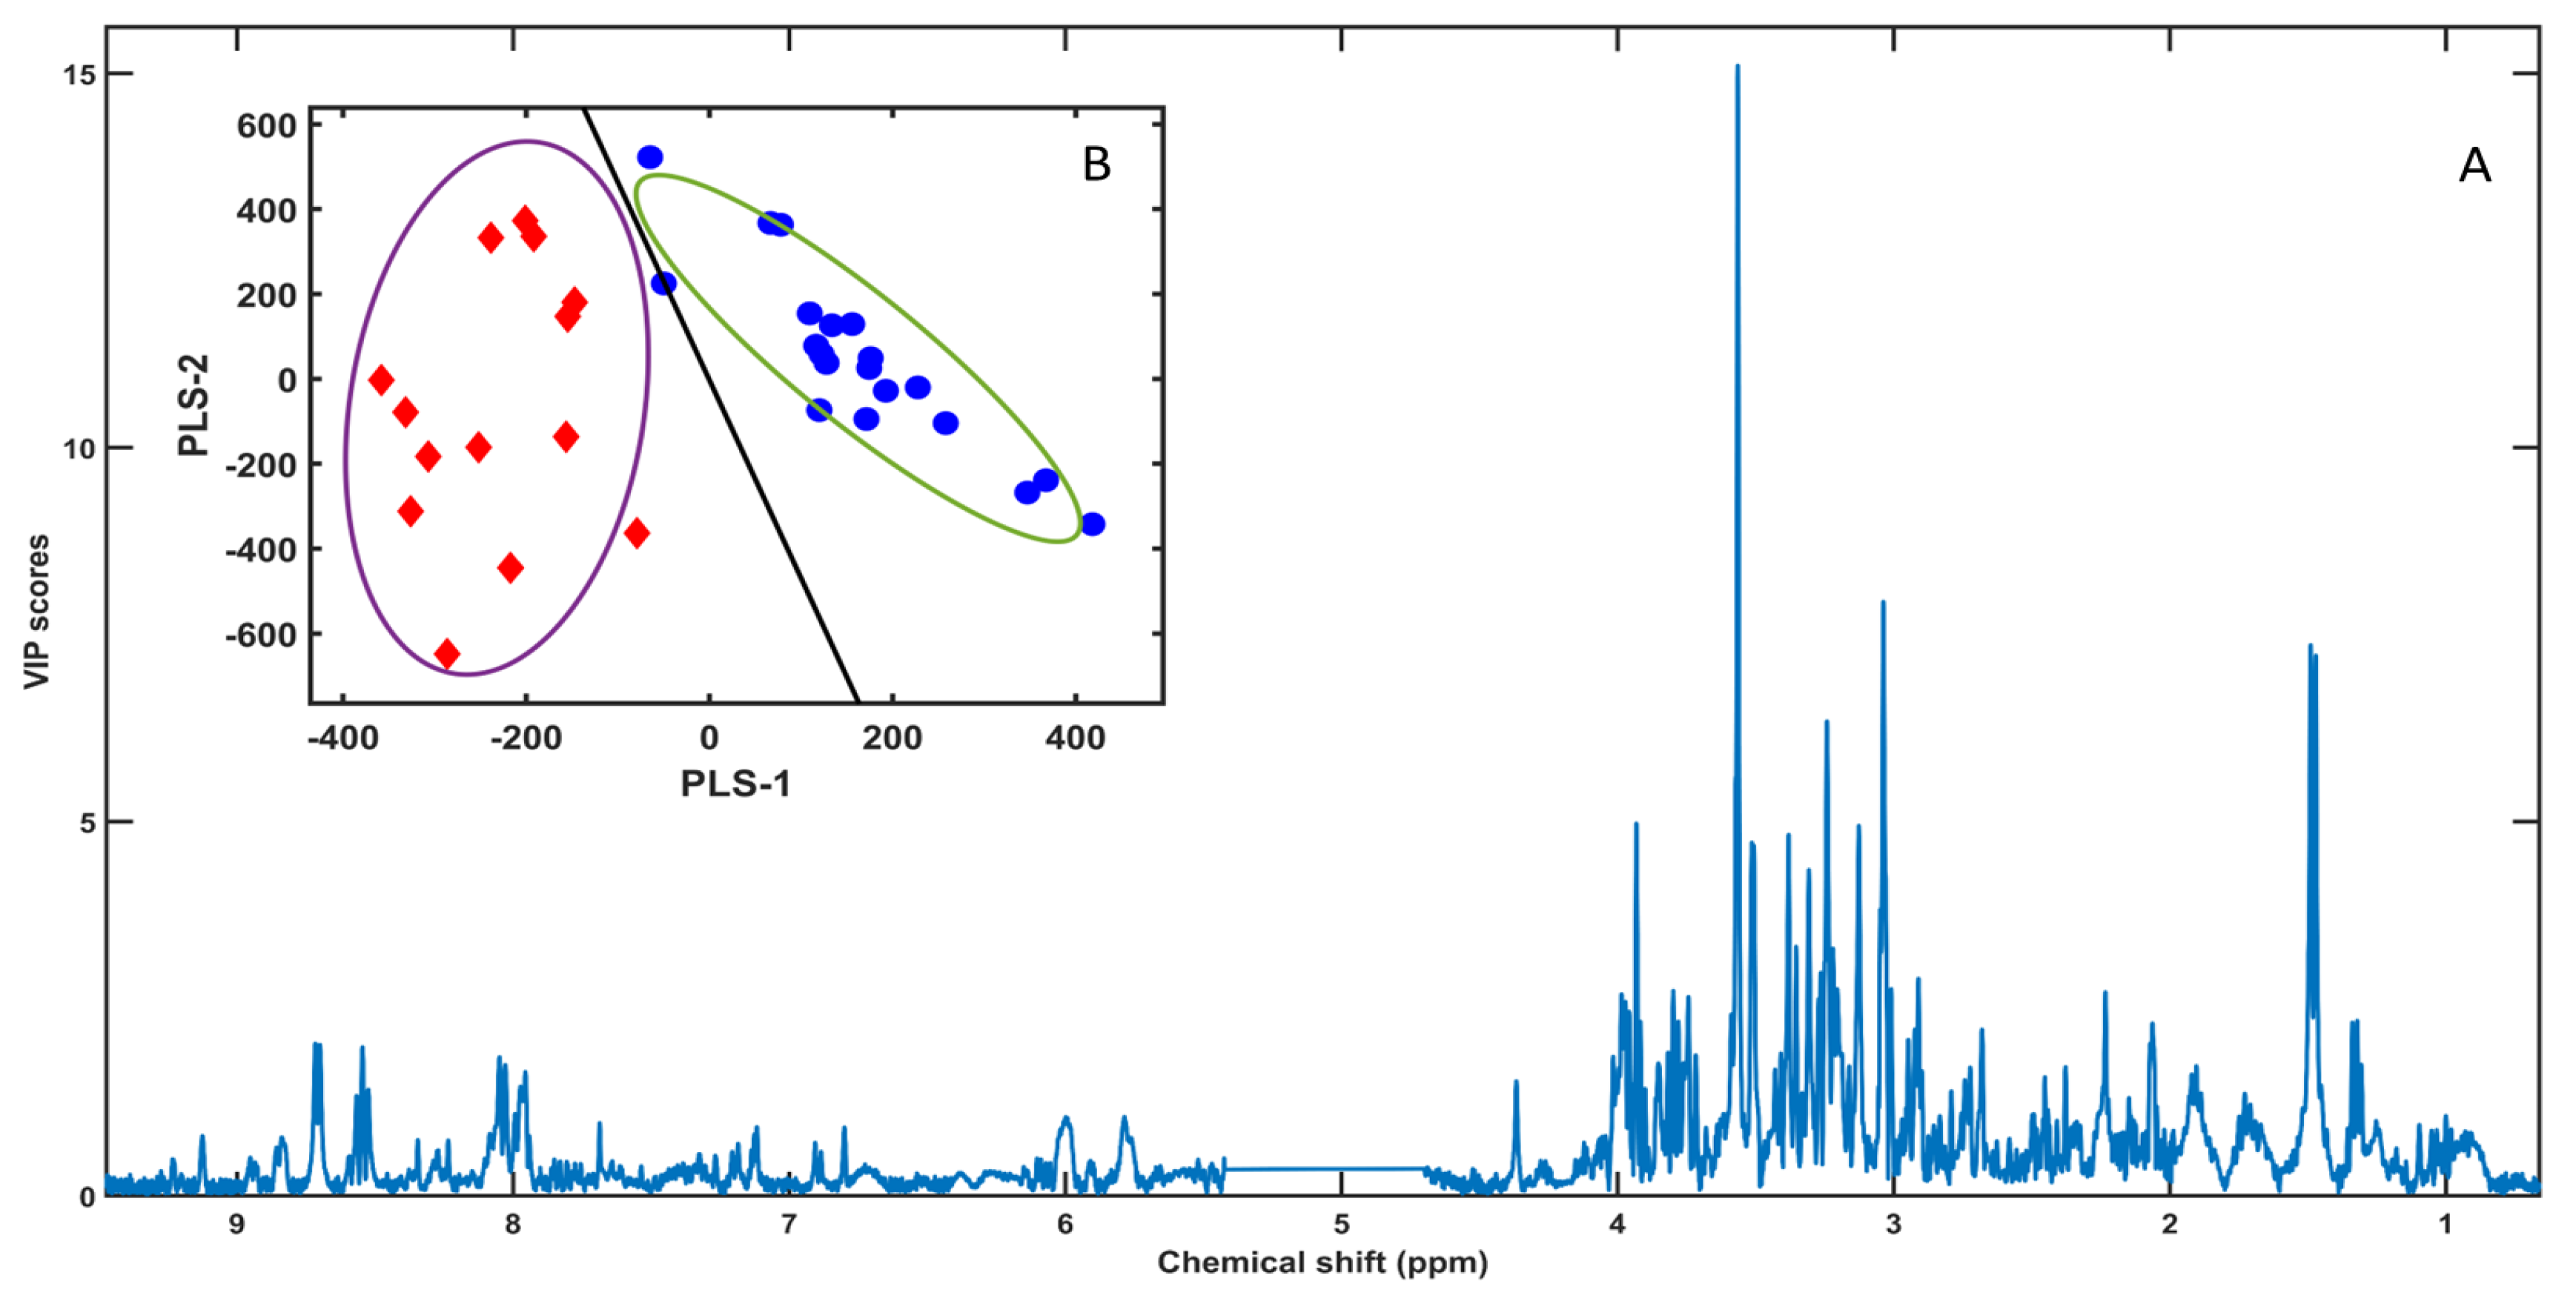
Figure 3.
Sex-stratified boxplots of selected polar 1H NMR resonances (peak heights) in Paracentrotus lividus gonads. Peak heights (a.u.) were extracted at the indicated chemical shifts (ppm) from the polar 1H NMR spectra and are shown for females (n = 14) and males (n = 23). Panels correspond to representative discriminant resonances/assignments: glycine (3.5648 ppm), alanine (1.4715 ppm), creatine (3.9323 ppm), TMAO (3.2488 ppm), a choline-related signal (3.5101 ppm), acetate (1.9052 ppm), histidine (3.1273 ppm), N-acetylglucosamine (2.0630 ppm), glutamate (2.0816 ppm), lysine (3.0362 ppm), and two unassigned features (3.9800 and 3.5042 ppm). Boxes represent the interquartile range (IQR) with the median as the centre line; whiskers extend to 1.5×IQR; points denote individual samples.
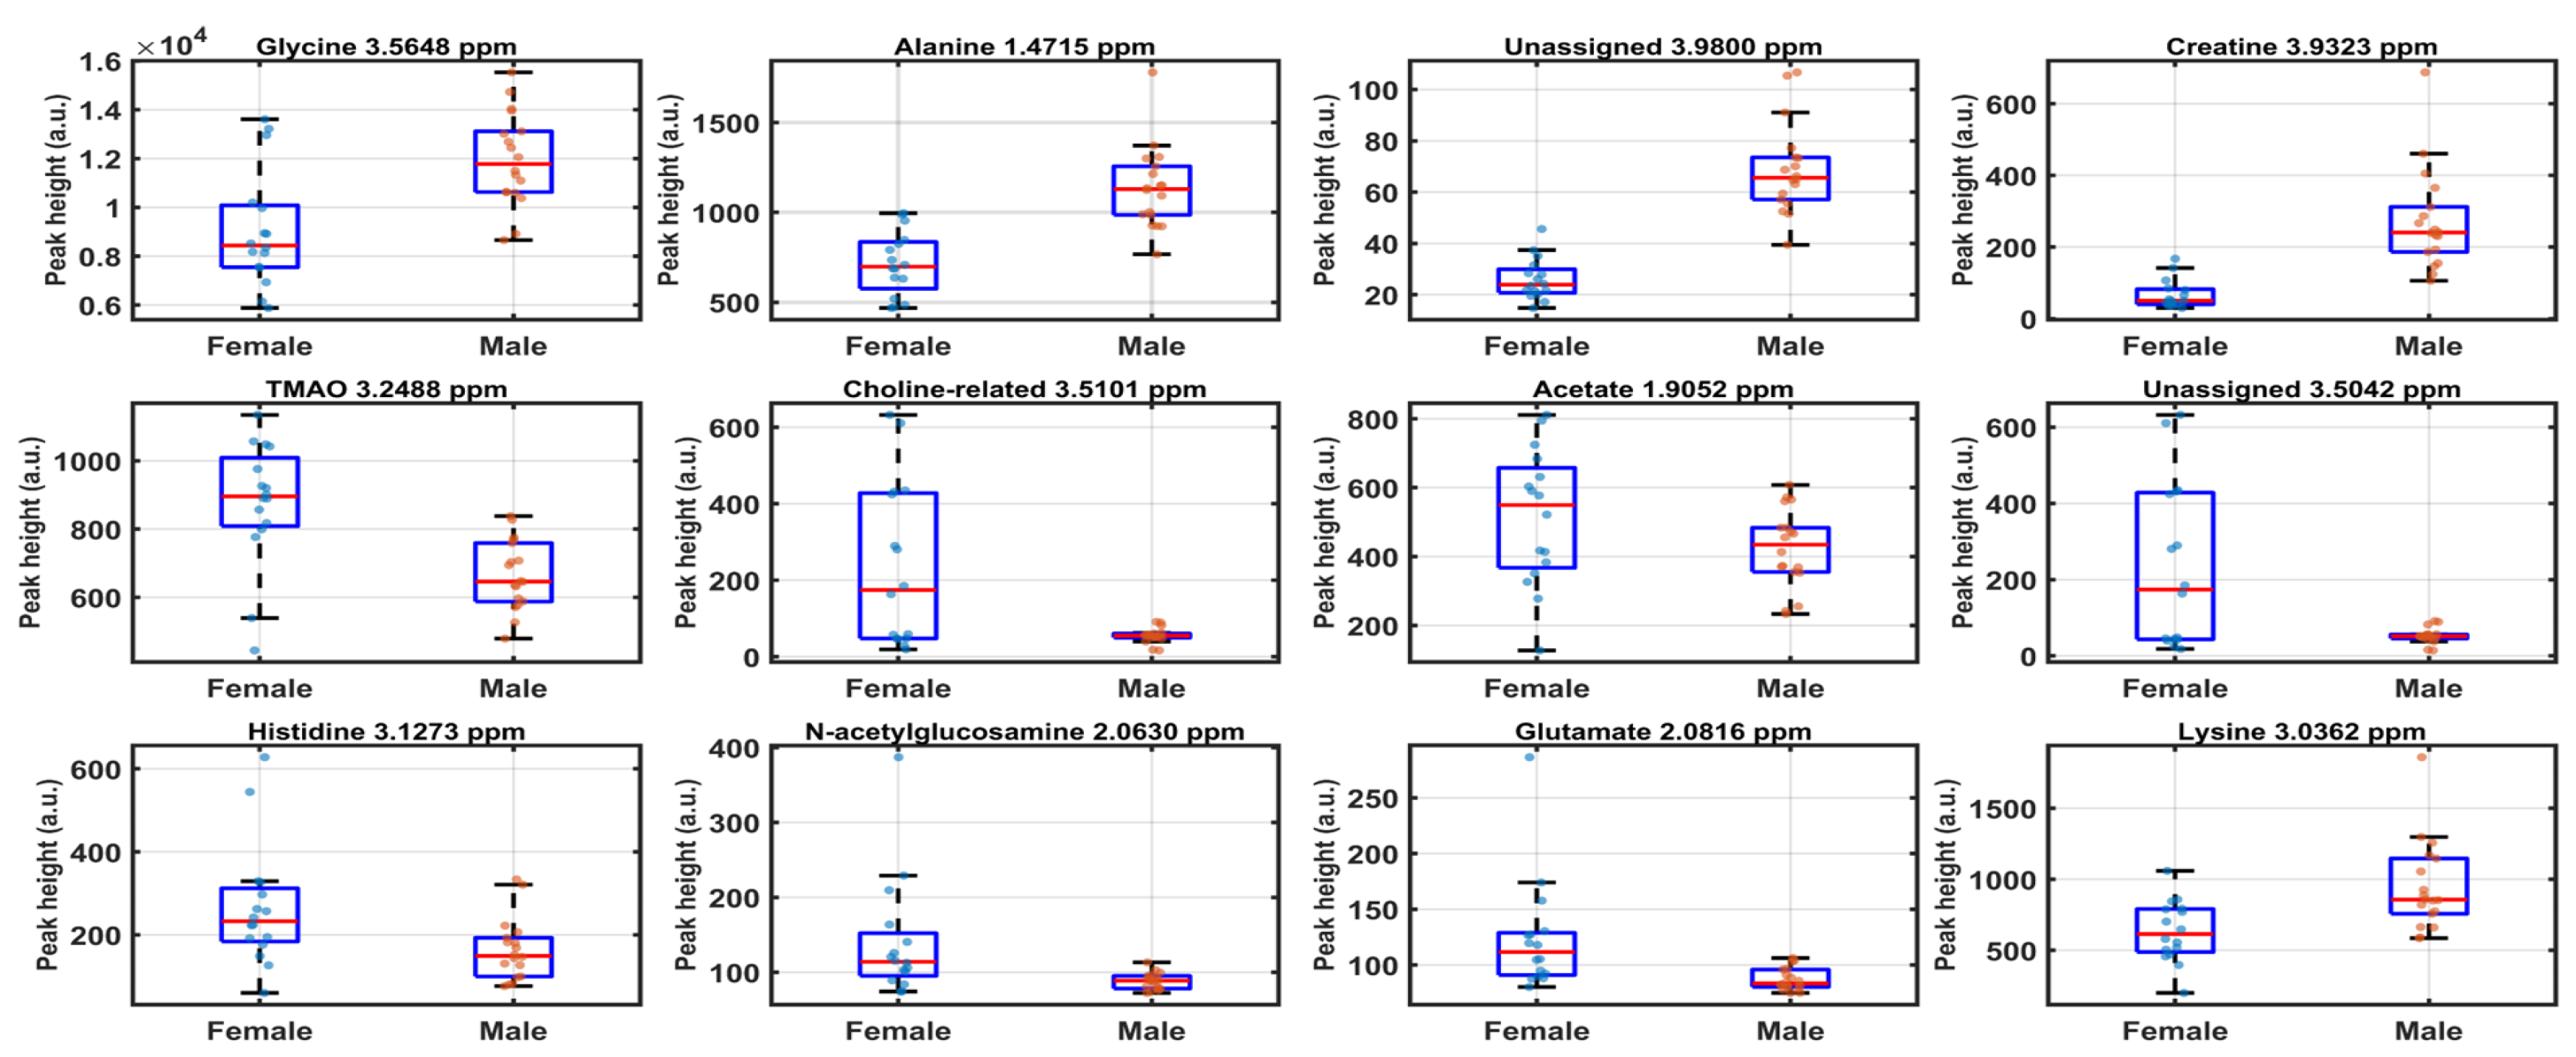
Figure 4.
Pathway topology analysis of sex-discriminatory polar metabolites using MetaboAnalyst. Each bubble represents a KEGG pathway plotted by pathway impact (x-axis) and enrichment significance (–log10 raw p-value; y-axis). Bubble size is proportional to the number of matched metabolites in each pathway, and bubble colour reflects the p-value (yellow to red). Full pathway statistics are reported in Table S2.
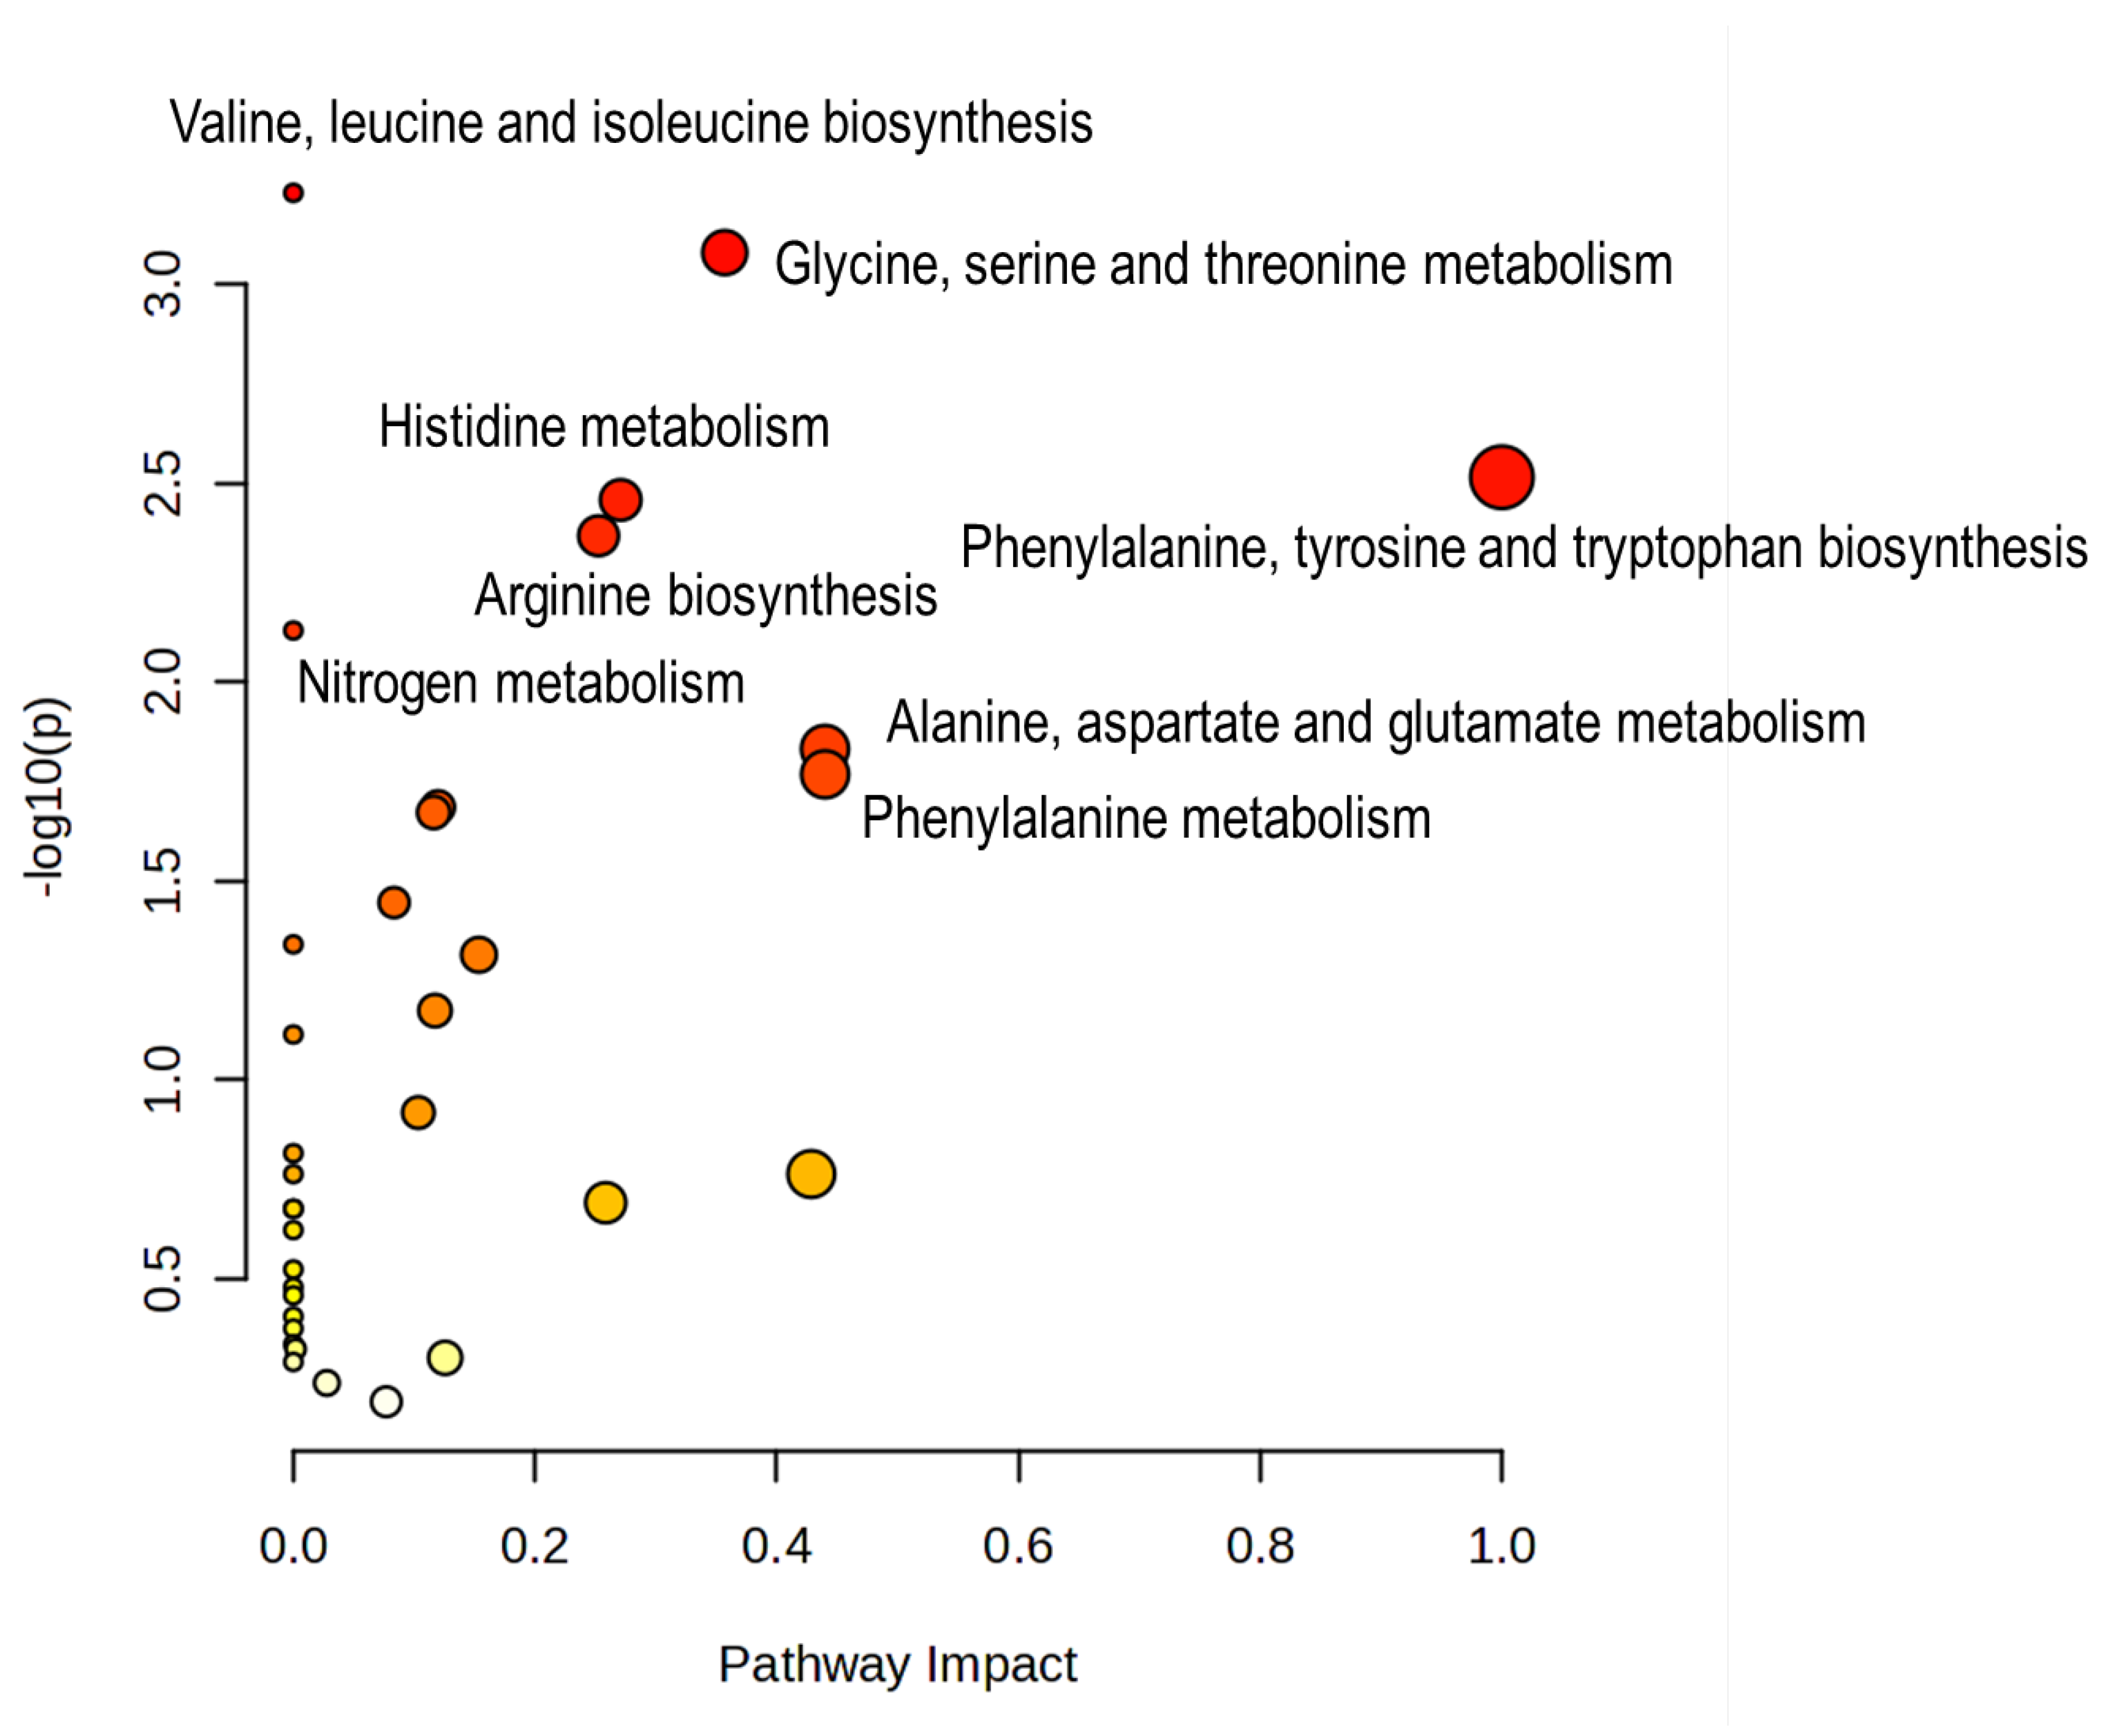
Figure 5.
Representative 1H NMR spectrum of apolar extracts recorded in CDCl3, dominated by lipid resonances. Annotated motifs include terminal methyls, acyl-chain methylene envelope, allylic and bis-allylic methylenes, olefinic protons, TAG/DAG glycerol –CH2–O–CO signals, and phospholipid-associated glycerophospholipid fragments. Moiety-to-lipid-class mapping is summarised in Supplementary Table S2.
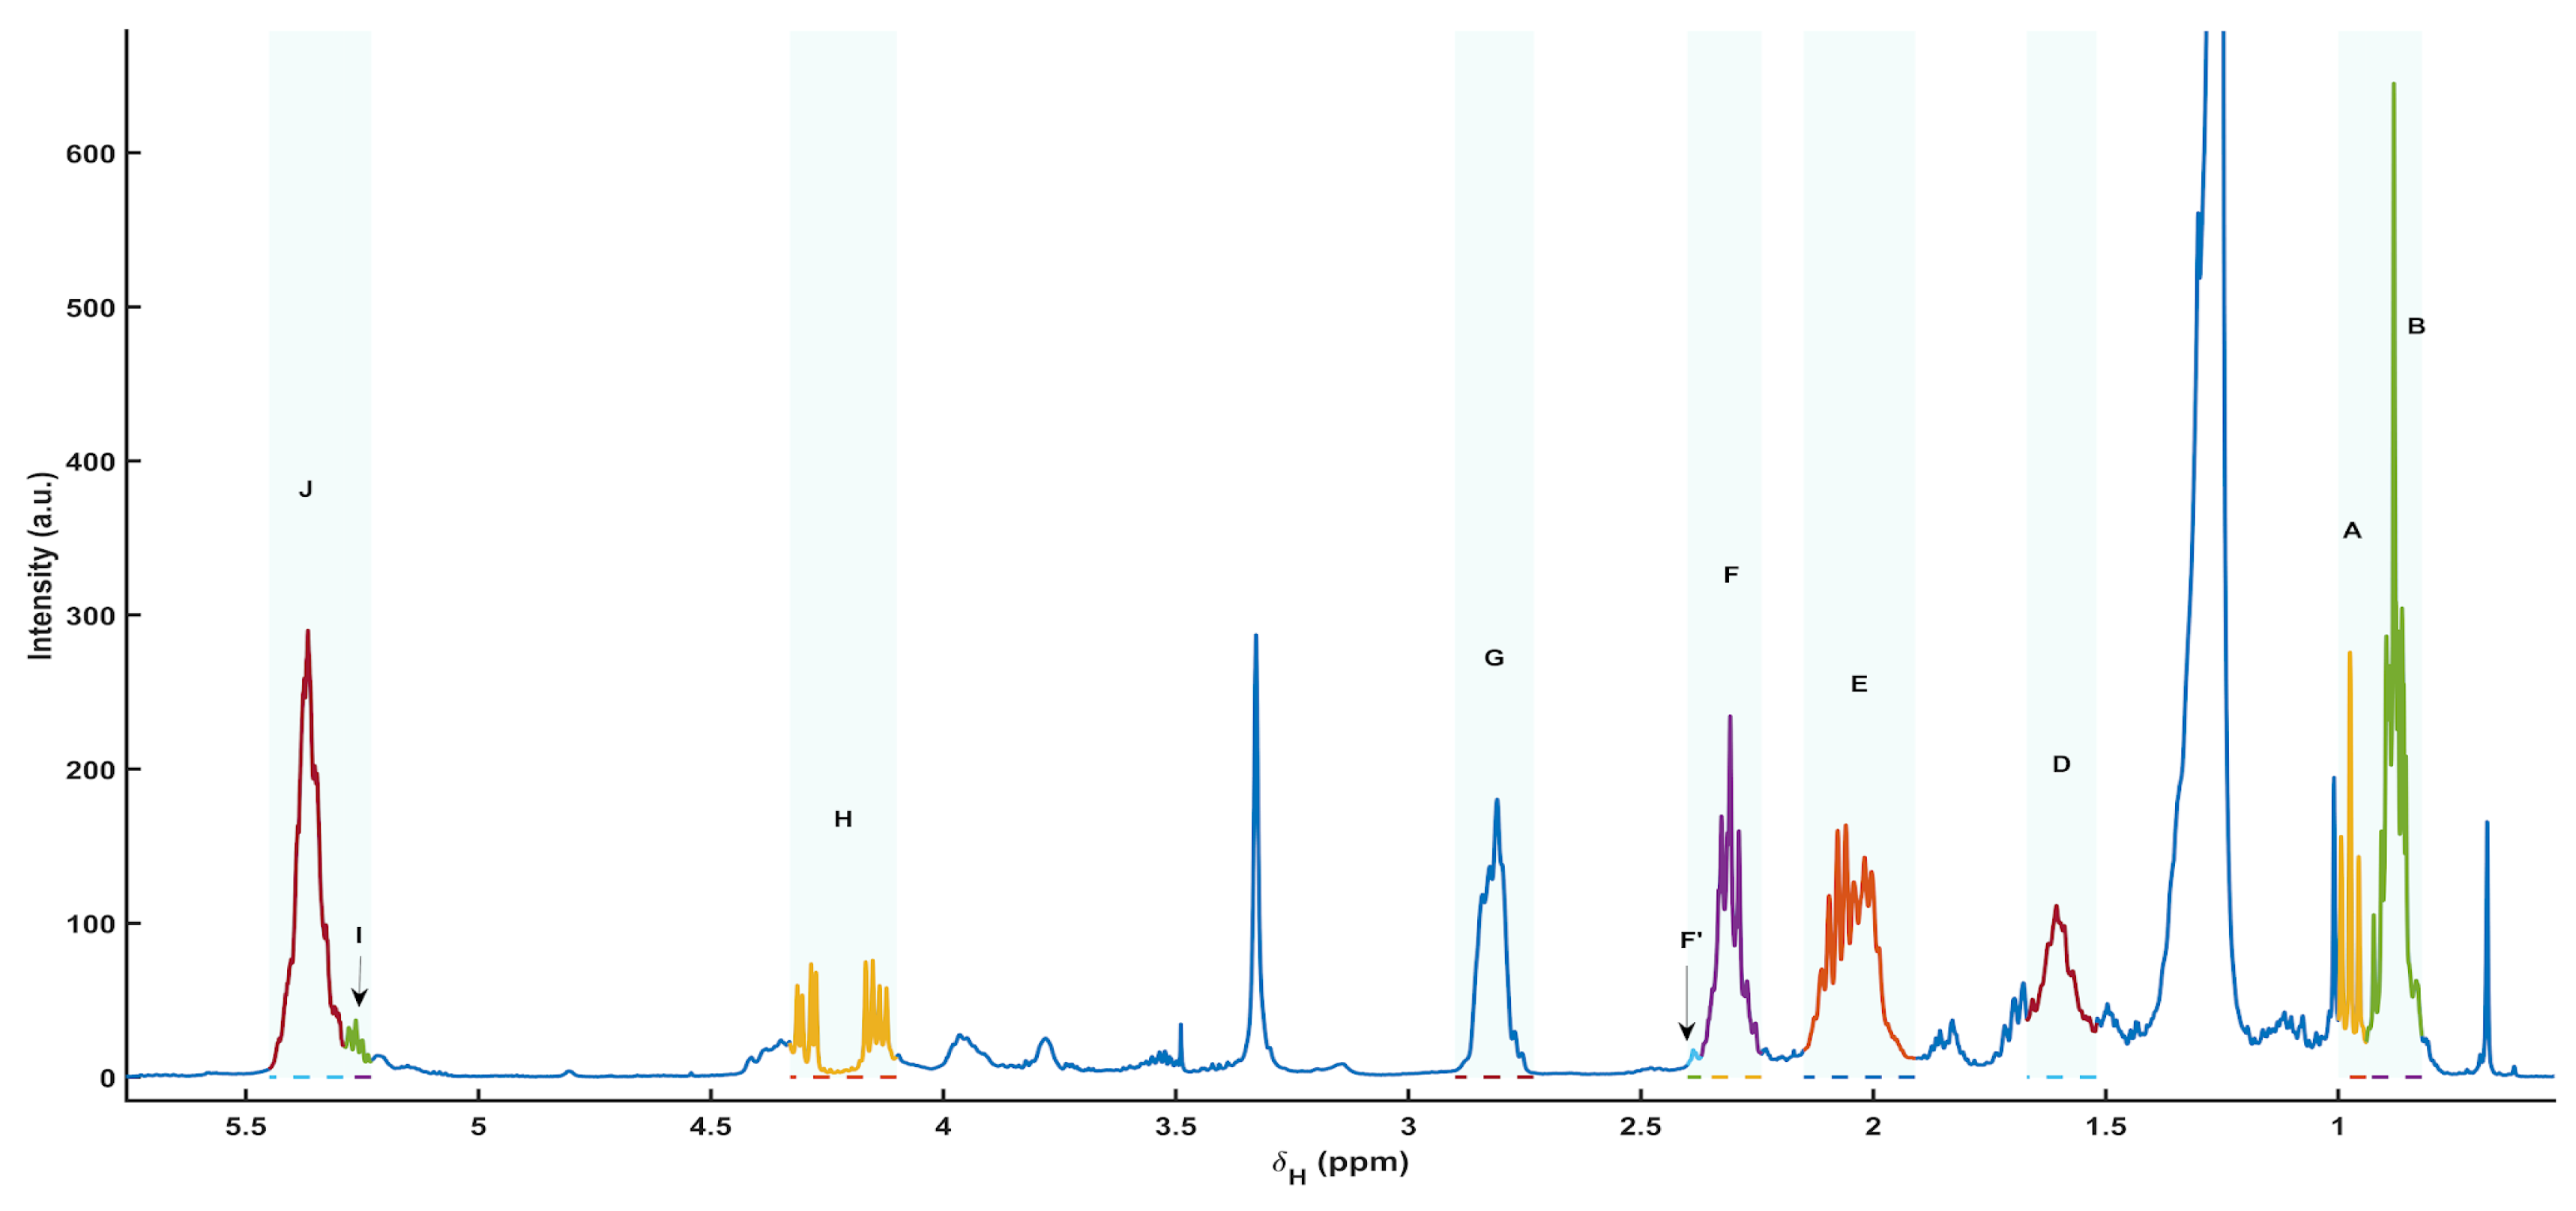
Figure 6.
Benchmarking of Bratu-derived DHA (mol%) in apolar extracts of Paracentrotus lividus gonads against published fish-oil reference values. DHA (mol%) was estimated from apolar 1H NMR spectra (CDCl3) by integrating diagnostic lipid regions and applying Bratu-type balance equations (see Methods; integration windows defined in the apolar integration map). The sea urchin dataset (n = 34) is shown as a boxplot with individual sample points; fish oils are displayed as reference values reported in Bratu et al., with labelled examples (e.g., cod liver, mackerel, bream, salmon, catfish; phytophagous oils). Boxes represent the interquartile range (IQR) with the median as the centre line; whiskers extend to 1.5×IQR; points denote individual observations, highlighting markedly lower DHA in sea urchin gonad apolar extracts relative to fish oils.
Disclaimer/Publisher’s Note: The statements, opinions and data contained in all publications are solely those of the individual author(s) and contributor(s) and not of MDPI and/or the editor(s). MDPI and/or the editor(s) disclaim responsibility for any injury to people or property resulting from any ideas, methods, instructions or products referred to in the content. |
© 2026 by the authors. Licensee MDPI, Basel, Switzerland. This article is an open access article distributed under the terms and conditions of the Creative Commons Attribution (CC BY) license (http://creativecommons.org/licenses/by/4.0/).
Copyright: This open access article is published under a Creative Commons CC BY 4.0 license, which permit the free download, distribution, and reuse, provided that the author and preprint are cited in any reuse.


