
Submitted:
15 February 2026
Posted:
25 February 2026
You are already at the latest version
Abstract
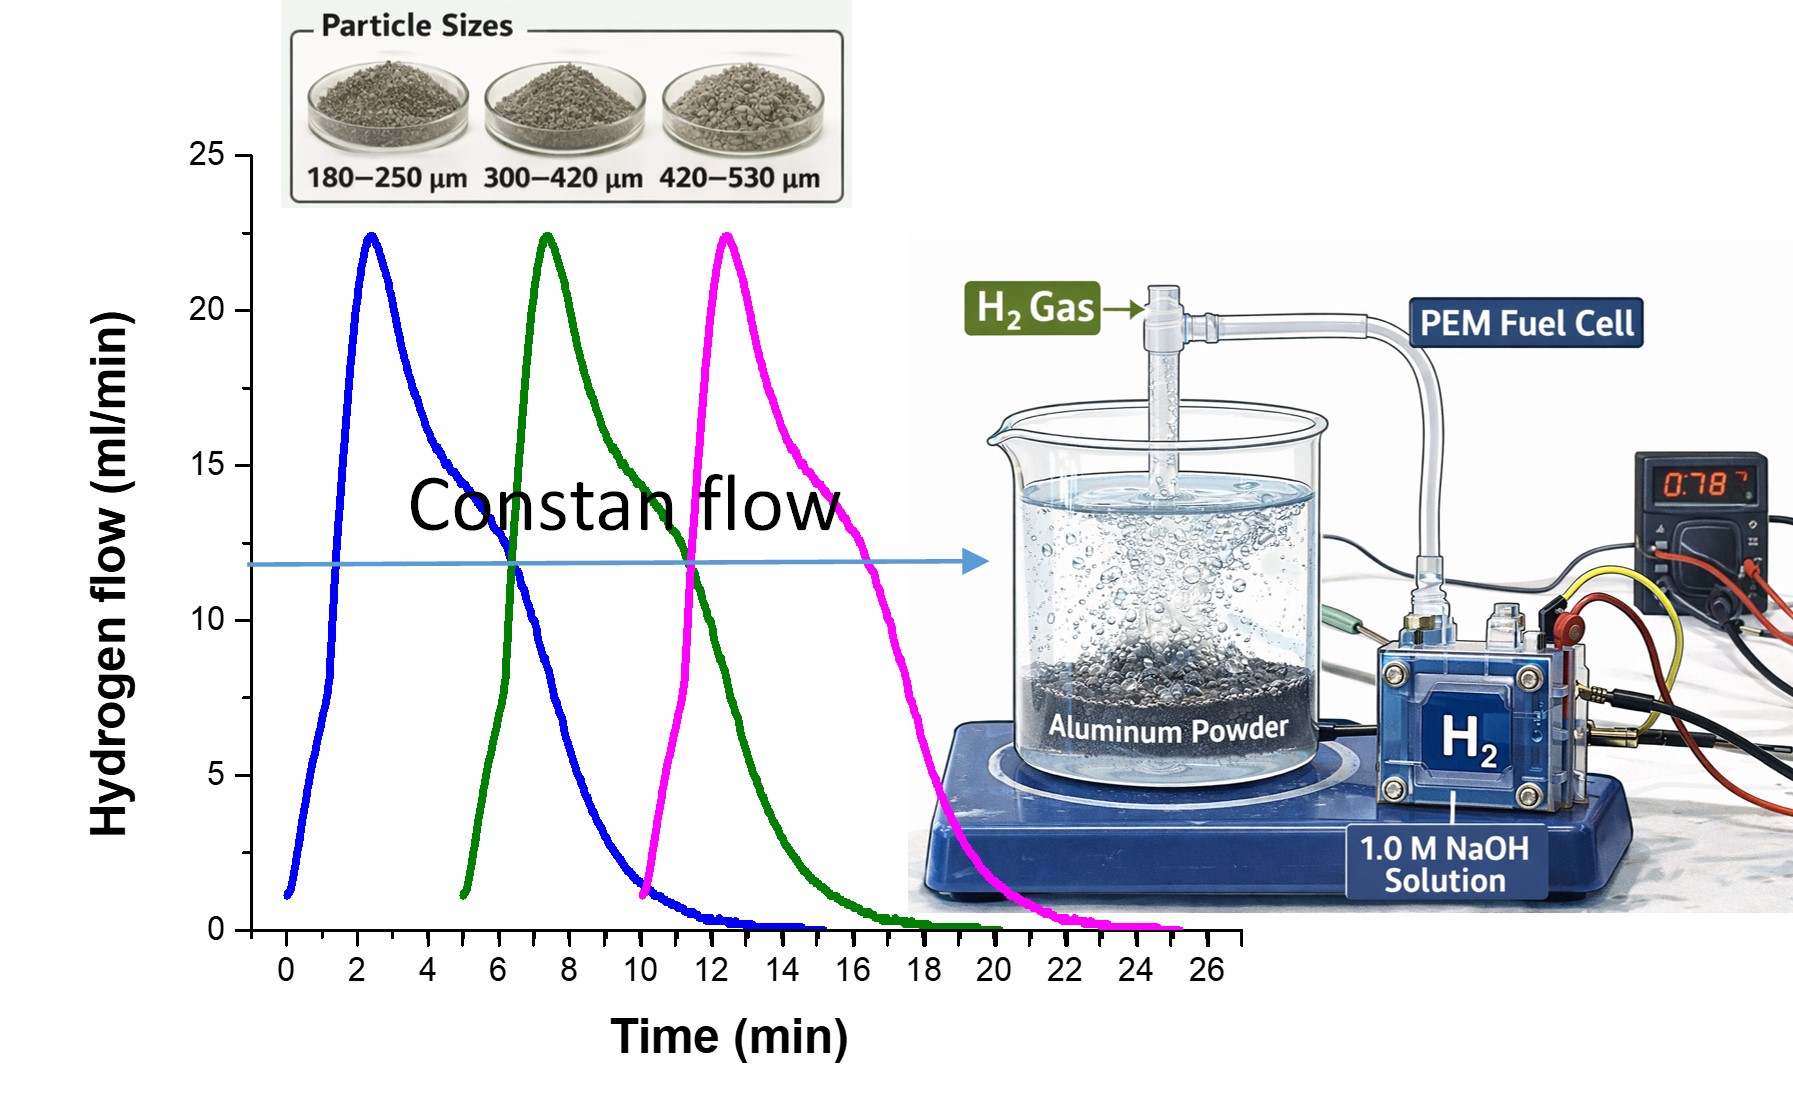
Hydrogen (H2) was produced using recycled aluminum (Al), with particle sizes of 180-250 μm, 300-420 μm and 420-530 μm. A 1.0 M NaOH solution was employed to enhance aluminum dissolution and maximize hydrogen release. During a 30-minute evaluation, peak hydrogen flow rates of approximately 14, 16, and 23 ml/min were obtained, depending on particle size reduction. The H₂ flow behavior for the three size ranges can be divided into two distinct stages: the first corresponds to the initial contact between Al and the NaOH solution, where hydrogen production increases until reaching a maximum; the second stage follows, characterized by a gradual decline in H₂ generation to nearly zero toward the end of the test. These findings indicate that smaller particle sizes promote a more intense hydrogen release during the first stage, due to the higher aluminum dissolution rate, while in the second stage, production decreases significantly as the formation of an oxide layer slows down Al dissolution. For fuel cell applications, particle size and sample mass can thus be adjusted to regulate the desired hydrogen flow rate. XRD and SEM analysis demonstrated the consistency of the equations describing the hydrogen production reaction phenomenon in these aluminum-based equations.
Keywords:
recycled aluminum
; hydrogen technology
; gas flow evolution
; alkaline medium
1. Introduction
In recent years, clean energy sources have attracted significant global attention, with hydrogen emerging as a promising alternative to reduce dependence on fossil fuels. Global hydrogen production amounts to millions of tons annually, predominantly from natural gas steam reforming, followed by 30% from other hydrocarbons, 18% from coal gasification, 3.9% from water electrolysis, and approximately 0.1% from other routes [1,2]. The choice of production method is determined by plant energy requirements, end-use applications, and feedstock costs. Natural gas, as a byproduct of crude oil extraction, is the most widely employed raw material; however, its use generates polluting emissions [3]. This underscores the need for more efficient and environmentally sustainable alternatives. Hydrogen storage represents another critical challenge. Electronic devices require sufficient energy capacity to extend operational time, yet conventional storage methods present drawbacks: gaseous storage is inefficient, and metal hydrides are costly. Furthermore, these methods often consume more energy than they supply. Recent advances in material synthesis have sought to overcome these limitations. For instance, lithium borohydride (LiBH₄) exhibits high energy density [4], though it remains limited by high production costs, scalability issues, and environmental concerns. When utilized in fuel cells, hydrogen produces only water vapor as a byproduct, establishing it as a clean, carbon-free energy carrier. Nevertheless, in portable power generation systems based on fuel cells, two persistent challenges remain: hydrogen production and storage [5,6,7].
A promising route for hydrogen production is the reaction between metallic aluminum (Al) and water [8]. Aluminum is an attractive energy carrier due to its abundance, recyclability, and high energy density [9]. It constitutes 7.45% of the Earth’s crust, making it the most abundant metal, and theoretically, 1 g of Al can generate ~1245 ml of H₂ [10]. Reacting Al waste, such as beverage cans, with water offers a sustainable and clean energy pathway. The reaction has been reported to yield ~2.2 kW·h/kg Al in fuel cells [11], without greenhouse gas emissions, and with hydrogen storage densities up to ten times greater than compressed gas [12].
Although Al reacts with water to form Al(OH)₃ and H₂, this process is hindered by a passivating amorphous Al₂O₃ layer (2–5 nm) [13]. Two main strategies are used to overcome this limitation: (i) acidic or alkaline aqueous media, where Al oxides are soluble, and (ii) mechanical ball milling to remove the oxide layer. In alkaline solutions, Al dissolution is favored, enhancing hydrogen generation.
The main reactions of Al with NaOH in aqueous solution are [8,14,15]:
2Al(s)+ 6H2O(l)+ 2NaOH(s)→ 2NaAl(OH)4(aq)+ 3H2(g)
2NaAl(OH)4(aq) → 2NaOH(s) + 2Al(OH)3(aq)
2Al(s) + 6H2O(l) → 2Al(OH)3(aq) + 3H2(g)
NaOH consumed in (1) is regenerated in (2), completing the overall process in (3). However, passivation by Al(OH)₃ and Al₂O₃ films can reduce hydrolysis by ~30%, lowering H₂ yield by ~33% [16].
This work investigates in-situ hydrogen generation to supply a fuel cell in real time. The study evaluates a simple method for aluminum corrosion in alkaline media as a cost-effective route for hydrogen production, analyzing the effect of recycled Al particle size when exposed to NaOH solution. XRD and SEM characterization was carried out to determine the phases present during the process and to determine the consistency of the hydrogen production reaction with other authors.
2. Materials and Methods
Aluminum beverage cans were used to obtain aluminum alloy ingot. The chemical components of each can part were as follows: AA 5182/H48 (beverage can lids) [17], AA 5042/H18 (beverage can tabs) [18], and AA 3104/H19 (beverage can body) [19], as shown in Table 1.
First, the paint covering the cans was removed using sandpaper and solvent. Subsequently, the cans were compacted and placed in an electric induction furnace at a melting temperature of 700 °C. An ingot was obtained by conventional casting and cooled to room temperature, as shown in Figure 1. It is worth mentioning that Jayaraman et al. [8] reported that the specific surface area and reaction temperature influence the reaction rate of aluminum with water, which in turn modifies the yield of hydrogen generation and the compounds formed. For this reason, particles of different sizes were obtained by gradually grinding the ingot using a flat metal file (10 inches, Bellota steel, model 6400110f1bl). Subsequently, a magnet was used to remove any remaining ferrous contamination from the steel file.
Next, numbered sieves ranging from 50 to 100 were used to classify the particles. The resulting particle size distribution is presented in the histogram shown in Figure 2. Based on this distribution, three particle size ranges were selected for testing: 180–250 µm, 300–420 µm, and 420–530 µm, as indicated by the arrows in Figure 2.
To evaluate the influence of particle size on hydrogen production, 100 mL of a 1.0 M NaOH solution was poured into a 250 mL flask containing 1.0 g of Al particles (180–250 µm). Immediately afterward, the flask was sealed and connected to the flowmeter through a conduit, allowing the determination of the hydrogen produced in milliliters per minute per gram of aluminum. Three repetitions were performed for each particle size distribution. The same procedure was carried out for particles sized 300–420 µm and 420–530 µm. Hydrogen production occurred through Al–NaOH reactions (see Eqs. 4 and 5), in a cyclic process where environmental pollution is avoided and aluminum is efficiently reused [9,10,11,12,13].
2Al(s) + 2NaOH(s) + 6H2O(l) → 2Al(OH)3(aq) + 3H2(g)
2Al(s) + 2Al(OH)3(aq) → 2NaAl(OH)4(aq) + 3H2(g)
The ratio of the Al(OH)3(aq) (Bayerite) to NaAl(OH)4(aq) on the reaction (5) is basically independent of temperature [20]. Moreover, the oxidative behavior of aluminum in hydrogen production strongly depends on the nature of the dissolved species present when it interacts with aqueous solutions. Machanás et al. have taken advantage of this behavior to develop a new sustainable method (the AlHidrox process) to produce hydrogen from water under mild conditions, in such a way that they have achieved to reduce the surface passivation of aluminum for produce hydrogen through a process that allows reduced hydrogen production costs [21].
In early moments aluminum comes into contact with the environment, it forms on the aluminum an oxide film (Al2O3) of about 2-4 nanometers on its surface [22]. This Al2O3 on the aluminum surface is not homogeneous and has imperfections, through its ambient humidity comes into contact with aluminum, forming aluminum hydroxide Al(OH)3 on its surface and releasing H2 into the environment (see Equation 3). The formation and consequent growth of Al(OH)3 on the aluminum surface minimizes the reaction with water molecules in the early moments. Although in alkaline conditions equation 1, is favored by the destruction of Al2O3 on the surface, giving as reaction product NaAl(OH)4 and the release of hydrogen into the environment. Hydrogen generation is increased by the interaction of the alkaline medium (NaOH) with the aluminum surface and by the same hydrogen generated by the embrittlement mechanism [23].
In addition, the average flow and the average volume of hydrogen produced were determined where different stages during hydrogen production were identified. The compounds and phases formed from the residual products were characterized by X-ray diffraction (XRD), and scanning electron microscopy (SEM).
3. Results
Figure 3 shows the three hydrogen production flux curves as a function of time for the different particle size distributions (a) 420-530 µm, b) 300-420 µm, and c) 180-250 µm). The behavior of the H₂ fluxes for the three particle sizes is described in two stages (separated by a dashed line): the first occurs in the initial moments of interaction of the aluminum particles with the NaOH solution, which tends to increase to a maximum (approximately at 2.5 min), according to the Cabrera-Mott mechanism [15], then in the second stage the behavior of the flow rates shows a tendency to decrease to values close to zero in NaOH solution, effect of increasing the thickness of the Al2O3 over aluminum particles. On the other hand, a greater dispersion in the hydrogen flow is observed as the particle size decreases; for example, in size distribution b) the maximum flow achieved varies from 13 to 16 ml/min, while in distribution c) it varies from 15 to 22 ml/min, from this it can be deduced that the decrease in particle size plays an important role in the kinetics of hydrogen production.
An inflection point can also be seen in the curve, after passing through the maximum indicated by arrows for each particle distribution. This suggests a second hydrogen production reaction, albeit at a lower rate compared to the first region.
Figure 4a presents the average hydrogen flow curve, where the behavior of each hydrogen production process can be observed in greater detail. Also, shows that the maximum flow rate obtained for each particle size distribution a), b) and c) are 14, 16, and 22 mL/min, respectively, indicating an increase as particle size decreases. Furthermore, these curves show a passivation time for the hydrogen production reaction for all curves: (a) 32.5, (b) 27, and (c) 15 minutes, indicating a trend toward a decrease in reaction time as particle size decreases.
Figure 4b shows the cumulative volume obtained from the H₂ production flow data as a function of time. This figure shows that particle size curve (a) accumulates a volume of 102 ml, while curve (b) accumulates 132 ml and curve (c) 106 ml of hydrogen. This interesting result suggests the following explanation: in the first region, the particles react very rapidly, achieving a very high flow rate and becoming coated with Al(OH)₃, which quickly decreases the hydrogen production reaction, resulting in a smaller cumulative volume. Thus, larger particles have a longer reaction time compared to smaller particles.
To determine the microstructural components of the samples after the experiments, scanning electron microscopy (SEM) was used, as shown in Figure 5. Figure 5 shows a superficial layer of NaOH that covers the aluminum particles, which decrease the reaction of the NaOH solution with the aluminum. Figure 5a shows a pattern obtained by backscattered electron microscopy, where the homogeneous particles after the hydrogen production reaction can be observed. A contrast of gray tones corresponding to the Al(OH)3 coated particles is also shown. For a more detailed view, the image was magnified to 5000X, as shown in Figure 5b, where details of the acicular growth of the Al(OH)3 phase on the surface of the aluminum alloy particles can be observed. Furthermore, the particle surfaces exhibit the coexistence of the main alloying elements, as identified by EDS (Energy-Dispersive X-ray Spectroscopy) analysis. Oxygen is present in the highest proportion, which is attributed to aluminum oxidation. The remaining elements, including Fe, Mg, Mn, Na, and Si, correspond to the alloying constituents listed in Table 1. Chlorine (Cl) was also detected and is attributed to impurities in the NaOH reagent.
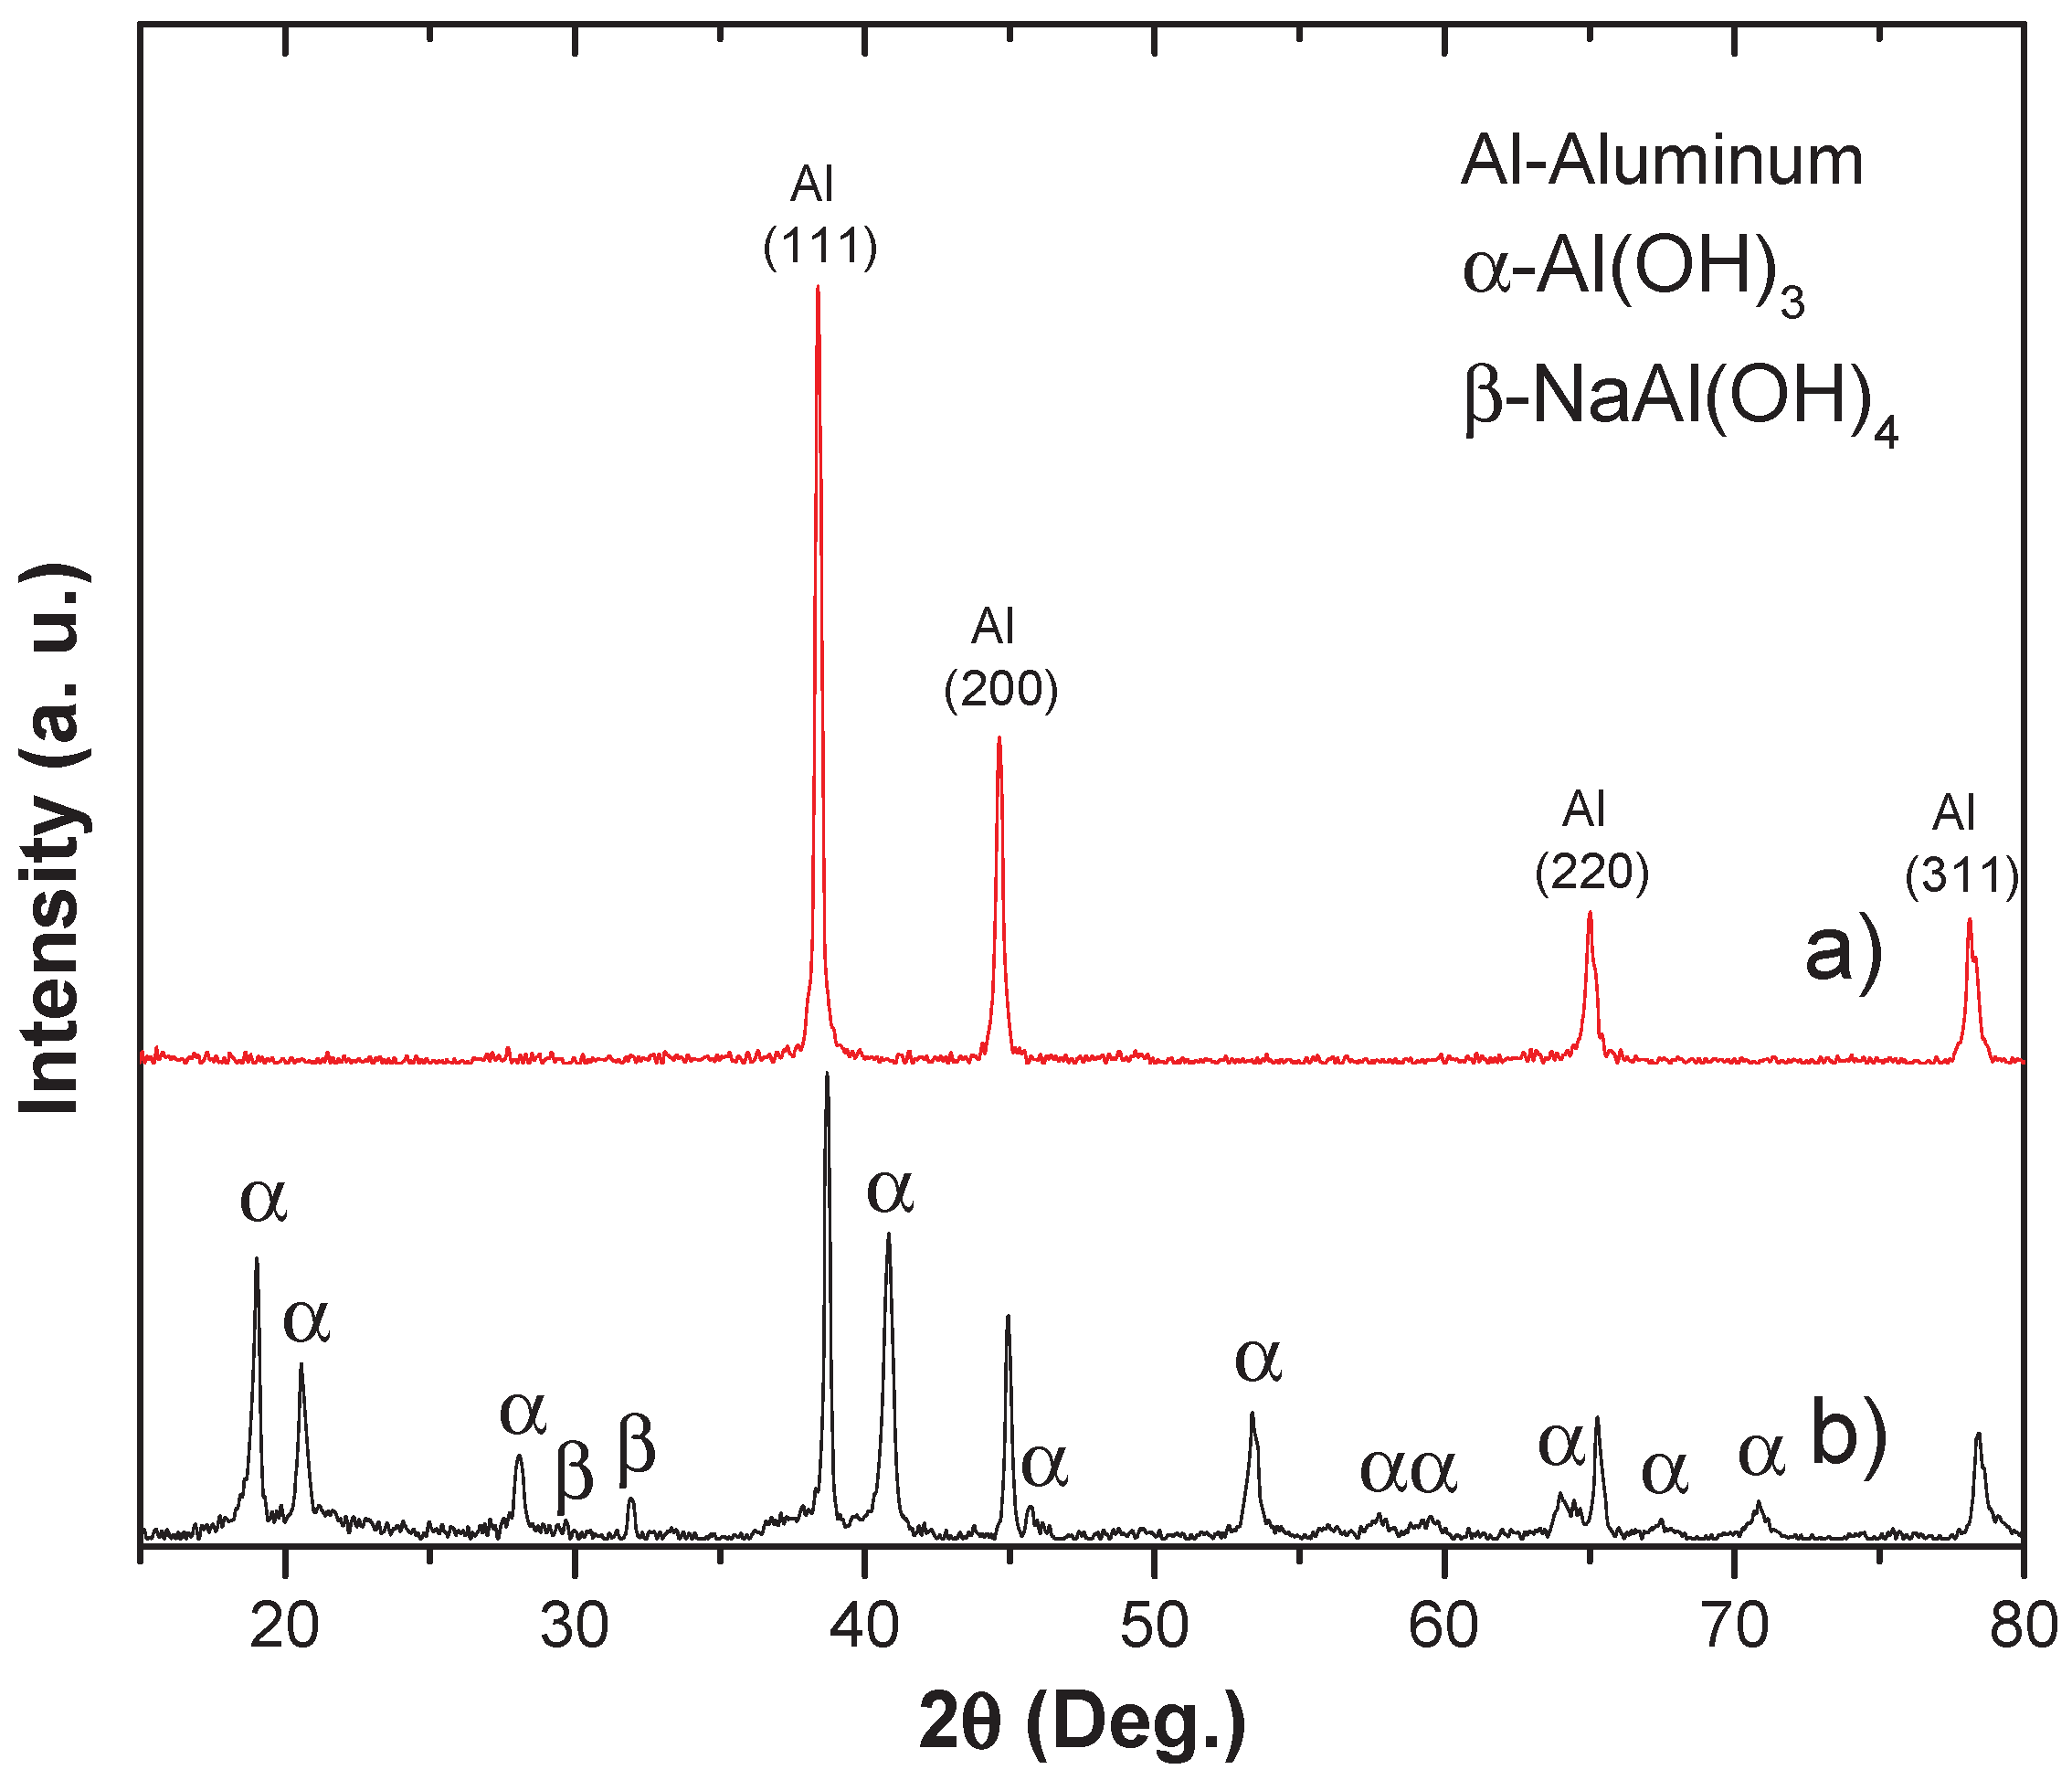
The samples were subjected before and after to X-ray diffraction to determine the phases of the byproducts of the production reaction between aluminum and the alkaline medium of sodium hydroxide (see figure 6). Figure 6a shows the XRD pattern of the powder sample before being subjected to the hydrogen production reaction. It displays the typical crystalline structure of aluminum with its respective principal crystallographic planes (111), (200), (220), and (311), which diffract in this 2θ region according to Bragg's law. It is important to note that the alloying chemical components shown in Table 1 are not visible in the pattern. This is because the alloying elements are randomly distributed within the aluminum structure and at the grain boundaries, as previously reported [24]. According to the random distribution of alloying elements within the aluminum matrix and at grain boundaries, several critical microstructural effects occur. The XRD pattern corresponding to the sample subjected to the hydrogen production reaction is shown in Figure 6b, where it is possible to determine the coexistence of phases such as: Al, Al(OH)3 and NaAl(OH)4. These results suggest the consistency of the products and reactants of equations (1) to (6) mentioned above.
4. Discussion
The differences observed in the hydrogen production kinetics (Figure 3) can be attributed primarily to particle size effects generated during mechanical fragmentation of the aluminum ingot. Mechanical grinding increases the specific surface area and modifies the surface chemical state of the particles [21]. Additionally, particle size reduction increases surface energy, which thermodynamically favors aluminum dissolution in alkaline media [25,26]. These effects explain the higher hydrogen flow rate (Q) obtained for the smallest particle size range (180–250 μm), compared with the 300–420 μm and 420–530 μm fractions.
The dissolution behavior of aluminum in alkaline solution is strongly influenced by oxide film characteristics, including bond covalency, lattice defects, crystallographic anisotropy, oxide thickness, impurity content, and the degree of structural order [27,28]. Smaller particles present a higher density of surface defects and active sites, which enhances oxide disruption and accelerates hydrogen evolution.
For the largest particle size range (420–530 μm, curve a), a maximum flow rate of approximately 14 mL/min was reached after a relatively slow induction period, extending close to 30 min. In contrast, the 300–420 μm fraction (curve b) exhibited a higher peak flow rate (~16 mL/min) with a broader curve profile, indicating a longer sustained hydrogen production period. This behavior suggests a kinetic size effect associated with surface tension, supersaturation, and dissolution dynamics of the primary particles [29].
The smallest particles (180–250 μm, curve c) showed the fastest kinetic response, reaching a maximum hydrogen flow rate of approximately 22 mL/min within the first few minutes of reaction. This rapid increase corresponds to the initial active dissolution stage of aluminum upon contact with the NaOH solution. Such behavior is consistent with the induction period reported in alkaline aluminum corrosion systems [30]. Following this initial stage, the hydrogen flow rate gradually decreased due to the progressive formation and thickening of an oxide/hydroxide layer (Al₂O₃/Al(OH)₃), which limits mass transfer and reduces the effective contact between aluminum and the alkaline solution [31].
Overall, the results confirm that smaller particles react more rapidly, demonstrating that the corrosion rate—and consequently hydrogen generation—is strongly dependent on particle size [32]. Although higher initial hydrogen production is achieved with smaller particles, the gradual growth of the oxide layer reduces surface reactivity over time.
SEM observations (Figure 5) reveal a heterogeneous surface layer composed mainly of hydroxide products, whose defect-rich morphology may temporarily sustain hydrogen evolution. The acicular growth structures observed are characteristic of Al(OH)₃ phases. XRD analysis (Figure 6) confirms the presence of metallic aluminum prior to reaction and the formation of Al(OH)₃ and sodium aluminate species after alkaline exposure, consistent with the proposed reaction mechanisms (Equations 1–3). These findings support the interpretation that hydrogen production is governed by surface-controlled dissolution and oxide layer evolution.
5. Conclusions
Hydrogen was successfully generated from recycled aluminum cans via alkaline hydrolysis using a 1.0 M NaOH solution to promote oxide layer removal and enhance aluminum dissolution.
The results demonstrate that hydrogen flow rate increases as particle size decreases due to the higher specific surface area, while the overall reaction time is shortened. The smallest particle size evaluated (180–250 μm) exhibited the highest hydrogen production rate.
The hydrogen evolution process followed a two-stage kinetic behavior: an initial rapid production phase governed by active aluminum dissolution, followed by a gradual decline associated with oxide layer formation that limits further reaction.
XRD and SEM analyses validated the proposed aluminum–water reaction mechanisms, confirming the consistency of the governing reaction equations. Overall, the findings demonstrate that hydrogen production from recycled aluminum is a viable and controllable strategy. By adjusting particle size and mass, hydrogen flow rates can be tailored for potential on-demand and portable fuel cell applications, contributing to sustainable hydrogen generation approaches.
Author Contributions
Conceptualization, C. Patino-Carachure and S. Martinez-Vargas; methodology, S. Pérez-Montejo; validation, C. Patino-Carachure, S. Martinez-Vargas and J.E. Flores-Chan; formal analysis, D. Calan-Canche.; investigation, S. Pérez-Montejo; resources, D. Calan-Canche.; data curation, H.J. Mandujano-Ramírez.; writing—original draft preparation, C. Patino-Carachure and S. Martinez-Vargas; writing—review and editing, C. Patino-Carachure and S. Martinez-Vargas.All authors have read and agreed to the published version of the manuscript.
Funding
This research received no external funding.
Acknowledgments
to technicians Agustin Vazquez-Escudero and Ivan Castro-Cisneros for their support in the use and handling of characterization equipment.
Conflicts of Interest
The authors declare no conflicts of interest.
Abbreviations
The following abbreviations are used in this manuscript:
| XRD | X-ray diffraction |
| SEM | Scanning electron microscopy |
| NaOH | Sodium hydroxide |
| Al(OH)3 | Aluminum hydroxide |
| Al2O3 | Aluminum oxide |
| NaAl(OH)4 | Hydrated sodium aluminate |
| EDS | Energy-dispersive X-ray spectroscopy |
References
- Gupta, R.B.; Pant K.K. Fundamentals and Use of Hydrogen as a Fuel. In Hydrogen Fuel: Production, Transport and Storage, 1st ed.; Ram B. Gupta Ed.; CRC Press: Boca Raton, FL, USA, 2008; Chapter 1, pp. 1-30. [CrossRef]
- Gimpel, J.A.; Specht, E.A.; Georgianna, D.R.; Mayfield, S.P. Advances in microalgae engineering and synthetic biology applications for biofuel production. Curr. Opin. Chem. Biol. 2013, 17(3), 489–495. [Google Scholar] [CrossRef]
- Moore, R. Economic feasibility of advanced technology for hydrogen production from fossil fuels. Int. J. Hydrogen Energy 1983, 8, 905–912. [Google Scholar] [CrossRef]
- Bannenberg, L.J.; Heere, M.; Benzidi, H.; Montero, J.; Dematteis, E.M.; Suwarno, S.; Jaroń, T.; Winny, M.; Orłowski, P.A.; Wegner, W.; Starobrat, A.; Fijałkowski, K.J.; Grochala, W.; Qian, Z.; Bonnet, J.-P.; Nuta, I.; Lohstroh, W.; Zlotea, C.; Mounkachi, O.; Cuevas, F.; Chatillon, C.; Latroche, M.; Fichtner, M.; Baricco, M.; Hauback, B.C.; El Kharbachi, A. Metal (boro-)hydrides for high energy density storage and relevant emerging technologies. Int. J. Hydrogen Energy 2020, 45, 33687–33730. [Google Scholar] [CrossRef]
- Tashie-Lewis, B.C.; Nnabuife, S.G. Hydrogen production, distribution, storage and power conversion in a hydrogen economy—A technology review. Chem. Eng. J. Adv. 2021, 8, 100172. [Google Scholar] [CrossRef]
- Nnabuife, S.G.; Ugbeh-Johnson, J.; Okeke, N.E.; Ogbonnaya, C. Present and projected developments in hydrogen production: A technological review. Carbon Capture Sci. Technol. 2022, 3, 100042. [Google Scholar] [CrossRef]
- Halder, P.; Babaie, M.; Salek, F.; Haque, N.; Savage, R.; Stevanovic, S.; Bodisco, T.A. Advancements in hydrogen production, storage, distribution and refuelling for a sustainable transport sector: Hydrogen fuel cell vehicles. Int. J. Hydrogen Energy 2024, 52, 973–1004. [Google Scholar] [CrossRef]
- Jayaraman, K.; Chauveau, C.; Gökalp, I. Effects of aluminum particle size, galinstan content and reaction temperature on hydrogen generation rate using activated aluminum and water. Energy Power Eng. 2015, 7, 426–435. [Google Scholar] [CrossRef]
- Trowell, K.A.; Goroshin, S.; Frost, D.L.; Bergthorson, J.M. Aluminum and its role as a recyclable, sustainable carrier of renewable energy. Appl. Energy 2020, 275, 115112. [Google Scholar] [CrossRef]
- Hammad, A.; Ning, F.; Zou, S.; Liu, Y.; Tian, B.; He, C.; Chai, Z.; Wen, Q.; He, L.; Zhou, X. Aluminum hydrolysis for hydrogen generation enhanced by sodium hydride. Int. J. Hydrogen Energy 2024, 77, 138–148. [Google Scholar] [CrossRef]
- Mutlu, R.N.; Kandasamy, J.; Kıymaz, T.B.; Güleryüz, D.; Böncü, E.; Eroğlu, E.; Gökalp, İ. Optimization of aluminum hydrolysis reactions and reactor design for continuous hydrogen production using aluminum wire feeding. Int. J. Hydrogen Energy 2024, 52, 1390–1403. [Google Scholar] [CrossRef]
- Reda, R.; Ashraf, A.; Magdy, I.; Ragab, M.; Eldabaa, N.; Elmagd, M.A.; Abdelhafiz, M.; El-Banna, O.; Fouad, A.; Aly, H.A.; Tlija, M.; Soliman, A.T.; Elsayed, A.; Elshaghoul, Y.G.Y. An investigation on the potential of utilizing aluminum alloys in the production and storage of hydrogen gas. Mater. 2024, 17, 4032. [Google Scholar] [CrossRef]
- Wang, H.Z.; Leung, D.Y.C.; Leung, M.K.H.; Ni, M. A review on hydrogen production using aluminum and aluminum alloys. Renew. Sustain. Energy Rev. 2009, 13, 845–854. [Google Scholar] [CrossRef]
- Soler, L.; Macanás, J.; Muñoz, M.; Casado, J. Hydrogen generation from aluminum in non-consumable potassium hydroxide solution. In Proceedings of the International Hydrogen Energy Congress and Exhibition (IHEC 2005), Istanbul, Turkey, 13–15 July 2005; Available online: https://www.researchgate.net/publication/266220795_Hydrogen_Generation_From_Aluminum_In_A_Non-Consumable_Potassium_Hydroxide_Solution.
- Gorobez, J.; Maack, B.; Nilius, N. Growth of self-passivating oxide layers on aluminum—Pressure and temperature dependence. Phys. Status Solidi B 2021, 258, 2000559. [Google Scholar] [CrossRef]
- Kaur, P.; Verma, G. A critical assessment of aluminum–water reaction for on-site hydrogen-powered applications. Mater. Today Energy 2024, 40, 101508. [Google Scholar] [CrossRef]
- Kokoszka, P.; Milenin, A. The influence of aging on buckle strength loss in AA5182-H48 for beverage can ends. Comput. Methods Mater. Sci. 2023, 23(4), 5–17. [Google Scholar] [CrossRef]
- Wang, Z.; Yu, Y.; Jin, Y.; Li, Z.; Sun, S.; Xu, H.; Wu, C.; Zhang, D. Solid state recycling of used aluminum alloy beverage cans by thermomechanical consolidation. Heat Treat. Surf. Eng. 2022, 4(1), 90–98. [Google Scholar] [CrossRef]
- Shi, Y.; Jin, H.; Wu, P. D. Analysis of cup earing for AA3104-H19 aluminum alloy sheet. Eur. J. Mech. A Solids 2018, 69, 1–11. [Google Scholar] [CrossRef]
- Li, H.; Addai-Mensah, J.; Thomas, J.C.; Gerson, A.R. The crystallization mechanism of Al(OH)\₃ from sodium aluminate solutions. J. Cryst. Growth 2005, 279, 208–216. [Google Scholar] [CrossRef]
- Macanás, J.; Soler, L.; Candela, A.M.; Muñoz, M.; Casado, J. Hydrogen generation by aluminum corrosion in aqueous alkaline solutions of inorganic promoters: The AlHidrox process. Energy 2011, 36, 2493–2501. [Google Scholar] [CrossRef]
- Saif, M.T.A.; Zhang, S.; Haque, A.; Hsia, K.J. Effect of native Al₂O₃ on the elastic response of nanoscale Al films. Acta Mater. 2002, 50, 2779–2786. [Google Scholar] [CrossRef]
- Belitskus, D. Reaction of aluminum with sodium hydroxide solution as a source of hydrogen. J. Electrochem. Soc. 1970, 117, 1097–1102. [Google Scholar] [CrossRef]
- Qian, X.; Dong, Z.; Jiang, B.; Lei, B.; Yang, H.; He, C.; Liu, L.; Wang, C.; Yuan, M.; Yang, H.; Yang, B.; Zheng, C.; Pan, F. Influence of alloying element segregation at grain boundary on the microstructure and mechanical properties of Mg-Zn alloy. Mater. Des. 2022, 224, 111322. [Google Scholar] [CrossRef]
- Soler, L.; Macanás, J.M.; Muñoz, M.; Casado, J. Aluminum and aluminum alloys as sources of hydrogen for fuel cell applications. J. Power Sources 2007, 169, 144–149. [Google Scholar] [CrossRef]
- Jeurgens, L.P.H.; Sloof, W.G.; Tichelaar, F.D.; Mittemeijer, E.J. Structure and morphology of aluminium–oxide films formed by thermal oxidation of aluminum. Thin Solid Films 2002, 418, 89–101. [Google Scholar] [CrossRef]
- Abdelghani-Idrissi, S.; Dubouis, N.; Grimaud, A.; Stevens, P.; Toussaint, G.; Colin, A. Effect of electrolyte flow on a gas evolution electrode. Sci. Rep. 2021, 11, 4677. [Google Scholar] [CrossRef] [PubMed]
- Urbonavicius, M.; Varnagiris, S.; Girdzevicius, D.; Milcius, D. Hydrogen generation based on aluminum–water reaction for fuel cell applications. Energy Procedia 2017, 128, 114–120. [Google Scholar] [CrossRef]
- González-Solórzano, M.G.; Morales, R.; Ávila, J.R.; Muñiz-Valdés, C.R.; Bastida, A.N. Alumina nucleation, growth kinetics, and morphology: A review. Steel Res. Int. 2023, 94, 2200678. [Google Scholar] [CrossRef]
- Aleksandrorov, Yu.A.; Tsyganova, E.I.; Pisarev, A.L. Reaction of aluminum with dilute aqueous NaOH solutions. Russ. J. Gen. Chem. 2003, 73, 689–694. [Google Scholar] [CrossRef]
- Poznyak, A.; Pligovka, A.; Turavets, U.; Norek, M. On-aluminum and barrier anodic oxide: Meeting the challenges of chemical dissolution rate in various acids and solutions. Coatings 2020, 10, 875. [Google Scholar] [CrossRef]
- Shmelev, V.; Nikolaev, V.; Lee, J.H.; Yim, C. Hydrogen production by reaction of aluminum with water. Int. J. Hydrogen Energy 2016, 41, 16664–16673. [Google Scholar] [CrossRef]
Figure 1.
Schematic representation of the experimental procedure: recycling and processing of aluminum cans (paint removal, melting at 700 °C, casting, grinding, and magnetic cleaning), followed by hydrogen production testing using 1.0 g of Al particles (180–250, 300–420, and 420–530 µm) reacted with 100 mL of 1.0 M NaOH in a sealed 250 mL flask connected to a flowmeter.
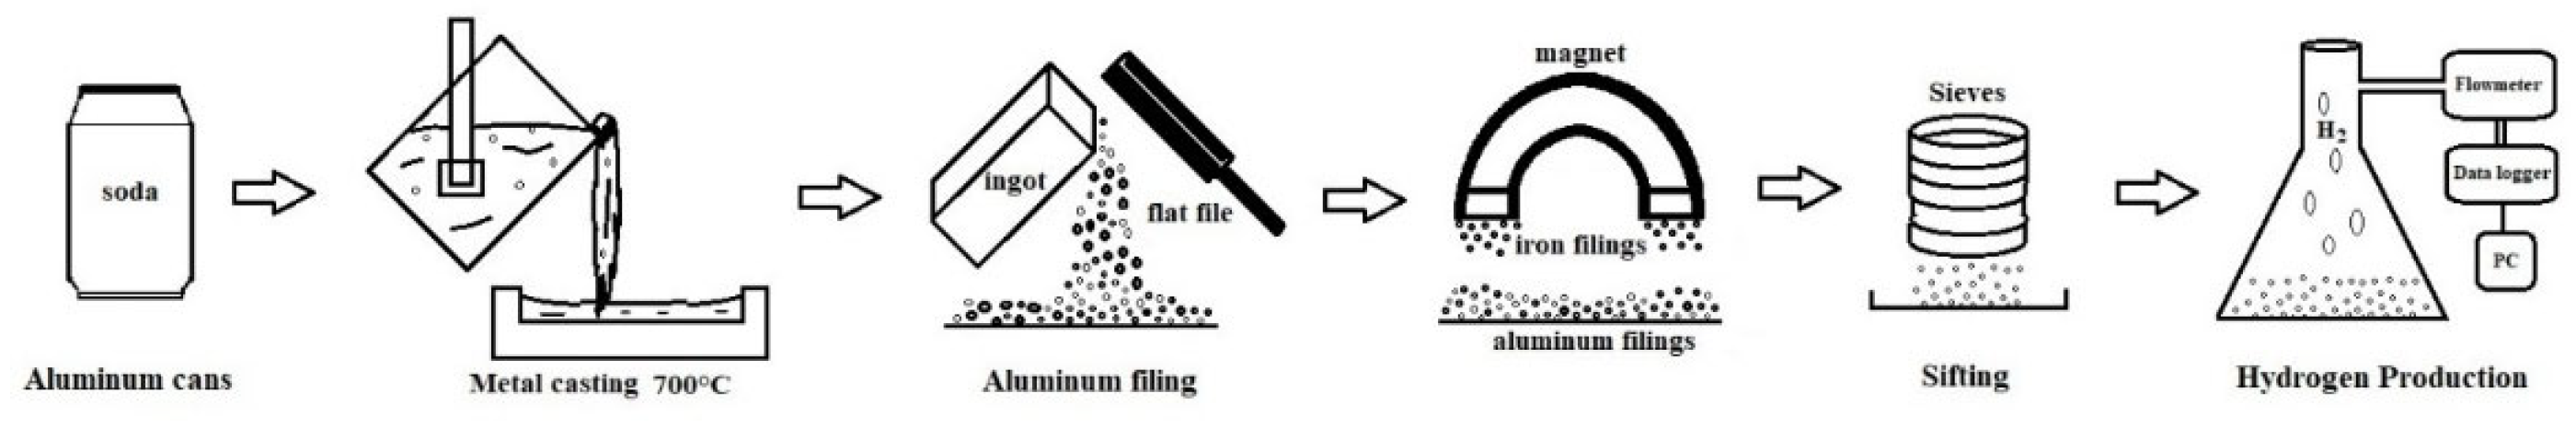
Figure 2.
Particle size distribution of sieved aluminum powders (mesh 50–100), highlighting the selected size ranges (180–250, 300–420, and 420–530 µm).
Figure 2.
Particle size distribution of sieved aluminum powders (mesh 50–100), highlighting the selected size ranges (180–250, 300–420, and 420–530 µm).
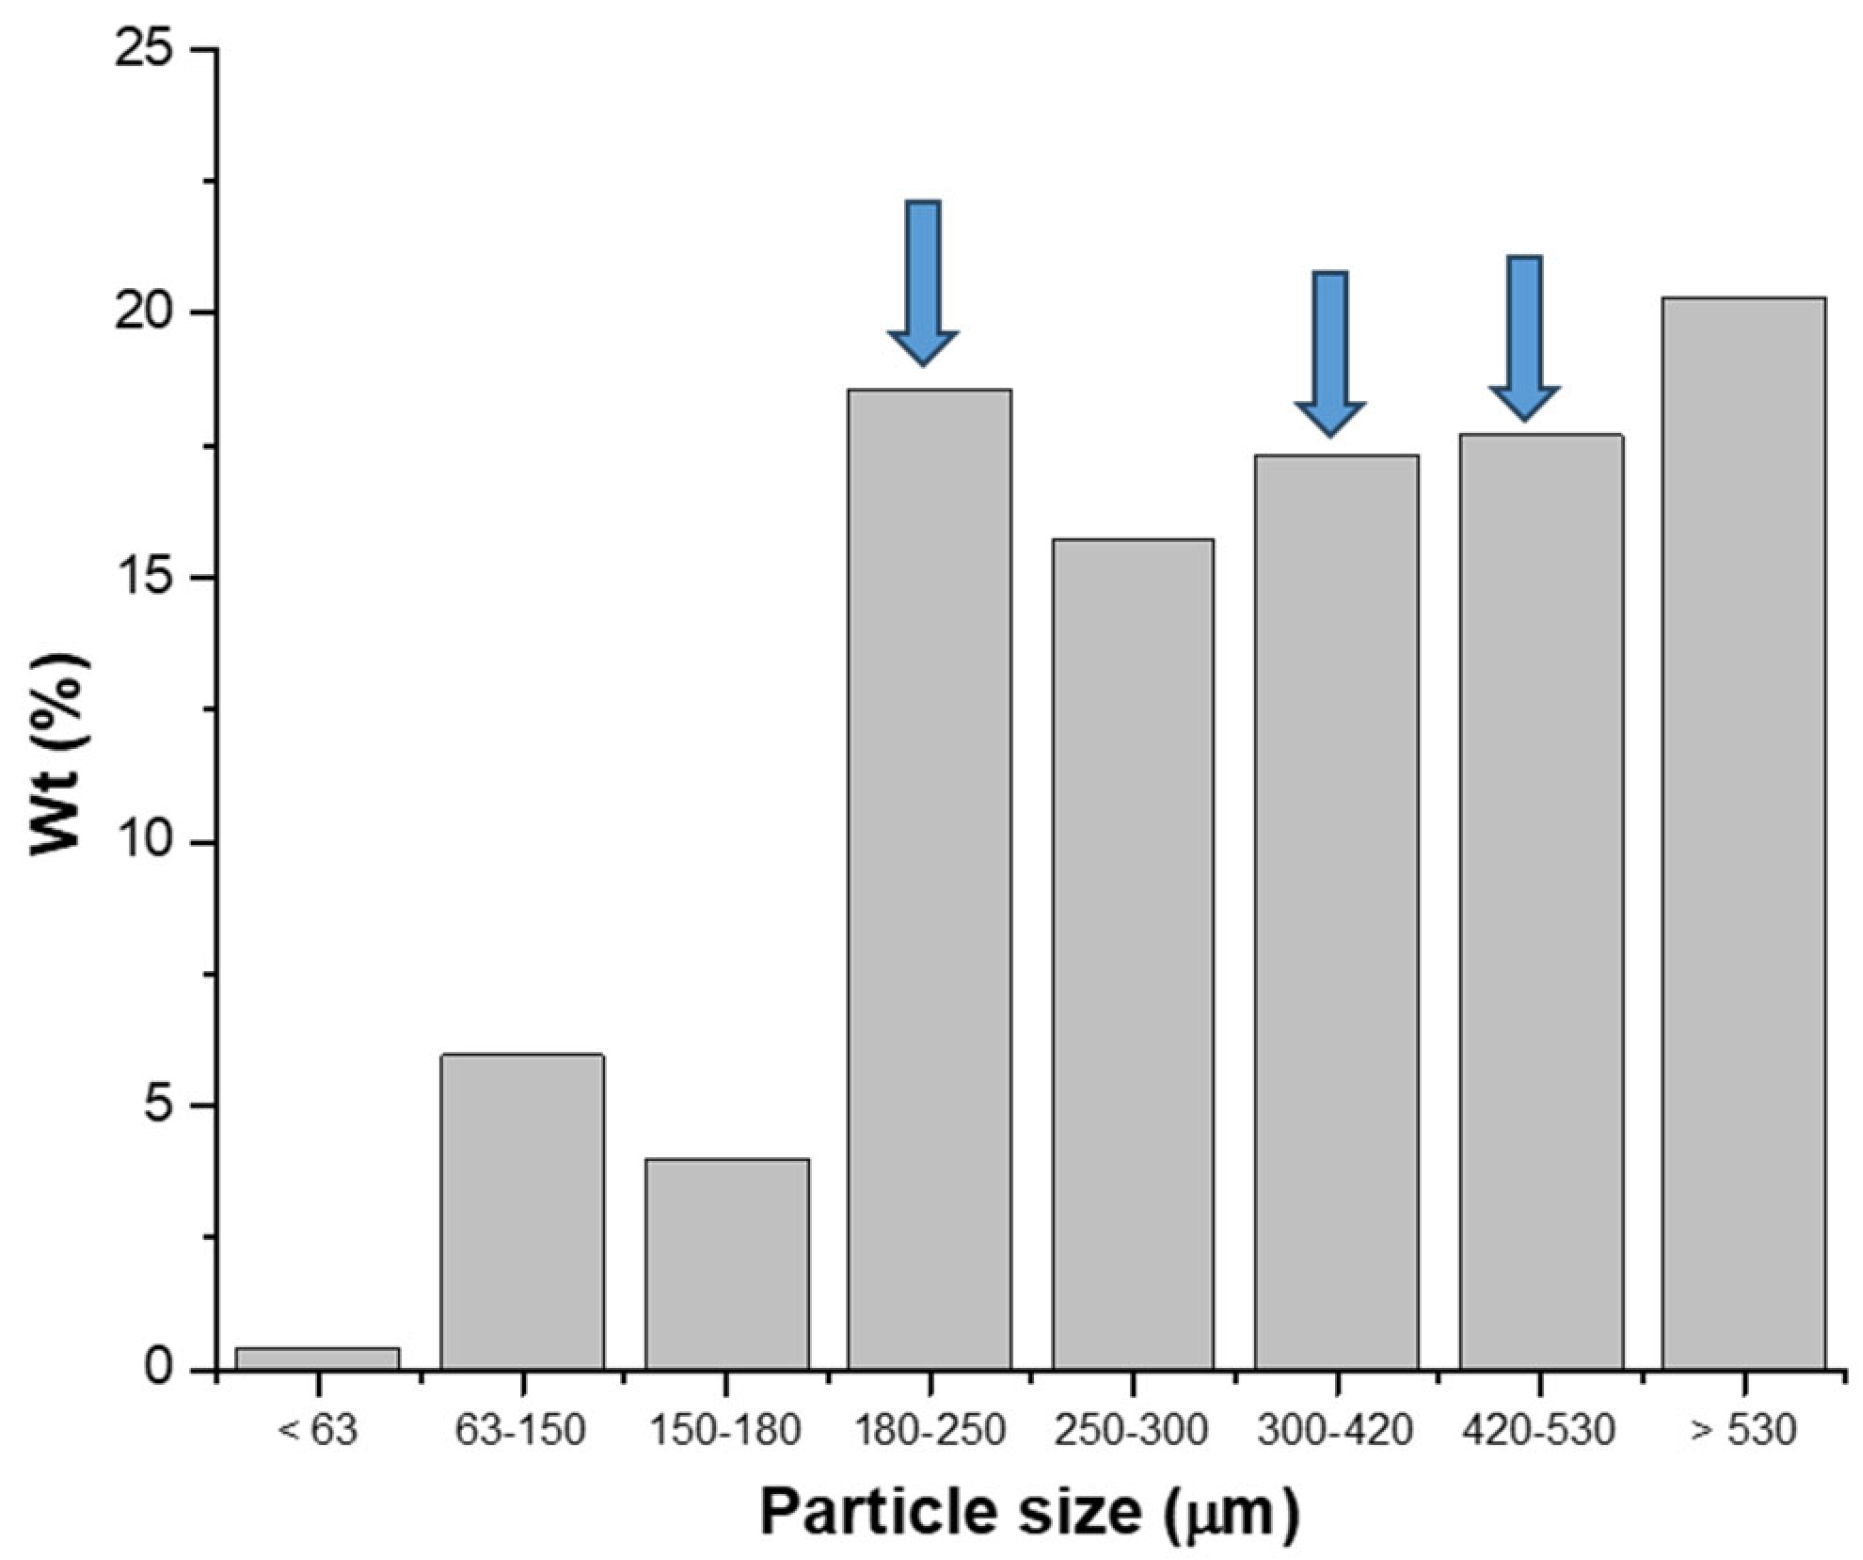
Figure 3.
Hydrogen flow rate versus time for particle sizes of a) 420–530 µm, b) 300–420 µm, and c) 180–250 µm.
Figure 3.
Hydrogen flow rate versus time for particle sizes of a) 420–530 µm, b) 300–420 µm, and c) 180–250 µm.
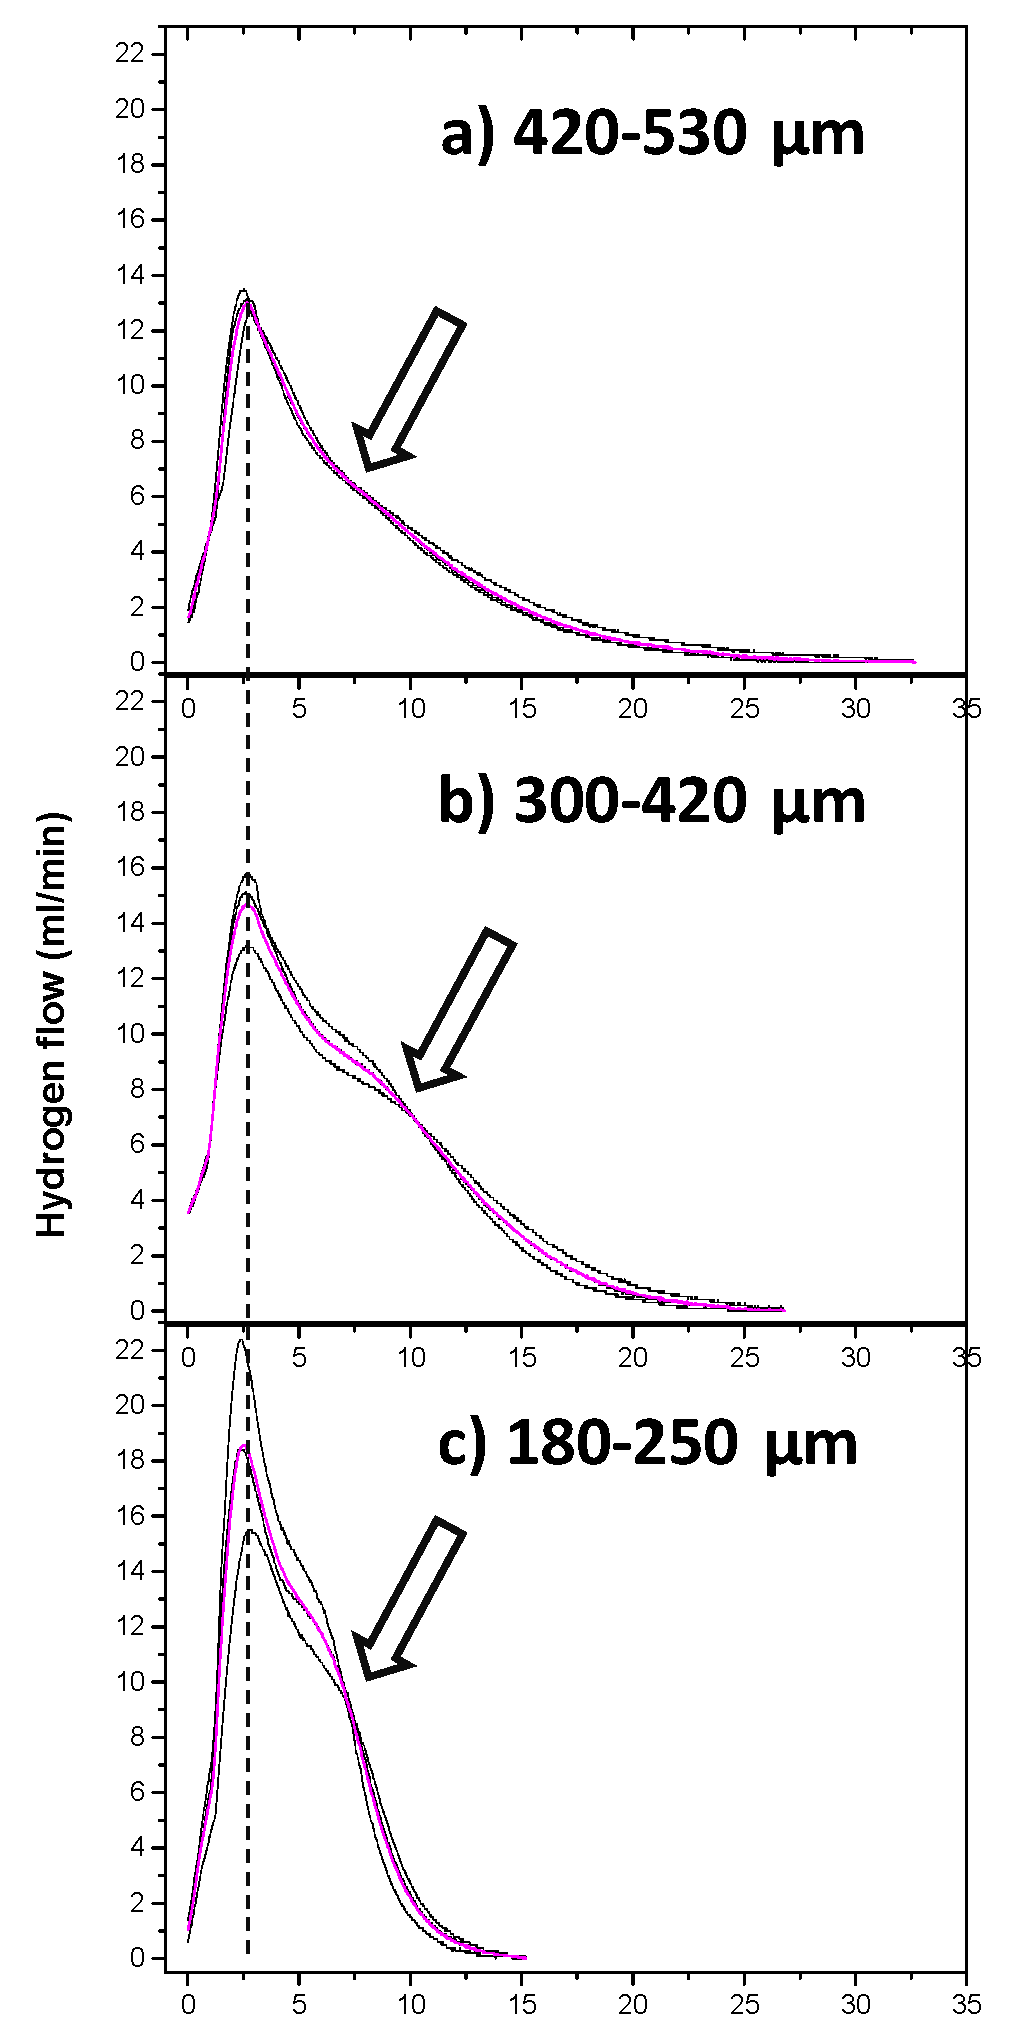
Figure 4.
a) Average hydrogen flow rate and b) cumulative volume versus time for different particle sizes.
Figure 4.
a) Average hydrogen flow rate and b) cumulative volume versus time for different particle sizes.
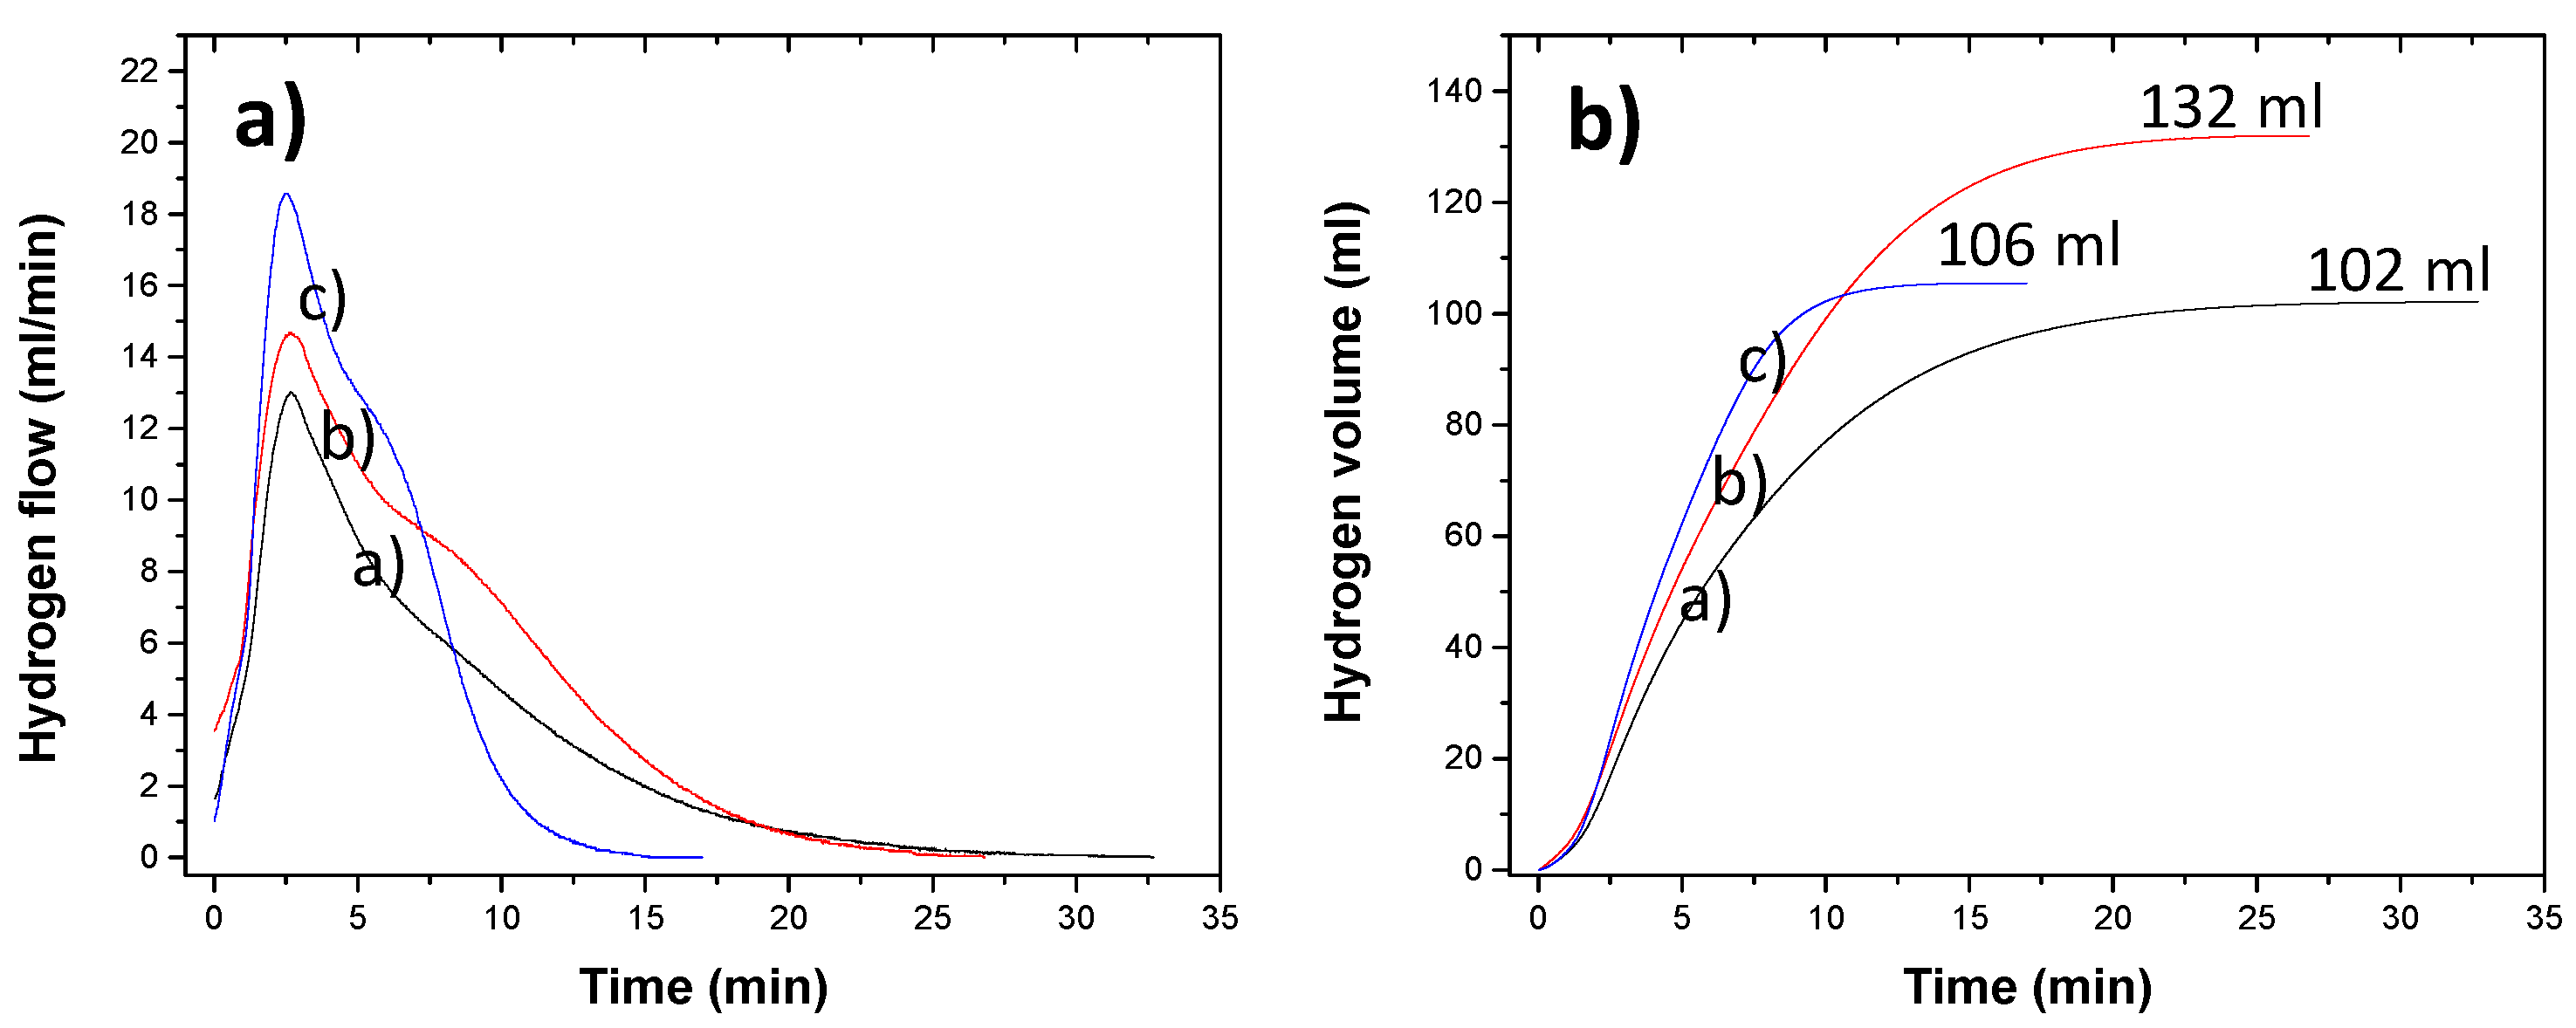
Figure 5.
SEM images of aluminum particles after NaOH reaction: (a) Al(OH)₃-coated particles; (b) 5000× magnification showing acicular Al(OH)₃ growth; EDS confirms alloying elements and oxidation.
Figure 5.
SEM images of aluminum particles after NaOH reaction: (a) Al(OH)₃-coated particles; (b) 5000× magnification showing acicular Al(OH)₃ growth; EDS confirms alloying elements and oxidation.
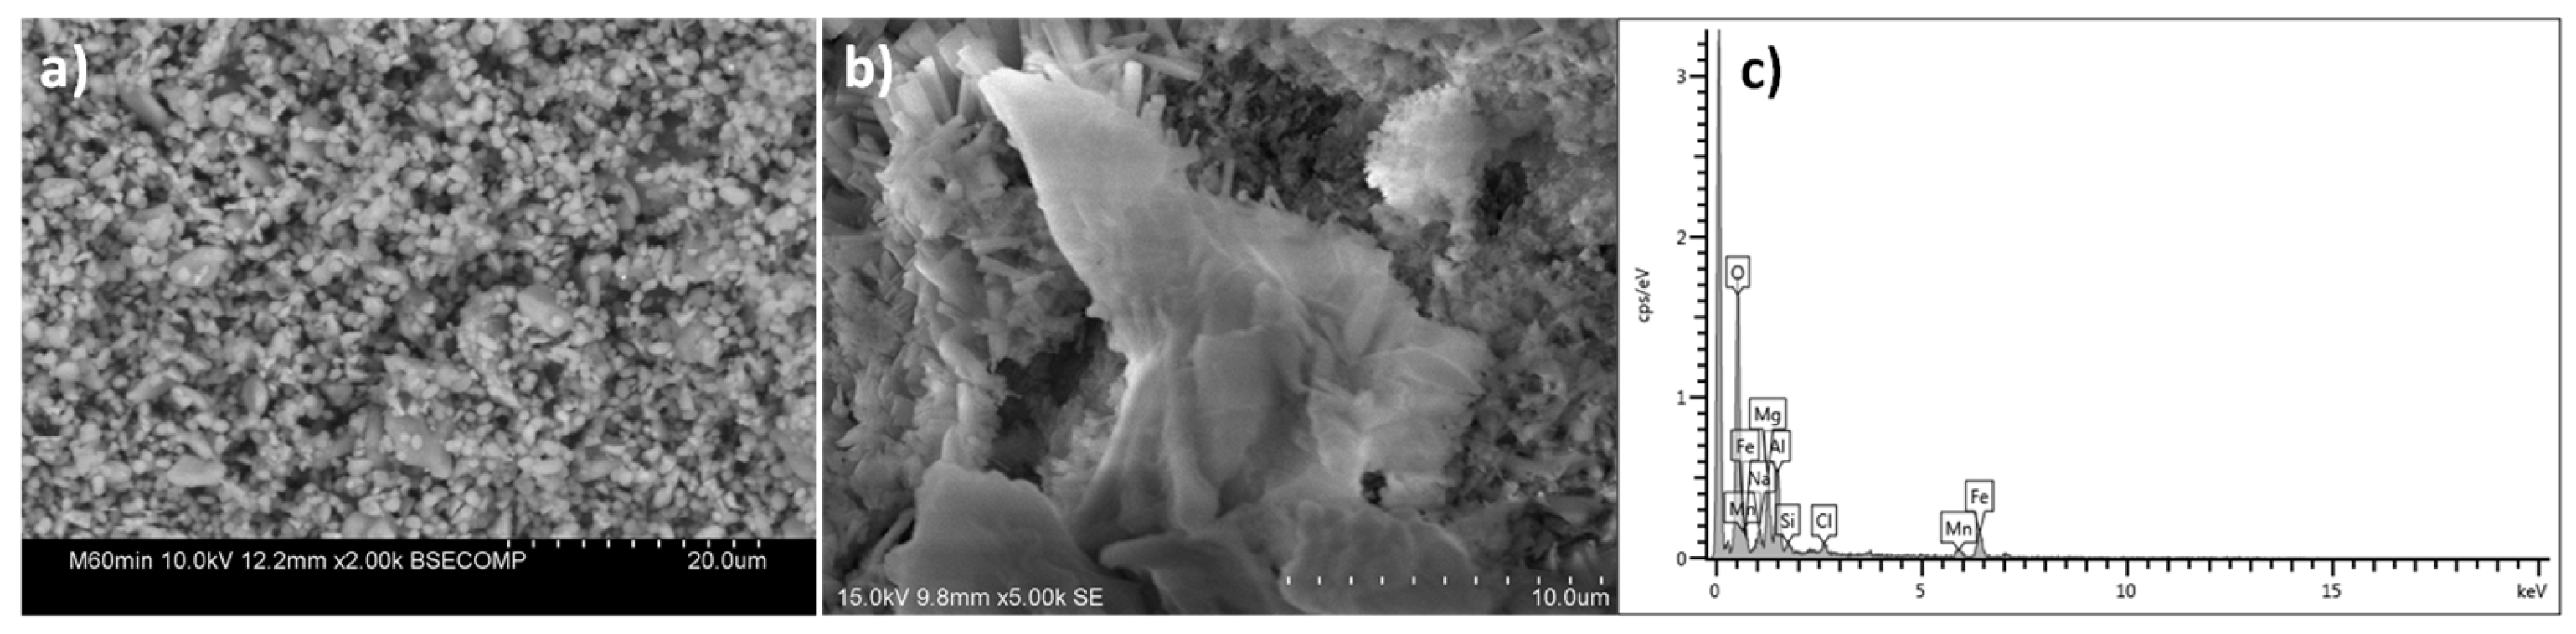
Figure 6.
XRD patterns of aluminum powders before (a) and after (b) reaction with NaOH solution.

| Alloy | Composition % Si Fe Cu Mn Mg Cr |
|---|---|
| AA 5182/H48 | Min 0.00 0.00 0.00 0.20 4.00 0.00 |
| (Beverage can lids) | Max 0.20 0.35 0.15 0.50 5.00 0.00 |
| AA 5042/H18 | Min 0.00 0.00 0.00 0.20 3.00 0.00 |
| (Beverage can tabs) | Max 0.20 0.35 0.15 0.50 4.00 0.10 |
| AA 3104/H19 | Min 0.00 0.00 0.05 0.80 0.80 0.00 |
| (Beverage can body) | Max 0.20 0.80 0.25 1.40 1.30 0.05 |
Disclaimer/Publisher’s Note: The statements, opinions and data contained in all publications are solely those of the individual author(s) and contributor(s) and not of MDPI and/or the editor(s). MDPI and/or the editor(s) disclaim responsibility for any injury to people or property resulting from any ideas, methods, instructions or products referred to in the content. |
© 2026 by the authors. Licensee MDPI, Basel, Switzerland. This article is an open access article distributed under the terms and conditions of the Creative Commons Attribution (CC BY) license (http://creativecommons.org/licenses/by/4.0/).
Copyright: This open access article is published under a Creative Commons CC BY 4.0 license, which permit the free download, distribution, and reuse, provided that the author and preprint are cited in any reuse.


