
Submitted:
13 February 2026
Posted:
14 February 2026
You are already at the latest version
Abstract
Vaccination represents the cornerstone of Newcastle disease control. Nanotechnology offers a promising approach to improve the effectiveness of DNA vaccines, supporting their use as an alternative to conventional platforms. Herein, the virulent Orthoavulavirus javaense (OAV-j) fusion (F) gene was cloned into a DNA expression plasmid (pDNA). After validating the constructed pDNA-F and confirming robust intracellular protein expression in vitro, three polymeric nanoparticles (NPs)–based formulations were generated using Chitosan (Cs), poly(lactic-co-glycolic) (PLGA), and poly(amidoamine) (PAMAM)-Dendrimers. Physicochemical and morphological analyses confirmed excellent formulation characteristics, including optimal nanoscale size, formulation-specific surface charge, and effective DNA–carrier interactions. Encapsulation/loading and release profiles further confirmed their successful preparation. In vivo experiments were conducted to assess the immunogenicity and protective efficacy of these formulations compared to naked pDNA-F using various administration routes. Following intramuscular administration, PAMAM-Dendrimers-pDNA-F demonstrated superior efficacy, with 100% survival, the highest post-challenge antibody titers, and a pronounced reduction in viral shedding. Moreover, intranasal administration of PLGA-NPs-pDNA-F demonstrated enhanced efficacy, with 90% survival. Interestingly, naked pDNA-F surpassed the Cs-NPs-pDNA-F in both immune response and clinical protection, with Cs-NPs-pDNA-F exhibiting the lowest overall performance. These findings underscore the importance of route-dependent formulation performance and demonstrate that a well-designed carrier significantly improves DNA vaccines effectiveness.
Keywords:
Newcastle disease (ND)
; Orthoavulavirus javaense (OAV-j)
; DNA vaccine
; nanoparticles-based delivery
; polymeric nanoparticles
; chitosan
; PLGA
; PAMAM-dendrimers
1. Introduction
The poultry industry strongly supports global food security, a central pillar of the One Health framework [1]. However, infectious viral diseases continue to threaten the sustainability of poultry production. Newcastle disease (ND) remains one of the most devastating viral diseases affecting both domestic and wild birds, causing significant economic losses and negatively impacting poultry production and international trade; moreover, it has a zoonotic potential [2,3,4,5]. ND is caused by Orthoavulavirus javaense (OAV-j), formerly known as Avian Orthoavulavirus 1 (AOAV-1) or Newcastle disease virus (NDV), a member of the family Paramyxoviridae. OAV-j is an enveloped virus with a non-segmented, negative-sense, single-stranded RNA genome that encodes six structural proteins: nucleoprotein [N], phosphoprotein [P], matrix protein [M], fusion protein [F], hemagglutinin-neuraminidase [HN], and large polymerase protein [L], and two non-structural proteins (V and W) [6,7]. HN and F are the major envelope glycoproteins that play critical roles in viral-cell interactions and in determining strain virulence [8]. F protein is a type 1 glycoprotein responsible for membrane fusion after receptor binding is mediated by OAV-j HN protein [9]. Its functional domains, particularly the fusion peptide and heptad repeats, are the mechanical engines driving the transition from pre- to post-fusion state [8,10]. Antibodies targeting the F protein neutralize the virus by physically blocking these domains, thereby preventing membrane fusion and genome delivery into the host cell. Consequently, an effective anti-F immune response is the most critical factor in mitigating mortality and suppressing viral shedding [11].
Alongside strict biosecurity measures, vaccination represents the cornerstone of effective control against ND. Traditional live and inactivated vaccines are widely used in the commercial poultry sector; however, several limitations compromise their availability and field effectiveness, particularly in low and middle-income countries. These constraints include, but are not limited to, production and supply challenges, high costs, and limited adaptability to the rapid evolution of circulating strains [12,13,14,15,16,17]. Molecular-based vaccines, particularly DNA vaccines, offer a promising alternative to the conventional vaccination platforms. DNA vaccines are developed by inserting a gene encoding immunodominant antigen(s) into a eukaryotic expression plasmid (pDNA). Upon delivery into host cells, the encoded antigen is de novo expressed intracellularly, allowing for correct protein folding, natural post-translational modifications, and efficient processing and presentation via both major histocompatibility complex pathways. DNA vaccines also provide practical advantages, including favorable safety profiles, relatively low production costs, and the use of established manufacturing platforms that can be rapidly adapted to emerging variants. Additionally, the final product is relatively stable, facilitating storage and distribution without stringent cold-chain requirements [18,19,20,21].
Despite these advantages, several obstacles hinder the clinical translation and widespread commercial application of DNA vaccines in the poultry industry. The immunogenicity of naked pDNA is often suboptimal, primarily due to inefficient cellular uptake and low antigen expression levels [22]. Furthermore, conventional intramuscular administration mainly induces systemic immune responses. It is also generally insufficient to elicit robust mucosal immunity, which is essential for protection against pathogens, including OAV-j that initiate infection at respiratory mucosal surfaces [23,24]. These limitations highlight the need for strategies that enhance DNA vaccine delivery and biological performance, shifting research efforts toward the development of more effective delivery systems that improve cellular uptake, antigen expression, and mucosal immune activation [25].
Advances in nanotechnology have provided promising platforms for the efficient delivery of DNA vaccines. Nanoparticle-based carriers can protect pDNA from premature extracellular degradation, enhance cellular uptake, and improve intracellular delivery, thereby increasing antigen expression [26,27]. These improvements are often reflected in enhanced immunogenicity and protective efficacy in vivo [26,27]. A wide range of polymeric nanoparticle delivery systems has been explored for DNA vaccine applications. Among these, natural linear polymers, such as chitosan, synthetic linear polymers, such as poly(lactic-co-glycolic) acid (PLGA), and branched polymeric architectures, such as poly(amidoamine) (PAMAM) dendrimers, have attracted scientific attention. Each of these platforms offers distinct advantages in DNA concentration, protection, cellular interactions, and intracellular trafficking, which are critical determinants of immunogenicity and in vivo vaccine performance [28,29,30].
Therefore, various polymeric nanoparticles were used in this study to formulate pDNA-F vaccines, which demonstrated variable effectiveness compared with the naked pDNA-F vaccine. Notably, PAMAM-Dendrimers nanoparticles demonstrated superior efficacy following intramuscular administration, while PLGA nanoparticles yielded the most favorable results when administered intranasally. Interestingly, naked pDNA-F surpassed the chitosan-pDNA-F formulation in both immune response and clinical protection. These results highlight the significance of route-dependent formulation performance and indicate that nanotechnology can both improve and impair the effectiveness of DNA vaccines.
2. Materials and Methods
2.1. Cells and Viruses
Chicken fibroblast (DF-1) cells were maintained in Dulbecco’s modified Eagle medium (DMEM) supplemented with 5% fetal bovine serum (FBS) and 1X antibiotic-antimycotic solution (Thermo Fisher Scientific, Waltham, MA) at 37°C in a humidified 5% CO2 incubator. The Egyptian OAV-j isolate (Genbank accession no: F19753D) served as the template for F-gene amplification to generate the transgene and was subsequently used as a challenge virus in the animal experiment. The titer of the challenge virus was determined in 9–11-day-old specific-pathogen-free (SPF) embryonated chicken eggs. Briefly, ten-fold serial dilutions of the virus stock were inoculated via the allantoic cavity, and embryo mortality was recorded daily for 5 days. The virus titer was calculated using the Reed and Muench method and expressed as the 50% egg infectious dose (EID₅₀) per 0.2 mL [31]. The challenge dose used in the animal experiment was standardized to 105.5 EID₅₀ per bird [32].
2.2. Construction of OAV-j F Gene Expression Cassette
Viral RNA was extracted from virus-containing allantoic fluid using QIAamp Viral RNA Mini Kit (Qiagen, Germantown, MD) according to the manufacturer’s protocol. First-strand cDNA synthesis was carried out using RevertAid First Strand cDNA Synthesis Kit (ThermoFisher Scientific, USA) and random hexamer primers. The full-length F- gene of -OAV-j was amplified using gene-specific primers modified to include SacI and SmaI restriction sites (MB-OAV-j-F: 5’-TTCGAGCTCGCCACCATGGGCTCCAAACCTTCTACC-3’ and MB-OAV-j-R: 5’-TCCCCCGGGTGCTCTCGTGGTGGCTCTC-3’). PCR amplification was performed with Phusion High-Fidelity Master Mix (Thermo Fisher Scientific) according to the manufacturer’s guidelines. Thermal cycling conditions included an initial denaturation at 95°C for 5 min, 35 cycles of 95°C for 10 sec, 54°C for 30 sec, and 72°C for 120 sec, and a final extension at 72°C for 10 min. The product was visualized on 1% agarose gel, and the specific band was excised and purified using the GeneJET Gel Extraction Kit (Thermo Fisher Scientific). The concentration and purity of the purified product were measured on a NanoDropTM spectrophotometer (Thermo Fisher Scientific).
The purified PCR product of the F gene was digested with SacI and SmaI and inserted into the pCAGGS-FLAG-COOH expression plasmid. The pCAGGS vector is driven by the CAG promoter complex, which combines the chicken β-actin promoter with a cytomegalovirus (CMV) enhancer to facilitate robust ectopic expression [33]. Successful cloning was first verified by restriction digestion with the same enzymes and colony PCR using gene-specific primers. In addition, Sanger sequencing with gene-specific primers confirmed successful integration of the F gene. To further validate the entire construct, the recombinant plasmid was analyzed by next-generation sequencing (NGS).
2.3. In Vitro Expression of the Recombinant F Protein
2.3.1. Indirect Immunofluorescent Assay
DF-1 cells were seeded onto sterile glass coverslips in 24-well tissue culture plates and incubated overnight at 37°C in a humid chamber. Cells at 70-90% confluency were transfected with the pDNA-F (500 ng per well) with Lipofectamine 3000™ (Thermo Fisher Scientific), according to the manufacturer’s guidelines. Control wells were transfected with the empty pCAGGS vector. After incubation at 37°C for 24 h, cells were fixed with 4% paraformaldehyde for 1 h and permeabilized with 0.1% Triton X-100 for 10 min. To block non-specific binding, samples were treated with 0.5% bovine serum albumin (BSA) for 1 h at room temperature. Coverslips were then incubated with rabbit anti-FLAG primary antibody (1:1000) for 1 h at 37 °C, followed by three PBS washes, then incubated with Alexa Fluor 488–conjugated anti-rabbit IgG secondary antibody (1:2000) for 1 h at 37 °C. After three additional PBS washes, coverslips were mounted in 50% glycerol medium. Fluorescence was observed under an inverted Olympus IX81 microscope equipped with Alexa Fluor 488 excitation and emission filters.
2.3.2. Western Immunoblotting
DF-1 cells were seeded in 6-well tissue culture plates and similarly transfected with pDNA-F (2000 ng per well) using Lipofectamine 3000™ (Thermo Fisher Scientific), according to the manufacturer’s guidelines. After 48 h, cells were washed twice with ice-cold PBS, detached with trypsin, and pelleted by centrifugation at 10,000 x g for 30 min at 4°C. Pellets were resuspended and lysed on ice for 30 min in NP-40 lysis buffer (Thermo Fisher Scientific) containing protease inhibitors (Thermo Fisher Scientific), and then clarified by centrifugation at 14,000 rpm for 15 min at 4 °C. Protein concentrations were determined, and equal amounts of lysate were mixed with Laemmli loading buffer, denatured by heating, and separated by SDS-PAGE. Proteins were transferred to a nitrocellulose membrane by wet transfer and blocked with 5 % non-fat dry milk in PBS-Tween (PBST) for 1 h at room temperature. Membranes were incubated overnight at 4°C with rabbit anti-FLAG primary antibody (1:1000), washed three times in PBST, and incubated for 2 h at room temperature with HRP-conjugated anti-rabbit IgG secondary antibody (1:2000). To confirm equal loading, membranes were reprobed with mouse anti-β-actin primary antibody followed by HRP-conjugated anti-mouse IgG. Positive reactions were developed with a chemiluminescent substrate (Thermo Fisher Scientific) and visualized using a ChemiDoc imaging system (Bio-Rad, Hercules, CA).
2.4. Scaling-up and Purification of pDNA-F
Following confirmation of cloning and in vitro expression, pDNA-F was amplified in TOP10 E. coli (Thermo Fisher Scientific) and then purified using QIAGEN® Plasmid Maxi Kit (Qiagen) according to the manufacturer’s instructions. Plasmid concentration and purity were assessed using NanoDrop™ spectrophotometer, and only preparations with A₂₆₀/A₂₈₀ ratios of 1.8–2.0 were used. The purified endotoxin-free pDNA-F was employed for nanoparticle-based formulations and in vivo immunization studies.
2.5. Preparation of Nanoparticle-Based DNA Vaccine Formulations
2.5.1. Preparation of Chitosan Nanoparticles (Cs NPs) – Based pDNA-F Vaccine
Cs NPs loaded with pDNA-F (Cs-NPs-pDNA-F) were prepared using the ionic gelation method under mild conditions. A 0.3% (w/v) chitosan solution was prepared by dissolving medium molecular weight chitosan (75% degree of deacetylation; Sigma-Aldrich, St. Louis, MO) in 1% (v/v) analytical-grade acetic acid (Sigma-Aldrich) and stirring overnight at room temperature (25 ± 0.5 °C) until complete dissolution. The pH of the solution was adjusted to 5.5 using 1N sodium hydroxide (Sigma-Aldrich) to optimize interaction with pDNA-F. Separately, pDNA-F was diluted to a concentration of 0.5 µg/mL using PBS (pH 7.4; Thermo Fisher Scientific). Nanoparticles were formed by mixing equal volumes of Cs solution and pDNA-F solution at an optimized N/P ratio of 3:1 (the molar ratio of amino groups (N) in chitosan to phosphate groups (P) in DNA). The mixture was stirred continuously for 1 h at room temperature (25 ± 0.5 °C) to facilitate interactions between Cs and DNA. To ensure uniform nanoparticle formation, the solution was vortexed for 30 s at 2500 rpm. The nanoparticle suspension was centrifuged at 14,000 rpm for 15 min at 4°C, and the pellet was washed three times with PBS (pH 7.4) to remove unbound DNA and impurities [34,35]. The prepared nanoparticles were freeze-dried and stored at 4°C until use.
2.5.2. Preparation of PLGA Nanoparticles (PLGA NPs) - Based pDNA-F Vaccine
PLGA NPs loaded with pDNA-F (PLGA-NPs-pDNA-F) were prepared using the double emulsion-solvent evaporation method [36]. First, an organic phase was prepared by dissolving PLGA (50:50, 40–75 kDa; Sigma-Aldrich) at a concentration of 30 mg/mL in dichloromethane (DCM; Thermo Fisher Scientific). Separately, the aqueous phase containing pDNA-F was prepared at a concentration of 0.5 µg/mL in deionized water. To form the primary emulsion (water-in-oil), 2 mL of the aqueous phase was added to 4 mL of the organic phase and sonicated using a probe sonicator at 50 W for 30 s. The primary emulsion was then added dropwise to 10 mL of a 2% (w/v) poly(vinyl alcohol) solution (PVA, 30–70 kDa; Thermo Fisher Scientific) to form a double emulsion (water-in-oil-in-water). This mixture was sonicated again at 50 W for 60 s to stabilize the emulsion. The resulting double emulsion was stirred at room temperature for 6 h to allow complete evaporation of DCM, resulting in the formation of PLGA NPs. The nanoparticles were collected by centrifugation at 15,000 rpm for 15 min at 4°C. The pellet was washed three times with deionized water to remove residual PVA and unencapsulated pDNA-F. The purified nanoparticles were lyophilized and stored at −20°C until use [37].
2.5.3. Preparation of PAMAM Dendrimers–Based pDNA-F Vaccine
PAMAM G5 dendrimers-loaded pDNA-F (PAMAM-Dendrimers-pDNA-F) were prepared using a self-assembly process based on electrostatic interactions between the cationic dendrimers and the anionic pDNA backbone. A stock solution of generation 5 PAMAM dendrimers (molecular weight: 28,826 Da, diameter: 5.4 nm, 128 surface amine groups; Sigma-Aldrich, St. Louis, MO, USA, Cat. No. 412368) was prepared by diluting the commercial 5% (w/v) methanolic solution 1:10 (v/v) in sterile 20 mM HEPES buffer (pH 7.4, filtered through 0.22 µm PES membrane) and subsequent removal of methanol by rotary evaporation at 40°C under reduced pressure (100 mbar) for 30 min, followed by gentle nitrogen gas flushing for 10 min to ensure complete organic solvent elimination. The final dendrimer concentration was adjusted to 1.0 mg/mL (34.7 µM) in HEPES buffer, and the solution was stored at 4°C for no longer than 2 weeks prior to use. The pDNA-F was diluted to 100 µg/mL in 10 mM HEPES buffer (pH 7.4, A260/A280 ratio 1.80–2.00). Nanoparticle formation was initiated by adding the PAMAM G5 dendrimers solution dropwise (10 µL per 30 s interval) to an equal volume of pDNA solution under gentle vortex mixing at 400 rpm using a Vortex-Genie 2 mixer (Scientific Industries, Bohemia, NY, USA) to achieve a final nitrogen-to-phosphate (N/P) ratio of 10:1, calculated as the molar ratio of nitrogen atoms (N) present in the 128 amine groups of the G5 PAMAM dendrimer to the phosphate groups (P) in the pDNA backbone (2 phosphate groups per base pair, average molecular weight 660 Da per base pair). Following the addition of the dendrimer solution, the mixture was immediately vortexed for 30 s at maximum speed, then incubated at room temperature (25 ± 1°C) without agitation for 30 min to allow complete electrostatic self-assembly and formation of stable, compact nanoparticles. The resulting nanoparticle suspension was then centrifuged at 3,000 rpm (1,200 × g) for 5 min at 4°C to remove any large aggregates, and the supernatant was collected. For all subsequent experiments, the final pDNA concentration within the nanoparticle formulation was adjusted to 50 µg/mL using 10 mM HEPES buffer (pH 7.4).
2.6. Physicochemical Characterization of Nanoparticles
2.6.1. Hydrodynamic Size, Polydispersity Index, and Zeta Potential Analysis
The hydrodynamic diameter, polydispersity index (PDI), and zeta potential of the nanoparticles were determined using Zetasizer Nano ZS (Malvern, UK) at 25°C. Samples were dispersed in deionized water prior to analysis. Measurements were performed in triplicate, and the obtained data were used to evaluate particle size distribution, homogeneity, and surface charge characteristics.
2.6.2. Scanning Electron Microscopy (SEM)
The surface morphology of nanoparticles was examined using SEM. Samples were analyzed using Philips XL30 SEM (Philips, Netherlands) to evaluate particle shape, surface topography, and morphological characteristics.
2.6.3. Fourier Transform Infrared (FTIR) Spectroscopy
Fourier-transform infrared (FTIR) spectra were recorded in the range of 4000–400 cm⁻¹ using Vertex 70 FTIR spectrometer (Bruker, Germany). Samples were prepared as potassium bromide pellets prior to analysis. The spectra were acquired at a resolution of 1 cm⁻¹, and each spectrum represented the average of three consecutive scans. FTIR analysis was performed to identify the characteristic functional groups and to confirm molecular interactions within the samples.
2.6.4. Entrapment Efficiency (EE%) and Loading Capacity (LC%)
The entrapment efficiency (EE%) and loading capacity (LC%) of nanoparticles loaded with pDNA were determined using NanoDrop spectrophotometry. Briefly, 1 mg of nanoparticles was dispersed in 100 µL of 0.1 N HCl to ensure complete release of the encapsulated DNA. The suspension was vortexed briefly and centrifuged at 15,000 rpm for 15 min to remove insoluble materials. A 1 µL aliquot of the supernatant was analyzed using a NanoDrop spectrophotometer, and the absorbance was measured at 260 nm. DNA concentration was automatically calculated by the NanoDrop software based on the Beer–Lambert law. To determine entrapment efficiency, the concentration of free (non-encapsulated) pDNA-F in the supernatant collected during nanoparticle preparation was measured separately. The EE% and LC% were calculated using the following equations:
EE% = [(Total pDNA added − Free pDNA)/Total p.DNA added] × 100
LC% = [Encapsulated pDNA/Weight of nanoparticles] × 100
All measurements were performed in triplicate to ensure accuracy and reproducibility.
2.7. In Vitro DNA Release Study
The in vitro release profile of pDNA-F from the prepared nanoparticles was evaluated under physiological conditions. Briefly, 10 mg of p-DNA-F–loaded nanoparticles were dispersed in 1 mL of PBS, pH 7.4, optionally supplemented with 0.02% (w/v) sodium azide to prevent microbial growth. The dispersion was transferred to microcentrifuge tubes and incubated at 37°C with gentle agitation (100 rpm) to simulate physiological conditions. At predetermined time intervals (0, 0.5, 1, 2, 4, 8, 12, 24, 48, and 72 h), samples were centrifuged at 15,000 rpm for 15 min to sediment the nanoparticles. A 100 µL aliquot of the supernatant was carefully collected and immediately replaced with an equal volume of fresh, pre-warmed release medium to maintain sink conditions. Collected supernatants were stored at 4 °C until further analysis.
The amount of released pDNA-F was quantified using a NanoDropTM spectrophotometer by measuring absorbance at 260 nm. A 1 µL aliquot of each sample was loaded onto the NanoDrop pedestal, and DNA concentration was automatically calculated using the Beer–Lambert equation. The cumulative percentage of DNA release was calculated using the following equation:
where mᵢ represents the mass of pDNA-F released at each sampling time point (corrected for dilution), and m₍encapsulated₎ denotes the total amount of DNA initially entrapped within the nanoparticles. All experiments were performed in triplicate.
2.8. In Vivo Evaluation of DNA Vaccine Formulations
2.8.1. Experimental Animal Groups and Vaccination Protocol
One-day-old broiler chicks were maintained in controlled experimental facilities until 11 days of age. At that time, birds were randomly divided into 10 groups (10 birds each). Eight groups were immunized with one of the four pDNA-F-Nanoparticle formulations, including Cs-NPs-pDNA-F, PLGA-NPs-pDNA-F, PAMAM-Dendrimers-pDNA-F, and Naked pDNA-F (delivered either intranasally (IN, 4 groups) or intramuscularly (IM, 4 groups). The two remaining groups served as controls: non-vaccinated and challenged group (Group 1), while the other remained non-vaccinated and unchallenged (Group 2; Table 1). DNA vaccination was performed twice, at 11 and 21 days of age, with each bird receiving 40 µg of pDNA-F per dose.
2.8.2. Serological Evaluation of Humoral Immunity
To evaluate humoral immune responses, Serum samples were collected on days 1 and 11 of age to assess maternally derived antibody (MDA) levels and their decline. Sera collected on days 21, 28, and 35 were used to evaluate post-vaccination antibody responses. Sera collected on day 42 were used to assess post-challenge antibody titers. At each time point, serum samples were collected from five birds per group. Antibodies against OAV-j F protein were quantified using an NDV-F indirect ELISA kit (BioChek BV, Netherlands), according to the manufacturer’s instructions.
2.8.3. Evaluation of Protective Efficacy
On day 35, all groups except group 10 were intranasally challenged with 0.2 mL of a virulent OAV-j genotype VII Egyptian strain at a dose of 105.5 EID₅₀/0.2 mL. Birds were monitored twice daily for clinical signs and mortality. Cloacal swabs were collected on days 3, 5, and 7 post-challenge to assess viral shedding using RT-qPCR targeting the F gene (HERA RT-qPCR kit with custom primers and probe, according to the manufacturer’s instructions).
2.9. Statistical Analysis
Unpaired Student’s T-test was used to compare between IN and IM groups for each preparation. One-way analysis of variance (ANOVA) followed by Dunnett’s multiple comparison test was applied in multiple group comparisons for a single factor. p-values were calculated using GraphPad Prism 8 (GraphPad Software, USA; www.graphpad.com). Data are presented as the means of three independent biological replicates with standard deviation (SD). Statistical significance was denoted as follows: ns, not significant (p > 0.05); p < 0.01; *p < 0.001; **p < 0.001; ***p < 0.0001.
3. Results
3.1. Generation of pDNA-F and Characterization of the Recombinant F Protein
Full-length fusion (F) gene of the Egyptian OAV-j was amplified using gene-specific primers modified to include SacI and SmaI restriction sites to insert it into pCAGGS-FLAG-COOH expression plasmid (Figure 1A). Double enzymatic digestion of pDNA-F using SacI and SmaI generated two fragments of the expected sizes—approximately 4.7 kb for the pCAGGS-FLAG-COOH backbone and 1.7 kb for the full-length F insert (Figure 1B). In contrast, the empty plasmid showed only a single band. Colony PCR using gene-specific primers also generated the expected full-length F amplicon (~1.7 kb) in all positive clones (data not shown). Complete plasmid sequencing using NGS further verified that the F gene was inserted in the correct orientation and was free of mutations, confirming full integrity of the recombinant construct.
Chicken DF1 cell line transfected with pDNA-F exhibited strong cytoplasmic green fluorescence. In contrast, mock-transfected cells and cells transfected with empty pCAGGS control showed negligible background fluorescence (Figure 1C), confirming successful expression of the recombinant FLAG-tagged-F protein. Western blot analysis demonstrated robust expression of the FLAG-tagged F protein, revealing bands at approximately 63 kDa (F0 precursor) and 48 kDa (F1 cleavage product) in pDNA-F-transfected cell lysates. As expected, specific bands were not detected in either the empty vector or the non-transfected control cells. β-actin (~42 kDa) was readily detected in all samples, confirming equal protein loading (Figure 1D). These findings collectively indicated successful construction and expression of the recombinant pDNA-F plasmid.
3.2. Physicochemical Characterization of the pDNA-F–Loaded Nanoparticles
3.2.1. Hydrodynamic Size, Polydispersity Index (PDI), and Zeta Potential
The physicochemical properties of pDNA-F–loaded nanoparticles are summarized in Table 2. Dynamic light scattering analysis revealed significant differences in particle size among the three formulations. PAMAM-Dendrimers-pDNA-F exhibited the smallest mean hydrodynamic diameter, followed by Cs-NPs-pDNA-F, while PLGA-NPs-pDNA-F showed the largest particle size. Moreover, all formulations demonstrated relatively narrow size distributions, as indicated by low PDI values. PAMAM-Dendrimers-pDNA-F showed the lowest PDI, indicating the highest degree of homogeneity, followed by Cs-NPs-pDNA-F and PLGA-NPs-pDNA-F. Furthermore, zeta potential measurements revealed distinct surface charge characteristics among the formulations. Both PAMAM-Dendrimers-pDNA-F and Cs-NPs-pDNA-F exhibited positive surface charges. In contrast, PLGA-NPs-pDNA-F displayed a negative zeta potential value (Table 2). These differences are consistent with the intrinsic chemical properties of the carrier materials and may influence nanoparticle stability and cellular interaction.
3.2.2. Scanning Electron Microscopy (SEM)
SEM analysis revealed distinct surface morphologies among the three nanoparticle formulations (Figure 2A-C). PLGA-NPs-pDNA-F consisted predominantly of discrete, relatively uniform, spherical nanoparticles with smooth surfaces and good dispersion, although minor aggregation was observed. The estimated particle diameters ranged from 50 to 100 nm. In contrast, Cs-NPs-pDNA-F exhibited a markedly different morphology, characterized by heterogeneous, irregularly shaped particles with rough surface texture. Extensive aggregation was evident, with the formation of larger micron-sized clusters composed of smaller submicron and nanoscale primary particles. The overall structure appeared less defined and more crystalline or flake-like compared with PLGA-NPs-pDNA-F. PAMAM-Dendrimers pDNA-F displayed a unique morphology, characterized by a highly porous and interconnected three-dimensional network. Rather than discrete nanoparticles, the formulation exhibited elongated, rod-like, or fibrous structures fused to form a complex web-like architecture.
3.2.3. Fourier Transform Infrared (FTIR) Analysis
FTIR spectra confirmed the successful formation of pDNA-F-loaded nanoparticles using three different nanocarriers (Chitosan, PLGA, and PAMAM-Dendrimers) and revealed carrier-specific spectral features consistent with DNA association (Figure 2D). For Cs-NPs-pDNA-F, the spectrum exhibited a broad and intense band in the 3600–3000 cm⁻¹ region, corresponding to overlapping O–H and N–H stretching vibrations, indicative of a highly hydrogen-bonded and hydrated structure. Prominent amide bands were observed, including amide I (1620–1650 cm⁻¹) and amide II/N–H bending (1550–1590 cm⁻¹), in addition to characteristic polysaccharide backbone vibrations in the 1150–1000 cm⁻¹ region (C–O–C and C–O stretching). Notably, alteration of the N–H bending band around 1550 cm⁻¹ was observed, supporting the involvement of chitosan amine groups in the complexation with pDNA-F.
PLGA-NPs-pDNA-F spectrum was dominated by a strong ester carbonyl (C=O) stretching band at approximately 1750 cm⁻¹, confirming the presence of the PLGA matrix. A broad C–O stretching envelope was also observed in the 1250–1050 cm⁻¹ region. Within this region, the intense polymer absorptions masked the weaker phosphate-associated DNA bands (typically observed near 1240 and 1080 cm⁻¹), which is consistent with the relatively low spectral contribution of entrapped pDNA-F compared with the polymer signal.
For PAMAM-Dendrimers-pDNA-F, characteristic dendrimer-associated bands were evident, including N–H stretching near 3290 cm⁻¹ and distinct amide I and amide II bands at approximately 1650 cm⁻¹ and 1550 cm⁻¹, respectively. In addition, a complex and intense absorption pattern was observed in the 1300–900 cm⁻¹ fingerprint region, attributable to overlapping dendrimer internal vibrations and DNA phosphate backbone stretching modes. Collectively, the FTIR profiles verified the successful formulation with preserved carrier-specific signatures alongside spectral changes consistent with pDNA-F association and complex formation.
3.2.4. Entrapment Efficiency (EE%) and Loading Capacity (LC%)
The entrapment efficiency (EE%) and loading capacity (LC%) of pDNA-F varied among the three nanoparticle formulations. PAMAM-Dendrimers-pDNA-F exhibited the highest EE% (95.2 ± 1.8%), indicating highly efficient complexation/entrapment of pDNA-F during nanoparticle formation. This value was higher than those obtained for the Cs-NPs-pDNA-F (82.53 ± 1.2%) and PLGA-NPs-pDNA-F (80.5 ± 2.1%). In contrast, PAMAM-Dendrimers-pDNA-F displayed the lowest LC% (4.8 ± 0.6%), reflecting the relatively low proportion of pDNA-F mass relative to the total nanoparticle mass. Cs-NPs-pDNA-F achieved the highest LC% (18.2 ± 2.5%), suggesting a greater capacity of the chitosan matrix to accommodate pDNA-F. PLGA-NPs-pDNA-F showed an intermediate LC% (12.78 ± 1.5%). Overall, an inverse trend was observed between EE% and LC% across the formulations, whereby PAMAM-Dendrimers-pDNA-F achieved maximal entrapment efficiency but minimal loading capacity, whereas Cs-NPs-pDNA-F exhibited the highest loading capacity with slightly lower, though still high, entrapment efficiency.
3.2.5. In Vitro Release of pDNA-F DNA from Nanoparticles
As shown in Figure 2 E, all nanoparticle formulations exhibited a time-dependent increase in cumulative DNA release, with distinct release profiles depending on the carrier system. Cs-NPs-pDNA-F demonstrated a sustained release pattern, with cumulative release increasing from 1.4% at 0.5 h to 93.76% at 72 h. PLGA-NPs-pDNA-F showed a slower and more controlled release, reaching 70.28% at 72 h (0.47% at 0.5 h). In contrast, PAMAM-Dendrimers-pDNA-F exhibited a more rapid initial release, reaching 59.14% by 12 h, and achieving 89.82% cumulative release at 72 h.
To further elucidate the release mechanisms, kinetic modeling was performed using zero-order, first-order, Higuchi, and Korsmeyer–Peppas models (Table 3). Cs-NPs-pDNA-F showed the strongest agreement with the Higuchi diffusion model (R² = 0.9842) and excellent fitting to the Korsmeyer–Peppas model during the early release phase (R² = 0.9914, n = 1.0307), suggesting a diffusion-dominated release mechanism. PLGA-NPs-pDNA-F exhibited an excellent fit to the zero-order model (R² = 0.9911), indicating a near-constant release rate, and demonstrated high correlation with first-order (R² = 0.9679) and Higuchi (R² = 0.9560) models. For PAMAM-Dendrimers-pDNA-F, the best fit during the early phase was observed with the Korsmeyer–Peppas model (R² = 0.9945, n = 0.8877), while the overall release profile was best described by the first-order model (R² = 0.9466). In contrast, fitting to the zero-order model was comparatively weak (R² = 0.7443). Collectively, these findings indicate that the three delivery systems exhibit distinct release behaviors, with sustained diffusion-controlled release for Cs-NPs-pDNA-F, near zero-order kinetics for PLGA-NPs-pDNA-F, and rapid initial release followed by concentration-dependent release for PAMAM-Dendrimers-pDNA-F.
3.3. Robust Humoral Immune Responses Elicited by PAMAM-Dendrimers-pDNA-F
Serological monitoring revealed a characteristic decline in maternally derived antibodies (MDA) during the first three weeks. At 1 and 11 days of age, prior to group allocation and vaccination (Figure 3A and B), the flock exhibited high baseline MDA levels (GMT = [20557] and [6836], respectively). By day 21, titers across all groups continued to wane as anticipated. Although this sampling point occurred 10 days after the initial vaccination, the detected titers were consistent with the natural decay of maternal immunity and did not indicate a vaccine-induced humoral response. Notably, no active humoral response was detected at 28 or 35 days of age, and antibody titers in all experimental groups remained below the assay positivity threshold (Figure 3B).
After challenge, consistent with the induction of an anamnestic humoral response, antibody titers increased dramatically in the challenged groups, with substantial differences observed between experimental groups (Figure 3C). Regarding intramuscular groups, the PAMAM-Dendrimers-pDNA-F group showed the highest post-challenge GMT, followed by naked pDNA-F and PLGA-NPs-pDNA-F groups, whereas the Cs-NPs-pDNA-F group exhibited the lowest GMT. Moderate GMTs were observed in intranasal groups. The non-vaccinated-challenged control group developed only low antibody titers, while the non-vaccinated-unchallenged control group remained seronegative throughout the experimental period.
3.4. PAMAM-Dendrimers-pDNA-F Exhibits Potent Protective Efficacy Against Virulent Challenge
The protective efficacy of the different pDNA-F formulations against the virulent OAV-j challenge is illustrated by the Kaplan–Meier survival curves (Figure 4A), with overall survival rates summarized in Table 1. As expected, the non-vaccinated, challenged control group exhibited 100% mortality by 8 dpc, with deaths began at 2 dpc, confirming the virulence of the challenge strain, while the non-vaccinated, unchallenged control group showed 100% survival throughout the observation period. PAMAM-Dendrimers-pDNA-F IM group showed complete protection, with 100% survival throughout the observation period. PLGA-NPs-pDNA-F IN group showed 90% survival, with a single mortality recorded at 6 days post-challenge (dpc). Intermediate protection was observed in naked pDNA-F IM (70% survival) and naked pDNA-F IN (50% survival) groups. PLGA-NPs-pDNA-F IM and PAMAM-Dendrimers-pDNA-F IN groups each showed 50% survival. In contrast, Cs-NPs-pDNA-F showed the lowest survival rates, with 30% survival (IN) and 20% survival (IM).
Viral shedding was also quantified by RT-qPCR and expressed as equivalent log₁₀ EID₅₀/ml using a standard curve generated from ten-fold serial dilutions of a quantified virus standard (Ct = −3.345 × log₁₀[EID₅₀] + 41.52; R² = 0.9869), as indicated earlier [38]. The non-vaccinated, challenged control group exhibited sustained high-level viral shedding (approximately 5.18 log₁₀ EID₅₀/mL) throughout the study, confirming the robustness of the challenge model and supporting the subsequent reductions in viral shedding. The efficacy of the formulations in reducing viral shedding varied according to both the nanoparticle carrier and the route of administration (Figure 4B). PAMAM-Dendrimers-pDNA-F IM group showed the most pronounced reduction in viral shedding, maintaining viral titers at its lowest across all time points. Viral loads declined from 3.92 log₁₀ EID₅₀/mL at 3 dpc to 2.13 log₁₀ EID₅₀/mL by 7 dpc. In contrast, PAMAM-Dendrimers-pDNA-F IN group exhibited higher viral titers during the early phase (3 dpc), followed by a marked decline toward the end of the observation period. Cs-NPs-pDNA-F and PLGA-NPs-pDNA-F produced moderate reductions in viral shedding compared with the control challenged group. Notably, vaccination with naked pDNA-F (both IN and IM ) provided limited control of viral replication, with viral titers remaining above 4.0 log₁₀ EID₅₀/mL at 7 dpc.
4. Discussion
Developing an effective DNA vaccine against infectious viral diseases requires optimization at various stages, from precise genetic engineering to overcoming biological barriers. This study followed a thorough research process, starting with generating an OAV-j F gene expression cassette (pDNA-F), then functional validation of transgene expression in an avian cell line. Thereafter, three nanoparticle-based delivery systems—Chitosan, PLGA, and PAMAM-Dendrimers—were formulated and evaluated to enhance the efficacy of the pDNA-F vaccine candidate. By comparing these formulations with naked pDNA-F administered via both intramuscular and intranasal routes, we aim to understand how vaccine design, nanocarrier properties, and delivery strategy collectively influence immunogenicity and protective efficacy.
Clear cytoplasmic expression of the F protein in transfected DF-1 cells, indicated effective transcription and translation of the transgene (Figure 1C). Western blot analysis further validated functionality by confirming the presence of the cleaved F-1 subunit (Figure 1D), which provided evidence that pDNA-F–expressed protein undergoes authentic post-translational maturation necessary to elicit a protective immune response [39,40].
Nevertheless, the efficacy of a DNA vaccine is determined not only by transgene competence but also by the efficiency with which the genetic cargo is protected, internalized, and presented to the host immune system [41]. Therefore, we utilized three nanoparticle-based delivery systems: Chitosan, PLGA, and PAMAM Dendrimers, to overcome physiological obstacles that hinder the efficacy of pDNA in its naked form.
The efficacy of the delivery systems is fundamentally governed by the physicochemical properties of the carrier, specifically its size, size distribution, and surface charge, which dictate stability, cellular interactions, and immunogenicity [42]. All three formulations exhibit sizes within the optimal range (100–300 nm) for uptake by antigen-presenting cells (APCs) [43]. Measuring 120 ± 10.2 nm, PAMAM-Dendrimers were the smallest across all formulations, providing a distinct advantage in cellular internalization and tissue penetration [44]. Furthermore, the low PDI values (0.24) across all systems confirm a monodisperse population, which is crucial for reproducible in vivo performance [45]. Moreover, PAMAM-Dendrimers showed the greatest homogeneity, exhibiting the lowest PDI (0.16 ± 0.03). Surface charge, indicated by Zeta Potential, is a critical determinant of colloidal stability and cellular interaction. Both PAMAM-Dendrimers (+45.3 ± 3.5 mV) and Chitosan (+32.5 ± 2.8 mV) formulations were highly cationic, ensuring both high colloidal stability and a strong electrostatic affinity for the negatively charged host cell membranes, which are critical for enhancing cellular adhesion and subsequent endosomal uptake of the DNA payload [25,46]. In contrast, the PLGA formulation demonstrated a negative Zeta Potential of -21.8 ± 1.9 mV. This anionic characteristic is primarily attributed to the terminal carboxylic acid groups on the PLGA polyester backbone. While this charge provides moderate colloidal stability, it is a well-documented limitation of PLGA systems, as it may reduce initial cellular uptake efficiency due to electrostatic repulsion from the negatively charged sialic acid residues on host cell membranes [47].
Morphological assessment by SEM (Figure 2A-C) revealed that PAMAM-Dendrimers-pDNA-F exhibited an interconnected, web-like network characteristic of high-generation dendriplexes [48], which efficiently condenses the DNA into a compact state, shielding it from enzymatic degradation while maximizing the surface area available for membrane interaction. PLGA-NPs-pDNA-F was observed as spherical nanoparticles with smooth surfaces, suggesting that DNA is predominantly entrapped within the hydrophobic core rather than adsorbed to the surface. Cs-NPs-pDNA-F exhibited irregular, aggregated structures rather than the uniform spheres observed in PLGA. While individual particles are on the nanoscale, their tendency to form larger clusters can significantly alter their in- vivo behavior. The FTIR spectra (Figure 2D) validated the successful preparation of all three formulations and revealed that chitosan and PAMAM dendrimers primarily electrostatically complexed pDNA-F, whereas PLGA nanoparticles predominantly physically encapsulated pDNA-F.
The observed inverse relationship between encapsulation efficiency (EE%) and loading capacity (LC%) among the three formulations was a critical finding. For PAMAM-Dendrimers, while their structural precision facilitated the highest encapsulation efficiency (95.2 ± 1.8%), it inherently limited the total mass incorporation, resulting in the lowest loading capacity (4.8 ± 0.6%) of the three systems. For PLGA, while it achieved a substantial loading capacity, it exhibited the lowest encapsulation efficiency (80.5 ± 2.1%). This finding is a frequent challenge in emulsion-based methods, where water-soluble DNA can escape into the external aqueous phase [49,50]. Regarding Chitosan, its less-structured, porous matrix achieved the highest loading capacity (18.2 ± 2.5%) among all tested systems, suggesting that the natural polysaccharide's architecture can accommodate a greater mass of DNA payload than that of synthetic polymers.
The three delivery systems exhibited distinct release behaviors, rationalized by their drug–carrier association mechanisms (Figure 2E). The release dynamics of PAMAM-Dendrimers-pDNA-F were uniquely suited for rapid immune priming. High early release (59.14% by 12 h) was observed, consistent with the reversible nature of electrostatic polyplex systems. PLGA-NPs-pDNA-F demonstrated controlled, sustained release kinetics, achieving 70.28% at 72 h. PLGA’s slower release provides a depot-like effect, delivering DNA over a longer window, a strategy often used to prolong antigen availability and potentially reduce the need for frequent boosting [51,52]. Cs-NPs-pDNA-F demonstrated an intermediate release profile, achieving 93.76% at 72 h. Korsmeyer–Peppas modeling indicated distinct release mechanisms among formulations. PAMAM-Dendrimers-pDNA-F showed anomalous transport (n = 0.88), reflecting combined diffusion and polyplex dissociation. In contrast, Chitosan (n = 1.0307) and PLGA (n = 1.0209) exhibited Super Case II transport, with release dominated by polymer relaxation/swelling followed by erosion [53,54,55].
The in vivo performance of the naked pDNA-F groups served as a baseline for evaluating whether nanoparticle use enhances or hinders candidate vaccine efficacy. Consistent with the other formulations in the study, post-vaccination ELISA titers remained below detection limits (Figure 3B), a characteristic frequently observed with DNA vaccines that prioritize cellular immunity and immunological memory [56,57]. The formulations effectively ‘primed’ the avian immune system. The impact of this priming was most evident following the challenge. The naked pDNA-F IM group exhibited a pronounced anamnestic response, recording the second-highest post-challenge antibody titers among all experimental groups, surpassed only by the PAMAM-Dendrimers-pDNA-F IM group (Figure 3C). Naked pDNA-F provided 70% survival via the intramuscular (IM) route and 50% survival via the intranasal (IN) route, consistent with earlier reports of partial protection by naked DNA vaccines against Newcastle disease in chickens [58,59]. The moderate survival observed in pDNA-F groups suggested that, at the concentration used, sufficient pDNA-F reached the myocytes or local APCs before being completely degraded by extracellular enzymes. However, the instability of naked DNA is well documented, and without a protective carrier, the genetic payload is highly susceptible to rapid enzymatic degradation by interstitial DNases. This hypothesis leads to suboptimal gene expression and failure to achieve the protective efficacy (≥90%) required [25].
PAMAM-Dendrimers-pDNA-F IM group exhibited a distinct anamnestic response, with antibody titers surging faster and more vigorously than in other groups, suggesting a potent candidate (Figure 3C). This rapid reactivation of memory cells translated into superior clinical outcomes, including the highest survival rate (100%) and a profound reduction in viral shedding (a 1,000-fold decrease compared to the control-challenged group at 7 days post-challenge) (Figure 4B). However, the efficacy was notably attenuated via the intranasal (IN) route. The high cationic charge (+45.3 mV) of the dendriplexes likely facilitated electrostatic entrapment within the respiratory mucus. The strong attraction between the positive terminal amines of the dendrimer and the negatively charged sialic acid residues of the mucin glycoproteins creates a "mucus trap" [60,61], which significantly hinders the diffusion of the polyplexes toward the underlying target epithelium [62]. This immobilization is a well-documented phenomenon in which cationic nanoparticles become physically and electrostatically tethered to the mucin fiber network, preventing them from reaching the mucosal-associated lymphoid tissues (MALT) [63]. As a result, while surface charge is a primary driver for cellular uptake once at the cell membrane, it acts as a significant barrier during the initial mucosal transit.
The in vivo performance of PLGA-NPs-pDNA-F provided a compelling contrast between administration routes, with a clear difference in survival rate: the IN group achieved 90% survival, a level of protection significantly higher than that of the IM group, which showed only 50% survival. Unlike the cationic dendrimers that are susceptible to "mucus trapping," the anionic PLGA particles likely experienced less electrostatic interference with the respiratory mucus, allowing for better diffusion and interaction with the Nasal-Associated Lymphoid Tissue (NALT) [62,63]. However, an anionic charge, which is advantageous for mucosal delivery, may limit uptake in muscle tissue [64]. The PLGA groups exhibited a slight anamnestic response post-challenge, with very low post-challenge GMTs compared with those of the dendrimer–IM group (Figure 3C). Despite this very low level, the high survival rate, especially in the intranasal group, highlights the critical contribution of mucosal and cell-mediated immunity [65,66].
Cs-NPs-pDNA-F demonstrated the lowest performance in the animal trial. Although the onset of mortality was slightly delayed compared to the non-vaccinated, challenged control group (Figure 4A), the overall survival rate was very low. The irregular aggregation observed in the SEM analysis may have reduced the cellular uptake of the DNA. Larger clusters are less efficient at penetrating tissues or being internalized by APCs than the smaller, discrete particles in the PAMAM-Dendrimers (120 nm) or PLGA (255 nm) groups, contributing to the lowest overall performance [67]. Intramuscularly, the high hydration and swelling of chitosan (as reflected in the 93.76% release) may have led to premature DNA release, exposing it to extracellular DNases before it could be internalized by cells [68]. Intranasally, chitosan's strong cationic charge and muco-adhesion likely tethered the particles to mucin glycoproteins in the respiratory mucus, preventing the DNA from diffusing toward the target NALT [60,61].
Comparison of naked pDNA-F with nanoparticle-based formulations reveals a distinct carrier-dependent impact on the vaccine performance. The use of PAMAM-Dendrimers successfully elevated IM protection from 70% to 100%, while PLGA elevated IN protection from 50% to 90%. This finding confirms that selecting a well-engineered carrier, along with the appropriate administration route, is essential for achieving optimal DNA vaccine potency. Conversely, Cs-NPs-pDNA-F was less effective than naked DNA, with survival rates dropping to 20–30%. This data suggests that an inappropriate carrier can be more detrimental than providing no carrier at all. The naked pDNA-F, being smaller and naturally anionic, likely diffused through the respiratory mucus or muscle tissue more effectively than the large, "trapped" chitosan clusters formed under the present formulation conditions.
Although the current study demonstrates notable findings, it also has some limitations that highlight opportunities for further experimental refinement. The current experimental design included multiple formulations, routes, and outcome measures, which inevitably limit the depth of optimization achievable for each variable. Future studies would benefit from a more focused experimental design, allowing for deeper optimization of specific platforms based on the performance trends identified here. Moreover, although the pDNA-F dose used for vaccination falls within the accepted range for experimental DNA vaccines, it is near the lower end of commonly reported concentrations [69,70,71,72], which also may explain the absence of detectable systemic antibody titers prior to challenge. Further dose-optimization studies are warranted to define the minimum effective dose and to maximize immunogenicity without compromising safety or cost-effectiveness. Finally, this study primarily assessed humoral immunity and clinical protection. However, particularly for intranasal vaccination, protection may be partially mediated by mucosal IgA responses and cell-mediated immunity, which were not addressed here. Incorporating assays for mucosal antibodies (e.g., tracheal wash sIgA) and cellular immune responses (e.g., Interferon-gamma quantification) would provide a more comprehensive understanding of the underlying protective mechanisms.
Author Contributions
Conceptualization: A.K and H.A.; methodology, A.K., M.B., and Z.E.; investigation, A.K., M.B., Z.E., and B.A.; formal analysis and data curation, A.K., M.B., and Z.E., and B.A.; visualization, A.K., M.B., Z.E.; writing—original draft preparation, A.K.; writing—review and editing, A.K., M.B., Z.E., B.A. and H.A.; resources, B.A. and H.A.; supervision, H.A. and B.A.; funding acquisition, A.K., and H.A. All authors have read and agreed to the submitted version of the manuscript.
Funding
This study is supported by the Science, Technology & Innovation Funding Authority (STDF) under grant No.: 48789.
Institutional Review Board Statement
All animal procedures were conducted in accordance with international standards for the care and use of laboratory animals and were approved by the Institutional Animal Care and Use Committee at Cairo University (approval number CU-II-F-2-25). All efforts were made to reduce the number of animals used and to minimize animal discomfort.
Informed Consent Statement
Not applicable.
Data Availability Statement
Not applicable.
Acknowledgments
The authors sincerely thank staff members of the Virology, Biochemistry and Molecular Biology, and Poultry Diseases Departments, Faculty of Veterinary Medicine, Cairo University, for their scientific support, access to laboratory facilities, valuable discussions, and constructive feedback throughout this work. The authors also thank Yasmin Abo-Zeid (Department of Pharmaceutics and Industrial Pharmacy, Faculty of Pharmacy, Helwan University, Cairo 11795, Egypt) for her scientific support.
Conflicts of Interest
The authors declare no conflicts of interest.
Abbreviations
| ND | Newcastle disease |
| OAV-j | Orthoavulavirus javaense |
| F | Fusion |
| pDNA | Plasmid DNA |
| NPs | Nanoparticles |
| Cs | Chitosan |
| PLGA | Poly (lactic-co-glycolic acid) |
| PAMAM | Poly(amidoamine) |
| DLS | Dynamic light scattering |
| PDI | Polydispersity index |
| SEM | Scanning Electron Microscopy |
| FTIR | Fourier-transform infrared spectroscopy |
| IFA | Indirect immunofluorescence assay |
| WB | Western blot |
| ELISA | Enzyme-Linked Immunosorbent Assay |
| GMT | Geometric mean titer |
| RT-qPCR | Reverse Transcription quantitative Polymerase Chain Reaction |
| Ct | Cycle threshold |
| EID₅₀ | 50% Egg Infectious Dose |
| Dpc | Day post challenge |
References
- Vlaicu, PA; Untea, AE; Oancea, AG. Sustainable Poultry Feeding Strategies for Achieving Zero Hunger and Enhancing Food Quality. Agriculture 2024, 14(10), 1811. [Google Scholar] [CrossRef]
- ALEXANDER, DJ. Newcastle disease and other avian paramyxovirus. Revue Scientifique et Technique de l’OIE 2000, 19(2), 443–62. [Google Scholar] [CrossRef] [PubMed]
- Cattoli, G; Susta, L; Terregino, C; Brown, C. Newcastle disease. Journal of Veterinary Diagnostic Investigation 2011, 23(4), 637–56. [Google Scholar] [CrossRef] [PubMed]
- Abd Elfatah, KS; Elabasy, MA; El-khyate, F; Elmahallawy, EK; Mosad, SM; El-Gohary, FA; et al. Molecular Characterization of Velogenic Newcastle Disease Virus (Sub-Genotype VII.1.1) from Wild Birds, with Assessment of Its Pathogenicity in Susceptible Chickens. Animals 2021, 11(2), 505. [Google Scholar] [CrossRef]
- Ul-Rahman, A; Ishaq, HM; Raza, MA; Shabbir, MZ. Zoonotic potential of Newcastle disease virus: Old and novel perspectives related to public health. Rev Med Virol 2022, 32(1). [Google Scholar] [CrossRef]
- Yusoff, K; Tan, WS. Newcastle disease virus: Macromolecules and opportunities. Avian Pathology 2001, 30(5), 439–55. [Google Scholar] [CrossRef]
- Kolakofsky, D; Roux, L; Garcin, D; Ruigrok, RWH. Paramyxovirus mRNA editing, the ‘rule of six’ and error catastrophe: a hypothesis. Journal of General Virology 2005, 86(7), 1869–77. [Google Scholar] [CrossRef]
- Chen, L; Gorman, JJ; McKimm-Breschkin, J; Lawrence, LJ; Tulloch, PA; Smith, BJ; et al. The Structure of the Fusion Glycoprotein of Newcastle Disease Virus Suggests a Novel Paradigm for the Molecular Mechanism of Membrane Fusion. Structure 2001, 9(3), 255–66. [Google Scholar] [CrossRef]
- Pantua, H; McGinnes, LW; Leszyk, J; Morrison, TG. Characterization of an Alternate Form of Newcastle Disease Virus Fusion Protein. J Virol. 2005, 79(18), 11660–70. [Google Scholar] [CrossRef]
- Toyoda, T; Gotoh, B; Sakaguchi, T; Kida, H; Nagai, Y. Identification of amino acids relevant to three antigenic determinants on the fusion protein of Newcastle disease virus that are involved in fusion inhibition and neutralization. J Virol. 1988, 62(11), 4427–30. [Google Scholar] [CrossRef]
- Shi, B; Yang, G; Xiao, Y; Qian, K; Shao, H; Xu, M; et al. Long-Term Protection against Virulent Newcastle Disease Virus (NDV) in Chickens Immunized with a Single Dose of Recombinant Turkey Herpesvirus Expressing NDV F Protein. Vaccines (Basel) 2024, 12(6). [Google Scholar] [CrossRef]
- Food and Agriculture Organization of the United Nations. Newcastle disease and its control in village chickens; Rome, 2002. [Google Scholar]
- Dortmans, JCFM; Peeters, BPH; Koch, G. Newcastle disease virus outbreaks: Vaccine mismatch or inadequate application? Vet Microbiol 2012, 160(1–2), 17–22. [Google Scholar] [CrossRef]
- Dortmans, JCFM; Venema-Kemper, S; Peeters, BPH; Koch, G. Field vaccinated chickens with low antibody titres show equally insufficient protection against matching and non-matching genotypes of virulent Newcastle disease virus. Vet Microbiol 2014, 172(1–2), 100–7. [Google Scholar] [CrossRef] [PubMed]
- Liu, H; de Almeida, RS; Gil, P; Majó, N; Nofrarías, M; Briand, FX; et al. Can genotype mismatch really affect the level of protection conferred by Newcastle disease vaccines against heterologous virulent strains? Vaccine 2018, 36(27), 3917–25. [Google Scholar] [CrossRef] [PubMed]
- Miller, PJ; King, DJ; Afonso, CL; Suarez, DL. Antigenic differences among Newcastle disease virus strains of different genotypes used in vaccine formulation affect viral shedding after a virulent challenge. Vaccine 2007, 25(41), 7238–46. [Google Scholar] [CrossRef] [PubMed]
- Hu, Z; He, X; Deng, J; Hu, J; Liu, X. Current situation and future direction of Newcastle disease vaccines; Veterinary research. NLM (Medline), 2022; Vol. 53, p. 99. [Google Scholar]
- Bolhassani, A; Yazdi, SR. DNA immunization as an efficient strategy for vaccination. Avicenna J Med Biotechnol. 2009, 1(2), 71–88. [Google Scholar]
- Gurunathan, S; Klinman, DM; Seder, RA. DNA Vaccines: Immunology, Application, and Optimization. Annu Rev Immunol 2000, 18(1), 927–74. [Google Scholar] [CrossRef]
- Zhou, ZP; Chen, ZR; Bandara, RA; Duan, R; Cao, H; Liu, J; et al. DNA-Based Vaccines: Advances, Applications, and Future Prospects. Genes Dis 2026, 102025. [Google Scholar] [CrossRef]
- Neeli, P; Chai, D; Roy, D; Prajapati, S; Bonam, SR. DNA Vaccines in the Post-mRNA Era: Engineering, Applications, and Emerging Innovations. Int J Mol Sci. 2025, 26(17), 8716. [Google Scholar] [CrossRef]
- Kutzler, MA; Weiner, DB. DNA vaccines: ready for prime time? Nat Rev Genet 2008, 9(10), 776–88. [Google Scholar] [CrossRef]
- Li, J; Wu, G; Huang, Z; Hu, J; Tie, X; Wu, H; et al. Advances and prospects of respiratory mucosal vaccines: mechanisms, technologies, and clinical applications. NPJ Vaccines 2025, 10(1), 230. [Google Scholar] [CrossRef] [PubMed]
- Li, Y; Jin, L; Chen, T. The Effects of Secretory IgA in the Mucosal Immune System. Biomed Res Int. 2020, 2020(1). [Google Scholar] [CrossRef] [PubMed]
- Lu, B; Lim, JM; Yu, B; Song, S; Neeli, P; Sobhani, N; et al. The next-generation DNA vaccine platforms and delivery systems: advances, challenges and prospects. Front Immunol 2024, 15. [Google Scholar] [CrossRef] [PubMed]
- Lim, M; Badruddoza, AZM; Firdous, J; Azad, M; Mannan, A; Al-Hilal, TA; et al. Engineered Nanodelivery Systems to Improve DNA Vaccine Technologies. Pharmaceutics 2020, 12(1), 30. [Google Scholar] [CrossRef]
- Tang, J; Cai, L; Xu, C; Sun, S; Liu, Y; Rosenecker, J; et al. Nanotechnologies in Delivery of DNA and mRNA Vaccines to the Nasal and Pulmonary Mucosa. Nanomaterials 2022, 12(2), 226. [Google Scholar] [CrossRef]
- Bolhassani, A; Javanzad, S; Saleh, T; Hashemi, M; Aghasadeghi, MR; Sadat, SM. Polymeric nanoparticles: potent vectors for vaccine delivery targeting cancer and infectious diseases. Hum Vaccin Immunother. 2014, 10(2), 321–32. [Google Scholar] [CrossRef]
- Shi, Y; Zhu, L; Qiao, Z; Zhai, Y; Di, J; Wang, S; et al. Polymeric particle-based antigen delivery system: From immunological engineering to clinical translation. Int J Pharm X 2025, 10, 100466. [Google Scholar] [CrossRef]
- Kisakova, LA; Apartsin, EK; Nizolenko, LF; Karpenko, LI. Dendrimer-Mediated Delivery of DNA and RNA Vaccines. Pharmaceutics 2023, 15(4), 1106. [Google Scholar] [CrossRef]
- REED, LJ; MUENCH, H. A SIMPLE METHOD OF ESTIMATING FIFTY PER CENT ENDPOINTS12. Am J Epidemiol 1938, 27(3), 493–7. [Google Scholar] [CrossRef]
- Dimitrov, KM; Taylor, TL; Marcano, VC; Williams-Coplin, D; Olivier, TL; Yu, Q; et al. Novel Recombinant Newcastle Disease Virus-Based In Ovo Vaccines Bypass Maternal Immunity to Provide Full Protection from Early Virulent Challenge. Vaccines (Basel) 2021, 9(10), 1189. [Google Scholar] [CrossRef]
- Hitoshi, N; Ken-ichi, Y; Jun-ichi, M. Efficient selection for high-expression transfectants with a novel eukaryotic vector. Gene [Internet] 1991 Dec 15 [cited 2026 Jan 23, 108(2), 193–9. Available online: https://pubmed.ncbi.nlm.nih.gov/1660837/. [CrossRef] [PubMed]
- Abdel-Moneim, A; El-Shahawy, A; Yousef, AI; Abd El-Twab, SM; Elden, ZE; Taha, M. Novel polydatin-loaded chitosan nanoparticles for safe and efficient type 2 diabetes therapy: In silico, in vitro and in vivo approaches. Int J Biol Macromol 2020, 154, 1496–504. [Google Scholar] [CrossRef] [PubMed]
- Akerele, G; Ramadan, N; Renu, S; Renukaradhya, GJ; Shanmugasundaram, R; Selvaraj, RK. In vitro characterization and immunogenicity of chitosan nanoparticles loaded with native and inactivated extracellular proteins from a field strain of Clostridium perfringens associated with necrotic enteritis. Vet Immunol Immunopathol 2020, 224, 110059. [Google Scholar] [CrossRef] [PubMed]
- Salvador, A; Sandgren, KJ; Liang, F; Thompson, EA; Koup, RA; Pedraz, JL; et al. Design and evaluation of surface and adjuvant modified PLGA microspheres for uptake by dendritic cells to improve vaccine responses. Int J Pharm. 2015, 496(2), 371–81. [Google Scholar] [CrossRef]
- Adediran, E; Arte, T; Pasupuleti, D; Vijayanand, S; Singh, R; Patel, P; et al. Delivery of PLGA-Loaded Influenza Vaccine Microparticles Using Dissolving Microneedles Induces a Robust Immune Response. Pharmaceutics 2025, 17(4), 510. [Google Scholar] [CrossRef]
- Azab, AA; Yehia, N; Makhareta, M; Samir, M; Shoukry, A; Elhalem Mohamed, AA; et al. Evaluation of inactivated avian influenza virus and Newcastle disease virus bivalent vaccination program against newly circulated H5N8 and NDV strains. Poult Sci. 2023, 102(10), 102952. [Google Scholar] [CrossRef]
- Ganar, K; Das, M; Sinha, S; Kumar, S. Newcastle disease virus: Current status and our understanding. Virus Res 2014, 184, 71–81. [Google Scholar] [CrossRef]
- Miller, PJ; Afonso, CL. Newcastle Disease Virus. In Encyclopedia of Life Sciences; Wiley, 2011. [Google Scholar]
- Ferraro, B; Morrow, MP; Hutnick, NA; Shin, TH; Lucke, CE; Weiner, DB. Clinical Applications of DNA Vaccines: Current Progress. Clinical Infectious Diseases 2011, 53(3), 296–302. [Google Scholar] [CrossRef]
- Shi, R; Liu, X; Wang, Y; Pan, M; Wang, S; Shi, L; et al. Long-term stability and immunogenicity of lipid nanoparticle COVID-19 mRNA vaccine is affected by particle size. Hum Vaccin Immunother 2024, 20(1). [Google Scholar] [CrossRef]
- Hassett, KJ; Higgins, J; Woods, A; Levy, B; Xia, Y; Hsiao, CJ; et al. Impact of lipid nanoparticle size on mRNA vaccine immunogenicity. Journal of Controlled Release 2021, 335, 237–46. [Google Scholar] [CrossRef]
- Saade, F; Petrovsky, N. Technologies for enhanced efficacy of DNA vaccines. Expert Rev Vaccines 2012, 11(2), 189–209. [Google Scholar] [CrossRef] [PubMed]
- Hashemi, P; Osanloo, M; Farjadfar, A; Nasiri-Ghiri, M; Zarenezhad, E; Mahmoodi, S. A multi-epitope protein vaccine encapsulated in alginate nanoparticles as a candidate vaccine against Shigella sonnei. Sci Rep. 2024, 14(1), 22484. [Google Scholar] [CrossRef] [PubMed]
- Jadaa, N; Aldor, N; Jenik, K; Oberhoffner, S; Butkowsky, C; Tran, A; et al. Evaluating Cationic Nanoparticles as Carriers of Antiviral Nucleic Acids; 2024; pp. 309–20. [Google Scholar]
- Nafee, N; Taetz, S; Schneider, M; Schaefer, UF; Lehr, CM. Chitosan-coated PLGA nanoparticles for DNA/RNA delivery: effect of the formulation parameters on complexation and transfection of antisense oligonucleotides. Nanomedicine 2007, 3(3), 173–83. [Google Scholar] [CrossRef] [PubMed]
- Braun, CS; Vetro, JA; Tomalia, DA; Koe, GS; Koe, JG; Russell Middaugh, C. Structure/Function Relationships of Polyamidoamine/DNA Dendrimers as Gene Delivery Vehicles. J Pharm Sci. 2005, 94(2), 423–36. [Google Scholar] [CrossRef]
- Amir Kalvanagh, P; Ebtekara, M; Kokhaei, P; Soleimanjahi, H. Preparation and Characterization of PLGA Nanoparticles Containing Plasmid DNA Encoding Human IFN-lambda-1/IL-29. Iran J Pharm Res. 2019, 18(1), 156–67. [Google Scholar]
- Danhier, F; Ansorena, E; Silva, JM; Coco, R; Le Breton, A; Préat, V. PLGA-based nanoparticles: An overview of biomedical applications. Journal of Controlled Release 2012, 161(2), 505–22. [Google Scholar] [CrossRef]
- WAECKERLEMEN, Y; GROETTRUP, M. PLGA microspheres for improved antigen delivery to dendritic cells as cellular vaccines. Adv Drug Deliv Rev. 2005, 57(3), 475–82. [Google Scholar] [CrossRef]
- Demento, SL; Cui, W; Criscione, JM; Stern, E; Tulipan, J; Kaech, SM; et al. Role of sustained antigen release from nanoparticle vaccines in shaping the T cell memory phenotype. Biomaterials 2012, 33(19), 4957–64. [Google Scholar] [CrossRef]
- Abedi-Gaballu, F; Dehghan, G; Ghaffari, M; Yekta, R; Abbaspour-Ravasjani, S; Baradaran, B; et al. PAMAM dendrimers as efficient drug and gene delivery nanosystems for cancer therapy. Appl Mater Today 2018, 12, 177–90. [Google Scholar] [CrossRef]
- Siepmann, J; Peppas, NA. Higuchi equation: Derivation, applications, use and misuse. Int J Pharm. 2011, 418(1), 6–12. [Google Scholar] [CrossRef]
- Upputuri, RTP; Mandal, AKA. Mathematical Modeling and Release Kinetics of Green Tea Polyphenols Released from Casein Nanoparticles. Iran J Pharm Res. 2019, 18(3), 1137–46. [Google Scholar] [PubMed]
- Guo, Z; Wang, H; Yang, T; Wang, X; Lu, D; Li, Y; et al. Priming with a DNA vaccine and boosting with an inactivated vaccine enhance the immune response against infectious bronchitis virus. J Virol Methods 2010, 167(1), 84–9. [Google Scholar] [CrossRef] [PubMed]
- Shan, S; Fenwick, S; Ellis, T; Poinern, E; Edwards, J; Le, X; et al. Evaluation of different chemical adjuvants on an avian influenza H6 DNA vaccine in chickens. Avian Pathology 2016, 45(6), 649–56. [Google Scholar] [CrossRef] [PubMed]
- Zhao, K; Rong, G; Hao, Y; Yu, L; Kang, H; Wang, X; et al. IgA response and protection following nasal vaccination of chickens with Newcastle disease virus DNA vaccine nanoencapsulated with Ag@SiO2 hollow nanoparticles. Sci Rep. 2016, 6(1), 25720. [Google Scholar] [CrossRef]
- Zhao, K; Zhang, Y; Wang, X; Shi, C; Wang, X; Wang, X; et al. Chitosan-coated poly(lactic-co-glycolic) acid nanoparticles as an efficient delivery system for Newcastle disease virus DNA vaccine. Int J Nanomedicine 2014, 4609. [Google Scholar] [CrossRef]
- Ensign, LM; Cone, R; Hanes, J. Oral drug delivery with polymeric nanoparticles: The gastrointestinal mucus barriers. Adv Drug Deliv Rev. 2012, 64(6), 557–70. [Google Scholar] [CrossRef]
- Kim, D; Kim, S; Na, DH. Dendrimer nanoplatforms for oral drug delivery applications. J Pharm Investig. 2025, 55(2), 169–89. [Google Scholar] [CrossRef]
- Hussain, Z; Khan, S; Imran, M; Sohail, M; Shah, SWA; de Matas, M. PEGylation: a promising strategy to overcome challenges to cancer-targeted nanomedicines: a review of challenges to clinical transition and promising resolution. Drug Deliv Transl Res. 2019, 9(3), 721–34. [Google Scholar] [CrossRef]
- Lai, SK; Wang, YY; Hanes, J. Mucus-penetrating nanoparticles for drug and gene delivery to mucosal tissues. Adv Drug Deliv Rev. 2009, 61(2), 158–71. [Google Scholar] [CrossRef]
- Fröhlich, E. The role of surface charge in cellular uptake and cytotoxicity of medical nanoparticles. Int J Nanomedicine 2012, 5577. [Google Scholar] [CrossRef]
- Hobson, P. Mucosal immunization with DNA vaccines. Methods 2003, 31(3), 217–24. [Google Scholar] [CrossRef]
- Kapczynski, DR; Afonso, CL; Miller, PJ. Immune responses of poultry to Newcastle disease virus. Dev Comp Immunol. 2013, 41(3), 447–53. [Google Scholar] [CrossRef]
- He, C; Hu, Y; Yin, L; Tang, C; Yin, C. Effects of particle size and surface charge on cellular uptake and biodistribution of polymeric nanoparticles. Biomaterials 2010, 31(13), 3657–66. [Google Scholar] [CrossRef]
- Mao, S; Sun, W; Kissel, T. Chitosan-based formulations for delivery of DNA and siRNA. Adv Drug Deliv Rev. 2010, 62(1), 12–27. [Google Scholar] [CrossRef]
- Huo, S; Zuo, Y; Li, N; Li, X; Zhang, Y; Wang, L; et al. Chicken IL-7 as a potent adjuvant enhances IBDV VP2 DNA vaccine immunogenicity and protective efficacy. Vet Microbiol 2016, 193, 145–55. [Google Scholar] [CrossRef]
- Deb, R; Dey, S; Madhan Mohan, C; Gaikwad, S; Kamble, N; Khulape, SA; et al. Development and evaluation of a Salmonella typhimurium flagellin based chimeric DNA vaccine against infectious bursal disease of poultry. Res Vet Sci. 2015, 102, 7–14. [Google Scholar] [CrossRef] [PubMed]
- Zhao, K; Han, J; Zhang, Y; Wei, L; Yu, S; Wang, X; et al. Enhancing Mucosal Immune Response of Newcastle Disease Virus DNA Vaccine Using N -2-Hydroxypropyl Trimethylammonium Chloride Chitosan and N, O -Carboxymethyl Chitosan Nanoparticles as Delivery Carrier. Mol Pharm. 2018, 15(1), 226–37. [Google Scholar] [CrossRef] [PubMed]
- Zhao, K; Li, W; Huang, T; Luo, X; Chen, G; Zhang, Y; et al. Preparation and Efficacy of Newcastle Disease Virus DNA Vaccine Encapsulated in PLGA Nanoparticles. PLoS One 2013, 8(12), e82648. [Google Scholar] [CrossRef] [PubMed]
Figure 1.
Generation and characterization of the Recombinant OAV-j F protein. A) Schematic representation of the recombinant pCAGGS- OAV-j F-FLAG-COOH plasmid is driven by the CAG promoter complex (yellow arrow), which combines the chicken β-actin promoter with a cytomegalovirus (CMV) enhancer (pC-F). and the empty vector (EV). The FLAG tag showed as a red box, and the stop codon is represented by an asterisk. B) Gel electrophoresis analyses of the vectors represented at (A), showing the restriction digestion pattern after double digestion using SacI and SmaI restriction. C) Ectopic cytoplasmic expression of pC-F in chicken fibroblast DF1 transfected cells, in comparison to mock-transfected and EV-transfected cells using indirect immunofluorescence assay. Scale bars are 300 µm. D) Western blot-based validation of expression of pC-F in DF1. EV- and Mock-transfected cells were included. β-actin was also included as a loading control. Molecular weight markers are indicated on the right. AOAV-1 corresponds to Orthoavulavirus javaense according to the updated ICTV nomenclature.
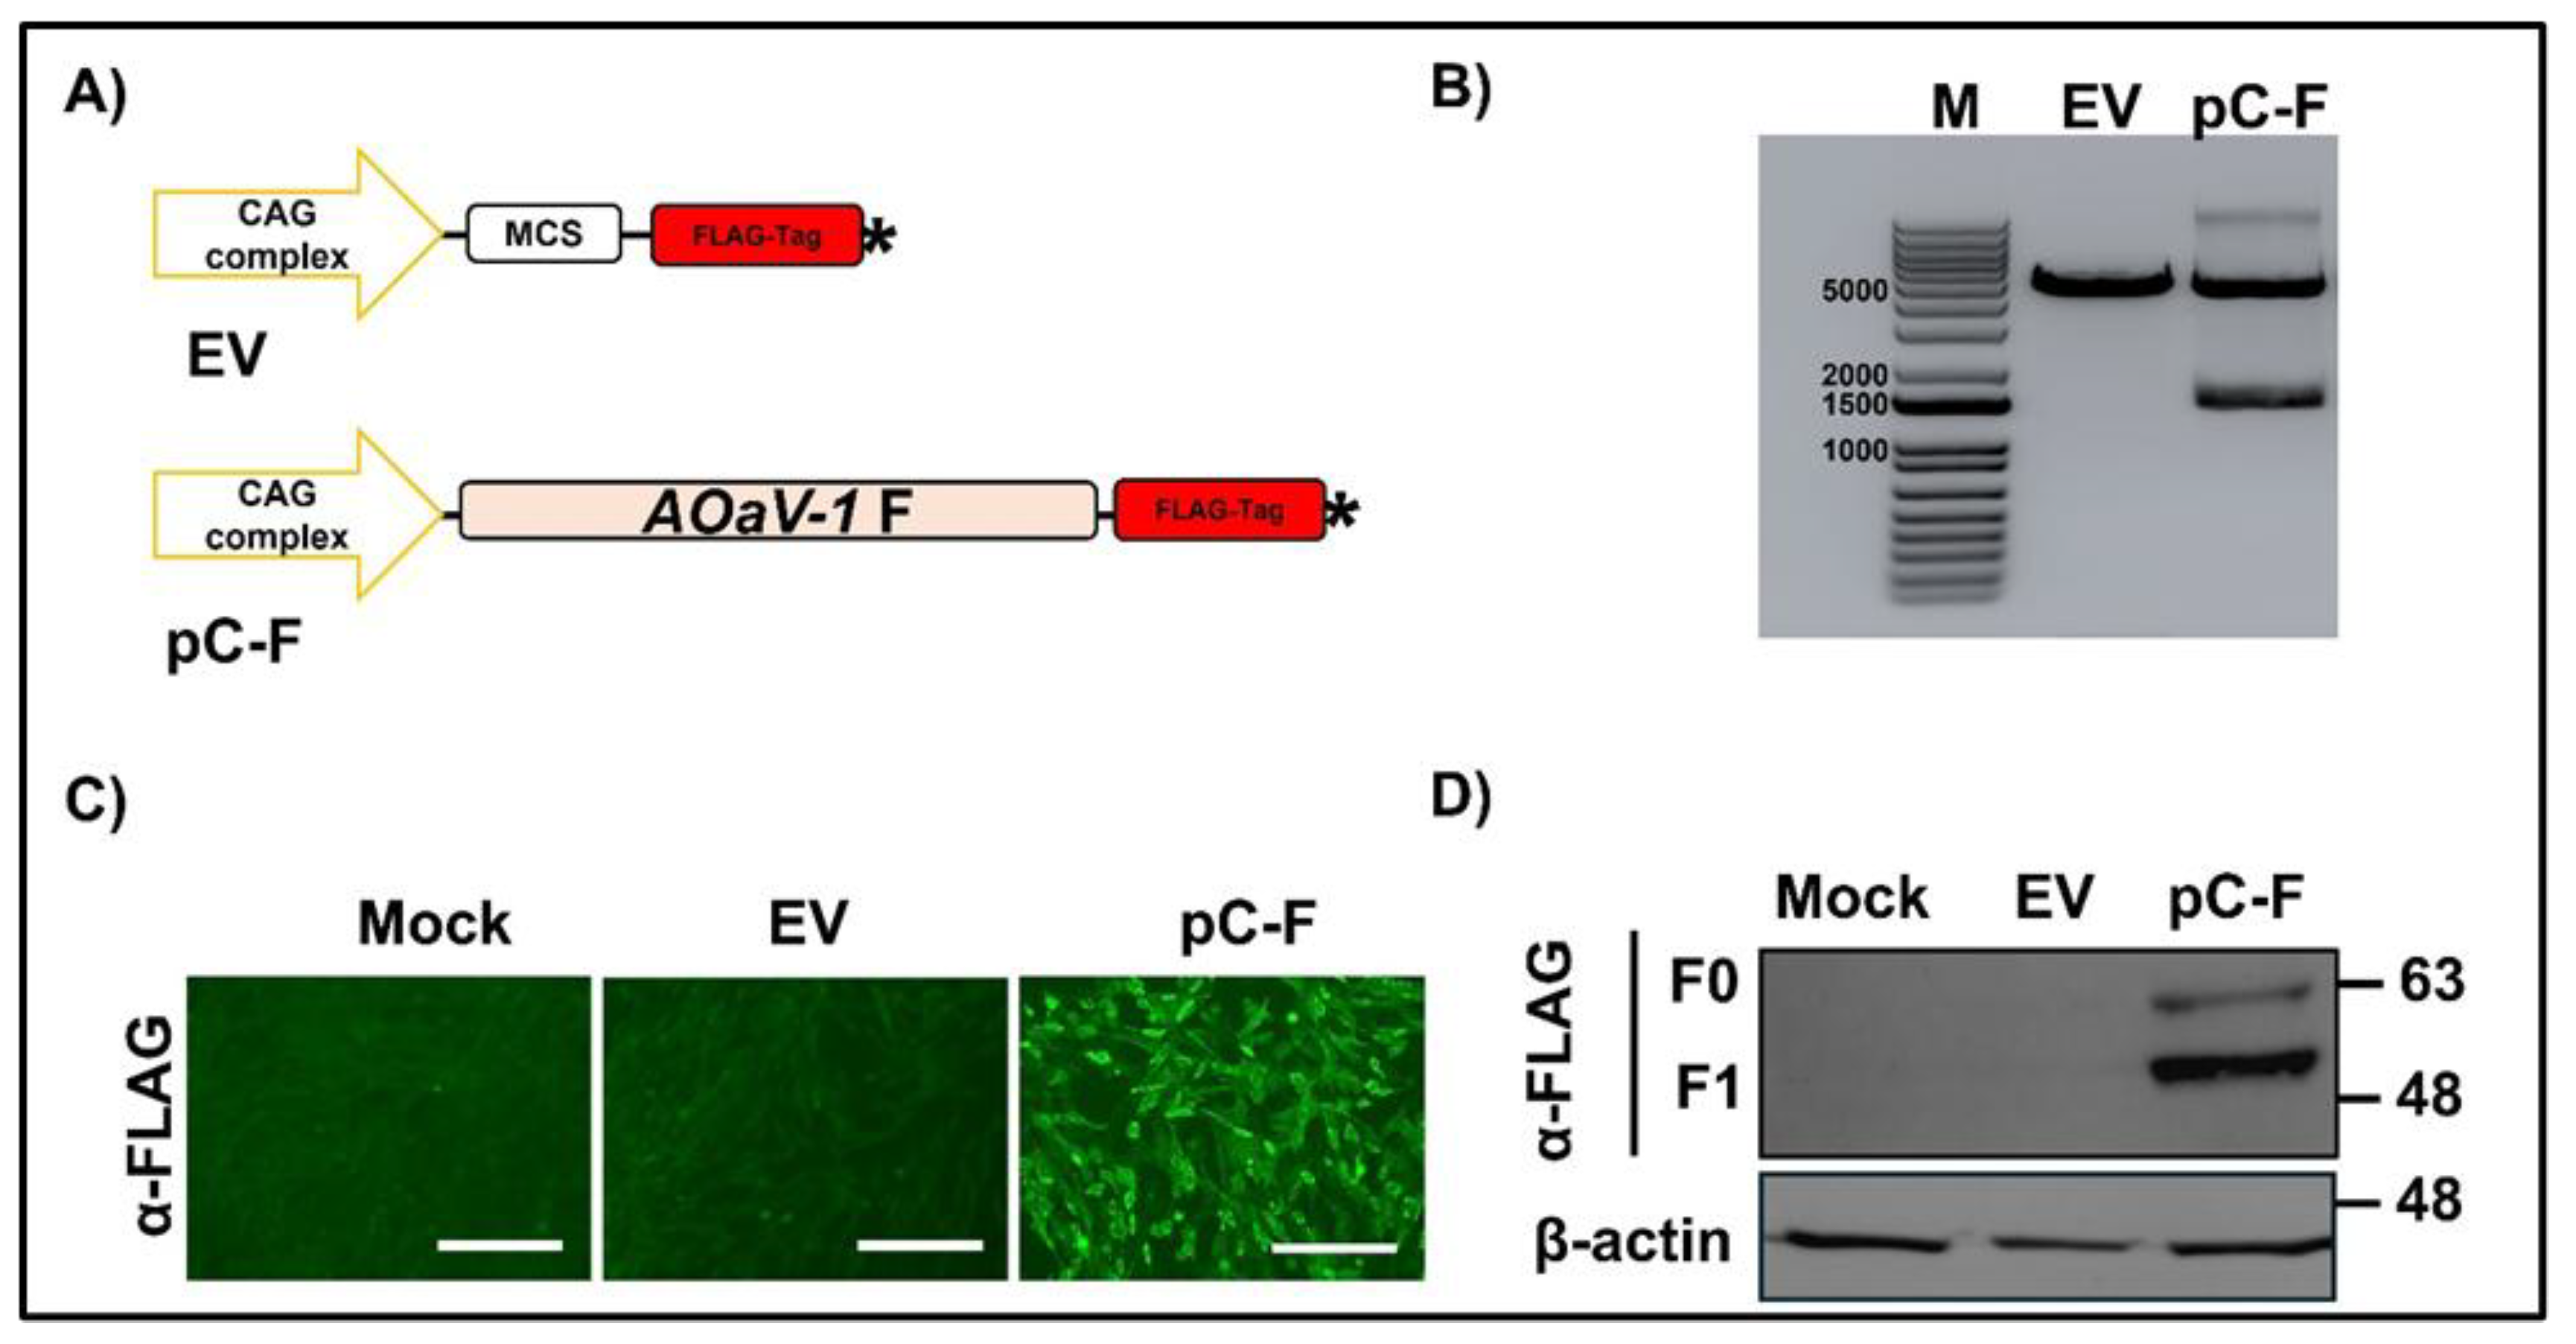
Figure 2.
Morphological, structural, and release characterization of pDNA-F–loaded Nanoparticles. Representative scanning electron microscopy (SEM) micrographs illustrating the surface morphology of A) Cs-NPs-pDNA-F, B) PLGA-NPs-pDNA-F, and C) PAMAM-Dendrimers-pDNA-F. All images are shown at the same magnification (scale bar = 100 nm). D) Fourier-transform infrared (FTIR) spectra of Cs-NPs-pDNA-F, PLGA-NPs-pDNA-F, and PAMAM-Dendrimers-pDNA-F formulations. E) In vitro cumulative release profiles of pDNA-F from the different nanoparticle formulations over 72 h, demonstrating formulation-dependent release kinetics. Data is presented as mean ± SD. AOAV-1 corresponds to Orthoavulavirus javaense according to the updated ICTV nomenclature.
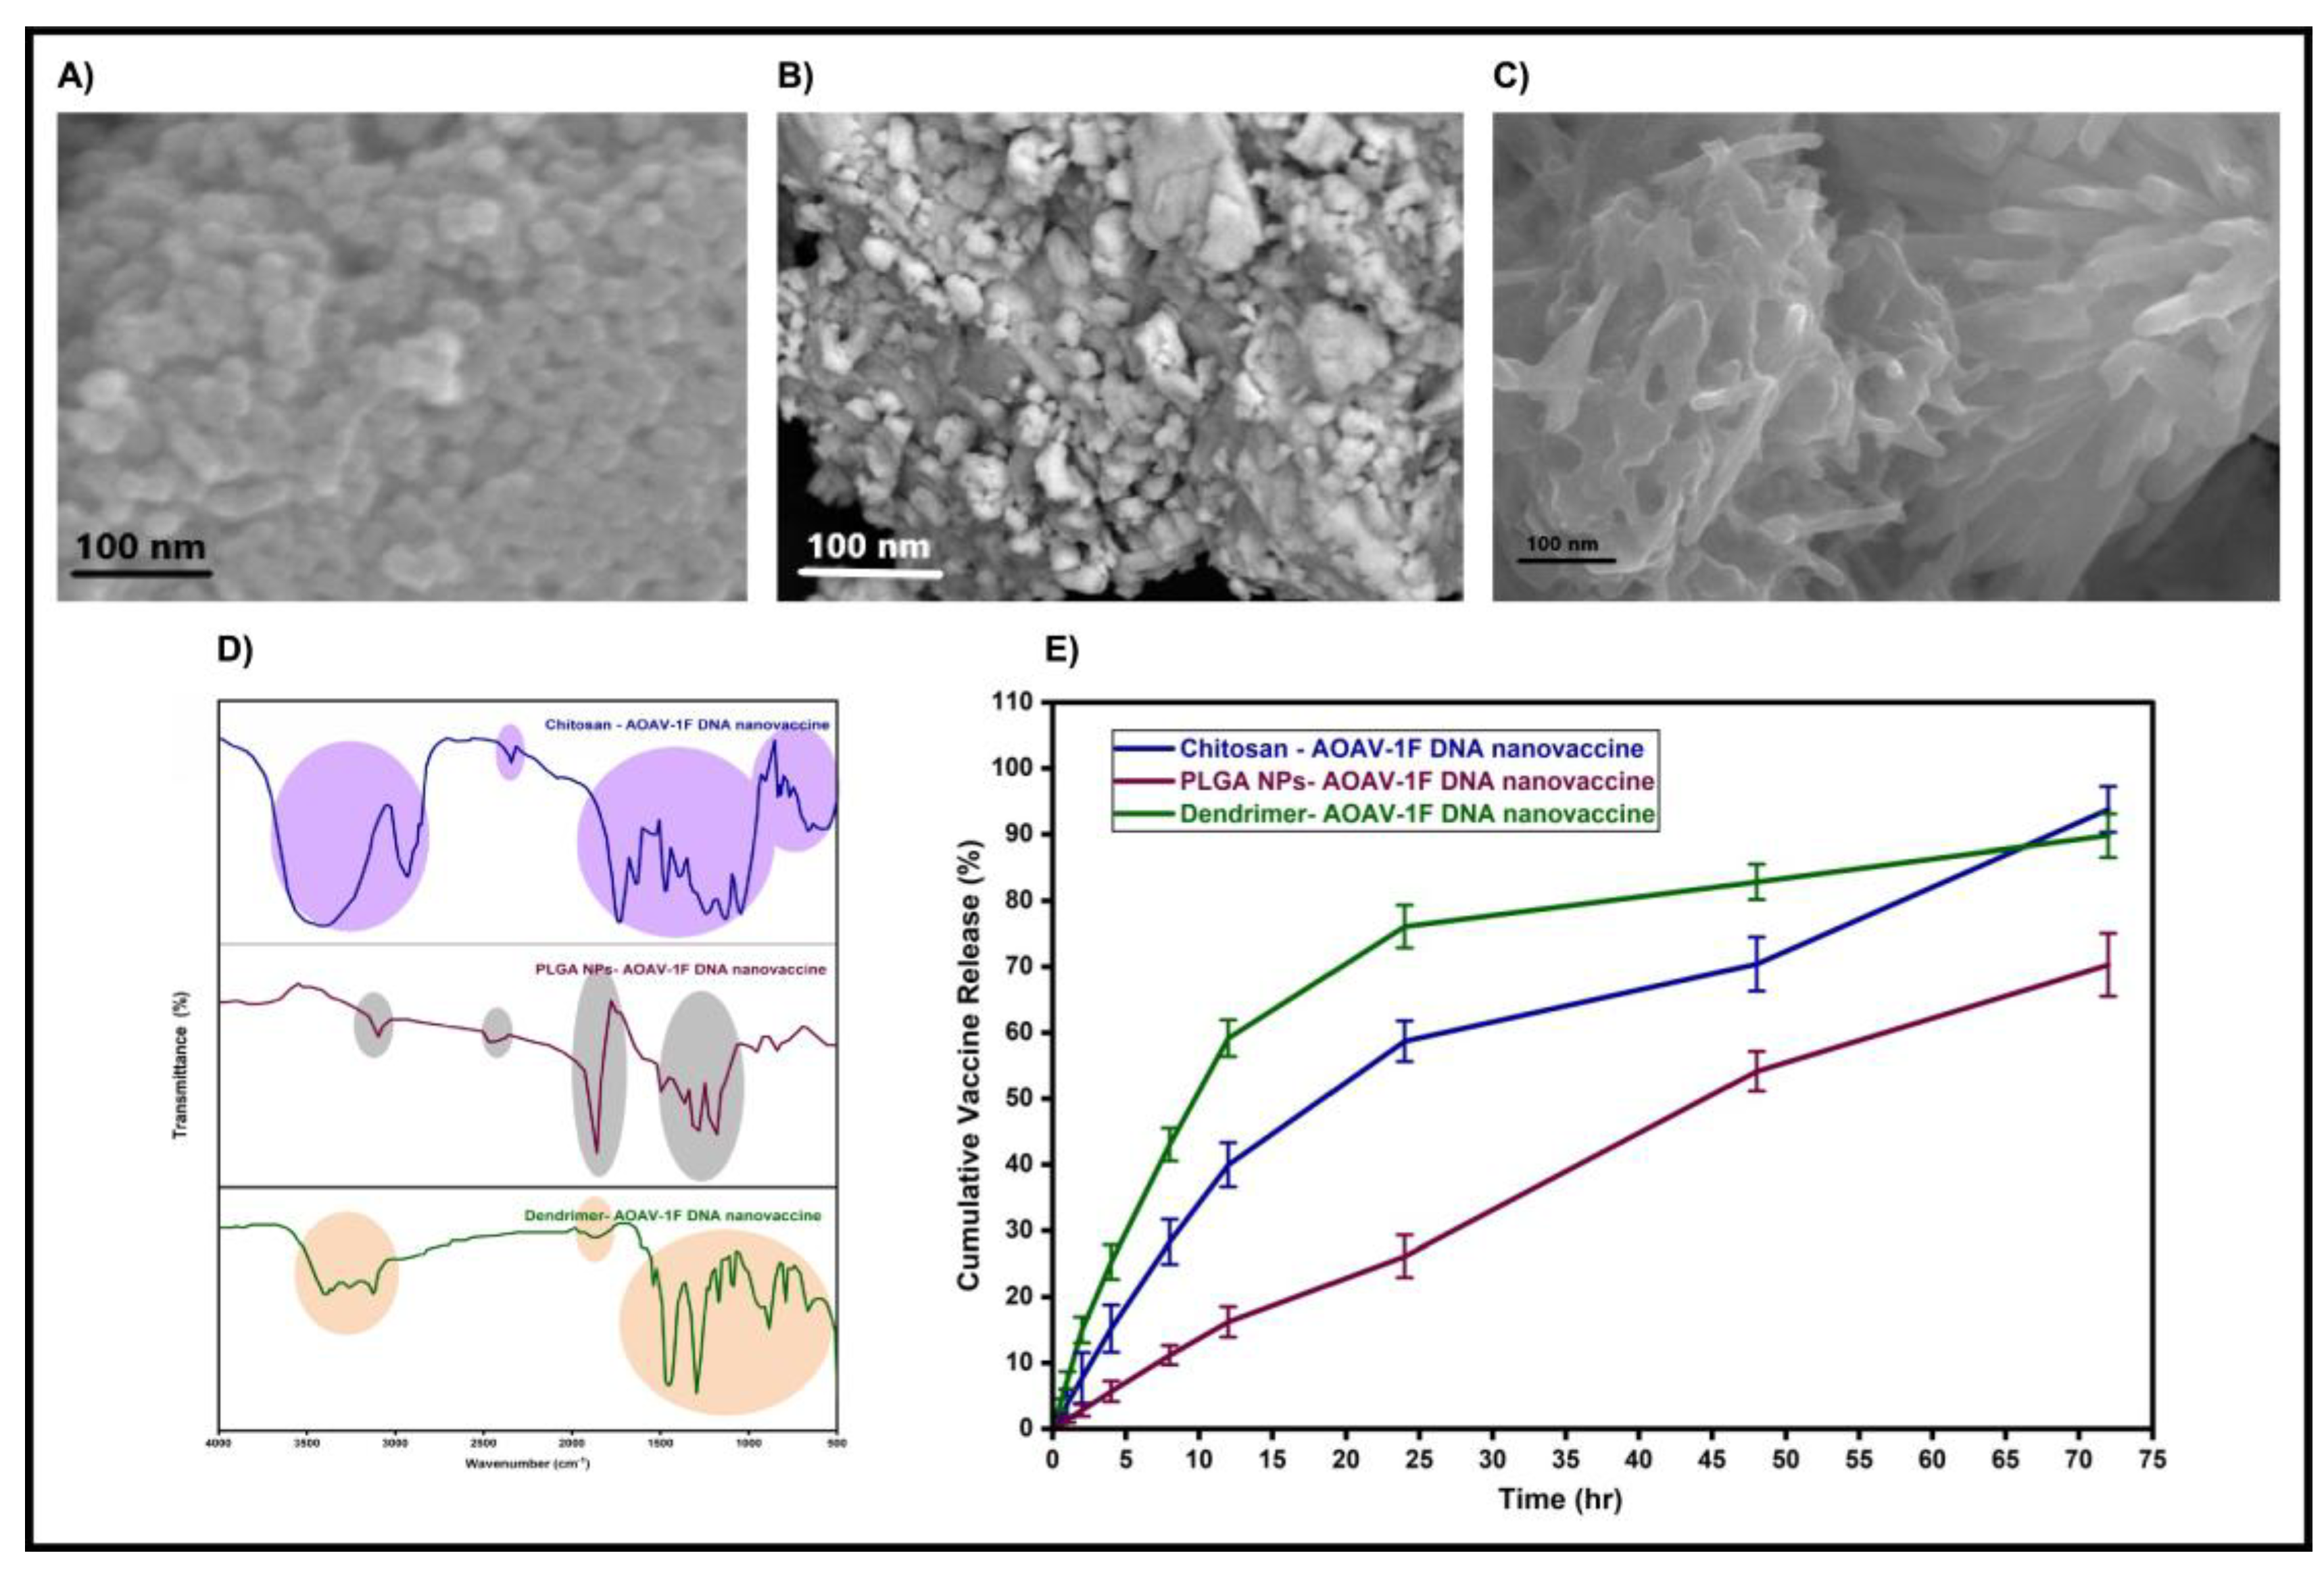
Figure 3.
Experimental design and antibody response profile throughout the experiment. A) Schematic timeline of the in vivo experimental design showing primary vaccination (day 11), booster vaccination (day 21), challenge (day 35), blood sampling points, and cloacal swab collection schedule. B) Kinetics of geometric mean antibody titers (GMT) measured by ELISA in at different time points (days 1, 11, 21, 28, and 35). C) Post-challenge geometric mean titers (GMT) of individual experimental groups. Data are presented as mean ± SD. Statistical significance is indicated as ****P < 0.0001.
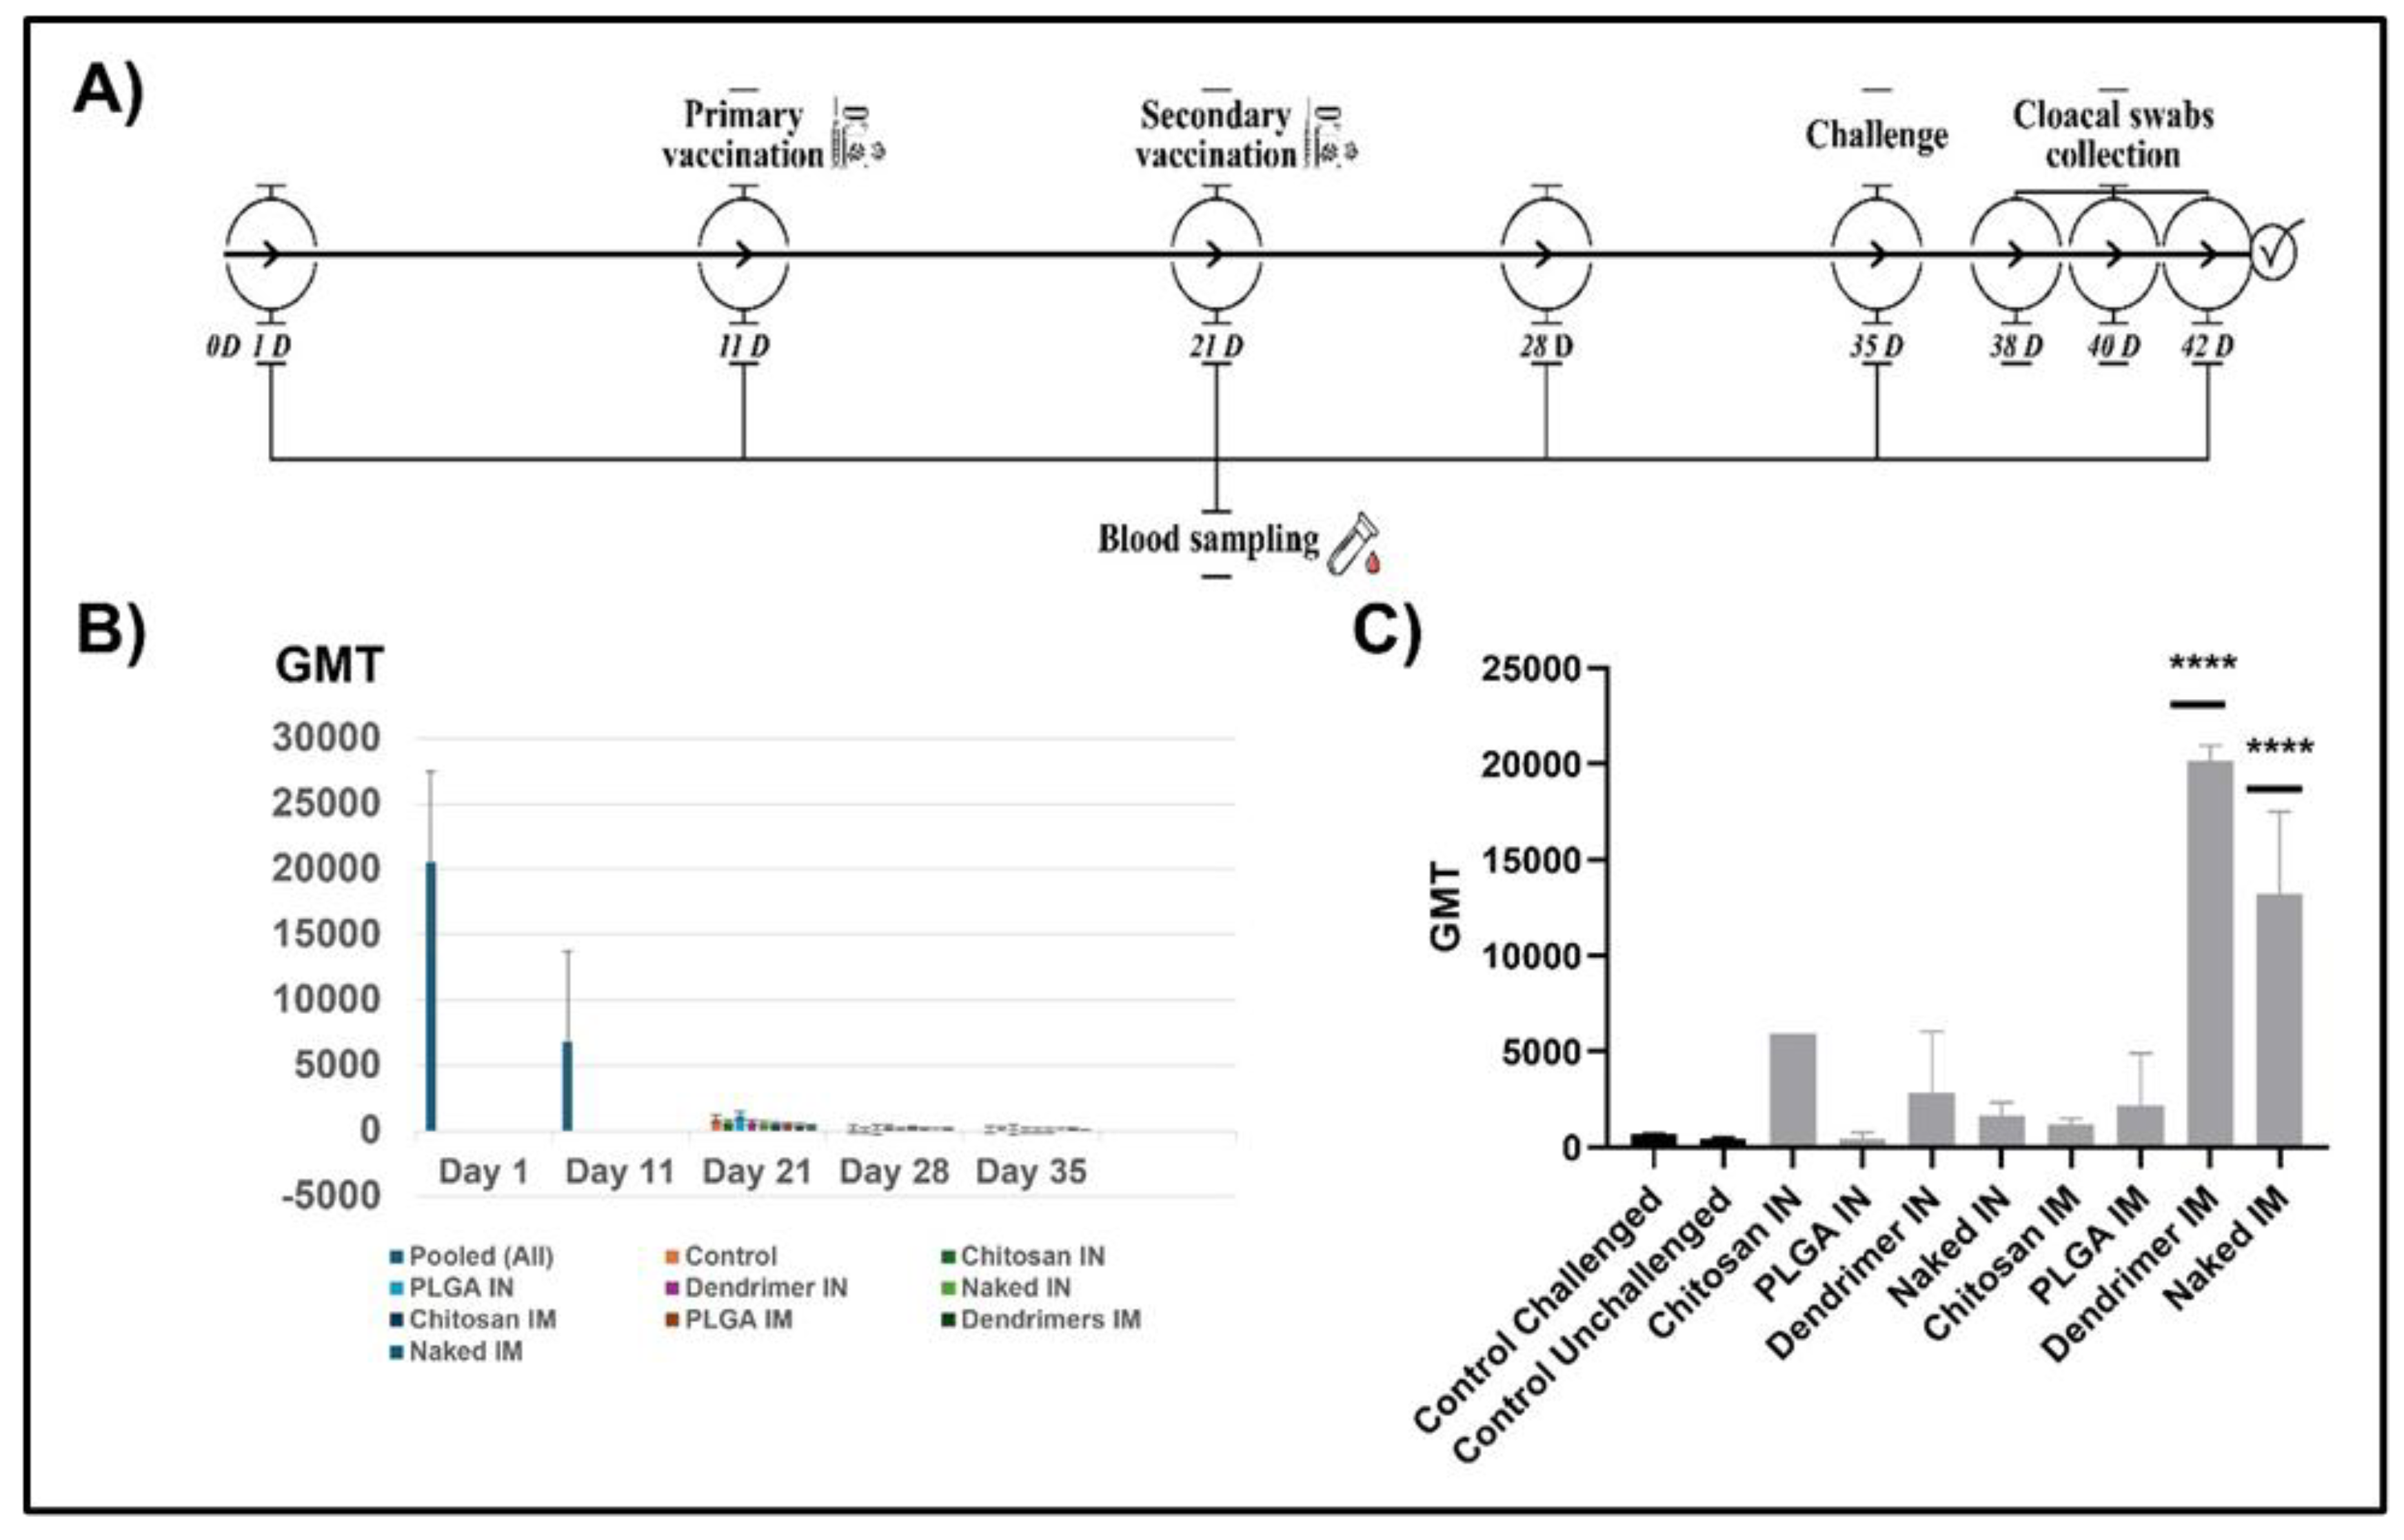
Figure 4.
Survival outcomes and viral shedding following Virulent OAV-j Challenge. A) Kaplan–Meier survival curves of chickens immunized with Cs-NPs-pDNA-F, PLGA-NPs-pDNA-F, and PAMAM-Dendrimers-pDNA-F via intranasal (IN) or intramuscular (IM) routes, compared with naked pDNA-F and non-vaccinated, challenged control group, monitored for 8 days post-challenge (dpc). B) Viral shedding quantified as log₁₀ EID₅₀ equivalents at 3, 5, and 7 dpc.

Table 1.
Experimental grouping based on nanoparticle carrier, administration route, and post-challenge survival.
Table 1.
Experimental grouping based on nanoparticle carrier, administration route, and post-challenge survival.
| Gr. | Formulation administered | Carrier | Route | Challenge | Survival rate |
|---|---|---|---|---|---|
| 1 | Non-vaccinated-challenged control | — | — | + | 0% |
| 2 | Non-vaccinated-unchallenged control | — | — | - | 100% |
| 3 | Cs-NPs-pDNA-F | Chitosan | Intranasal | + | 30% |
| 4 | PLGA-NPs-pDNA-F | PLGA | Intranasal | + | 90% |
| 5 | PAMAM-Dendrimers-pDNA-F | PAMAM-Dendrimers | Intranasal | + | 50% |
| 6 | Naked pDNA-F | None | Intranasal | + | 50% |
| 7 | Cs-NPs-pDNA-F | Chitosan | Intramuscular | + | 20% |
| 8 | PLGA-NPs-pDNA-F | PLGA | Intramuscular | + | 50% |
| 9 | PAMAM-Dendrimers-pDNA-F | PAMAM-Dendrimers | Intramuscular | + | 100% |
| 10 | Naked pDNA-F | None | Intramuscular | + | 70% |
Table 2.
Physicochemical characterization of pDNA-F–loaded Nanoparticles.
| Formulation | Hydrodynamic Size (nm) | Polydispersity Index (PDI) | Zeta Potential (mV) |
|---|---|---|---|
| Cs-NPs-pDNA-F | 210 ± 15.5 | 0.21 ± 0.04 | +32.5 ± 2.8 |
| PLGA-NPs-pDNA-F | 255 ± 20.1 | 0.24 ± 0.05 | -21.8 ± 1.9 |
| PAMAM-Dendrimers-pDNA-F | 120 ± 10.2 | 0.16 ± 0.03 | +45.3 ± 3.5 |
Table 3.
Comparison of the regression coefficient (R2) for pDNA-F release.
| Release mechanism | Cs-NPs-pDNA-F (R²) | PLGA-NPs-pDNA-F (R²) | PAMAM-Dendrimers-pDNA-F (R²) | Equations | Model |
|---|---|---|---|---|---|
| Constant release rate | 0.9034 | 0.9911 | 0.7443 | Mt=k0t+b | Zero order |
|
Concentration- dependent release |
0.9558 | 0.9679 | 0.9466 | ln(M∞−Mt)=ln(M∞)−k1t | First order |
|
Diffusion-controlled ‘ release |
0.9842 | 0.9560 | 0.9226 | Mt=kHt1/2+bMt=kHt1/2+b | Higuchi |
|
Polymer/transport controlled (early phase) |
0.9914 | 0.9869 | 0.9945 | ln(Mt/M∞)=lnkKP+nlnt (≤60%) | Korsmeyer–Peppas |
Disclaimer/Publisher’s Note: The statements, opinions and data contained in all publications are solely those of the individual author(s) and contributor(s) and not of MDPI and/or the editor(s). MDPI and/or the editor(s) disclaim responsibility for any injury to people or property resulting from any ideas, methods, instructions or products referred to in the content. |
© 2026 by the authors. Licensee MDPI, Basel, Switzerland. This article is an open access article distributed under the terms and conditions of the Creative Commons Attribution (CC BY) license (http://creativecommons.org/licenses/by/4.0/).
Copyright: This open access article is published under a Creative Commons CC BY 4.0 license, which permit the free download, distribution, and reuse, provided that the author and preprint are cited in any reuse.


