
Submitted:
13 February 2026
Posted:
14 February 2026
You are already at the latest version
Abstract
The modeling study investigated the impact of the 2023 Canadian wildfire aerosols (primarily black carbon and organic aerosol) on weather forecasts, concluding that incorporating real-time aerosol forcing improved model skill over using a climatology. Experiments without real-time data severely underestimated the Aerosol Optical Depth (AOD), an error mitigated by including the forcing or by using the coupled atmosphere-chemistry model. The aerosols exerted a strong direct radiative effect, reducing the surface downward shortwave (SW) flux and causing a corresponding surface cooling over the wildfire region. Furthermore, including aerosol-cloud interactions amplified this cooling and led to an increase in overall cloud fraction and precipitation, illustrating complex indirect effects. While these physical improvements enhanced the representation of the atmosphere, the positive impact on overall medium-range forecast skill (5–10 days) was modest, suggesting that the benefits of accurately representing wildfire feedback on the coupled Earth system are achieved through relatively slow processes, such as radiation feedback.
Keywords:
aerosol-radiation interactions (ARI)
; aerosol-cloud interactions
; biomass burning aerosols
; numerical weather prediction
; radiative forcing
; 2023 Canadian wildfires
; aerosol optical depth (AOD
1. Introduction
The 2023 Canadian wildfire season was marked by 6,551 fires that burned approximately 184,961 square kilometers (Johns et al. 2024). The resulting smoke traveled south into the United States, reaching as far as Virginia, and even crossed the Atlantic Ocean to Europe. Wildfires cause direct damage to both property and human life, as well as short-term disruptions to weather forecasts (e.g., Hulstrom and Stoffel 1990; Peace et al. 2015) and long-term impacts on climate (e.g., Kaufman and Nakajima 1993; Kaufman and Fraser 1997).
Aerosols, particularly black and organic carbon emitted by wildfires, influence the atmosphere in several ways. The primary direct effects occur through aerosol–radiation interactions (ARI), including the extinction, scattering, and reflection of solar radiation (e.g., Verma et al. 2015). Indirectly, aerosols can reduce precipitation efficiency in clouds (e.g., Rosenfeld 1999; Ramanathan et al. 2001) by increasing the number concentration of cloud condensation nuclei (CCN) and ice nuclei (IN), which in turn decreases the size and coalescence of cloud droplets and ice crystals through aerosol–cloud interactions (ACI; Twomey 1977). The semidirect effect (Hansen et al. 1997) occurs when black carbon absorbs radiation and heats the surrounding atmosphere, which can suppress cloud formation and stabilize the lower atmosphere if the absorbing aerosol is located at low altitudes (Koren et al. 2004).
Wildfires also have long-term effects on climate. Kaufman and Nakajima (1993) demonstrated that smoke particles can reduce cloud droplet size from 15 to 9 μm and decrease reflectance from 0.71 to 0.68 due to sunlight absorption by biomass-burning aerosols, based on Advanced Very High Resolution Radiometer (AVHRR) analysis during the 1980s Amazon Basin biomass-burning season. Using the Community Earth System Model with prescribed daily fire aerosol emissions, Jiang et al. (2020) estimated the total global fire aerosol radiative effect (RE) to be approximately 0.78 W m⁻², primarily attributed to ACI. Similarly, Xu et al. (2021), using the Energy Exascale Earth System Model (E3SM) with the Global Fire Emissions Database (GFED) and ground-based Aerosol Robotic Network (AERONET) aerosol optical depth (AOD) observations from 1997–2016, found that fire aerosols significantly increased global AOD by 7–14% and reduced net shortwave radiation at the surface by about –2.3 W m⁻². Fire-induced direct and indirect aerosol effects were found to lower the annual mean global land surface air temperature by approximately 0.17 K.
Despite their substantial impacts, limited research has examined how wildfires influence weather forecasting—an area that remains challenging. Peace et al. (2015) reported that, in a coupled fire–atmosphere model, the sea-breeze frontal line propagated faster and vertical motion within the frontal zone was enhanced. Hulstrom and Stoffel (1990) observed that the optical depth of smoke clouds from the Yellowstone wildfire was up to 6.8 times greater than under clear-sky conditions. As a result of this increased optical depth, Robock (1991) found daytime cooling of 1.5°–7°C under wildfire smoke, with negligible nighttime effects. Potter and McEvoy (2021) compared daily weather patterns during large and small fires and found that the greatest response differences occurred in wind speed—reflecting variations in fire growth response rather than in the meteorological conditions themselves. Conrick et al. (2021) investigated the influence of wildfire smoke on cloud microphysics during the September 2020 Pacific Northwest wildfires and found that thermodynamic factors were the primary driver of enhanced cloud lifetimes, with microphysical effects playing a secondary role.
2. Experimental Design and Model Description
The NOAA experimental atmospheric Global Forecast System (GFS) version 17 prototype 8 (GFS.v17_p8) (Yang et al., 2020), which has a horizontal resolution of approximately 26 km and 128 vertical levels extending to the mesopause (C384L128 configuration), is used in this study. The Thompson microphysics scheme (Thompson et al., 2004, 2008), a double-moment parameterization, is employed to predict both the mixing ratios and number concentrations of condensates and hydrometeors. The activation of ice nuclei (IN) and cloud condensation nuclei (CCN) follows the approach described in Cheng and Yang (2025). The Rapid Radiative Transfer Model for General Circulation Models (GCMs) (RRTMG) (Mlawer et al., 1997; Mlawer et al., 2016) is used for radiative transfer calculations involving the atmosphere, aerosols, and clouds.
To assess the aerosol direct effects of the 2023 Canadian summer wildfires on GFS forecasts, two main experiments are performed. The control experiment (CTL) uses the climatological mean aerosol fields from 2014 to 2023, while the sensitivity experiment (RTF) uses three-hourly Real-Time Forcing (RTF) data from MERRA2 (Modern-Era Retrospective analysis for Research and Applications, Version 2, Buchard et al, 2017; Randles et al, 2017). Both experiments are conducted with the C384L128 configuration of the GFS for 240-hour free forecasts, initialized every three days from 00 UTC 1 June 2023 to 00 UTC 1 September 2023. The aerosol direct effects of the wildfires can be evaluated by comparing CTL and RTF.
Additionally, we conducted a third experiment (EXP_GOC) using instantaneous aerosol data predicted by the coupled GFS and GOCART (Goddard Chemistry, Aerosol, Radiation, and Transport) model (Chin et al., 2002; Colarco et al., 2010). Within this framework, 15 aerosol species—including sulfate, five size bins each for dust and sea salt, and hydrophilic/hydrophobic organic and black carbon—are transported as passive tracers (Pan et al., 2023). While the GOCART scheme manages most chemical and physical processes, two key exceptions exist: aerosol convective scavenging is integrated into the GFS scale-aware mass flux scheme, and dust is modeled via the Fengsha scheme (Zhang et al., 2022a). Biomass burning emissions are derived from the GBBEPx (Global Biomass Burning Emission Product – Extended) multi-satellite inventory (Wang et al., 2018; Zhang et al., 2022b). This experiment is designed to evaluate the performance of GOCART against the MERRA-2 hourly aerosol forcing.
The first three experiments (CTL, RTF, and EXP_GOC) include only aerosol–radiation interactions (ARI). To further examine aerosol–cloud interactions (ACI), a fourth experiment (EXP_RTACI) is conducted, which is identical to RTF except that ACI is activated—allowing aerosols to act as CCN and IN and enabling full coupling among aerosols, radiation, and clouds.
A summary of all experiments is provided in Table 1. The comparison between EXP_RTF and EXP_RTACI represents the effects of ACI on numerical weather prediction (NWP) forecasts.
3. Results
3.1. Effects on Aerosol Optical Depth
Wildfire emissions are characterized primarily by black and organic carbon aerosols, as well as gaseous precursors such as volatile organic compounds and nitrogen oxides (Shen et al. 2025). During the summer of 2023, the influence of wildfire emissions was largely confined to the Northern Hemisphere, as indicated by the summer mean aerosol optical depth (AOD) on forecast day 1 (Figure 1). All experiments underestimated AOD over the Northern Hemisphere compared with Moderate Resolution Imaging Spectroradiometer (MODIS) observations. It should be noted that MERRA-2 assimilates multiple observational datasets, including MODIS, Advanced Very High Resolution Radiometer (AVHRR) instruments, the Multi Angle Imaging SpectroRadiomete (MISR), AERONET, and other numerous additions and bias-corrected systems, in addition to MODIS, which likely contributes to its higher accuracy.
As expected, EXP_CTL shows the strongest AOD underestimation (Figure 1a), since the climatological aerosol forcing does not include information about the 2023 wildfires. The region of underestimation extends from the northwest to the southeast, consistent with the spatial orientation of the major wildfire events. In addition, EXP_CTL and EXP_GOC also underestimate AOD near the west coast of southern Africa, the Indian monsoon region, and northeastern Asia, but they overestimate AOD over part of northern Africa, northern Asia, and the storm-track regions in the Southern Hemisphere. Similar biases are present in EXP_RTF and EXP_RTACI, though their magnitudes are generally smaller.
The sources of aerosols in these regions differ substantially: near the west coast of Africa, aerosols are dominated by organic carbon; over northern Africa and Asia, they are primarily dust; and in the Southern Hemisphere storm-track regions, they mainly consist of sea salt. Although these regional biases are not directly related to the Canadian wildfires, they interact within the coupled Earth system and influence the mean biases and root-mean-square errors (RMSE) in the analyses that follow.
The biases generally increase with forecast lead time (Figure 2 and Figure 3), particularly in EXP_CTL and EXP_GOC, which do not include real-time aerosol forcing. In addition to the natural growth of forecast errors over time, positive feedback processes may also contribute to this increase. For instance, an underestimation of AOD can lead to enhanced surface warming, as more shortwave radiation reaches the surface. This surface heating can destabilize the lower atmosphere, promoting deep convection that transports aerosols vertically and out of the source region, further amplifying the forecast bias.
Quantitatively, the AOD root-mean-square error (RMSE) and bias from the four experiments, evaluated against MODIS and (Visible Infrared Imaging Radiometer Suite) VIIRS observations and averaged between 65°N and 65°S, are summarized in Table 2 and Table 3, respectively. Overall, both RMSE and bias from all experiments show better agreement with VIIRS than with MODIS, with differences of approximately 10%. For example, the day-1 bias of EXP_CTL is –0.051 relative to MODIS and –0.045 relative to VIIRS, corresponding to a 13% difference (0.006/0.045=13%).
Among all experiments, EXP_CTL exhibits the largest RMSE and bias, while EXP_RTF shows the smallest RMSE, indicating that incorporating real-time wildfire aerosol forcing improves global forecast skill. Including aerosol–cloud interactions (ACI) in EXP_RTACI generally increases both RMSE and bias, likely due to the added complexity of feedback processes. Interestingly, EXP_GOC displays the smallest overall bias despite having a larger RMSE than EXP_RTF and EXP_RTACI, which may result from partial error cancellation within its interactive processes.
3.2. Effects on Radiation Fluxes
In the following sections, we focus on the results from day 5 of the forecasts. Day 5 represents a balance between forecast reliability and sensitivity: it does not exhibit the large forecast errors seen at day 10, yet the differences among the experiments remain more pronounced than at day 1. This choice is consistent with several previous studies that have also emphasized day-5 results (e.g., Mulcahy et al., 2014; Cheng and Yang, 2023).
We examined the 2023 summer mean top-of-atmosphere (TOA) upward shortwave (SW) fluxes, outgoing longwave radiation (OLR), and surface downward longwave fluxes. However, no distinct spatial patterns directly attributable to the wildfires were identified, likely due to the complex feedback processes involved. Moreover, the differences between the model simulations and Clouds and the Earth's Radiant Energy System (CERES) and Energy Balanced and Filled (EBAF, Kato et al. 2018) observations are generally larger than the differences among the experiments themselves.
The downward surface shortwave (SW) flux from EXP CTL with climatological forcing is characterized by stronger fluxes in the south and weaker ones in the north (Figure 4a). This pattern is mainly attributed to the effects of aerosols and clouds, as discussed in the following sections. Signals associated with wildfires can also be identified in the surface downward SW flux (Figure 4c–d). The reduction in downward SW flux, caused by the reflection, scattering, and attenuation of radiation by aerosols and clouds, is evident over northwestern Canada, with a small region showing statistically significant changes (above the 95% confidence level based on the Student’s t-test) in the RTF, GOC, and RTACI experiments. The affected region extends primarily in a northwest–southeast orientation, consistent with the spatial pattern of the wildfire. Notably, EXP RTACI shows extensive areas of reduced downward SW flux over the Arctic, the North Pacific, and the eastern coast, where moisture is abundant.
The total aerosol optical depth (AOD; Figure 5a) can partially explain the spatial pattern of the surface downward shortwave (SW) flux shown in Figure 4a. For instance, the region with the lowest AOD between 180°W–100°W and 30°N–40°N corresponds well to the area of strongest downward SW flux. However, the reduced downward SW flux near the Arctic does not coincide with particularly high AOD values between 45°N and 70°N, suggesting that clouds may play a more dominant role in modulating SW radiation there.
The three sensitivity experiments—RTF, GOC, and RTACI—indicate that wildfire-produced aerosols generated two AOD centers (Figure 5c–d): one over northwestern Canada and another over the southeast. These regions correspond closely to areas of reduced surface downward SW flux (Figure 4c–d). EXP RTF and EXP RTACI show very similar AOD distributions, implying that aerosol–cloud interactions exert limited influence on AOD. In contrast, EXP GOC exhibits the largest AOD values, especially over eastern Canada.
Black carbon (BC) and organic aerosols (OA)—including primary and secondary organic carbon—are the dominant carbonaceous species produced by wildfires. In a typical year without major wildfire events, BC and OA account for approximately half of the total aerosol optical depth (AOD; Figure 6a). During the wildfire period, the BC and OA AOD increased by about 50%, with EXP RTACI showing the largest enhancement. Comparing Figure 5c–d and 6c–d reveals that the regional mean AOD increase in EXP RTF and EXP RTACI is about 0.018, and 0.047, primarily attributable to BC and OA. In contrast, EXP GOC exhibits an AOD increase of approximately 0.041, some of which originates from aerosol species other than BC and OA in north-east Canada.
The spatial pattern of 2-m temperature (Figure 7a) closely resembles that of the surface downward shortwave (SW) flux (Figure 4a), with warmer temperatures in the south corresponding to stronger downward SW fluxes and cooler temperatures in the north associated with weaker fluxes. This indicates that the 2-m temperature largely reflects the influence of surface SW radiation. The differences in 2-m temperature between the three sensitivity experiments and CTL (Figure 7c–d) also correspond well to the respective SW flux differences. The negative temperature anomalies induced by high aerosol loading and elevated AOD from wildfires are distributed along a northwest–southeast axis, with the strongest cooling over northwestern Canada, where the changes exceed the 95% confidence level based on the Student’s t-test. Among all experiments, EXP RTACI produces the largest area of negative 2-m temperature anomalies, likely due to the combined effects of abundant cloud condensation nuclei (CCN), ice nuclei (IN), and water vapor in that region.
In addition to aerosols, clouds (Figure 8a and Figure 9a) also play an important role in shaping the spatial patterns of the surface downward shortwave (SW) flux. The lower cloud fraction in the south, which increases toward the north, leads to stronger downward SW fluxes in southern regions and weaker fluxes in the north (Figure 4a). Mid-level clouds are much less abundant than high and low clouds, follow a similar spatial pattern, and are therefore not shown here.
The direct effects of aerosols on high clouds are relatively small. A slight increase in high cloud cover near 60°N and 115°W (Figure 8b and Figure 8c) is evident in EXP RTF and EXP GOC, likely resulting from cooling caused by enhanced SW reflection by aerosols. In contrast, the indirect aerosol effects lead to an overall 5% increase in total cloud fraction across the domain, primarily due to the enhanced availability of ice nuclei (IN) and cloud condensation nuclei (CCN) from the increased aerosol loadings.
The response of low-level clouds differs from that of high-level clouds. A reduction in low cloud cover is observed over central Canada (45°N–65°N, 110°W–80°W) across all three sensitivity experiments, despite an overall regional increase of about 2% in EXP RTACI. This reduction is likely associated with the warming effect of black carbon, which absorbs shortwave radiation and reduces cloud formation locally.
The regional distribution of cloud water (including both liquid and ice components; Figure 10a) is generally consistent with the cloud fraction patterns shown in Figure 8a and Figure 9a, except for the large cloud water concentrations over the North Pacific and along the eastern coast of Canada. The two experiments that include only aerosol–radiation interactions (ARI)—EXP RTF and EXP GOC—do not produce distinct spatial patterns of cloud water (Figure 10b–c). In contrast, EXP RTACI generates substantially greater liquid water content over the ocean and the eastern coast of Canada, where both moisture and IN/CCN concentrations are high. The limited cloud water over central Canada may be attributed to two factors: (1) competition for available moisture among aerosols to form IN and CCN, and (2) the heating effect of black carbon, which absorbs shortwave radiation and suppresses cloud formation.
To quantitatively assess the impact of wildfires on radiation fluxes, the root-mean-square errors (RMSEs) of the top-of-atmosphere (TOA) upward shortwave (SW) fluxes against CERES-EBAF observations are listed in Table 4 for both the global and North American domains. The two experiments that include wildfire aerosol effects, RTF and GOC, perform better than CTL globally and regionally, as expected, with EXP GOC showing slightly better skill. For North America, EXP RTACI produces the smallest RMSE among all experiments, although it performs the worst globally. It should be noted that the UFS model has not been retuned after including aerosol–cloud interactions (ACI). The feedbacks among clouds, radiation, and aerosols are highly complex, making consistent improvements in RMSE and anomaly correlation (AC) scores—discussed later—particularly challenging.
The outgoing longwave radiation (OLR), which reflects the combined effects of cloud and surface processes, is summarized in Table 5. None of the three sensitivity experiments shows improvement over CTL, suggesting that the inclusion of wildfire aerosols does not substantially enhance the representation of cloud and surface processes. The performance of the three sensitivity experiments for surface downward SW fluxes (Table 6) is generally consistent with that of the TOA upward SW fluxes. For surface downward longwave (LW) fluxes (Table 7), EXP RTACI performs best both globally and regionally, while the other three experiments (CTL, RTF, and GOC) yield comparable results—although EXP GOC performs slightly worse globally and EXP RTF slightly worse regionally compared to CTL.
3.3. A Case Study
Although the summer-mean RMSE and bias analyses presented above are essential for understanding the direct and indirect aerosol effects, a process-level case study provides deeper insight. A 10-day free forecast initialized at 00 UTC on August 21, 2023, was analyzed to examine these effects in more detail. Figure 11a shows the time series of large-scale precipitation (solid lines) and convective precipitation (dotted lines) for the four experiments and the NCEP analysis (denoted as OBS), averaged over the region 40°–65°N and 130°–65°W.
During the first seven days, all four experiments produce similar total and convective precipitation. However, after August 27, the simulations begin to diverge, with EXP CTL and EXP RTACI yielding higher total and convective precipitation. EXP GOC consistently produces the least precipitation, while EXP RTF exhibits a sharp increase in total precipitation primarily due to enhanced large-scale precipitation, as the convective component shows no comparable increase.
Correspondingly, EXP RTACI produces the largest amounts of low-, middle-, and high-level cloud cover during the final three days of the forecast, whereas EXP GOC produces the least (Figure 11b–d). These differences suggest that aerosol indirect effects play a significant role in EXP RTACI. Enhanced wildfire aerosols increase the activation of ice nuclei (IN) and cloud condensation nuclei (CCN), leading to greater cloud formation (Twomey, 1977). In contrast, the reduced cloud and precipitation in EXP GOC may be attributed to aerosol semi-direct effects: black carbon absorbs solar radiation, warms the cloud layer, and raises the threshold for water condensation (Hansen et al., 2005; Koch and Del Genio, 2010).
The aerosol optical depths (AODs) of BC and OA produced by wildfires increase by approximately 57% in EXP RTF and EXP RTACI, and by nearly 105% in EXP GOC (Figure 12). The wildfires are primarily located in northwestern Canada, which also corresponds to the region of highest climatological BC and OA concentration (Figure 12a). The substantially larger BC and OA AOD in EXP GOC may be linked to the reduced cloud cover and precipitation observed in that experiment, likely as a result of the aerosol semi-direct effect (Figure 11c). The AOD patterns and magnitudes in EXP RTF and EXP RTACI are very similar, as both use the same aerosol forcing; the minor differences between them arise mainly from variations in relative humidity.
The aerosol direct effects—namely extinction, scattering, and reflection—largely determine the distribution of surface downward shortwave (SW) fluxes (Figure 13). In EXP CTL (Figure 13a), stronger downward SW fluxes are found in the south where AOD is low, while weaker fluxes occur in the north where AOD is high. The elevated AOD in northwestern Canada due to wildfire emissions leads to reduced downward SW fluxes in this region across all three sensitivity experiments (Figure 13b–d). The aerosol indirect effects in EXP RTACI appear to amplify the direct effects, producing the lowest downward SW fluxes in northwestern Canada, extending eastward, and the highest fluxes in the south. This pattern suggests that increased aerosol loading enhances cloud formation and reflection, while reduced aerosol concentrations are associated with fewer clouds and stronger surface SW fluxes.
The spatial patterns of surface temperature (Figure 14) correspond closely to those of the surface downward shortwave (SW) fluxes. The region of higher surface temperatures between 40°N–50°N and 110°W–80°W (Figure 14a) aligns well with the areas of stronger downward SW flux in the control experiment (Figure 13a). In contrast, the three sensitivity experiments exhibit lower temperatures over northwestern Canada and higher temperatures in the south (Figure 14c–d). Overall, the net effect of the wildfire aerosols is surface cooling, despite localized warming in the south, with regional mean temperature changes of −0.061 K for EXP RTF, −0.075 K for EXP GOC, and −0.17 K for EXP RTACI, respectively. The cooling magnitude more than doubles when aerosol indirect effects are included, consistent with previous studies (e.g., Jiang et al., 2020; Xu et al., 2021).
The convective available potential energy (CAPE) during the event reaches its maximum where surface temperatures are highest (Figure 15a). However, the majority of the domain exhibits CAPE values below 110 J kg⁻¹, likely reflecting the influence of complex interactions between temperature and moisture. In the three sensitivity experiments, the lowest CAPE occurs over northwestern Canada, coinciding with the coolest surface temperatures (Figure 15c–d). EXP GOC has the smallest regional mean CAPE, followed by EXP RTACI. The experiments with real-time forcing (EXP RTF and EXP RTACI) show elevated CAPE south of 45°N and between 110°W–85°W, even in the absence of warm surface temperatures, suggesting that processes unrelated to aerosol-induced cooling and warming contribute to these CAPE enhancements.
In EXP CTL, convective precipitation is largest between 50°–55°N and 110°–125°W (Figure 16a), corresponding to areas where surface CAPE exceeds 110 J kg⁻¹ (Figure 15a). However, convective activity also occurs in regions with relatively low CAPE, such as eastern Canada, indicating that convection can be triggered even with modest CAPE values and that CAPE may not be the dominant factor. Interestingly, EXP GOC exhibits the lowest regional mean CAPE but produces the most deep convective precipitation among the three sensitivity experiments (Figure 16c–d). Furthermore, the spatial distribution of deep convective precipitation in all three experiments follows a southeast-to-northwest orientation, consistent with the wildfire locations and associated aerosol loading.
The spatial pattern of large-scale precipitation in EXP CTL (Figure 17a) is generally similar to that of deep convective precipitation, although the regional mean is more than twice as large. Unlike convective precipitation, the large-scale precipitation pattern does not closely follow the surface temperature distribution (Figure 14a). However, it appears to correspond reasonably well with AOD, particularly over eastern Canada (Figure 12a). Since aerosol semi-direct effects tend to warm the atmosphere, the cooling direct effects of aerosols may play a more significant role in modulating large-scale precipitation. EXP RTACI, which includes aerosol indirect effects, produces more large-scale precipitation than the other two experiments that include only direct aerosol effects (Figure 17c–d). The precipitation anomalies predominantly extend in a west-to-east direction, suggesting that factors other than aerosols may be important in shaping this pattern.
3.4. Impact on Large-Scale NWP Forecast Skill
Previous studies have reported mixed results regarding the impact of aerosols on the forecast skill of numerical weather prediction (NWP) models. Incorporating more sophisticated aerosol–cloud–radiation interaction schemes does not always improve forecast skill due to the complex feedbacks and inherent uncertainties (e.g., Reale et al., 2011; Mulcahy et al., 2014). Using monthly varying aerosol climatology instead of a fixed climatology in the ECMWF IFS, Rodwell and Jung (2008) found improved forecast skill at 5–10-day lead times in both tropical and extratropical regions. However, there has been limited work examining the influence of wildfires on global and regional forecast skill. In this section, we investigate the impact of wildfire aerosol forcing on overall medium-range weather forecast skill.
Figure 18 illustrates the differences in 500-hPa geopotential height anomaly correlation (AC) scores between the three sensitivity experiments and the CTL run for the summer of 2023. Scores are provided for the global domain, the Northern Hemisphere (20°N–80°N), and the Southern Hemisphere (20°S–80°S). Calculated against NCEP reanalysis, the AC score quantifies model fidelity in representing synoptic-scale systems. While forecast skill improves at 5–10-day lead times across all domains—consistent with Rodwell and Jung (2008)—these differences do not exceed the 95% significance level (determined via Student’s t-test).
The absence of short-term (1–5 day) improvements suggests that aerosol effects on rapid processes, such as deep convection and frontal systems, are negligible in this configuration. Instead, the delayed improvement at 5–10 days indicates that wildfire feedbacks operate primarily through relatively slow processes, specifically through aerosol optical depth (AOD) impact on radiative forcing and temperature distribution. This aligns with our case study, which suggested that aerosol loading are not the dominant direct drivers of large-scale or convective precipitation. Despite being modest, these enhancements represent a meaningful advancement in the physical representation and predictive performance of the GFS.
4. Discussion and Conclusions
This paper presents a detailed analysis of the impact of real-time wildfire aerosol forcing on global weather forecast models during the 2023 summer Canadian wildfires, using four different experimental setups (EXP_CTL, EXP_GOC, EXP_RTF, and EXP_RTACI). The results are broken down into three main sections: effects on aerosol optical depth (AOD), effects on radiation fluxes and surface variables, and overall impact on forecast skill.
The analysis confirms that experiments without real-time wildfire aerosol forcing (EXP_CTL) significantly underestimated the Aerosol Optical Depth (AOD) in the Northern Hemisphere compared to observations, an error that increased over the forecast lead time due to a positive feedback loop involving surface warming. The experiment including real-time forcing but without aerosol-cloud interactions (EXP_RTF) showed the best overall AOD skill (smallest Root-Mean-Square Error), indicating that incorporating the forcing improves the global forecast. Black carbon and organic aerosol were identified as the primary wildfire aerosol, and its increase led to reduced surface downward shortwave (SW) flux—a cooling effect—evident over northwestern Canada, the core wildfire region. This reduction was consistent with two AOD centers generated by the wildfire aerosols, one over northwestern Canada and one over the southeast.
The reduction in surface SW flux corresponded directly to negative 2-m temperature anomalies (surface cooling), with the largest cooling observed in the experiment that included both aerosol-radiation and aerosol-cloud interactions (EXP_RTACI). Clouds played a key modulatory role, with aerosol indirect effects in EXP_RTACI leading to an overall 5% increase in total cloud fraction by enhancing the available cloud condensation and ice nuclei. A case study further highlighted the differing impacts on precipitation: EXP_RTACI produced the highest precipitation and cloud cover (due to enhanced nuclei and indirect effects), while EXP_GOC consistently produced the least, likely due to the aerosol semi-direct effect where black carbon absorbs solar radiation, warms the cloud layer, and suppresses formation.
The study examined the impact on Numerical Weather Prediction (NWP) skill using 500-hPa height anomaly correlation (AC) scores. Consistent with some previous research, the forecast skill of the sensitive experiments modestly improved over the control experiment at 5–10-day lead times across the global domain and both hemispheres, though the changes were generally not statistically significant at the 95% level. The delayed improvement suggests that the wildfire feedback on large-scale weather operates through relatively slow processes like AOD and radiation changes. Ultimately, the results demonstrate that incorporating real-time wildfire aerosol forcing, particularly with aerosol-cloud interactions (EXP_RTACI), represents a step forward in the physical representation and overall performance of the Global Forecast System (GFS) model.
Data: Availability Statement
MERRA2 data are available at MDISC, managed by the NASA Goddard Earth Sciences (GES) Data and Information Services Center (DISC). CERES-EBAF data is downloaded from the LaRC NASA data center. MODIS is available at http://ladsweb.nascom.nasa.gov/data/search.html.
Acknowledgments
The Authors would like to thank my colleagues in EMC and universities for insightful discussions.
References
- Buchard, V.; A. Randles, C.; da Silva, A. M.; Darmenov, A.; Colarco, P. R.; Govindaraju, R.; Ferrare, R.; Hair, J.; Beyersdorf, A. J.; Ziemba, L. D.; Yu, H. The MERRA-2 Aerosol Reanalysis, 1980-Onward, Part II: Evaluation and Case Studies. J. Climate 2017, 30, 6851–6872. [Google Scholar] [CrossRef]
- Cheng, A; Yang, F. Direct radiative effects of aerosols on numerical weather forecasts—a comparison of two aerosol datasets in the NCEP GFS. Weather Forecast 2023, 38(5), 753–772. [Google Scholar] [CrossRef]
- Cheng, A; Yang, F. Aerosol, Clouds and Radiation Interactions in the NCEP Unified Forecast Systems. Meteorology 2025, 4(2), 14. [Google Scholar] [CrossRef]
- Chin, M.; Ginoux, P.; Kinne, S.; Torres, O.; Holben, B. N.; Duncan, B. N.; Nakajima, T. : Tropospheric aerosol optical thickness from the GOCART model and comparisons with satellite and Sun photometer measurements. Journal of the atmospheric sciences 2002, 59(3), 461–483. [Google Scholar] [CrossRef]
- Colarco, P.; da Silva, A.; Chin, M.; Diehl, T. Online simulations of global aerosol distributions in the NASA GEOS-4 model and comparisons to satellite and ground-based aerosol optical depth. Journal of Geophysical Research: Atmospheres 2010, 115. [Google Scholar] [CrossRef]
- Conrick, R.; Mass, C. F.; Boomgard-Zagrodnik, J. P.; Ovens, D. : The Influence of Wildfire Smoke on Cloud Microphysics during the September 2020 Pacific Northwest Wildfires. Weather Forecast. 36, 1519–1536. [CrossRef]
- Hansen, J. E.; Sato, M.; Ruedy, R. Radiative forcing and climate response. J. Geophys. Res. 1997, 102, 6831–6864. [Google Scholar] [CrossRef]
- Hulstrom, R. L.; Stoffel, T. L. Some effects of the Yellowstone fire smoke cloud on incident solar irradiance. J. Clim. 1990, 3, 1485–1490. [Google Scholar] [CrossRef]
- Jiang, Y.; Yang, X.-Q.; Liu, X.; Qian, Y.; Zhang, K.; Wang, M.; Li, F.; Wang, Y.; Lu, Z. : Impacts of wildfire aerosols on global energy budget and climate, 2020: The role of climate feedbacks. J. Climate 33, 3351–3366. [CrossRef]
- Jones, M. W. Kelley, and coauthors 2024: State of Wildfires 2023–2024. Earth Syst. Sci. Data 16, 3601–3685. [CrossRef]
- Kato, S.; Rose, F. G.; Rutan, D. A.; Thorsen, T. J.; Loeb, N. G.; Doelling, D. R.; et al. Surface Irradiances of Edition 4.0 Clouds and the Earth’s Radiant Energy System (CERES) Energy Balanced and Filled (EBAF) data product. Journal of Climate 2018, 31, 4501–4527. [Google Scholar] [CrossRef]
- Kaufman, Y.; Fraser, R. The effect of smoke particles on clouds and climate forcing. Science 1997, 277, 1636–1639. [Google Scholar] [CrossRef]
- Kaufman, Y.; Nakajima, T. Effect of Amazon smoke on cloud microphysics and albedo: Analysis from satellite imagery. J. Appl. Meteorol. 1993, 32, 729–744. [Google Scholar] [CrossRef]
- Koch, D.; Del Genio, A.D. Black carbon absorption effects on cloud cover: Review and synthesis. Atmos. Chem. Phys. 2010, 10, 7685–7696. [Google Scholar] [CrossRef]
- Koren, I.; Kaufmann, Y. J.; Remer, L. A.; Martins, J. V. Measurement of the effect of Amazon smoke on inhibition of cloud formation. Science 2004, 303, 1342–1345. [Google Scholar] [CrossRef] [PubMed]
- Mlawer, E.J.; Taubman, S. J.; Brown, P. D.; Iacono, M. J.; Clough, S. A. Radiative transfer for inhomogeneous atmospheres: RRTM, a validated correlated-k model for the l ongwave. J. Geophys. Res. 102 1997, 16663–16682. [Google Scholar] [CrossRef]
- Mlawer, E.J.; Iacono, M.J.; Pincus, R.; Barker, H.W.; Oreopoulos, L.; Mitchell, D.L. Contributions of the ARM Program to Radiative Transfer Modeling for Climate and Weather Applications, The Atmospheric Radiation Measurement Program: The First 20 Years. Meteor. Monograph 2016, 57, Amer. Meteor. Soc.. [Google Scholar]
- Mulcahy, J. P.; Walters, D. N.; Bellouin, N.; Milton, S. F. Impacts of increasing the aerosol complexity in the Met Office global numerical weather prediction model. Atmos. Chem. Phys. 2014, 14, 4749–4778. [Google Scholar] [CrossRef]
- Pan, L.; Bhattacharjee, P. S.; Zhang, L.; Montuoro, R.; Baker, B.; McQueen, J.; Stajner, I. Analysis of GEFS-Aerosols annual budget to better understand the aerosol predictions simulated in the model. Geoscientific Model Development Discussions 2023, 2023, 1–32. [Google Scholar] [CrossRef]
- Peace, M.; Mattner, T.; Mills, G.; Kepert, J.; McCaw, L. Fire-modified meteorology in a coupled fire–atmosphere model. J. Appl. Meteor. Climatol. 2015, 54, 704–720. [Google Scholar] [CrossRef]
- Potter, B. E.; McEvoy, D. Weather factors associated with extremely large fires and fire growth days. Earth Interactions 2021, 25(1), 160–176. [Google Scholar] [CrossRef]
- Ramanathan, V.; Crutzen, P. J.; Kiehl, J. T.; Rosenfeld, D. Aerosols, climate, and the hydrological cycle. Science 2001, 294, 2119–2124. [Google Scholar] [CrossRef]
- Randles, C. A.; da Silva, A. M.; Buchard, V.; Colarco, P. R.; Darmenov, A.; Govindaraju, R.; Smirnov, Q.; Holben, B.; Ferrare, R.; Hair, J.; Shinozuka, Y.; Flynn, C. J. The MERRA-2 Aerosol Reanalysis, 1980 - Onward, Part I: System Description and Data Assimilation Evaluation. J. Climate 2017, 30, 6823–6850. [Google Scholar] [CrossRef]
- Reale, O.; Lau, K. M.; Silva, A. D. Impact of interactive aerosol on the African Easterly Jet in the NASA GEOS-5 global forecasting system. Wea. Forecast. 2011, 26, 504–519. [Google Scholar] [CrossRef]
- Robock, A. Surface cooling due to forest fire smoke. Journal of Geophysical Research 1991, 96(D11), 20869–20878. [Google Scholar] [CrossRef]
- Roberts, G.C.; Nenes, A.; Seinfeld, J.H.; Andreae, M.O. 2003: Impact of biomass burning on cloud properties in the Amazon Basin. J. Geophys. Res. 108, 4062. [CrossRef]
- Rodwell, M. J.; Jung, T. Understanding the local and global impacts of model physics changes: an aerosol example. Q. J. R. Meteorol. Soc. 2008, 134, 1479–1497. [Google Scholar] [CrossRef]
- Rosenfeld, D. TRMM observed first direct evidence of smoke from forest fires inhibiting rainfall. Geophys. Res.Lett 1999, 26, 3105–3108. [Google Scholar] [CrossRef]
- Shen, J.; Cohen, R. C.; Wolfe, G. M.; Jin, X. : Impacts of wildfire smoke aerosols on near-surface ozone photochemistry. Atmos. Chem. Phys. 2025, 25, 8701–8718. [Google Scholar] [CrossRef]
- Thompson, G.; Field, P. R.; Rasmussen, R. M.; Hall, W. D. Explicit forecasts of winter precipitation using an improved bulk microphysics scheme. Part II: Implementation of a new snow parameterization. Mon. Wea. Rev. 2008, 136, 5095–5115. [Google Scholar] [CrossRef]
- Thompson, G.; Rasmussen, R. M.; Manning, K. W. Explicit forecasts of winter precipitation using an improved bulk microphysics scheme. Part I: Description and sensitivity analysis. Mon. Wea. Rev. 2004, 132, 519–542. [Google Scholar] [CrossRef]
- Twomey, S. The influence of pollution on the shortwave albedo of clouds. J. Atmos. Sci. 1977, 34, 1149–1152. [Google Scholar] [CrossRef]
- Verma, S.; Prakash, D.; Ricaud, P.; Payra, S.; Atti´e, J. L.; Soni, M. A new classification of aerosol sources and types as measured over Jaipur, India. Aerosol Air Qual. Res. 2015, 15, 985–993. [Google Scholar] [CrossRef]
- Wang, J.; Bhattacharjee, P. S.; Tallapragada, V.; Lu, C. H.; Kondragunta, S.; Da Silva, A.; Harris, A. The implementation of NEMS GFS Aerosol Component (NGAC) Version 2.0 for global multispecies forecasting at NOAA/NCEP–Part 1: Model descriptions. Geoscientific Model Development 2018, 11(6), 2315–2332. [Google Scholar] [CrossRef]
- Xu, L.; Qing, Z.; William, J. R.; Yang, C.; Hailong, W.; Po-Lun, M.; James, T. : The influence of fire aerosols on surface climate and gross primary production in the Energy Exascale Earth System Model (E3SM). J. Climate 2021, 34, 7219–7238. [Google Scholar] [CrossRef]
- Yang. Model Upgrade Plan and Initial Results from a Prototype NCEP Global Forecast System Version 16, 10th Conference on Transition of Research to Operations, 100th AMS Annual Meeting. Boston, 2020; Available online: https://ams.confex.com/ams/2020Annual/meetingapp.cgi/Paper/362797.
- Zhang, L.; Montuoro, R.; McKeen, S. A.; Baker, B.; Bhattacharjee, P. S.; Grell, G. A.; Li, F. Development and evaluation of the aerosol forecast member in the National Center for Environment Prediction (NCEP)'s global ensemble forecast system (GEFS-Aerosols v1). Geoscientific Model Development 2022a, 15(13), 5337–5369. [Google Scholar] [CrossRef]
- Zhang, L.; Montuoro, R.; McKeen, S. A.; Baker, B.; Bhattacharjee, P. S.; Grell, G. A. & Li, F. (2022b): Development and evaluation of the aerosol forecast member in the National Center for Environment Prediction (NCEP)'s global ensemble forecast system (GEFS-Aerosols v1). Geoscientific Model Development 15(13), 5337–5369.
Figure 1.
Global distributions of the AOD bias against MODIS at the day 1 into forecasts, averaged for the 2023 summer from EXP CTL (a), RTF(b), GOC(c), and RTACI (d), respectively. In the following figures, we use the word 'minus' and the symbol '-' interchangeably.
Figure 1.
Global distributions of the AOD bias against MODIS at the day 1 into forecasts, averaged for the 2023 summer from EXP CTL (a), RTF(b), GOC(c), and RTACI (d), respectively. In the following figures, we use the word 'minus' and the symbol '-' interchangeably.
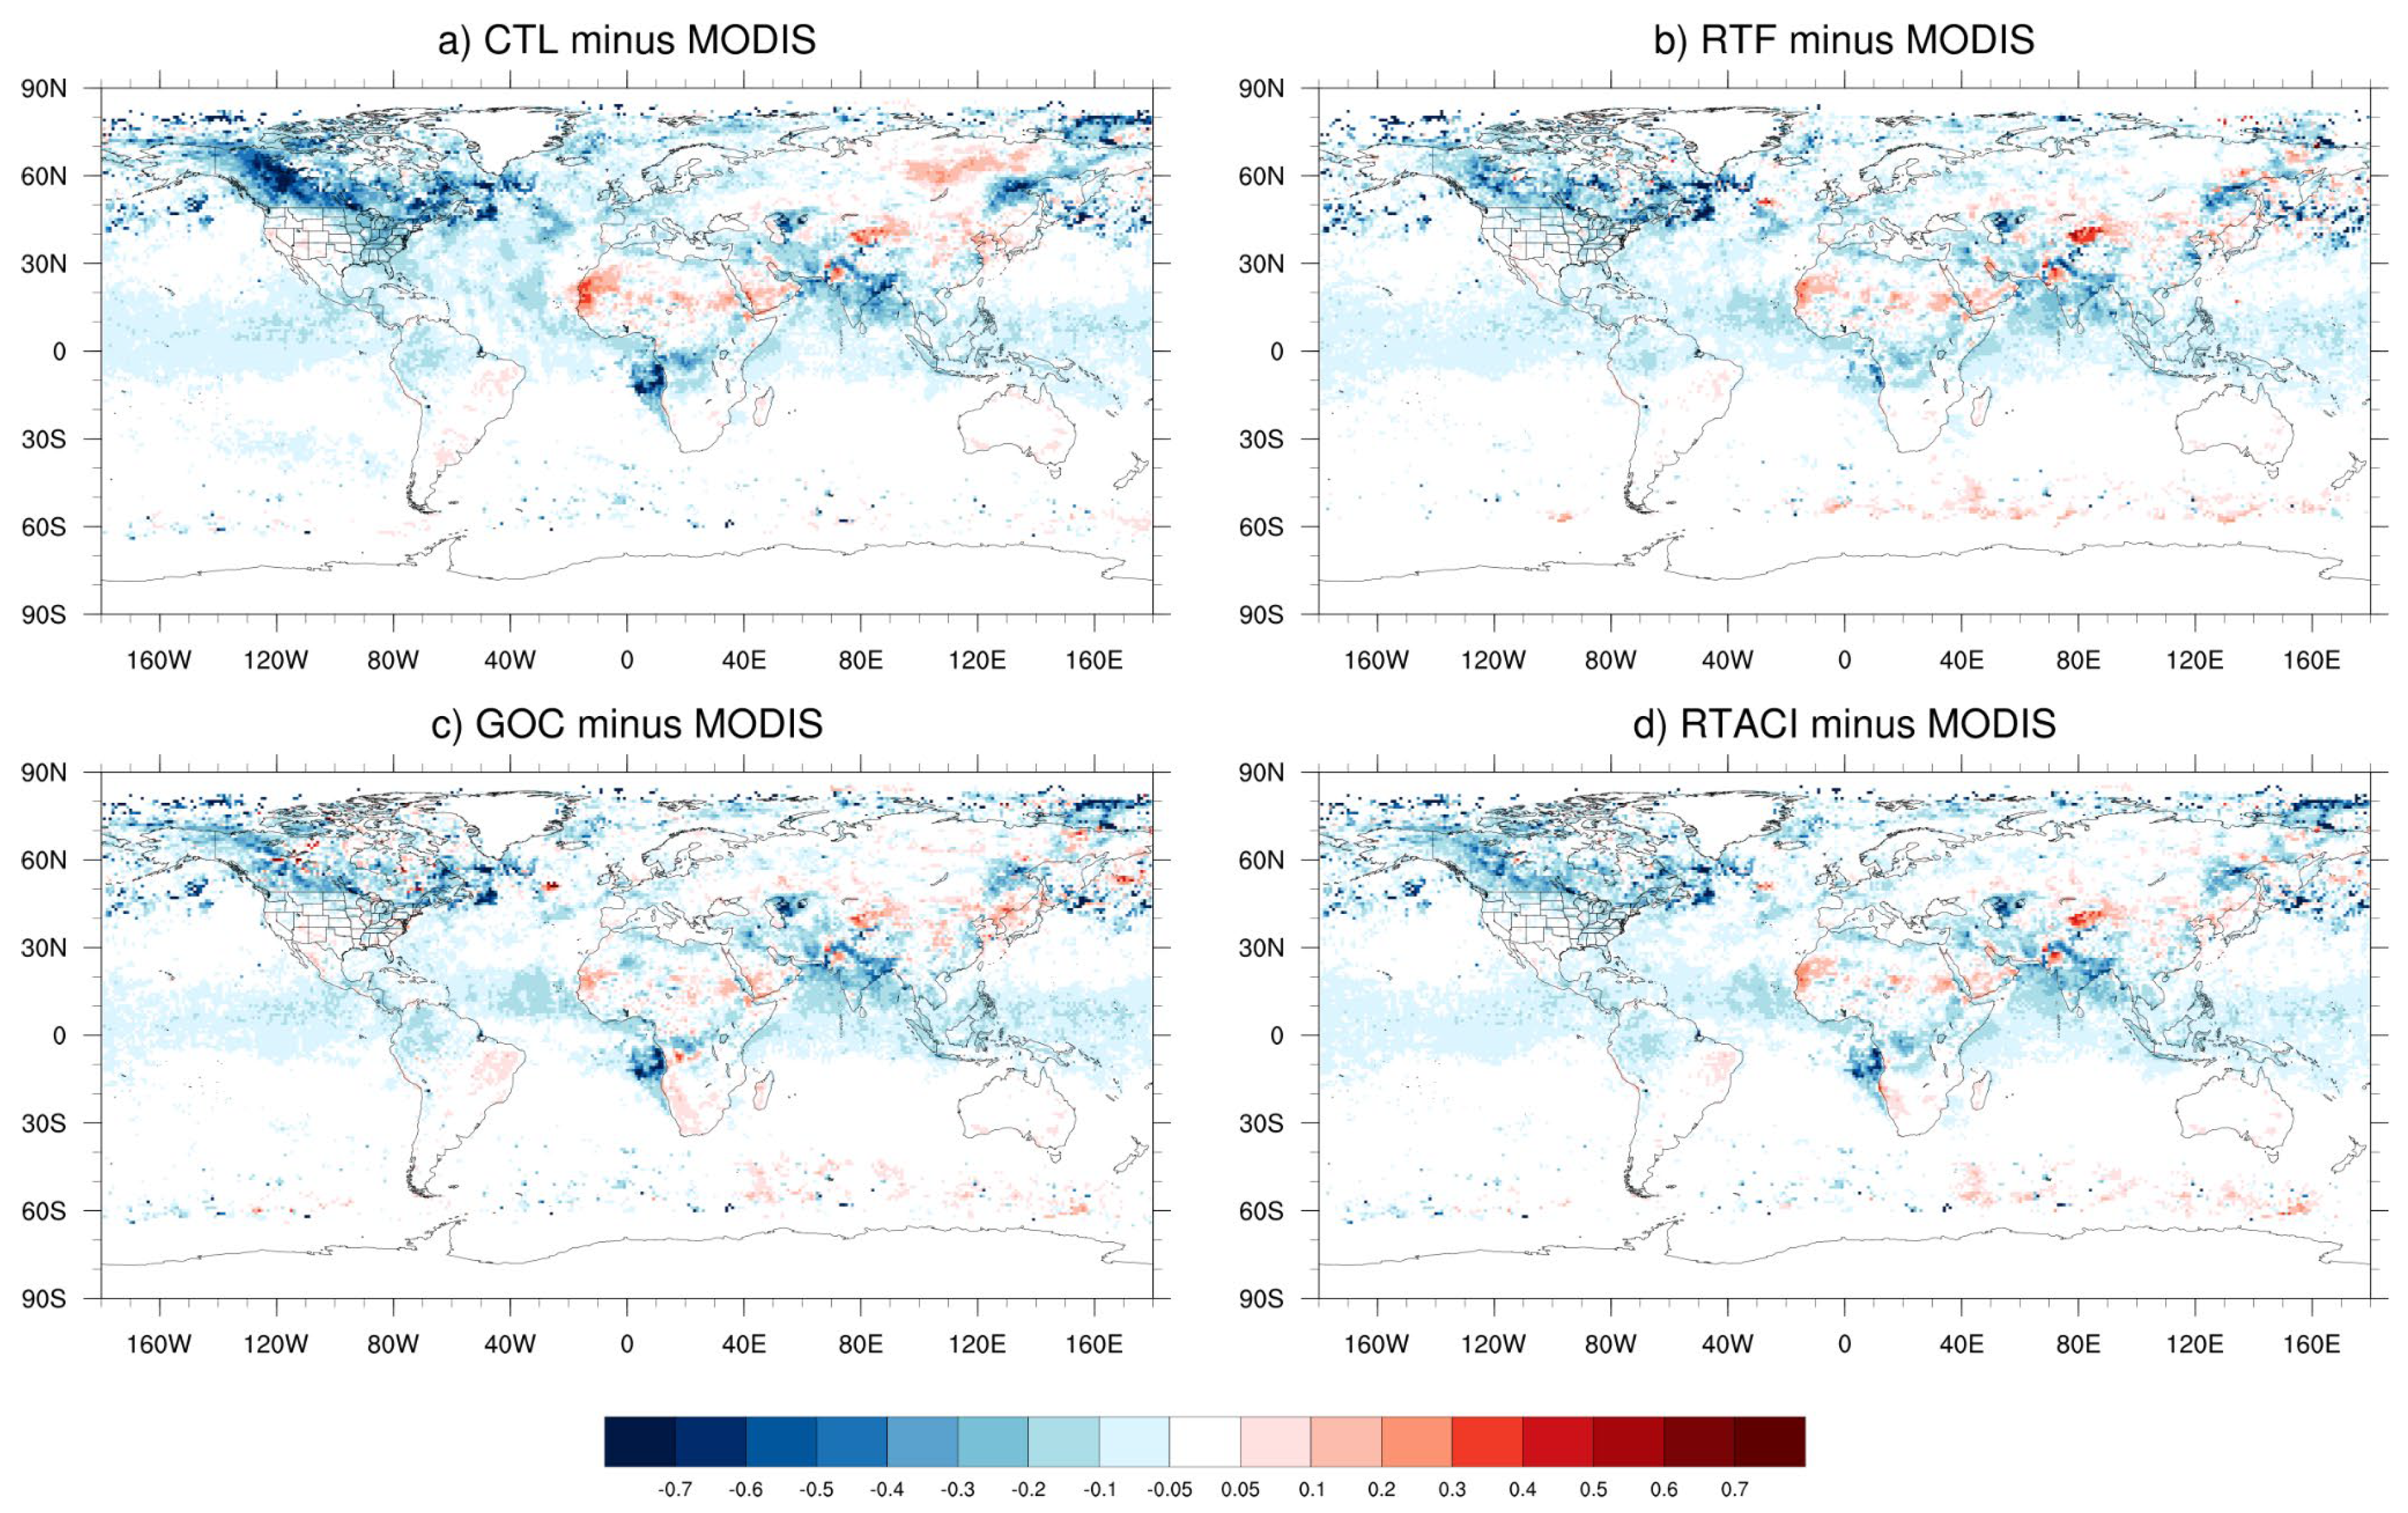
Figure 2.
Same as Figure 1 except for day 5 into forecasts.
Figure 2.
Same as Figure 1 except for day 5 into forecasts.
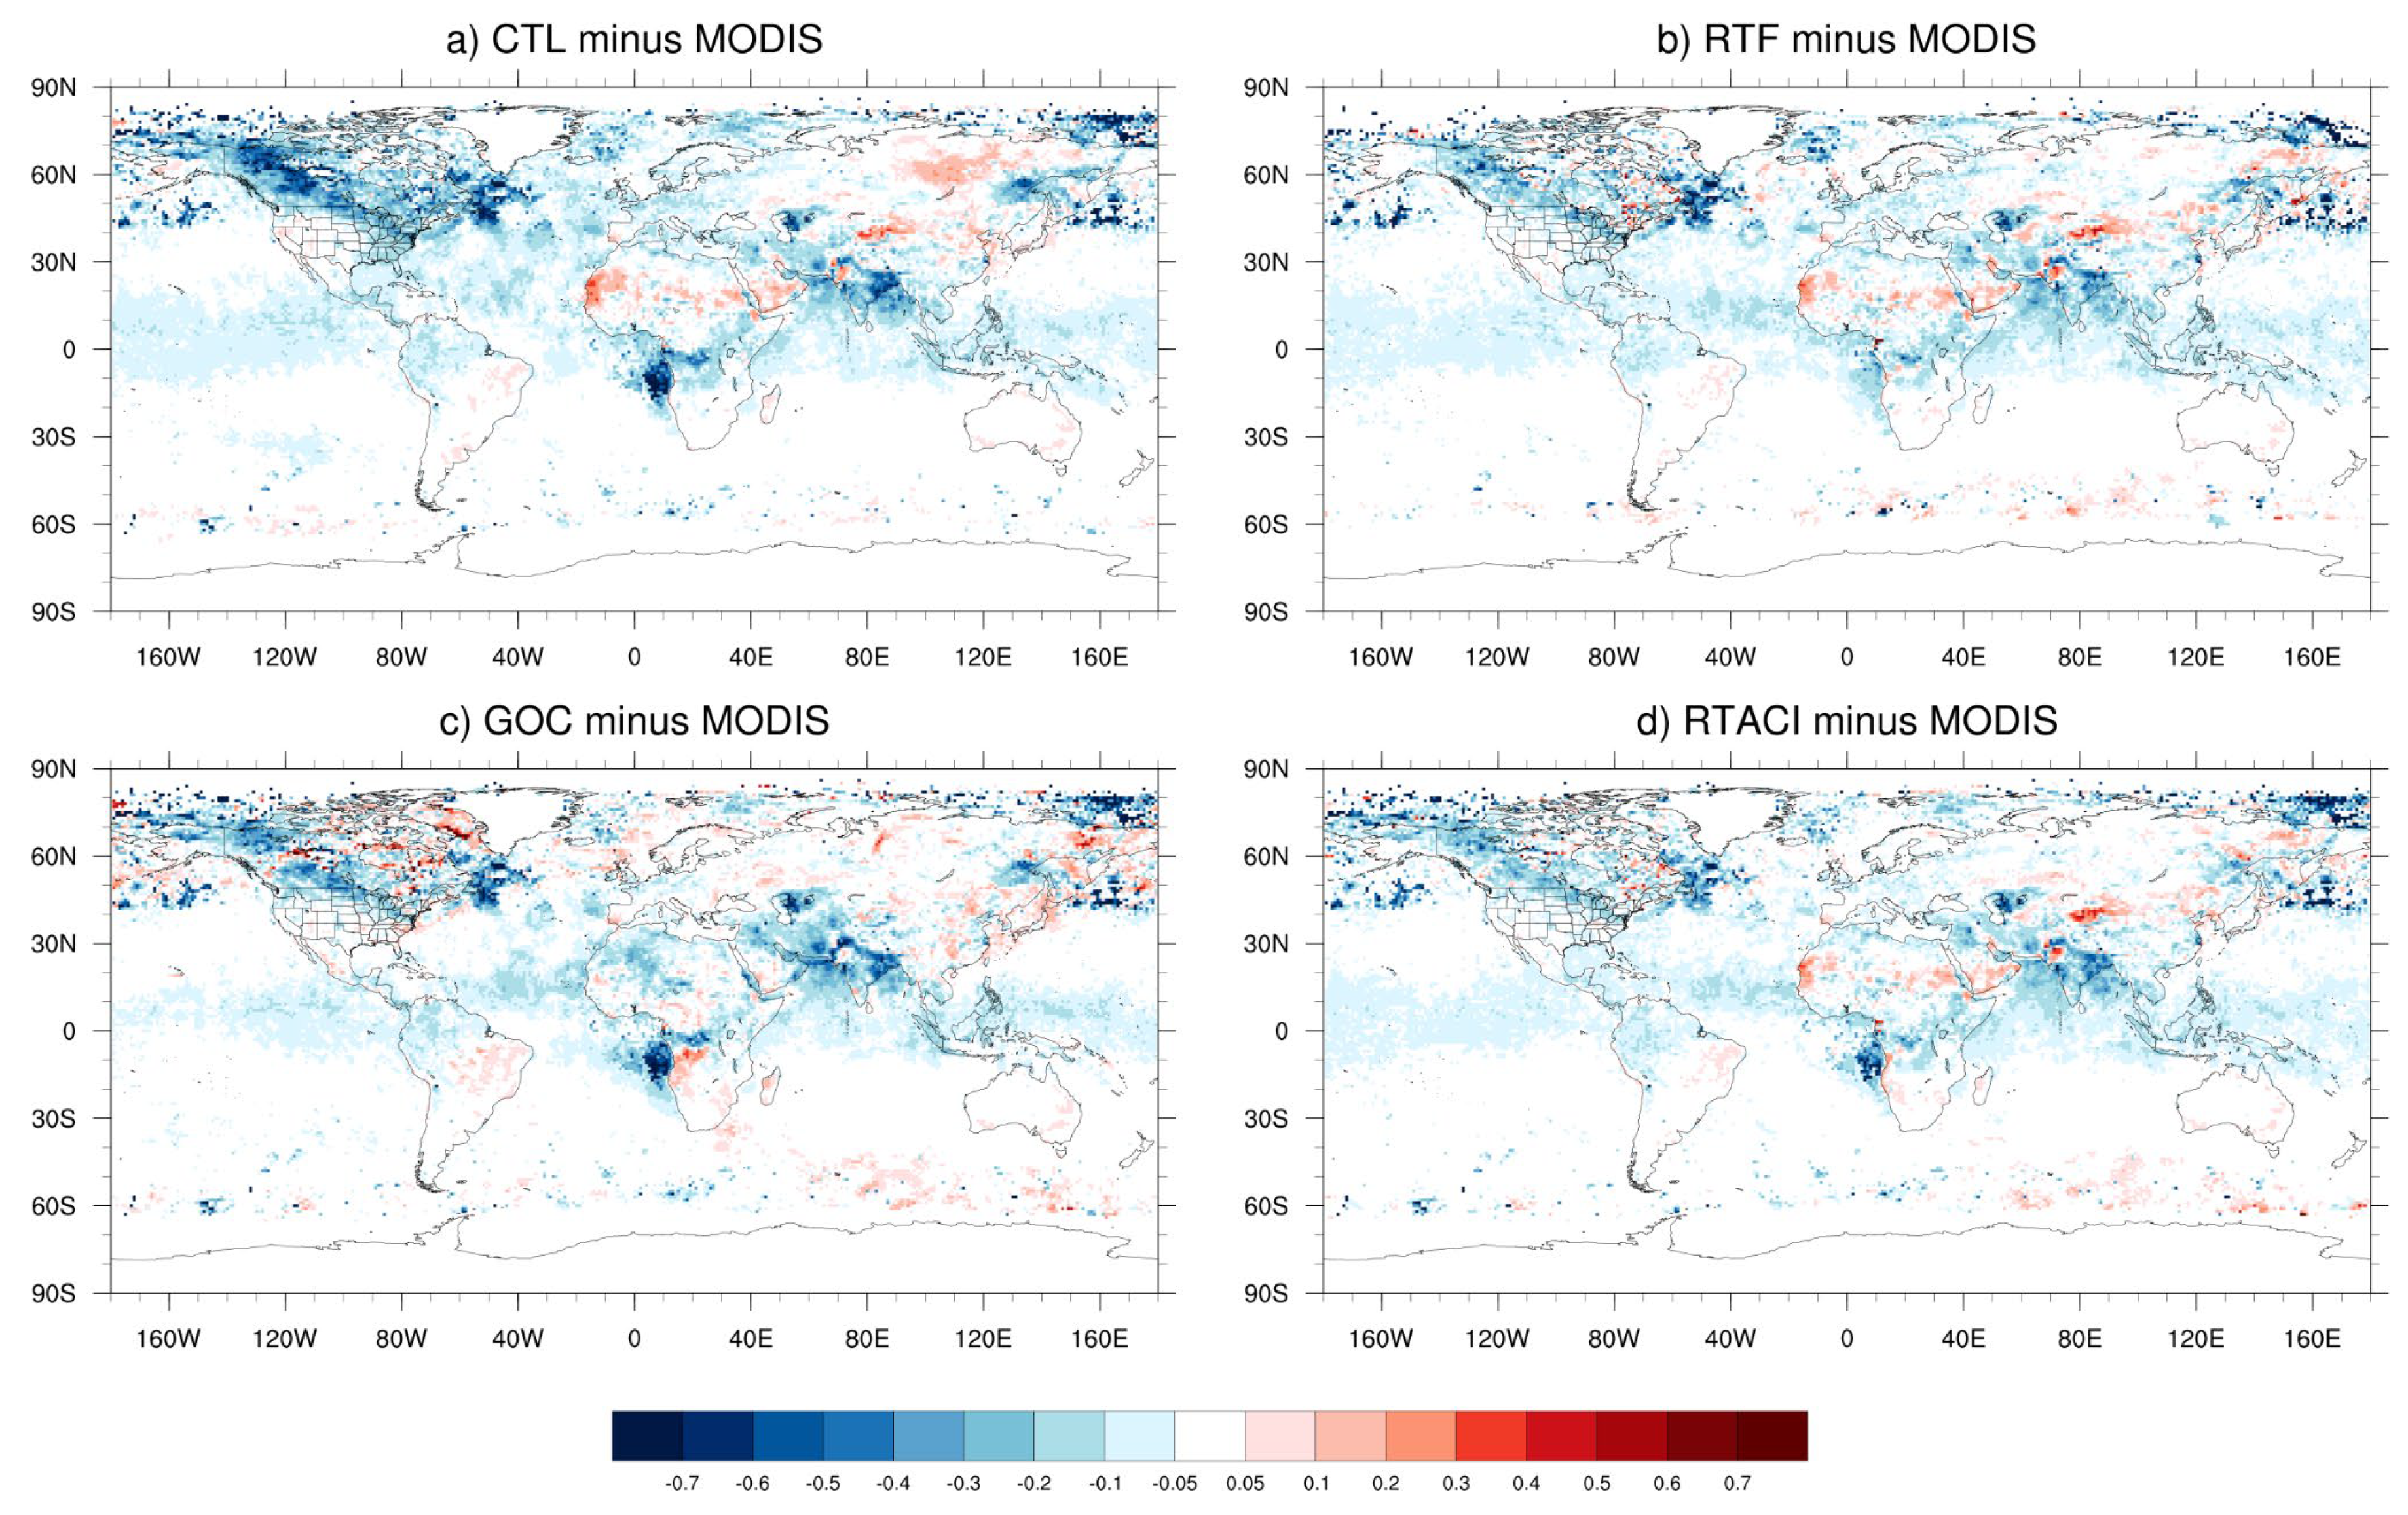
Figure 3.
Same as Figure 1 except for day 10 into forecasts.
Figure 3.
Same as Figure 1 except for day 10 into forecasts.
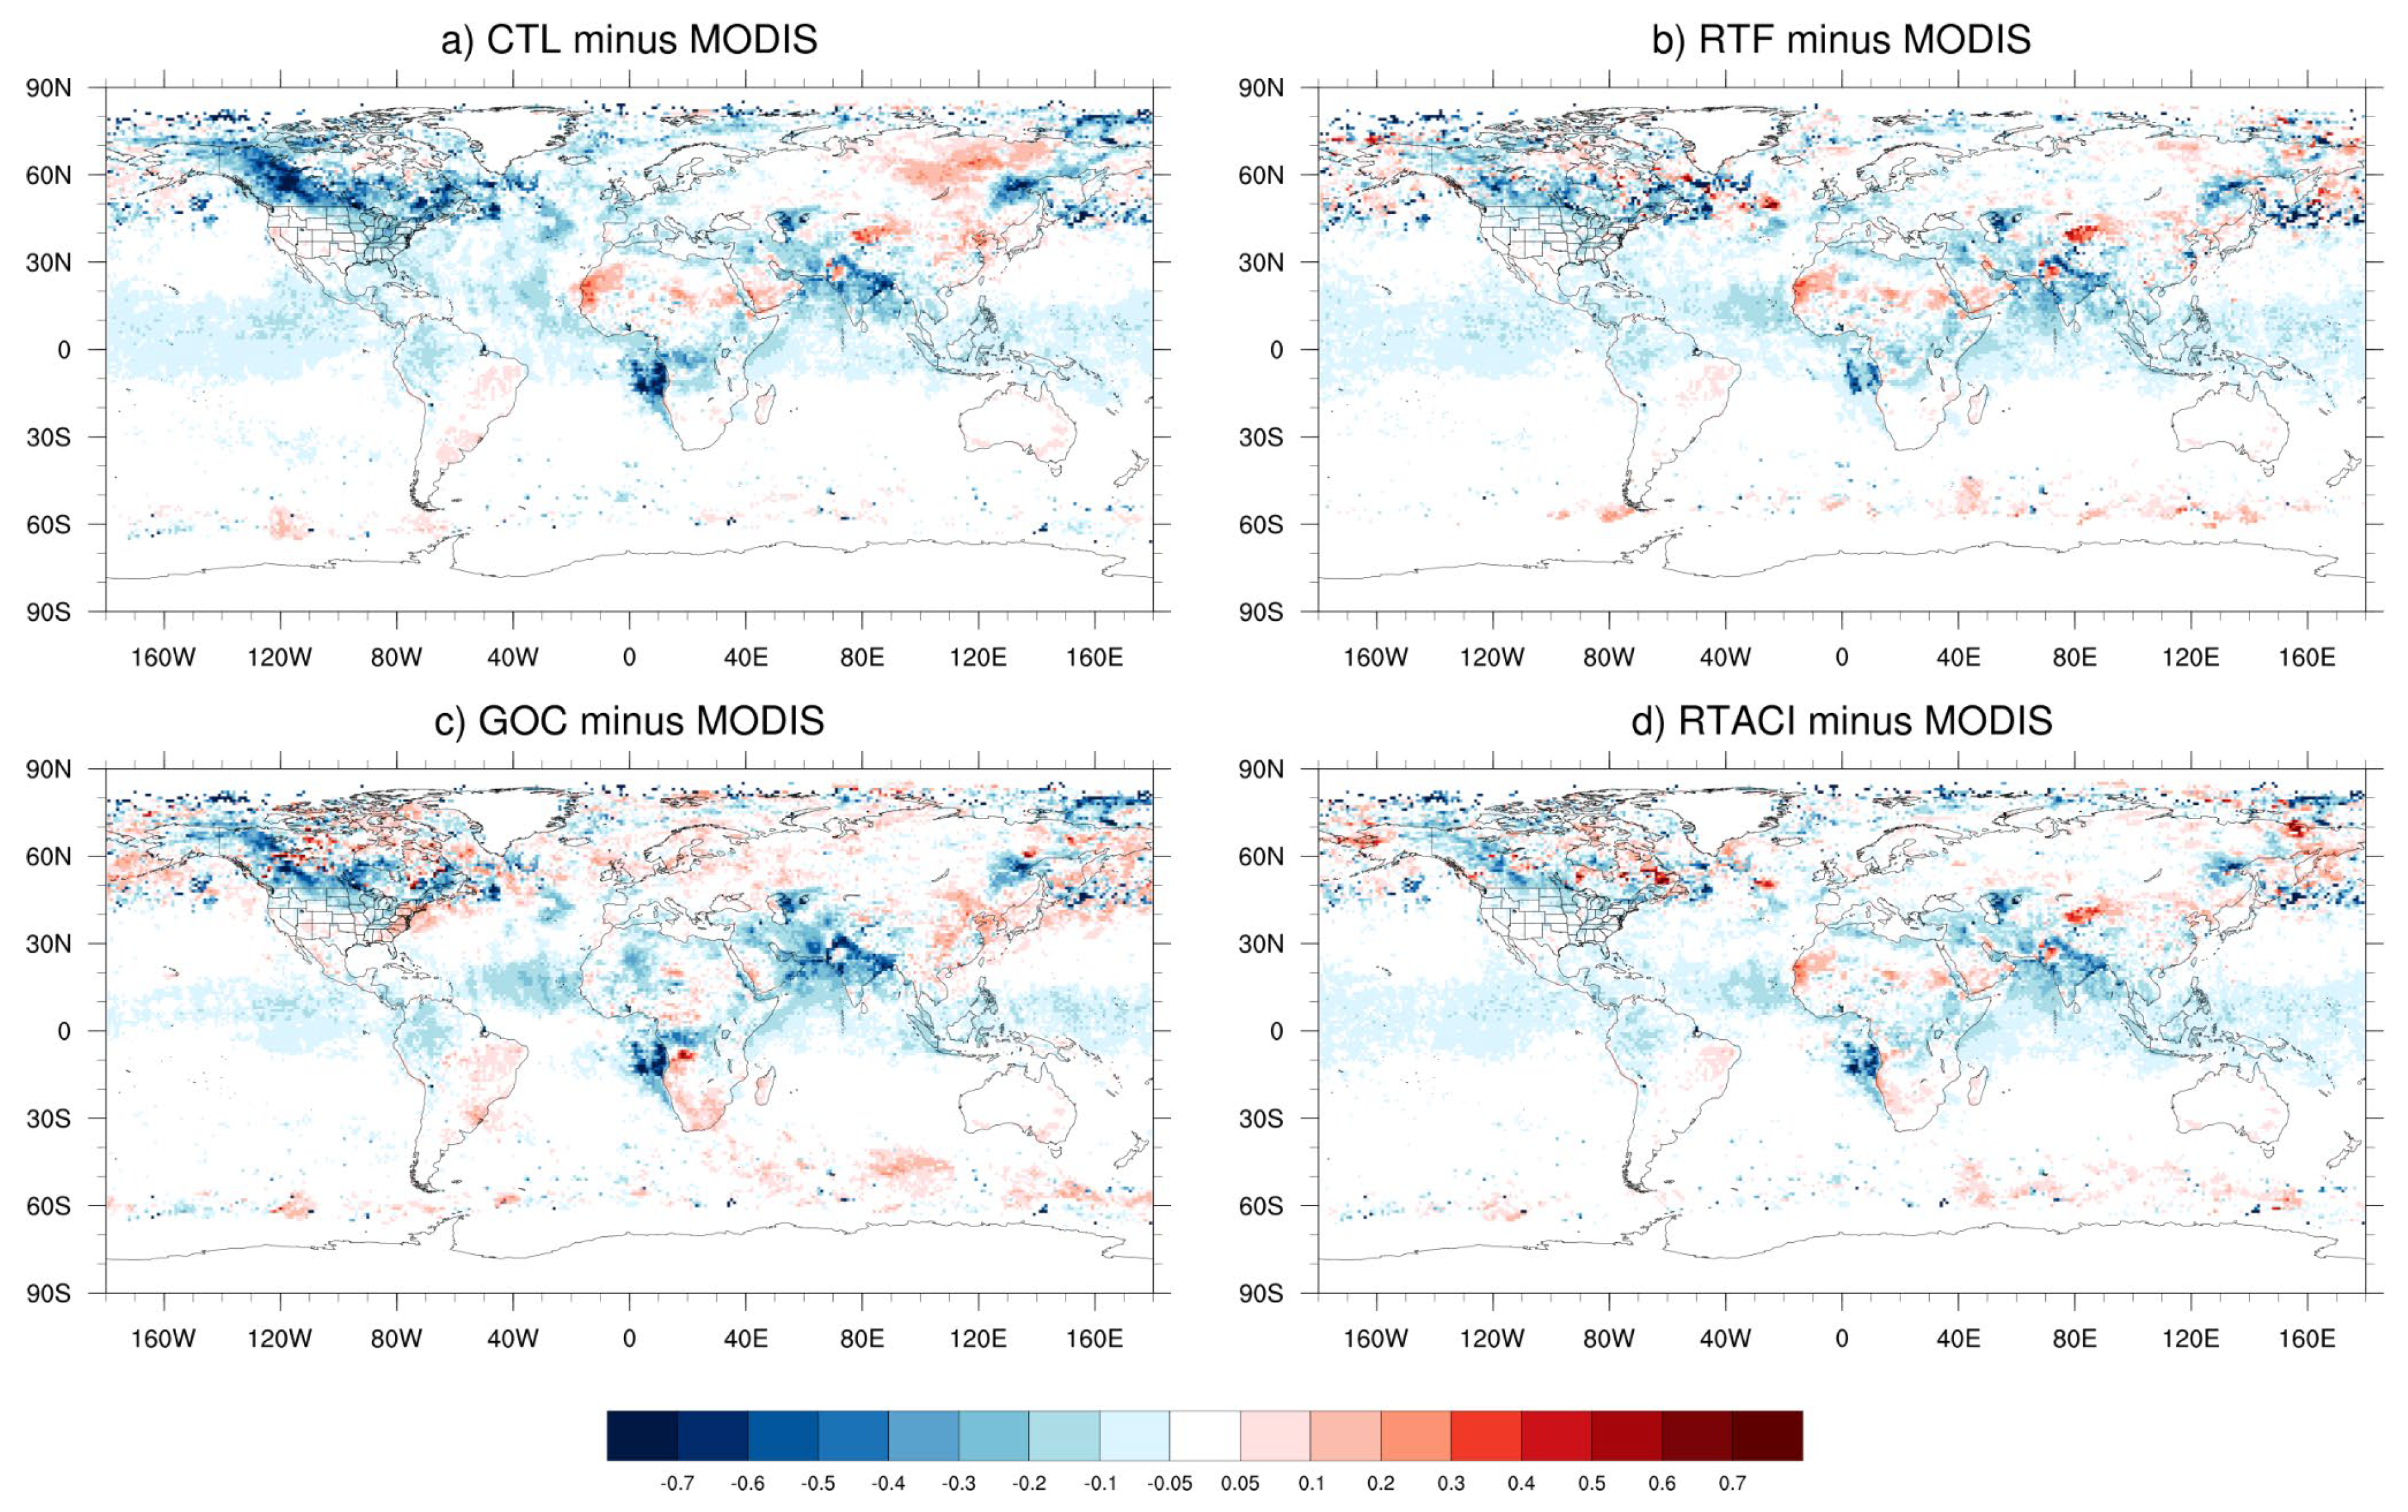
Figure 4.
Surface downward shortwave (SW) fluxes (W m⁻²) at day 5 of the forecasts, averaged over the 2023 summer in North America from EXP CTL (a); differences between EXP RTF and EXP CTL (b); between EXP GOC and EXP CTL (c); and between EXP RTACI and EXP CTL (d). The areas enclosed by thick green contours indicate regions where the mean differences in SW fluxes between the two experiments are statistically significant at the 95% confidence level based on a Student’s t-test with a sample size of 120.
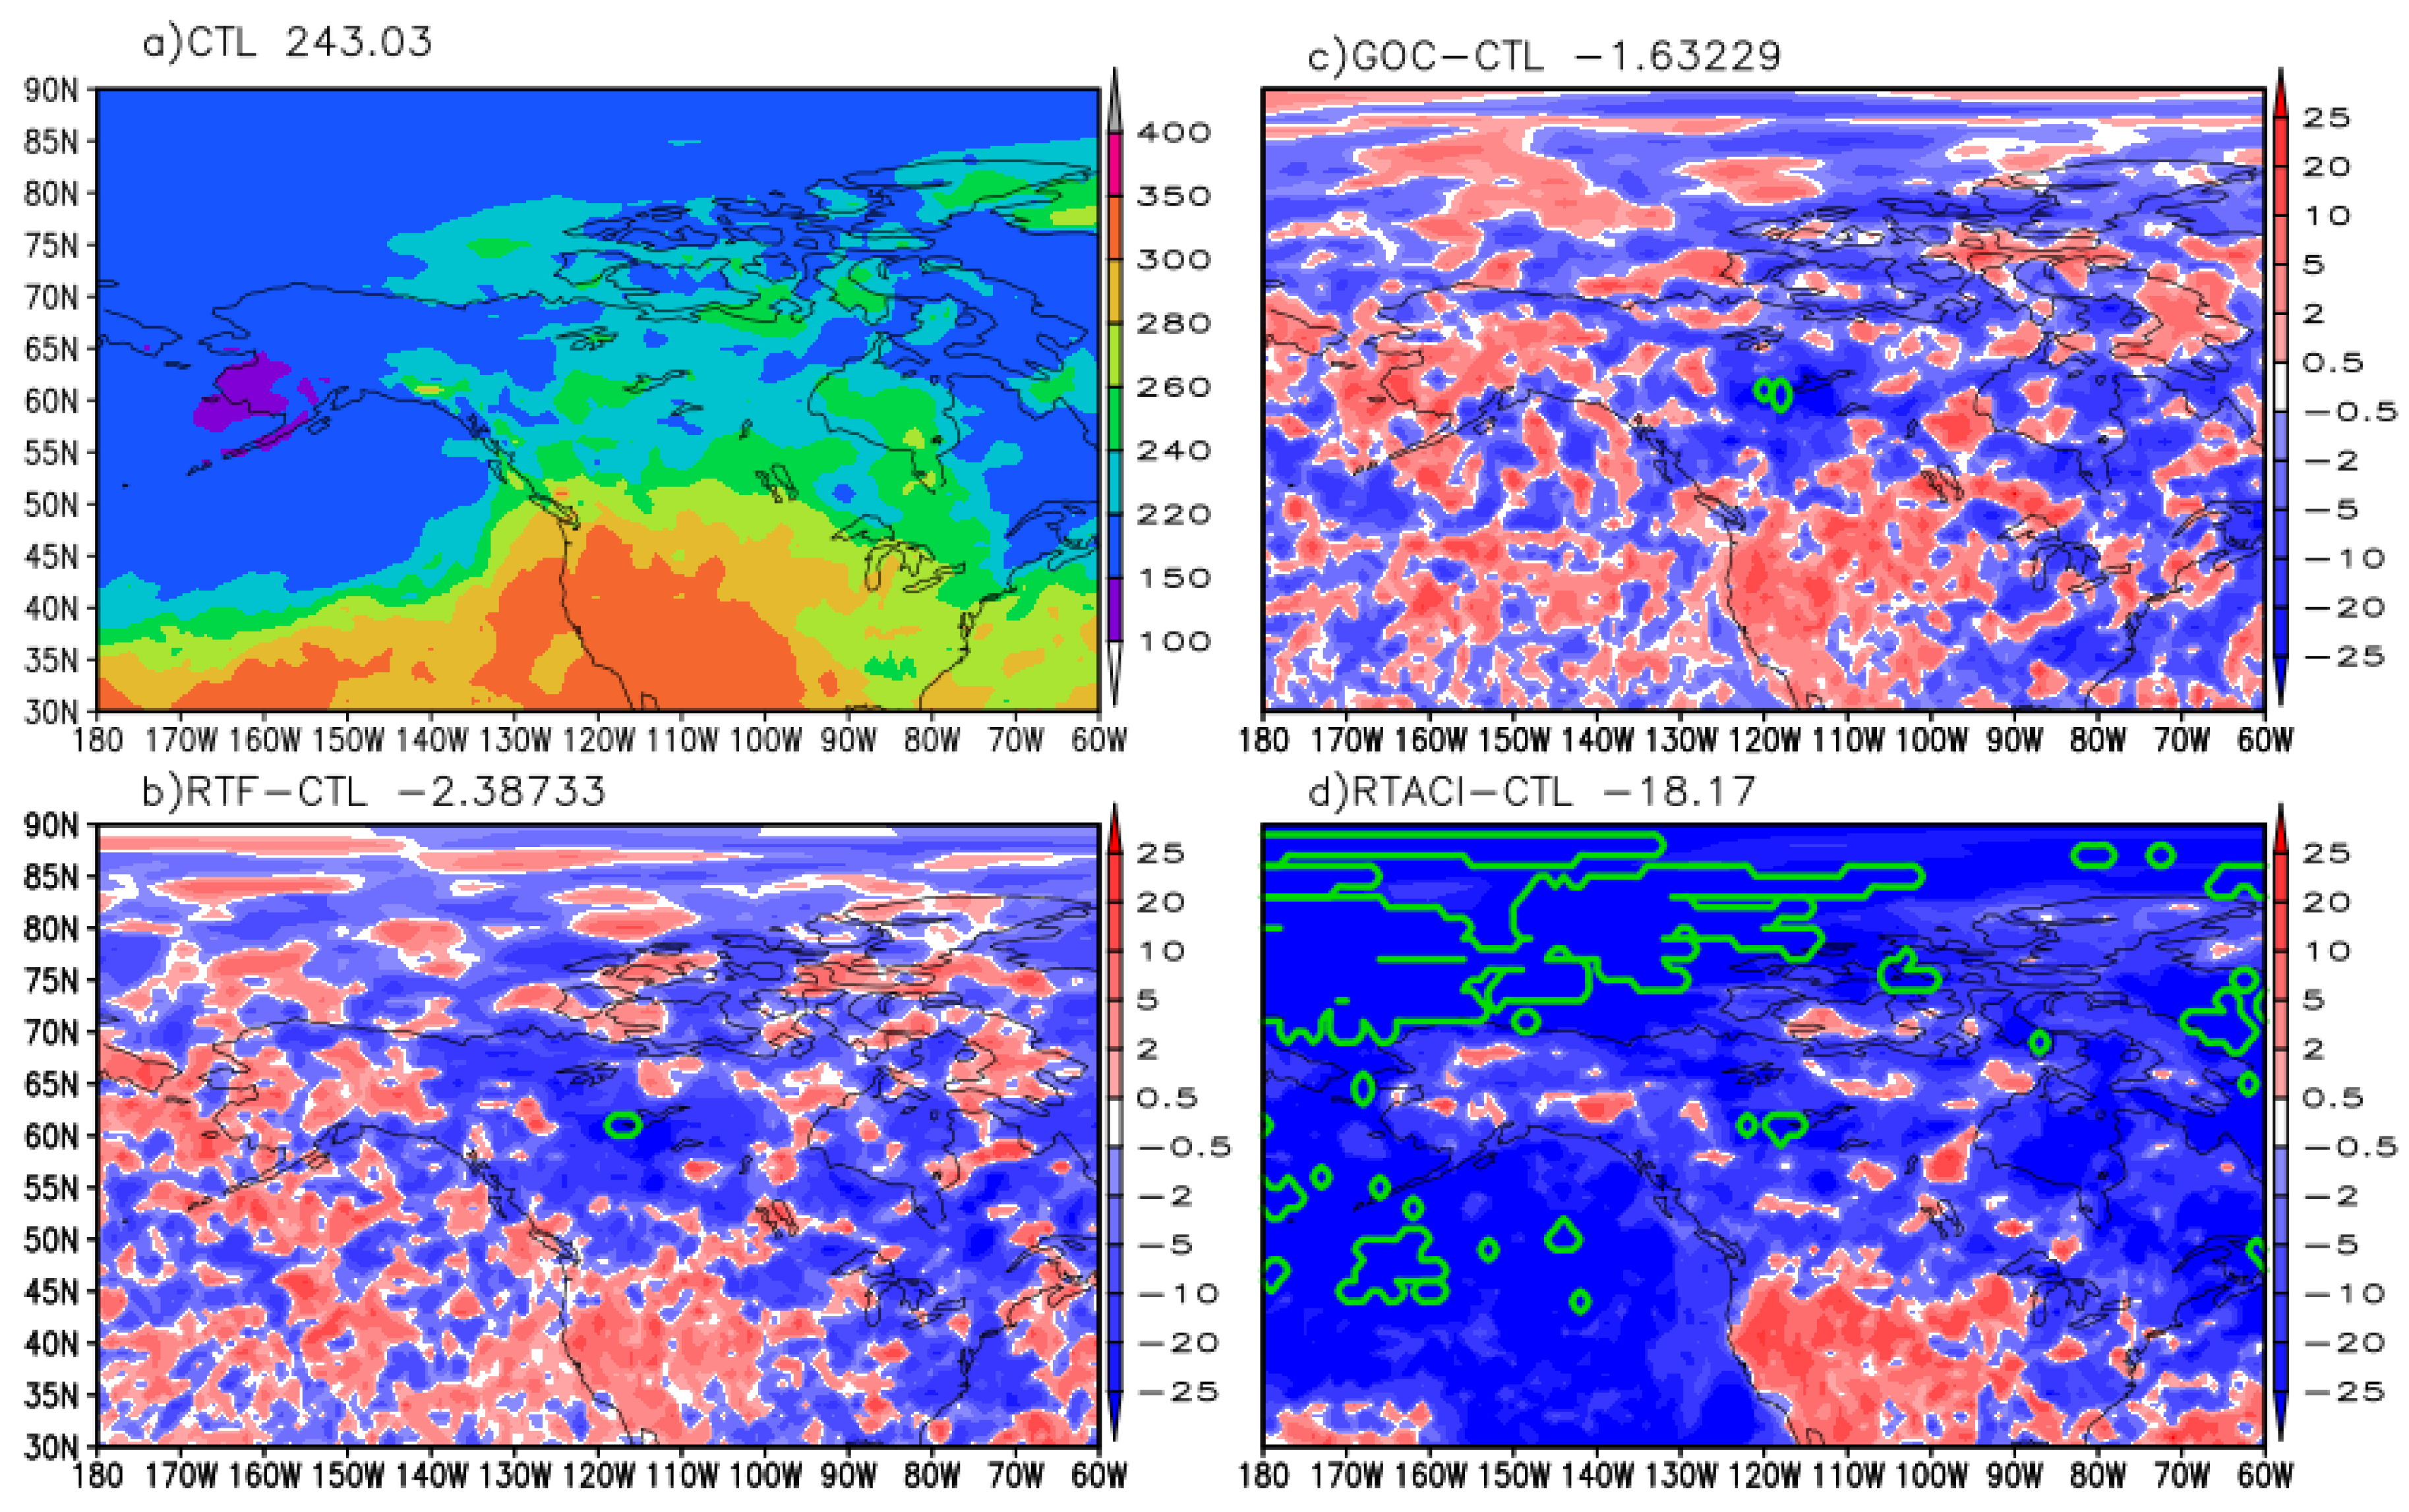
Figure 5.
Same as Figure 4 except for total AOD.
Figure 5.
Same as Figure 4 except for total AOD.
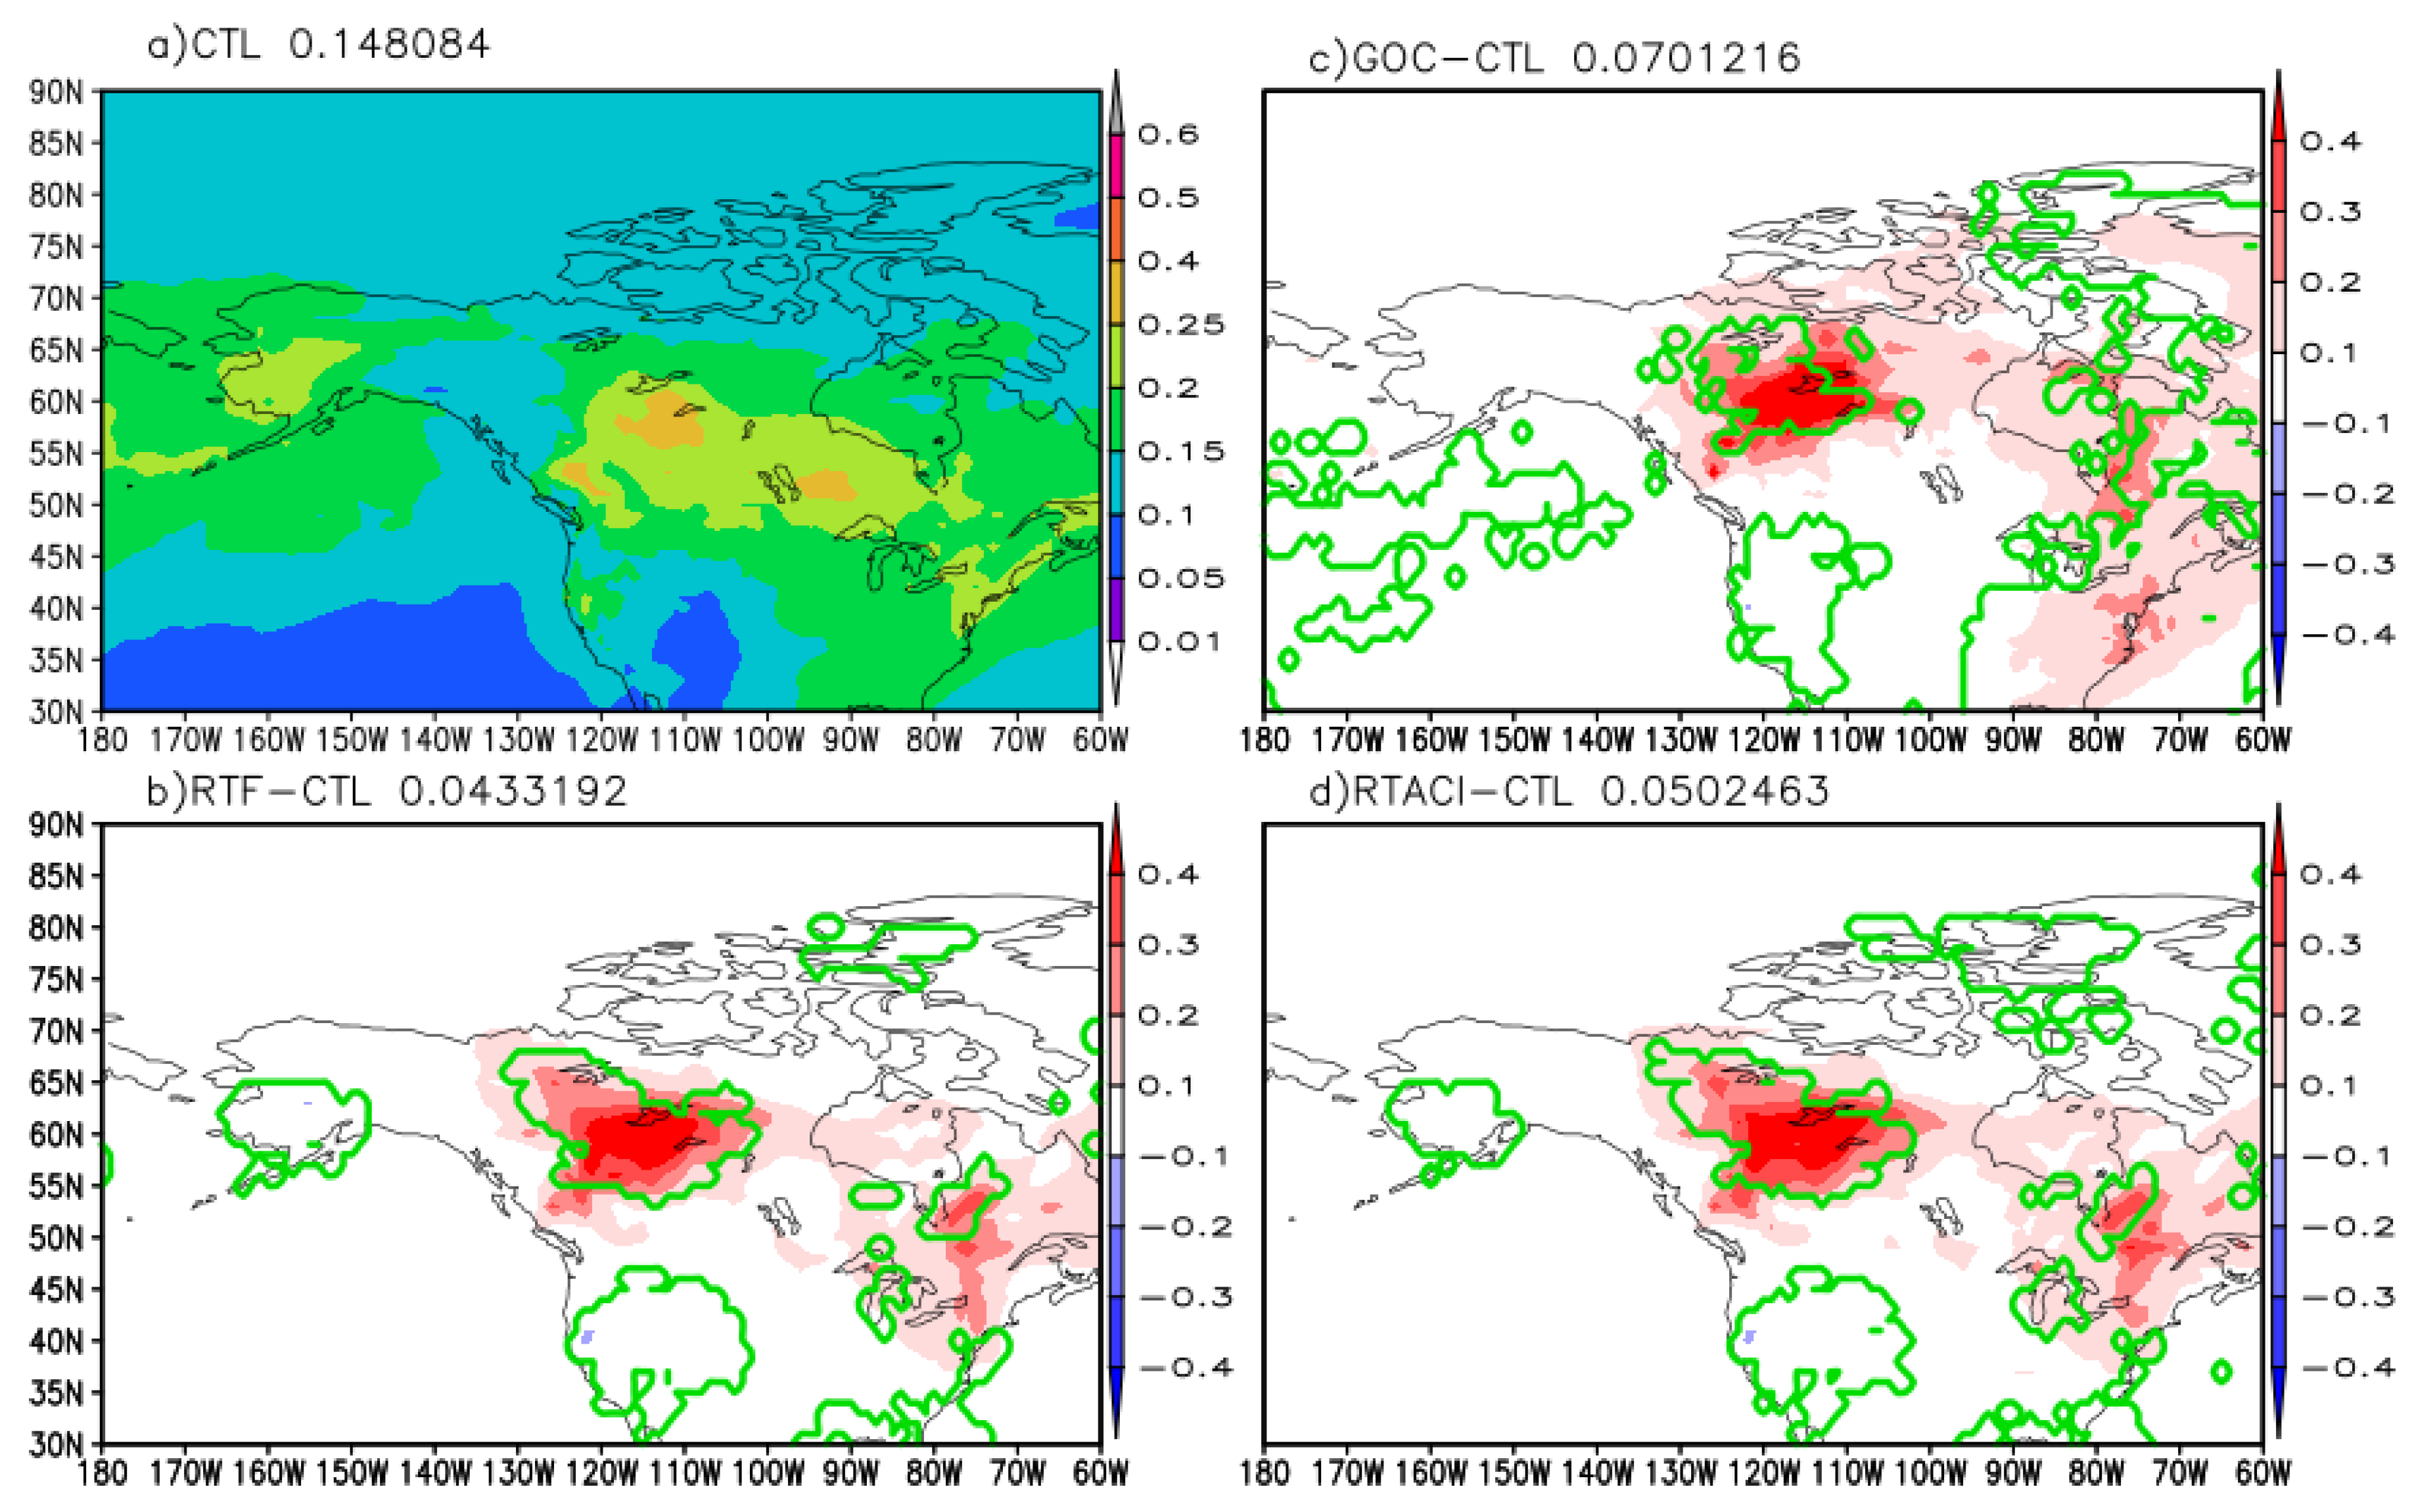
Figure 6.
Same as Figure 4 except for AOD from BC and OA.
Figure 6.
Same as Figure 4 except for AOD from BC and OA.
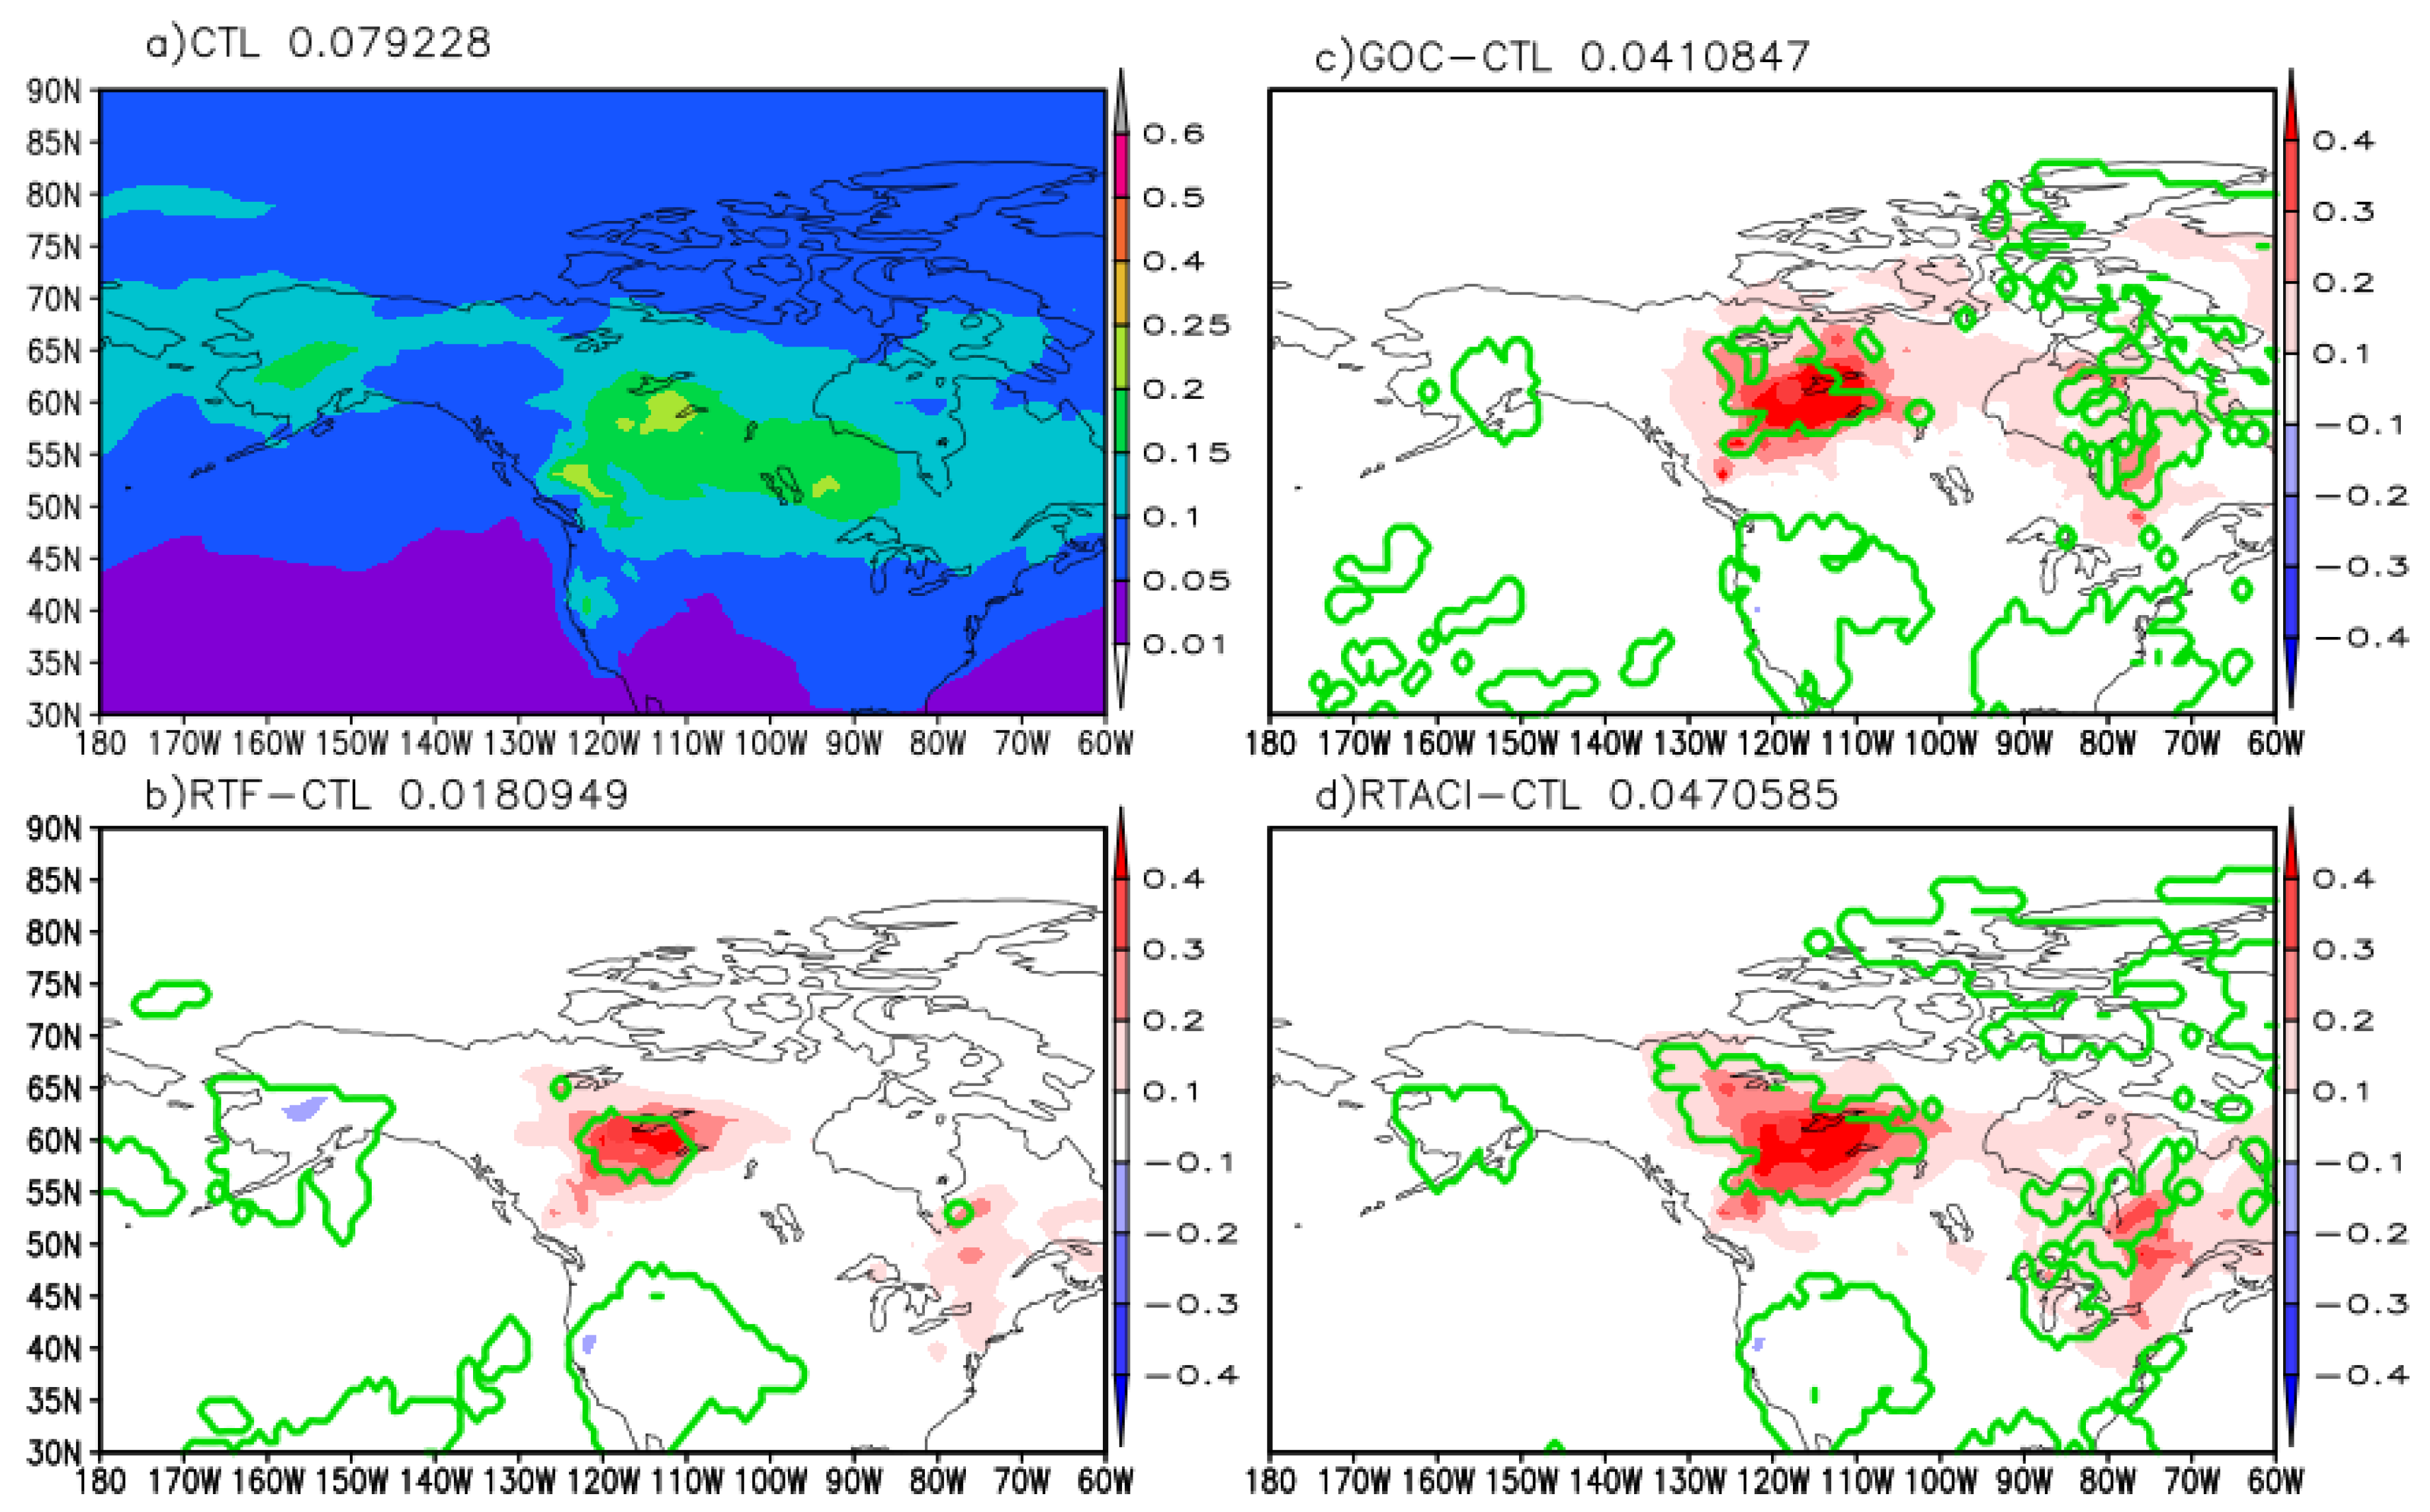
Figure 7.
Same as Figure 4 except for 2m temperature (K).
Figure 7.
Same as Figure 4 except for 2m temperature (K).
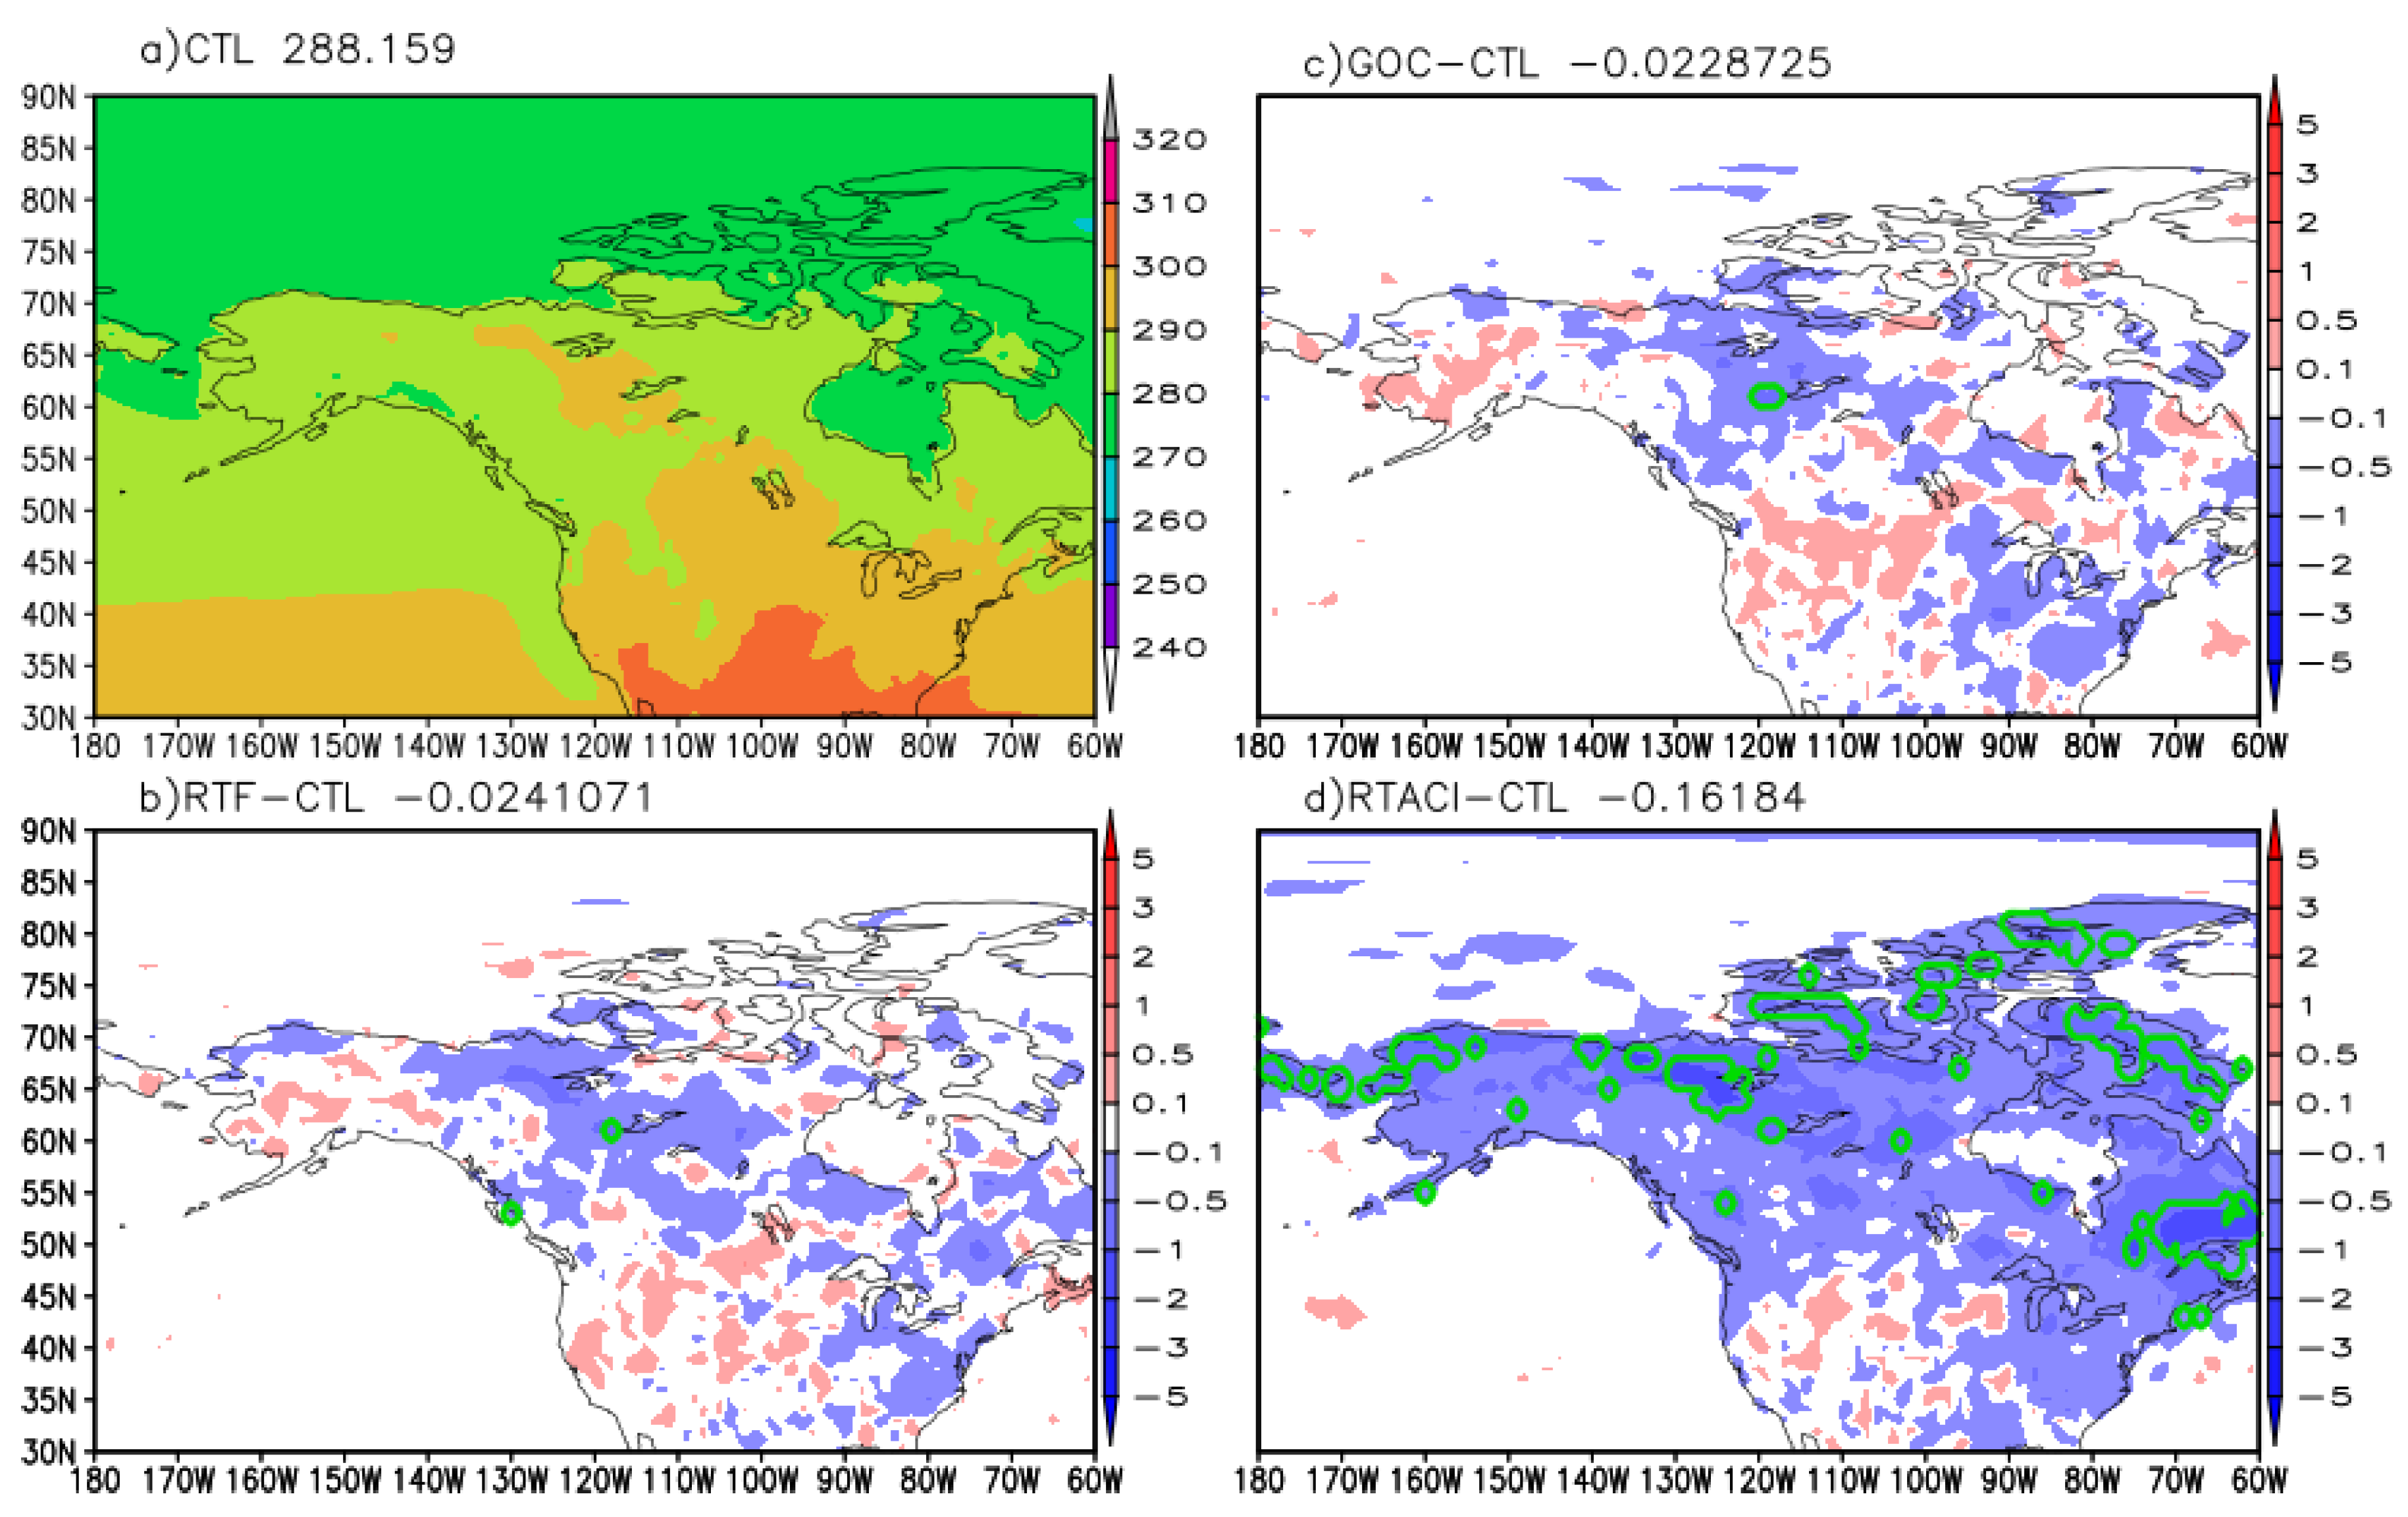
Figure 8.
Same as Figure 4 except for high-level cloud fraction.
Figure 8.
Same as Figure 4 except for high-level cloud fraction.
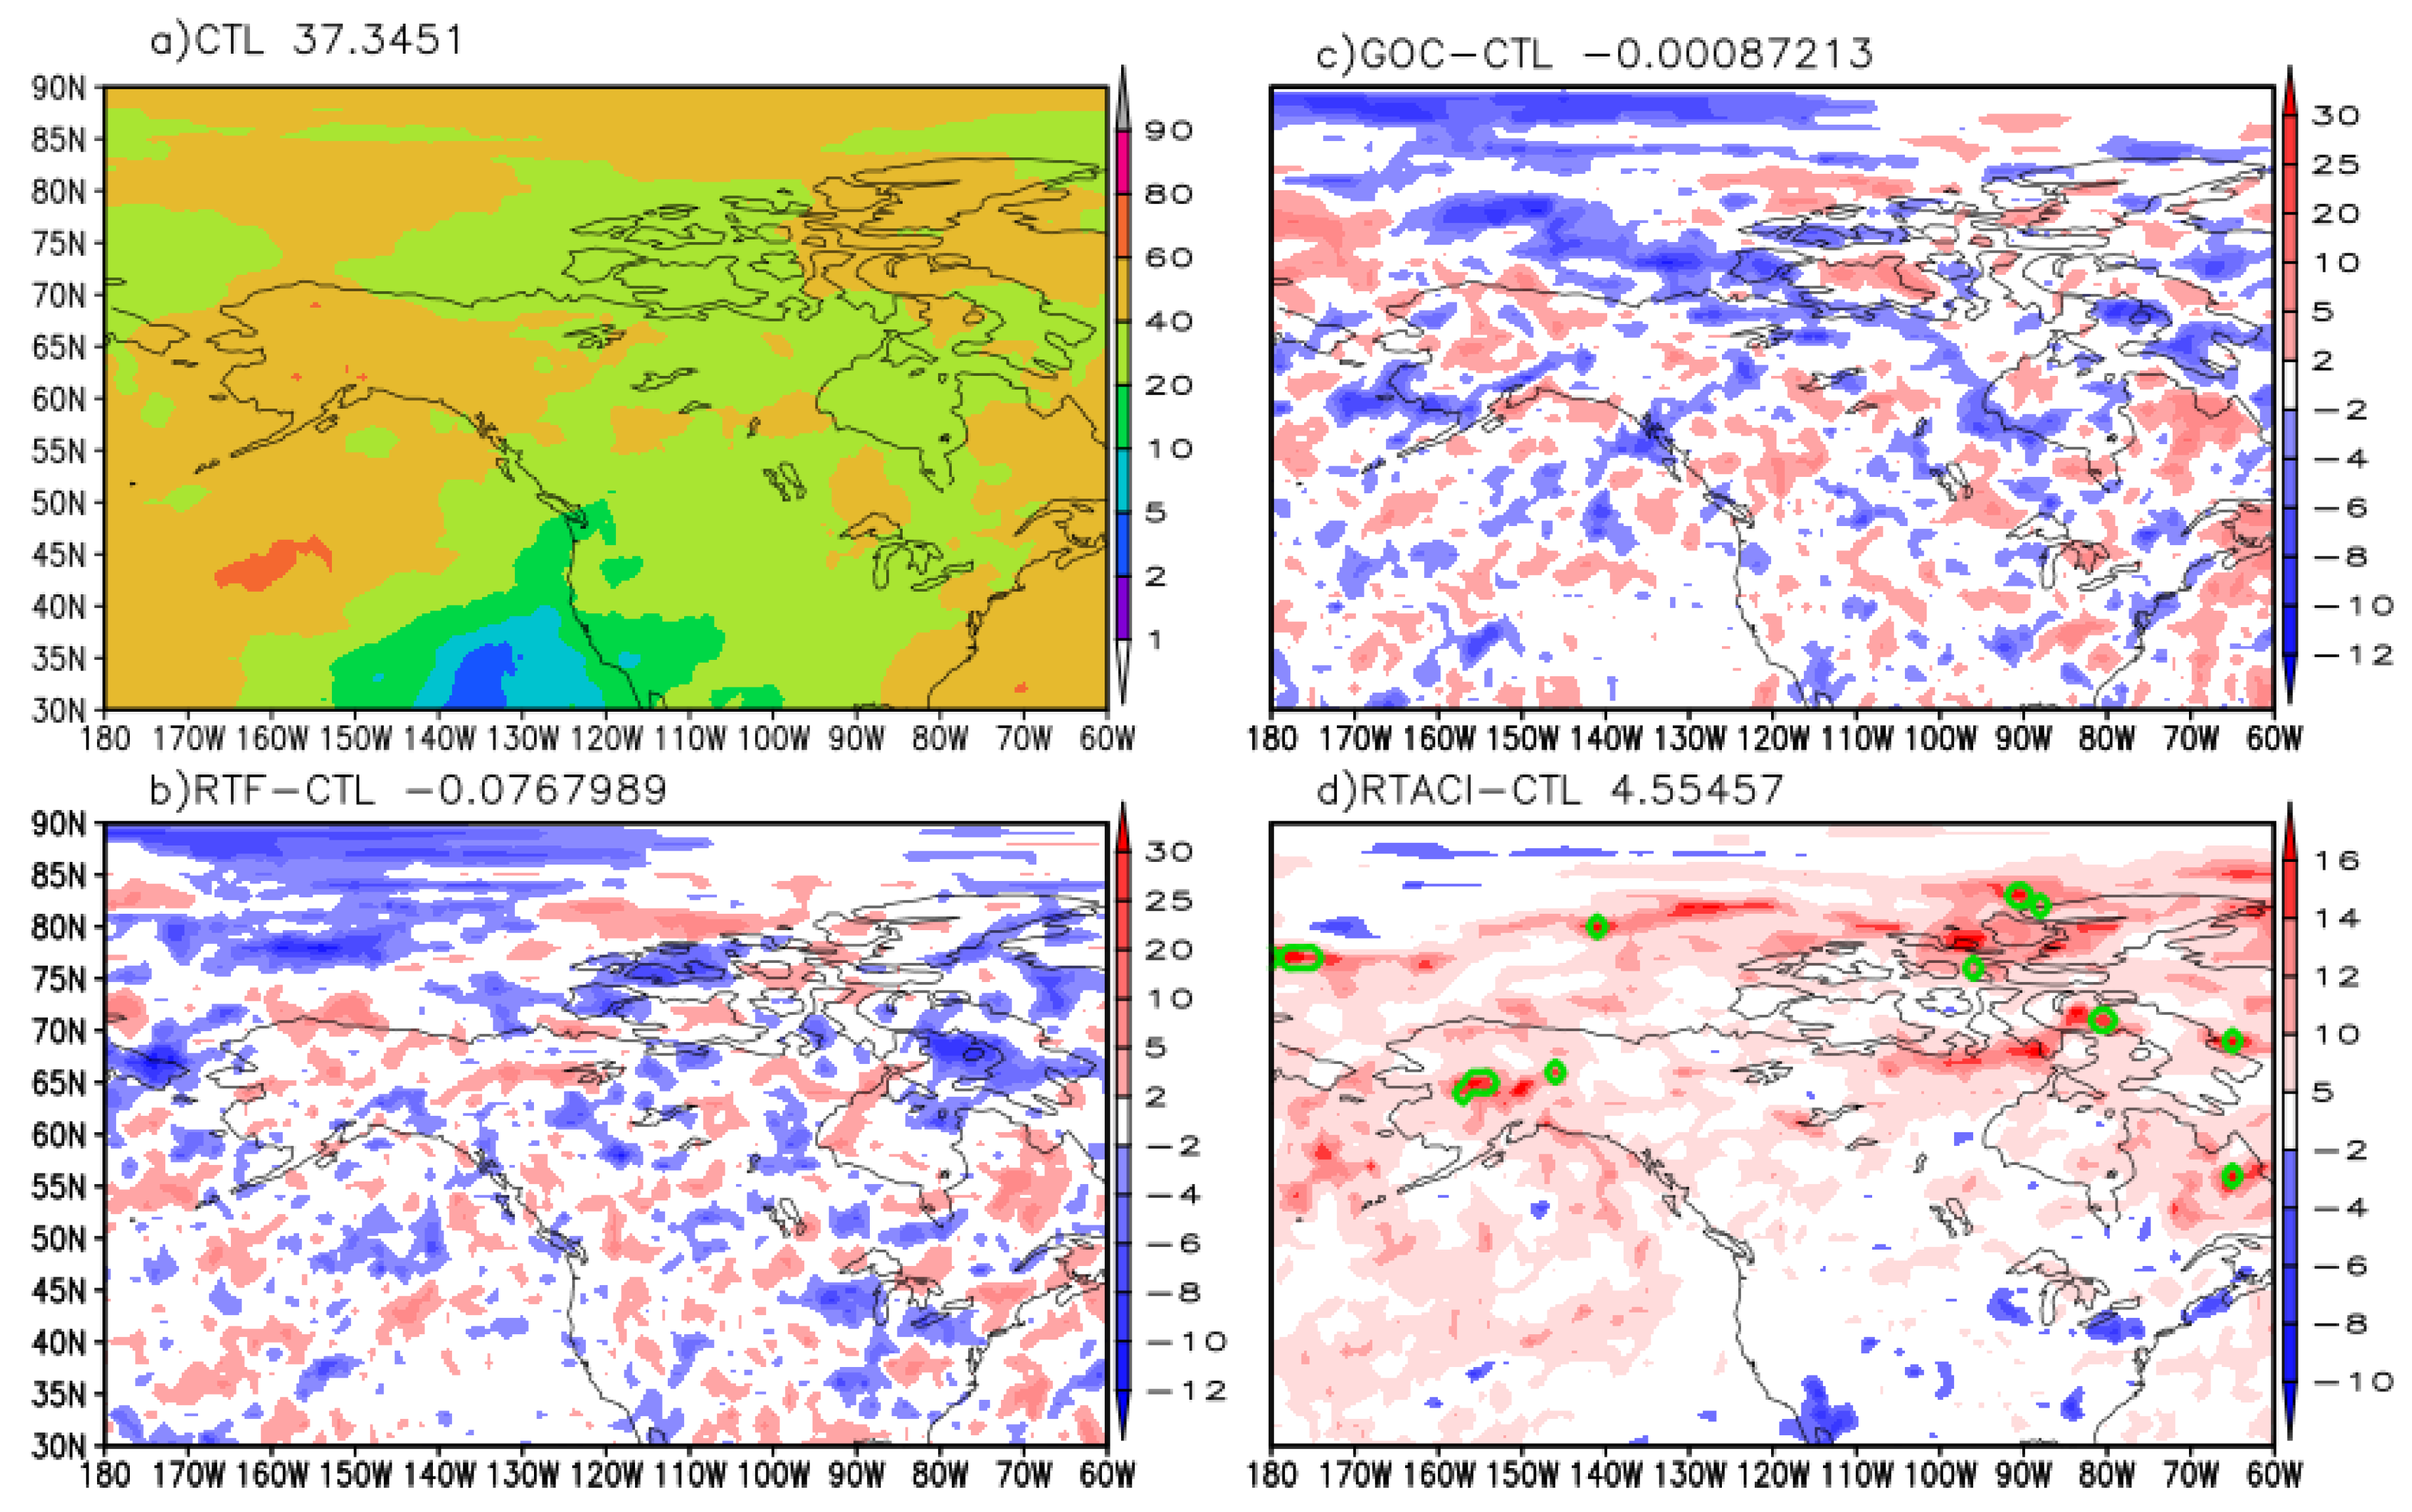
Figure 9.
Same as Figure 4 except for low-level cloud fraction.
Figure 9.
Same as Figure 4 except for low-level cloud fraction.
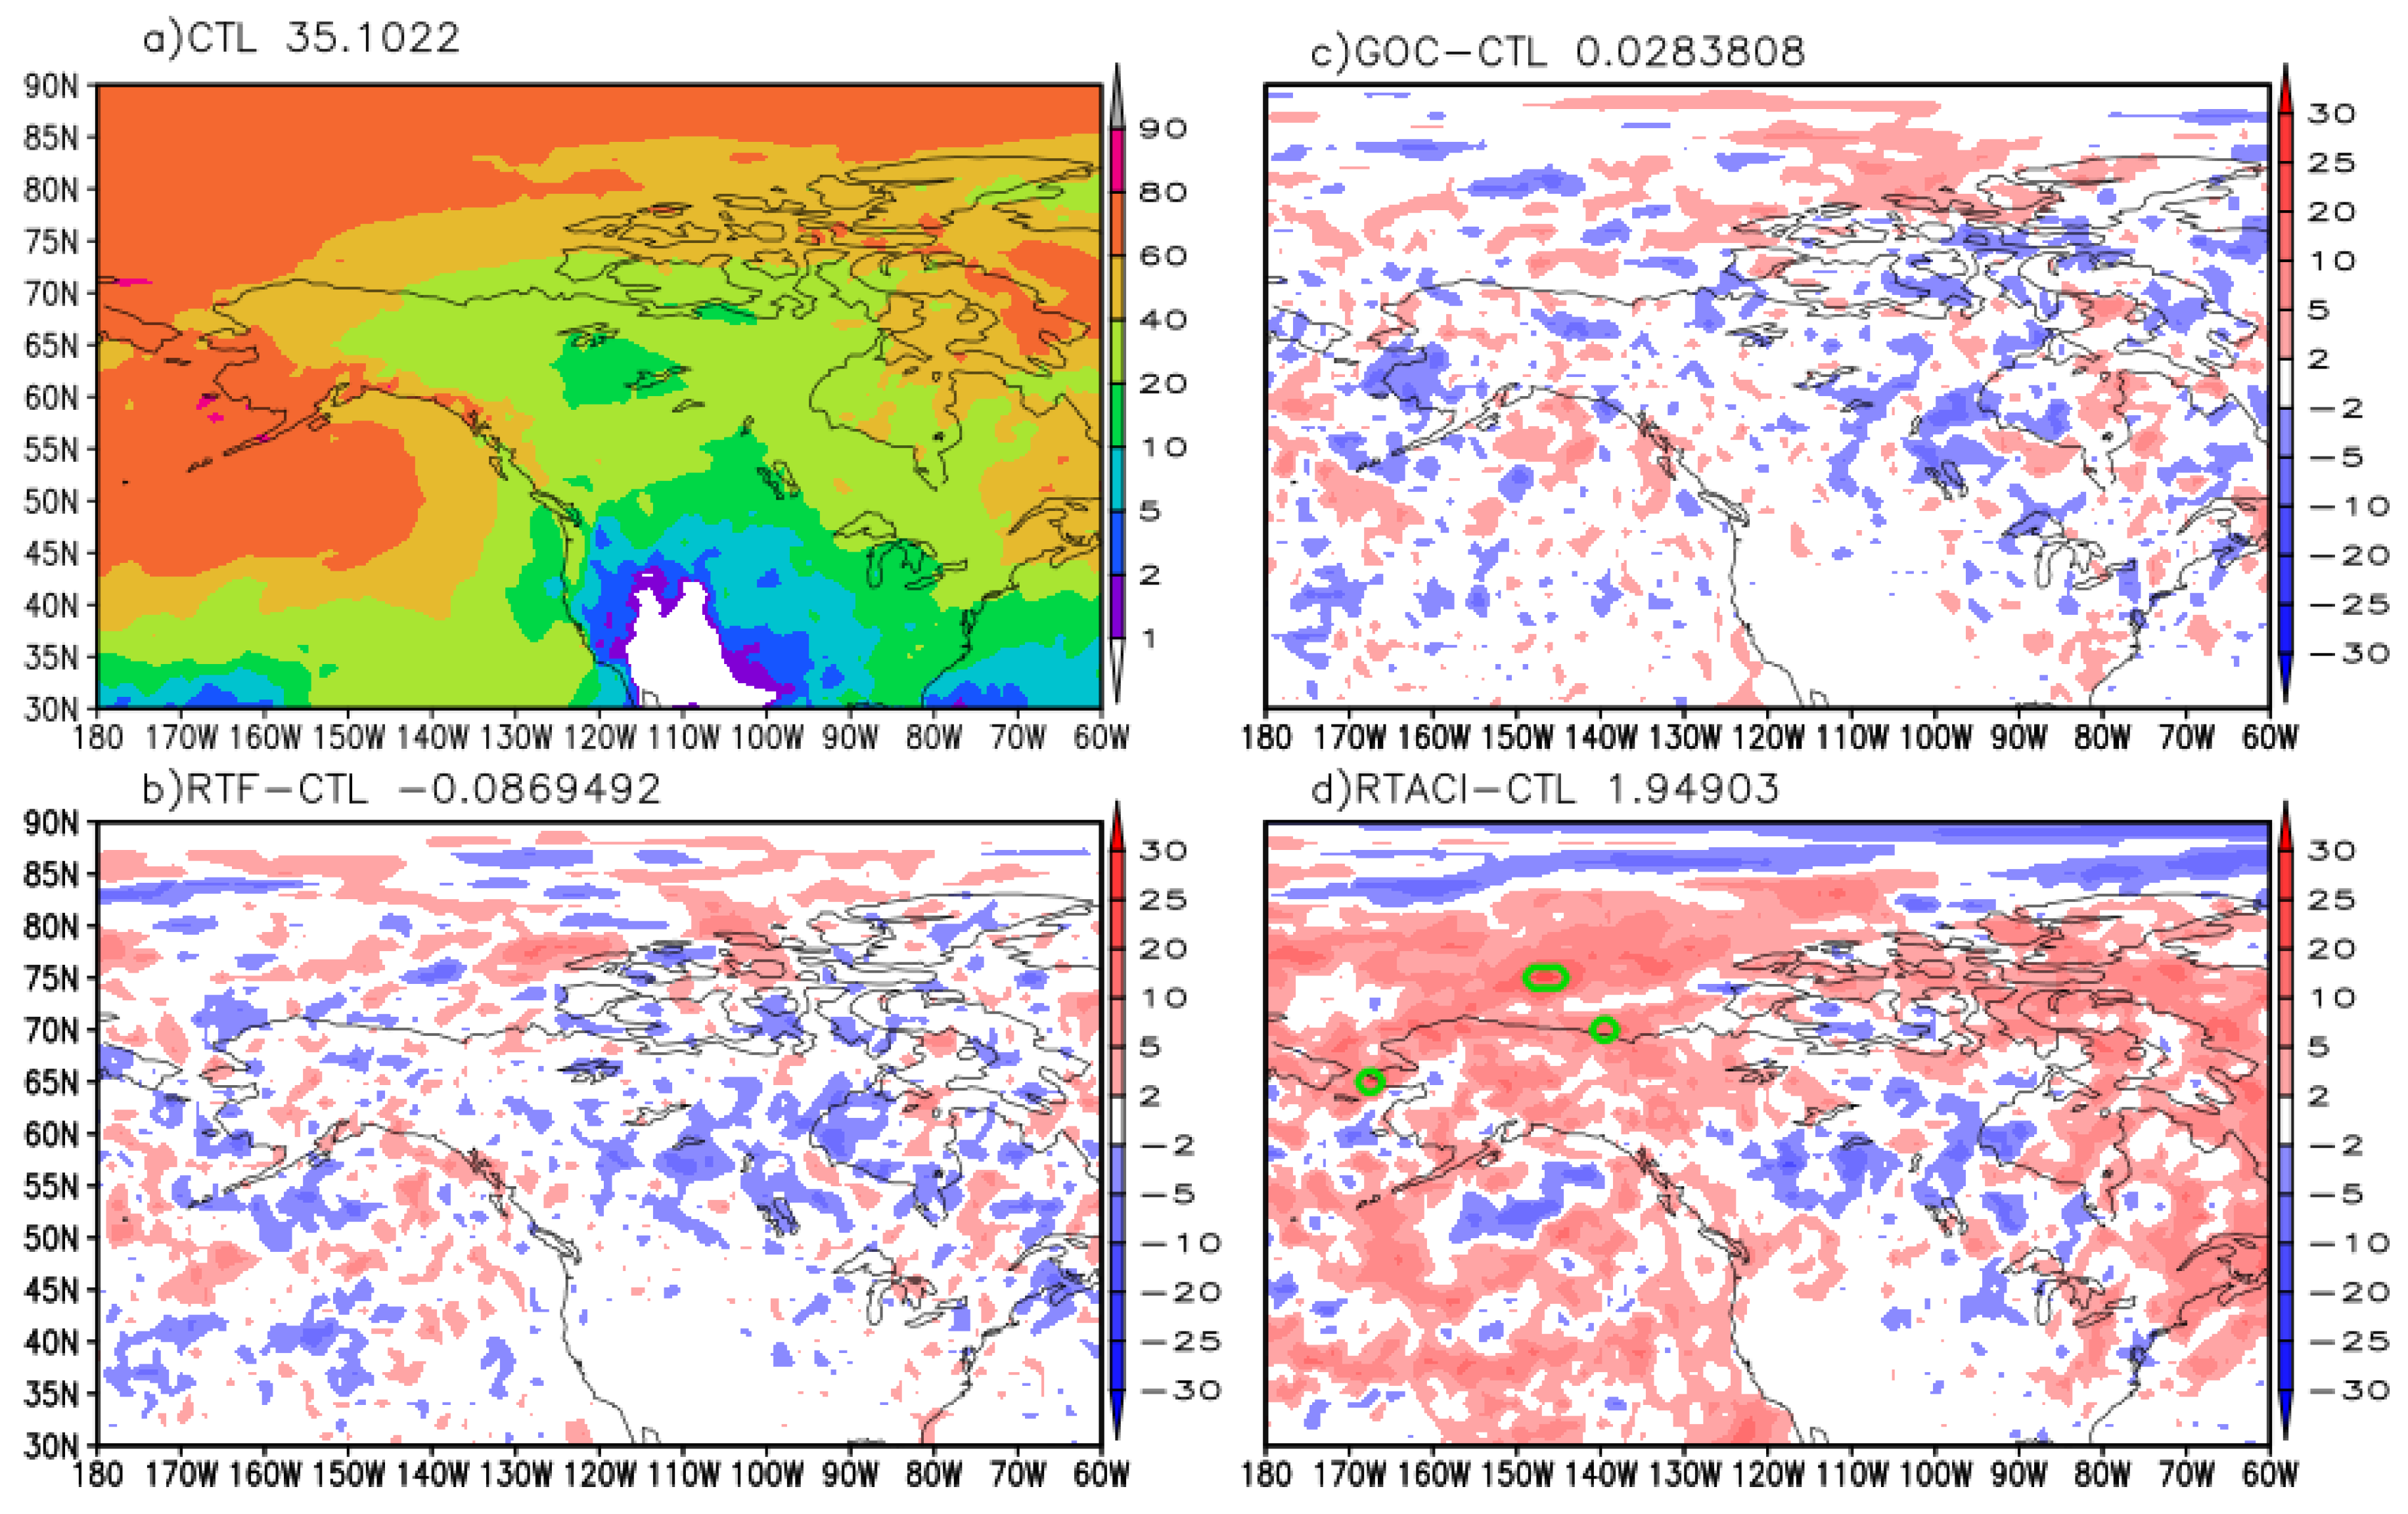
Figure 10.
Same as Figure 4 except for vertical integrated cloud water (ice and liquid, g m-2).
Figure 10.
Same as Figure 4 except for vertical integrated cloud water (ice and liquid, g m-2).
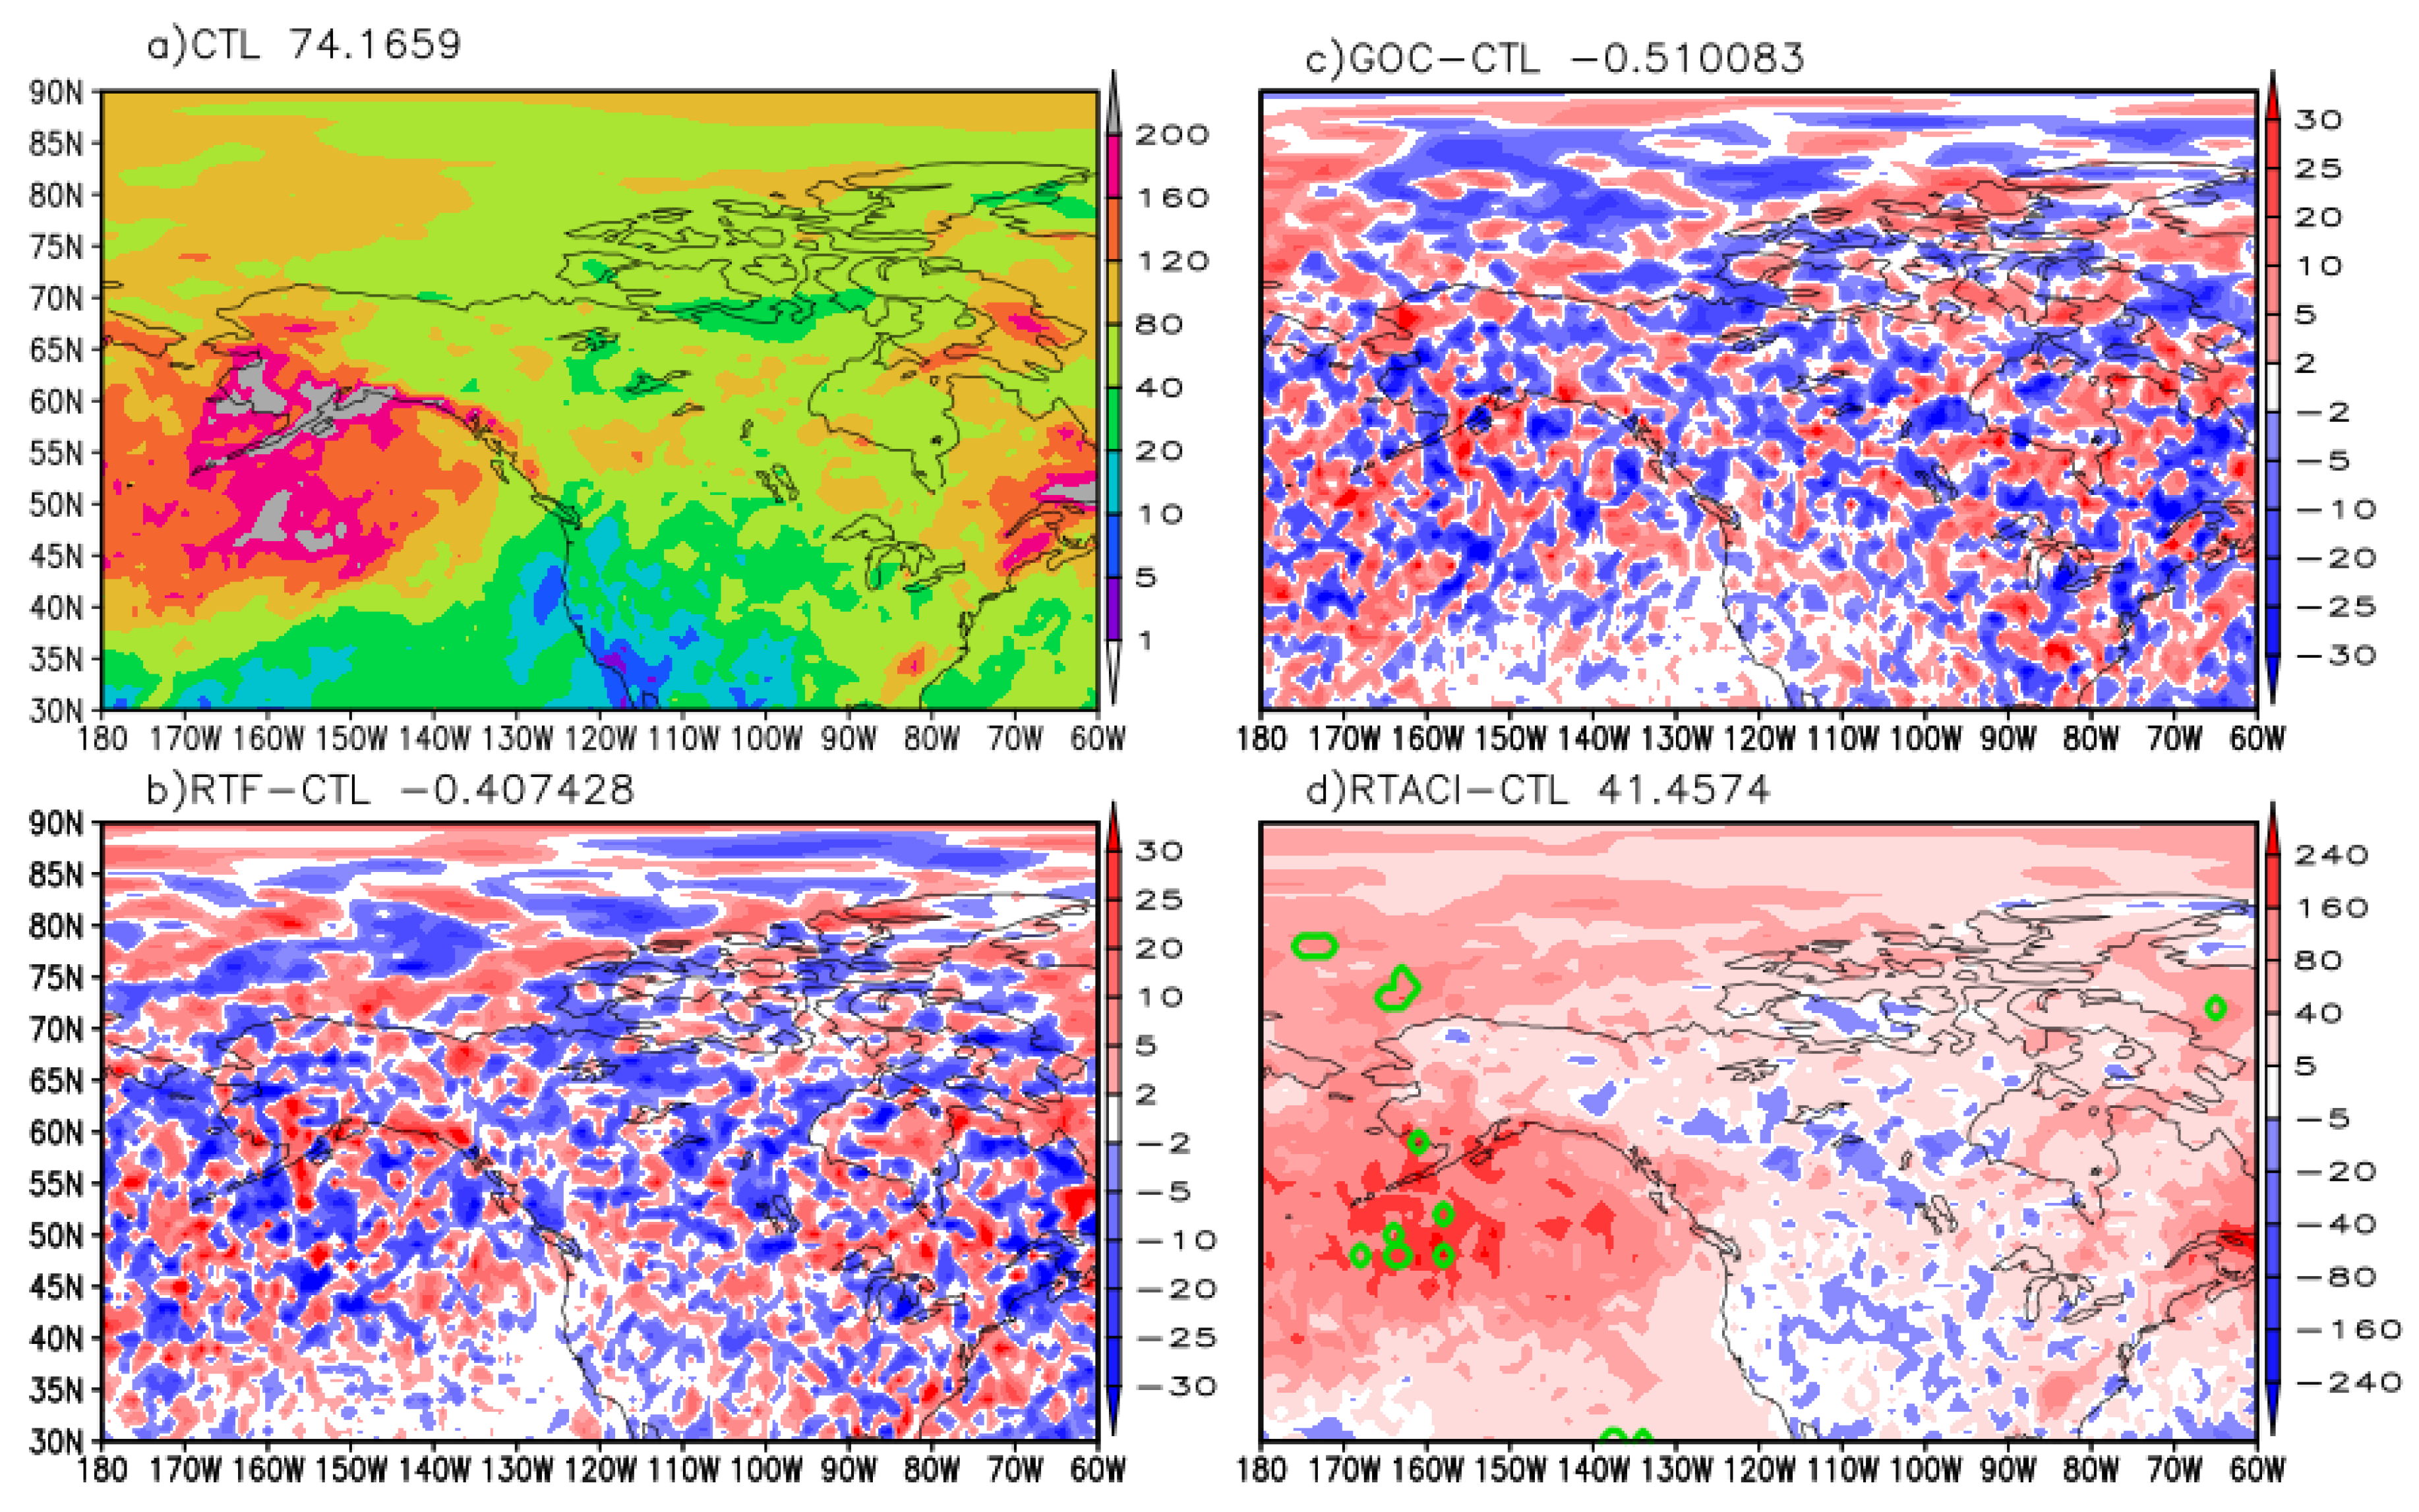
Figure 11.
Time series of regional mean surface precipitation (solid lines in a; mm day⁻¹) and convective precipitation (dotted lines in a; mm day⁻¹), and time series of regional mean low-level cloud fraction (solid lines in b; %), mid-level cloud fraction (solid lines in c; %), and high-level cloud fraction (solid lines in d; %) from the 10-day forecasts of EXPs CTL, RTF, GOC, and RTACI, respectively.
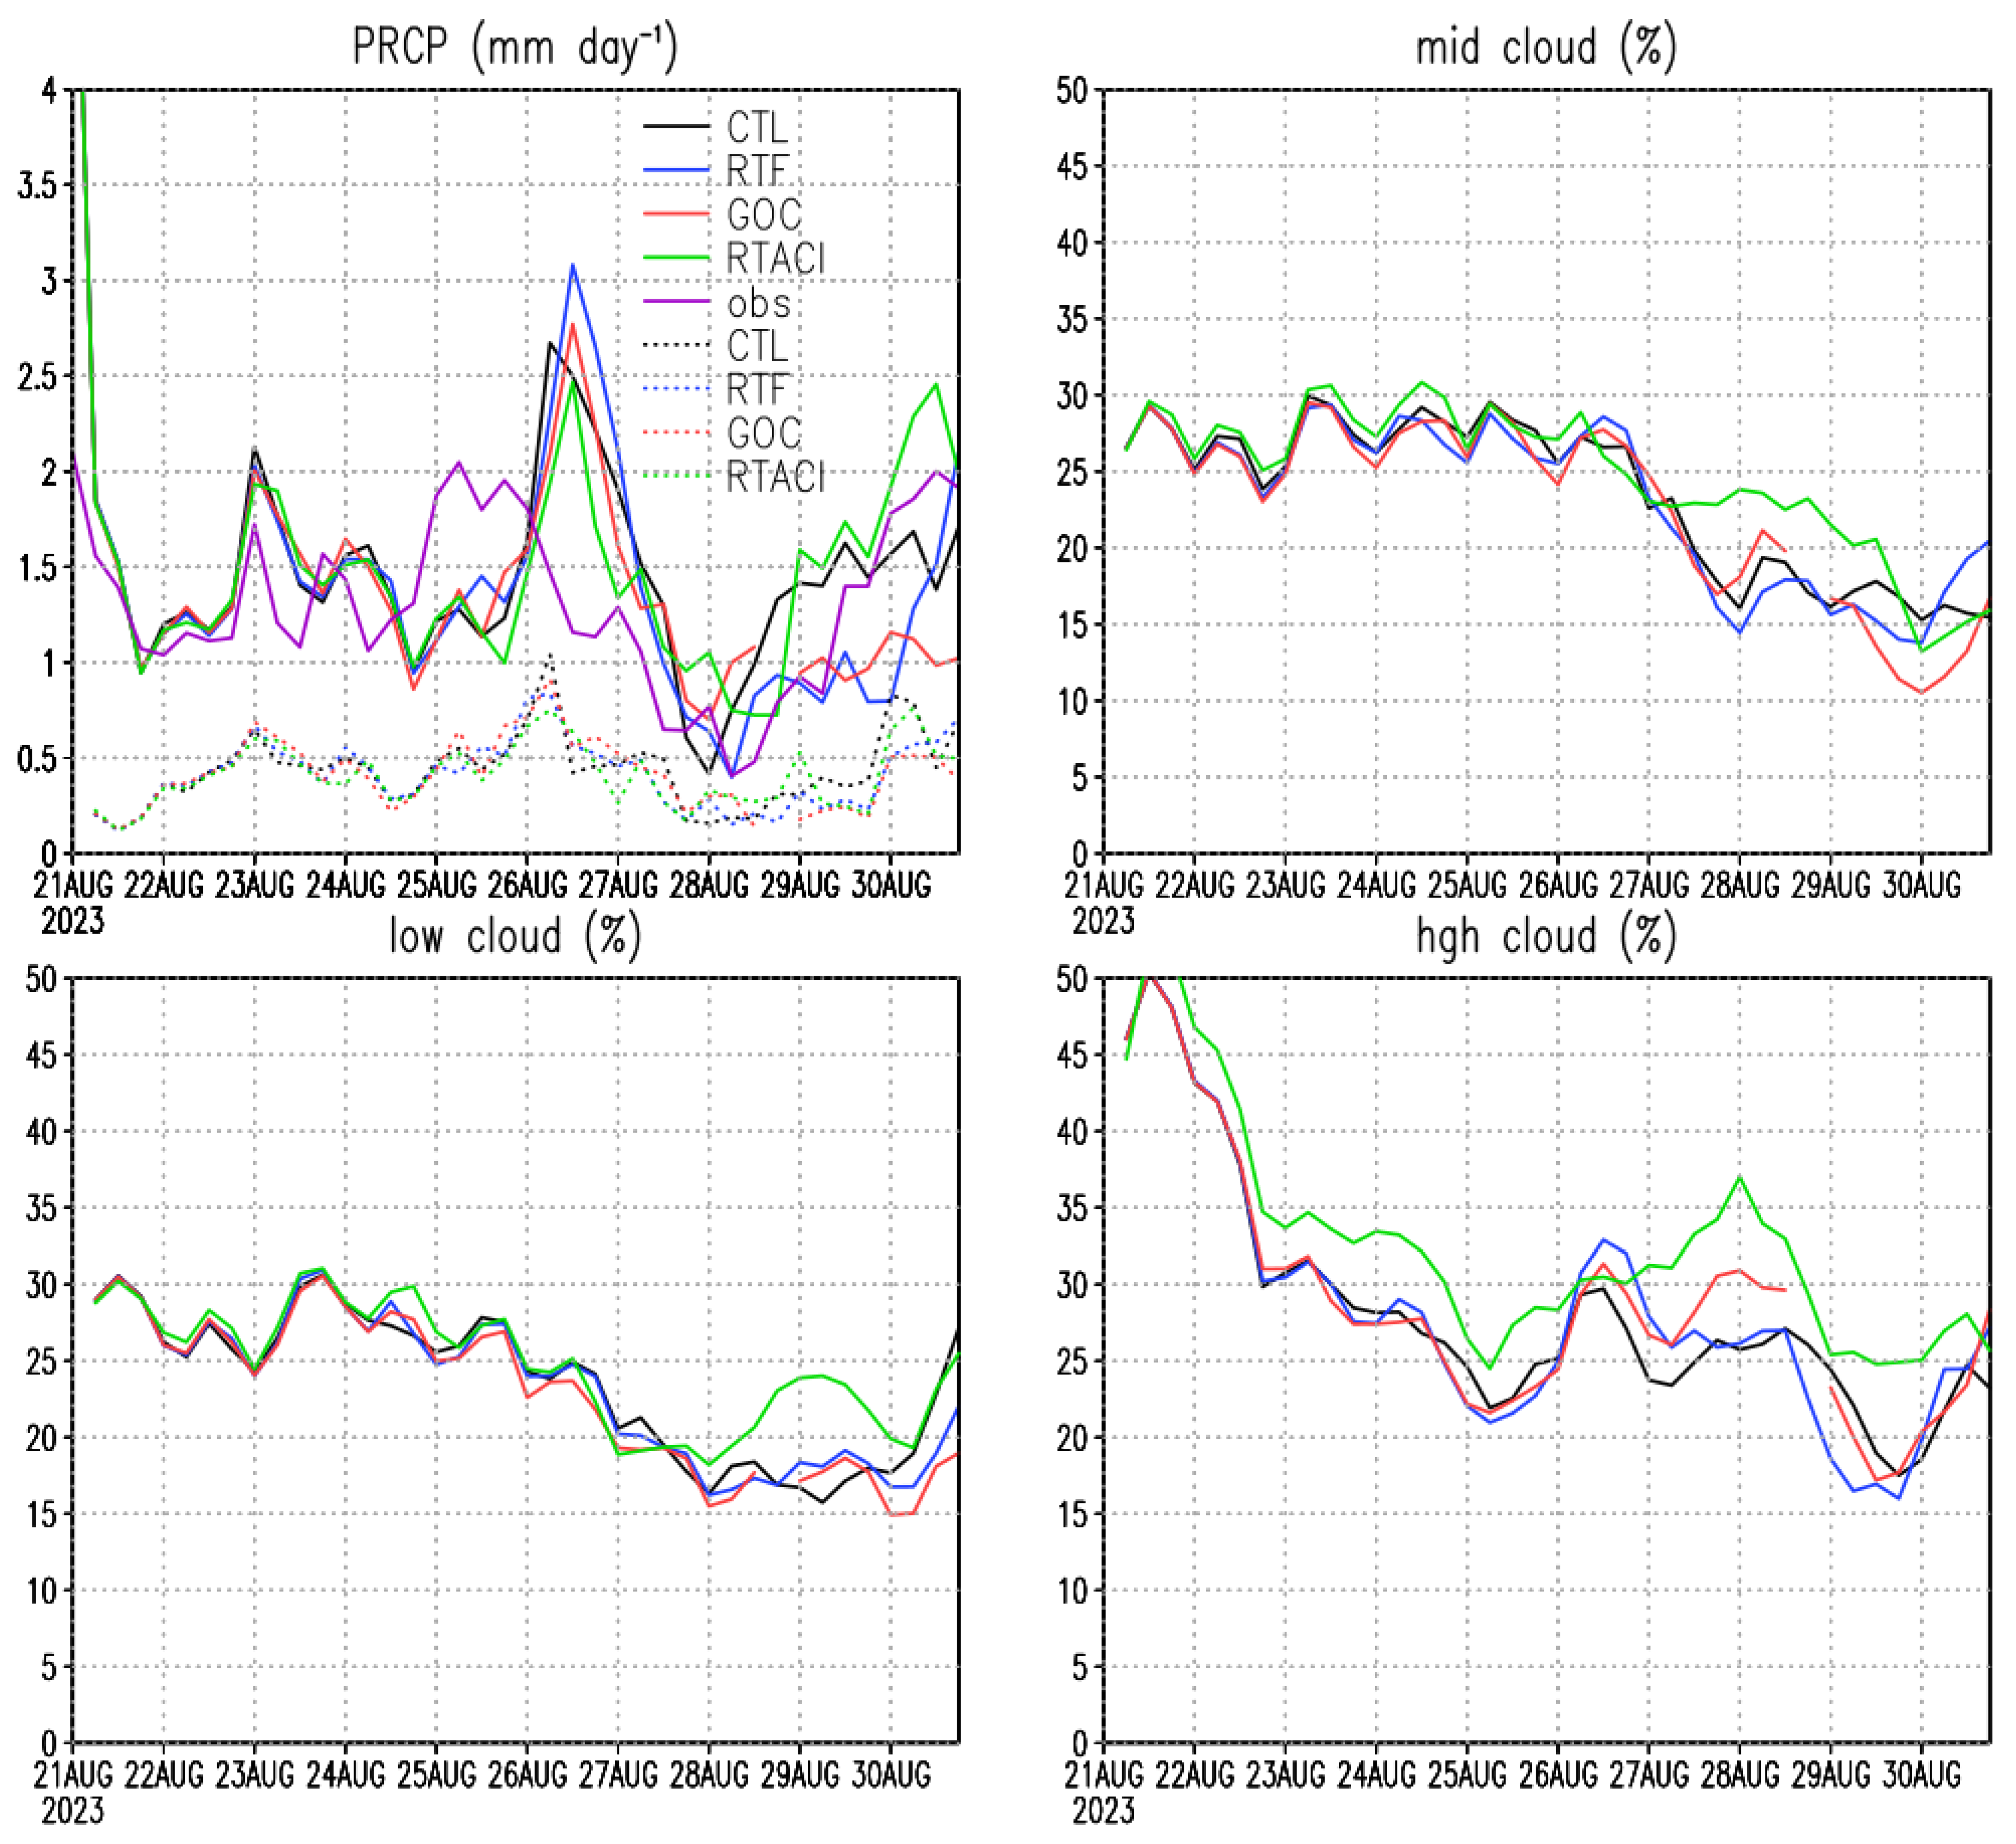
Figure 12.
AOD from BC and OA averaged over last three days in north America from EXP CTL (a). RTF (b), GOC (c), and RTACI (d), respectively.
Figure 12.
AOD from BC and OA averaged over last three days in north America from EXP CTL (a). RTF (b), GOC (c), and RTACI (d), respectively.
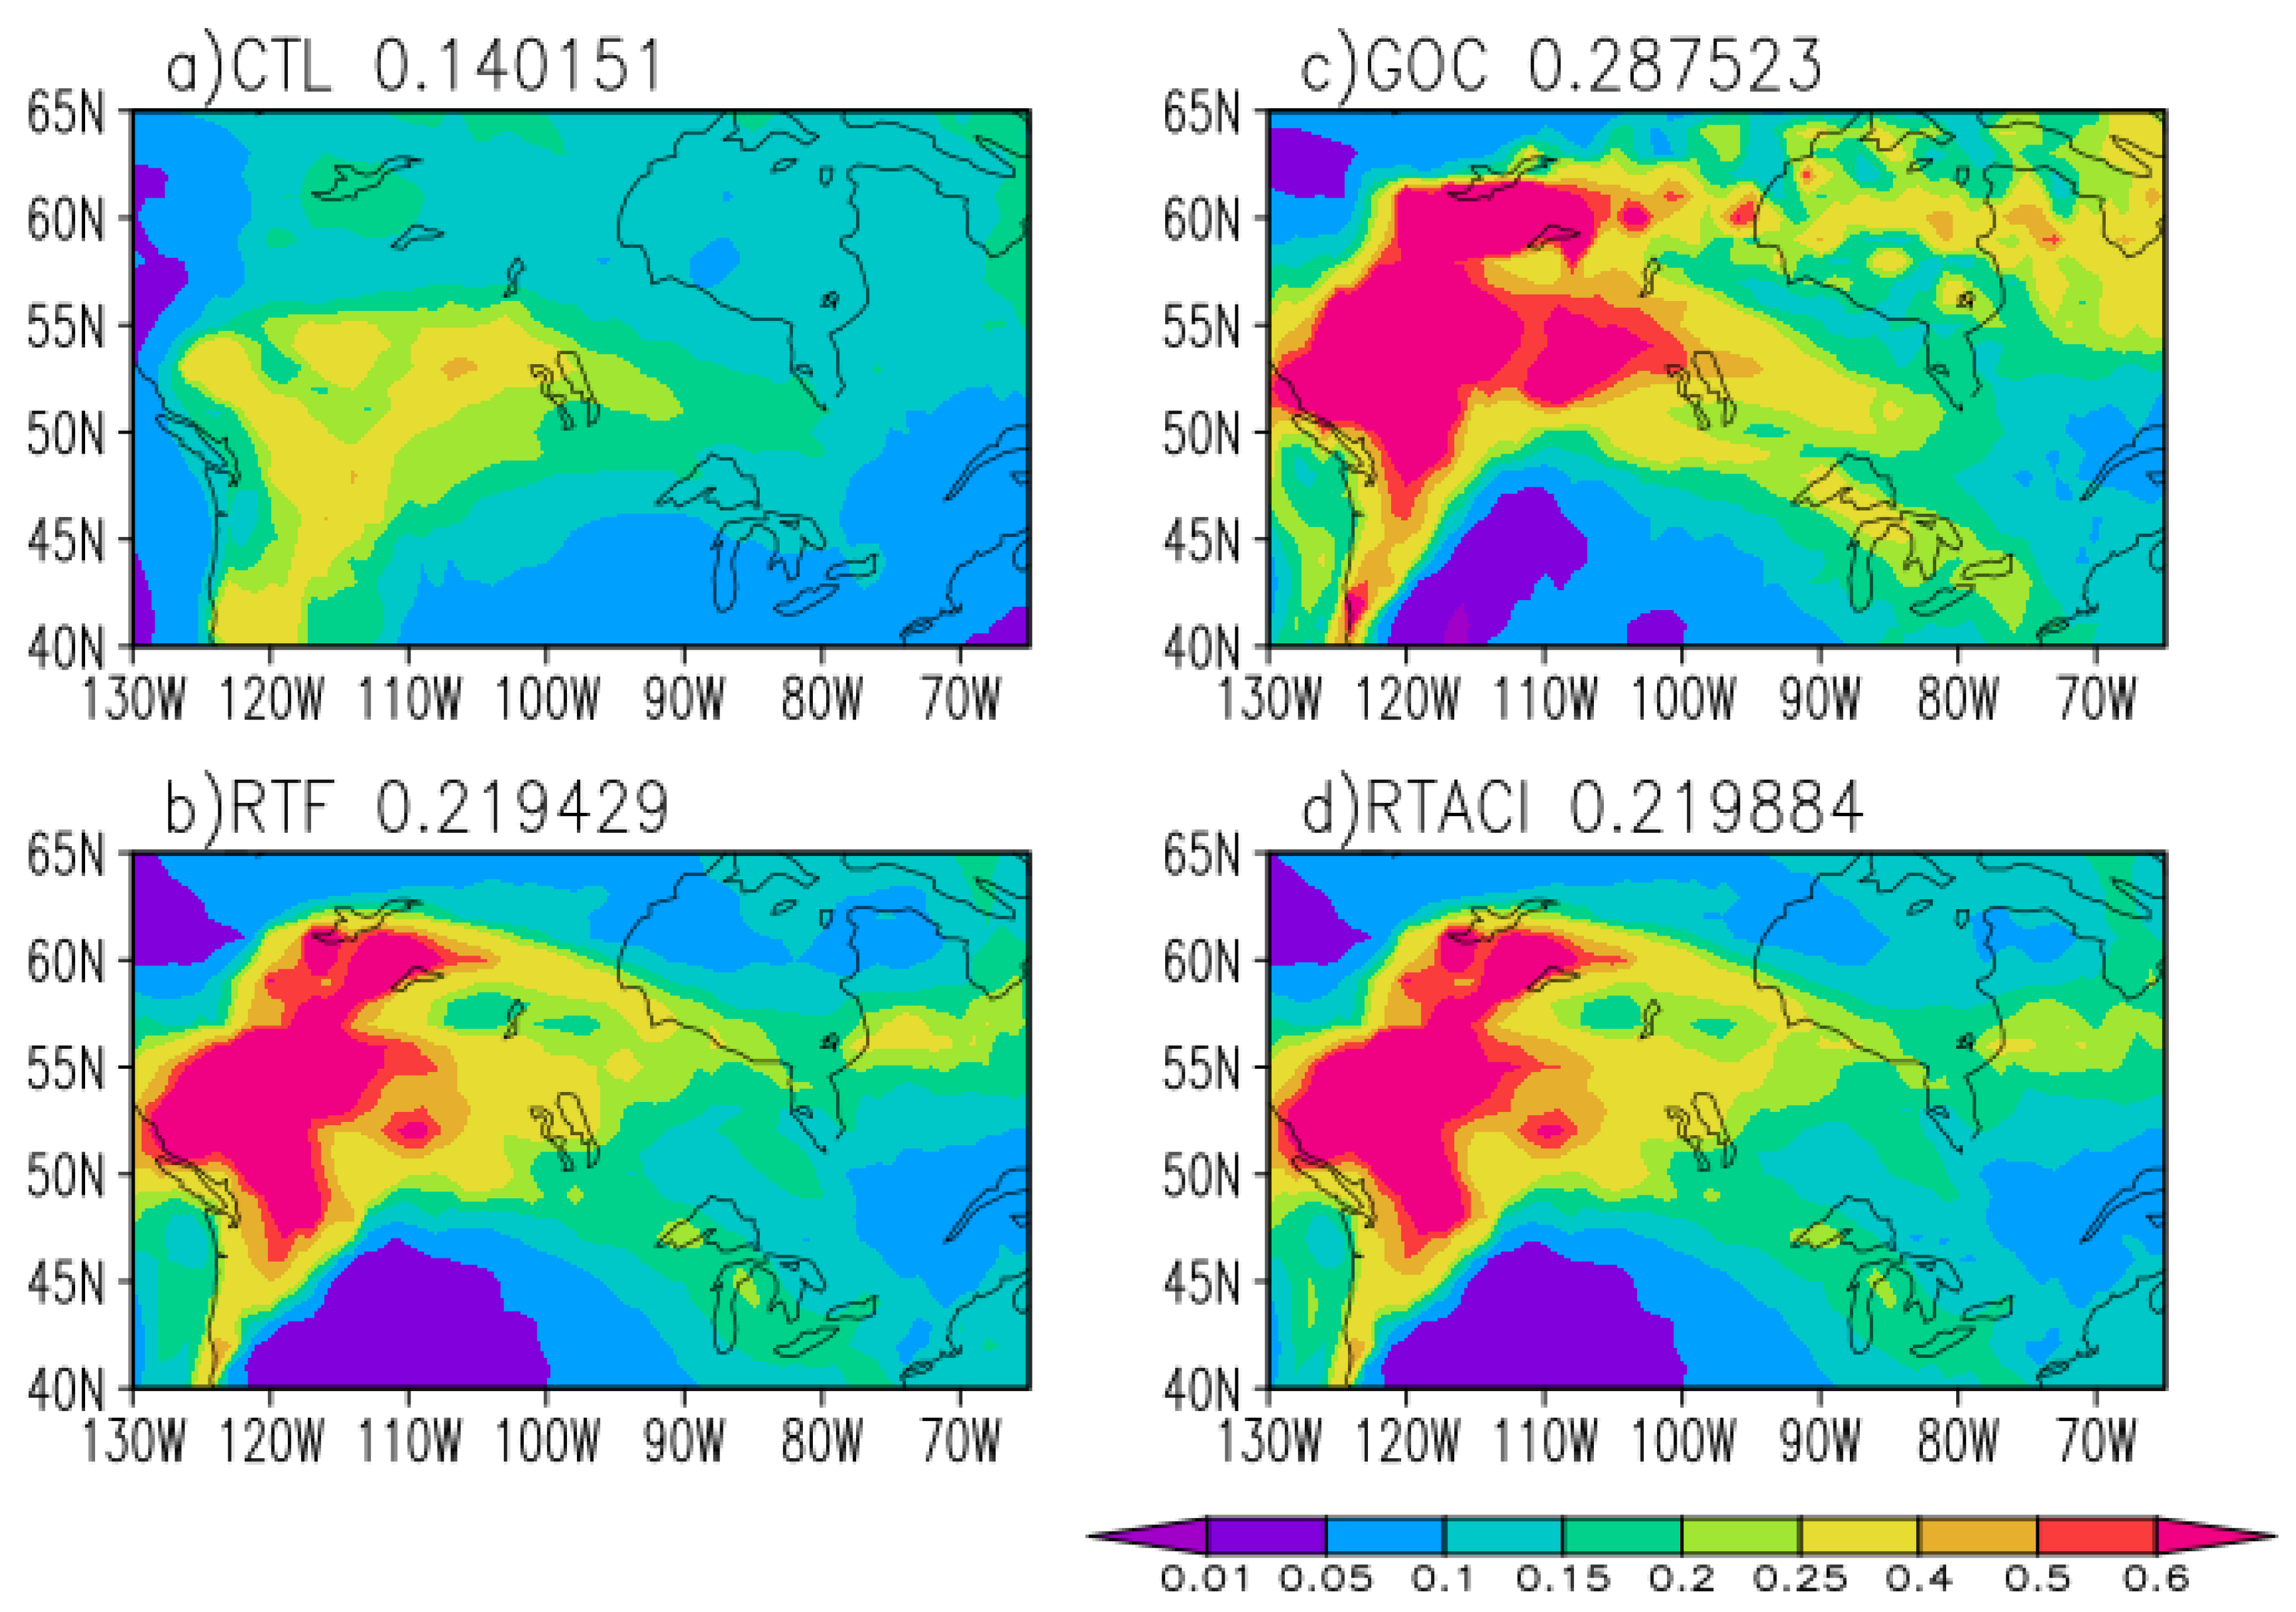
Figure 13.
Surface downward shortwave (SW) fluxes (W m⁻²) averaged over three days across North America from EXP CTL (a); differences between EXP RTF and EXP CTL (b); between EXP GOC and EXP CTL (c); and between EXP RTACI and EXP CTL (d).
Figure 13.
Surface downward shortwave (SW) fluxes (W m⁻²) averaged over three days across North America from EXP CTL (a); differences between EXP RTF and EXP CTL (b); between EXP GOC and EXP CTL (c); and between EXP RTACI and EXP CTL (d).
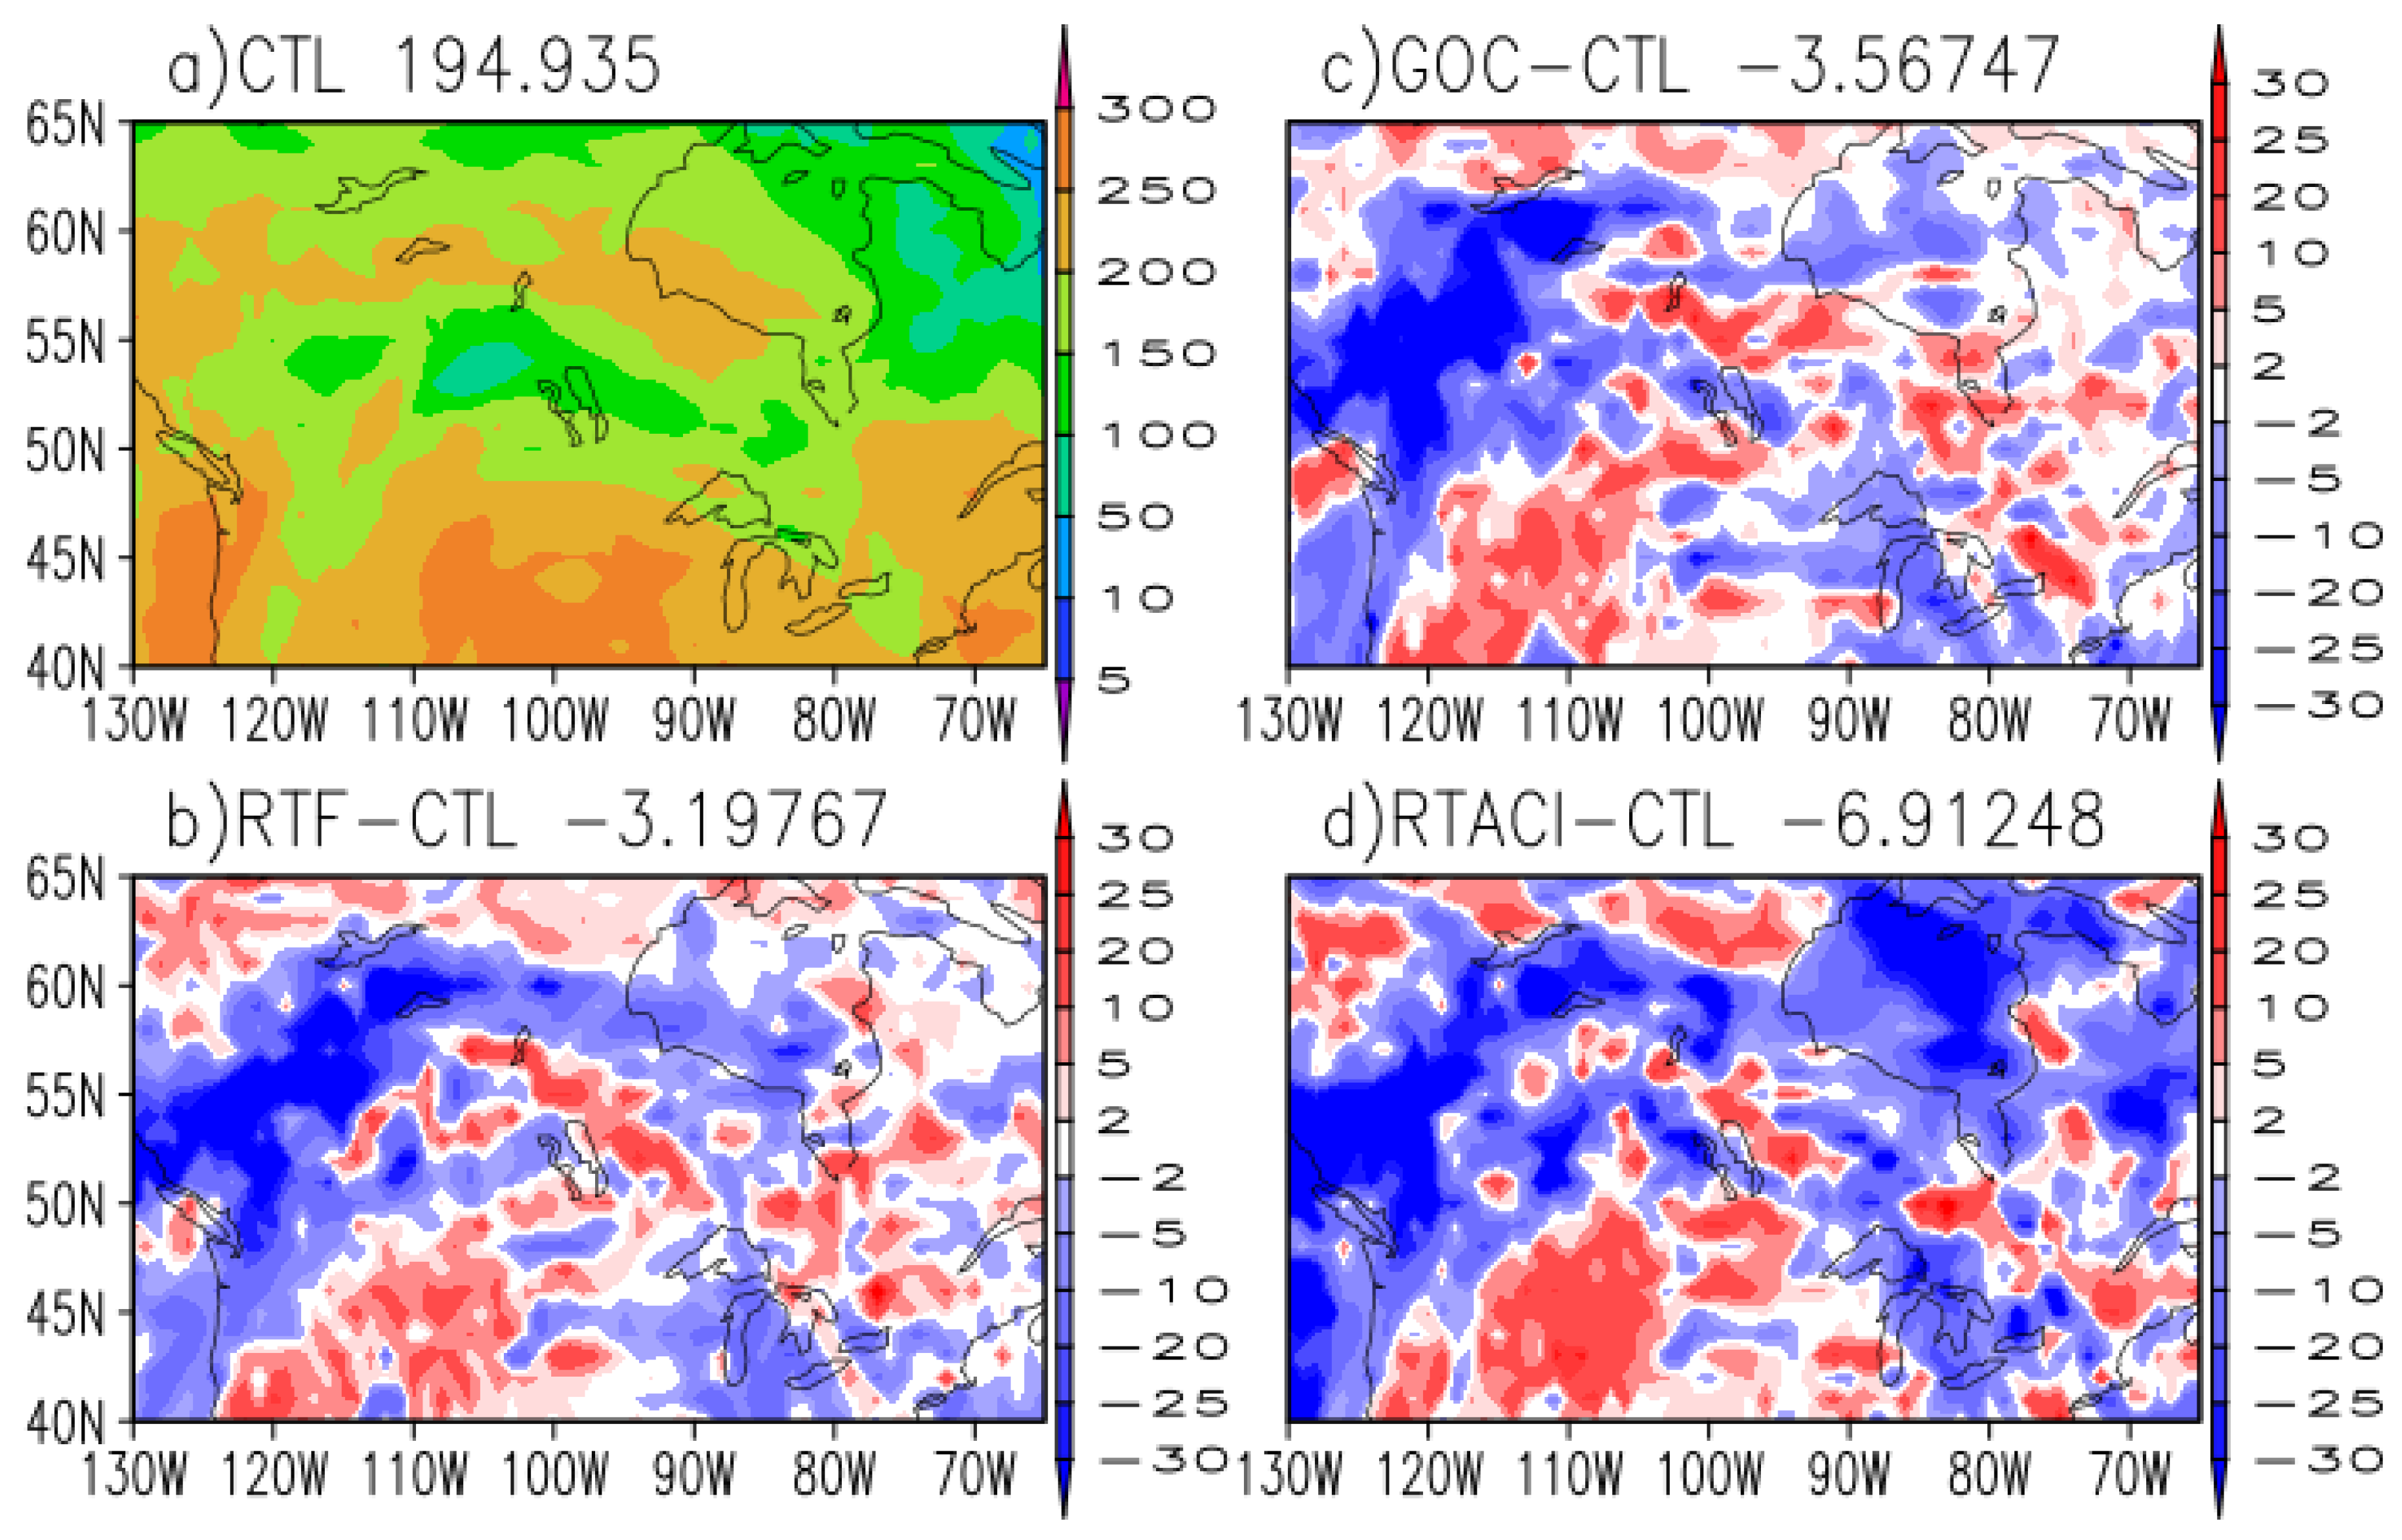
Figure 14.
Same as Figure 13 except for surface temperature (K).
Figure 14.
Same as Figure 13 except for surface temperature (K).
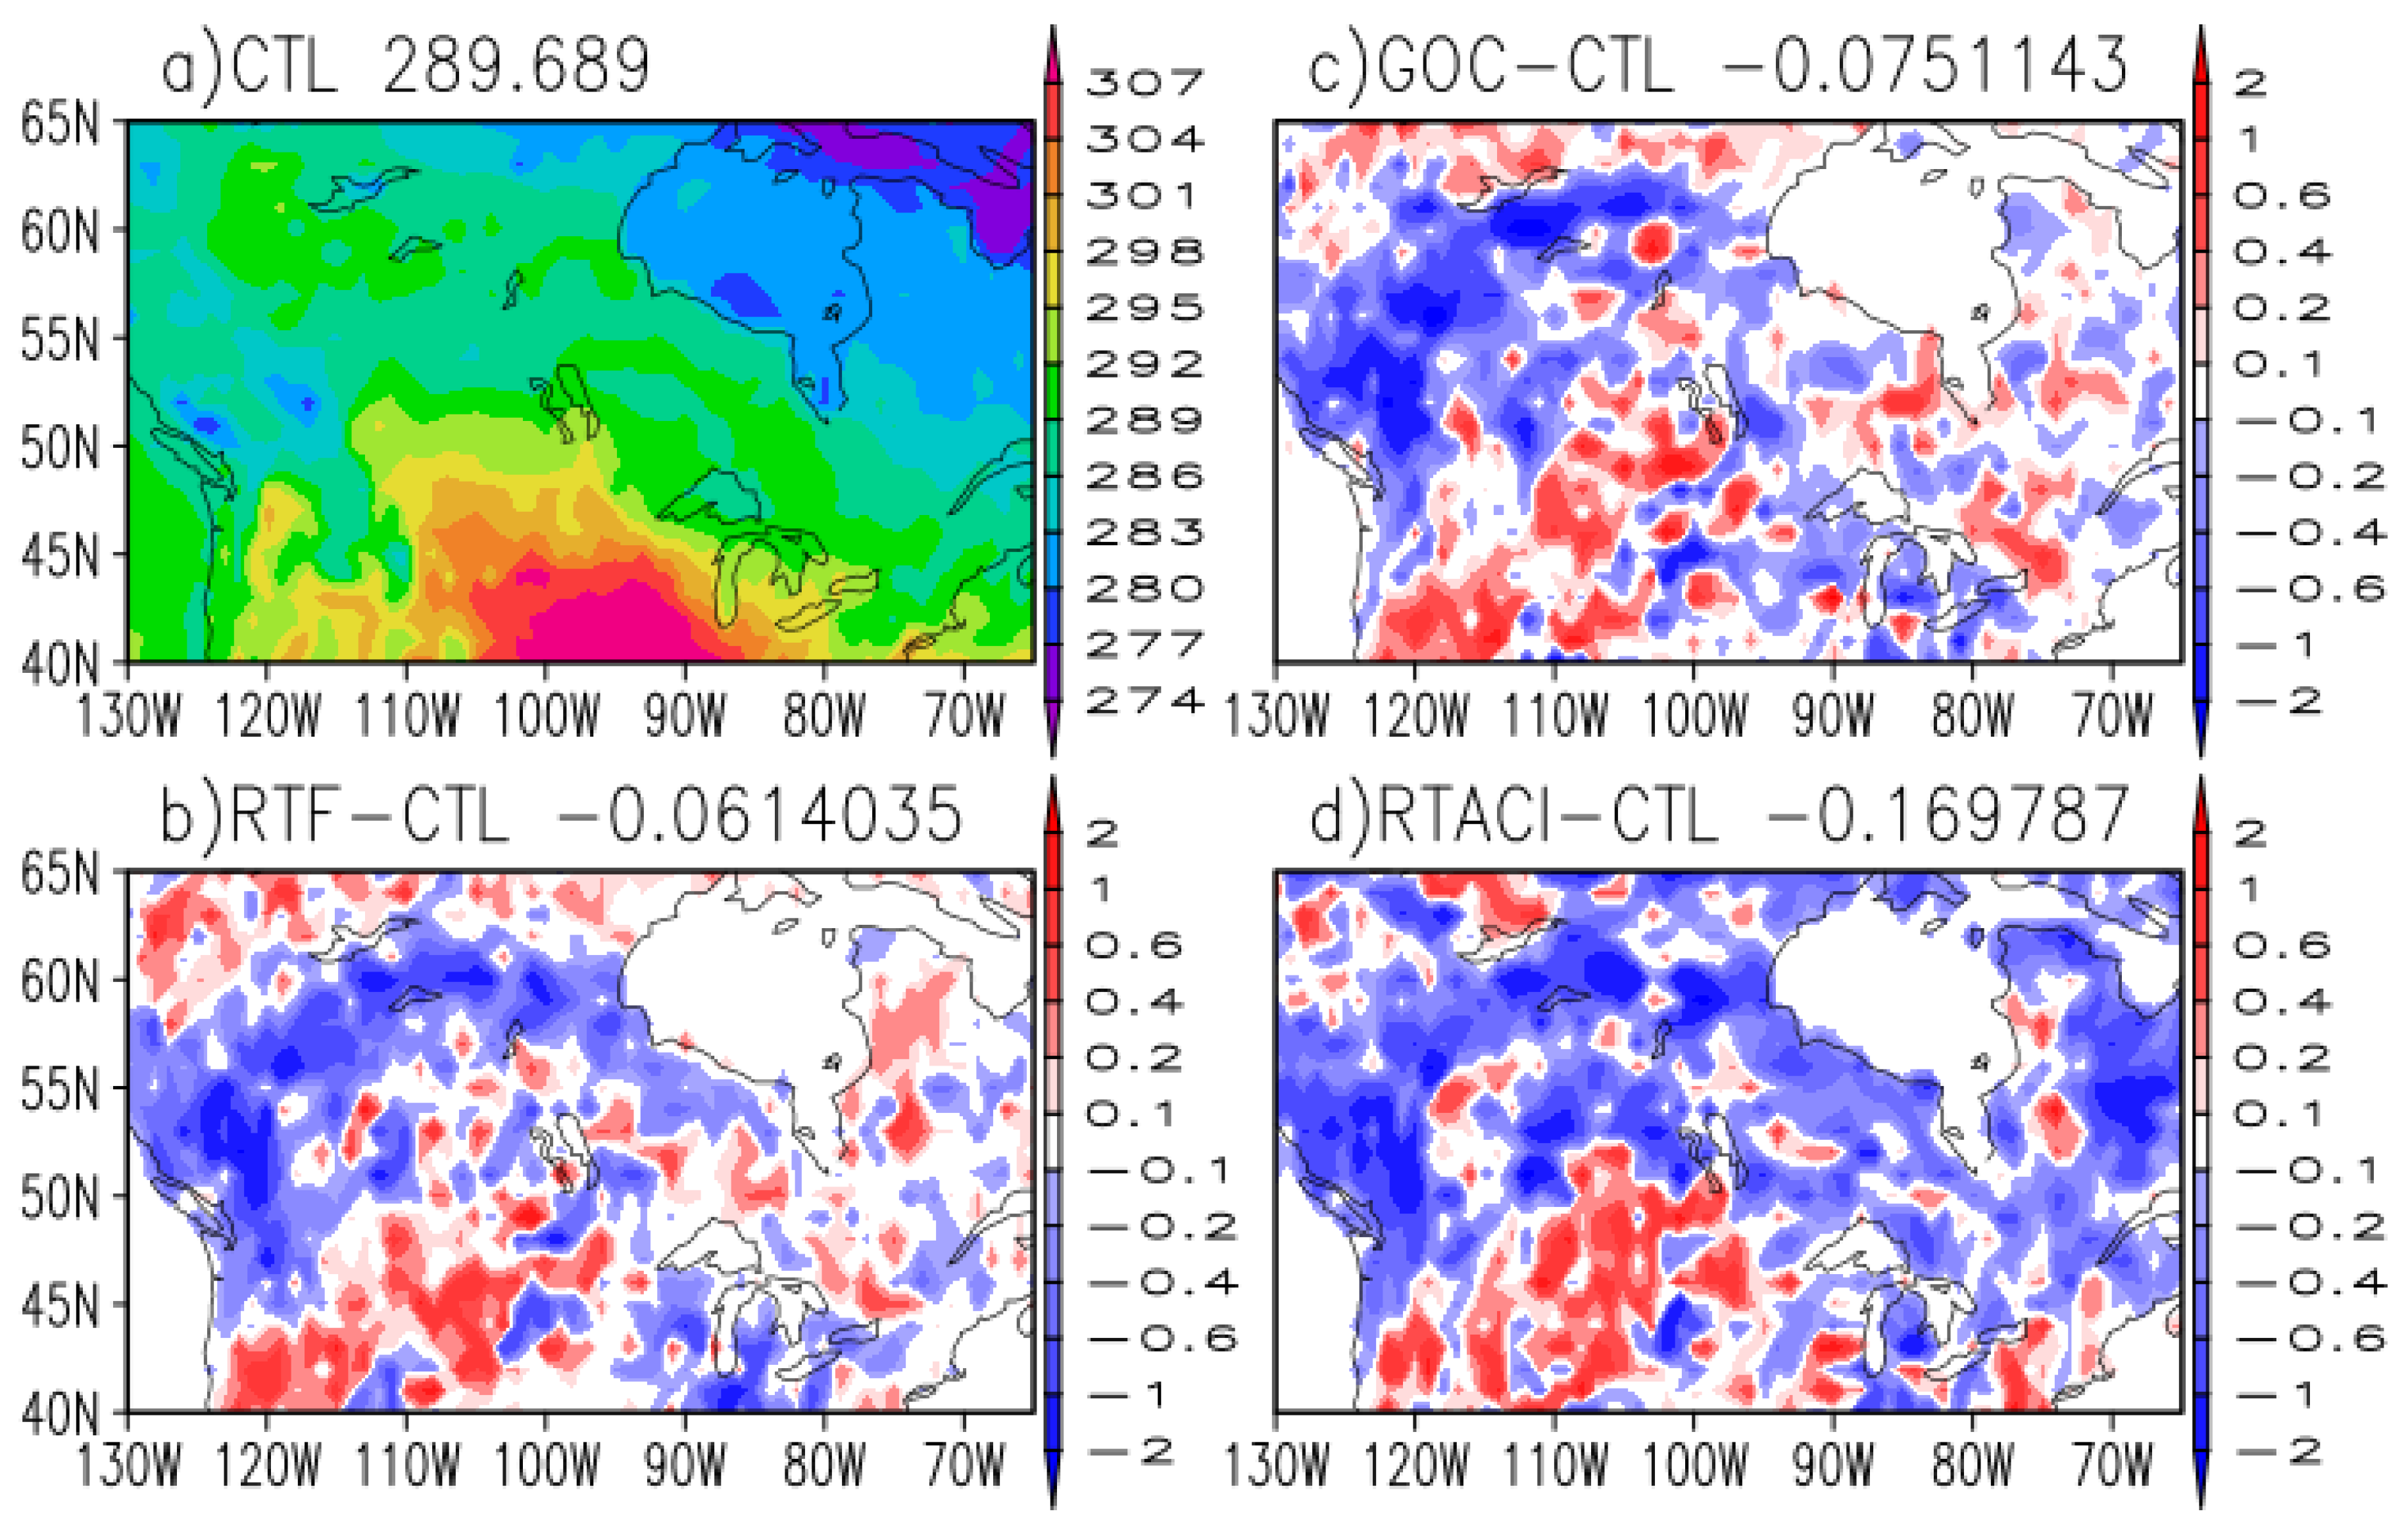
Figure 15.
Same as Figure 3 except for CAPE (J kg-1).
Figure 15.
Same as Figure 3 except for CAPE (J kg-1).
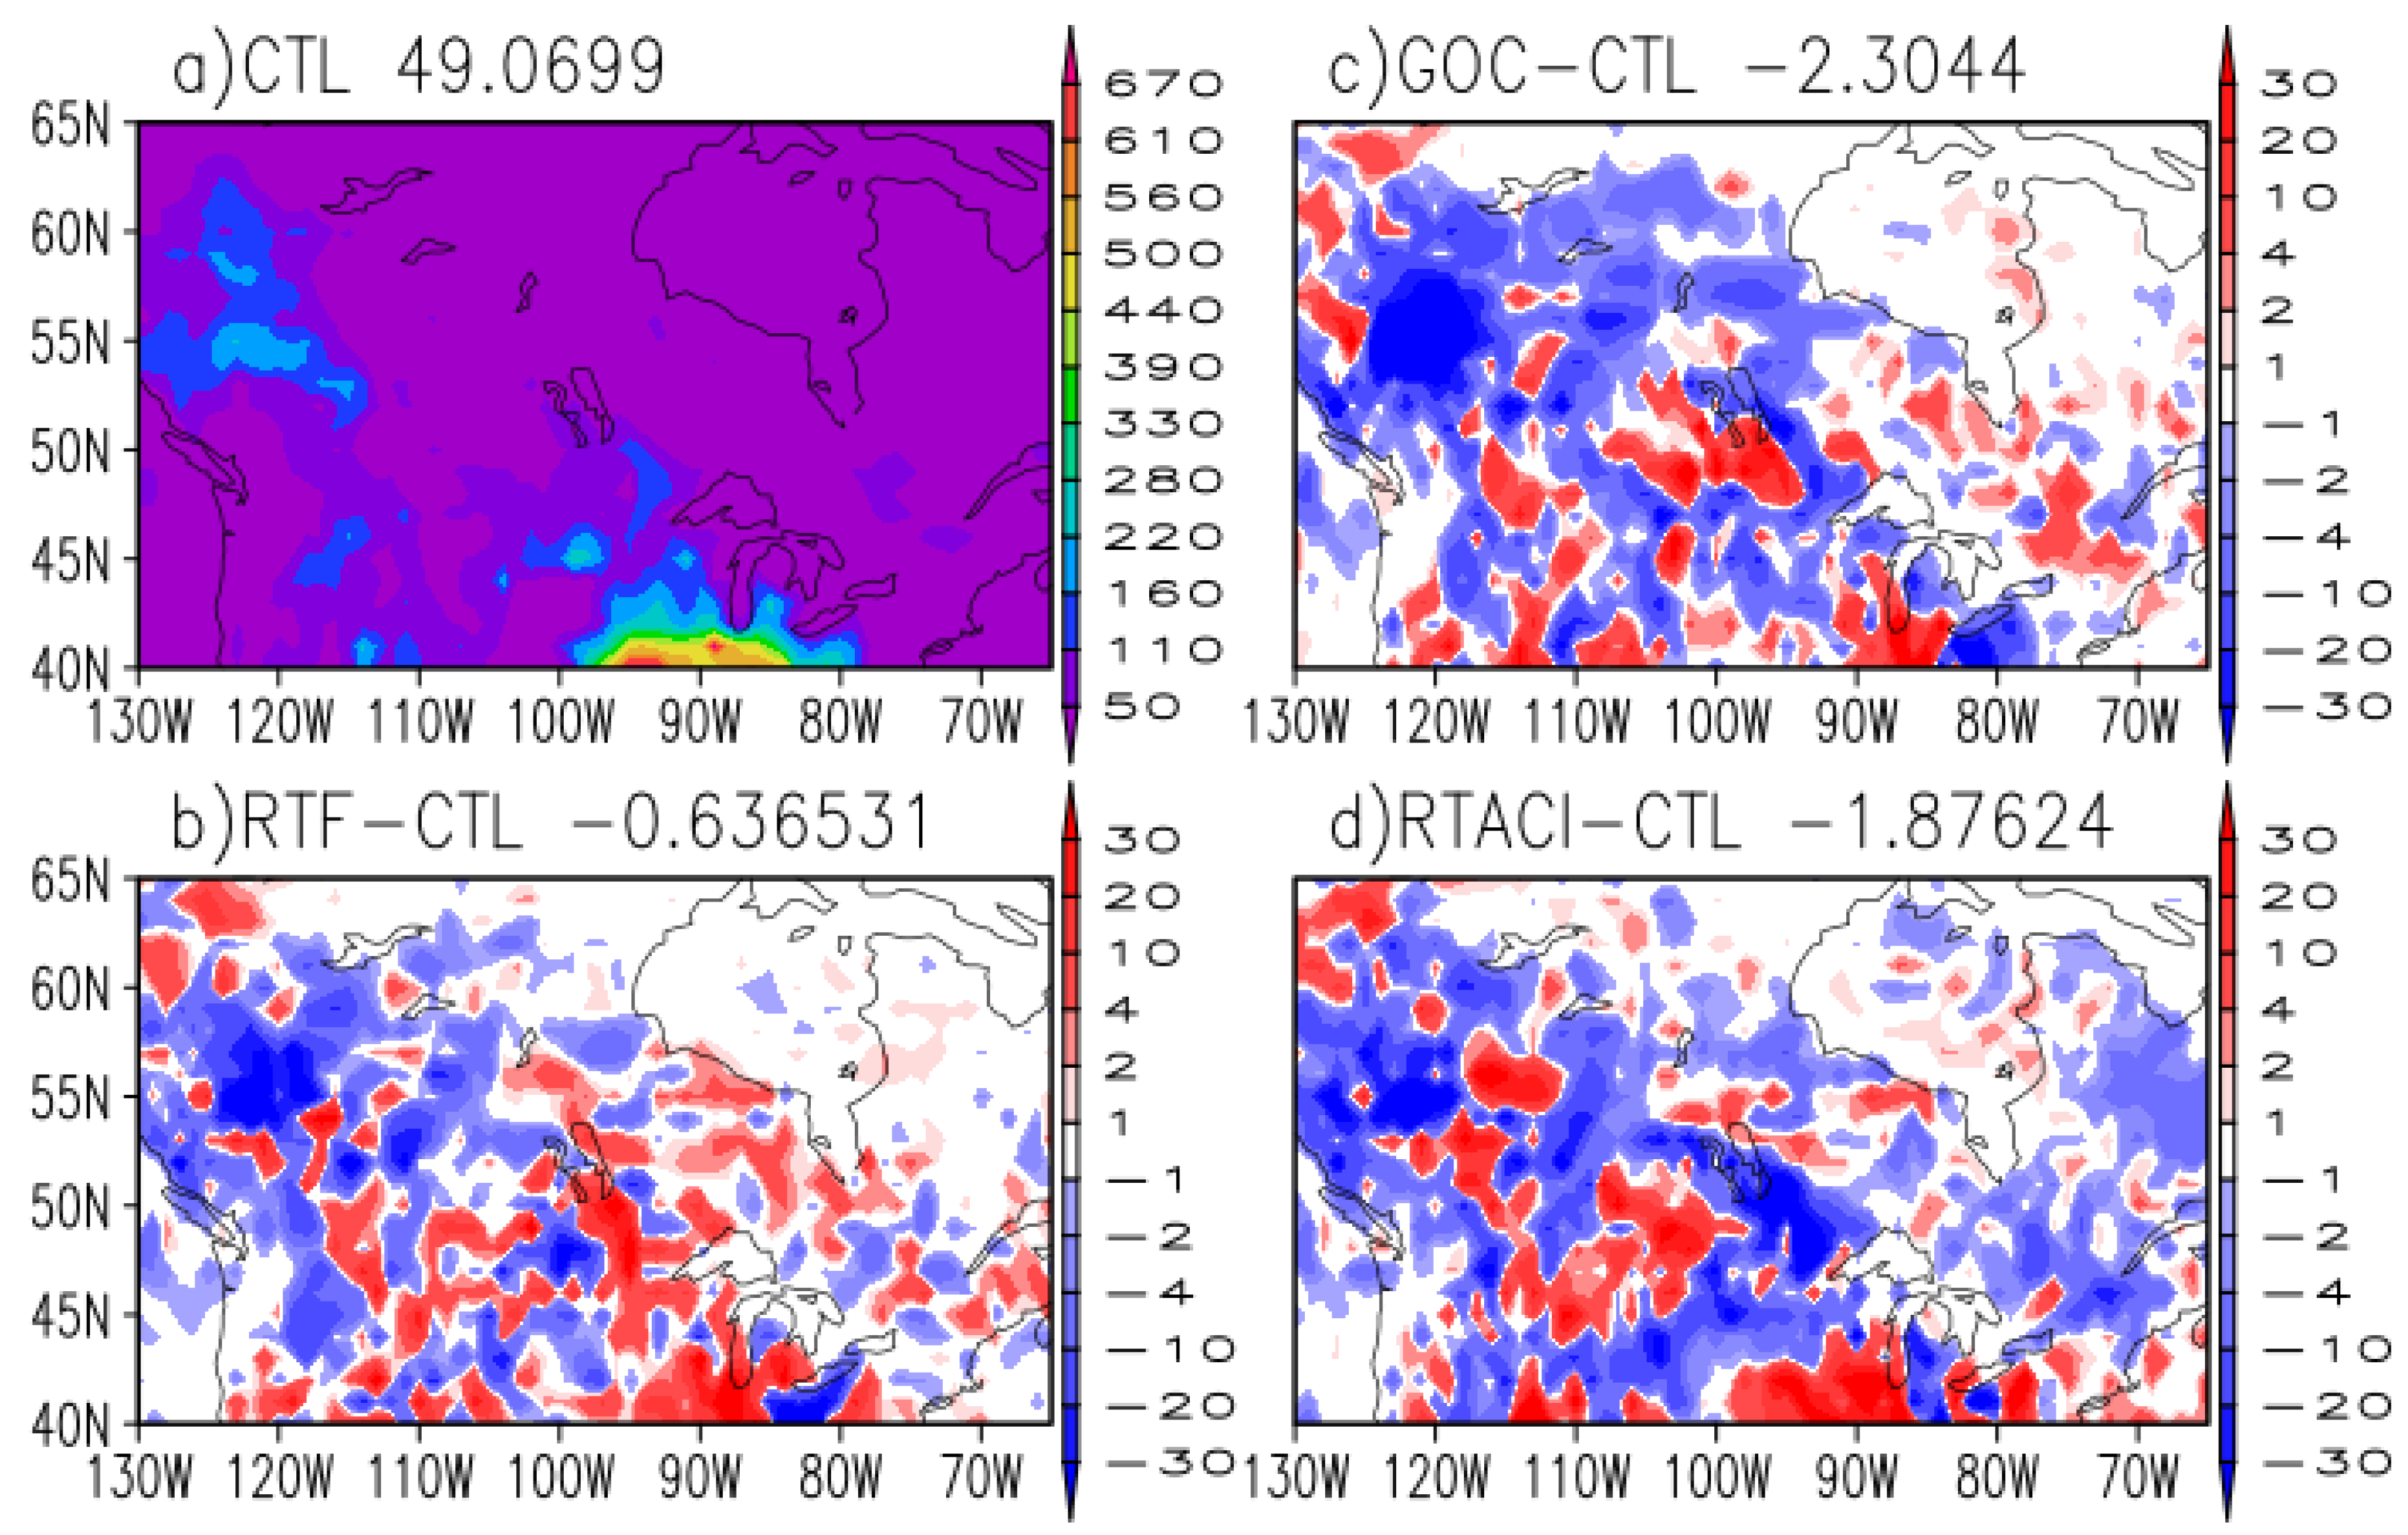
Figure 16.
Same as Figure 3 except for convective precipitation (mm day-1).
Figure 16.
Same as Figure 3 except for convective precipitation (mm day-1).
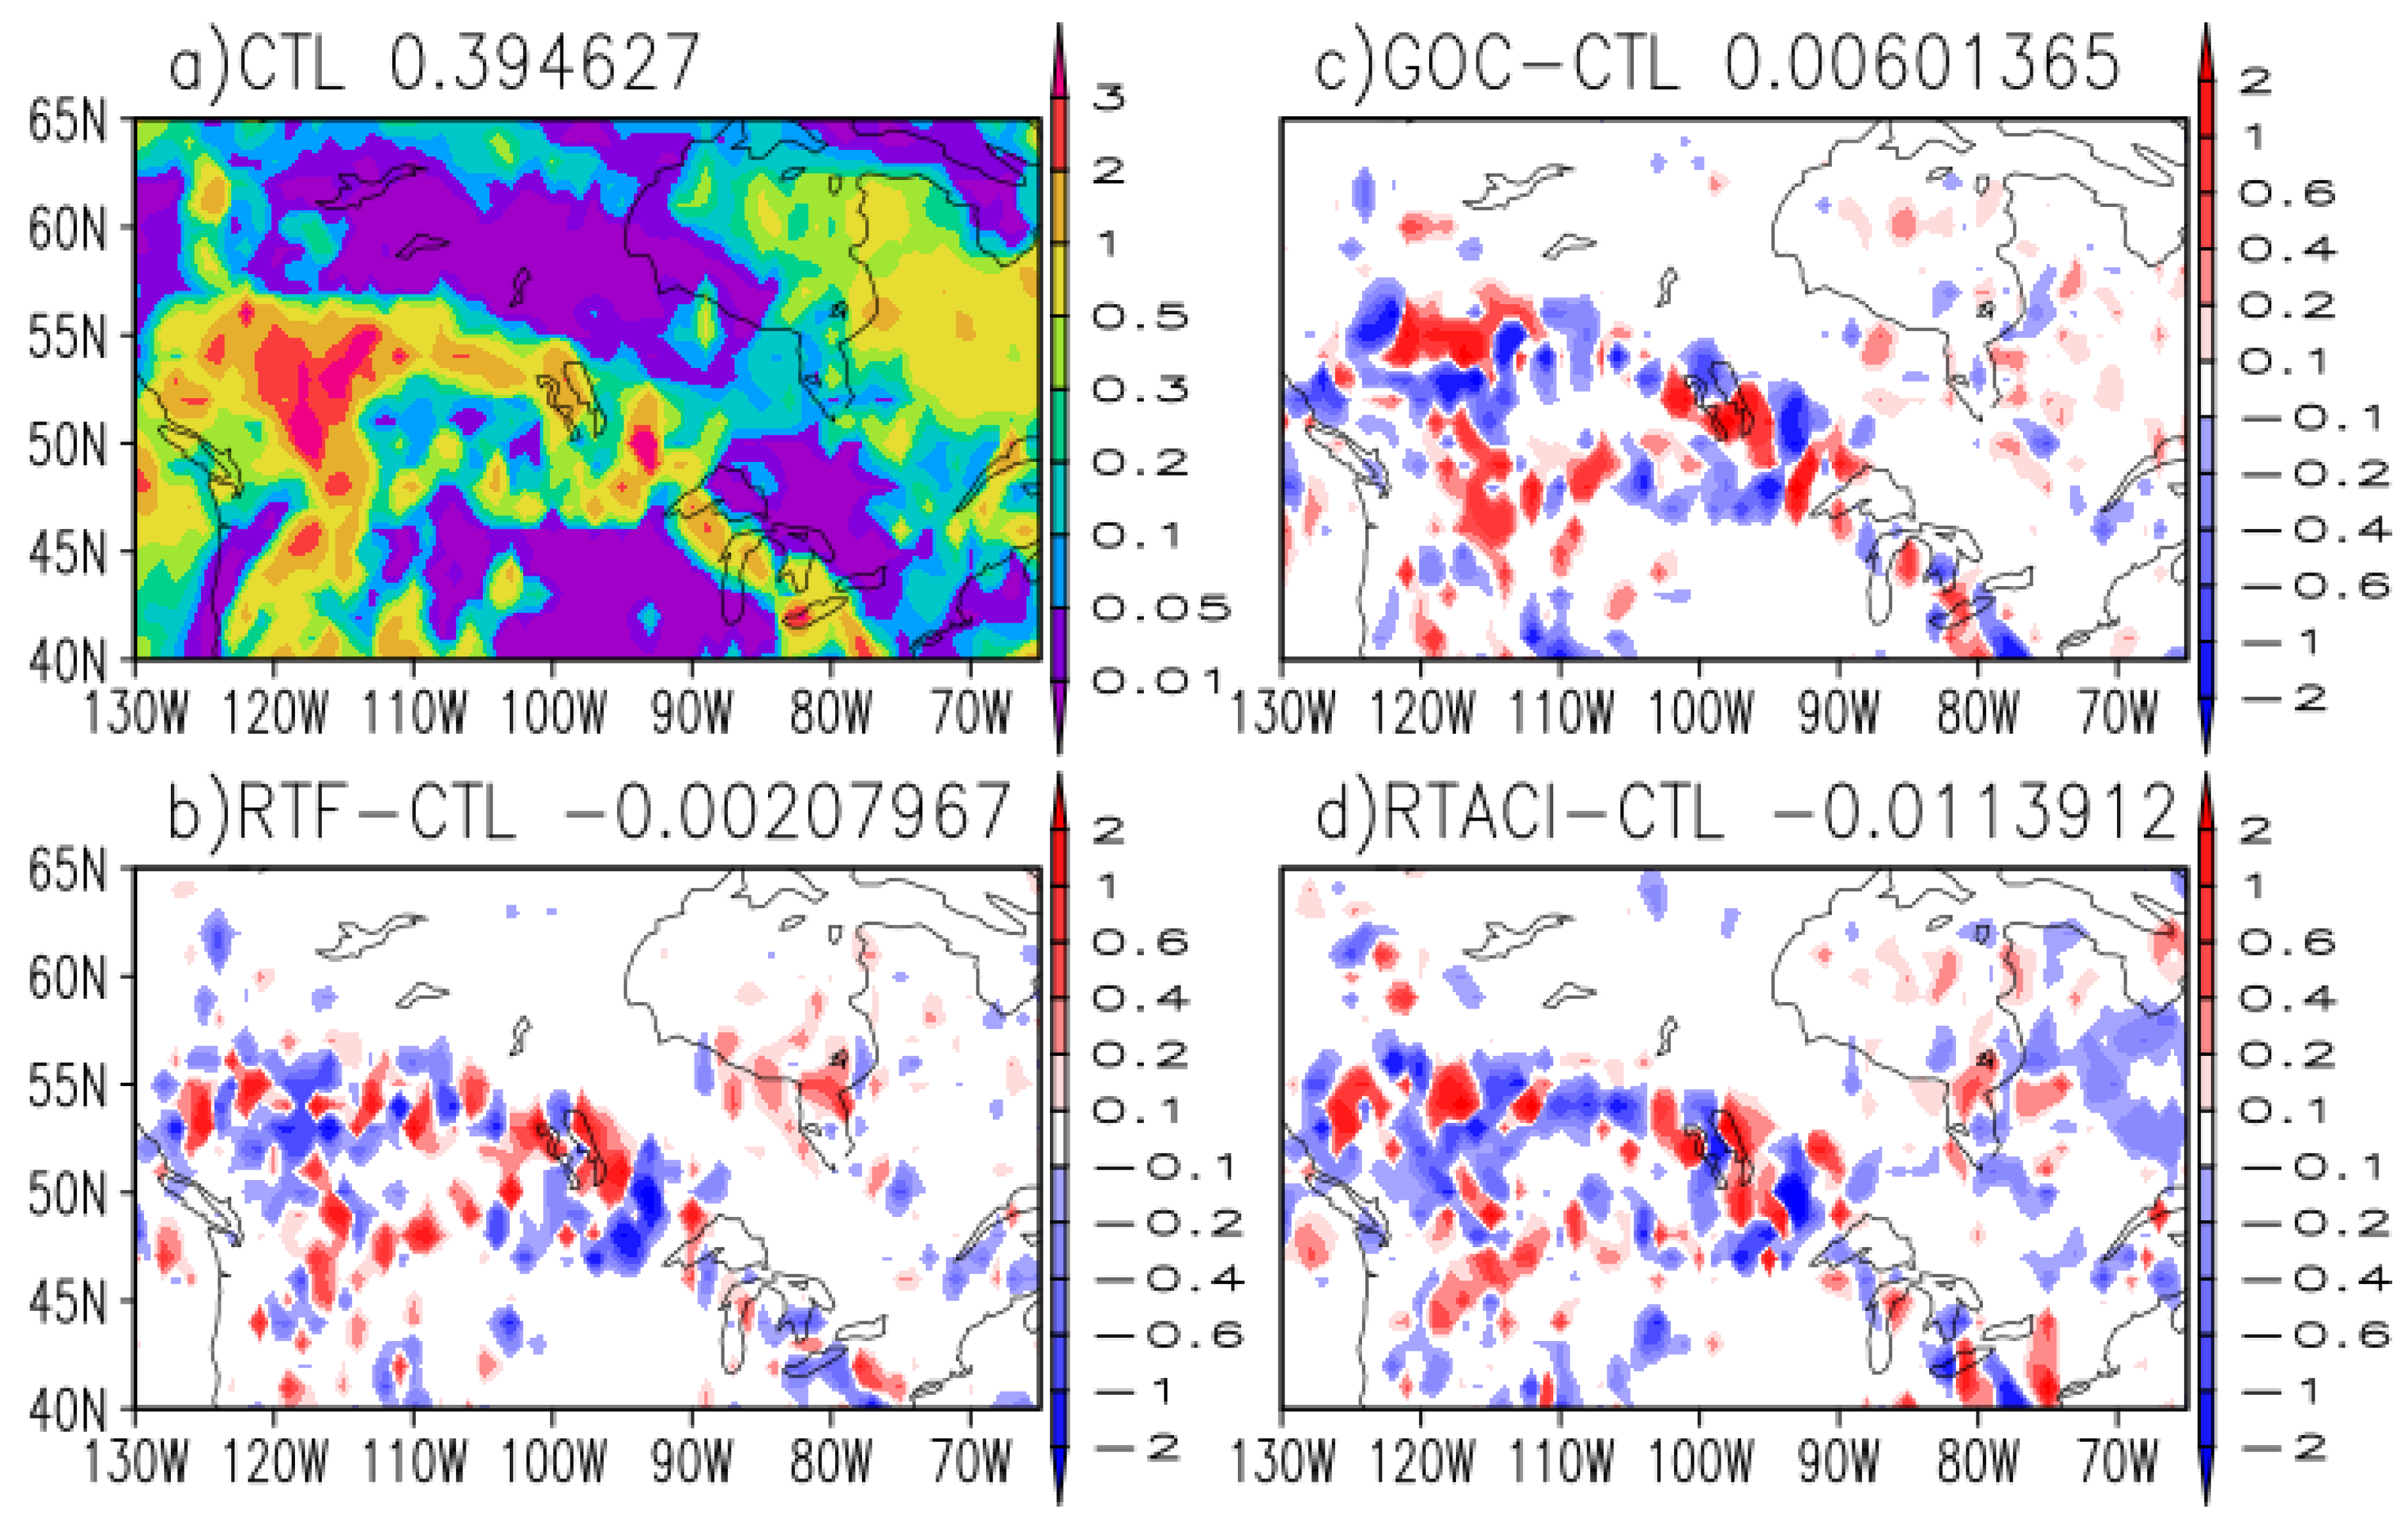
Figure 17.
Same as Figure 3 except for large-scale precipitation (mm day-1).
Figure 17.
Same as Figure 3 except for large-scale precipitation (mm day-1).
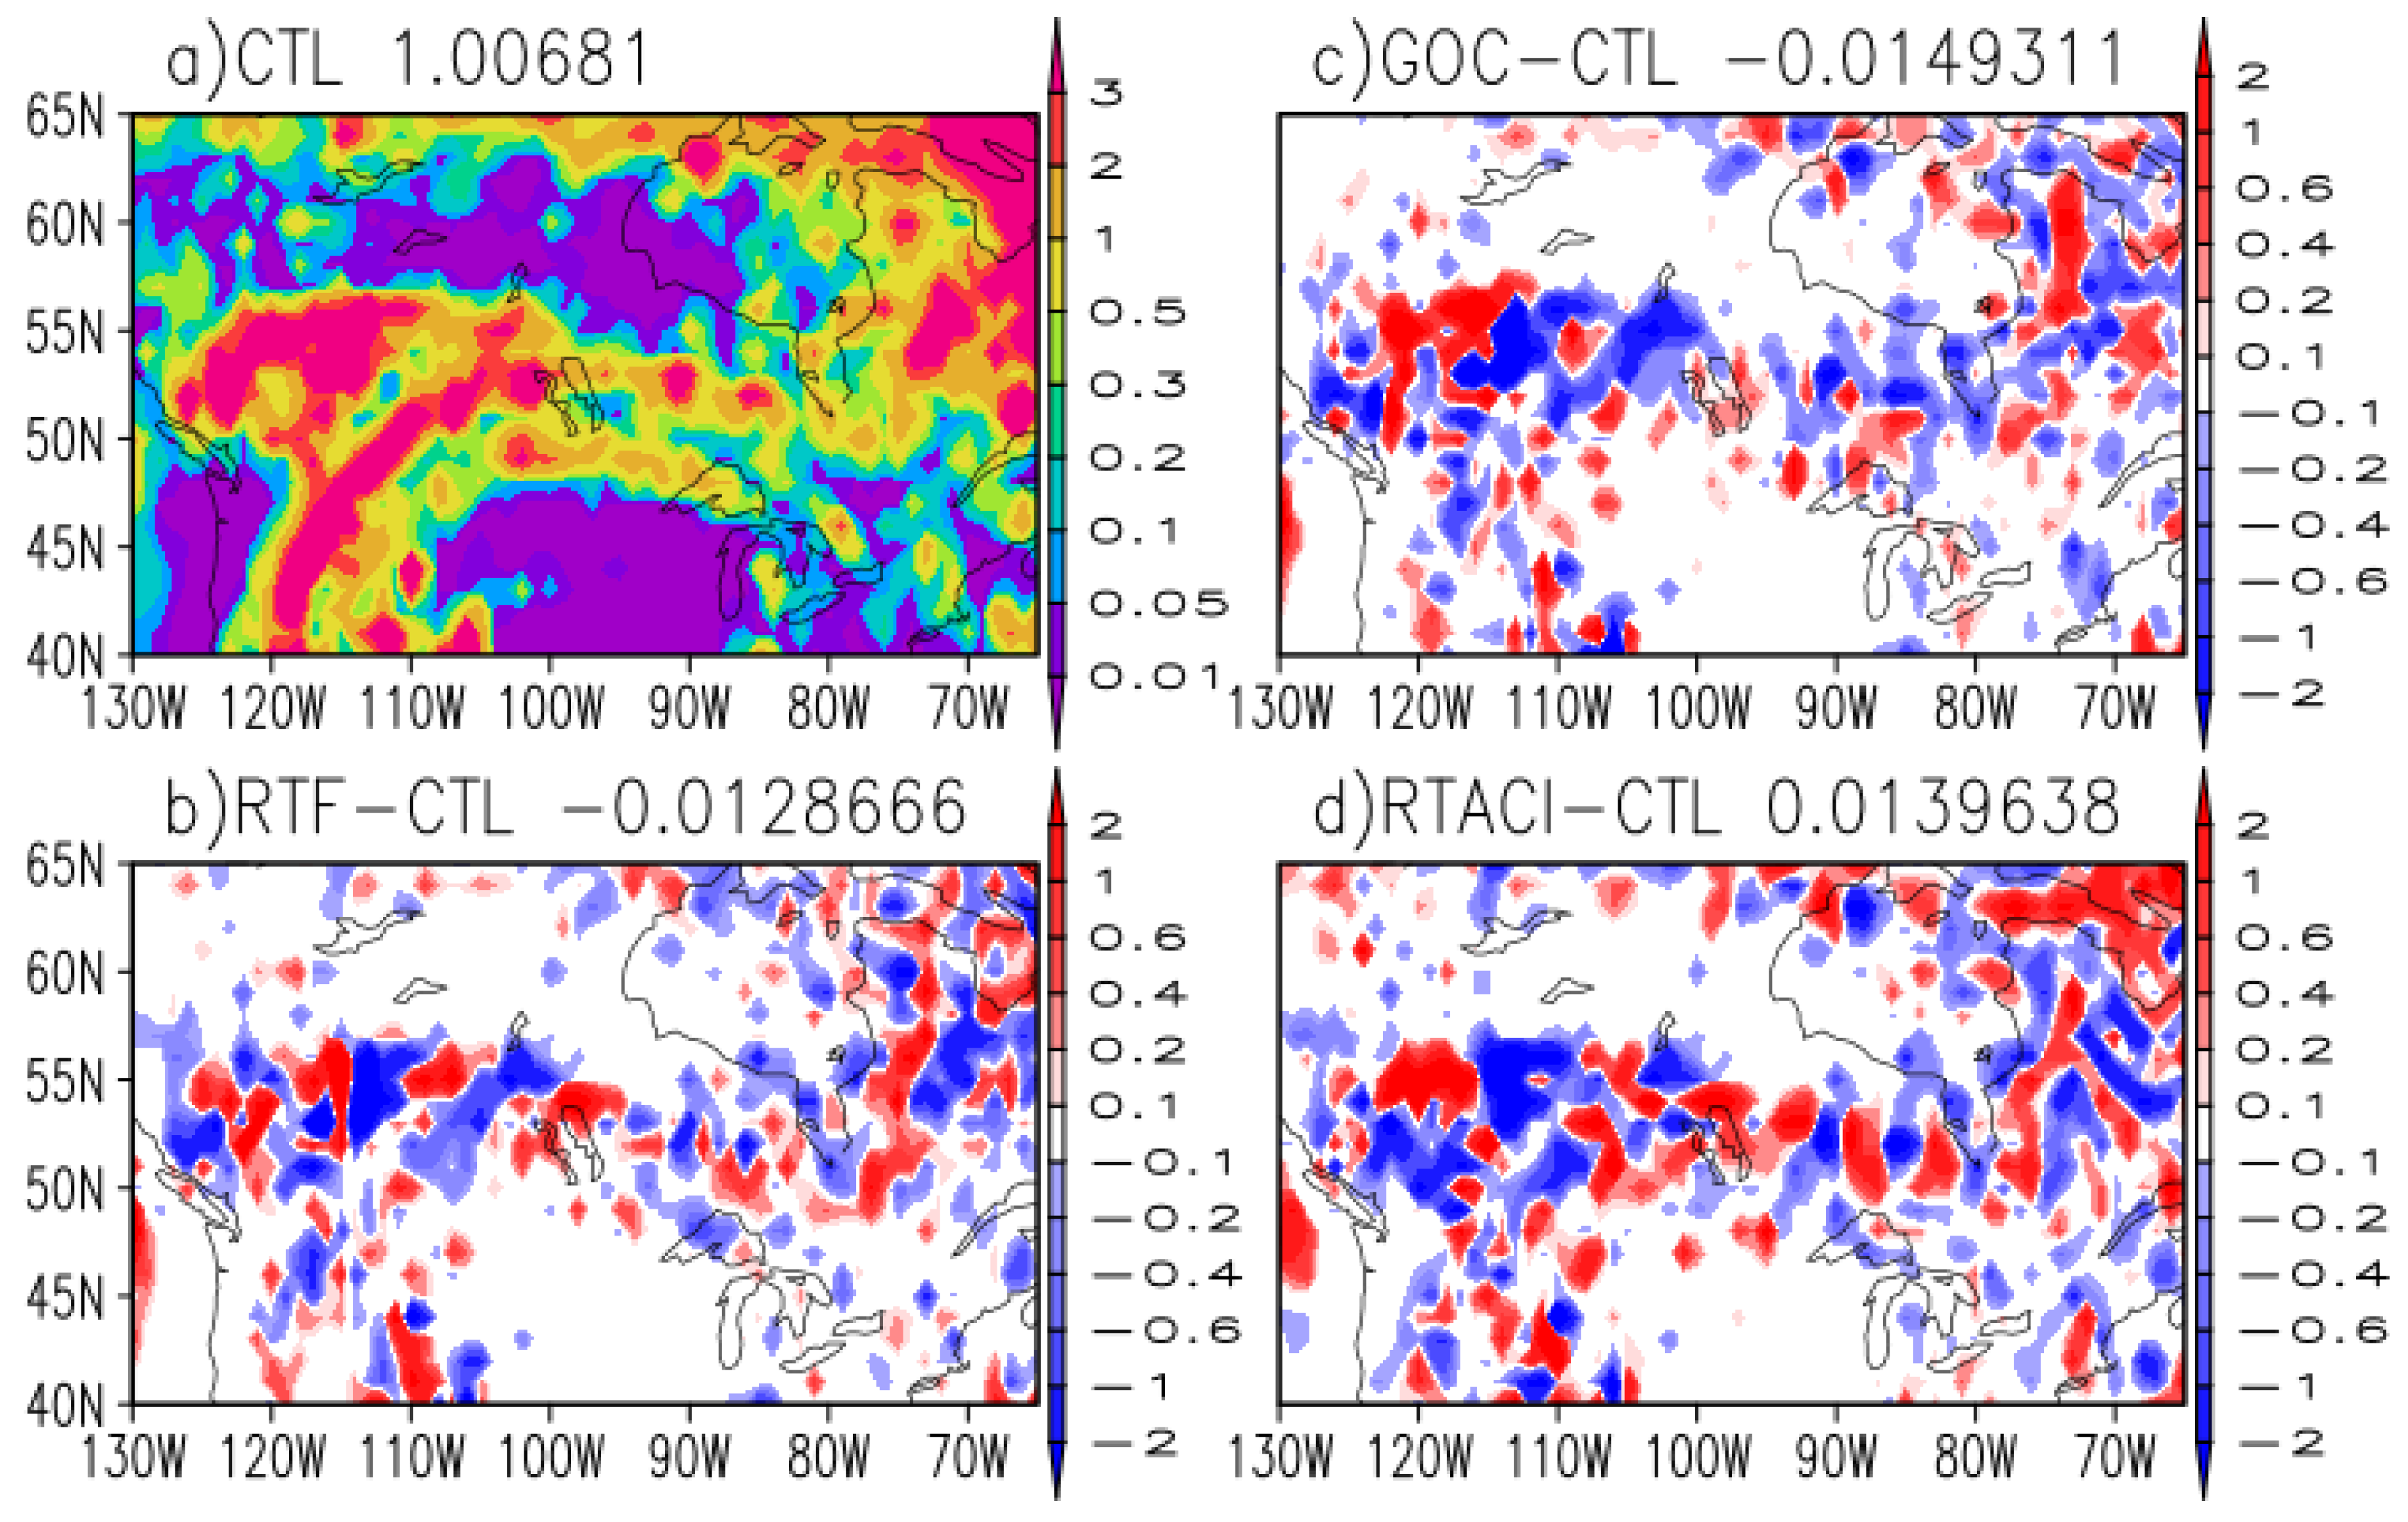
Figure 18.
Differences in 500-hPa height anomaly correlation (AC) scores between EXP RTF and CTL (red), EXP GOC and CTL (green), and EXP RTACI and CTL (blue) for the global domain (a), Northern Hemisphere (b), and Southern Hemisphere (c). AC differences outside the outlined bars are statistically significant at the 95% confidence level based on a Student’s t-test.
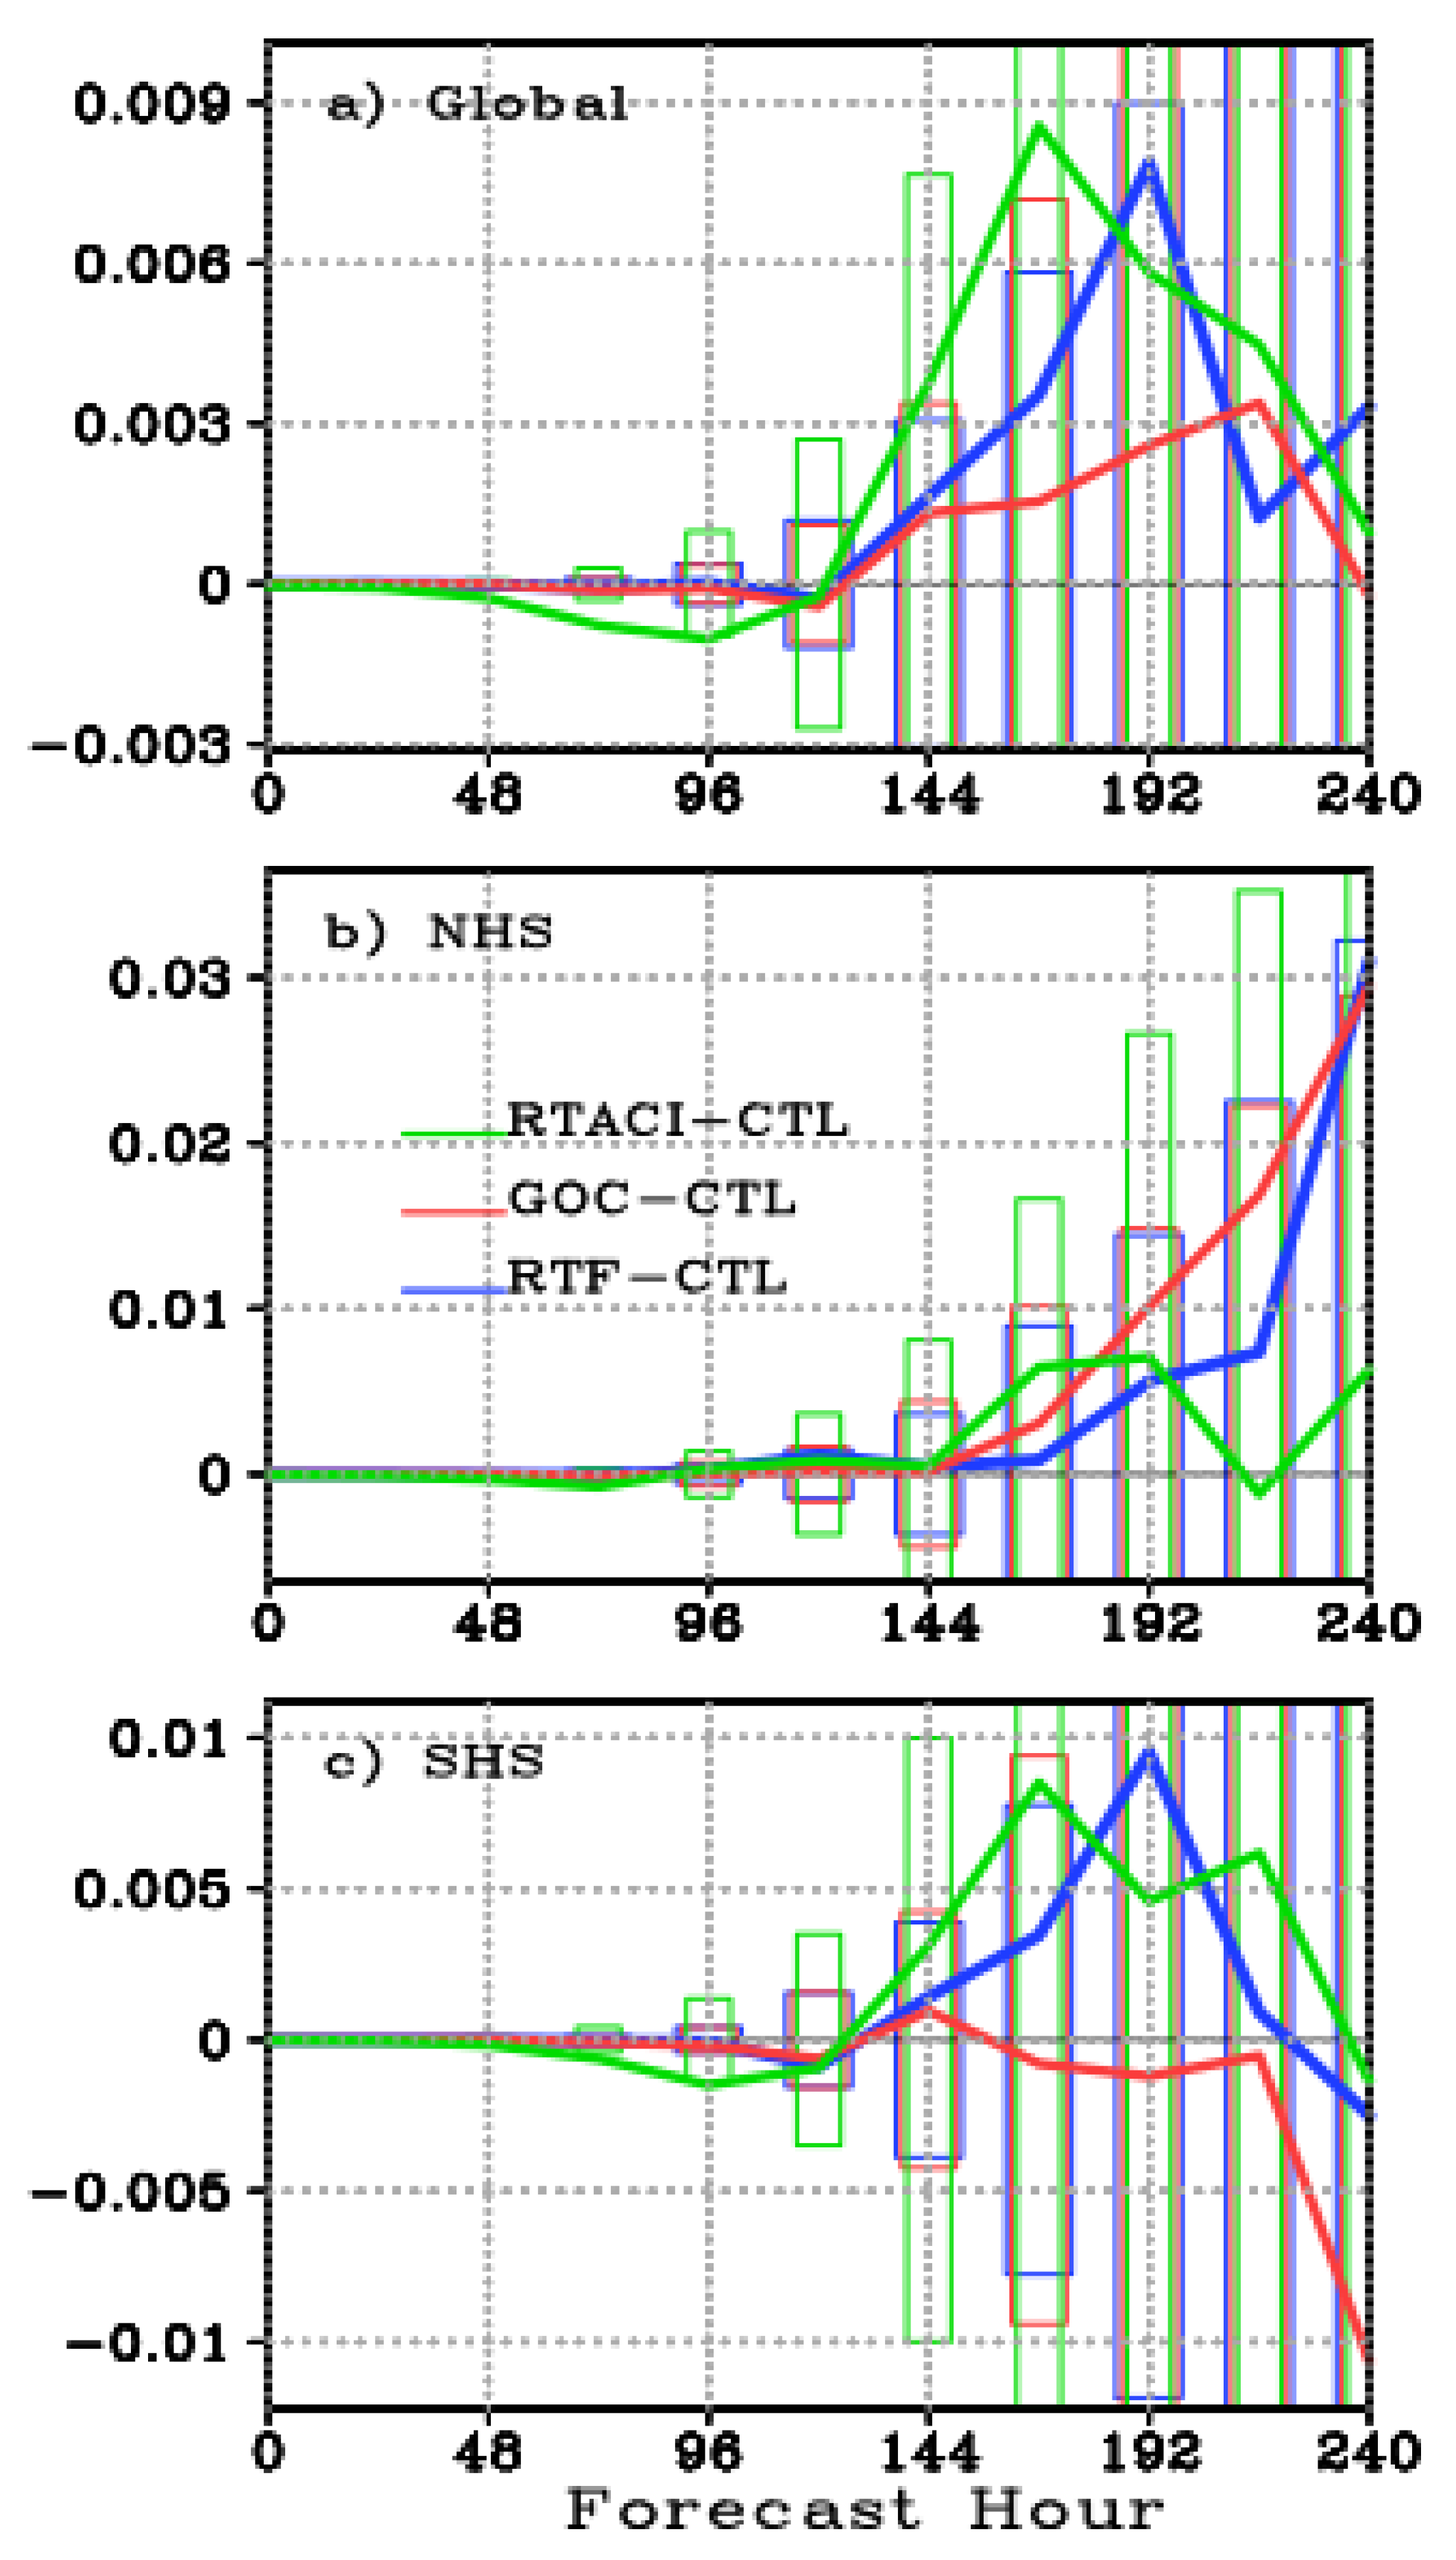

Table 1.
Experiments performed.
| Aerosol | ARI | ACI |
| MERRA2 2014-2023 (EXP CTL) | X | |
| MERRA2 three hourly Real Time Forcing (EXP RTF) | X | |
| aerosol forecasted from GOCART (EXP GOC) | X | |
| MERRA2 three hourly Real Time forcing (EXP RTACI) | X | X |
Table 2.
Global AOD RMSE and Bias calculated for the four experiments against MODIS observations, averaged over the latitude range from 65º N to 65ºS.
Table 2.
Global AOD RMSE and Bias calculated for the four experiments against MODIS observations, averaged over the latitude range from 65º N to 65ºS.
| RMSE | Bias | ||||||||
| CTL | RTF | GOC | RTACI | CTL | RTF | GOC | RTACI | ||
| Day1 | 0.136 | 0.116 | 0.1277 | 0.118 | -0.051 | -0.044 | -0.04 | -0.042 | |
| Day5 | 0.138 | 0.119 | 0.144 | 0.121 | -0.049 | -0.043 | -0.037 | -0.038 | |
| Day10 | 0.139 | 0.122 | 0.159 | 0.126 | -0.045 | -0.036 | -0.028 | -0.03 | |
Table 3.
Global AOD RMSE and Bias calculated for the four experiments against VIIRS observations, averaged over the latitude range from 65º N to 65ºS.
Table 3.
Global AOD RMSE and Bias calculated for the four experiments against VIIRS observations, averaged over the latitude range from 65º N to 65ºS.
| RMSE | Bias | ||||||||
| CTL | RTF | GOC | RTACI | CTL | RTF | GOC | RTACI | ||
| Day1 | 0.122 | 0.105 | 0.114 | 0.105 | -0.045 | -0.036 | -0.032 | -0.035 | |
| Day5 | 0.123 | 0.108 | 0.13 | 0.109 | -0.043 | -0.033 | -0.029 | -0.03 | |
| Day10 | 0.124 | 0.111 | 0.147 | 0.114 | -0.04 | -0.029 | -0.023 | -0.025 | |
Table 4.
RMSE of TOA upward short wave flux (W m-2) against CERES-EBAF.
| TOA_UP_SW | Global | North America | |
| CTL | 17.3856 | 23.127 | |
| RTF | 17.3221 | 22.9259 | |
| GOC | 17.1588 | 22.6171 | |
| RTACI | 23.1889 | 22.0543 |
Table 5.
Same as Table 4 except for OLR (W m-2).
Table 5.
Same as Table 4 except for OLR (W m-2).
| OLR | Global | North America |
| CTL | 7.27287 | 7.44851 |
| RTF | 7.29478 | 7.44844 |
| GOC | 7.31216 | 7.55837 |
| RTACI | 8.48511 | 8.63464 |
Table 6.
Same as Table 4 except for surface downward shortwave (W m-2).
Table 6.
Same as Table 4 except for surface downward shortwave (W m-2).
| Surface DN SW | Global | North America |
| CTL | 21.9616 | 28.6287 |
| RTF | 21.5634 | 27.4383 |
| GOC | 21.9064 | 27.9882 |
| RTACI | 27.7747 | 27.9135 |
Table 7.
Same as Table 4 except for surface downward longwave (W m-2).
Table 7.
Same as Table 4 except for surface downward longwave (W m-2).
| Surface DN LW | Global | North America |
| CTL | 13.1891 | 12.9391 |
| RTF | 13.1853 | 12.9791 |
| GOC | 13.2202 | 12.8836 |
| RTACI | 12.7508 | 12.5158 |
Disclaimer/Publisher’s Note: The statements, opinions and data contained in all publications are solely those of the individual author(s) and contributor(s) and not of MDPI and/or the editor(s). MDPI and/or the editor(s) disclaim responsibility for any injury to people or property resulting from any ideas, methods, instructions or products referred to in the content. |
© 2026 by the authors. Licensee MDPI, Basel, Switzerland. This article is an open access article distributed under the terms and conditions of the Creative Commons Attribution (CC BY) license (http://creativecommons.org/licenses/by/4.0/).
Copyright: This open access article is published under a Creative Commons CC BY 4.0 license, which permit the free download, distribution, and reuse, provided that the author and preprint are cited in any reuse.


