
Submitted:
27 April 2025
Posted:
28 April 2025
You are already at the latest version
Abstract
Wildfires are increasingly altering atmospheric composition across urban regions, with Southern California being a critical hotspot due to its frequent fire activity and population density. This study evaluates the impact of the January 2025 wildfires on urban air quality in the Los Angeles metropolitan area using satellite-derived observations of ozone (O₃), nitrogen dioxide (NO₂), carbon monoxide (CO), and aerosol optical depth (AOD). We employed data from TROPOMI and MODIS sensors to capture the spatiotemporal evolution of these pollutants across three phases: pre-fire (December 22, 2024–January 5, 2025), active fire (January 6–30), and post-fire (January 31–February 10). Results revealed marked increases in pollutant levels during the wildfire period, with CO exhibiting the most substantial rise (14% on average, with peaks exceeding 300% of the baseline), fol-lowed by NO₂ (33%) and AOD (28.6%). O₃ exhibited a modest enhancement (~4%), likely constrained by limited wintertime photochemistry and ozone titration by freshly emitted NO. This research helps us better understand how wildfire smoke affects air quality over time and shows how satellite tools can improve pollution monitoring in cities that are at high risk of wildfires due to growing populations and changing climate.
Keywords:
wildfire
; satellite remote sensing
; southern california wildfires
; CO
; AOD
1. Introduction
Wildfires have become increasingly frequent, widespread, and destructive across the United States (US), particularly in the western regions, where prolonged droughts, elevated temperatures, and land-use changes have amplified fire risk. Over the past four decades, the annual area burned has more than quadrupled, with wildland-urban interface (WUI) regions facing elevated vulnerability due to population growth and vegetation encroachment [1,2]. These fires pose dual threats i.e., destroying natural ecosystems and infrastructure, while also emitting massive quantities of air pollutants that compromise atmospheric composition and public health across local and regional scales [3]. The atmospheric impacts of wildfires, especially in urban and peri-urban regions, extend beyond the fire perimeter, as emissions from burning biomass release fine particulate matter (PM2.5), nitrogen oxides (NOx), carbon monoxide (CO), and volatile organic compounds (VOCs), many of which are precursors to ozone formation [4,5,6].
In January 2025, a series of rapidly spreading wildfires erupted across Southern California, fueled by unseasonably warm and dry offshore Santa Ana winds [7,8]. The most intense activity occurred in the greater Los Angeles region, where multiple fires including the Griffith Fire and San Bernardino blaze collectively scorched over 45,000 acres and forced the evacuation of tens of thousands of residents. These fires, striking during what is typically a low-risk season, not only challenged emergency responders but also triggered an abrupt and hazardous deterioration in urban air quality [8].
Numerous wildfire events in the US have demonstrated the severe degradation of air quality and associated health impacts on both local and regional populations. For example, the Camp Fire (2018) in Northern California, which destroyed the town of Paradise, led to daily PM2.5 concentrations in Sacramento and San Francisco that exceeded 200 µg/m³ which classified as “very unhealthy” to “hazardous” by the U.S. EPA [9]. The smoke plume extended over 1,500 km, affecting air quality in neighboring states [10]. Similarly, the Woolsey Fire (2018) in Southern California impacted the Los Angeles Basin, elevating levels of fine particulate matter and O3 in an already polluted urban environment [11]. In 2020, the August Complex Fire, the largest in California’s history, along with simultaneous fires in Oregon and Washington, resulted in the highest AQI values ever recorded in Portland, Seattle, and San Francisco, forcing widespread closures of schools, businesses, and transit systems [12].
Beyond the West Coast, smoke transport from western wildfires has repeatedly affected regions in the central and eastern U.S. In July 2021, wildfires in British Columbia and the Pacific Northwest produced smoke that blanketed the Midwest and Northeastern U.S., degrading visibility in New York City and increasing PM2.5 levels to over 50 µg/m³ which is well above the safe daily threshold [13]. During the same period, cities such as Chicago, Detroit, and Philadelphia issued air quality advisories, emphasizing the far-reaching impacts of wildfire emissions [14]. Moreover, the 2016 Great Smoky Mountains fires in Tennessee, which burned over 17,000 acres and led to 14 deaths, highlighted the growing wildfire risk in the eastern U.S., where vegetation and terrain differ substantially from the arid West but are increasingly susceptible under changing climate conditions [15].
Exposure to wildfire-related pollution has been robustly linked to increased hospital admissions for asthma, bronchitis, ischemic heart disease, and premature mortality, especially among children, the elderly, and individuals with pre-existing health conditions [16,17,18]. Furthermore, the economic burden of wildfire smoke such as lost productivity, elevated healthcare costs, and school disruptions can be regarded as direct damages of the fires themselves. Despite these severe implications, continuous and high-resolution monitoring of wildfire-induced air quality changes is essential particularly in urban centers like Los Angeles. Ground-based monitoring stations, though accurate, are spatially sparse and often cannot resolve the plume evolution or detect pollution over mountainous and rural fire-affected zones [19]. Satellite remote sensing thus provides a valuable supplement, offering wide-area, temporally frequent observations of atmospheric pollutants. Instruments such as Sentinel-5P/TROPOMI (for NO2, CO), MODIS and VIIRS (for Aerosol Optical Depth as a proxy for PM2.5), and GOES geostationary satellites (for fire detection and smoke tracking) are essential for quantifying pollution transport and intensity during wildfire episodes [20,21].
This study investigates the air quality impacts of the January 2025 Southern California wildfires, focusing specifically on the Los Angeles metropolitan area. Using multi-sensor satellite observations, we examine how key atmospheric pollutants i.e., PM (via aerosol optical depth), nitrogen dioxide (NO2), and carbon monoxide (CO)—varied temporally across three distinct phases of the wildfire: pre-fire, active fire, and post-fire periods. The primary objective of this research is to characterize the changes in urban air quality associated with the wildfire event and to identify the magnitude and temporal pattern of pollution anomalies. By tracking pollutant levels across these phases, this study contributes to a better understanding of the atmospheric consequences of urban-proximate wildfires and highlights the value of satellite-based remote sensing in evaluating air quality dynamics during extreme fire events.
2. Materials and Methods
2.1. Study Area and Event Description
This study aims to evaluate the temporal evolution of atmospheric pollutants—namely aerosol optical depth (AOD), carbon monoxide (CO), nitrogen dioxide (NO₂), and ozone (O₃)—before, during, and after the January 2025 Southern California wildfires, with a focus on the Los Angeles metropolitan area. These fires, driven by intense Santa Ana winds and anomalously dry winter conditions, resulted in the burning of over 45,000 acres between January 06 and January 30, 2025. To capture the full extent of air quality changes, the study period was divided into three phases: the pre-fire period (December 22, 2024–January 05, 2025), the active fire period (January 06–30), and the post-fire period (January 31–February 10). Research manuscripts reporting large datasets that are deposited in a publicly available database should specify where the data have been deposited and provide the relevant accession numbers. If the accession numbers have not yet been obtained at the time of submission, please state that they will be provided during review. They must be provided prior to publication.
2.2. Satellite Datasets
To assess these changes, we employed satellite-based remote sensing datasets that provide high-resolution, wide-area observations of atmospheric pollutants. AOD data were obtained from the Moderate Resolution Imaging Spectroradiometer (MODIS) instruments aboard both the Terra and Aqua satellites. Specifically, we used the MOD04_L2 and MYD04_L2 products, which provide Level 2 AOD retrievals at 550 nm with a spatial resolution of 10 km. These products are widely used as proxies for surface-level particulate matter (PM2.5) and allow for robust spatial and temporal comparisons of aerosol loading associated with wildfire smoke.
Tropospheric CO and NO₂ column densities were retrieved from the Tropospheric Monitoring Instrument (TROPOMI) onboard the Sentinel-5 Precursor satellite. The S5P_L2_CO product provides daily measurements of CO at a spatial resolution of approximately 7 km × 7 km, enabling the detection of elevated CO concentrations from biomass burning and subsequent transport. Similarly, the S5P_L2_NO2 product delivers tropospheric NO₂ vertical column densities at high resolution, suitable for capturing combustion-driven pollution and urban NOₓ enhancements. In addition, total column O3 concentrations were extracted from the S5P_L2_O3 product, offering insight into potential photochemical changes driven by wildfire-emitted precursors. While TROPOMI does not directly provide surface ozone, columnar anomalies can reflect regional-scale ozone perturbations during intense smoke episodes.
All satellite datasets were downloaded in NetCDF or HDF5 format and preprocessed using Python libraries such as xarray, numpy, and SatPy. Quality assurance flags provided within each product were applied to exclude retrievals with cloud contamination, low confidence scores, or sun glint interference. For uniformity, all variables were resampled onto a common 0.05° spatial grid covering Southern California. Daily mean values were computed for each pollutant, and composite maps were generated for each fire phase to evaluate spatial trends. Time series analyses were conducted to identify pollutant peaks and the lag in post-fire atmospheric recovery. Additionally, pollutant anomalies during the fire and post-fire phases were calculated relative to the pre-fire baseline to quantify the magnitude of change.
3. Results and Discussions
3.1. Descriptive Statistics of Air Pollutants
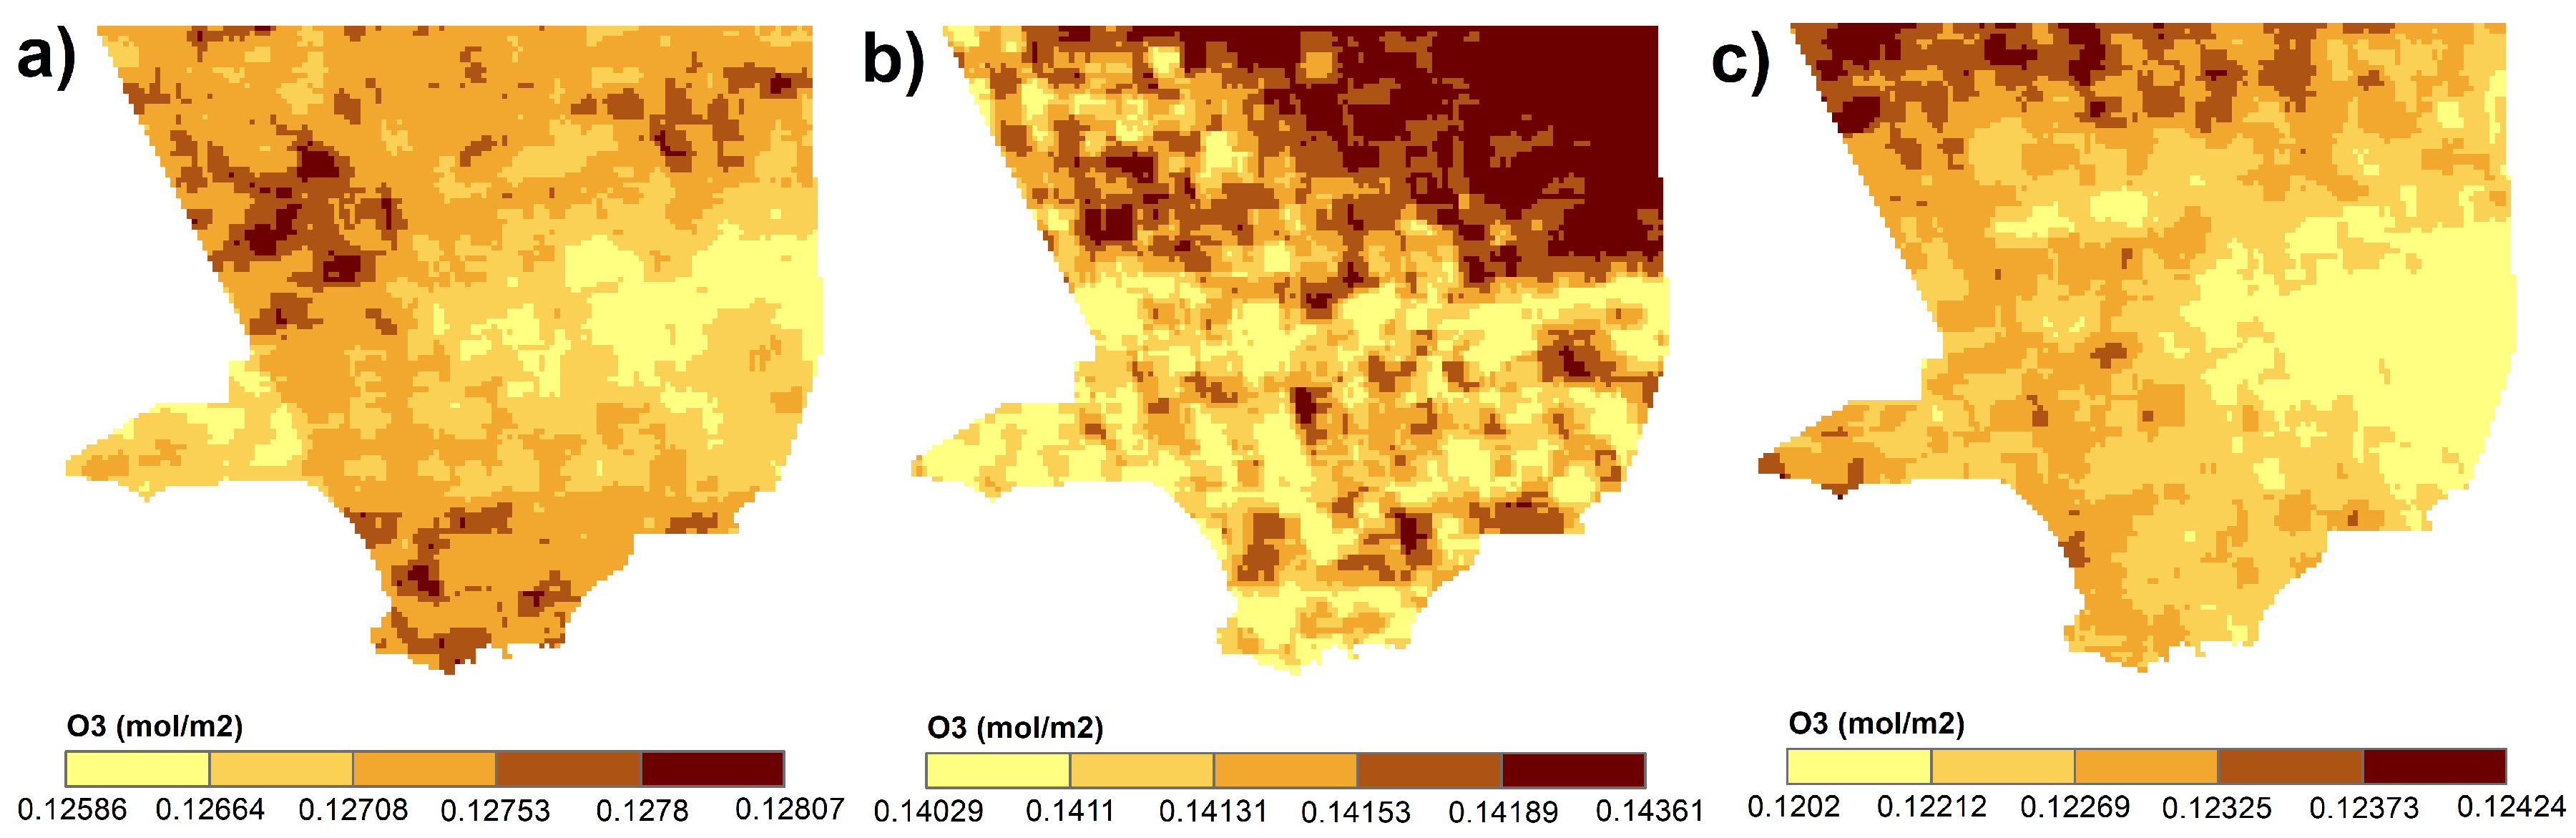
The analysis of satellite-derived air quality indicators reveals distinct temporal variations in pollutant concentrations across the three wildfire phases—pre-fire, active fire, and post-fire. For O₃, both the mean and maximum concentrations showed relatively stable values during the pre-fire period, with mean daily O₃ levels averaging around 0.121 mol/m² and maximum values around 0.128 mol/m². During the fire, a slight increase in mean O₃ was observed, rising to 0.126 mol/m², while post-fire values declined to pre-event levels (~0.123 mol/m²), indicating a transient enhancement.
Figure 1.
Spatial distribution of mean O₃ column concentrations (mol/m²) over the Los Angeles region during the three wildfire phases: (a) pre-fire (January 8–14, 2025), (b) active fire (January 15–24, 2025), and (c) post-fire (January 25–February 1, 2025).
Figure 1.
Spatial distribution of mean O₃ column concentrations (mol/m²) over the Los Angeles region during the three wildfire phases: (a) pre-fire (January 8–14, 2025), (b) active fire (January 15–24, 2025), and (c) post-fire (January 25–February 1, 2025).
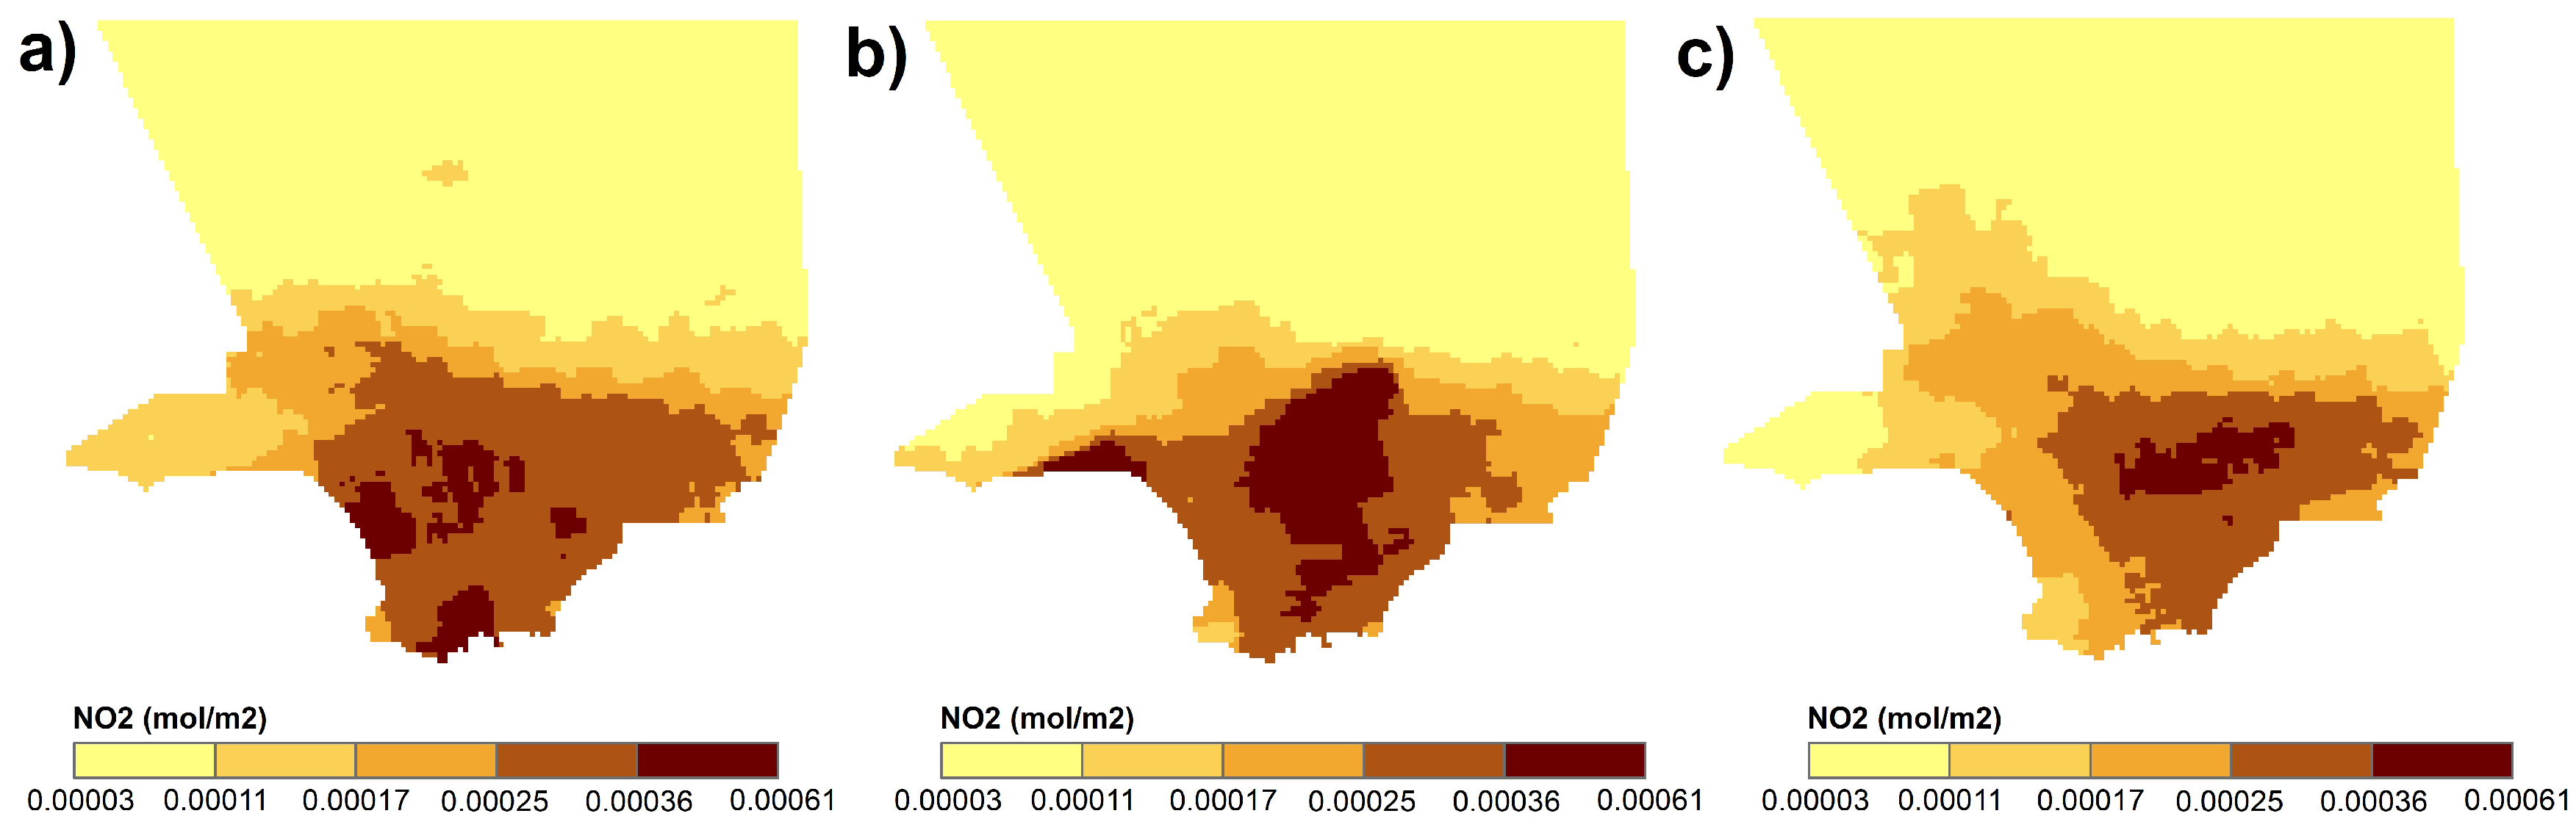
In contrast, NO₂ exhibited sharper variations. The mean NO₂ concentration prior to the fire was relatively low (mean: 0.00015 mol/m²), consistent with typical wintertime urban background levels. During the wildfire, NO₂ levels increased substantially, with average values rising to 0.00020 mol/m², likely due to the combustion of nitrogen-rich vegetation and interaction with urban emissions. The post-fire phase showed a partial recovery, with mean concentrations declining to 0.00017 mol/m², though not fully returning to baseline.
Figure 2.
Spatial distribution of mean NO2 column concentrations (mol/m²) over the Los Angeles region during the three wildfire phases: (a) pre-fire (b) active fire, and (c) post-fire.
Figure 2.
Spatial distribution of mean NO2 column concentrations (mol/m²) over the Los Angeles region during the three wildfire phases: (a) pre-fire (b) active fire, and (c) post-fire.
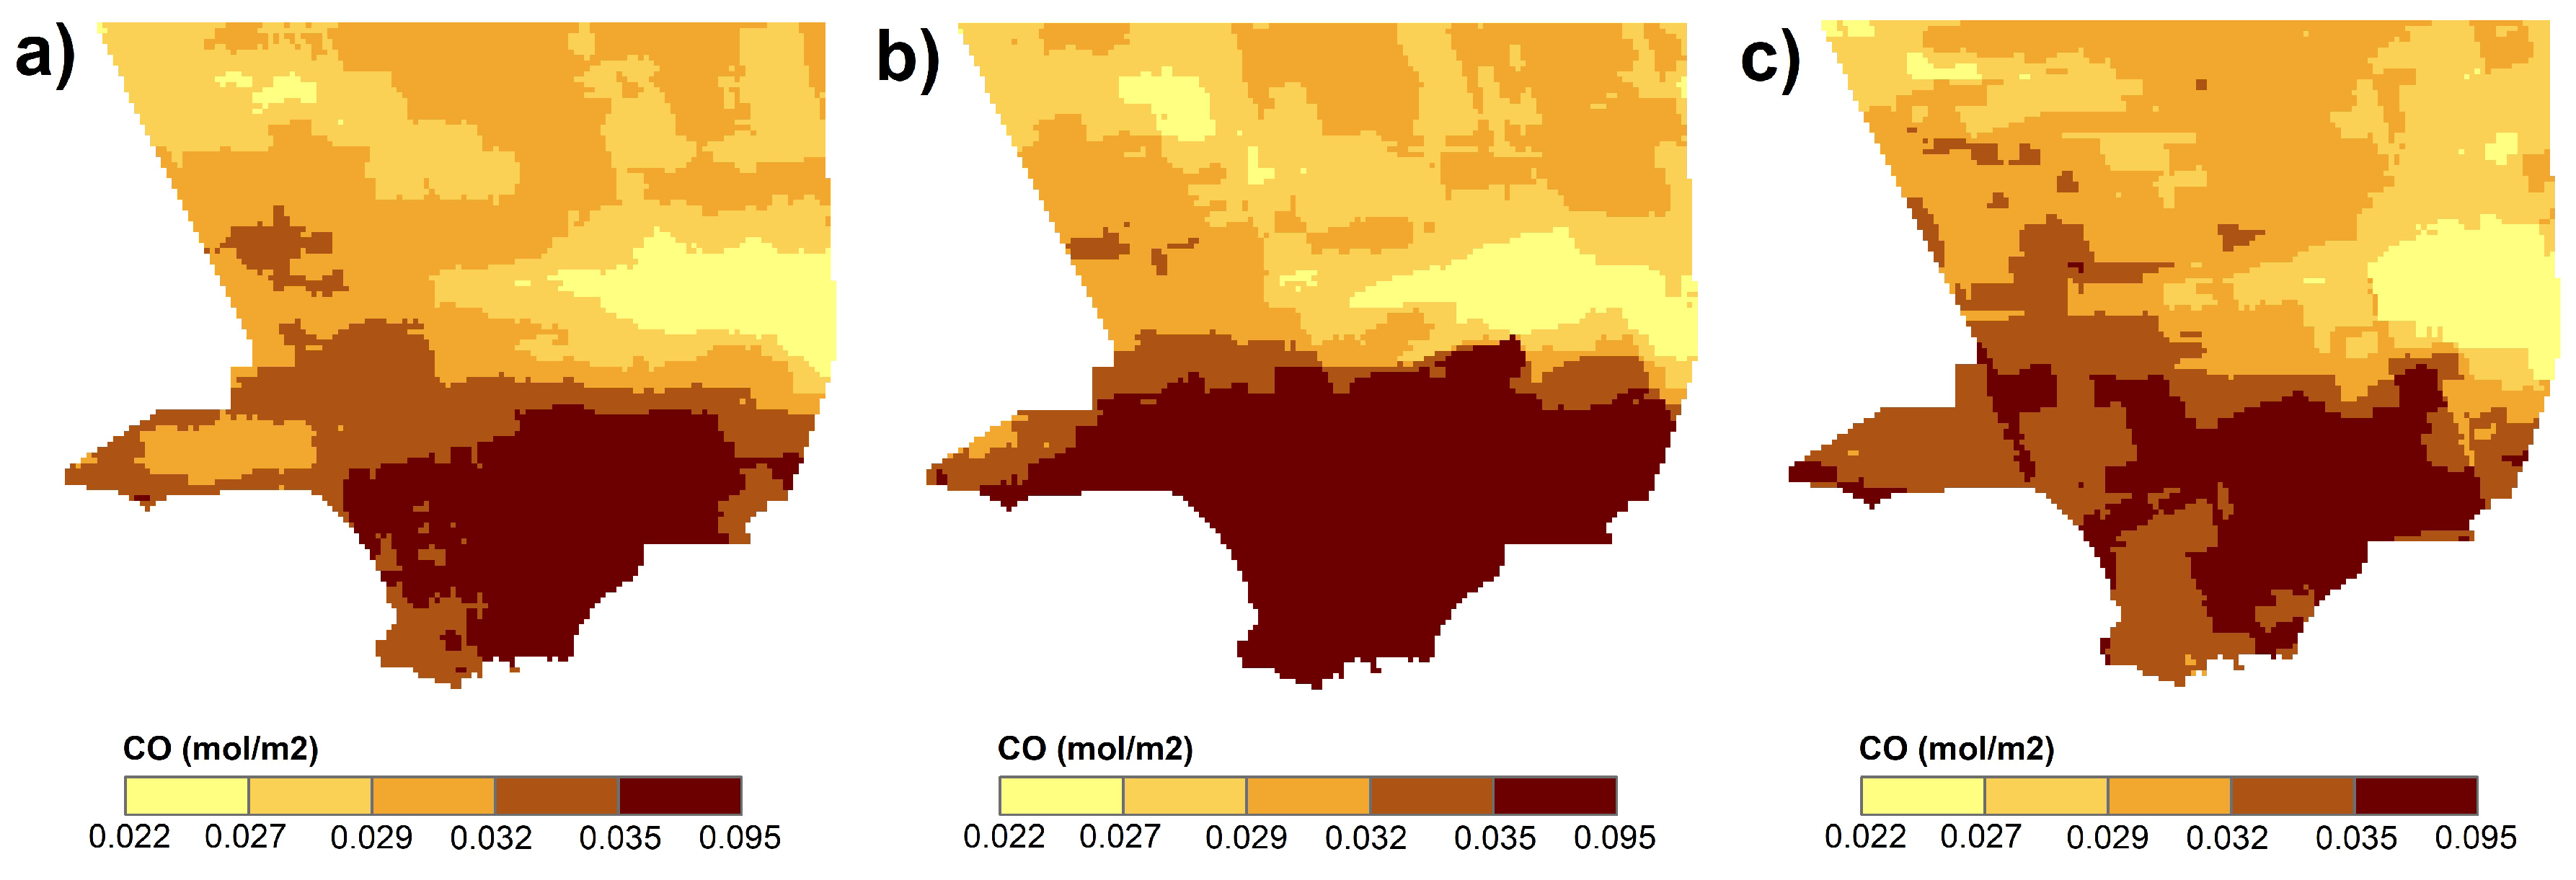
CO displayed the most pronounced fire-induced enhancement. Pre-fire CO concentrations averaged 0.035 mol/m², whereas during the active fire period, mean levels rose significantly to 0.040 mol/m², accompanied by a peak daily value of 0.147 mol/m², nearly 4× higher than pre-fire maxima. This dramatic increase aligns with CO’s known role as a primary emission product from incomplete biomass combustion. After the fire, CO levels declined but remained slightly elevated (mean: 0.033 mol/m²) compared to the baseline.
Figure 3.
Spatial distribution of mean CO column concentrations (mol/m²) over the Los Angeles region during the three wildfire phases: (a) pre-fire, (b) active fire, and (c) post-fire.
Figure 3.
Spatial distribution of mean CO column concentrations (mol/m²) over the Los Angeles region during the three wildfire phases: (a) pre-fire, (b) active fire, and (c) post-fire.
3.2. Change Analysis from Pre-Fire Baseline
Figure 4 and Table 1 illustrates the temporal evolution of mean concentrations of O₃, NO₂, and CO across the pre-fire, active fire, and post-fire phases of the January 2025 Southern California wildfires. Each pollutant exhibited distinct temporal behavior, reflecting differences in emission sources, atmospheric lifetimes, and chemical transformation pathways.
3.1. Ozone (O₃)
During the pre-fire phase, the average tropospheric O3 column concentration over the Los Angeles region was approximately 0.121 mol/m². This value increased to ~0.126 mol/m² during the active fire period, representing a ~4.1% increase compared to the pre-fire baseline. Following the fire, in the post-fire period, the average O3 concentration declined to ~0.123 mol/m², which is ~1.7% higher than pre-fire values, indicating a partial return toward baseline conditions.
This modest and short-lived enhancement of O3 can be attributed to its role as a secondary pollutant, formed through photochemical reactions involving wildfire-emitted precursors such as NOx and VOCs [22,23]. However, the formation of O3 was constrained by low solar intensity in winter, which limits the photolysis of NO2, a critical step in ozone formation. Furthermore, high concentrations of NO in fresh fire plumes likely led to ozone titration (NO + O3 → NO₂ + O₂), effectively suppressing ozone accumulation in areas of intense burning [24]. These factors explain the relatively weak O3 response, despite significant precursor emissions during the fire.
3.2. Nitrogen Dioxide (NO₂)
The mean NO₂ concentration during the pre-fire period was ~0.00015 mol/m². During the wildfire, this value rose sharply to ~0.00020 mol/m², indicating a ~33% increase. In the post-fire period, NO₂ declined to ~0.00017 mol/m², remaining ~13% above pre-fire levels.
The sharp rise in NO₂ reflects its role as a primary pollutant, directly emitted from combustion of nitrogen-containing biomass [25]. The temporal alignment of the NO₂ peak with the fire duration underscores the immediate atmospheric response to wildfire emissions. The partial persistence of elevated NO₂ post-fire may result from lingering pollution trapped near the surface under stable atmospheric conditions or slower vertical dispersion [25,26]. The disparity between the pronounced NO₂ rise and the moderate O₃ response emphasizes the chemically decoupled behavior of primary and secondary pollutants under wintertime wildfire conditions. While NO₂ reflects direct emissions, O₃ formation is chemically dependent on environmental factors that were suboptimal during this period [25,27].
3.3. Carbon Monoxide (CO)
CO exhibited the most substantial increase among the analyzed pollutants. From a pre-fire average of ~0.035 mol/m², CO concentrations increased to ~0.040 mol/m² during the fire, corresponding to a ~14% rise. The maximum daily concentration reached approximately 0.147 mol/m², which is over 320% higher than the pre-fire maximum. Post-fire CO values decreased to ~0.033 mol/m², slightly below the pre-fire mean but still within a range suggesting residual influence.
This high increase is due to CO’s emission as a major byproduct of incomplete combustion of carbon-rich vegetation and urban fuels [28]. Wildfires burning under oxygen-limited conditions release large quantities of CO. Additionally, CO’s long atmospheric lifetime (several weeks) enables it to persist and accumulate in the lower troposphere, especially during winter, when oxidative removal via hydroxyl radicals (OH) is slower due to weaker photochemistry [28,29]. The pronounced and sustained CO enhancement illustrates the efficiency of wildfires in injecting long-lived, health-relevant pollutants into the atmosphere. It also reinforces the importance of CO as a robust tracer for wildfire smoke transport and combustion intensity in satellite-based air quality assessments.
3.3. Aerosol Optical Depth
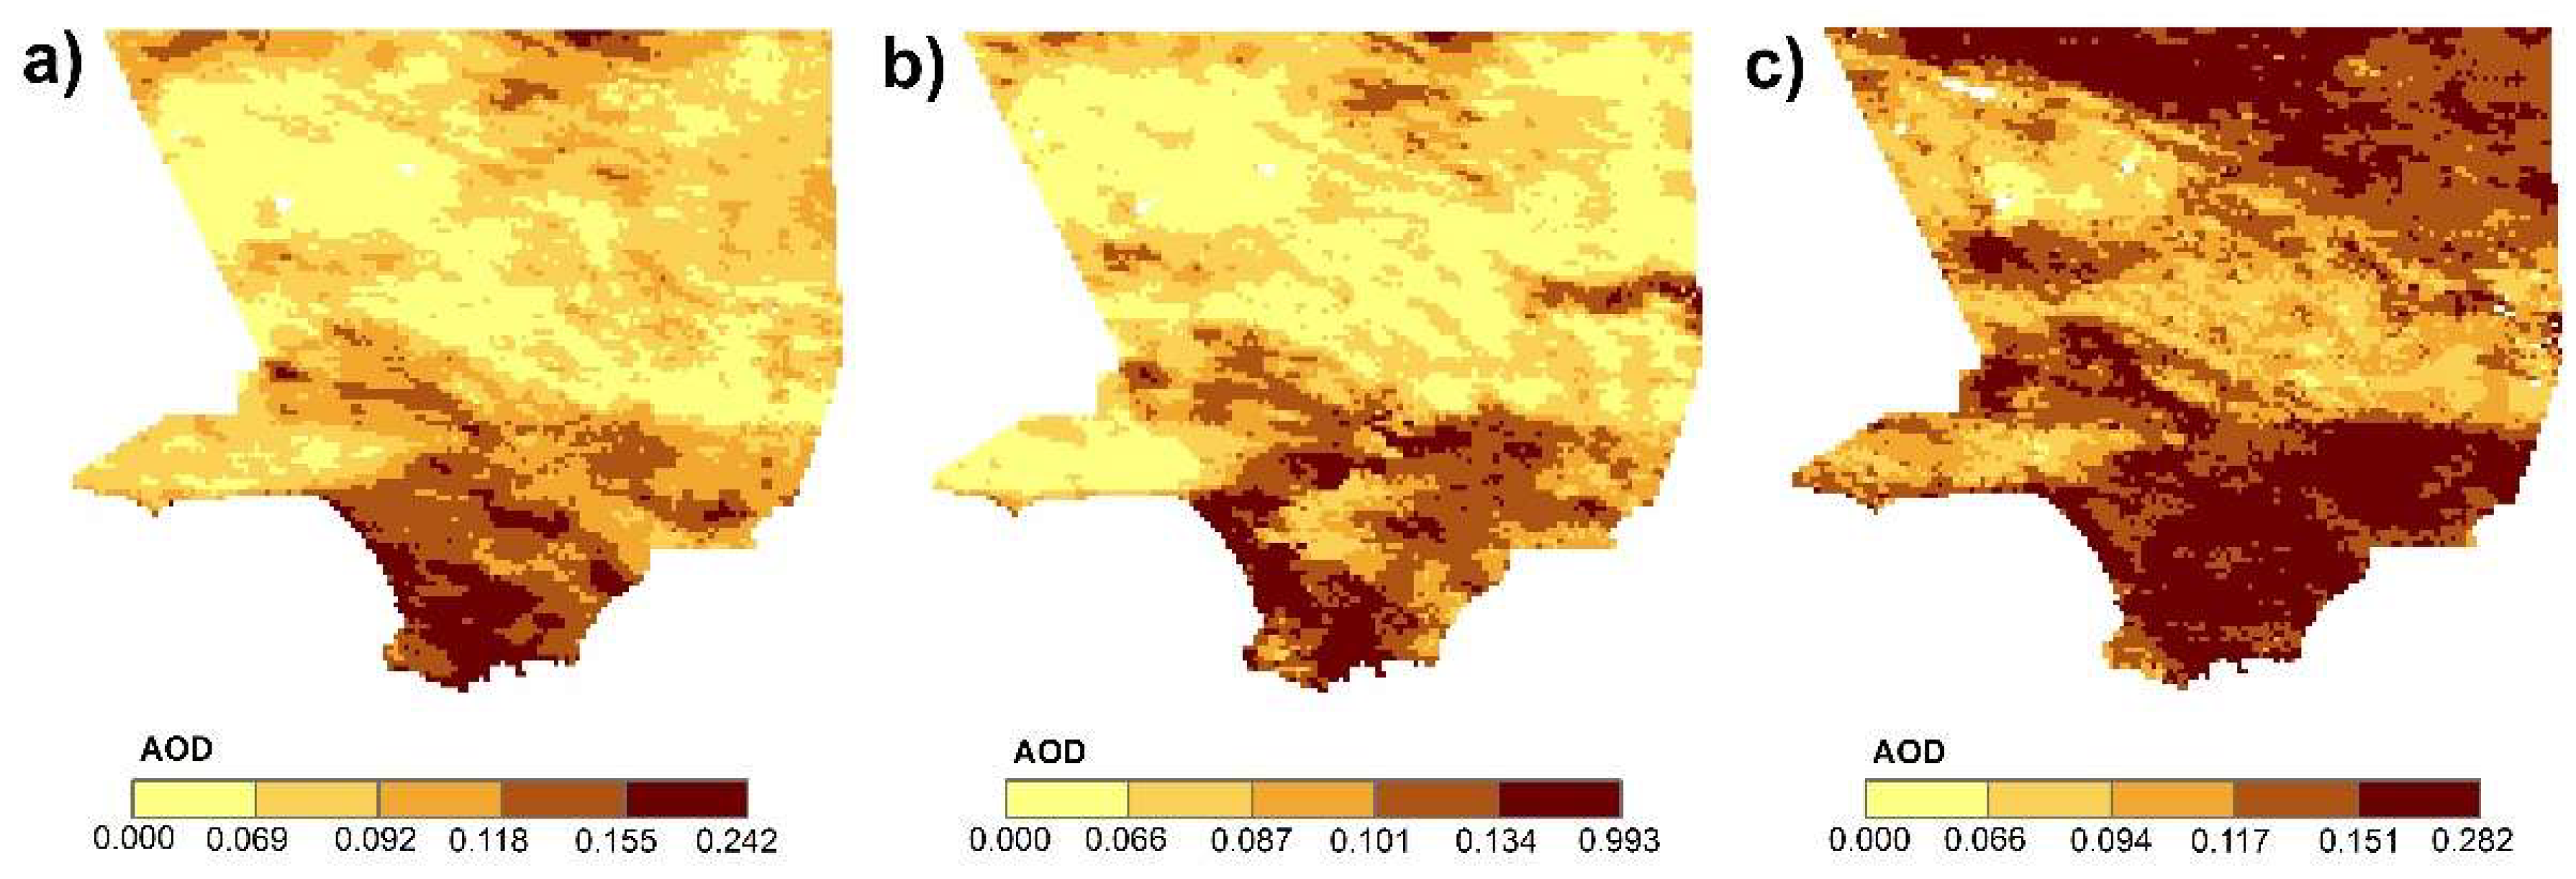
During the pre-fire phase, the average AOD over the Los Angeles metropolitan region was approximately 0.143, reflecting typical wintertime background aerosol levels under relatively stable meteorological conditions. However, during the active fire period, the mean AOD increased sharply to 0.184, representing a 28.6% enhancement relative to the baseline. This substantial increase corresponds with the massive injection of smoke and fine particulate matter into the troposphere due to intense biomass burning. Wildfires emit large quantities of primary carbonaceous aerosols (e.g., black carbon and organic carbon) and ash particles, which significantly increase atmospheric optical depth [30,31].
Post-fire AOD values averaged 0.163, remaining 14.0% higher than the pre-fire baseline. The persistence of elevated AOD after the fire can be attributed to several factors: (i) slow dispersion of smoke plumes under weak synoptic wind conditions typical of Southern California winters; (ii) and possible long-range transport of aerosols from nearby active fire zones or regional recirculation patterns [32,33]. Moreover, wintertime boundary layer inversions frequently trap pollutants near the surface, exacerbating local aerosol retention [34].
Figure 5.
Spatial distribution of mean AOD over the Los Angeles region during the three wildfire phases: (a) pre-fire (b) active fire and (c) post-fire.
Figure 5.
Spatial distribution of mean AOD over the Los Angeles region during the three wildfire phases: (a) pre-fire (b) active fire and (c) post-fire.
5. Conclusions
This study assessed the impact of the January 2025 Southern California wildfires on urban air quality over the Los Angeles region using satellite-derived observations of O₃, NO₂, and CO. By analyzing temporal trends and spatial distributions across the pre-fire, during-fire, and post-fire phases, we were able to characterize the pollutant-specific responses to wildfire activity and identify their underlying atmospheric drivers.
The results revealed that CO and NO₂ experienced strong and immediate increases during the active fire period due to their direct emission from biomass combustion. CO concentrations rose by over 14% on average and peaked at values more than 300% above pre-fire levels, while NO₂ increased by approximately 33%, reflecting intense nitrogen emissions from the fire. In contrast, O₃ exhibited a relatively modest increase of ~4%, constrained by wintertime photochemical conditions and likely suppressed further by titration with freshly emitted NO.
Post-fire analysis indicated that while NO₂ and CO gradually declined after the fire, CO exhibited a longer persistence, consistent with its longer atmospheric lifetime and slower removal mechanisms. O₃ returned to near baseline levels, reinforcing its dependence on solar-driven chemistry and secondary formation dynamics.
These findings highlight the value of satellite remote sensing for wildfire air quality monitoring, particularly in data-sparse or rapidly evolving fire scenarios. The differentiated pollutant responses underscore the importance of accounting for both primary and secondary atmospheric processes when assessing the health and environmental consequences of wildfires. This study contributes to ongoing efforts to understand and mitigate wildfire-induced pollution in urban regions under changing climate and land-use conditions.
Author Contributions
Conceptualization, A.C.D.; S.A.S.; and I.K.; methodology, A.C.D.; S.A.J.; S.A.S and I.K.; software, A.C.D.; and S.A.J.; validation, S.A.S.; and I.K.; formal analysis, A.C.D.; and S.A.J.; investigation, S.A.S.; and I.K.; resources, I.K.; data curation, S.A.S; writing—original draft preparation, A.C.D.; and S.A.S.; writing—review and editing, S.A.S.; and I.K.; visualization, A.C.D.; and S.A.J.; supervision, I.K.; project administration, I.K.; All authors have read and agreed to the published version of the manuscript.
Funding
This research received no external funding
Data Availability Statement
Data is available upon request
Use of Artificial Intelligence: During the preparation of this manuscript, the authors used AI-assisted tools, for the purposes of language editing and grammar refinement. The tool was not used to generate original research content, data interpretation, or scientific conclusions. All AI-generated output was reviewed, edited, and approved by the authors to ensure accuracy and alignment with the study objectives.
Conflicts of Interest
The authors declare no conflicts of interest
Abbreviations
| AOD | Aerosol Optical Depth |
| CO | Carbon Monoxide |
| NO2 | Nitrogen Dioxide |
| O3 | Ozone |
| MODIS | Moderate Resolution Imaging Spectroradiometer |
| TROPOMI | Tropospheric Monitoring Instrument |
| S5P | Sentinel-5 Precursor |
| WUI | Wildland–Urban Interface |
| EPA | Environmental Protection Agency |
| VOC | Volatile Organic Compound |
References
- Nielsen-Pincus, M.; Moseley, C.; Gebert, K. Job growth and loss across sectors and time in the western US: The impact of large wildfires. For. Pol. Econ. 2014, 38, 199–206.
- Burke, M.; Driscoll, A.; Heft-Neal, S.; Xue, J.; Burney, J.; Wara, M. The changing risk and burden of wildfire in the United States. Proc. Natl. Acad. Sci. USA 2021, 118, e2011048118.
- Mendoza, D.L.; Crosman, E.T.; Benney, T.M.; Anderson, C.; Gonzales, S.A. A Preliminary Case Study on the Compounding Effects of Local Emissions and Upstream Wildfires on Urban Air Pollution. Fire 2024, 7, 184.
- Liu, J.C.; Mickley, L.J.; Sulprizio, M.P.; Dominici, F.; Yue, X.; Ebisu, K.; Anderson, G.B.; Khan, R.F.; Bravo, M.A.; Bell, M.L. Particulate air pollution from wildfires in the Western US under climate change. Clim. Change 2016, 138, 655–666.
- Chen, G.; Guo, Y.; Yue, X.; Xu, R.; Yu, W.; Ye, T.; Tong, S.; Gasparrini, A.; Bell, M.L.; Armstrong, B.; et al. All-cause, cardiovascular, and respiratory mortality and wildfire-related ozone: A multicountry two-stage time series analysis. Lancet Planet. Health 2024, 8, e452–e462.
- Shahriar, S.A.; Choi, Y.; Islam, R. Advanced Deep Learning Approaches for Forecasting High-Resolution Fire Weather Index (FWI) over CONUS: Integration of GNN-LSTM, GNN-TCNN, and GNN-DeepAR. Remote Sens. 2025, 17(3), 515.
- Qiu, M.; Chen, D.; Kelp, M.; Li, J.; Huang, G.; Yazdi, M.D., 2025. The rising threats of wildland-urban interface fires in the era of climate change: The Los Angeles 2025 fires. The Innovation 2025, 100835. [CrossRef]
- Schollaert, C.; Connolly, R.; Cushing, L.; Jerrett, M.; Liu, T.; Marlier, M. Air quality impacts of the January 2025 Los Angeles wildfires: Insights from public data sources. EarthArXiv 2025. [CrossRef]
- Rooney, B.; Wang, Y.; Jiang, J.H.; Zhao, B.; Zeng, Z.C.; Seinfeld, J.H. Air quality impact of the Northern California Camp Fire of November 2018. Atmos. Chem. Phys. 2020, 20, 14597–14616.
- Chow, F.K.; Yu, K.A.; Young, A.; James, E.; Grell, G.A.; Csiszar, I.; Tsidulko, M.; Freitas, S.; Pereira, G.; Giglio, L.; Friberg, M.D. High-resolution smoke forecasting for the 2018 Camp Fire in California. Bull. Am. Meteorol. Soc. 2022, 103, E1531–E1552.
- Kaltofen, M.; Gundersen, M.; Gundersen, A. Radioactive microparticles related to the Woolsey Fire in Simi Valley, CA. J. Environ. Radioact. 2021, 240, 106755.
- Masri, S.; Jin, Y.; Wu, J. Compound risk of air pollution and heat days and the influence of wildfire by SES across California, 2018–2020: implications for environmental justice in the context of climate change. Climate 2022, 10, 145.
- Shrestha, B.; Brotzge, J.A.; Wang, J. Observations and impacts of long-range transported wildfire smoke on air quality across New York State during July 2021. Geophys. Res. Lett. 2022, 49, e2022GL100216.
- Hung, W.T.; Lu, C.H.S.; Alessandrini, S.; Kumar, R.; Lin, C.A. The impacts of transported wildfire smoke aerosols on surface air quality in New York State: a multi-year study using machine learning. Atmos. Environ. 2021, 259, 118513.
- Duncan, S.; Reed, C.; Spurlock, T.; Sugg, M.M.; Runkle, J.D. Acute health effects of wildfire smoke exposure during a compound event: a case-crossover study of the 2016 Great Smoky Mountain wildfires. GeoHealth 2023, 7, e2023GH000860.
- Ye, T.; Xu, R.; Yue, X.; Chen, G.; Yu, P.; Coêlho, M.S.; Saldiva, P.H.; Abramson, M.J.; Guo, Y.; Li, S. Short-term exposure to wildfire-related PM₂.₅ increases mortality risks and burdens in Brazil. Nat. Commun. 2022, 13, 7651.
- Heft-Neal, S.; Driscoll, A.; Yang, W.; Shaw, G.; Burke, M. Associations between wildfire smoke exposure during pregnancy and risk of preterm birth in California. Environ. Res. 2022, 203, 111872.
- Chen, G.; Guo, Y.; Yue, X.; Xu, R.; Yu, W.; Ye, T.; Tong, S.; Gasparrini, A.; Bell, M.L.; Armstrong, B.; et al. All-cause, cardiovascular, and respiratory mortality and wildfire-related ozone: A multicountry two-stage time series analysis. Lancet Planet. Health 2024, 8, e452–e462.
- Verma, S.; Gangwar, T.; Singh, J.; Prakash, D.; Payra, S. Urban air quality monitoring and modelling using ground monitoring, remote sensing, and GIS. In Geospatial Analytics for Environmental Pollution Modeling: Analysis, Control and Management; Springer Nature Switzerland: Cham, 2023; pp. 213–247.
- Lassman, W.; Mirocha, J.D.; Arthur, R.S.; Kochanski, A.K.; Farguell Caus, A.; Bagley, A.M.; Carreras Sospedra, M.; Dabdub, D.; Barbato, M. Using satellite-derived fire arrival times for coupled wildfire-air quality simulations at regional scales of the 2020 California wildfire season. J. Geophys. Res. Atmos. 2023, 128, e2022JD037062.
- Xue, Z.; Gupta, P.; Christopher, S. Satellite-based estimation of the impacts of summertime wildfires on PM₂.₅ concentration in the United States. Atmos. Chem. Phys. 2021, 21, 11243–11256.
- Wada, R.; Yonemura, S.; Tani, A.; Kajino, M. Exchanges of O₃, NO, and NO₂ between forest ecosystems and the atmosphere. J. Agric. Meteorol. 2023, 79, 38–48.
- Wang, B.; Geddes, J.A.; Adams, T.J.; Lind, E.S.; McDonald, B.C.; He, J.; Harkins, C.; Li, D.; Pfister, G.G. Implications of sea breezes on air quality monitoring in a coastal urban environment: Evidence from high resolution modeling of NO₂ and O₃. J. Geophys. Res. Atmos. 2023, 128, e2022JD037860.
- Shi, K.; Mei, X.; Chen, C.R.; Liu, C. Impact of atmospheric O₃ and NO₂ on the secondary sulfates in real atmosphere. J. Environ. Sci. 2025, 150, 277–287.
- Wang, Y.; Faloona, I.C.; Houlton, B.Z. Satellite NO₂ trends reveal pervasive impacts of wildfire and soil emissions across California landscapes. Environ. Res. Lett. 2023, 18, 094032.
- Dang, R.; Jacob, D.J.; Shah, V.; Eastham, S.D.; Fritz, T.M.; Mickley, L.J.; Liu, T.; Wang, Y.; Wang, J. Background nitrogen dioxide (NO₂) over the United States and its implications for satellite observations and trends: effects of nitrate photolysis, aircraft, and open fires. Atmos. Chem. Phys. 2023, 23, 6271–6284.
- Schneider, S.R.; Lee, K.; Santos, G.; Abbatt, J.P. Air quality data approach for defining wildfire influence: Impacts on PM₂.₅, NO₂, CO, and O₃ in Western Canadian cities. Environ. Sci. Technol. 2021, 55, 13709–13717.
- Jaffe, D.A.; Schnieder, B.; Inouye, D. Use of PM₂.₅ to CO ratio as an indicator of wildfire smoke in urban areas. Atmos. Chem. Phys. 2022, 22, 12695–12704.
- Palm, B.B.; Peng, Q.; Hall, S.R.; Ullmann, K.; Campos, T.L.; Weinheimer, A.; Montzka, D.; Tyndall, G.; Permar, W.; Hu, L.; Flocke, F. Spatially resolved photochemistry impacts emissions estimates in fresh wildfire plumes. Geophys. Res. Lett. 2021, 48, e2021GL095443.
- Ye, X.; Deshler, M.; Lyapustin, A.; Wang, Y.; Kondragunta, S.; Saide, P. Assessment of satellite AOD during the 2020 wildfire season in the western US. Remote Sens. 2022, 14, 6113.
- Filonchyk, M.; Peterson, M.P.; Sun, D. Deterioration of air quality associated with the 2020 US wildfires. Sci. Total Environ. 2022, 826, 154103.
- Junghenn Noyes, K.T.; Kahn, R.A.; Limbacher, J.A.; Li, Z. Canadian and Alaskan wildfire smoke particle properties, their evolution, and controlling factors, from satellite observations. Atmos. Chem. Phys. Discuss. 2021, 2021, 1–34.
- Magzamen, S.; Gan, R.W.; Liu, J.; O’Dell, K.; Ford, B.; Berg, K.; Bol, K.; Wilson, A.; Fischer, E.V.; Pierce, J.R. Differential cardiopulmonary health impacts of local and long-range transport of wildfire smoke. GeoHealth 2021, 5, e2020GH000330.
- Ramsey, E.; Monahan, A.H. Empirical low-dimensional dynamics of atmospheric stable boundary layer temperature inversions. J. Atmos. Sci. 2022, 79, 1965–1984.
Figure 4.
Temporal variation of mean column concentrations of ozone (O₃), nitrogen dioxide (NO₂), and carbon monoxide (CO) over the Los Angeles region from December 22, 2024 to February 8, 2025, encompassing the pre-fire, during-fire, and post-fire phases of the January 2025 Southern California wildfires. Each line segment is colored according to the wildfire phase: red for pre-fire, blue for active fire, and green for post-fire.
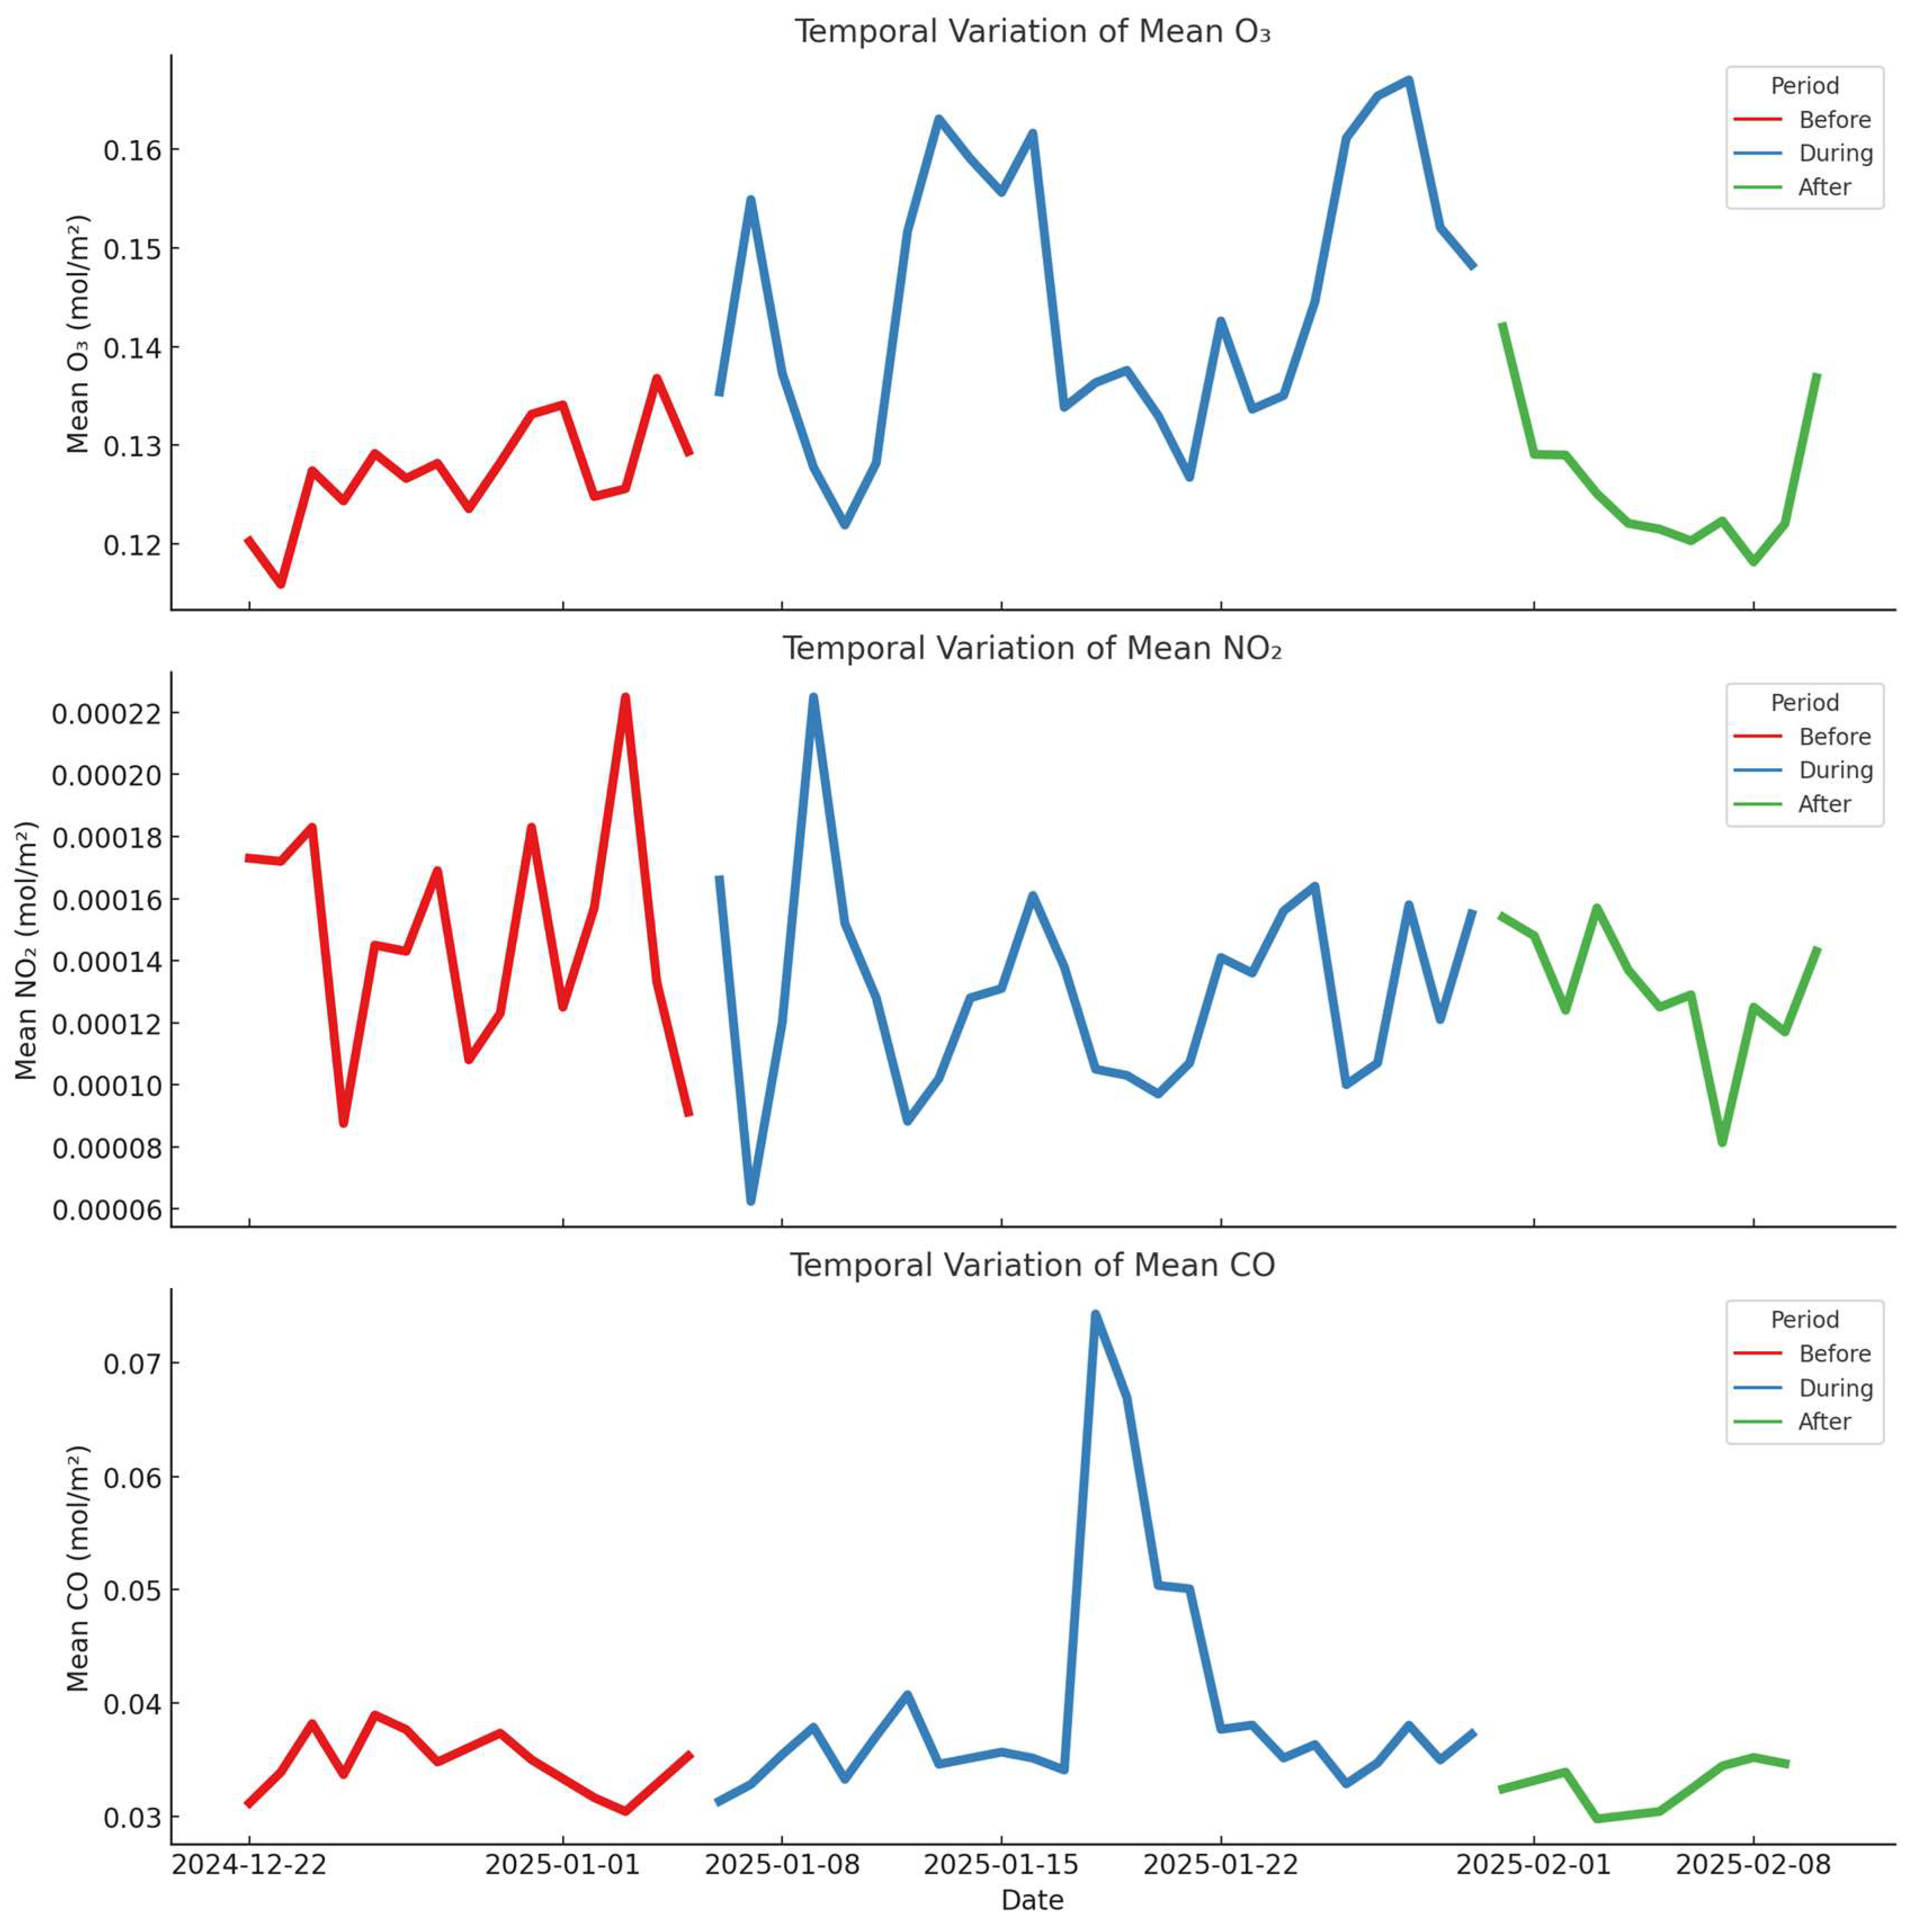

Table 1.
Summary of mean tropospheric column concentrations (mol/m²) of O₃, NO₂, and CO during the pre-fire, active fire, and post-fire phases of the January 2025 Southern California wildfires. Percentage changes relative to the pre-fire baseline highlight the distinct atmospheric responses of each pollutant to wildfire emissions and subsequent atmospheric processing.
| Pollutant | Pre-Fire Avg | During-Fire Avg | Post-Fire Avg | % Change (During vs. Pre) | % Change (Post vs. Pre) |
| O₃ (mol/m²) | 0.121 | 0.126 | 0.123 | 4.1 | 1.7 |
| NO₂ (mol/m²) | 0.00015 | 0.0002 | 0.00017 | 33 | 13 |
| CO (mol/m²) | 0.035 | 0.04 | 0.033 | 14 | -5.7 |
| AOD | 0.143 | 0.184 | 0.163 | 28.6 | 14 |
Disclaimer/Publisher’s Note: The statements, opinions and data contained in all publications are solely those of the individual author(s) and contributor(s) and not of MDPI and/or the editor(s). MDPI and/or the editor(s) disclaim responsibility for any injury to people or property resulting from any ideas, methods, instructions or products referred to in the content. |
© 2025 by the authors. Licensee MDPI, Basel, Switzerland. This article is an open access article distributed under the terms and conditions of the Creative Commons Attribution (CC BY) license (http://creativecommons.org/licenses/by/4.0/).
Copyright: This open access article is published under a Creative Commons CC BY 4.0 license, which permit the free download, distribution, and reuse, provided that the author and preprint are cited in any reuse.


