
Submitted:
12 February 2026
Posted:
14 February 2026
You are already at the latest version
Abstract
Longevity is a key determinant of economic efficiency and sustainability in dairy cattle production. The study evaluated longevity and lifetime productivity traits in Red breed (RB) and Holstein breed (HB) dairy cows in Latvia and assessed the effects of birth year, age at first calving (AFC), and farm size. Data from 279,818 culled and living cows born between 2010 and 2019 were analyzed. The aim of the study was to investigate biological and farm-level factors affecting dairy cow longevity in RB and HB populations. RB and HB cows born between 2010 and 2013 had significantly longer (p< 0.05) total lifespan (LS) and productive life (PL) than cows born in later years; however, they showed lower life day (MPD) and productive life day (MPPD) milk productivity. AFC significantly affected MPD and MPPD. The highest life-day productivity in RB cows was observed at AFC of 22.1 – 24 months, while in HB cows it was observed at < 24 months. Significantly longer LS and PL were recorded on farms with fewer than 20 cows, whereas the highest MPD was observed on farms with 101 – 500 cows in RB breed and 101 – 200 cows in HB.
Keywords:
dairy cow
; longevity
; productive life
; milk productivity
; ECM
; age at first calving
; farm size
1. Introduction
Longevity of dairy cows has become an increasingly important trait in modern dairy production systems, where primary objective is to obtain high milk yields from individual animals while maintaining them in the herd for as long as possible. Improving longevity is closely linked to economic efficiency, animal welfare, and sustainability of dairy farming [1,2]. A longer productive life allows farms to reduce replacement rates and distribute rearing costs over a greater amount of milk produced [3,4,5]. Consequently, dairy cow longevity is now recognized as a complex trait that reflects the interaction between biological potential, management practices and environmental conditions [6].
To comprehensively evaluate longevity, it is necessary to consider distinct phases of a cow’s life, including the rearing period of heifers, the productive phase and eventual culling along with its underlying reasons. Longevity is commonly described using two main indicators – total lifespan (LS) and length of productive life (PL). While LS provides information on overall survival, PL more accurately reflects the economically productive portion of a cow’s life, as it excludes the non-productive rearing period. Both measures are complementary and are required to fully assess longevity performance in dairy herds [7]. However, longevity alone does not adequately describe the efficiency of dairy production. Because productivity levels vary considerably between breeds, production systems, and farms, indicators that combine longevity with milk productivity are commonly used [8].
Extending dairy cow lifespan offers a clear economic advantage, primarily by reducing the costs associated with rearing replacement heifers. Rearing represents a substantial investment, and farms generally begin to recover these costs only after cows reach their second or third lactation [9,10,11]. Therefore, premature culling often prevents full recovery of initial investments and negatively affects farm profitability [12]. On the other hand, prolonged lifespan may slow genetic progress, as longer generation intervals reduce the rate at which genetic improvements are introduced into the herd [13,14].
Longevity in dairy cattle is influenced by a wide range of factors. Genetic potential plays a fundamental role, as breeds and individual animals differ in their capacity for production, health resilience, and functional conformation [15,16,17]. Health status, particularly the occurrence of metabolic disorders, mastitis, and reproductive problems, is a major determinant of culling risk [18,19]. And environmental factors, including housing conditions, feeding strategies, rearing practices, and season of calving, further contribute to variation in longevity outcomes [20,21]. In addition, management decisions such as voluntary culling policies, replacement availability, and reproductive management strongly affect the length of cows’ lives [22,23,24].
Early life performance is especially important in shaping cows’ future longevity. Traits expressed at the beginning of cows’ productive life have been shown to be closely associated with later survival, productivity, and culling risks [25,26,27]. Age at first calving is a particularly important factor, as it determines the length of the non-productive rearing period and directly influences later life productivity [28,29]. Both excessively early and delayed first calving have been associated with increased culling risk and reduced productive life [30,31]. An optimal age at first calving allows heifers to reach sufficient physiological maturity for calving and lactation while minimizing rearing costs and supporting long-term health and performance. However, the optimal age at first calving is not universal and varies depending on breed, production system, feeding intensity, and management conditions [26].
In addition to individual animal characteristics, herd level factors play a significant role in shaping longevity outcomes. Farm size in particular is associated with differences in management intensity, labor organization, housing systems, feeding strategies, and access to technology [32]. Larger farms often benefit from advanced monitoring systems that allow early detection of health and reproductive disorders, automated data collection, and rapid management responses [17]. Conversely, smaller farms may provide more individualized animal care and closes daily observation, which can positively influence cow welfare and longevity. However, limited financial resources on small farms may restrict investments in housing modernization and feeding optimization [33]. Research indicates that culling risk exists across all farm sizes, but the underlying reasons for culling may differ [34]. The housing system also can influence dairy cow longevity, as proven in our previous research, cows in loose housing system are culled from herds earlier than in tied stall housing, but they characterized with higher lifetime milk productivity [32].
This study aimed to investigate the influence of biological and herd-level factors on longevity in RB and HB dairy cattle and to provide reference data for improving dairy herd management.
2. Materials and Methods
2.1. Data Collection
Data were obtained from the national database of the Rural Support Service of the Republic of Latvia. In the database were included cows under official performance recording that were born between 2010 and 2019. The dataset comprised a total 68,296 cows belonging to red breeds (RB), namely Latvian Brown, German Red, Danish Red, Swedish Red-and-White, and Ayrshire, and 211,522 Holstein breed (HB) cows, including Black-and-White and Red-and-White Holstein types. In total 279,818 culled and alive RB and HB dairy cows. The analyzed population included all culled cows and cows that were still in production as of 01.01.2023.
The number of culled and alive cows in each breed group is given in Figure 1.
Cows were kept in 7,599 different farms, from which majority were mixed herds with RB and HB cows, under various feeding and housing conditions.
2.2. Longevity Traits
To characterize longevity of analyzed dairy cows were used dairy cow lifespan characteristics – total lifespan (LS) and length of productive life (PL). For the evaluation of dairy cow productive performance were used energy corrected milk (ECM) and calculated total lifetime ECM productivity (MP), life day (MPD) and productive life day (MPPD) milk productivity. The calculation principles of different dairy cow longevity traits are shown in Table 1.
The LS and PL in tables and figures are represented in days, but MP, MPD and MPPD as kg, ECM.
2.3. Analyzed Factors
For RB and HB dairy cows 3 factors were identified as risk factors (Birth year, AFC, months and farm size) for cow culling and selected for analysis and for the study purposes cows were distributed in several groups depending on studied trait (Table 2).
Cows were distributed in 3 groups depending on their year of birth, 7 groups depending on age at first calving (AFC), and 5 groups depending on the number of animals per farm. Factor “Farm size” is represented as total number of registered dairy cows in specific farm per year. Only RB and HB dairy cows were included in longevity evaluations in specific dairy farms.
2.4. Statistical Analysis
Analysis of variance was used to estimate the longevity traits of culled cows (Table 1) depending on defined factors (Table 2). The Bonferroni test was used for multiple comparisons. The significance level was alpha = 0.05.
Length of productive life – the number of days from first calving until culling or censoring was evaluated by survival analysis. Survival analysis is particularly suitable for longevity studies because it allows the inclusion of two type data, uncensored (culled cows) and censored (alive cows) data, considers time-dependent environmental influences, and addresses the non-normal distribution of longevity traits [35]. Survival analysis was performed to estimate the factors associated with the productive lifetime survival of cows. Kaplan–Meier survival probability curves were plotted for HB and RB culling and alive cows depending on the cow’s birth year, AFC, and farm size.
The log-rank test was used to assess differences in survival rates across risk factors: birth year, AFC, and farm size groups.
3. Results
3.1. The Longevity Characteristics for RB and HB Cows
The length of LS and PL differed significantly (p<0.05) between breed groups within both culled and alive dairy cows (Table 3). For culled cows, RB cows had a longer LS (2,022.2±3.24) and length of PL (1,190.2±3.23) than HB dairy cows.
A similar pattern was observed among cows that were still producing. Alive RB cows showed longer LS and PL (accordingly 2,022.2±3.24 and 1,190.2±3.23 days) compared with alive HB cows, whose LS and PL were 1,871.4±2.69 and 1,064.0±2.64 days, respectively. Within each breed, cows that were still producing had longer LS and PL than culled cows.
MPD and MPPD differed significantly between breed groups (p<0.05) in culled and alive cow groups (Table 4). In the culled cow group, HB cows showed higher MPD and MPPD (11.5±0.01 and 23.4±0.02 kg ECM), while culled RB cows had 10.0±0.02 kg ECM in MPD and 19.0±0.02 kg ECM in MPPD.
The same trend was observed in cows that were alive and still in production. HB cows had higher MDP and MPPD (12.6±0.02 and 24.1±0.03 kg ECM accordingly). Within each group, cows that were still in production exhibited slightly higher MPD values than culled cows, while MPPD was by 0.1 kg ECM lower in RB group.
The distribution of PL differed between RB and HB cow groups. Both breeds exhibited positively skewed distributions, however HB cows showed substantially higher frequencies across the entire range of PL lengths (Figure 2).
In HB cows, the distribution was more strongly concentrated at shorter PL, with a higher and earlier peak occurring at approximately 500 – 1,200 days compared with RB cows. RB cows displayed a broader distribution with relatively higher frequencies at longer PL durations. Although both breed groups showed a long right-hand tail, the decline in frequency with increasing PL was steeper in HB cows, whereas RB cows included a greater proportion of individuals exceeding 3,000 days of PL.
A slight peak indicating increased culling risk was observed at the beginning of PL in both breed groups, however, the culling rate during this early period was higher in HB cows than in RB cows.
3.2. The Factor Analysis
When assessing the effect of year of birth on LS and duration of PL (Table 5), it is essential to consider not only animal-specific characteristics, but also the fact that cows in the first 2 groups (2010 – 2012 and 2013 – 2015) were able to remain productive for longer periods.
There were observed statistically significant differences (p<0.05) between birth year groups for LS and PL.
The longest LS and PL was observed in cow group born in 2010 – 2012 (2,184.4±4.57 and 1,348.4±4.56 in RB and 2,049.4±3.30 and 1,229.0±3.27 in HB breed accordingly). The cows born in more recent time periods characterized with shorter LS and length of PL in both analyzed breed groups. Although RB cows during their lifetime had more LS and PL days, they also characterized with lower total lifetime milk productivity in every birth year group in comparison with HB cows (Table S1).
MPD decreased significantly (p<0.05) in cows born in more recent years in both RB and HB cow groups, whereas MPPD showed a significantly increasing trend. (Table 6).
In RB cows MDP declined from 10.3±0.03 kg ECM per day in the 2010 – 2012 cohort to 8.3±0.05 kg ECM per day in cows born in 2016 – 2019 (p<0.05), while MPPD increased from 18.5±0.03 to 20.4±0.07 over the same period.
A similar pattern was observed in the HB breed, where MDP decreased from 11.6±0.02 to 10.7±0.03, whereas MMPD increased from 21.5±0.03 to 25.9±0.03 kg ECM daily across successive birth year groups.
AFC had a pronounced and statistically significant effect (p<0.05) on cow LS and PL in both RB and HB cow groups (Table 7).
In both breed groups, a clear increasing trend in LS was observed with increasing AFC. Cows that calved for the first time at an older age, particularly those with AFC exceeding 32 months, exhibited longer LS. In contrast, PL showed an opposite pattern. In RB cows, LS was longest in animals that reached first calving younger and gradually decreased as AFC increased. Cows with delayed AFC (> 32 months) had significantly shorter PL compared with cows calving earlier (p<0.05), despite their longer overall LS. A significantly longer (p<0.05) LS was observed in both breed groups in cows with later AFC, whereas PL exhibited the opposite trend. In RB cows, the longest PL was recorded in animals with AFC < 22 months, followed by a slight, but statistically significant decline up to 26 months. In contrast, in the HB population, the significantly longest PL was observed in cows with AFC between 24.1 and 28 months (p<0.05)
Significantly higher total lifetime milk productivity was obtained from cows with AFC < 24 months. The tendency persists in both RB and HB cow groups (Table S1). In later AFC groups cow total milk productivity gradually decreases until reaches its minimal amount at the AFC group > 32 months.
Age at first calving (AFC) significantly influenced (p<0.05) both MPD and MPPD in RB and HB cow groups (Table 8).
In both breeds, MPD showed a clear decreasing trend with increasing AFC. In RB cows, the highest MPD values were observed in animals calving first time before 26 months of age, with MPD declining progressively as AFC increased and reaching the lowest values in cows with AFC > 32 months.
In HB population, where MPD decreased steadily from 13.5±0.05 kg ECM in cows with AFC < 22 months to 8.3±0.04 kg ECM in cows calving first time older than 32 months.
In contrast MPPD displayed a different pattern. In RB cows, the highest MPPD values were recorded in cows with AFC between 22.1 and 28.0 months, whereas both earlier and later AFC groups showed significantly lower MPPD values (p<0.05). Although RB cows with AFC < 22 months exhibited relatively high MPD, their MPPD was among the lowest (accordingly 10.8±0.09 and 18.1±0.10 kg ECM). In HB cows, MPPD was highest in cows with the earliest AFC (< 22 months) and declined consistently with increasing AFC, reaching significantly lower values in AFC group > 32 months (accordingly 13.5±0.05 and 8.3±0.04 kg ECM).
Farm size had significant effect on both LS and PL in both analyzed breed groups (p<0.05). In RB and HB cows LS and PL decreased progressively with increasing of farm size (Table 9).
The significantly longest LS and PL (p<0.05) were observed in cows kept on small farms (with fewer than 20 cows), whereas the shortest periods were recorded in cows from largest farms (> 500 dairy cows) – accordingly 2,149.4±4.76 and 1,452.9±35.95 days in RB group and 1,974.5±3.09 and 1,394.9±6.58 days in HB group.
In cow farms with > 500 cows PL was 710.3±35.16 days (about 1.94 years) in RB cows 655.8±6.51 days (about 1.79 years) in HB cow group. With the increase of farm size, total milk productivity has tendency to gradually increase as well (Table S1). But the growth is not linear, since RB cows in farms with > 500 cows and HB cows in farms with > 201 cows characterize LS and PL, what reduces the total cow productive period in the herd.
The number of animals per farm did not only affect the LS and PL but also showed significant effect on cow daily milk productivity (MPD and MPPD) in RB and HB cows (p<0.05) (Table 10).
In both breeds, MPD increased with increasing farm size up to medium and large herds, with the highest MPD values generally observed in farms with 201 – 500 cows, followed by a slight, but statistically significant decrease in the largest herds (> 500 cows).
In RB cows, MPD increased from 9.4±0.02 kg ECM (herds < 20 cows) to 12.3±0.10 kg ECM in herds with 201 – 500 cows. A similar pattern was observed in HB population, where MPD rose from 9.9±0.02 kg ECM to 13.8±0.04 kg ECM in farms with 101 – 200 cows.
MPPD showed a more pronounced response to a farm size. In both analyzed breed groups MPPD increased constantly with increasing in herd size, reaching the highest value in the largest farms (>500 cows). There were no statistical difference between MPPD in RB cows in the herds with 101 – 200 and 201 – 500 cows, but between other groups the MPPD varied significantly (p<0.05). In HB cow population MPPD had tendency to gradually increase from 19.2±0.02 kg ECM in farms with < 20 cows up to 27.1±0.07 kg ECM in the farms with > 500 cows.
3.4. The Longevity Depending on AFC and Farm Size
AFC differed across all farm size categories and between breed groups. On small farms (< 20 cows), both breeds showed highest AFC values (Table S2). The highest AFC across all groups were observed in RB cows in the farms with 21 – 100 cows (average 844.8±1.07 or 28.2 months). In contrast, HB cows on farms of this size showed a marked reduction of AFC to 801.9±0.54 days (26.8 months).
As farm size increased to 101 – 200 cows, AFC declined further for both breeds. On larger farms 201 - 500 cows both breeds characterized with lowest AFC (742.6±4.84 and 739.1±0.85 days accordingly) reaching 24.8 and 24.6 months.
The longest PL in RB group were observed in small farms (< 20 and 21 – 100 dairy cows) in the groups with the latest AFC (>30.1 month) (Tabless S3 and S4). Due to prolonged heifer rearing period, animals characterized with shorter PL. Larger farms with RB cows (> 201 cow per herd) characterized with shortest PL, especially in the groups with AFC > 28 months. Although the longer PL for RB cows tended to be in the groups with AFC 26.1 months and later, the highest MPD and MPPD was observed in cow groups with AFC < 26 months (Table S5). With an exception of farms with 20 cows in which the most productive groups were with AFC 24.1 – 32 months and farms with 201 – 500 cows that showed similar tendency.
In HB group results showed similar tendencies to have higher lifespan in all farm sizes in groups with late AFC (> 28 months) and the longest LS was observed in groups with AFC <28 months (Tables S6 and S7). In HB cow group highest MPD and MPPD were observed in cow group with AFC < 24 months in all farm groups with exception of farms with > 500 cows, where the higher MPPD was observed in group with AFC >28.1 months (Table S8).
3.5. Survival Analysis
PL for culled and alive cows was evaluated by survival analysis. Kaplan–Meier survival curves (Figure 3) showing the length of productive life in RB and HB breeds. Median of productive life length was 1,278 days for RB and 1,086 days for HB cows. The median productive life was significantly longer in RB (1,278 days; 95% CI: 1,269–1,287 days) compared with HB cows (1,086 days; 95% CI: 1,081–1,091 days) by 192 days (p < 0.0001).
Figure 2.
Survival probability of productive life in Red (RB) and Holstein (HB) breeds.
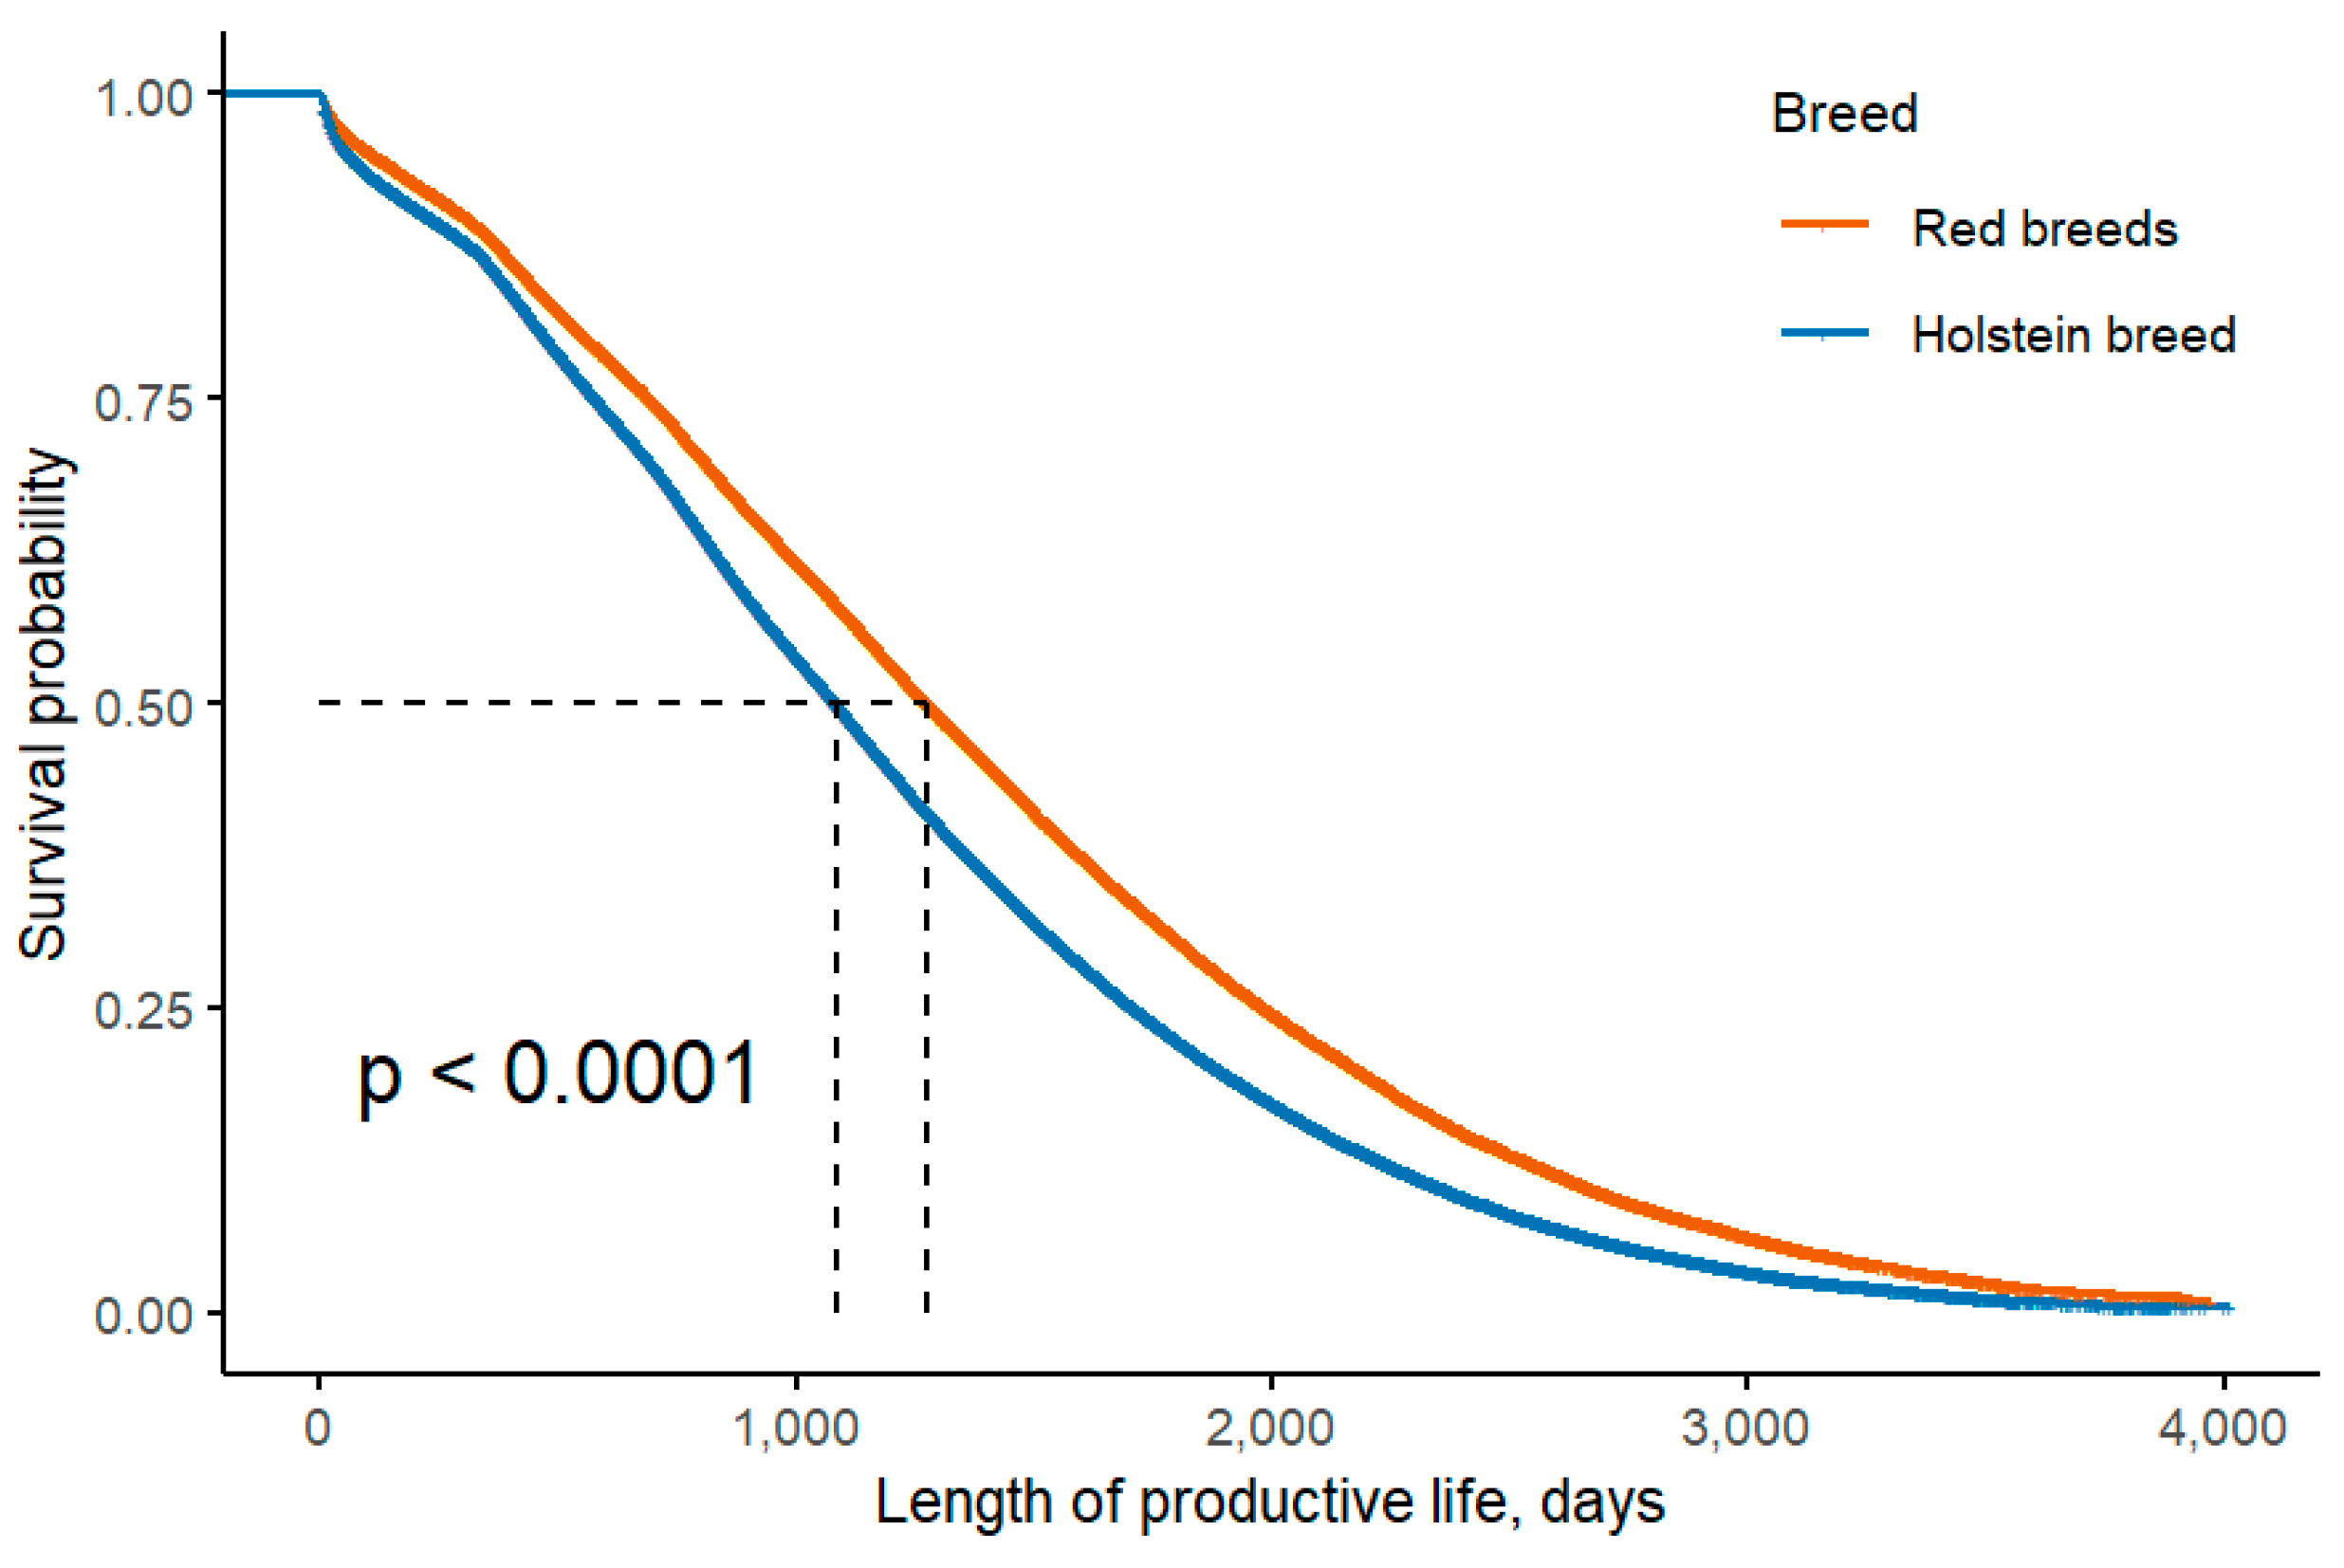
Figure 4.
Survival probability of productive life in Red (RB) and Holstein (HB) breeds depending on (1) birth year, (2) age at first calving (AFC), and (3) farm size.
Figure 4.
Survival probability of productive life in Red (RB) and Holstein (HB) breeds depending on (1) birth year, (2) age at first calving (AFC), and (3) farm size.
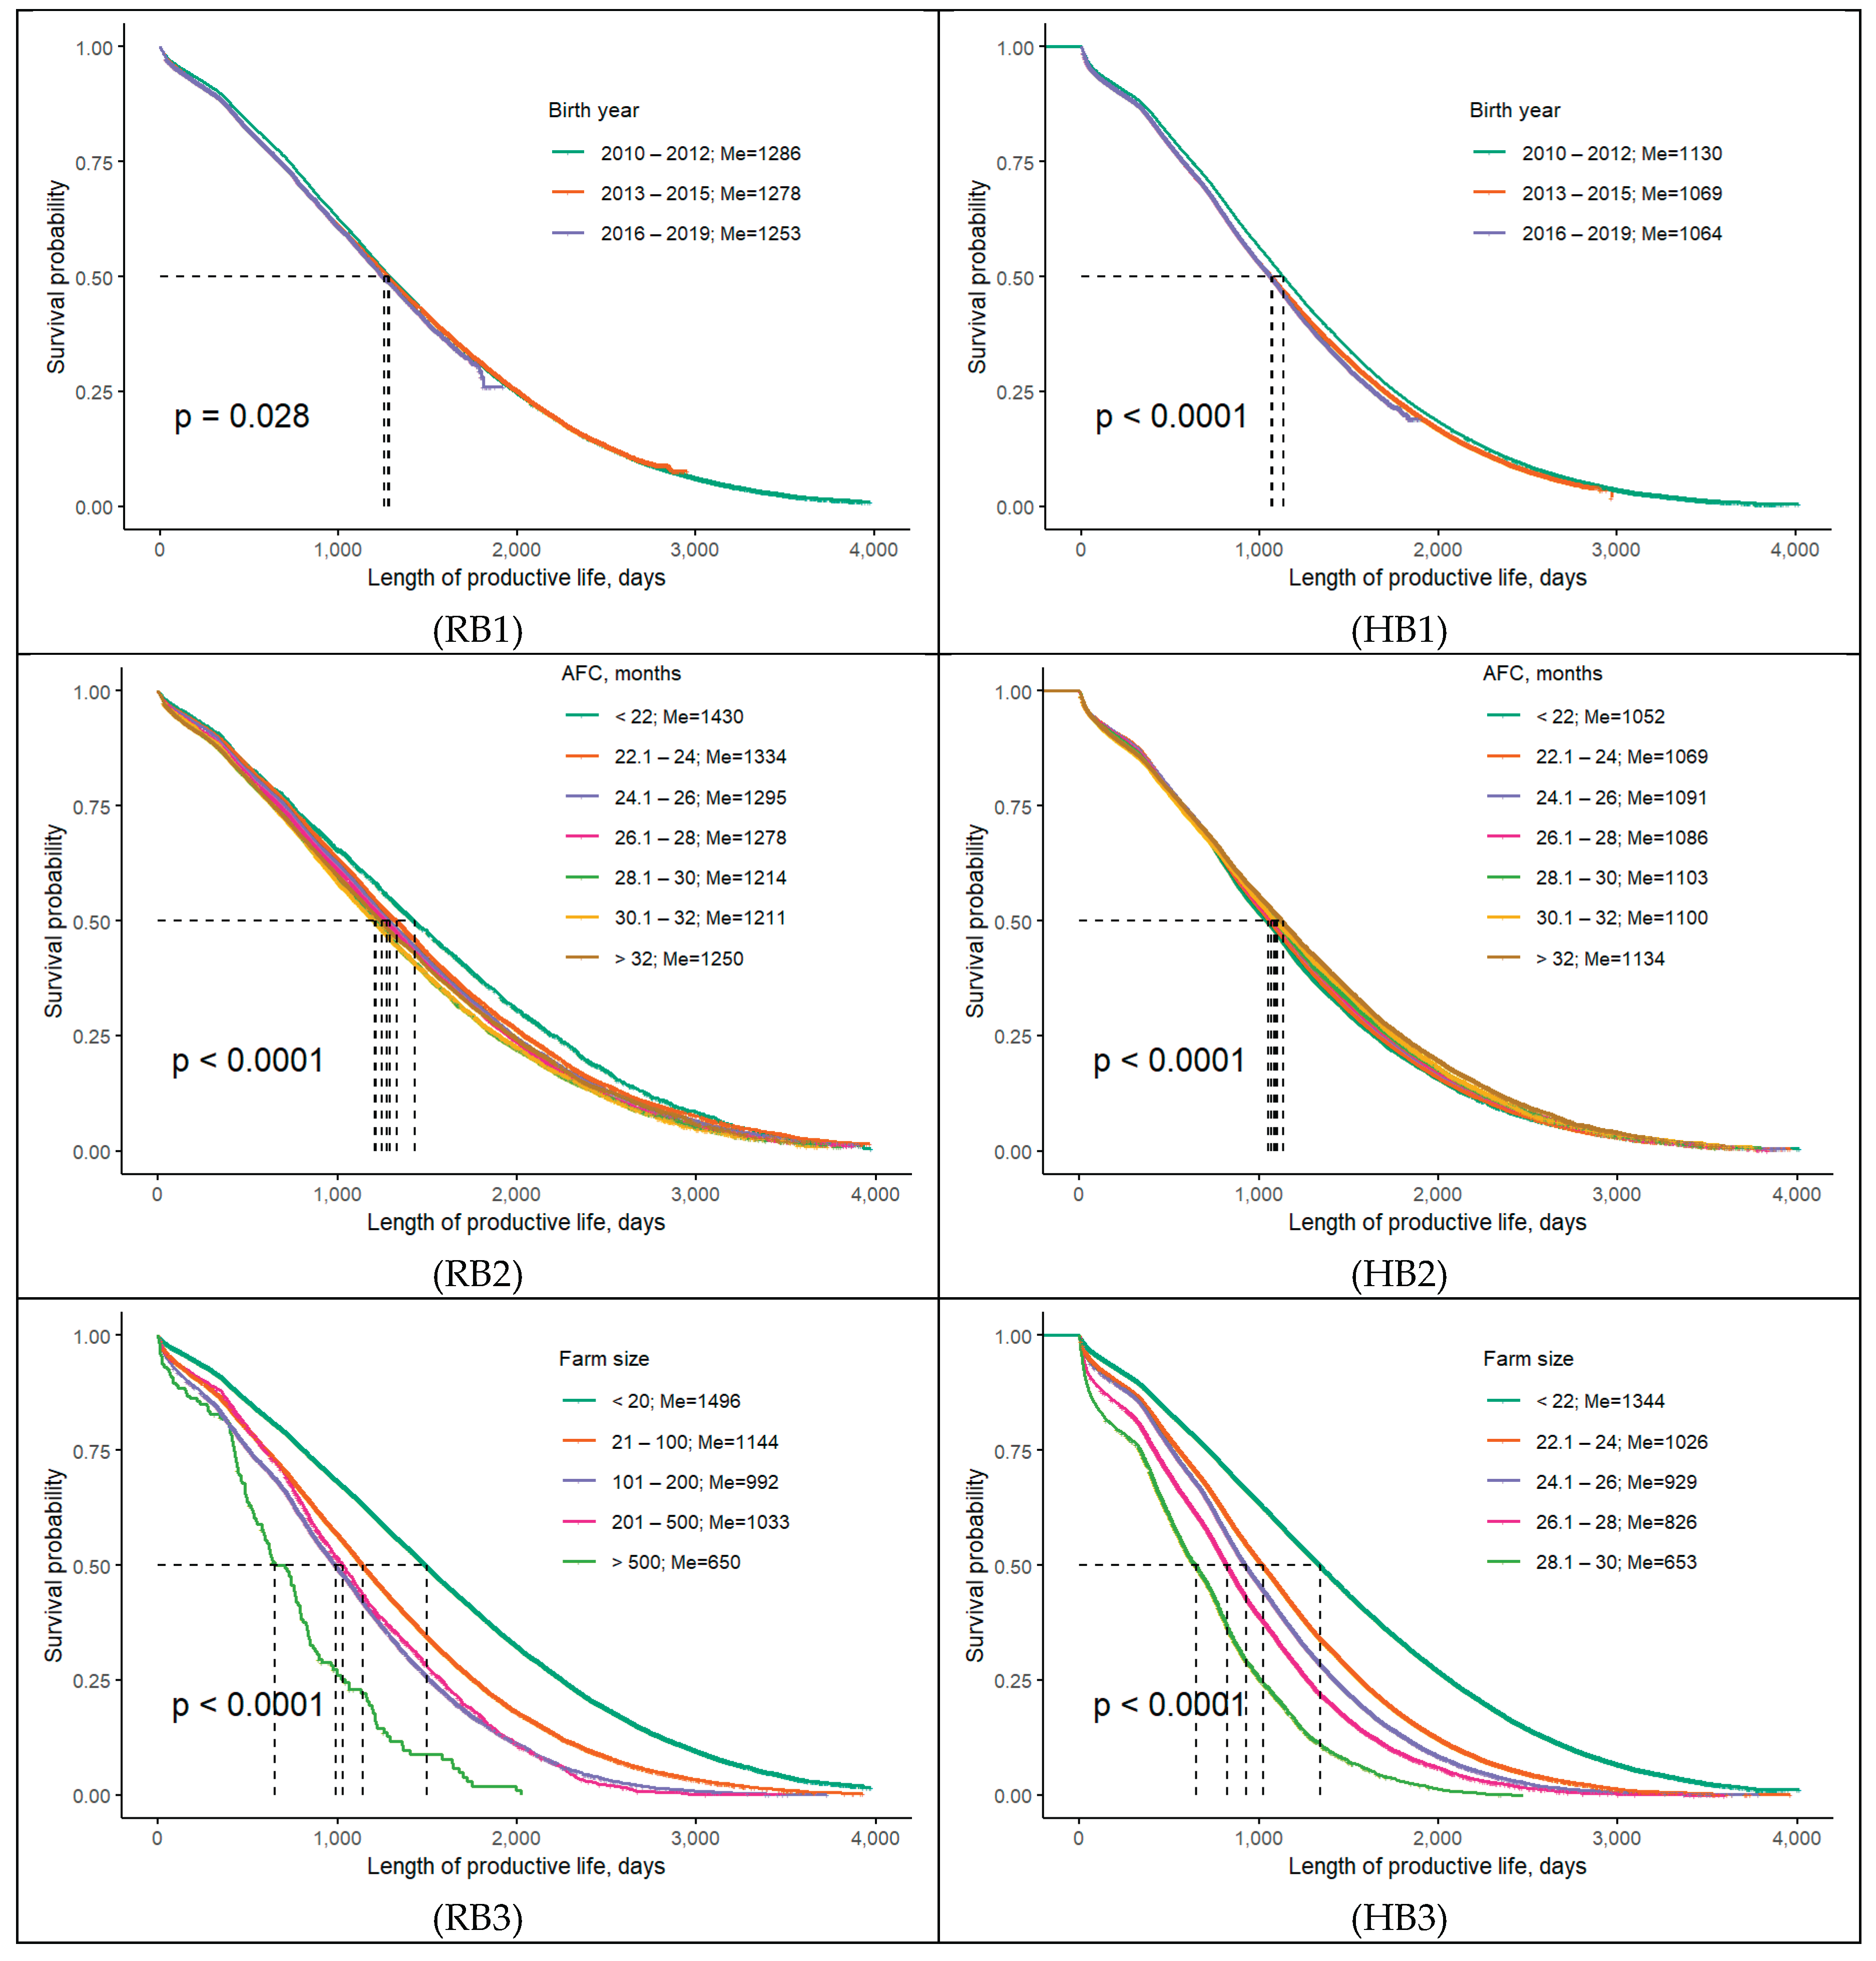
Cow’s PL depends on the birth-year factor (Figures RB1 and HB1). PL showed a gradual decline across cows' birth year groups in both breeds. The reduction in median PL from the earliest to the latest year group was approximately 33 days in RB and 66 days in HB cows. In RB, median PL ranged from 1,253 to 1,286 days, and in HB cows from 1,064 to 1,130 days. Differences in survival curves among birth-year groups were statistically significant (log-rank test: RB p < 0.05; HB p < 0.0001).
RB and HB cows’ PL depends on the age at the first calving (Figure RB2 and HB2) (p < 0.0001). HB median of PL ranges from 1,052 to 1,134 days, with the lowest PL median for cows with AFC lower than 22 months (1,052 days; 95% CI 1,034–1,068 days) and the highest PL median for cows with AFC higher than 32 months (1,134 days; 95% CI 1,119–1,150 days).
RB median of PL ranges from 1,211 to 1,430 days, with the highest PL median for cows with AFC lower than 22 months (1,430 days; 95% CI 1,382–1,479 days) and the lowest PL median for cows with AFC 30.1 - 32 months (1,211 days; 95% CI 1,176–1,240 days).
RB cows have higher overall variation around AFC groups (219 days) in comparison with HB cows (82 days). Kaplan–Meier analysis shows contrasting patterns between breeds: median PL increased slightly with AFC in HB cows, whereas an inverse relationship between AFC and PL was observed in RB.
Cow’s PL depends on farm size (Figure RB3 and HB3). The farm size significantly influenced PL in both breeds. In RB, the median of PL varied from 650 (95% CI 591–780 days) to 1496 days (95% CI 1,482–1,509 days), with the highest PL values observed in small farms with a number of cows up to twenty and the lowest PL in big farms with a number of cows in the herd higher than 500. In HB cows, median PL ranged from 653 (95% CI 626–673 days) to 1344 days (95% CI 1,336–1,352 days), following a similar ranking pattern across farms. Across all farm groups, RB exhibited a longer productive life than Holstein cows. Differences in survival curves among farm groups were statistically significant (log-rank test, p < 0.0001).
4. Discussion
The present study provides a comprehensive evaluation of longevity and productivity-related traits in RB and HB dairy cows born between 2010 and 2019, with particular emphasis on the effects of year of birth, age at first calving (AFC), and farm size. The results clearly demonstrate that longevity and its characteristics in dairy cattle cannot be interpreted solely in terms of lifespan duration, but must be assessed in conjunction with productive efficiency, expressed as lifetime and life day milk productivity [39].
4.1. Changes in Longevity and Milk Productivity over Time
In the period from 2010 to 2023 average milk yield for cows under recording in Latvia increased by 2,827 kg (from 5987kg in 2010 to 8814kg in 2023) [40]. It was achieved due to the increased proportion of HB cows in Latvian dairy herds, improved animal genetic quality, as well as due to improved housing and feeding conditions in dairy farms. The tendency was not observed only on Latvian dairy farms, but also in European dairy herds [41]. In studies performed in Latvia were determined that from 2012 to 2021 the number of high yielding dairy cows increased by more than 2 times (accordingly 28,749 and 66,751 thousand) with the side tendency for the total number of dairy cows to decrease [42].
In studies, the birth year was deemed to be an important factor that strongly influences the length of productive life. There is global tendency for PL length to gradually decrease in more recent years, while milk productivity has opposite trend. In present study cows born in more recent years exhibited shorter rearing periods, indicating improved heifer rearing efficiency and earlier entry into production [11]. In modern dairy farms with the increase of cow productivity occur changes in the culling reasons [43]. Due to high productivity levels dairy cows are often forced culled from herds due to metabolic performance [18,44], health issues [16,17,24], reproductive performance [45,46] and other management issues [46,47,48]. In numerous studies similar tendency – for cows with longer productive life to have lower production per one life or productive life day – has been observed. [49,50,51]
4.2. Influence of Age at First Calving
Optimal AFC can vary under the influence of in-farm or various animal-level factors. The heifer rearing process in dairy farm can be increased if there are some problems in animal feeding, health and farm management [52]. In present study increased AFC in cows’ lifetime for both analyzed breeds leads to decreased lifetime milk productivity as well as MPD and MPPD. The tendency is observed in studies in Europe, where cows with later AFC characterized with longer total LS, but shorter PL and lower MPD and MPPD [32,53,54,55].
The recommendations for optimal AFC vary in different studies with as low as 22 or as high as 26 months [49,51,56]. With the increase of investments during the rearing period of dairy heifers and lower productive returns in present study it was not beneficial to increase AFC over 28 months in RB group and over 24 months in HB group. These breed specific differences likely reflect variations in breed growth patterns, body size, and metabolic demands. Studies have reported that cows calving at younger ages (around 22–24 months) often improve herd life and lifetime productivity compared to older AFC cow groups. For example, heifers with first calving ages ≤ 24 months showed better performance in herd life and lifetime milk production in pasture-based systems compared to older AFC groups – cows in classes of AFC > 28 months without compromising reproductive performance [57]. In present study, animals with AFC between 22 and 26 months had more lactations (3.95 lactations) and total lactation days (1287days) during their life.
In our previous studies on Holstein Black-and-White and Holstein Red-and-White dairy cows optimal AFC for higher MPD was < 27 months, while for Holstein Red-and-White type maximums productivity results were obtained in groups where cows calved first time at 27 – 29 months [58]
4.3. Effect of Farm Size
The farm size does not only refer to the number of animals per herd, but also indicates housing, feeding, and management systems in the herd. The basic characteristics of Latvian dairy farms in 2018 were that up to 5 cow farms usually had tied housing with 98% possibility for mechanization covering only water supply and milking process, whilst cow farms with 50 – 200 cows mixed results – in 50% of farms dairy cows were kept tied and in 50% in a loose housing system. In farms with 50 – 200 cows, all farms had a mechanized water supply, milking and manure removal and in 95% possibility – feeding. If farm had more than 200 cows, the housing system was loose, and all basic work was performed mechanically or was fully automatized [55].
In our study, farm size emerged as a significant herd-level factor influencing both longevity and milk productivity traits. In studies dedicated to the evaluation of farm size on milk productivity level, it is proven that in herds with smaller number of cows, daily milk yield from one cow is lower than in bigger farms [50,51]. In terms of longevity global trends show that farms with smaller number of cows, has better results in the total and productive lifespan, while better lifetime and life-day milk productivity are occurring in farms with higher number of animal [59]. Both RB and HB cows LS and PL decreased with increasing farm size. The longest LS and PL were observed in small herds, whereas cows in large farms exhibited the shortest total and productive LS. These results indicate that management intensity, housing density and production pressure in large herds may negatively affect cow survival and productive persistence.
At the same time productivity indicators showed opposite pattern. Both MPD and MPPD increased with farm size, reaching the highest values in medium-sized and large herds. This indicates that cows in larger farms are managed for higher milk output, likely due to improved feeding strategies, genetic selection and the use of precision technologies.
However, the combination of higher productivity and shorter PL suggests a clear tradeoff between production intensity and longevity. While cows in large herds produce more milk per day, their shorter lifespan reduces the total lifetime output and increases replacement pressure. In contrast smaller farms appear to favor longevity over productivity intensity.
5. Conclusions
In the Latvian dairy cow population, cows of the RB group were characterized by significantly longer LS and PL; however, they exhibited lower MPD and MPPD compared with HB cows. A clear tendency was observed for RB cows to be more frequently kept on smaller farms, whereas HB cows predominated in intensive production systems with larger herd sizes. Cows born in earlier periods showed lower MPD and MPPD values in both groups, indicating improvements in productivity over time.
The results suggest that extending AFC beyond 28 months in RB cows and beyond 24 months in HB cows is not beneficial for longevity of lifetime and life day productivity. Farm size had a significant effect on dairy cow longevity and milk production traits. In smaller farms cows of both breeds demonstrated longer LS and comparable average lifetime productivity. In contrast the highest MPD and MPPD values were observed in farms with 101 – 500 cows for the RB group and 101 – 200 cows for the HB group. Overall, these findings highlight the importance of breed specific management strategies and optimal farm size in improving dairy cow longevity and milk productivity.
Supplementary Materials
The following supporting information can be downloaded at the website of this paper posted on Preprints.org, Table S1. The impact of the analyzed factors on the variability of total lifetime productivity; Table S2. Number of RB cows in different AFC and farm size groups; Table S3. The LS and PL of RB cows depending on their AFC in farms with different number of cows; Table S4. The MPD and MPPD of RB cows depending on their AFC in farms with different number of cows; Table S5. Number of HB cows in different AFC and farm size groups; Table S6. The LS and PL of HB cows depending on their AFC in farms with different number of cows; Table S7. The MPD and MPPD of HB cows depending on their AFC in farms with different number of cows.
Author Contributions
Conceptualization, L.C,, L.P., D.J., writing—original draft preparation, L.C., L.P.; writing—review and editing, L.C., D.J., L.P; supervision, L.C., D.J., L.P software, L.C., L.P.; visualization, L.C. and LP. All authors have read and agreed to the published version of the manuscript.
Funding
This research received no external funding.
Data Availability Statement
No new data were created.
Acknowledgments
The authors acknowledge contributions preparation of dataset and express gratitude to Rural Support Service of the Republic of Latvia.
Conflicts of Interest
The authors declare no conflicts of interest.
Abbreviations
The following abbreviations are used in this manuscript:
| RB | Red breed |
| HB | Holstein breed |
| LS | Lifespan |
| PL | Productive life |
| MPD | Energy corrected milk productivity per life day |
| MPPD | Energy corrected milk productivity per productive life day |
| ECM | Energy corrected milk |
| AFC | Age at first calving |
References
- Bruijnis, M.R.N.; Meijboom, F.L.B.; Stassen, E.N. Longevity as an Animal Welfare Issue Applied to the Case of Foot Disorders in Dairy Cattle. J. Agric. Environ. Ethics 2013, 26, 191–205. [Google Scholar] [CrossRef]
- Vredenberg, I.; Han, R.; Mourits, M.; Hogeveen, H.; Steeneveld, W. An Empirical Analysis on the Longevity of Dairy Cows in Relation to Economic Herd Performance. Front. Vet. Sci. 2021, 8. [Google Scholar] [CrossRef]
- Hultgren, J.; Svensson, C.; Pehrsson, M. Rearing Conditions and Lifetime Milk Revenues in Swedish Dairy Cows. Livest. Sci. 2011, 137, 108–115. [Google Scholar] [CrossRef]
- Schlebusch, S.; Eppenstein, R.; Hoop, D.; Von Rohr, P. Are Dairy Cow Replacement Decisions Economically Justified? Evidence from Swiss Farms. 2025. [Google Scholar] [CrossRef]
- Gazzarin, C.; Schmid, D.; Bieber, A. Economic Drivers of the Optimal Productive Lifespan of Dairy Cows in Two Different Swiss Milk Production Systems. J. Dairy Sci. 2025, 108, 12352–12372. [Google Scholar] [CrossRef]
- De Vries, A. Symposium Review: Why Revisit Dairy Cattle Productive Lifespan? J. Dairy Sci. 2020, 103, 3838–3845. [Google Scholar] [CrossRef]
- Wilcox, C.J.; Curl, J.A.; Roman, J.; Spurlock, A.H.; Becker, R.B. Life Span and Livability of Crossbred Dairy Cattle. J. Dairy Sci. 1966, 49, 991–994. [Google Scholar] [CrossRef]
- Gaillard, C.; Martin, O.; Blavy, P.; Friggens, N.C.; Sehested, J.; Phuong, H.N. Prediction of the Lifetime Productive and Reproductive Performance of Holstein Cows Managed for Different Lactation Durations, Using a Model of Lifetime Nutrient Partitioning. J. Dairy Sci. 2016, 99, 9126–9135. [Google Scholar] [CrossRef]
- Boulton, A.C.; Rushton, J.; Wathes, D.C. An Empirical Analysis of the Cost of Rearing Dairy Heifers from Birth to First Calving and the Time Taken to Repay These Costs. Animal 2017, 11, 1372–1380. [Google Scholar] [CrossRef] [PubMed]
- Tatar, A.M.; Deniz Şireli, H.; Tutkun, M. Reasons for culling and replacement rate in dairy cattle. Scientific Papers. Series D. Animal Science 2017, LX, 49–51. [Google Scholar]
- Dallago, G.M.; Wade, K.M.; Cue, R.I.; Mcclure, J.T.; Lacroix, R.; Pellerin, D.; Vasseur, E. Keeping Dairy Cows for Longer: A Critical Literature Review on Dairy Cow Longevity in High Milk-Producing Countries. Animals. 2021, 11, 808. [Google Scholar] [CrossRef]
- Sherwin, G. Economics of Heifer Rearing on Dairy Farms. Livestock 2023, 28, 70–75. [Google Scholar] [CrossRef]
- De Vries, A. Economic Trade-Offs between Genetic Improvement and Longevity in Dairy Cattle. J. Dairy Sci. 2017, 100, 4184–4192. [Google Scholar] [CrossRef]
- Djedovi´cdjedovi´c, R.; Vukasinovic, N.; Stanojevi´cstanojevi´c, D.; Bogdanovi´cbogdanovi´c, V.; Ismael, H.; Jankovi´c, D.J.; Gligovi´c, N.G.; Brka, M.; Štrbac, L. Genetic Parameters for Functional Longevity, Type Traits, and Production in the Serbian Holstein. Animals. 2023, 13, 534. [Google Scholar] [CrossRef]
- Strapák, P.; Candrák, J.; Aumann, J. Relationship between Longevity and Selected Production, Reproduction and Type Traits. Czech J. Anim. Sci. 2005, Vol. 50, 1–6. [Google Scholar] [CrossRef]
- Stefani, G.; El Faro, L.; Santana Júnior, M.L.; Tonhati, H. Association of Longevity with Type Traits, Milk Yield and Udder Health in Holstein Cows. Livest. Sci. 2018, 218, 1–7. [Google Scholar] [CrossRef]
- Owusu-Sekyere, E.; Nyman, A.K.; Lindberg, M.; Adamie, B.A.; Agenäs, S.; Hansson, H. Dairy Cow Longevity: Impact of Animal Health and Farmers’ Investment Decisions. J. Dairy Sci. 2023, 106, 3509–3524. [Google Scholar] [CrossRef] [PubMed]
- Van Knegsel, A.T.M.; Hammon, H.M.; Bernabucci, U.; Bertoni, G.; Bruckmaier, R.M.; Goselink, R.M.A.; Gross, J.J.; Kuhla, B.; Metges, C.C.; Parmentier, H.K.; et al. Metabolic Adaptation during Early Lactation: Key to Cow Health, Longevity and a Sustainable Dairy Production Chain. CAB Reviews: Perspectives in Agriculture, Veterinary Science, Nutrition and Natural Resources 2014, 9. [Google Scholar]
- Mikó, E.; Kusza, S.; Kocsis-Gráff, M.; Tóth, V.; Sudár, G. Longevity and Culling Dynamics of Holstein–Friesian Cows in Hungary. Agriculture (Switzerland) 2025, 15. [Google Scholar] [CrossRef]
- Grandl, F.; Luzi, S.P.; Furger, M.; Zeitz, J.O.; Leiber, F.; Ortmann, S.; Clauss, M.; Kreuzer, M.; Schwarm, A. Biological Implications of Longevity in Dairy Cows: 1. Changes in Feed Intake, Feeding Behavior, and Digestion with Age. J. Dairy Sci. 2016, 99, 3457–3471. [Google Scholar] [CrossRef]
- Leso, L.; Pellegrini, P.; Barbari, M. Effect of Two Housing Systems on Performance and Longevity of Dairy Cows in Northern Italy. Agronomy Research 2019, 17, 574–581. [Google Scholar] [CrossRef]
- Han, R.; Hogeveen, H.; Mourits, M. The Association of Dairy Cattle Longevity with Farm Level Technical Inefficiency. Front Vet Sci. 2022, 14;9, 1001015. [Google Scholar] [CrossRef]
- Rostellato, R.; Promp, J.; Leclerc, H.; Mattalia, S.; Friggens, N.C.; Boichard, D.; Ducrocq, V. Influence of Production, Reproduction, Morphology, and Health Traits on True and Functional Longevity in French Holstein Cows. J. Dairy Sci. 2021, 104, 12664–12678. [Google Scholar] [CrossRef] [PubMed]
- Fall, N. Health and Reproduction in Organic and Conventional Swedish Dairy Cows. Doctoral thesis, Swedish University of Animal Sciences, 2009. [Google Scholar]
- Teke, B.; Murat, H. Effect of Age at First Calving on First Lactation Milk Yield, Lifetime Milk Yield and Lifetime in Turkish Holsteins of the Mediterranean Region in Turkey. Bulgarian Journal of Agricultural Science 2013, 19(5), 1126–1129. [Google Scholar]
- Zavadilová, L.; Štípková, M. Effect of Age at First Calving on Longevity and Fertility Traits for Holstein Cattle. Czech J. Anim. Sci. 2013, 58, 47–57. [Google Scholar] [CrossRef]
- Hamworth, G.M.; Tranter, W.P.; Chuck, J.N.; Cheng, Z.; Wathes, D.C. Relationships between Age at First Calving and First Lactation Milk Yield, and Lifetime Productivity and Longevity in Dairy Cows. Veterinary Record 2013, 643–647. [Google Scholar] [CrossRef]
- Jenko, J.; Perpar, T.; Kovač, M. Genetic Relationship between Lifetime Milk Production, Longevity and First Lactation Milk Yield in Slovenian Brown Cattle Breed. Mljekarstvo 2015, 65, 111–120. [Google Scholar] [CrossRef]
- Sawa, A.; Siatka, K.; Krezel-Czopek, S. Effect of Age at First Calving on First Lactation Milk Yield, Lifetime Milk Production and Longevity of Cows. Annals of Animal Science 2019, 19, 189–200. [Google Scholar] [CrossRef]
- Siriak, V.; Polupan, Y.; Stavetska, R. Retrospective: Duration and Efficiency of Dairy Cows Productive Lifespan Depending on Age at First Calving and First Lactation Milk Productivity. Agraarteadus 2022, 33, 146–153. [Google Scholar] [CrossRef]
- Kalińska, A.; Golebiewski, M.; Kruzińska, B.; Przysucha, T.; Slósarz, J.; Wojcik, A. The Impact of Age at the First Calving on Lifetime Milk Yield, Life Span and Herd Life of Dairy Cows. Annals of Warsaw University of Life Sciences - SGGW - Animal Science 2021, 58, 215–221. [Google Scholar] [CrossRef]
- Cielava, L.; Jonkus, D.; Paura, L. Lifetime Milk Productivity and Quality in Farms with Different Housing and Feeding Systems. Agronomy Research. 2017, 15(2), 369–375. [Google Scholar]
- Tiezzi, F.; Parappurathu, S.; Han, R. The Association of Dairy Cattle Longevity with Farm Level Technical Inefficiency. Frontiers in Veterinary Science 2022, 9. [Google Scholar] [CrossRef]
- Doncel-Díaz, B.; Fariña, S.; Caffarena, R.D.; Giannitti, F.; Riet-Correa, F. Cow Culling Rates and Causes in 12 Pasture-Based Dairy Herds in Southern Uruguay, a Pilot Study. Dairy 2025, 6, 3. [Google Scholar] [CrossRef]
- Ducrocq, V. Statistical Analysis of Length of Productive Life for Dairy Cows of the Normande Breed. J. Dairy Sci. 1994, 77, 855–866. [Google Scholar] [CrossRef]
- R Core Team R: A Language and Environment for Statistical Computing. R Foundation for Statistical Computing 2024.
- Therneau, T. A Package for Survival Analysis in R. R package version 3.8-3. 2024. Available online: https://CRAN.R-project.org/package=survival.
- Kassambara, A.; Kosinski, M.; Biecek, P. survminer: Drawing Survival Curves using 'ggplot2'. R package version 0.5.1. 2025. Available online: https://rpkgs.datanovia.com/survminer/index.html.
- Shin, J.; Lee, J.; Cho, J.; Dang, C.; Choi, T.; Do, C.; Lee, J.; Lee, S. The Estimation of Genetic Parameters for Longevity According to Lactation Period Using a Multiple Trait Animal Model in Korean Holstein Cows. Animals 2022, 12. [Google Scholar] [CrossRef]
- Lauku atbalsta dienests – Reģistri. Pārraudzība; Lauksaimniecības datu centrs. Available online: https://registri.ldc.gov.lv/lv/parraudziba (accessed on 10 February 2026). (in Latvian).
- Lowder, S.; Arslan, A.; Cabrera Cevallos, C. E.; O’Neill, M.; de la O Campos, A. P. A global update on the number of farms, farm size and farmland distribution." (2025); Food and Agriculture Organization of the United Nations (FAO): Rome, Italy, 2025; p. 42p. [Google Scholar] [CrossRef]
- Paura, L.; Berzina, L.; Degola, L.; Aplocina, E.; Kairisa, D.; Jonkus, D.; Skiste, O. Trends in Milk Yield Productivity and Emissions from the Dairy Sector in Latvia. Agronomy Research 2023, 21, 1254–1265. [Google Scholar] [CrossRef]
- Matjila, L.; Nephawe, K.; Sanarana, Y.; Dube, B.; Banga, C. Cow Longevity and Reasons and Risk Factors for Culling in South African Holstein and Jersey Dairy Herds. Animals 2025, 15. [Google Scholar] [CrossRef]
- Džermeikaitė, K.; Krištolaitytė, J.; Anskienė, L.; Girdauskaitė, A.; Arlauskaitė, S.; Šertvytytė, G.; Antanaitis, R. Milk Lactose and Inflammatory Marker Changes: Early Indicators of Metabolic and Inflammatory Stress in Early Lactation Dairy Cattle. Agriculture 2025, 15(11), 1205. [Google Scholar] [CrossRef]
- Cielava, L.; Jonkus, D.; Paura, L. Number of Services per Conseption and Its Relationship with Dairy Cow Productive and Reproductive Traits. In Proceedings of the Research for Rural Development; Latvia University of Agriculture: Jelgava, 2017; Vol. 2, pp. 67–73. [Google Scholar]
- Bognar, A.; Cziszter, L.T.; Acatincăi, S.; Tripon, I.; Gavojdian, D.; Baul, S.; Erina, S. Longevity and Milk Production Economics in Romanian Black and White Cows Reared in the South-Western Romania. Lucrări ştiinţifice Zootehnie, USAMV Iaşi 2011, 55(16), 193–198. [Google Scholar]
- Herrema, F.; Bieleman, H.; Hoekstra, M.; Gomes, J. Longevity and Milk Production Improvement in Dairy Cows Using Plant-Derived Products. J Vet Heal Sci 2023, 4, 128–140. [Google Scholar]
- Cooke, J.S.; Cheng, Z.; Bourne, N.E.; Wathes, D.C. Association between Growth Rates, Age at First Calving and Subsequent Fertility, Milk Production and Survival in Holstein-Friesian Heifers. Open J. Anim. Sci. 2013, 03, 1–12. [Google Scholar] [CrossRef]
- Valchev, V.; Marinov, I.; Angelova, T. Relationship between Age at First Calving and Longevity and Productive Life in Holstein Cows. Acta Universitatis Agriculturae et Silviculturae Mendelianae Brunensis 2020, 68, 867–874. [Google Scholar] [CrossRef]
- Nilforooshan, M.A.; Edriss, M.A. Effect of Age at First Calving on Some Productive and Longevity Traits in Iranian Holsteins of the Isfahan Province. J. Dairy Sci. 2004, 87, 2130–2135. [Google Scholar] [CrossRef]
- Banos, G.; Brotherstone, S.; Coffey, M.P. Prenatal Maternal Effects on Body Condition Score, Female Fertility, and Milk Yield of Dairy Cows. J. Dairy Sci. 2007, 90, 3490–3499. [Google Scholar] [CrossRef]
- Pirlo, G.; Miglior, F.; Speroni, M. Effect of Age at First Calving on Production Traits and on Difference between Milk Yield Returns and Rearing Costs in Italian Holsteins. J. Dairy Sci. 2000, 83, 603–608. [Google Scholar] [CrossRef]
- Sawa, A.; Bogucki, M. Longevity of Cows Depending on Their First Lactation Yield and Herd Production Level. Annals of Animal Science 2017, 17, 1171–1183. [Google Scholar] [CrossRef]
- Steele, M. Age at first calving in dairy cows: which months do you aim for to maximize productivity? Veterinary Evidence 2020, 5(1), 1–22. [Google Scholar] [CrossRef]
- Priekulis, J.; Laurs, A. Development Trends of Milk Production Mechanisation in Latvia. In Proceedings of the Engineering for Rural Development; Latvia University of Life Sciences and Technologies, May 1 2020; Vol. 19, pp. 270–275.
- Sherwin, V.E.; Hudson, C.D.; Henderson, A.; Green, M.J. The association between age at first calving and survival of first lactation heifers within dairy herds. Animals 2016, 10, 1877–1882. [Google Scholar] [CrossRef]
- Vargas-Leitón, B.; Romero-Zúñiga, J.J.; Castillo-Badilla, G.; Saborío-Montero, A. Optimal Age at First Calving in Pasture-Based Dairy Systems. Dairy 2023, 4, 581–593. [Google Scholar] [CrossRef]
- Bernard, J.; Le Gal, P.Y.; Triomphe, B.; Hostiou, N.; Moulin, C.H. Involvement of Small-Scale Dairy Farms in an Industrial Supply Chain: When Production Standards Meet Farm Diversity. Animal 2011, 5, 961–971. [Google Scholar] [CrossRef] [PubMed]
- BernardJali´c, N.J.; Vaško, Ž.; Rozman, C.; Pažek, K. Value-Added Diversification in Small Dairy Farms: Economic Efficiency and Strategic Investment. 2026. [Google Scholar] [CrossRef]
Figure 1.
The number of RB and HB cows analyzed depending on their status.
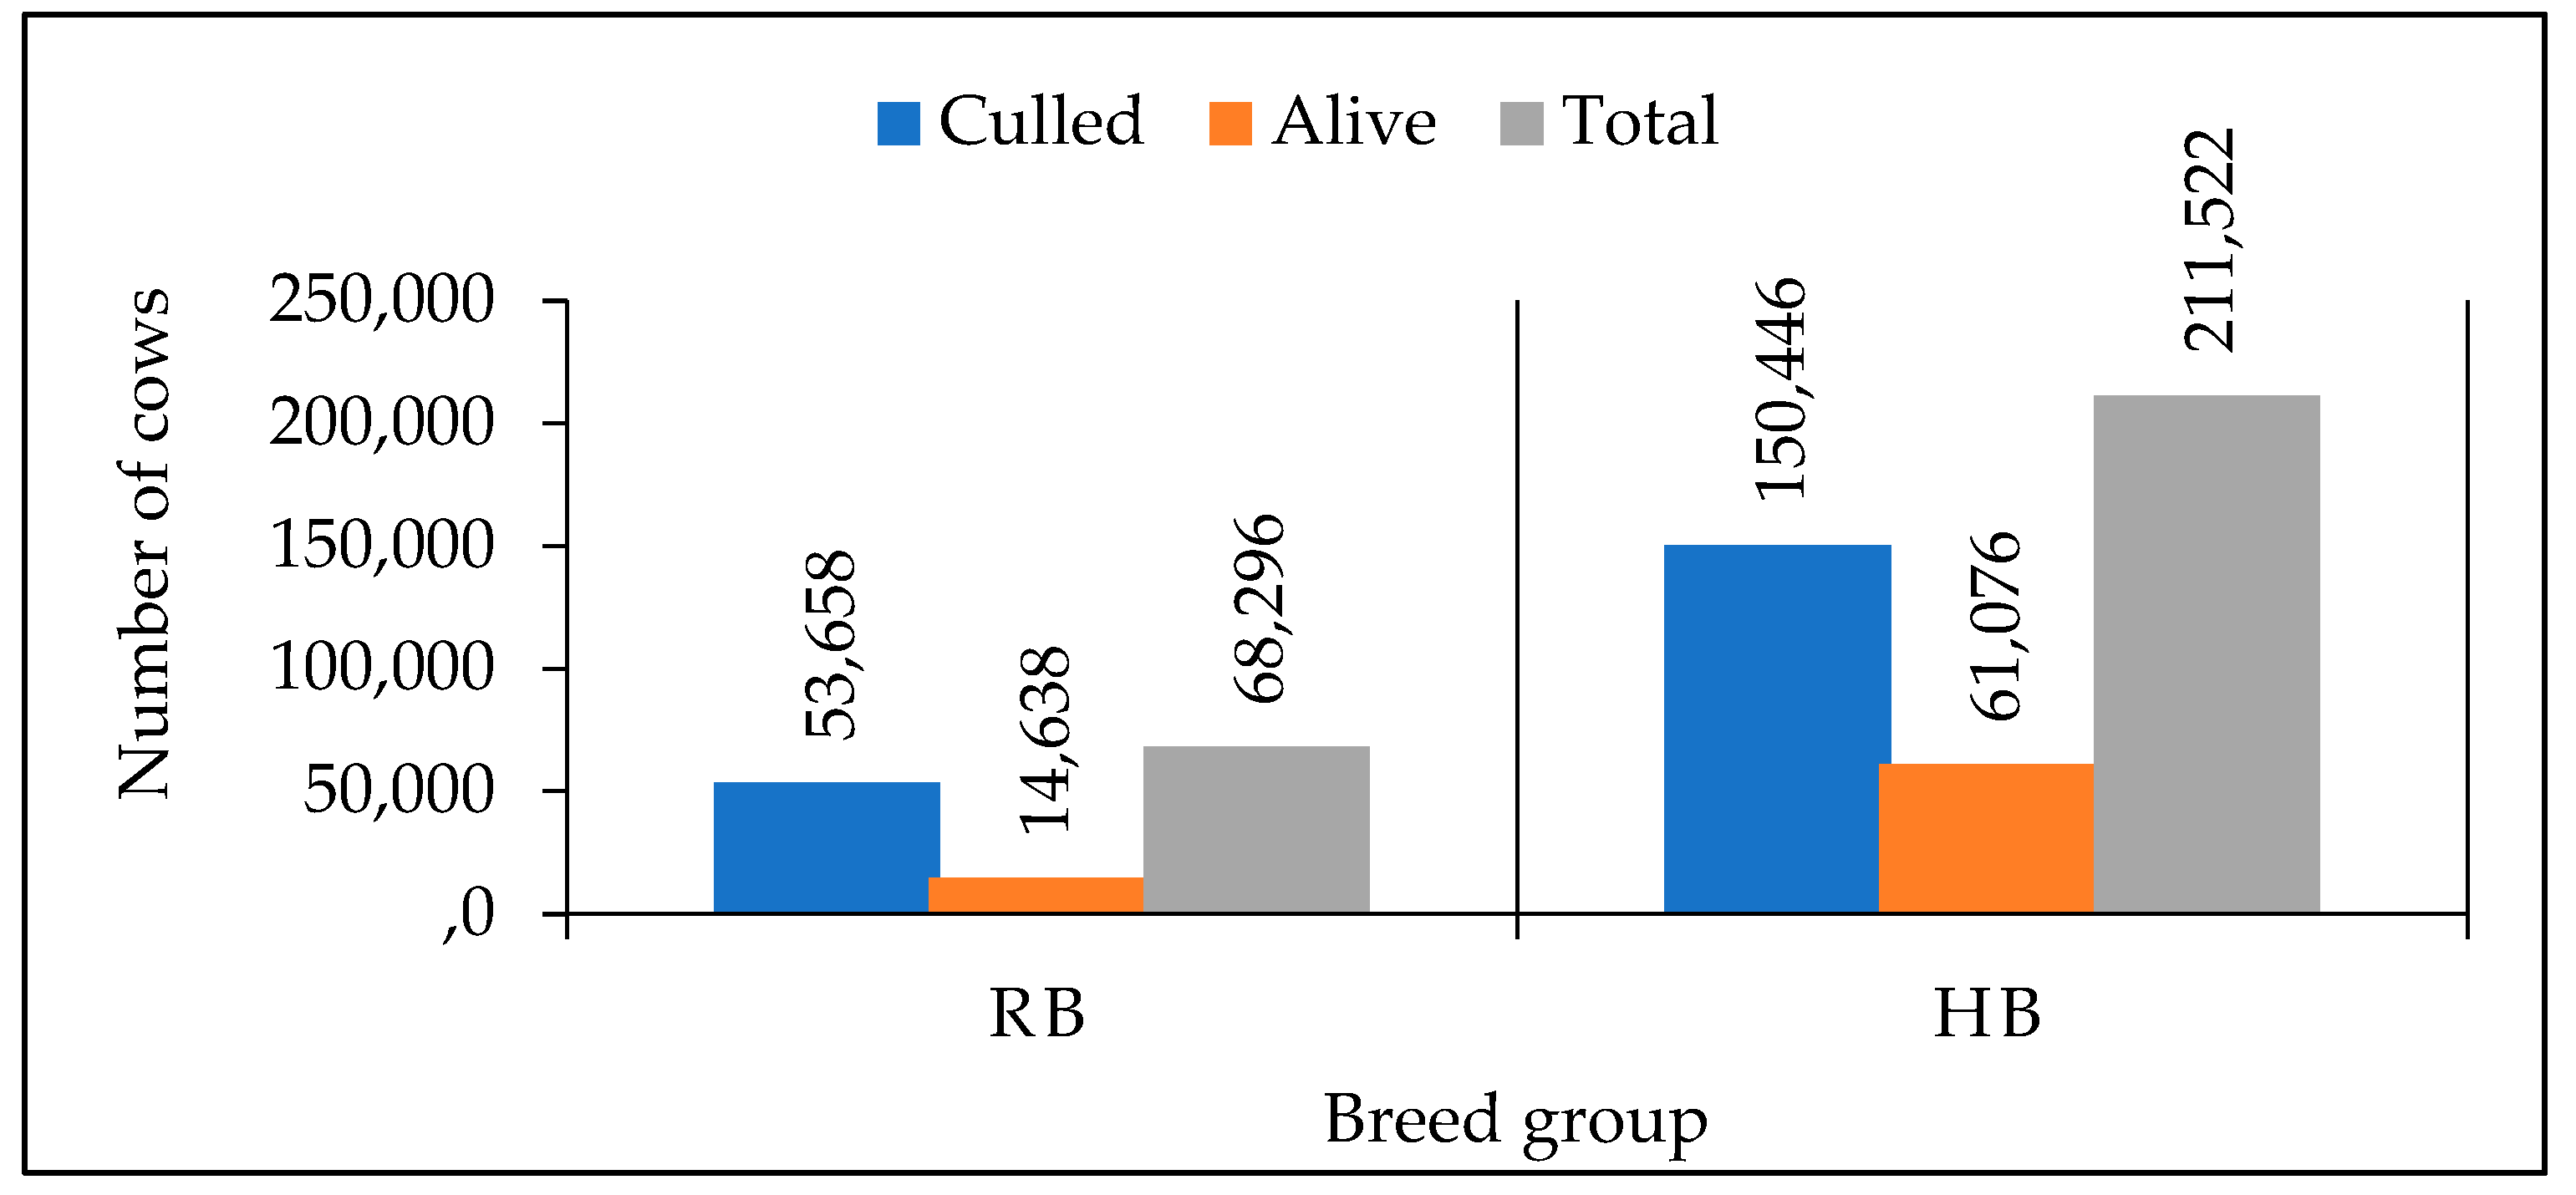
Figure 2.
Lifespan distribution of culled RB and HB cows.
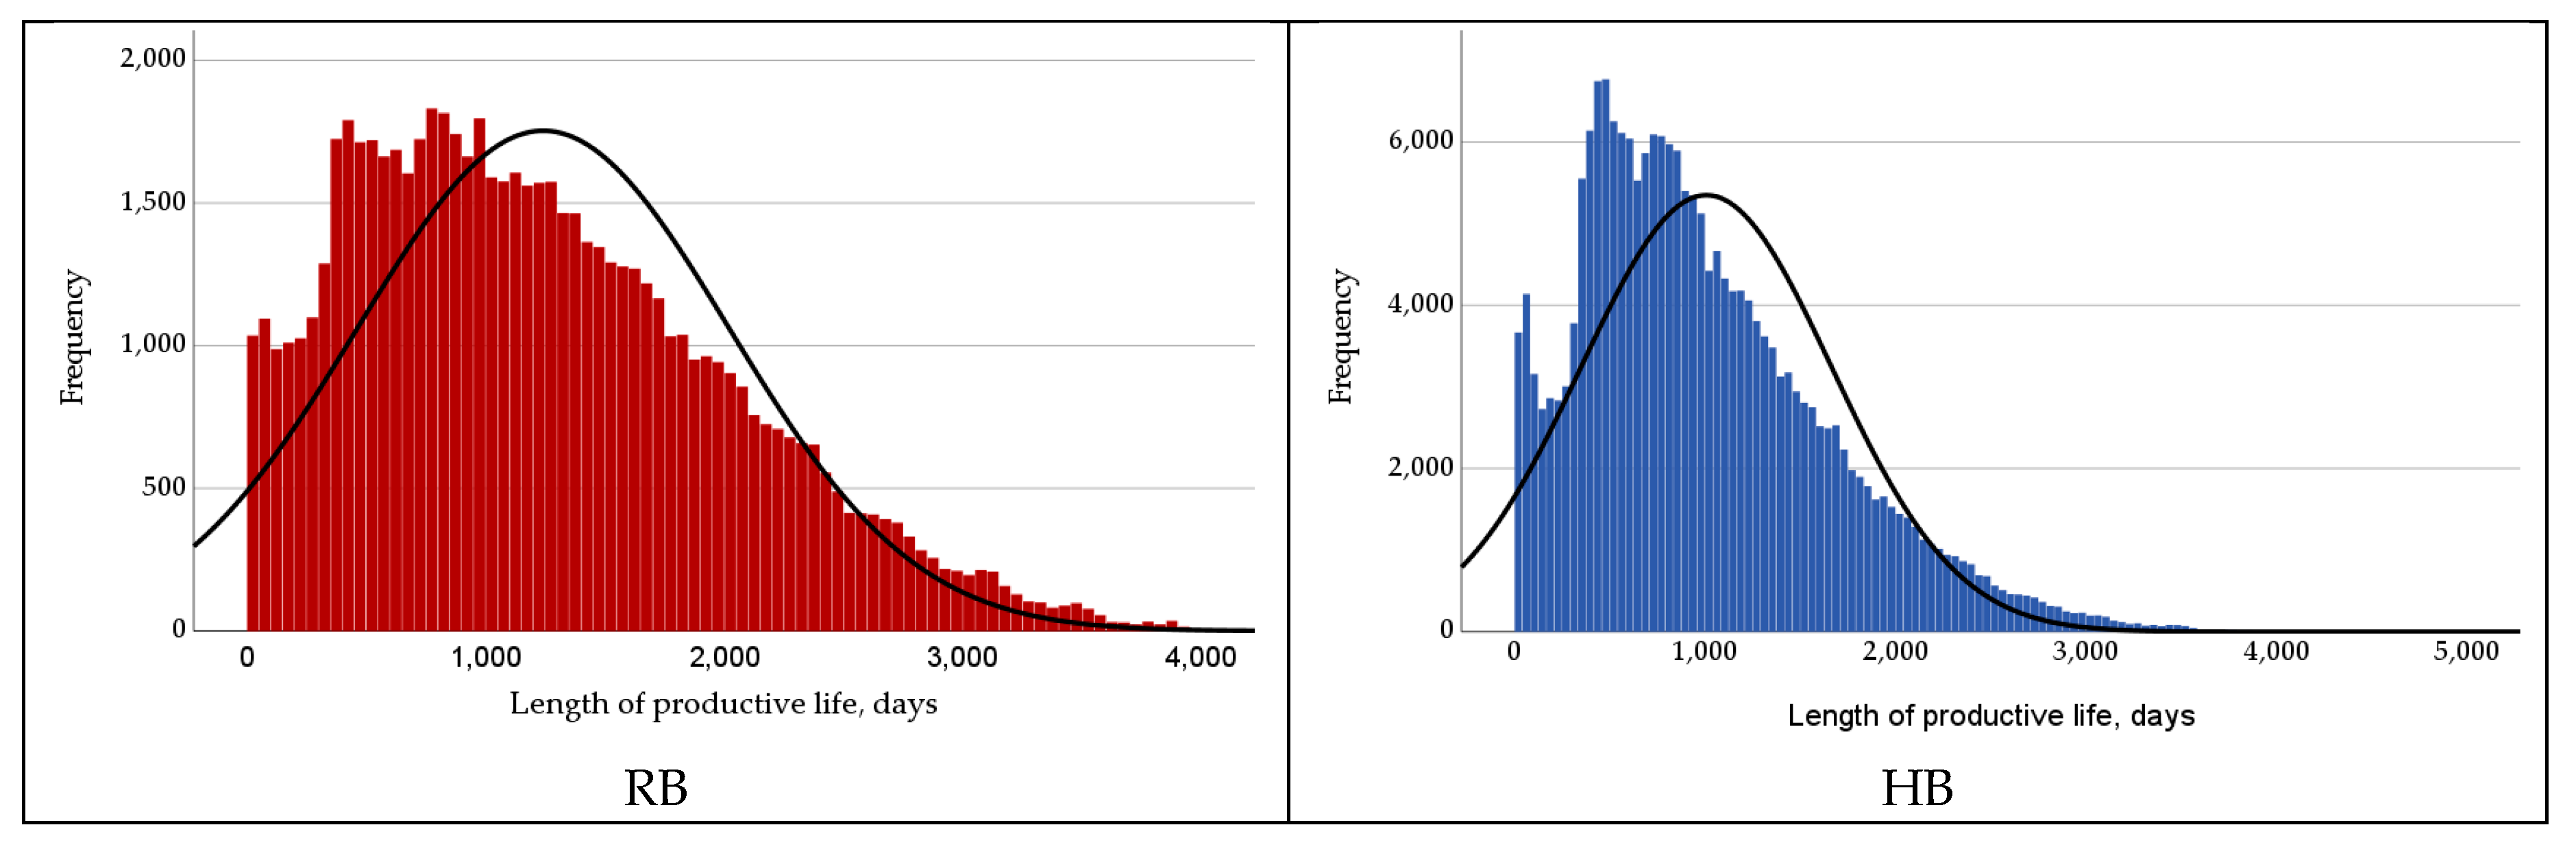

Table 1.
Longevity traits and their calculation principles.
| Abbreviation | Calculation principles |
| LS | Number of days from cows’ birth until culling |
| PL | Number of days from first calving until culling |
| MP | Total amount of energy corrected milk obtained during cows’ lifetime |
| MPD | ECM productivity calculated per one LS day |
| MPPD | ECM productivity calculated per one LP day |
Table 2.
The distribution of analyzed cows depending on studied factor.
| Factor | Groups | Number of culled (alive) cows in group | |
| RB | HB | ||
| Birth year | 2010 – 2012 | 30,661 (1,196) | 53,168 (1,300) |
| 2013 – 2015 | 16,613 (3,884) | 55,923 (8,529) | |
| 2016 – 2019 | 6,384 (9,558) | 41,355 (51,247) | |
| AFC, months | <22 | 2,743 (765) | 15,845 (7,574) |
| 22.1 – 24 | 10,241 (2,574) | 38,277 (15,006) | |
| 24.1 – 26 | 12,420 (3,108) | 35,442 (13,046) | |
| 26.1 – 28 | 9,649 (2,416) | 23,168 (8,496) | |
| 28.1 – 30 | 6,844 (1,761) | 14,349 (5,540) | |
| 30.1 – 32 | 4,550 (1,303) | 8,943 (3,776) | |
| >32 | 7,211 (2,720) | 14,422 (7,638) | |
| Farm size, number of cows per farm |
<20 | 27,736 (9,438) | 57,399 (28,101) |
| 21 – 100 | 14,698 (3,295) | 51,928 (20,536) | |
| 101 – 200 | 8,919 (1,615) | 23,647 (8,241) | |
| 201 – 500 | 2,162 (268) | 12,845 (3,246) | |
| > 500 | 143 (22) | 4,627 (952) | |
AFC – age at first calving, months.
Table 3.
The lifespan and length of productive life for culled and still producing cow groups.
| Status | RB | HB | ||||
| n | LS | PL | n | LS | PL | |
| Culled | 53,658 | 2,022.2±3.24a | 1,190.2±3.23a | 150,446 | 1,783.3±1.73b | 984.1±1.70b |
| Alive | 14,638 | 2,282.7±6.95a | 1,431.0±6.98a | 61,076 | 1,871.4±2.69b | 1,064.0±2.64b |
RB – red breed cows; HB – Holstein breed cows; LS – total lifespan, days; PL – productive life, days; Significant differences between breed groups noted with different superscripted letters (p<0.05).
Table 4.
The lifetime and life day milk productivity for culled and still producing cow groups.
| Status | RB | HB | ||||
| n | MPD | MPPD | n | MPD | MPPD | |
| Culled | 53,658 | 10.0±0.02a | 19.0±0.02a | 150,446 | 11.5±0.01b | 23.4±0.02b |
| Alive | 14,638 | 10.8±0.03a | 18.9±0.04a | 61,076 | 12.6±0.02b | 24.1±0.03b |
RB – red breed cows; HB – Holstein breed cows; MPD – milk productivity per life day, kg ECM; MPPD – milk productivity per productive life day kg ECM; Significant differences between breed groups noted with different superscripted letters (p<0.05).
Table 5.
LS and PL of culled RB and HB cows born between 2010 and 2019.
| Birth year | RB | HB | ||||
| n | LS | PL | n | LS | PL | |
| 2010 - 2012 | 30,661 | 2,184.4±4.57a | 1,348.4±4.56a | 53,168 | 2,049.4±3.30a | 1,229.0±3.27a |
| 2013 - 2015 | 16,613 | 1,931.4±4.96b | 1,101.6±4.96b | 55,923 | 1,812.7±2.56b | 1,011.4±2.54b |
| 2016 - 2019 | 6,384 | 1,479.9±5.14c | 660.5±5.09c | 41,355 | 1,401.4±1.97c | 632.2±1.93c |
RB – red breed cows; HB – Holstein breed cows; LS – total lifespan, days; PL – productive life, days; Significant differences between birth year within breed group noted with different superscripted letters (p<0.05).
Table 6.
MPD and MPPD (kg ECM) of culled RB and HB cows born from 2010 to 2019.
| Birth year | RB | HB | ||||
| n | MPD | MPPD | n | MPD | MPPD | |
| 2010 – 2012 | 30,661 | 10.3±0.03a | 18.5±0.03a | 53,168 | 11.6±0.02a | 21.5±0.03a |
| 2013 – 2015 | 16,613 | 10.0±0.04b | 19.2±0.04b | 55,923 | 11.9±0.02b | 23.5±0.03b |
| 2016 - 2019 | 6,384 | 8.3±0.05c | 20.4±0.07c | 41,355 | 10.7±0.03c | 25.9±0.03c |
RB – red breed cows; HB – Holstein breed cows; MPD – milk productivity per life day, kg ECM; MPPD – milk productivity per productive life day kg ECM; Significant differences between birth year groups noted with different superscripted letters (p<0.05).
Table 7.
LS and PL of culled RB and HB cows depending on their age at first calving (AFC).
| AFC | RB | HB | ||||||
| n | AFC, days | LS | PL | n | AFC, days | LS | PL | |
| < 22 | 2,743 | 648.2 | 1,951.9±15.54a | 1,303.7±15.55a | 15,845 | 648.5 | 1,576.8±4.97a | 928.3±4.97a |
| 22.1 – 24 | 10,241 | 708.6 | 1,953.2±7.60a | 1,244.6±7.60b | 38,277 | 706.3 | 1,684.6±3.33b | 978.4±3.33b |
| 24.1 – 26 | 12,420 | 763.7 | 1,978.8±6.73b | 1,215.1±6.73c | 35,442 | 762.6 | 1,765.6±3.52c | 1,002.9±3.52c |
| 26.1 – 28 | 9,649 | 822.8 | 2,014.7±7.59c | 1,191.9±7.60d | 23,168 | 822.1 | 1,825.2±4.39d | 1,003.1±4.39d |
| 28.1 – 30 | 6,844 | 882.5 | 2,022.1±8.78c | 1,139.5±8.77e | 14,349 | 882.1 | 1,876.1±5.55e | 994.0±5.54e |
| 30.1 – 32 | 4,550 | 942.5 | 2,074.6±10.75d | 1,132.1±10.74f | 8,943 | 941.9 | 1,931.9±7.12f | 990.0±7.11f |
| > 32 | 7,211 | 1,090.0 | 2,199.0±8.51e | 1,109.1±8.48g | 14,422 | 1,093.5 | 2,063.7±5.56g | 970.2±5.53g |
RB – red breed cows; HB – Holstein breed cows; LS – total lifespan, days; PL – productive life, days; Significant differences between different AFC groups noted with different superscripted letters (p<0.05).
Table 8.
MPD and MPPD of culled RB and HB cows depending on AFC.
| AFC | RB | HB | ||||
| n | MPD | MPPD | n | MPD | MPPD | |
| < 22 | 2,743 | 10.8±0.09a | 18.1±0.10a | 15,845 | 13.5±0.05a | 26.0±0.06a |
| 22.1 – 24 | 10,241 | 11.0±0.05a | 19.4±0.05b | 38,277 | 12.7±0.03b | 24.8±0.04b |
| 24.1 – 26 | 12,420 | 10.6±0.04ab | 19.2±0.05b | 35,442 | 11.8±0.03c | 23.5±0.03c |
| 26.1 – 28 | 9,649 | 10.1±0.05c | 19.3±0.05b | 23,168 | 11.0±0.03d | 22.9±0.04d |
| 28.1 – 30 | 6,844 | 9.5±0.05d | 19.0±0.06c | 14,349 | 10.3±0.04e | 22.2±0.05e |
| 30.1 – 32 | 4,550 | 9.0±0.06e | 18.6±0.08d | 8,943 | 9.6±0.05f | 21.6±0.07f |
| > 32 | 7,211 | 8.0±0.05f | 18.0±0.06a | 14,422 | 8.3±0.04g | 20.3±0.05g |
RB – red breed cows; HB – Holstein breed cows; MPD – milk productivity per life day, kg ECM; MPPD – milk productivity per productive life day, kg ECM; Significant differences between different AFC groups noted with different superscripted letters (p<0.05).
Table 9.
The influence of number of cows per farm on their LS and PL.
| Farm size | RB | HB | ||||
| n | LS | PL | n | LS | PL | |
| < 20 | 27,736 | 2,149.4±4.76a | 1,313.8±4.77a | 57,399 | 1,974.5±3.09a | 1,140.8±3.08a |
| 21 – 100 | 14,698 | 1,948.8±5.83b | 1,104.0±5.78b | 51,928 | 1,734.4±2.71b | 932.4±2.66b |
| 101 – 200 | 8,919 | 1,808.6±6.70c | 984.7±6.69c | 23,647 | 1,630.3±3.68c | 875.5±3.63c |
| 201 – 500 | 2,162 | 1,808.4±13.33c | 1,069.2±13.39b | 12,845 | 1,548.1±4.77d | 810.8±4.76d |
| > 500 | 143 | 1,452.9±35.95d | 710.3±35.16d | 4,627 | 1,394.9±6.58e | 655.8±6.51e |
RB – red breed cows; HB – Holstein breed cows; LS – total lifespan, days; PL – productive life, days; Significant differences between farm size groups noted with different superscripted letters (p<0.05).
Table 10.
MPD and MPPD of culled RB and HB cows depending on the number of animals per farm.
| Farm size | RB | HB | |||||
| n | MPD | MPPD | n | MPD | MPPD | ||
| < 20 | 27,736 | 9.4±0.02a | 17.1±0.03a | 57,399 | 9.9±0.02a | 19.2±0.02a | |
| 21 – 100 | 14,698 | 10.0±0.04b | 19.7±0.04b | 51,928 | 12.0±0.02b | 24.8±0.03b | |
| 101 – 200 | 8,919 | 11.1±0.05c | 22.6±0.05c | 23,647 | 13.8±0.04c | 28.2±0.04c | |
| 201 – 500 | 2,162 | 12.3±0.10d | 22.6±0.09c | 12,845 | 12.5±0.05d | 26.6±0.05d | |
| > 500 | 143 | 11.1±0.37e | 24.8±0.37d | 4,627 | 11.3±0.08e | 27.1±0.07e | |
RB – red breed cows; HB – Holstein breed cows; MPD – milk productivity per life day, kg ECM; MPPD – milk productivity per productive life day kg ECM; Significant differences between farm size groups noted with different superscripted letters (p<0.05).
Disclaimer/Publisher’s Note: The statements, opinions and data contained in all publications are solely those of the individual author(s) and contributor(s) and not of MDPI and/or the editor(s). MDPI and/or the editor(s) disclaim responsibility for any injury to people or property resulting from any ideas, methods, instructions or products referred to in the content. |
© 2026 by the authors. Licensee MDPI, Basel, Switzerland. This article is an open access article distributed under the terms and conditions of the Creative Commons Attribution (CC BY) license (http://creativecommons.org/licenses/by/4.0/).
Copyright: This open access article is published under a Creative Commons CC BY 4.0 license, which permit the free download, distribution, and reuse, provided that the author and preprint are cited in any reuse.


