Submitted:
13 February 2026
Posted:
13 February 2026
You are already at the latest version
Abstract
Oropouche fever (OF), caused by Oropouche virus (OROV), has expanded beyond its Amazonian range into Minas Gerais (MG), Brazil, raising concern about transmission in extra‑Amazonian Atlantic Forest landscapes. Critical gaps persist regarding Culicoides vector communities, anthropophily, and climate-sensitive transmission risk in these newly affected regions. We conducted targeted entomological surveys in five MG outbreak communities using CDC light traps and Protected Human Attraction (PHA) to characterize Culicoides composition. Females underwent RT-qPCR for OROV (n = 819) and physiological assessment (n=312). We developed an entomological alert framework that integrates blood-fed abundance, minimum infection rate (MIR) upper confidence bounds, and environmental drivers via generalized additive mixed models, which explained 68% of the variability in Culicoides abundance and the alert index across communities. We collected 1,171 Culicoides representing five species, C. leopoldoi (79.1%) and the primary vector C. paraensis (20.3%) predominated. C. paraensis was documented for the first time in all five outbreak areas and dominated PHA captures (90%), confirming anthropophily. Although no specimens tested OROV-positive (consistent with expected field infection rates of 0.01–1%), MIR upper bounds reached 132/1,000 in low-sample settings and humidity and temperature strongly modulated abundance. This operational baseline and alert index transform virologically negative, sparse surveillance data into prioritized targets for in-tensified sampling and vector control during early, low‑prevalence phases, when con-tainment of OROV’s extra‑Amazonian spread is still achievable.
Keywords:
arbovirus
; Culicoides paraensis
; midge
; entomological surveillance
; Oropouche
; vectors
1. Introduction
Oropouche virus (OROV) has recently emerged as a significant public health concern in the Americas, expanding beyond its historical Amazonian range into new regions and affecting previously non-endemic populations [1,2,3]. In Brazil, this expansion includes the Northeast, Central-West, Southeast, and Southern regions, with increasing reports of autochthonous Oropouche fever (OF) cases and outbreaks in densely populated areas [4]. The expansion of OROV beyond the Amazon has been linked to broader eco-epidemiological pressures at the human-wildlife interface, including environmental change, landscape fragmentation, urbanization, and increased contact among vectors, wildlife reservoirs, and human populations [5,6]. These eco-epidemiological pressures create conditions that favor viral adaptation by increasing contact among vectors, reservoir hosts, and susceptible human populations, exposing viral populations to novel selective pressures in non-endemic environments, and facilitating genomic reassortment among co-circulating OROV lineages, as recently documented [1,2]. Brazilian OROV cases coincide with the first Caribbean outbreak in decades in Cuba, as well as recent outbreaks in Peru, suggesting enhanced transmission capacity [3,7].
Critically, ecological changes, including vector range expansion, shifts in community composition, or increased anthropophilic behavior, often precede detectable viral circulation by months to years, functioning as sensitive early-warning indicators of emerging transmission risk. Establishing baseline entomological data during the initial phases of geographic expansion is therefore essential for: (i) identifying competent vector species present in affected areas; (ii) quantifying vector-human contact rates; (iii) detecting viral circulation through molecular surveillance; and (iv) guiding evidence-based vector control interventions [8,9].
Oropouche fever is an acute febrile disease caused by OROV, first isolated in 1955 [10,11,12]. Over 29,000 confirmed cases occurred across the Americas since 2024 [3,4]. OROV transmission occurs through two epidemiologically distinct but potentially overlapping cycles: an urban cycle, in which humans serve as the primary amplification hosts and C. paraensis acts as the principal vector, and a sylvatic cycle involving non-human primates, sloths, and other arboreal mammals, maintained by poorly characterized Culicoides species [13,14,15,16,17]. Biting midges of the genus Culicoides Latreille, 1809 (Diptera: Ceratopogonidae) are small hematophagous insects widely distributed across tropical and temperate regions, occupying natural, rural, peri-urban, and increasingly anthropized environments [8,16,17,18]. Females of many species require blood meals for oogenesis and feed on a broad range of vertebrate hosts, placing several Culicoides species among the most important vectors of pathogens of medical and veterinary relevance worldwide [15,19]. In addition to OROV, Culicoides species are responsible for the transmission of economically and epidemiologically significant viruses such as Bluetongue virus and Epizootic Hemorrhagic Disease virus, whose emergence has been strongly linked to environmental change and vector range expansion [20,21,22].
Despite the growing burden of OF outside the Amazon region, Culicoides fauna and vector ecology remain critically under-characterized across large areas of Brazil, particularly in regions that were historically considered non-endemic [16,20]. In southeastern Brazil, the state of Minas Gerais (MG) has reported its first autochthonous OF cases only recently, with a sharp increase in notifications since 2024, particularly in the health regions of Cataguases, Ubá, and Teófilo Otoni [4,23]. Notably, these transmission events are occurring within Atlantic Forest landscapes, which differ markedly from Amazonian ecosystems in terms of climate, fragmentation, biodiversity, and human land use [24,25,26]. This ecological shift raises critical questions regarding which Culicoides species are sustaining transmission, how vector–host interactions are structured in these environments, and whether local ecological conditions may favor the establishment of new transmission cycles.
We conducted targeted entomological surveys in MG municipalities with confirmed autochthonous cases to characterize Culicoides composition/abundance, quantify host contact via physiological status, estimate entomological transmission potential using minimum infection rate (MIR) metrics and an exploratory entomological alert index, detect OROV via RT-qPCR, and examine environmental drivers of abundance, thereby introducing a transferable framework for uncertainty-weighted vector surveillance in low-prevalence settings. By integrating surveillance with ecological modeling and uncertainty-weighted entomological alert frameworks, we provide the first comprehensive characterization of Culicoides communities in extra-Amazonian OROV outbreak zones, linking vector structure and environment to emerging transmission risk. Even absent virus-positive vectors (expected in low-prevalence arbovirus ecology), these data establish baseline information for monitoring trends, detecting epidemic signals, prioritizing resources, and informing control during early expansion phases when interventions work best, and when integrating entomological alerts with routine febrile-illness surveillance is most feasible.
2. Materials and Methods
2.1. Study Area
Since early 2024, autochthonous OROV cases have been confirmed in municipalities across the state of Minas Gerais, Brazil. In response, entomological collections were conducted at five sampling locations, hereafter referred to as ecological communities (A–E), based on the spatial dispersion of Culicoides midges, defined as spatial clusters with a radius of at least 5 km. These communities are located in three different health regions (Table 1, Figure 1) and were selected based on previous and recently confirmed human OROV cases, representing operational ecological clusters used for entomological surveillance and analysis rather than administrative units. All communities are located in the Atlantic Forest biome (Figure 1), characterized by a tropical forest heavily impacted by anthropogenic activities, with extensive deforestation and land conversion to pastures and agricultural crops [24,25,26,27]. The climate in these regions is classified as Cwa (humid subtropical with dry winters and hot summers) for communities A-D, and Aw (tropical savanna with dry winters) for community E, respectively, according to the Köppen climate classification system, with variations in precipitation and mean annual temperature (Table 1) [27]. The geographic coordinates (latitude and longitude) of the centroid of each ecological community (A–E) are provided in Table S1 and were used for spatial analyses and mapping. The spatial distribution of these communities across health regions, along with reported human OROV cases in 2025 and their location within the Atlantic Forest biome, is shown in Figure S1.
These five communities were selected for intensive sampling based on confirmed human OROV case clustering, accessibility for repeated sampling, presence of diverse habitat types (peridomestic, agricultural, forest edge), and representation of the primary affected health regions. This strategic sampling design prioritized outbreak-associated areas to maximize probability of: (i) detecting competent vectors; (ii) capturing vectors with recent blood meals from human hosts; and (iii) identifying virus-positive specimens if present. By focusing surveillance effort on locations with confirmed human transmission, this approach balances logistical feasibility with epidemiological relevance.
2.2. Entomological Sampling
Five ecological communities (A-E), distributed across three health regions of Minas Gerais, were sampled for entomological analyses between March and May 2025, corresponding to the peak months of reported human OROV cases (Table S1, Figure S1). Within each community, sampling sites were selected according to the spatial distribution of confirmed OF cases. At each sampling site, midges were collected using two CDC light traps positioned 1.5 m above the ground, one placed in the peridomicile and the other in the extradomicile. Peridomicile environments were defined as areas immediately surrounding human dwellings that combine frequent human activity with potential Culicoides breeding and resting sites, including animal enclosures, shaded vegetation, and moist organic substrates. Extradomicile sites were defined as areas located farther from human dwellings, with reduced direct human activity, typically at the interface between households and adjacent vegetated or semi-natural environments. Traps were installed in sites favorable to Culicoides resting and breeding, such as banana plants and animal enclosures (e.g., chicken coops and pigsties). As an attractant, CO2 was produced through fermentation by mixing 500 mL of sugarcane molasses with 2 L of water and adding dry baker’s yeast (approximately one 50 mL Falcon tube), thereby ensuring alcoholic fermentation and continuous CO2 release [28]. Traps operated for 15 h per night (from 16:00 to 07:00) over three consecutive nights, resulting in a total sampling effort of 90 h per sampling point (15 h × 3 nights × 2 traps). Communities B, C, D, and E each had one sampling point, while community A had two sampling points. CDC light traps represent the standard approach for passive Culicoides surveillance globally and are particularly effective for host-seeking females in peridomestic environments. However, species-specific differences in attraction to light and CO2 sources can lead to collection bias, potentially underrepresenting anthropophilic species that preferentially seek human hosts through chemosensory cues beyond CO2 alone.
Additionally, from 15:00 to 18:00, collections were conducted using hand nets and oral aspirators through the Protected Human Attraction (PHA) method. The PHA method was therefore incorporated to complement CDC trapping and specifically target anthropophilic Culicoides. PHA involves trained collectors using hand-nets to capture host-seeking midges attracted to human collectors wearing protective equipment, thereby reflecting anthropophilic behavior, the most epidemiologically relevant parameter for human disease transmission. The dual-method approach employed here thus balances community-level diversity characterization (CDC traps) with targeted surveillance of the primary epidemiological threat (C. paraensis via PHA), addressing the limitations of single-method approaches.
After each trapping night and PHA session, collecting cages were labeled and transported to the field laboratory, where specimens were immobilized by refrigeration (4 °C) and sorted under a stereomicroscope. Culicoides specimens were then stored using two preservation methods prior to shipment to the reference laboratory: a subset of specimens was preserved in 70% ethanol for slide mounting, physiological condition assessment, and taxonomic identification, whereas the remaining specimens were cryopreserved in liquid nitrogen (−196 °C) for molecular analyses. Methods and protocols were previously approved by Brazilian Ministry of the Environment (SISBIO nº 95162-1).
2.3. Physiological State and Taxonomic Identification
Culicoides specimens preserved in 70% ethanol were examined for physiological status under a stereomicroscope and classified into four categories: nulliparous (females that had not yet taken a blood meal); engorged (females with abdomens filled with freshly ingested blood); gravid (females with visible eggs in the abdomen); and parous (females that had previously taken a blood meal and laid eggs, as indicated by abdominal and ovarian pigmentation), according to the criteria of Dyce (1969) [29].
Following physiological classification, taxonomic identification was performed using standardized protocols for specimen clarification, slide mounting, and morphological examination, as described by Wirth & Marston [30] and complemented by the Operational Document for the Identification of Culicoides Latreille (Diptera: Ceratopogonidae), issued by the Pan American Health Organization [31].
This subset was reserved for slide mounting and detailed morphological identification and was therefore unsuitable for RT-qPCR analysis.
2.4. RNA Extraction and OROV Molecular Diagnosis
Culicoides specimens intended for molecular analysis were removed from liquid nitrogen and immediately transferred to a cold table at −20 °C to prevent RNA degradation [24]. Specimens were preliminarily identified to the lowest possible taxonomic level based on wing morphology, following the Operational Document for the Identification of Culicoides Latreille (Diptera: Ceratopogonidae) [31].
Females were then grouped into pools of up to 25 individuals according to species, collection site, and engorged/non-engorged condition. Each pool was placed in a 1.5 mL microtube containing sterile beads and 300 µL of L-15 culture medium supplemented with 20% fetal bovine serum, 0.5% non-essential amino acids, 1% penicillin, 0.1% gentamicin, and 0.1% fungizone. Samples were homogenized for 45 s at 8000 rpm using a Loccus L-Beader 24® homogenizer, followed by centrifugation at 14,000 rpm for 8 min at 4 °C. A 140 µL aliquot of the supernatant was used for RNA extraction with the QIAamp Viral RNA Mini Kit (Qiagen®), according to the manufacturer’s instructions. RNA was eluted in 50 µL of buffer AVE and stored at −80 °C until analyses.
RT-qPCR assays for OROV detection were performed on a QuantStudio 3 Real-Time PCR System (Applied Biosystems, USA) using the GoTaq® 1-Step RT-qPCR System (Promega, Madison, WI, USA) following procedures previously described by Naveca et al. (2017) [32]. Briefly, the assay targets the S-segment of OROV using the following primers and probe: OROV-F: 5′-TCCGGAGGCAGCATATGTG-3′; OROV-R: 5′-ACAACACCAGCATTGAGCACTT-3′, OROV-P: 5′-FAM-CATTTGAAGCTAGATACGG-3′-BHQ1. The thermal cycling conditions consisted of reverse transcription at 50 °C for 20 min, initial denaturation at 95 °C for 2 min, followed by 45 cycles of 95 °C for 15 s and 60 °C for 1 min.
Each RT-qPCR run included a positive control consisting of RNA from a previously confirmed OROV sample, and a no-template negative control to verify the absence of contamination. All amplification reactions were performed in duplicate, and amplification curves were analyzed using the QuantStudio Design and Analysis Software.
Molecular screening for OROV in field-collected vectors serves multiple surveillance objectives: (i) confirming that competent vectors are not only present but also potentially infected; (ii) estimating infection prevalence (minimum infection rate) to quantify transmission intensity; (iii) identifying geographic hotspots where vector infection rates are elevated; and (iv) potentially recovering viral genomic sequences for phylogenetic analysis.
2.5. Statistical Analysis
2.5.1. Minimum Infection Rate Estimation
Estimating infection prevalence in vector populations is fundamental to arbovirus surveillance, yet poses substantial methodological challenges when infection rates are low and individual testing is resource-prohibitive. The Minimum Infection Rate (MIR) provides a conservative estimate of infection prevalence by assuming that each positive pool contains exactly one infected individual (thus representing a lower bound on true prevalence). In the present study, with zero positive pools detected, we calculated MIR estimates with 95% confidence intervals using exact Poisson methods to quantify the uncertainty associated with non-detection. Critically, the upper confidence bound of the MIR represents a statistically plausible maximum infection rate compatible with our sampling, enabling risk assessment even in absence of positive detections and facilitating comparison across communities with different sample sizes. MIR were calculated to estimate the frequency of OROV infection in Culicoides spp. The MIR was defined as the number of positive individuals divided by the total number of tested individuals, expressed per 1000 specimens. MIR calculations were performed separately for each vector species and community, as well as overall by species irrespective of community. Individual midges tested by RT-qPCR were grouped by species and community, and the total number tested and number of positives were determined. Exact Poisson confidence intervals (95%) were calculated for each group using the number of positive detections and the total number tested. MIR values and their corresponding lower and upper 95% confidence limits were derived from the Poisson rate estimates and multiplied by 1000 to express infection rates per 1000 individuals. Overall MIR estimates for each species were calculated using the same approach, pooling data across all communities. MIR estimates were reported alongside their 95% confidence intervals to account for uncertainty associated with low or zero positive detections.
2.5.2. Uncertainty-Weighted Entomological Alert Index
We derived a community-level entomological alert index to summarize, in a single comparative metric, (i) the intensity of human–vector contact by C. paraensis and (ii) the statistical uncertainty surrounding OROV infection prevalence in this vector. Only females with evidence of at least one previous blood meal (engorged, gravid, or parous) were included, as these individuals represent vectors with confirmed host contact and therefore potential exposure to infection. For each community, we first standardized blood-fed C. paraensis abundance by dividing the total number of blood-fed females captured by PHA by the number of PHA collectors, yielding the number of blood-fed vectors per sampling unit.
To incorporate infection-prevalence uncertainty, this effort-standardized blood-fed abundance was multiplied by the upper 95% confidence limit of the MIR for C. paraensis in that community, estimated from pooled RT-qPCR results as described in Section 2.5.1. Because no pools tested positive, the MIR upper bound represents the maximum infection rate statistically compatible with our sampling effort rather than a point estimate of true prevalence. The resulting product therefore reflects an uncertainty-weighted entomological alert score, which increases when human-biting vector abundance is high and/or when the plausible range of undetected infection remains wide.
This index was calculated separately for each community and then linearly rescaled to a 0-1 range using min-max normalization, where 0 corresponds to the lowest observed score and 1 to the highest, to facilitate relative comparison among communities. The alert index is explicitly intended as an exploratory prioritization tool and not as a quantitative estimator of absolute transmission risk or human infection probability. This uncertainty-weighted alert index extends conventional MIR reporting by explicitly incorporating upper confidence limits into a community-level prioritization metric for early-phase arbovirus surveillance.
Because all MIR point estimates were zero, the alert index is explicitly intended as an exploratory prioritization tool and not as a quantitative estimator of absolute transmission risk or human infection probability. This uncertainty-weighted alert index extends conventional MIR reporting by explicitly incorporating upper confidence limits into a community-level prioritization metric for early-phase arbovirus surveillance.
2.5.3. Standardizing Vector Abundance and Sampling Effort
Vector abundance was standardized to account for differences in sampling effort among collection events. Sampling effort was defined as the product of the number of sampling days, the number of collectors, and the number of sampling hours per day.
For each sampling event, the total number of individuals collected was calculated and paired with the total sampling effort. To correct abundance estimates for unequal effort, a generalized linear mixed model (GLMM) with a negative binomial error distribution was fitted using the number of collected individuals as the response variable. Species, community, and collection method (CDC and PHA) were included as fixed effects, and the logarithm of total sampling effort was incorporated as an offset term. This framework accounts for overdispersion while standardizing abundance to a common sampling effort. Model-based predictions on the response scale were generated to estimate effort-corrected abundance for each sampling event. To facilitate comparisons of relative vector composition within communities, predicted abundances were further standardized by dividing each event’s predicted value by the sum of predicted abundances within the corresponding community. Using the glmmTMB package in R [33], we obtained a relative-abundance metric that represents the proportional contribution of each species and sampling event to the total vector abundance within each community.
2.5.4. Vector Community Diversity
Vector community diversity was quantified using the Shannon diversity index (H′), which incorporates both species richness and evenness. Effort-corrected and standardized abundance estimates were used to minimize the influence of unequal sampling effort across communities. For each community, standardized abundance values were summed by species to obtain total relative abundance per species. Missing species within a community were assigned a value of zero, indicating absence. Shannon diversity indices were calculated for each community using the vegan package in R [34], applying the Shannon entropy formula to standardized relative abundance values. An H′ value of zero indicates a community composed of a single species, while higher values reflect greater diversity resulting from higher species richness and/or more even species distributions.
2.5.5. Environmental Effect on Vector Abundance
Environmental data were compiled to investigate the relationship between climatic variables and the standardized abundance of Culicoides midges across communities in Minas Gerais, Brazil, during the first half of 2025, corresponding to the entomological sampling period. Weekly environmental data were used for precipitation (mean, median, minimum, maximum, and sum), air temperature at 2 m (mean, median, minimum, maximum), and air humidity (mean, median, minimum, maximum). Air humidity was represented by vapor pressure (hPa), derived from ERA5 reanalysis, which reflects atmospheric moisture availability. These climatic data were obtained from the Copernicus Climate Change Service (C3S) [35] and filtered to include four previous weeks of sampling dates.
To align temporal scales, the environmental variables were lagged up to four weeks prior to each midge sampling event. Specifically, for each sampling week, environmental data from one to four preceding weeks were matched, producing lagged predictors for each variable because these predictors can impact midge abundance. All environmental predictors were scaled to a mean of 0 and unit variance prior to modeling.
Given the high dimensionality and collinearity of environmental predictors, principal component analysis (PCA) was conducted separately for air humidity, precipitation, and temperature variables. The first principal components (PCs) from each environmental type, capturing the majority of variance, were retained to investigate the influence of environmental variables on standardized midge abundance. We implemented a generalized additive mixed model (GAMM) using the mgcv package in R. Principal components (PC) derived from precipitation (PC1_rain), air humidity (PC1_humidity), and temperature (PC1_temperature) data were used as predictors to reduce multicollinearity and summarize weekly environmental variation. The model included random intercepts for both communities and species to account for repeated measures and species-specific effects. Smooth functions with a low degree of freedom (k = 5) were applied to each PC to allow potential nonlinear relationships, while avoiding overfitting given the limited variation in the data. The model formula was specified as:
3. Results
3.1. Entomological Results
Across the five outbreak-associated communities sampled we collected a total of 1171 Culicoides specimens, representing five species (Figure 2). This established the first comprehensive characterization of Culicoides community composition in Minas Gerais areas experiencing autochthonous OROV transmission. This assemblage includes C. paraensis, the primary vector implicated in urban OROV transmission cycles throughout the Amazon basin, whose presence in all sampled communities (n = 5) confirms that a competent vector is established in extra-Amazonian outbreak zones. The most abundant species was C. leopoldoi, with 926 individuals (79.08%), followed by C. paraensis, with 238 individuals (20.32%). The remaining species were recorded at much lower frequencies: C. pusillus (n = 5; 0.43%), C. foxi (n = 1; 0.09%), and C. limai (n = 1; 0.09%).
The highest abundance of specimens was observed in community E (n = 865; 73.87%), followed by community B (n = 215; 18.36%) and community A (n = 68; 5.81%), and community C (n = 13; 1.11%) and community D (n = 10; 0.85%) (Table 2).
3.2. OROV Detection, Physiological Status Assessment, and Capture Method Comparisons
Of the total collected specimens, 819 individuals (69.8%) were screened for OROV by RT-qPCR, organized into 42 pools. These pools included 607 C. leopoldoi (64.7% of all individuals of this species) and 212 C. paraensis (88.7%) (Table 2). The remaining specimens were preserved for taxonomic confirmation. All pools tested negative for OROV, despite the inclusion of positive and negative controls in every assay, confirming the reliability of the RT-qPCR results. No OROV RNA was detected in any species or community at the time of sampling.
The physiological status of 312 female Culicoides was assessed using abdominal and ovarian pigmentation (Figure 3, Table S2). Most examined females (228; 73.1%) had already taken at least one blood meal, as evidenced by engorged, gravid or parous classification, indicating widespread prior contact with vertebrate hosts and potential exposure to OROV infection (Figure 3, Table S2).
For C. leopoldoi, which was the most abundant species, a high proportion of females in community E were gravid (35.9%; n = 84), followed by parous (23.9%; n = 56) and engorged individuals (9.4%; n = 22) (Table S2). In communities A and B, gravid and parous females also predominated among the relatively smaller numbers of examined C. leopoldoi, and similar patterns of post-blood-meal females were observed in the C and D communities (Table S2). For C. paraensis, the physiological assessment was limited because most specimens from communities A, B, and E were used for molecular analysis. Nevertheless, 22 of the 26 ethanol-preserved specimens (84.6%) were classified as engorged or parous, again indicating frequent blood feeding and prior host contact (Table S2).
When capture methods were compared, the PHA approach proved markedly more efficient than CDC light traps for sampling C. paraensis, accounting for 215 individuals (90.0%) of the 239 collected. In contrast, all C. leopoldoi specimens were obtained exclusively with CDC light traps (Figure 4). Together, these results show that, despite the lack of detectable OROV RNA in tested pools, competent vectors are present in outbreak areas, actively blood-feeding, and exhibiting pronounced anthropophilic behavior, thereby fulfilling key ecological prerequisites for OROV transmission.
3.3. Minimum Infection Rate of OROV in Culicoides spp.
Minimum infection rate analysis was conducted on 819 Culicoides individuals representing two species (C. leopoldoi and C. paraensis) across 42 pools. This yielded MIR point estimates of zero for all species-community combinations, a finding that, while negative, generates informative upper confidence bounds that quantify the uncertainty associated with non-detection (Table 3). These upper confidence limits represent the maximum infection prevalence statistically compatible with our sampling effort and enable comparative risk assessment across communities despite zero positive detections.
For C. paraensis, the upper MIR limit was highest in community B (132.0 per 1000), followed by community A (73.8 per 1000) and community E (27.5 per 1000). For C. leopoldoi, upper MIR limits were lower overall, ranging from 7.9 per 1000 in community E to 26.3 per 1000 in community B. When data were pooled across communities, the upper MIR limits were 17.4 per 1000 for C. paraensis and 6.1 per 1000 for C. leopoldoi (Table 3).
These results indicate no evidence of active OROV infection in the tested populations. However, the upper confidence bounds suggest low but non-negligible potential OROV infection levels, consistent with the expected ecology of OROV in vector populations characterized by rare or sporadic transmission.
These upper MIR bounds merit interpretation as indicators of relative uncertainty rather than infection prevalence estimates. Communities with smaller sample sizes (e.g., community A: n = 50 C. paraensis tested) exhibit wider confidence intervals and consequently higher upper bounds (73.8 per 1000), reflecting greater uncertainty about true infection prevalence. Conversely, communities with larger samples (e.g., community E: n = 134 C. paraensis) generate narrower intervals and lower upper bounds (27.5 per 1000), providing greater certainty that infection rates, if present, are low. For longitudinal surveillance purposes, repeated sampling with similar effort would enable detection of MIR increases above these baseline thresholds, functioning as a sentinel system for epidemic intensification. These MIR upper bounds provide a baseline against which future surveillance can detect increases in vector infection.
3.4. Uncertainty-Weighted Entomological Alert Index
Because no pools tested positive for OROV, all MIR point estimates were zero and the index reflects uncertainty-weighted entomological prioritization rather than measured differences in infection prevalence among communities. The index combines (i) the number of blood-fed C. paraensis captured per PHA collector (a proxy for human-vector contact) with (ii) the upper 95% confidence limit of the MIR (a measure of how high infection prevalence could plausibly be given the available data). This uncertainty-weighted alert index extends conventional MIR-based analyses by combining effort-standardized human-biting C. paraensis abundance with MIR upper confidence limits into a single community-level metric that prioritizes locations for early-phase arbovirus surveillance.
Raw alert scores (blood-fed C. paraensis per collector × MIR upper 95% CI) varied across the three communities in which both components could be calculated (A, B, and E). Community A showed the highest alert score (1291), driven by a moderate density of blood-fed C. paraensis (n = 35 across two collectors) combined with a wide MIR upper bound of 73.8 per 1000, reflecting limited sample size and therefore substantial uncertainty about true infection prevalence. Community B had an intermediate alert score (856) with fewer blood-fed vectors (n = 13 across two collectors) but the widest MIR upper bound (132.0 per 1000), again indicating high uncertainty. Community E, despite having the largest number of blood-fed C. paraensis (n = 44 across two collectors), exhibited the lowest alert score (606) because the MIR upper bound was narrow (27.5 per 1000), suggesting that if infection is present it is likely at low prevalence. After min-max normalization, the alert index ranged from 1.00 (community A) to 0.00 (community E), with community B showing an intermediate value of 0.37 (Table 4). Interpreted operationally, higher index values identify communities where anthropophilic vectors are present and where infection prevalence remains weakly constrained by current sampling, highlighting locations where additional entomovirological surveillance would be most informative. The index is therefore best viewed as a comparative, uncertainty-weighted tool for prioritizing follow-up sampling rather than as a direct estimate of absolute OROV transmission risk to humans.
3.5. Vector Community Diversity
After accounting for sampling effort, model-based predictions revealed differences in vector abundance among species, communities, and collection methods. Shannon diversity indices varied among communities, indicating heterogeneity in vector community composition (Table 5). The highest diversity was observed in community D (H′ = 0.54), followed by community A (H′ = 0.51). Intermediate diversity levels were recorded in community B (H′ = 0.45) and community E (H′ = 0.44). In contrast, community C exhibited no detectable diversity (H′ = 0.00), consistent with the presence of a single vector species or strong dominance by a single Culicoides species.
Overall, these results indicate moderate variation in vector community diversity across the study area, with some communities characterized by more balanced species assemblages and others dominated by a single species. The use of effort-corrected abundance estimates ensures that observed differences in diversity reflect underlying ecological patterns rather than differences in sampling effort.
3.6. Environmental Effect on Culicoides Abundance
The GAMM explained a moderate proportion of the variance in standardized Culicoides abundance (adjusted R2 (explained deviance) = 0.372; Supplementary Material S3). Air humidity (PC1_humidity) and temperature (PC1_temperature) showed significant associations with standardized abundance, whereas precipitation (PC1_rain) did not reach statistical significance (p = 0.134). Specifically, humidity was positively associated with abundance (F = 10.96, p = 0.001), and temperature also showed a significant effect (F = 6.51, p = 0.011), while precipitation showed no significant effect (F = 2.25, p = 0.134) (Figure S2; Table S3). Random effects for community and species accounted for unexplained variation, capturing differences among sampling sites and midge species.
4. Discussion
Our study represents the first targeted entomological survey conducted in areas of MG with confirmed autochthonous OF cases, contributing to the expansion of current knowledge on Culicoides fauna and OROV epidemiology in extra-Amazonian regions. OROV expansion into MG is occurring against the backdrop of a continent-wide resurgence, with >29,000 confirmed cases reported across the Americas since 2024 and sustained transmission now documented from the Amazon Basin to extra-Amazonian Brazil and the Caribbean [3,4,7]. Autochthonous outbreaks in Northeastern, Central-Western, Southeastern and Southern Brazil, together with recent epidemics in Peru and Cuba, indicate that OROV has shifted from a historically Amazon-restricted virus to a multi-biome, multi-country threat. In this context, MG functions as a critical Atlantic Forest bridge between long-endemic Amazonian foci and densely populated southeastern urban corridors, where established C. paraensis populations could facilitate further regional dissemination. By providing the first Culicoides baseline for extra-Amazonian OROV foci in MG, our study situates local entomological risk within this broader continental expansion and offers a template for other newly affected regions.
Our entomological alert index was not designed to estimate true OROV transmission probability, but to rank communities by the combination of (i) observed human-biting vector abundance and (ii) how wide the statistically plausible range of infection prevalence remains given limited sampling. Because all MIR point estimates were zero, the index is driven by the upper MIR confidence bounds, which capture how much infection could be occurring without being detected rather than how much is occurring. Communities with many blood-fed C. paraensis but narrow MIR intervals are interpreted as higher-information, lower-uncertainty settings, whereas communities with fewer tested midges and wide MIR intervals remain higher-priority from an information-gap standpoint even if observed abundance is moderate. This design explains why community A, with moderate blood-fed densities but wide MIR bounds, scored higher than community E, which had more blood-fed vectors but narrower bounds. The same structure could be applied to other low-prevalence arboviruses where virological negatives and sparse sampling currently limit the actionability of entomological data. From a surveillance perspective, this is intentional: in early-phase, low-prevalence arbovirus systems, uncertainty about infection prevalence can be as operationally important as abundance itself because it determines where additional sampling is most needed to rule out silent transmission.
Beyond documenting vector presence, we characterized community-level entomological risk heterogeneity driven by uncertainty rather than absolute C. paraensis abundance. Community A exhibited the highest normalized alert index (1.00), combining moderate blood-fed densities (n = 35) with a wide MIR upper bound (73.8 per 1000), whereas community E showed the lowest index (0.00) despite higher blood-fed abundance (n = 44) because its narrowest MIR interval (27.5 per 1000) constrains plausible infection prevalence. This pattern illustrates how, in early-phase expansion settings, statistical uncertainty surrounding infection rates can elevate prioritization even when observed vector abundance is not maximal. The inverse relationship between sample size and upper MIR bounds highlights how sparse testing amplifies informational gaps in focal arbovirus systems.
The patterns we document, established anthropophilic C. paraensis populations, low-to-intermediate Culicoides diversity, and strong climatic modulation of abundance, are not unique to MG but echo conditions reported from other emerging OROV hotspots in Brazil and the western Amazon, where urban and peri-urban foci have recently intensified. These parallels suggest that the framework developed here (combined CDC-PHA sampling, MIR-based baselines, and climate-linked abundance models) can be exported to other Atlantic Forest and peri-Amazonian settings that are likely to experience OROV introduction over the coming years. These MG foci lie along a plausible corridor linking Amazonian and coastal Atlantic population centers, where anthropophilic C. paraensis could accelerate extra-Amazonian spread.
Understanding Culicoides species diversity and relative abundance is fundamental because vector competence varies dramatically among species, even within the same genus. Our documentation of five species across communities (C. leopoldoi 79.1%, C. paraensis 20.3%, C. pusillus 0.4%, C. foxi 0.09%, C. limai 0.09%) establishes baseline assemblage structure against which future shifts can be measured. Critically, C. paraensis, the primary vector of OROV in the Amazon Basin [13,24,36] comprised over 20% of captures and dominated PHA collections (90% of C. paraensis individuals), confirming anthropophilic behavior. This constitutes the first record in these specific outbreak areas (previously noted only in Belo Horizonte [21], absent from Laender et al.’s (2004) [37] comprehensive MG survey), suggesting recent range expansion into anthropized foci.
No OROV RNA was detected in 42 pools (819 specimens), consistent with typical field infection rates (0.01-1.0%) requiring thousands screened for reliable detection [14,38]. Viral RNA in infected vectors may be transiently detectable depending on time since infectious blood meal, environmental exposure conditions, and viral replication kinetics, so absence of detection in a finite sample does not exclude ongoing transmission, but reflects the focal, heterogeneous nature of arbovirus circulation in vector populations. Physiological assessment confirmed established populations with frequent host contact. Of 312 females examined, 73.1% were blood-fed (engorged, gravid, parous), including 84.6% of C. paraensis and high parous rates in C. leopoldoi (23.9% in community E), indicating repeated feeding and local breeding. Similar engorgement patterns have been reported elsewhere in Brazil, such as in Maranhão, where many engorged Culicoides females were collected in rural areas [39]. While C. leopoldoi shows peridomestic hematophagy, there is currently no evidence supporting OROV vector competence for this species [39].
Vector community diversity patterns illuminate this risk heterogeneity. Shannon indices ranged 0.00-0.54, with low-diversity assemblages showing strong dominance by one or two species versus intermediate diversity elsewhere. Low-diversity communities may amplify C. paraensis’ relative contribution, potentially elevating local transmission [40,41], whereas diverse assemblages may dilute the impact of competent vectors [8]. Atlantic Forest fragmentation likely favors generalist C. paraensis in anthropized landscapes. Environmental drivers further shape vector abundance and diversity. Humidity (F = 10.96, p = 0.001) and temperature (F = 6.51, p = 0.011) were significantly associated with standardized abundance. Humidity sustains larval habitats and adult survival [8,42] and temperature extends activity windows and may influence viral replication [22]. These predictors enable targeting high-risk periods and sites for surveillance and align with Culicoides optima but imply vulnerability to climate change. Projections of rising humidity/temperatures in Southeast Brazil [8] could amplify abundance, extending transmission windows, underscoring the need for dynamic risk mapping. Together, these results indicate that ecological structure and environmental drivers jointly modulate vector abundance and community composition, and that the absence of detectable OROV in vectors does not preclude epidemiological risk. This reinforces the value of integrating entomological, ecological, and quantitative approaches for early detection and risk assessment in emerging transmission areas.
Capture methods revealed distinct patterns between species. C. leopoldoi was collected exclusively using CDC light traps, suggesting an association with peridomestic environments related to animal breeding, as previously reported in Brazilian surveys [16,39]. In contrast, C. paraensis exhibited marked anthropophilic behavior, being predominantly captured through the PHA method, consistent with studies conducted in Brazil showing a strong preference of C. paraensis for human hosts and the limited efficiency of CDC light traps for this species [9,43]. Similar findings have also been reported outside Brazil, including in Cuba, where C. paraensis was detected exclusively through human landing collections, with no records from light traps [44].
One of the most relevant findings of our study was the occurrence of C. paraensis across all sampled communities. Unlike the survey conducted by Laender et al. (2004) [37], which relied solely on CDC traps and did not record this species in MG, our results indicate that the inclusion of the PHA method was crucial for its detection. Indeed, approximately 90% of all C. paraensis individuals in our study were collected using PHA. We therefore recommend the inclusion of PHA or equivalent human-attraction methods in future entomological surveys targeting OROV vectors in extra-Amazonian regions. The entomological alert index integrates blood-fed abundance (host contact proxy) with MIR bounds, prioritizing uncertainty hotspots over high-density, low-risk zones. PHA’s efficiency for C. paraensis mandates its routine use alongside CDC traps.
Our study has several limitations that contextualize findings and guide future work. Methodological biases inherent to collection approaches may influence species representation. CDC light traps favor light-attracted species like C. leopoldoi and may under-sample highly anthropophilic C. paraensis, which dominated PHA captures (90%). PHA directly quantifies human-vector contact, it is labor-intensive and limited to diurnal peaks (1500-1800h), possibly missing nocturnal activity [1]. Low Shannon diversity (0.00-0.54) reflects targeted outbreak sampling and limits inference on sylvatic cycle dynamics. The lack of forest sampling precludes assessing wild reservoirs (e.g., sloths, primates) and secondary vectors, which are critical for understanding transmission cycles. Zero OROV positives yield wide MIR bounds; larger samples or individual testing could refine prevalence estimates. The absence of blood-meal identification restricts detailed inference of host preferences, which future studies could address through molecular blood-meal analysis, metagenomics, longitudinal monitoring, and multi-habitat sampling designs. The alert index itself also has important limitations and should be interpreted cautiously. It rests on MIR upper confidence limits derived from zero-positive pools, so it cannot distinguish between truly uninfected and very low-prevalence vector populations, and it ignores several determinants of human risk (e.g., human immunity, health-care access, fine-scale biting heterogeneity) making it unsuitable for forecasting case incidence or setting absolute risk thresholds. Its main value is pragmatic: providing a transparent, reproducible way to rank outbreak-affected communities by where anthropophilic vectors are present and where infection prevalence remains most weakly constrained, thereby guiding where to intensify future entomo-virological sampling.
Our uncertainty-weighted entomological alert index highlights moderate-abundance communities, such as community B with the highest normalized score, as locations where additional entomological and virological sampling would be most informative and where targeted vector management could be prioritized. Public health authorities should target peridomestic sites exceeding humidity thresholds associated with increased abundance (the PC1 humidity range driving higher predicted densities) through drainage improvements and vegetation management to reduce breeding habitats. Routine deployment of PHA methods will enhance detection of anthropophilic species like C. paraensis and integrating these entomological baselines and alert metrics into national surveillance platforms [4] would enable real-time risk mapping and help prevent urban amplification, as observed in Northeast Brazil outbreaks [3,5]. Entomological alerts could be integrated with routine febrile illness reporting to trigger targeted field investigations when human case numbers are still low. Embedding MG within the wider extra-Amazonian and Pan-American OROV emergence underscores that entomological baselines and early-phase uncertainty metrics are not only locally useful but essential to regional efforts to prevent OROV from following the explosive expansion trajectories seen for dengue, zika and chikungunya across the continent. Our uncertainty-weighted alert index indicates that communities A and B should be prioritized for intensified entomological and virological sampling, even in the absence of OROV-positive pools. Integrating PHA into routine Culicoides surveillance will improve detection of anthropophilic vectors like C. paraensis that are poorly sampled by CDC light traps. Vector control and community engagement efforts can be strategically timed to weeks with higher predicted humidity and temperature, when Culicoides abundance and human-vector contact are most likely to peak.
In conclusion, this baseline study demonstrates the establishment and anthropophily of C. paraensis in MG outbreaks areas. By integrating diversity patterns, physiological structure, environmental drivers, and statistical uncertainty, our framework reveals transmission heterogeneity that extends beyond simple abundance metrics. Transforming sparse and virologically negative data into uncertainty-weighted prioritization tools is essential for early containment of OROV’s extra-Amazonian spread.
Supplementary Materials
The following supporting information can be downloaded at the website of this paper posted on Preprints.org, Figure S1. Distribution of Orthobunyavirus oropouchense (OROV) cases in Minas Gerais, Brazil. Figure S2. Partial effects of climatic principal components on standardized abundance estimated using a generalized additive mixed model (GAMM). Table S1. Geographic coordinates and characteristics of the ecological communities (A–E) sampled in Minas Gerais, Brazil. Table S2. Physiological state of female Culicoides captured in five communities within outbreak areas in Minas Gerais, Brazil. Supplementary Material S3. GAMM output. Table S3. Results of a Generalized Additive Mixed Model (GAMM) assessing the relationship between standardized Culicoides abundance and three principal components summarizing climatic variation.
Author Contributions
Conceptualization, A.I.B., D.C.C.C., E.P.A.B., F.S.C., F.V.S.A., G.B.P. and R.G.A.; Methodology, A.E.E., A.I.B., B.M.R., D.C.C.C., E.D.B., E.P.A.B., F.S.C., F.V.S.A., G.B.P., L.C.J.A., L.M.R.T., L.W.A., M.C.D.B., M.E.S.A., M.F.S.S., N.R.G., P.A.A.S. and R.G.A.; Validation, A.E.E., A.I.B., B.M.R., D.C.C.C., E.D.B., E.P.A.B., F.S.C., F.V.S.A., G.B.P., L.C.J.A., L.M.R.T., M.C.D.B., M.E.S.A., M.F.S.S., P.A.A.S. and R.G.A.; Formal analysis, A.E.E., A.I.B., B.M.R., D.C.C.C., E.D.B., E.P.A.B., F.S.C., F.V.S.A., G.B.P., L.C.J.A., L.M.R.T., L.W.A., M.C.D.B., M.E.S.A., M.F.S.S., N.R.G., P.A.A.S. and T.E.R.A.; Investigation, A.E.E., B.M.R., D.C.C.C., E.P.A.B., F.S.C., F.V.S.A., L.C.J.A., L.M.R.T., M.C.D.B., M.E.S.A., M.F.S.S., N.R.G., R.G.A. and T.E.R.A.; Resources, B.M.R., D.C.C.C., E.P.A.B., F.S.C., F.V.S.A., L.C.J.A., L.M.R.T. and R.G.A.; Data curation, A.E.E., B.M.R., D.C.C.C., E.D.B., E.P.A.B., F.S.C., F.V.S.A., G.B.P., L.C.J.A., L.M.R.T., L.W.A., M.C.D.B., M.E.S.A., M.F.S.S., N.R.G., P.A.A.S., R.G.A. and T.E.R.A.; Visualization, A.I.B., E.D.B., F.S.C., F.V.S.A., G.B.P., L.M.R.T., M.E.S.A., M.F.S.S. and P.A.A.S.; Supervision, F.S.C., F.V.S.A. and L.C.J.A.; Project administration, F.S.C., F.V.S.A. and L.C.J.A.; Funding acquisition, B.M.R., D.C.C.C., E.P.A.B., F.S.C., F.V.S.A., L.C.J.A., L.M.R.T. and N.R.G.; Writing—original draft preparation, A.I.B., E.D.B., F.S.C., F.V.S.A., G.B.P., M.E.S.A., M.F.S.S. and P.A.A.S.; Writing—review and editing, A.E.E., B.M.R., D.C.C.C., E.P.A.B., L.C.J.A., L.M.R.T., L.W.A., M.C.D.B., N.R.G., R.G.A. and T.E.R.A.; All authors have read and agreed to the published version of the manuscript.
Funding
This research was funded by the National Council of Scientific Development (Conselho Nacional de Desenvolvimento Científico e Tecnológico—CNPq, chamada CNPq/MS-SCTIE-Decit No 22/2019, process number 443215/2019-7 to PMR), Instituto René Rachou—Fundação Oswaldo Cruz (Chamada 01/2024, Vigilância em Saúde), and the Rede Unificada de Análises Integradas de Arbovírus de Minas Gerais (REDE UAI-ARBO-MG), financed by the Fundação de Amparo à Pesquisa do Estado de Minas Gerais (FAPEMIG), grant number RED-00234-23 and Minas Gerais State Health Department.
Informed Consent Statement
Not applicable.
Data Availability Statement
The data and code used in our study are available in: https://github.com/elviradbastiani/OROV_Minas_Gerais_2026.
Acknowledgments
The authors express their sincere gratitude to Secretaria Estadual de Saúde de Minas Gerais (SES-MG) and to all Municipal Health Secretariats where sampling was conducted. We sincerely thank Luciane Zanotti, Rosiane Pessoa Teixeira, Marisa da Costa Moreira Gomes, Sirlene Valverde França, Marla Oliveira D. Esquivel, Cosme Tadeu Alves da Costa, and Élcio Ferreira Amaral for their invaluable logistical support, and Ricardo Oliveira Alves, Ricardo Ferreira Miranda, and Lúcia for their essential assistance during the fieldwork. B.M.R. and F.S.C. are CNPq research fellows, N.R.G. receive BDCTI-I scholarships from FAPEMIG, G.B.P receive scholarship from Brazilian Office to Coordinate Improvement of Higher Education Personnel (Coordenação de Aperfeiçoamento de Pessoal de Nível Superior—CAPES) and F.V.S.A is a Serrapilheira Institute grantee. In addition, F.S.C. acknowledges support from the Fulbright Program as a Visiting Scholar at Cornell University, Ithaca, NY, USA.
Conflicts of Interest
The authors declare no conflicts of interest.
References
- Gräf, T.; et al. Expansion of Oropouche virus in non-endemic Brazilian regions: Analysis of genomic characterisation and ecological drivers. Lancet Infect. Dis. 2025, 25, 379–389. [Google Scholar] [CrossRef] [PubMed]
- Naveca, F.G.; et al. Human outbreaks of a novel reassortant Oropouche virus in the Brazilian Amazon region. Nat. Med. 2024, 30, 3509–3521. [Google Scholar] [CrossRef]
- Pan American Health Organization (PAHO). Oropouche Fever—Epidemiological Update. PAHO. 2026. Available online: https://www.paho.org/en.
- Brazil, Ministry of Health. Monitoramento das Arboviroses. Ministry of Health. 2026. Available online: https://www.gov.br.
- Vasconcelos, P.F.; Calisher, C.H. Emergence of human arboviral diseases in the Americas, 2000–2016. Vector-Borne Zoonotic Dis. 2016, 16, 295–301. [Google Scholar] [CrossRef] [PubMed]
- Wesselmann, K.M.; et al. Emergence of Oropouche fever in Latin America: A narrative review. Lancet Infect. Dis. 2024, 24, e439–e452. [Google Scholar] [CrossRef]
- Rojo-Pérez, M.Á.; Ramírez-García, E.A.; Llenas-García, J. Clinical and epidemiological characteristics of an Oropouche virus outbreak in Loreto, Peru (October 2024–March 2025). Pathogens 2026, 15, 119. [Google Scholar] [CrossRef]
- Carpenter, S.; et al. Culicoides biting midges, arboviruses and public health in Europe. Antiviral Res. 2013, 100, 102–113. [Google Scholar] [CrossRef]
- Pan American Health Organization (PAHO). Manual for Entomological Surveillance and Vector Control of Arboviruses. PAHO. 2017. Available online: https://iris.paho.org/handle/10665.2/34254.
- Anderson, C.R.; et al. Oropouche virus: A new human disease agent from Trinidad, West Indies. Am. J. Trop. Med. Hyg. 1961, 10, 574–578. [Google Scholar] [CrossRef] [PubMed]
- Pinheiro, F.P.; et al. An outbreak of Oropouche virus disease in the vicinity of Santarém, Pará, Brazil. Tropenmed. Parasitol. 1976, 27, 213–223. [Google Scholar]
- Sakkas, H.; et al. Oropouche fever: A review. Viruses 2018, 10, 175. [Google Scholar] [CrossRef]
- Pinheiro, F.P.; et al. Transmission of Oropouche virus from man to hamster by the midge Culicoides paraensis. Science 1982, 215, 1251–1253. [Google Scholar] [CrossRef]
- Travassos da Rosa, J.F.; et al. Oropouche virus: Clinical, epidemiological, and molecular aspects of a neglected orthobunyavirus. Am. J. Trop. Med. Hyg. 2017, 96, 1019–1030. [Google Scholar] [CrossRef] [PubMed]
- Wirth, W.W.; Felippe-Bauer, M.L. The neotropical biting midges related to Culicoides paraensis (Diptera: Ceratopogonidae). Mem. Inst. Oswaldo Cruz 1989, 84, 551–565. [Google Scholar] [CrossRef]
- Farias, E.S.; et al. Diversity of biting midges Culicoides (Diptera: Ceratopogonidae), potential vectors of disease, in different environments in an Amazonian rural settlement, Brazil. Rev. Soc. Bras. Med. Trop. 2020, 53, e20200353. [Google Scholar] [CrossRef]
- Gallichotte, E.N.; Ebel, G.D.; Carlson, C.J. Vector competence for Oropouche virus: A systematic review of pre-2024 experiments. PLoS Negl. Trop. Dis. 2025, 19, e0013014. [Google Scholar] [CrossRef]
- Borkent, A.; Spinelli, G.R. Catalog of the New World biting midges south of the United States (Diptera: Ceratopogonidae). Contrib. Entomol. Int. 2000, 4, 1–107. [Google Scholar]
- Borkent, A.; Dominiak, P. Catalog of the biting midges of the world (Diptera: Ceratopogonidae). Zootaxa 2020, 4787, 1–377. [Google Scholar] [CrossRef]
- Santarém, M.C.; Felippe-Bauer, M.L. Analysis of Brazilian Ceratopogonidae (Diptera: Culicomorpha) species diversity and knowledge assessment. Zoologia 2024, 41, e23066. [Google Scholar] [CrossRef]
- Caixeta, E.A.; et al. The study of bluetongue virus (BTV) and epizootic hemorrhagic disease virus (EHDV) circulation and vectors at the Municipal Parks and Zoobotanical Foundation of Belo Horizonte, Minas Gerais, Brazil (FPMZB-BH). Viruses 2024, 16, 293. [Google Scholar] [CrossRef] [PubMed]
- Purse, B.V.; et al. Climate change and the recent emergence of bluetongue in Europe. Nat. Rev. Microbiol. 2005, 3, 171–181. [Google Scholar] [CrossRef]
- Secretaria de Estado de Saúde de Minas Gerais (SES-MG). Painel de Vigilância Laboratorial das Arboviroses. SES-MG. 2025. Available online: https://www.saude.mg.gov.br.
- Ribeiro, M.C.; et al. The Brazilian Atlantic Forest: How much is left, and how is the remaining forest distributed? Implications for conservation. Biol. Conserv. 2009, 142, 1141–1153. [Google Scholar] [CrossRef]
- Joly, C.A.; et al. Experiences from the Brazilian Atlantic Forest. New Phytol. 2014, 204, 459–473. [Google Scholar] [CrossRef]
- Rezende, C.L.; et al. From hotspot to hopespot: An opportunity for the Brazilian Atlantic Forest. Perspect. Ecol. Conserv. 2018, 16, 208–214. [Google Scholar] [CrossRef]
- Alvares, C.A.; et al. Köppen’s climate classification map for Brazil. Meteorol. Z. 2013, 22, 711–728. [Google Scholar] [CrossRef]
- Mweresa, C.K.; et al. Molasses as a source of carbon dioxide for attracting the malaria mosquitoes Anopheles gambiae and Anopheles funestus. Malar. J. 2014, 13, 160. [Google Scholar] [CrossRef] [PubMed]
- Dyce, A.L. The recognition of nulliparous and parous Culicoides. J. Aust. Entomol. Soc. 1969, 8, 11–15. [Google Scholar] [CrossRef]
- Wirth, W.W.; Marston, N. A method for mounting small insects. USDA Entomol. Bull. 1968, 86. [Google Scholar]
- Pan American Health Organization (PAHO). Documento Operacional de Identificação de Culicoides Latreille. PAHO 2025.
- Naveca, F.G.; et al. Multiplex real-time RT-PCR assay for detection of Oropouche virus. Virol. J. 2017, 14, 163. [Google Scholar] [CrossRef]
- Brooks, M.E.; et al. glmmTMB balances speed and flexibility among packages for zero-inflated generalized linear mixed modeling. R J. 2017, 9, 378–400. [Google Scholar] [CrossRef]
- Dixon, P. VEGAN, a package of R functions for community ecology. J. Veg. Sci. 2003, 14, 927–930. [Google Scholar] [CrossRef]
- Hersbach, H.; et al. The ERA5 global reanalysis. Q. J. R. Meteorol. Soc. 2020, 146, 1999–2049. [Google Scholar] [CrossRef]
- Feitoza, L.H.M.; et al. Integrated surveillance for Oropouche virus: Molecular evidence of potential urban vectors during an outbreak in the Brazilian Amazon. Acta Trop. 2025, 261, 107487. [Google Scholar] [CrossRef] [PubMed]
- Laender, J.O.; et al. Account of the species of Culicoides Latreille, 1809 (Diptera: Ceratopogonidae) in the regions of Norte de Minas, Jequitinhonha and Vale do Mucuri, Minas Gerais, Brazil. Entomol. Vect. 2004, 11, 145–157. [Google Scholar]
- Gu, W.; Lampman, R.; Novak, R.J. Problems in estimating mosquito infection rates using minimum infection rate. J. Med. Entomol. 2003, 40, 595–596. [Google Scholar] [CrossRef] [PubMed]
- Gusmão, G.M.C.; et al. Determination of blood meal sources of Culicoides Latreille (Diptera: Ceratopogonidae) in rural areas of northern Maranhão State, Brazil. Biotemas 2015, 28, 51–58. [Google Scholar] [CrossRef]
- Keesing, F.; Holt, R.D.; Ostfeld, R.S. Effects of species diversity on disease risk. Ecol. Lett. 2006, 9, 485–498. [Google Scholar] [CrossRef] [PubMed]
- Keesing, F.; Ostfeld, R.S. Dilution effects in disease ecology. Ecol. Lett. 2021, 24, 2490–2505. [Google Scholar] [CrossRef]
- Mellor, P.S.; Boorman, J.; Baylis, M. Culicoides biting midges: Their role as arbovirus vectors. Annu. Rev. Entomol. 2000, 45, 307–340. [Google Scholar] [CrossRef] [PubMed]
- de Souza, L.A.F.; Sena da Silva, S.L.; do Nascimento, B.L.S.; de Sousa Farias, E.; Nunes Neto, J.P.; Costa-Ribeiro, M.C.V.D. First report of Culicoides paraensis (Goeldi, 1905) (Diptera: Ceratopogonidae) in the state of Paraná, Southern Brazil. Acta Trop. 2025, 271, 107868. [Google Scholar] [CrossRef]
- Martínez Pérez, Y.; Companioni Ibáñez, A.; Menéndez Díaz, Z.; Camacho Acosta, E.; Sánchez González, M.; Cox García, N.; del Rosario Casanova Drake, Q.; Gutierrez-Bugallo, G. First report of Culicoides paraensis (Goeldi, 1905) (Diptera: Ceratopogonidae) in Cuba: A new challenge for public health. Parasite Epidemiol. Control 2025, 29, e00423. [Google Scholar] [CrossRef]
Figure 1.
Location of the five ecological communities (A-E) distributed across three health regions and selected as study areas within the Atlantic Forest biome in the state of Minas Gerais, Brazil. These communities correspond to the spatial units used for entomological sampling and analyses.
Figure 1.
Location of the five ecological communities (A-E) distributed across three health regions and selected as study areas within the Atlantic Forest biome in the state of Minas Gerais, Brazil. These communities correspond to the spatial units used for entomological sampling and analyses.
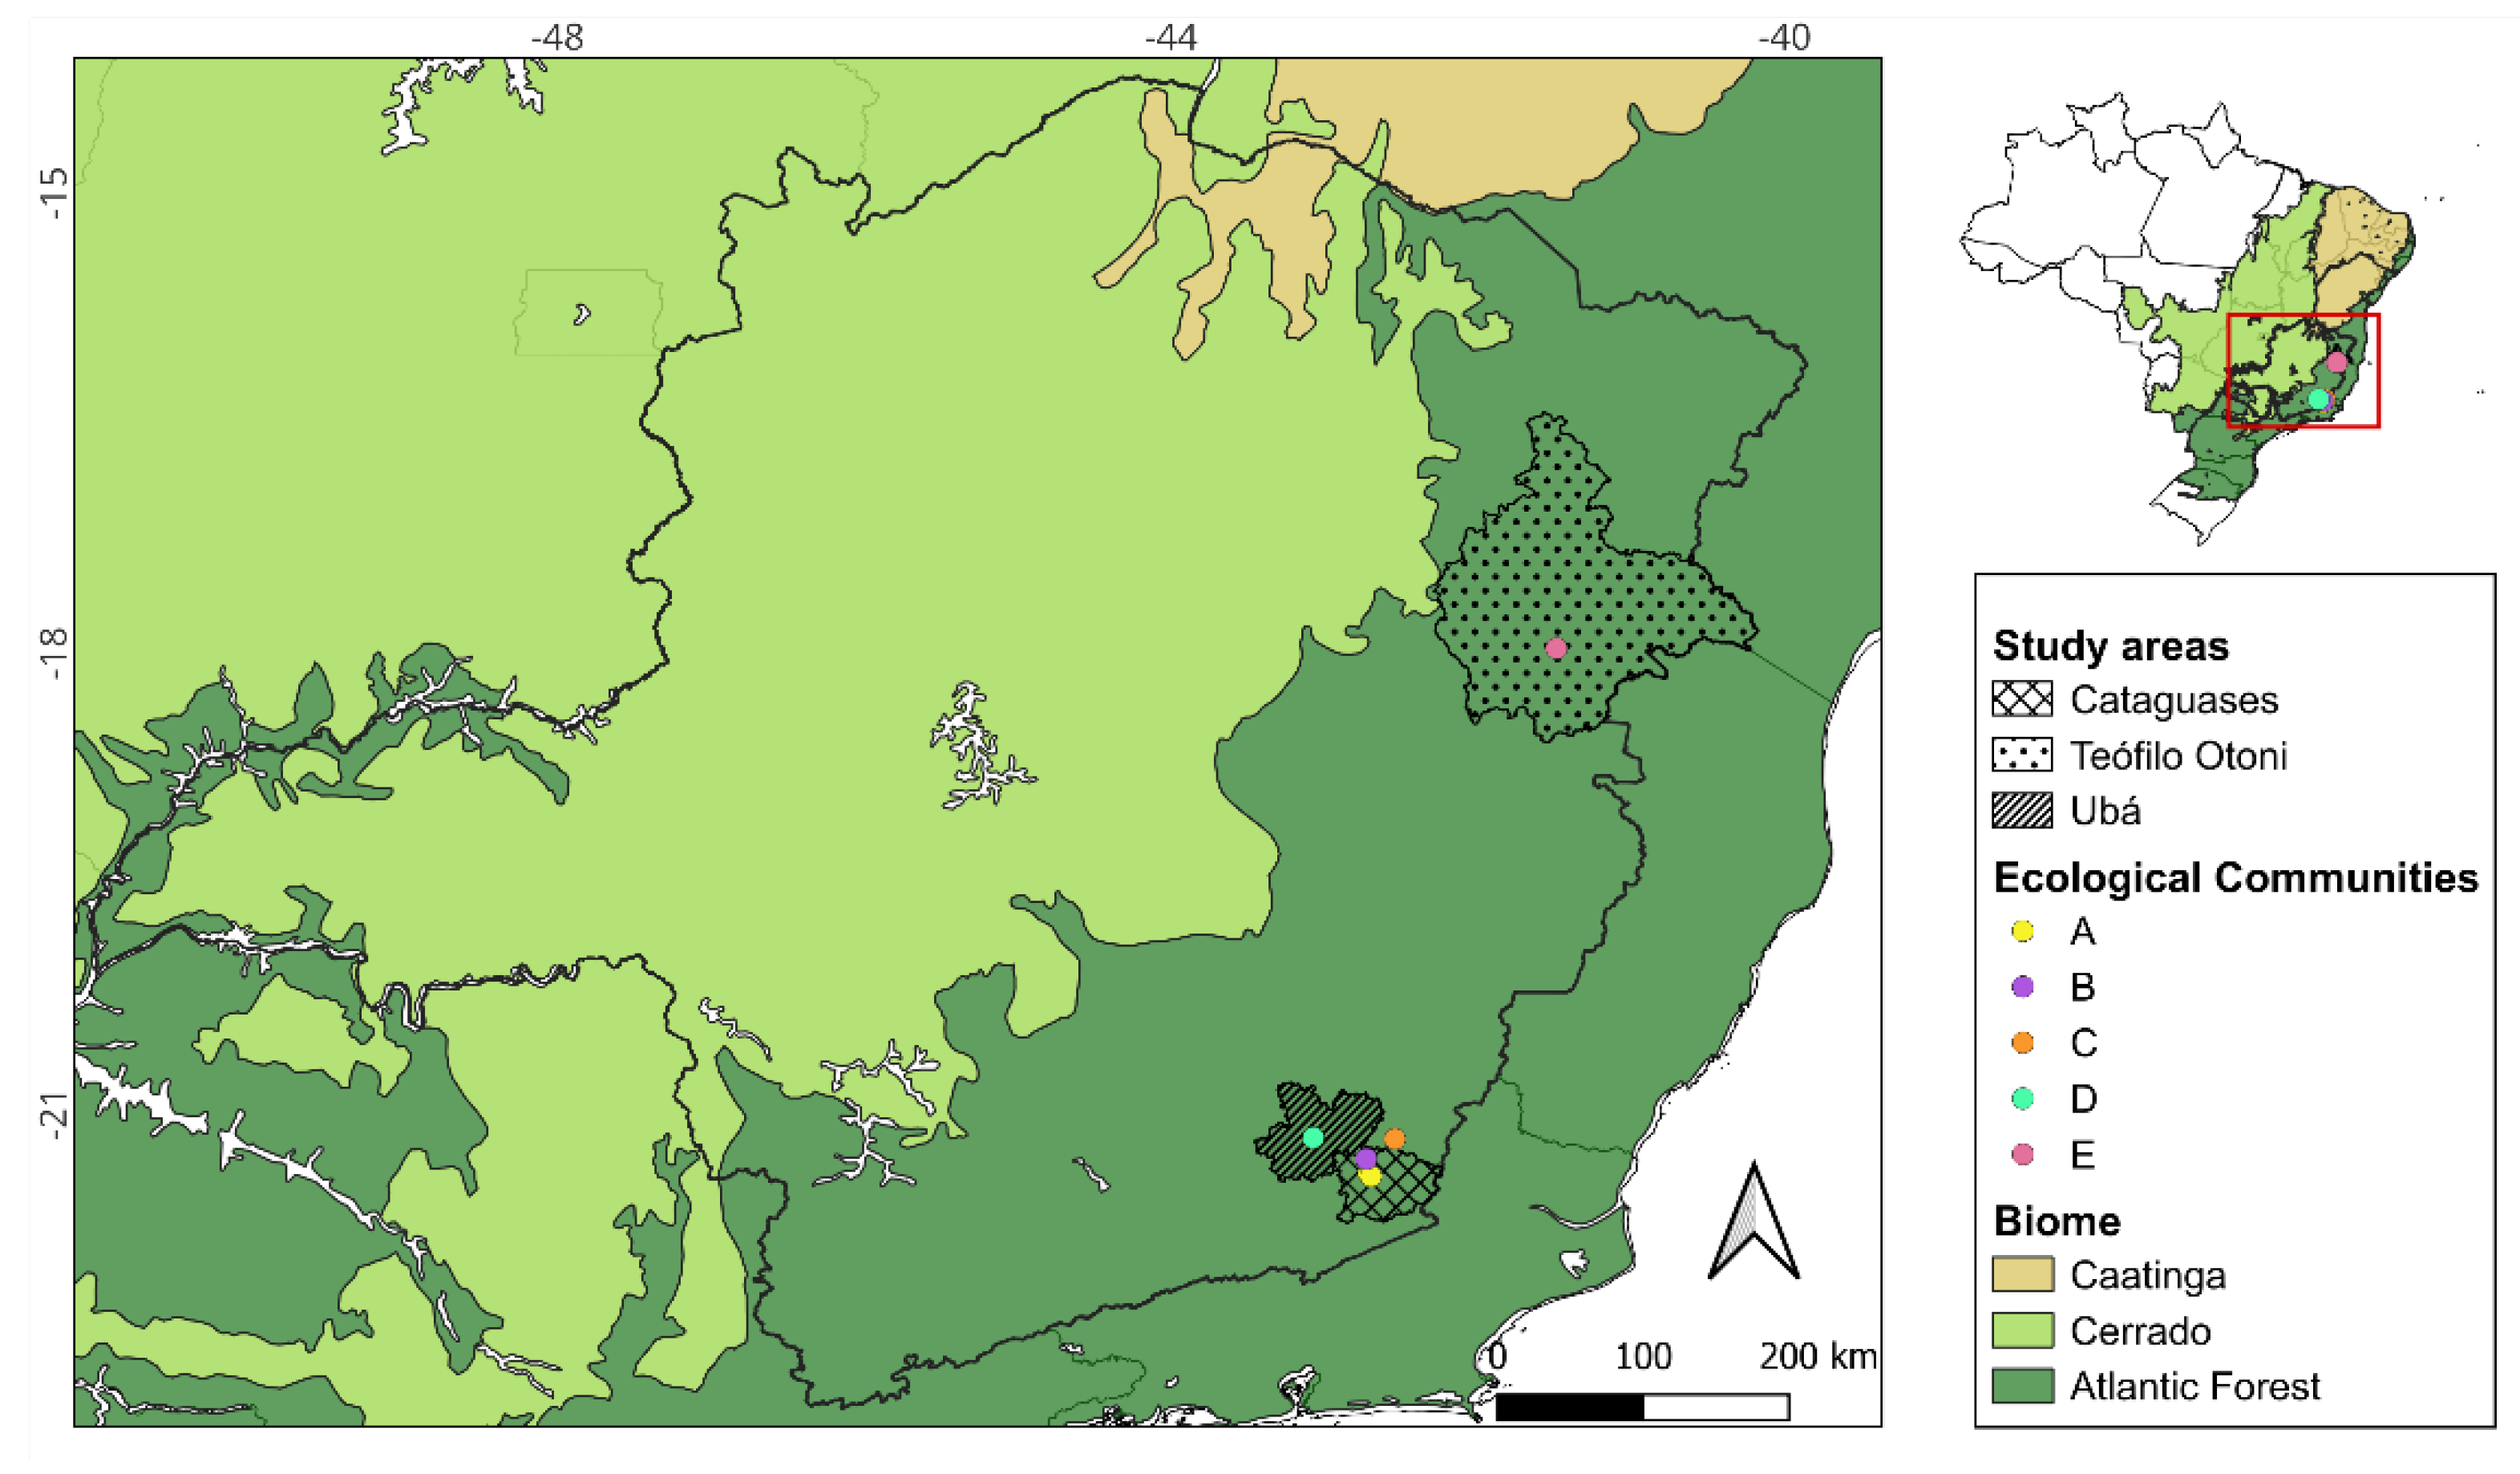
Figure 2.
Wings of Culicoides species captured during entomological collections: (A) C. leopoldoi; (B) C. paraensis; (C) C. pusillus; and (D) C. foxi. Images of C. limai wings were not obtained due to technical limitations and the low number of specimens collected.
Figure 2.
Wings of Culicoides species captured during entomological collections: (A) C. leopoldoi; (B) C. paraensis; (C) C. pusillus; and (D) C. foxi. Images of C. limai wings were not obtained due to technical limitations and the low number of specimens collected.
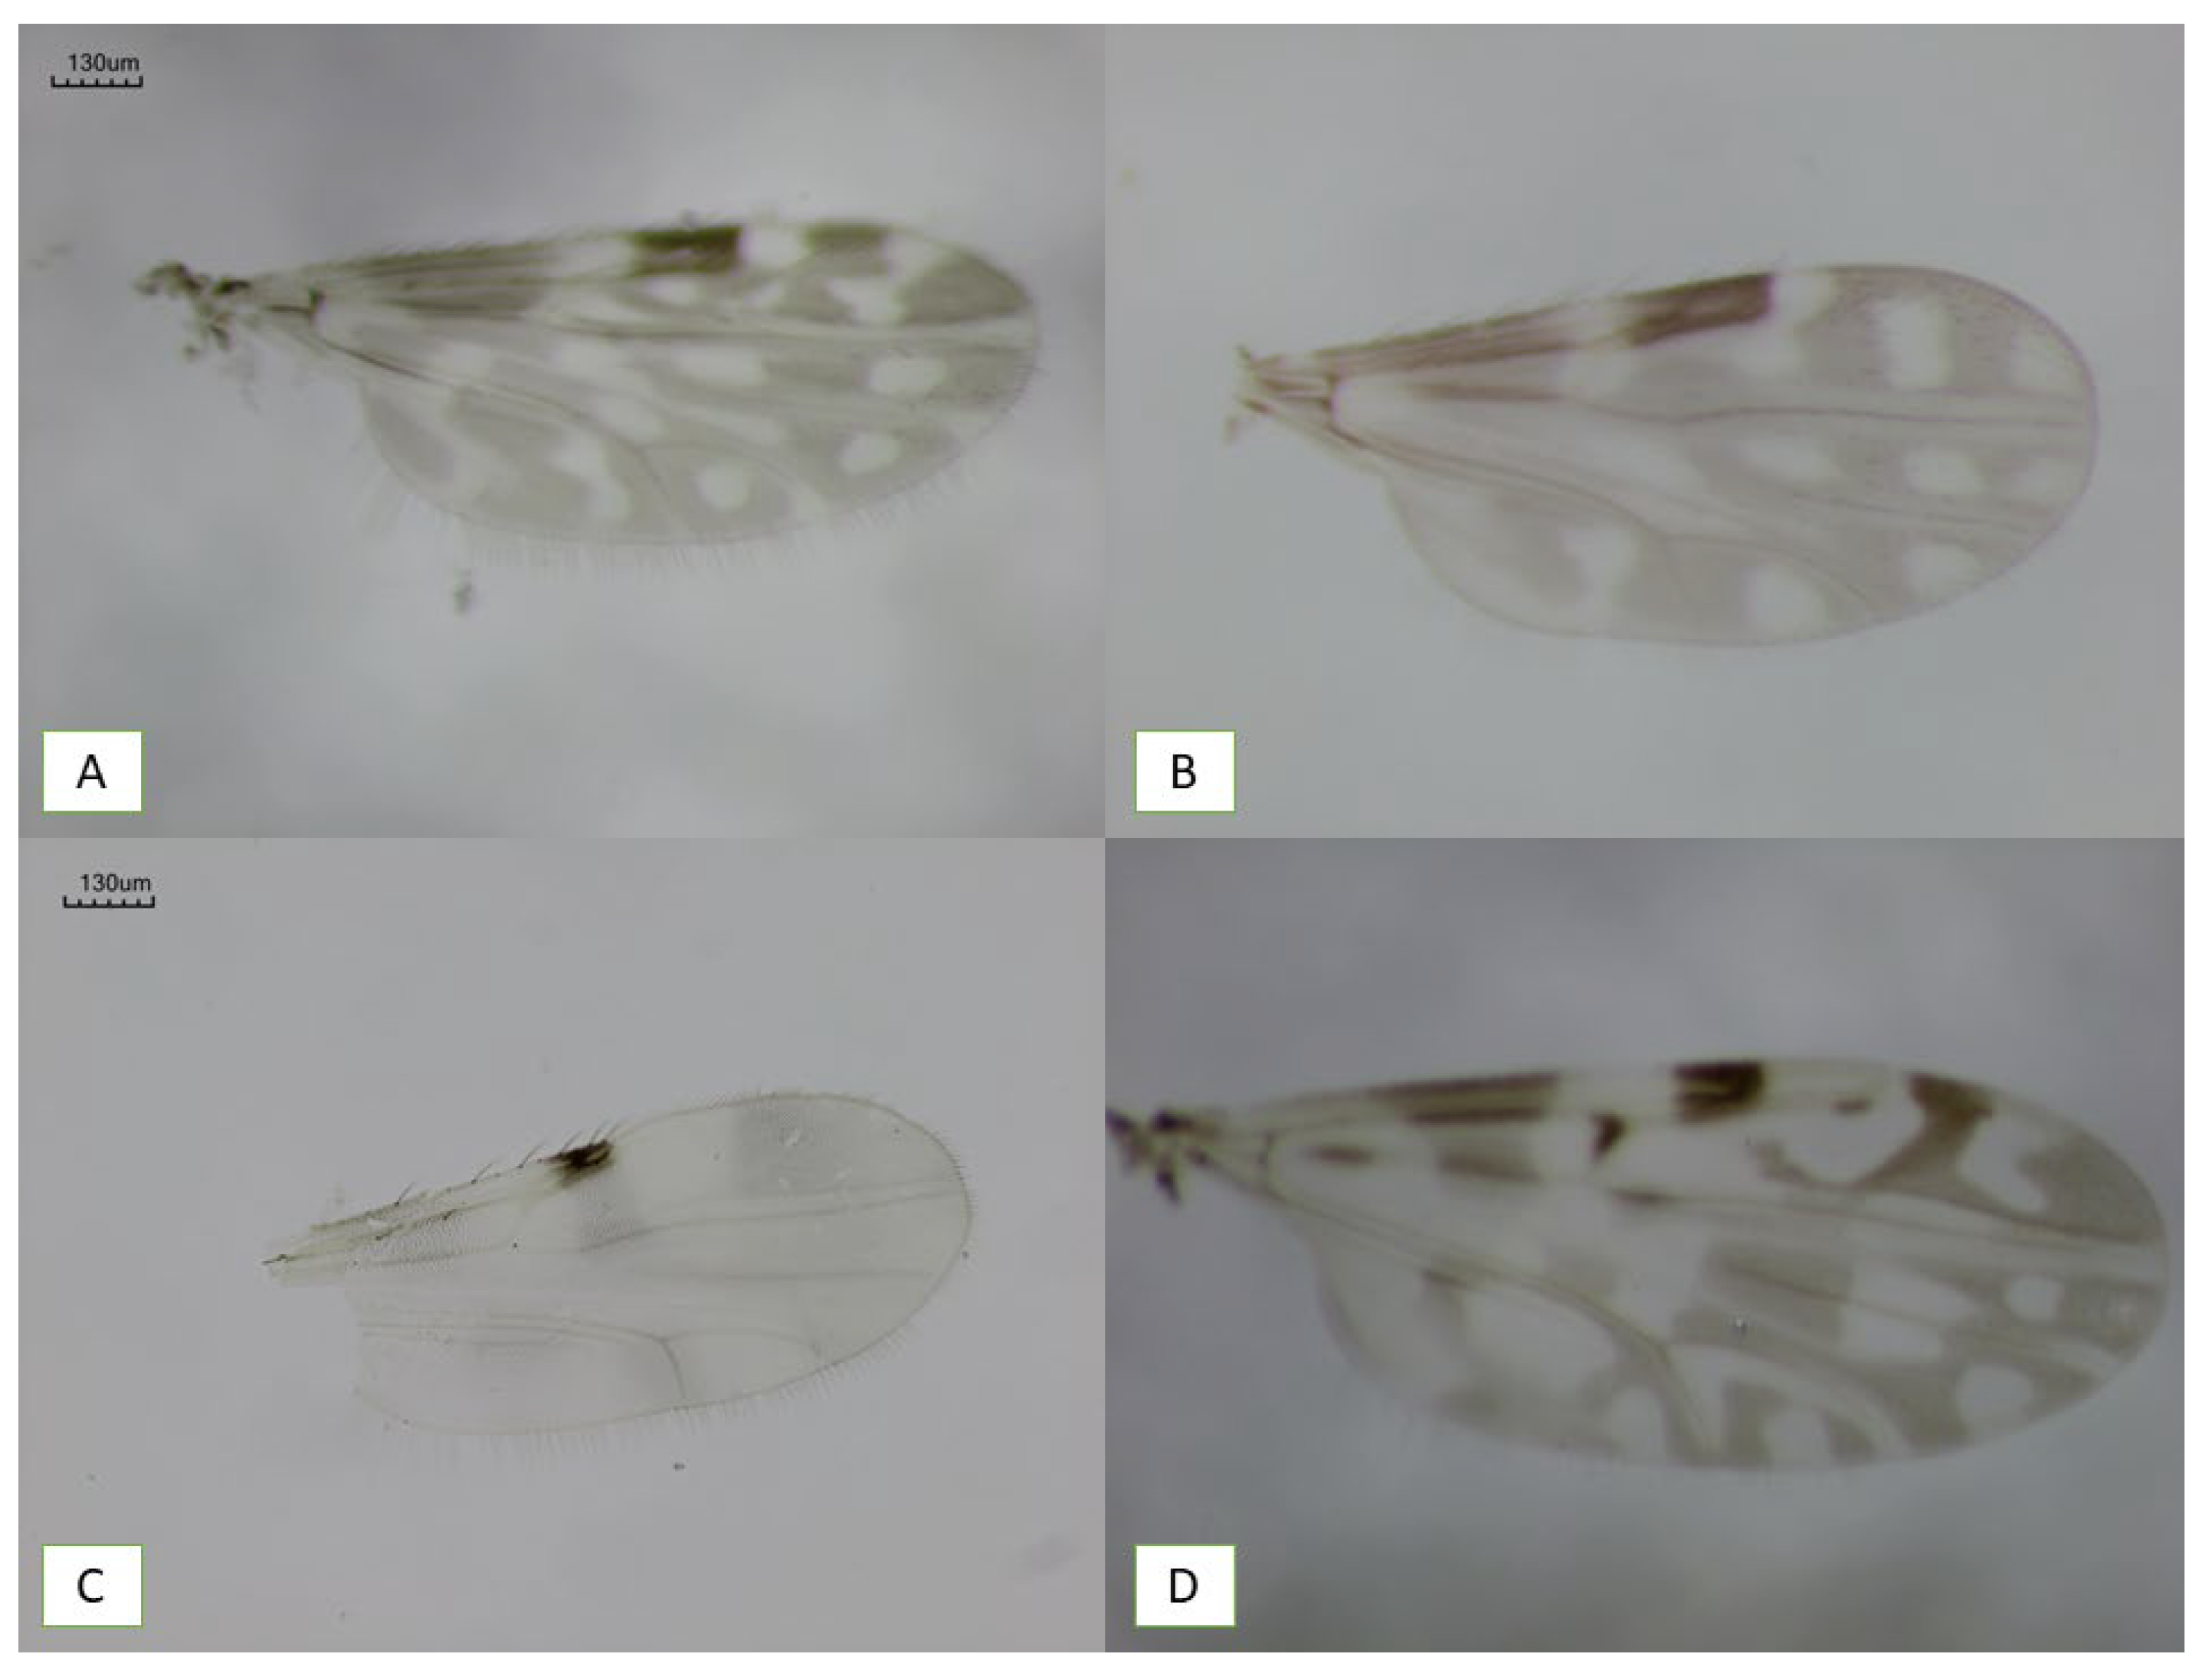
Figure 3.
Percentage distribution of Culicoides females according to physiological state at the time of capture aggregated across five communities within outbreak areas in Minas Gerais, Brazil. Physiological states were classified as Engorged (recently blood-fed), Gravid (carrying mature eggs), Nulliparous (females that have not yet laid eggs), Parous (females that have previously laid eggs), and Undefined (state could not be determined). Percentages are calculated relative to the total number of specimens examined, providing a view of the reproductive status of the sampled population. Including both blood-fed and non-blood-fed individuals offers a perspective on vector biology and potential roles in transmission.
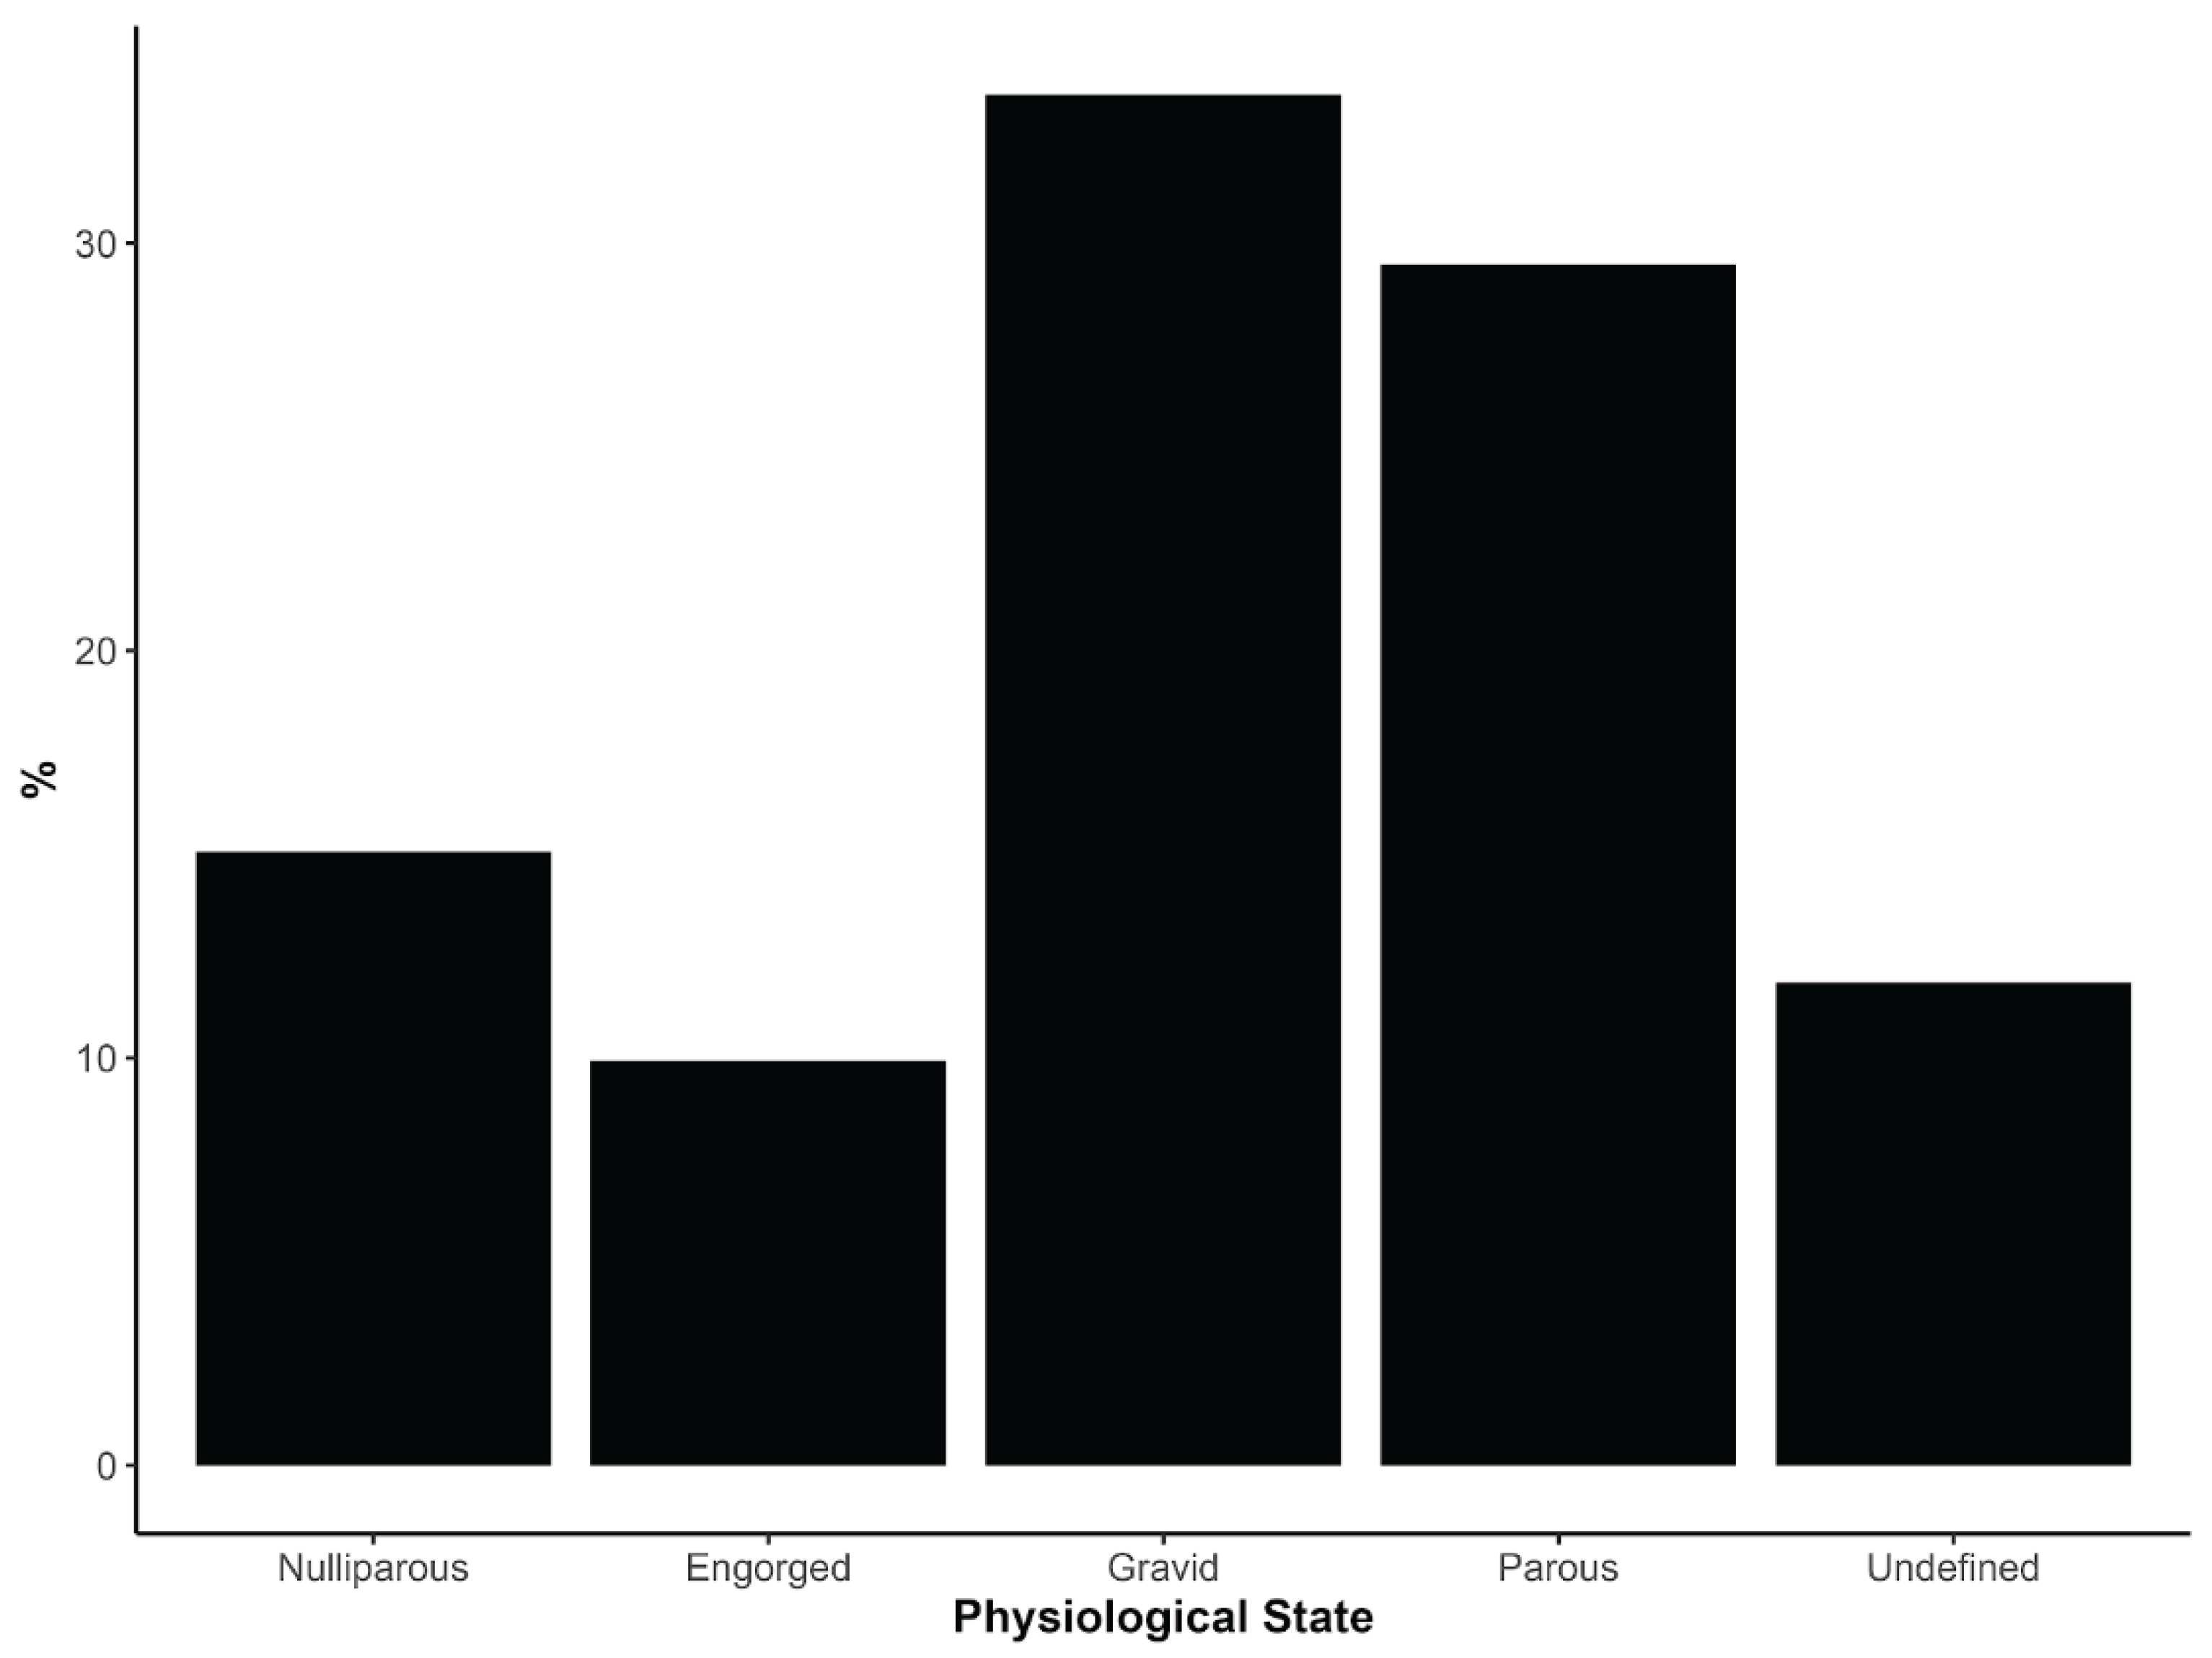
Figure 4.
Percentage of Culicoides specimens captured by community vector surveillance in five communities within outbreak areas in Minas Gerais, Brazil, shown by species and collection method. Each bar represents the proportion of individuals within a species collected using either CDC light traps (black) or human landing catches (PHA, grey). Percentages are calculated for each species relative to its total count across both methods, highlighting differences in capture efficiency between CDC and PHA.
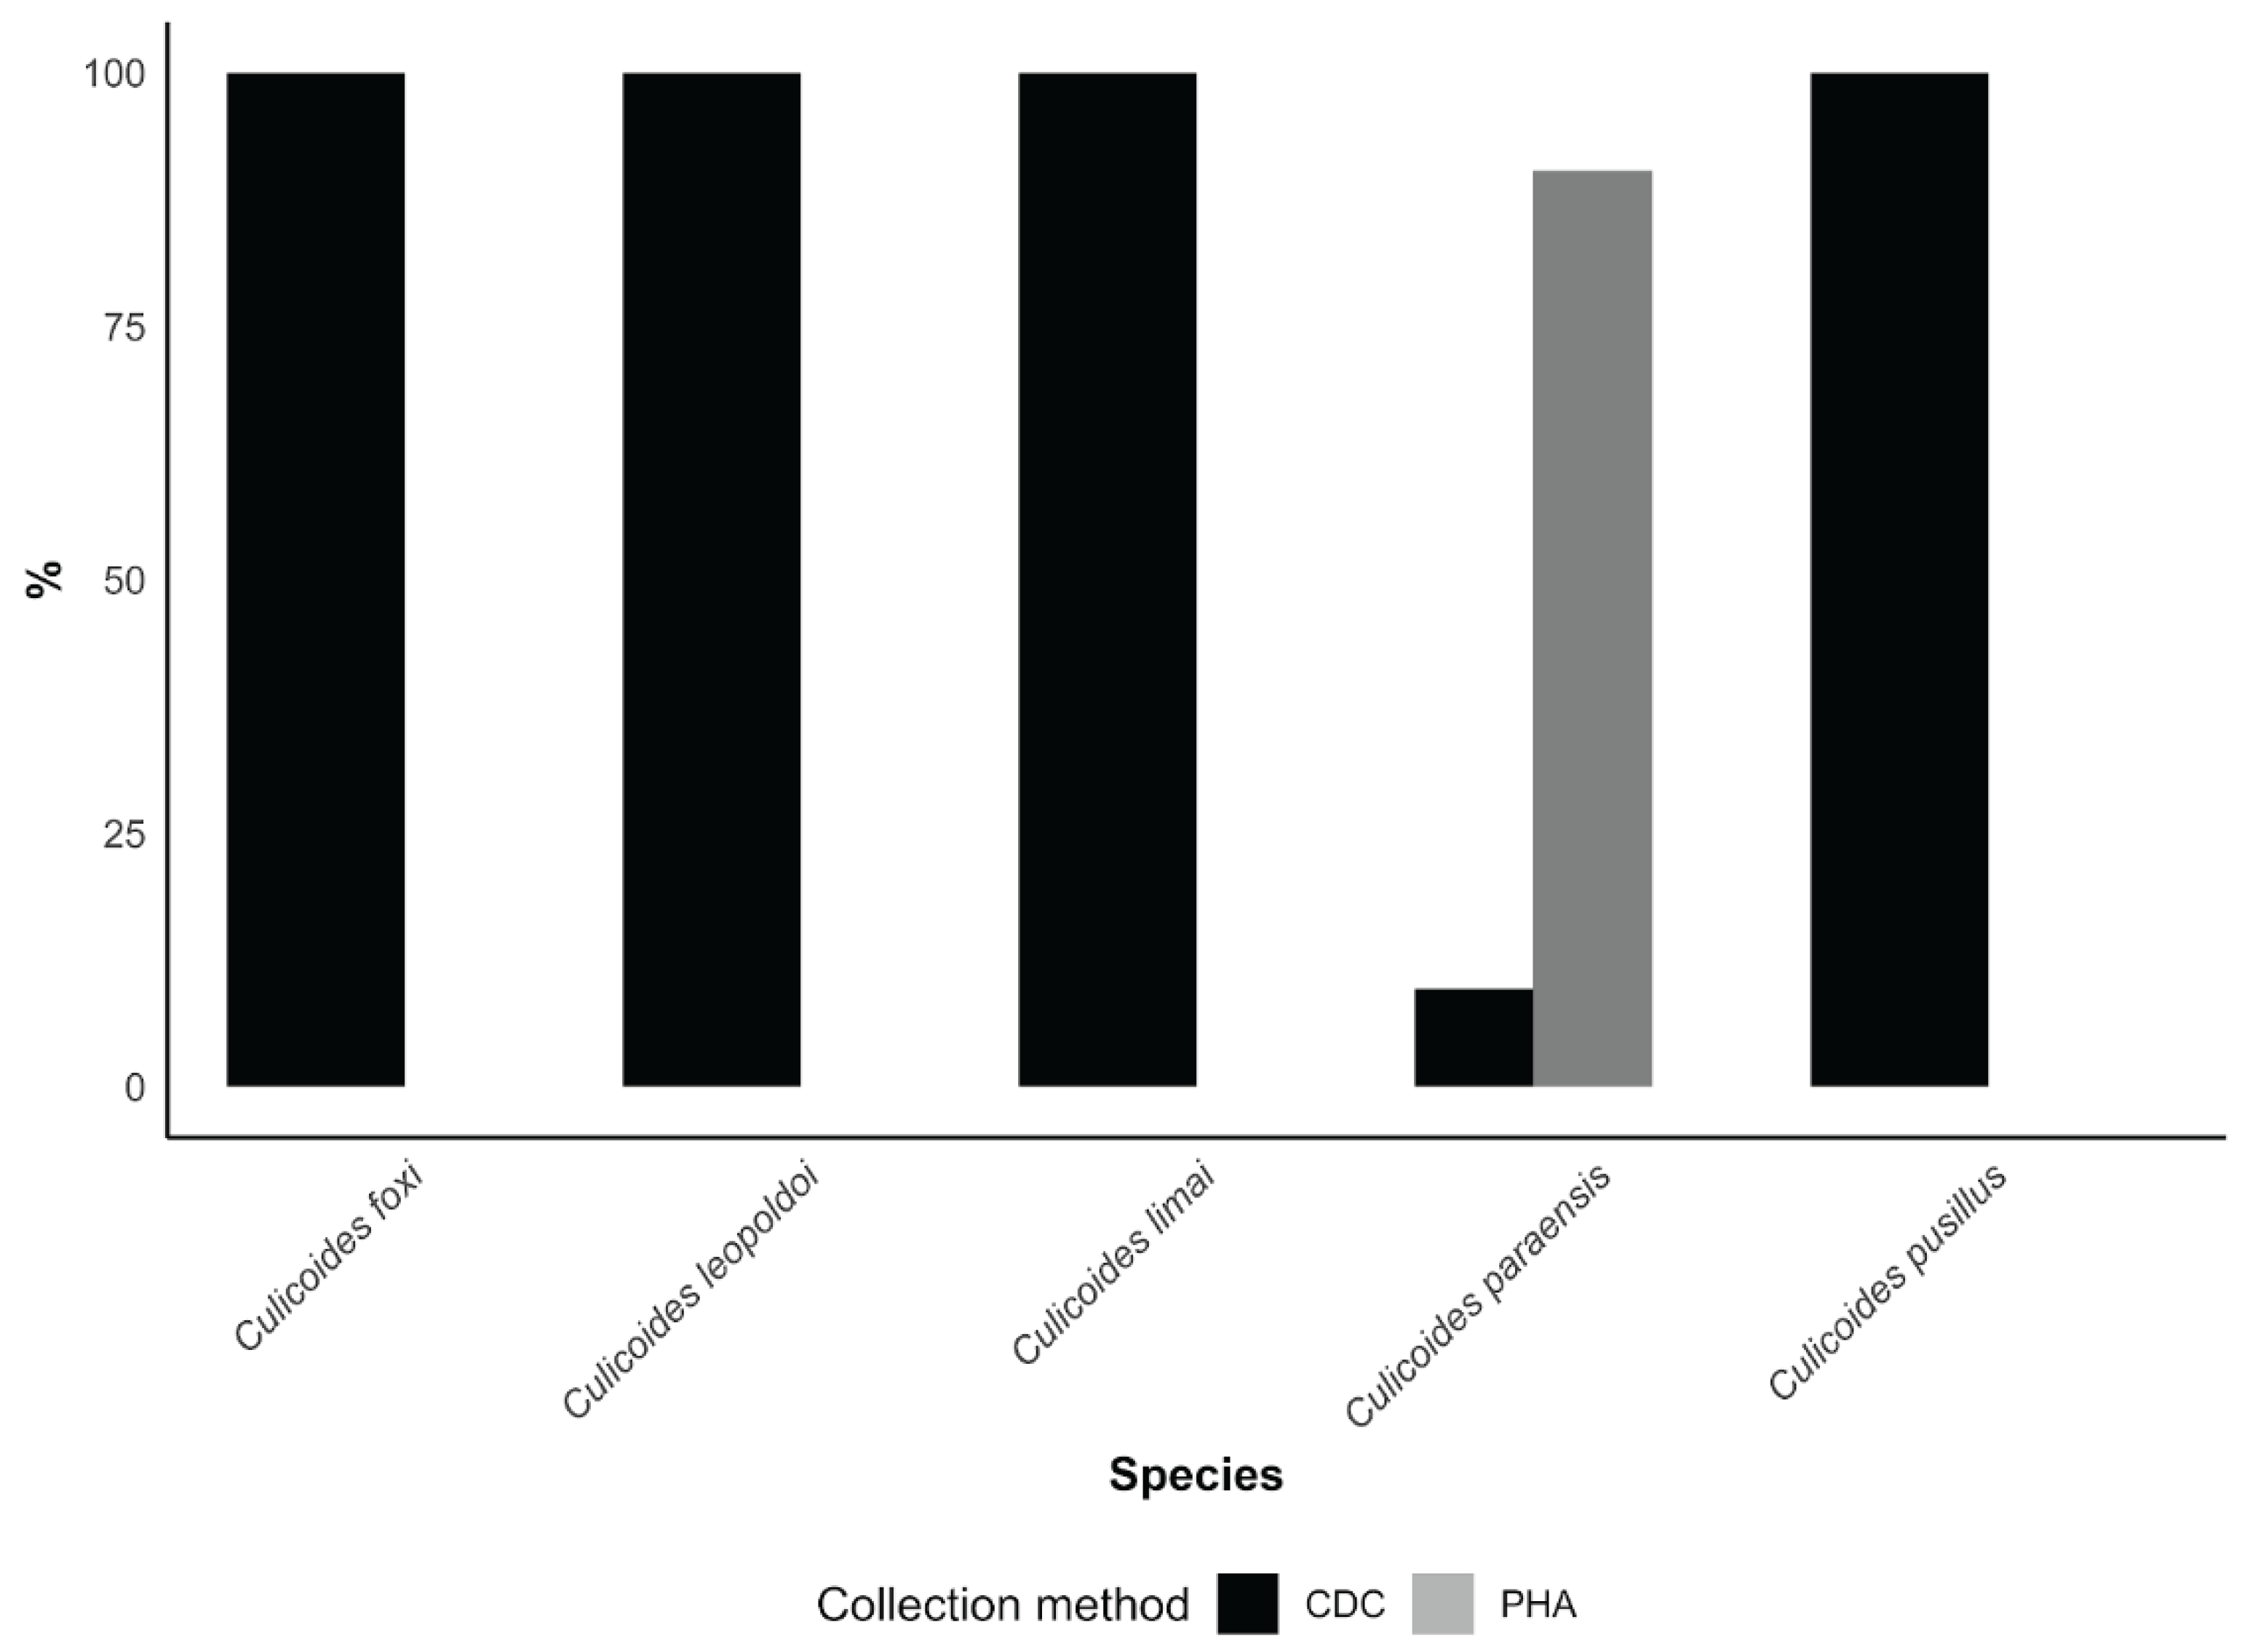

Table 1.
Climatic characteristics and reported human OROV cases in 2024 in communities across different health regions of Minas Gerais, Brazil. Ecological communities are coded according to their spatial groupings used in our study (A-E). Average temperature (°C), annual precipitation (mm), and annual average air humidity are presented as ranges or as means (minimum-maximum). Temperature and precipitation, air humidity data were obtained from long-term averages reported by Copernicus Climate Change Service (C3S).
| Communities | Health Region | Human OROV Cases | Weekly Average | ||
|---|---|---|---|---|---|
| Temperature (ºC) | Precipitation (mm/day) | Air Humidity (hPa) | |||
| A-B | Cataguases | 536 | 22.8 (18.5–30.7) | 3.53 (0–82.8) | 20.3 (12.7–26.8) |
| C-D | Ubá | 341 | 21.4 (17.4–29.57) | 3.48 (0–113) | 19.1 (12.1–25.8) |
| E | Teófilo Otoni | 77 | 23.2 (19.4–30.5) | 2.99 (0–79.9) | 20.0 (12.9–26.7) |
Table 2.
Number of Culicoides specimens collected and tested for OROV in five communities within outbreak areas in Minas Gerais, Brazil. Values are presented as No./Tested, where No. indicates the total number of specimens collected and Tested indicates the number of specimens processed for laboratory detection of OROV by RT-qPCR. Species rows show the distribution of collections and testing across Communities A-E, while the Total row sums count for each community.
| Species | Communities | |||||
|---|---|---|---|---|---|---|
| A (No./Tested) |
B (No./Tested) |
C (No./Tested) |
D (No./Tested) |
E (No./Tested) |
Total (No./Tested) |
|
| Culicoides foxi | 0/0 | 0/0 | 0/0 | 0/0 | 1/0 | 1/0 |
| C. leopoldoi | 5/0 | 184/140 | 0/0 | 8/0 | 729/467 | 926/607 |
| C. limai | 1/0 | 0/0 | 0/0 | 0/0 | 0/0 | 1/0 |
| C. paraensis | 59/50 | 29/28 | 13/0 | 2/0 | 135/134 | 238/212 |
| C. pusillus | 3/0 | 2/0 | 0/0 | 0/0 | 0/0 | 5/0 |
| Total | 68/50 | 215/168 | 13/0 | 10/0 | 865/601 | 1171/819 |
Table 3.
Minimum Infection Rate (MIR) estimates and 95% confidence intervals for OROV in Culicoides species across three tested communities within outbreak areas in Minas Gerais, Brazil.
Table 3.
Minimum Infection Rate (MIR) estimates and 95% confidence intervals for OROV in Culicoides species across three tested communities within outbreak areas in Minas Gerais, Brazil.
| Species | Community | No. tested | Positives | MIR (per 1000) | Lower 95% CI | Upper 95% CI * |
|---|---|---|---|---|---|---|
| C. leopoldoi | B | 140 | 0 | 0.0 | 0.0 | 26.3 |
| C. leopoldoi | E | 467 | 0 | 0.0 | 0.0 | 7.9 |
| C. paraensis | A | 50 | 0 | 0.0 | 0.0 | 73.8 |
| C. paraensis | B | 28 | 0 | 0.0 | 0.0 | 132.0 |
| C. paraensis | E | 134 | 0 | 0.0 | 0.0 | 27.5 |
| C. leopoldoi | Overall | 607 | 0 | 0.0 | 0.0 | 6.1 |
| C. paraensis | Overall | 212 | 0 | 0.0 | 0.0 | 17.4 |
* Note: Upper 95% CI reflects maximum plausible prevalence.
Table 4.
Composite uncertainty-weighted entomological alert index for OROV across the three tested communities within outbreak areas in Minas Gerais, Brazil.
Table 4.
Composite uncertainty-weighted entomological alert index for OROV across the three tested communities within outbreak areas in Minas Gerais, Brazil.
| Community | Blood-Fed Vectors (n) | No. of PHA Collectors | Upper 95% MIR (per 1000) | Alert Index | Normalized Risk Index |
|---|---|---|---|---|---|
| A | 35 | 2 | 73.8 | 1291 | 1.00 |
| B | 13 | 2 | 132.0 | 856 | 0.37 |
| E | 44 | 2 | 27.5 | 606 | 0.00 |
Notes: The uncertainty-weighted entomological alert index was calculated as the product of the number of blood-fed C. paraensis per sampling unit (PHA collectors) and the upper 95% confidence limit of the MIR. The normalized entomological alert index was obtained using min-max scaling and is intended solely for relative comparison among communities.
Table 5.
Shannon diversity index (H′) of Culicoides midge communities across five communities within outbreak areas in Minas Gerais, Brazil.
Table 5.
Shannon diversity index (H′) of Culicoides midge communities across five communities within outbreak areas in Minas Gerais, Brazil.
| Community | Shannon Diversity Index (H′) |
|---|---|
| A | 0.508 |
| B | 0.447 |
| C | 0.000 |
| D | 0.544 |
| E | 0.441 |
Notes: Shannon diversity indices (H′) were calculated using effort-corrected and standardized abundance estimates derived from model-based predictions. An H′ value of zero indicates a community dominated by a single species.
Disclaimer/Publisher’s Note: The statements, opinions and data contained in all publications are solely those of the individual author(s) and contributor(s) and not of MDPI and/or the editor(s). MDPI and/or the editor(s) disclaim responsibility for any injury to people or property resulting from any ideas, methods, instructions or products referred to in the content. |
© 2026 by the authors. Licensee MDPI, Basel, Switzerland. This article is an open access article distributed under the terms and conditions of the Creative Commons Attribution (CC BY) license (http://creativecommons.org/licenses/by/4.0/).
Copyright: This open access article is published under a Creative Commons CC BY 4.0 license, which permit the free download, distribution, and reuse, provided that the author and preprint are cited in any reuse.


