Submitted:
12 February 2026
Posted:
14 February 2026
You are already at the latest version
Abstract
Graffiti and mural painting, as essential forms of public visual art, require not only aesthetic planning but also high-precision implementation and control. This study constructs a structured teaching model based on a four-phase framework—"theme design—wall planning—process control—outcome evaluation"—integrated with computational support. Key techniques include image vector mapping, RGB-based color deviation analysis, and 3D wall surface modeling through point cloud reconstruction. Teaching effectiveness was verified via data collected from public wall implementations, using quantitative metrics computed through computer vision modules and spatial analysis algorithms. Results demonstrate significant improvements: 93.8% task completion rate, 16.5% gain in compositional consistency, 21.7% reduction in boundary color error, and a 0.76-point increase in public acceptance score (p<0.05), confirming the feasibility and technical reliability of this computationally augmented art education mode.This study demonstrates that integrating graffiti mural instruction into a structured teaching framework and employing quantitative assessment methods enhances the controllability and replicability of public art education, providing methodological insights for public space art education practices.
Keywords:
graffiti mural painting
; public space art
; art education model
; teaching effectiveness evaluation
; applied art education
CCS CONCEPTS: Applied computing~Arts and humanities~Fine arts.
1. Introduction
As the aesthetic education functions of urban public spaces continue to expand, graffiti and mural painting—as art forms integrating visual communication, social participation, and spatial expression—have gradually become significant extensions of art education. However, current graffiti and mural instruction in public art education still lacks a systematic teaching framework and quantifiable outcome assessment mechanisms. Particularly, the absence of computational modeling—such as image processing for design verification, wall surface point cloud acquisition for layout alignment, and color deviation calculation—limits the standardization and repeatability of instructional processes. To address these shortcomings, this study integrates digital design tools, computer vision-based evaluation algorithms, and 3D simulation techniques into the mural teaching pipeline, forming a measurable and adaptive instructional system that meets the structural demands of applied art education in public space scenarios. Therefore, this study focuses on the teaching needs of graffiti and mural painting in public space contexts. It constructs a teaching model encompassing four stages—“theme design, wall planning, process control, and outcome assessment”—and introduces evaluation mechanisms such as image structure analysis, color deviation measurement, and public acceptance feedback. Through teaching practice and quantitative analysis in real public settings, this model’s effectiveness in enhancing painting precision, spatial adaptation, and group collaboration is validated, providing theoretical support and empirical evidence for constructing public art education systems and innovating evaluation methods.
3. Establishing Graffiti Mural Art Instruction Models for Public Spaces
3.1. Principles for Teaching Model Design
Given the characteristics of public spaces—multiple disruptive factors, large operational scale, and real-time aesthetic feedback—the instructional model design must adhere to three principles: task orientation, process controllability, and structured assessment [2]. Task orientation ensures the learning process aligns with real-world mural creation demands. Process controllability emphasizes embedding step-by-step guidance and error tolerance mechanisms at different stages. Structured assessment requires pre-setting quantifiable metrics across teaching segments to facilitate data collection on key parameters such as work completion, color control, and spatial adaptation. This provides an executable framework for functional segmentation and quantitative modeling of process modules.
3.2. Instructional Process Framework
The teaching process is divided into four phases, each with defined inputs, outputs, and control parameters (see Figure 1). The Concept Design Phase requires completing three sets of conceptual sketches and one color configuration diagram based on a 2×2 m standard grid wall surface. A grayscale layering + CMY color composition scheme is implemented, where grayscale values are first processed using histogram equalization and edge-preserving filters (implemented via OpenCV) to enhance the underlying structural contours. Wall planning involves generating 1:10 scaled drawings and simulating visibility through an RGB-based photometric model. Here, lighting simulation is conducted using Python with the Radiance engine API, ensuring a maximum RGB illuminance difference <15 lx across all sampled zones. The Process Control Phase includes five key checkpoints:Preliminary wall layout composition, primary color block placement, edge refinement, layer integration, and interactive annotation for public spaces. Each milestone has defined tolerance standards (e.g., edge deviation ≤3 cm, color bleed rate ≤5%). The outcome evaluation phase incorporates a structured feedback mechanism, establishing metrics such as image structural consistency scoring, color reproduction deviation rate, and spatial interference tolerance to provide foundational data interfaces for model assessment [3].
3.3. Mechanism of Integrating Computational Techniques into Graffiti Wall Teaching
To enhance the transparency and traceability of computational integration within the instructional pipeline, this section delineates the mapping between key computational techniques and each teaching phase. Table 1 summarizes the specific roles, operation steps, and expected educational outcomes of each core technique within the four-stage model. This mapping ensures that each algorithmic or hardware component is not only functional but pedagogically aligned with learning goals such as structural fidelity, color accuracy, and public interaction feedback.
This modular integration approach enhances the interpretability of algorithmic impact on educational effectiveness, ensuring that computational interventions are measurable, stage-specific, and learning-aligned.
3.4. Construction of the Instructional Evaluation Metrics System
To ensure the measurability of the public space graffiti wall painting teaching process and the quantifiability of outcomes, the evaluation indicator system adopts a multidimensional structured design. It establishes indicator mapping relationships corresponding to the four stages of the teaching process [4]. First, for the theme design and wall planning stage, a composition consistency indicator is introduced. The sketch and wall structure vectors are computed using Scale-Invariant Feature Transform (SIFT) descriptors and vectorized via spatial pooling. Similarity is then calculated using cosine similarity of high-dimensional vectors extracted through OpenCV-based keypoint matching algorithms. The computed composition consistency score provides an objective metric for structure retention during layout transfer, defined as the weighted similarity between the sketch structure vector and the actual wall layout vector:
where represents the spatial vector of the th compositional unit during the design phase, denotes the corresponding wall implementation vector, is the unit weight, and is the number of compositional blocks. For the process control phase, a color control error rate indicator is constructed:
where denotes the actual RGB vector of the th sampling point, represents the target color vector, and indicates the total number of sampling points.
During the evaluation phase, the common space fitness function is introduced, comprehensively considering the viewing distance , occlusion coefficient , and illumination intensity :
where is the normalized weighting coefficient, and and represent the line-of-sight and illumination mapping functions, respectively. These metrics collectively form the teaching evaluation vector, providing a unified data interface for quantifying teaching effectiveness.
3.5. Collaborative Mechanism for Teaching Resources and Public Spaces
To ensure the teaching model’s feasibility and data collectability within public spaces, each phase requires a resource system and environmental coordination mechanism [5]. The thematic design phase necessitates a digital sketchpad system (resolution ≥1920×1080, pressure sensitivity ≥2048 levels) and a 3D elevation modeling platform. This supports constructing virtual wall models of public spaces in OBJ/FBX formats, providing foundational topology for subsequent planning.The wall planning phase requires integrating laser distance meters (error ≤ ±2mm) with facade photogrammetry techniques to capture physical wall 3D point cloud data for establishing mapping matrices:
Where represents the physical coordinate points of the wall surface, denotes the design coordinate points of the image, and signifies the affine mapping matrix. During the process control phase, deploy multi-source recording devices including wide-angle RGB cameras (30fps), infrared depth sensors (ranging from 0.5–5m), and color analysis modules [6] to synchronously capture trajectory data , occlusion status , and color shift . Construct the control coordination function:
Where represents control coefficients, dynamically adjustable during training phases. During evaluation, collaborate with public space managers to deploy observation viewpoint sets and establish perception area coverage metrics:
Where represents the observation angle deviation, denotes the line-of-sight distance, and indicates the perception threshold. This resource-collaborative design system ensures data responsiveness and public space adaptability across all teaching phases, providing end-to-end support for quantitative validation.
4. Experimental Results and Analysis
4.1. Experimental Design
In order to verify the adaptability and validity of the proposed model, 32 non-art majors (N = 32) were chosen and the whole process was carried out in a “6-week × 4-phase” teaching cycle. The experiment was conducted on three separate public walls (measuring 4.2m 2, 6.1m 2, and 7.5m 2 respectively), each corresponding to one of three task themes: abstract graphics, scene reproduction, and visual wayfinding. The outputs of the training phase included: 3 theme drawings, 1 wall building sketch, 5 process records, and 1 final artwork image. Inclusively collected assessment measures included: ① Project completion rate (calculated as the percentage of task completed); ② Composition consistency (calculated through coordinate overlap rate); ③ Color control error rate (quantified as pixel-level color deviation); ④ Acceptance of public space (based on an 8-item, 5-point questionnaire). All data were gathered and managed through a unified Python-based assessment platform that included Pandas for tabular data processing, NumPy for numerical processing, and Matplotlib for visualization of changes across indicators. The platform also integrates a regression model based on TensorFlow-based for detecting anomalies in learning trajectories and adjusting the intensity of guidance [7].
4.2. Analysis of Quantified Teaching Effectiveness Results
4.2.1. Improvement Rates in Work Completion and Compositional Consistency
Work completion rate was calculated based on the ratio of actual wall coverage to completed task items, reaching 93.8% by the end of instruction. Figure 2 visually illustrates changes in contour matching, spatial configuration stability, and boundary filling across completed areas before and after instruction through graffiti-style diagrams. This demonstrates the gradual convergence trend in structural control capabilities, providing foundational support for subsequent analyses of color error and spatial acceptance changes.
Figure 2 shows a quantitative comparison between the completion rate and the composition consistency before and after the instruction. In pre-instruction, the three samples were 62, 70, 66, and 58, 64, and 47% respectively. At the end of the course, these measures improved to 92%, 98% and 92%, respectively, and 91%, 95% and 88% respectively, respectively, and the average score increased from 66% to 94%. Samples with low consistency (for example, Sample 3) demonstrated the most significant improvement after training, with a 41% improvement in composition precision. Color works are better than gray level sketches in graphic closure, color block integrity, and structure fidelity, which proves that the teaching model can effectively support students’ ability to control space and composition.
4.2.2. Analysis of Color Control Error Rate Changes
To further illustrate changes in boundary control capabilities across critical regions, Figure 3 depicts the visual distribution and convergence characteristics of typical color block units under different color error patterns before and after instruction.
Figure 3 illustrates the changes in boundary control deviation for four typical color regions before and after optimization, visually comparing improvements in color boundary accuracy. In the initial state, the red-blue mixed area and purple-green transition zone exhibited the highest color deviation rates, reaching 19.4% and 17.8% respectively. This indicates that mixed and gradient areas are more susceptible to pigment diffusion and color interference, resulting in relatively weaker boundary stability. After optimization, their deviation rates decreased to 5.6% and 5.9%, respectively, demonstrating significant boundary convergence and effective color separation.
The initial error rate for the yellow-highlighted area with black outlines was 14.2%, reduced to 5.9% post-optimization. Key improvements include suppressed color bleeding in the highlighted area and stable control of black outline position. In contrast, errors in the red-blue mixed area primarily concentrated at color block junctions, reflecting the high difficulty of boundary management under multi-layer pigment overlay conditions. The purple-green transition zone exhibited a striped distribution pattern, indicating a pronounced tendency for color diffusion along linear boundaries. These differentiated spatial error characteristics further reveal the complexity in control difficulty across different color structure regions. Overall, the average offset rate across all regions decreased from 17.9% before optimization to 5.75%, significantly reducing boundary error levels. The red dashed line in the figure indicates the ideal boundary position, while the blue solid line represents the actual filled area. After optimization, the overlap between the two significantly increased, visually demonstrating the enhanced boundary accuracy. This marked improvement in boundary overlap indicates the method’s strong effectiveness in controlling colors within high-error areas, providing reliable support for enhancing the overall visual consistency and technical stability of graffiti mural works [8].
4.2.3. Changes in Public Space Acceptance Scores
To assess the adaptability of teaching outcomes in public space contexts, a five-point quantitative questionnaire was administered, covering eight acceptance dimensions. Each dimension was independently scored by at least ten non-participants based on on-site observations, with final scores averaged. Table 2 compares pre- and post-intervention scores.
The statistical analysis of Table 2 reveals substantial improvements across all eight public space acceptance scoring dimensions following the instructional intervention. The highest increase is observed in “Color Harmony,” with a rise of 0.91 points, indicating that students demonstrated significantly improved sensitivity and control in coordinating color schemes to match the visual expectations of public audiences. Similarly, “Visual Appeal” improved by 0.89 points, reflecting enhanced overall aesthetic quality and engagement. “Clarity of Composition” and “Information Conveyance” saw increases of 0.84 and 0.82 points respectively, suggesting that students were better able to organize their visual elements and effectively communicate thematic intentions after the training.
In the dimensions more closely tied to environmental and audience interaction, noticeable gains were also evident. “Disturbance Perception Control” increased by 0.79 points, implying that learners developed greater awareness of how their artwork interacts with its physical context, reducing visual noise or discomfort. “Audience Retention Rate” and “Spatial Memory Trigger Rate” improved by 0.73 and 0.72 points respectively, indicating an enhanced capacity to draw and retain audience attention, as well as to leave a spatial or emotional impression. “Environmental Integration,” while showing the lowest increase of 0.59, still reflects a meaningful improvement in harmonizing the mural with its surroundings. The overall average score increased from 3.24 to 4.00, a gain of 0.76 points, underscoring the broad effectiveness of the intervention across both compositional and experiential aspects of graffiti wall art [9].
4.3. Statistical Significance Verification
In order to verify the statistical significance of the changes in the individual parameters of the instructional intervention, a two-tailed paired t-test was used for the paired pre-intervention and post-intervention data. On the basis of a total sample size of N = 32, a difference sequence was constructed for four metrics — work completion rate, composition consistency, color control error rate, and public space acceptance score — to check if there was a significant deviation from zero. Each metric reflects a distinct dimension of learning effectiveness in graffiti wall painting: task completion rate corresponds to execution efficiency, composition consistency indicates spatial planning proficiency, color control error rate captures visual precision, and public space acceptance quantifies aesthetic and social recognition.
Results showed that the average improvement in work completion rate was 27.8%, indicating a marked enhancement in task execution following the intervention. The average improvement in composition consistency was 16.5%, suggesting better layout and structural planning. Meanwhile, the color control error rate decreased by 21.7%, pointing to improved technical accuracy and control in color application. Lastly, the average increase in public space acceptance score was 0.76 on a 5-point Likert scale, reflecting greater approval from both peers and observers. The corresponding p-values for all four metrics were less than 0.05, leading to the rejection of the null hypothesis at the α = 0.05 significance level. These findings demonstrate that the instructional intervention has a statistically significant impact on multiple dimensions of the learners’ performance. Therefore, the data strongly support the conclusion that the applied teaching strategies effectively enhance student engagement and output quality in graffiti wall painting practices.
5. Conclusion
In summary, establishing a structured, quantifiable graffiti mural teaching model provides a systematic solution for public space art education. The teaching process achieves full controllability from theme design to outcome evaluation. By integrating visual perception feedback with spatial adaptation features, it effectively enhances work completion, compositional consistency, color control precision, and public acceptance. Statistically significant experimental data demonstrate the model’s strong application and promotion value. The innovation lies in embedding traditional interest-driven mural activities into a standardized, computable teaching mechanism. By integrating multidimensional indicator modeling with computer-aided measurement techniques—such as real-time image vector analysis, color deviation computation, and perceptual mapping of spatial data—the system enhances instructional traceability and digital adaptability. This fusion of artistic pedagogy and computational evaluation offers a replicable model for public art education systems, supporting further integration of AR-assisted guidance and AI-based adaptive learning in future work. Current limitations include adaptability challenges in more complex public settings (e.g., non-planar walls, dynamic lighting environments). Future developments should expand the teaching model’s versatility and platform capabilities by integrating AR (augmented reality) and spatial behavioral data to build a more intelligent and interactive public space art education system.
References
- Zheng, X.; Hu, S.; Dwyer, V.; Derakhshani, M.; Barrett, L. Joint Attention Mechanism Learning to Facilitate Opto-physiological Monitoring during Physical Activity. arXiv 2025, arXiv:2502.09291. [Google Scholar] [CrossRef]
- Sutejo, A; Sunarmi, S; Soewardikoen, D W. Integrating Graffiti into Local Culture-Based Art Education: A Case Study in Surabaya. Journal of Innovation in Educational and Cultural Research 2025, 6(4), 799–810. [Google Scholar]
- Ardhitya, Y. The Materiality of Street Art and Public Space Expression: A Literature Review on the Relationship Between Art, City, and Social Identity. Interdisciplinary Social Studies 2026, 5(2), 699–709. [Google Scholar] [CrossRef]
- Adu, I E; Opoku, N; Sarpong, S O. Beyond vandalism: Analysing Graffiti as visual communication and cultural commentary at KNUST. Journal of African Arts and Culture 2025, 8(3), 15–30. [Google Scholar] [CrossRef]
- Wardhana, N; Ellisa, E. Youth tactics of urban space appropriation: case study of skateboarding and graffiti. Journal of Asian Architecture and Building Engineering 2024, 23(1), 465–481. [Google Scholar] [CrossRef]
- Sahabuddin, W; Hildayanti, A. Visual communication in public space through mural art in Makassar, Indonesia. SINERGI 2024, 28(1), 83–92. [Google Scholar] [CrossRef]
- Abbas, W; Sajid, M A; Ahmad, A. A Multimodal Analysis of Graffiti: A Case Study of Government Schools in Punjab, Pakistan. Qlantic Journal of Social Sciences and Humanities 2024, 5(4), 50–55. [Google Scholar] [CrossRef]
- Trihanondo, D; Nithipataraahnan, R. New Form of Social Activism Through Mural Art in Indonesian Schools. KnE Social Sciences 2025, 10(1), 76-83-76-83. [Google Scholar] [CrossRef]
- Riga, C. Graffiti, Street Art and Agency: An Anthropological Theory for Graffiti and Street Art Research. GSA-Graffiti and Street Art 2025, 3(1), 64–73. [Google Scholar]
- Martyka, A M; Rościecha-Kanownik, A; Torres, I F. Mural Painting Across Eras: From Prehistoric Caves to Contemporary Street Art. Arts 2025, 14(4), 77. [Google Scholar] [CrossRef]
Figure 1.
Structural Diagram of Graffiti Mural Teaching Process.
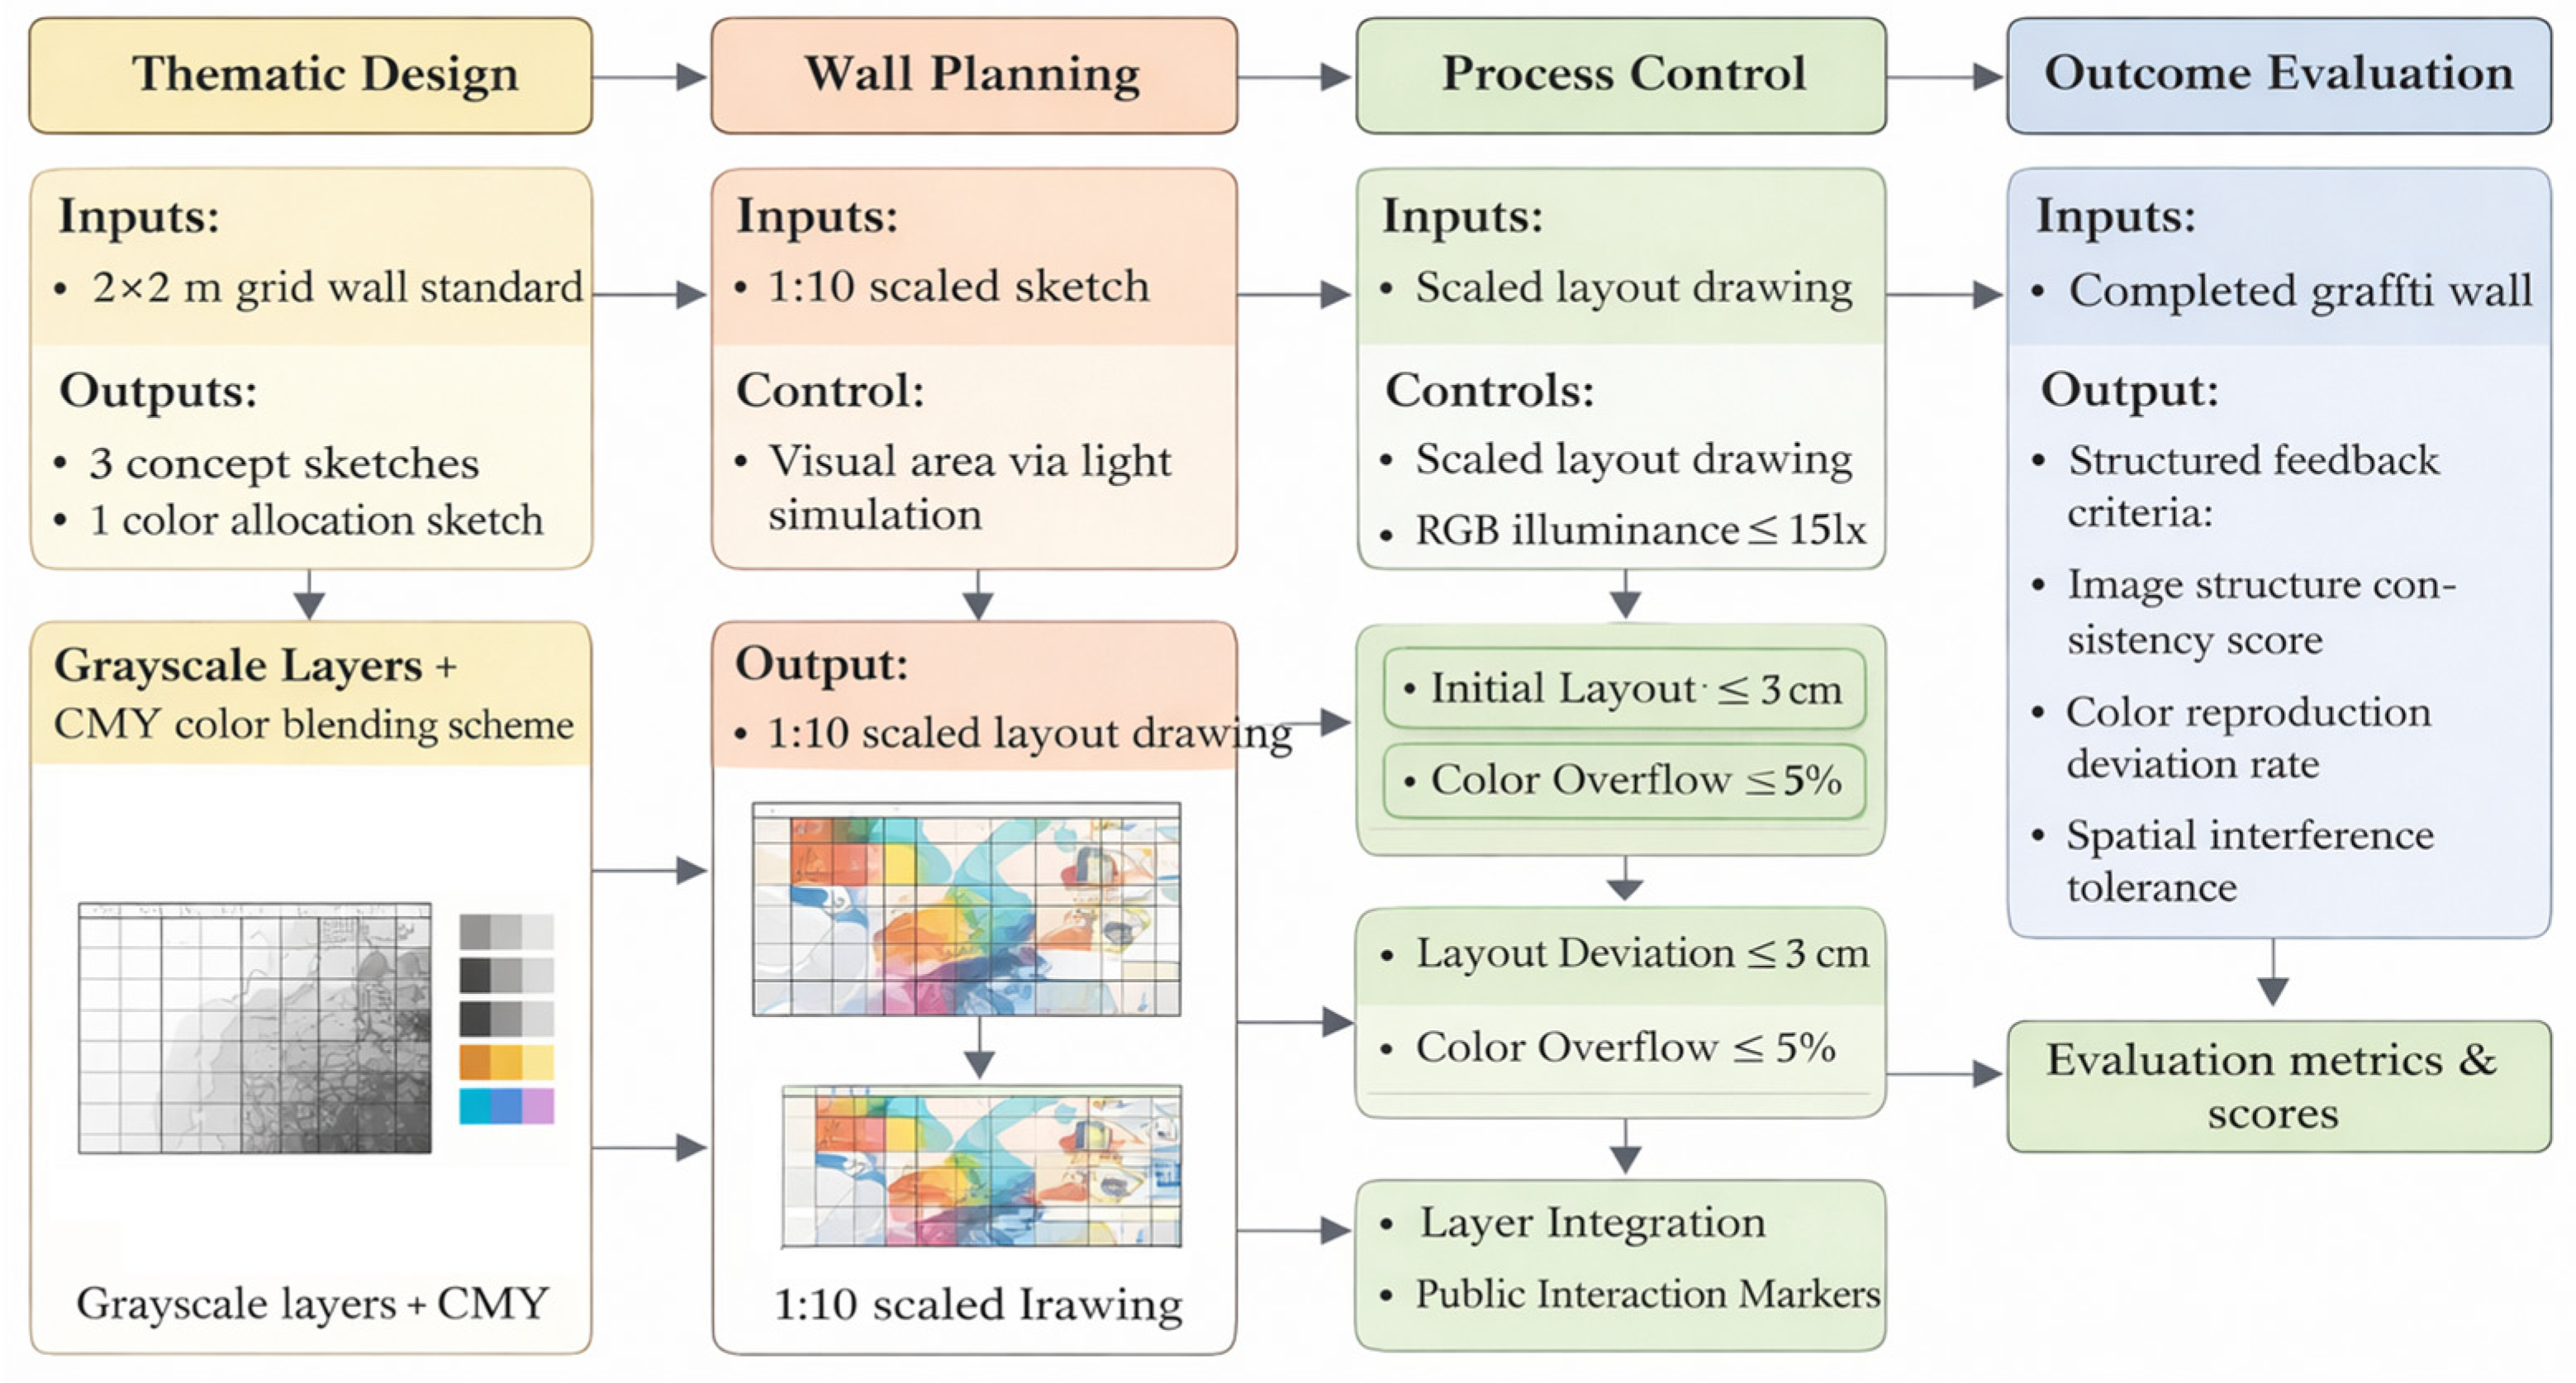
Figure 2.
Pre- and Post-Instruction Comparison of Work Completion Rate and Compositional Consistency.
Figure 2.
Pre- and Post-Instruction Comparison of Work Completion Rate and Compositional Consistency.
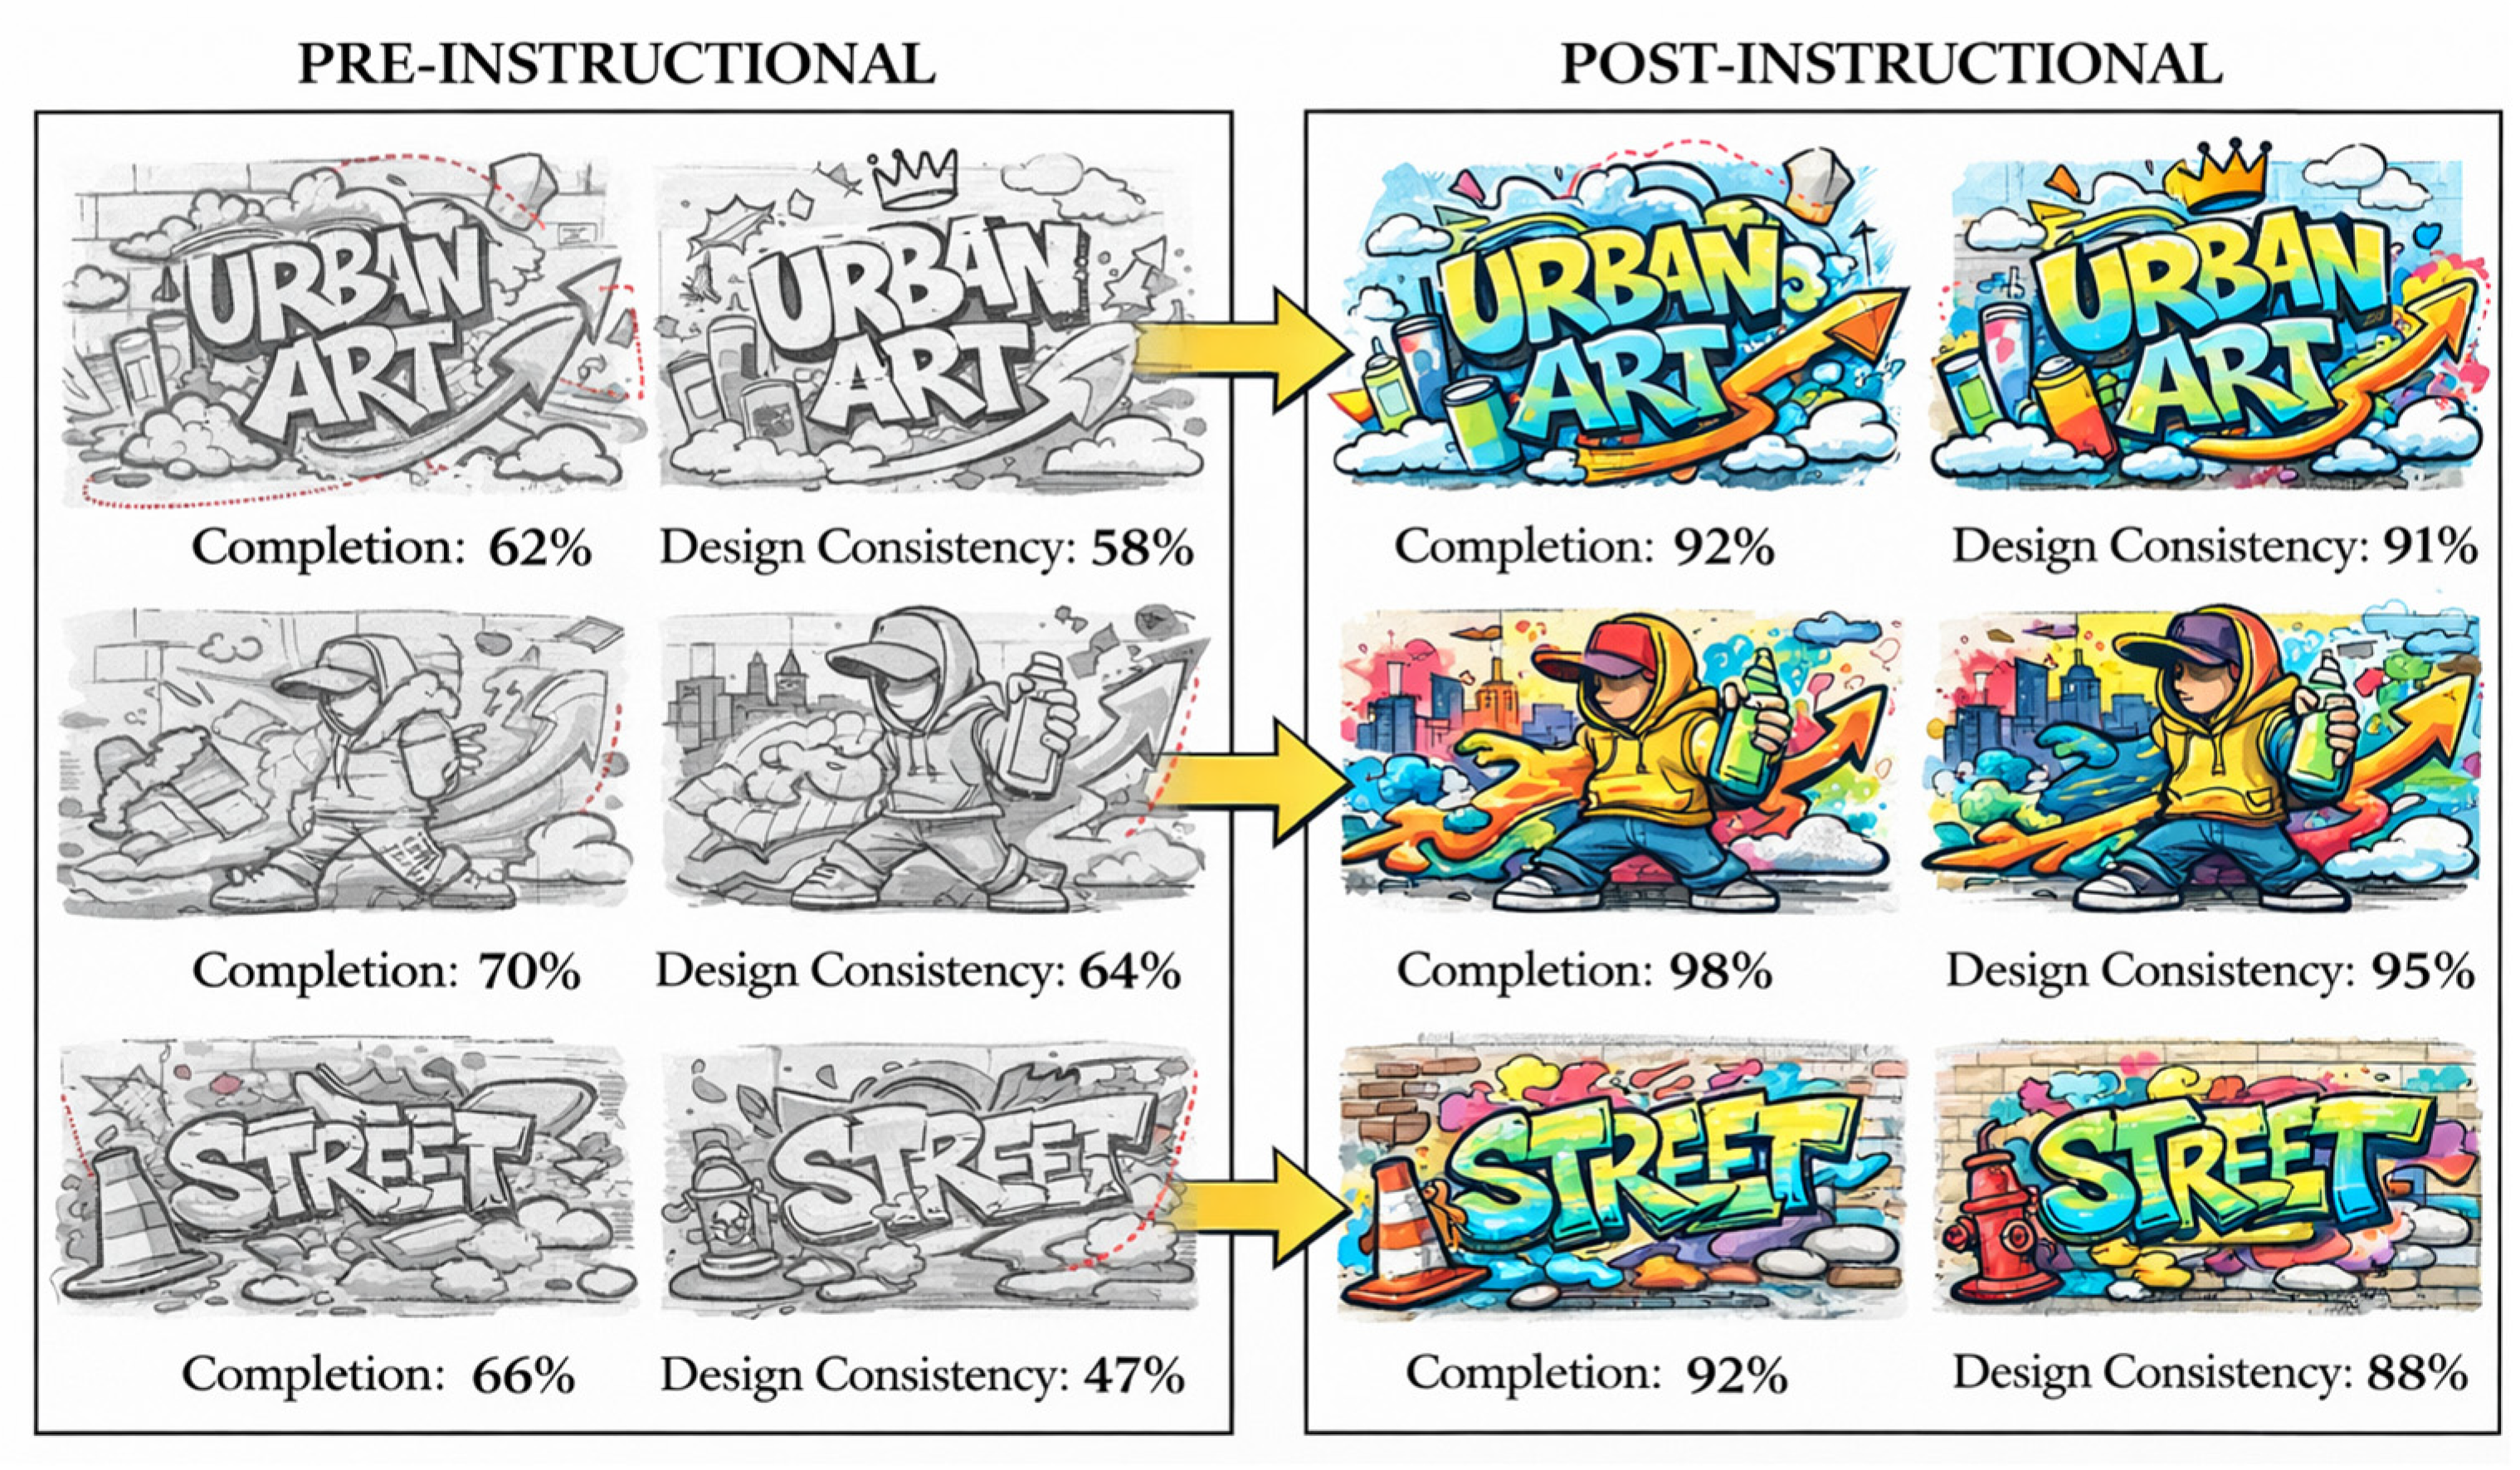
Figure 3.
Color Control Error Zone Doodles.
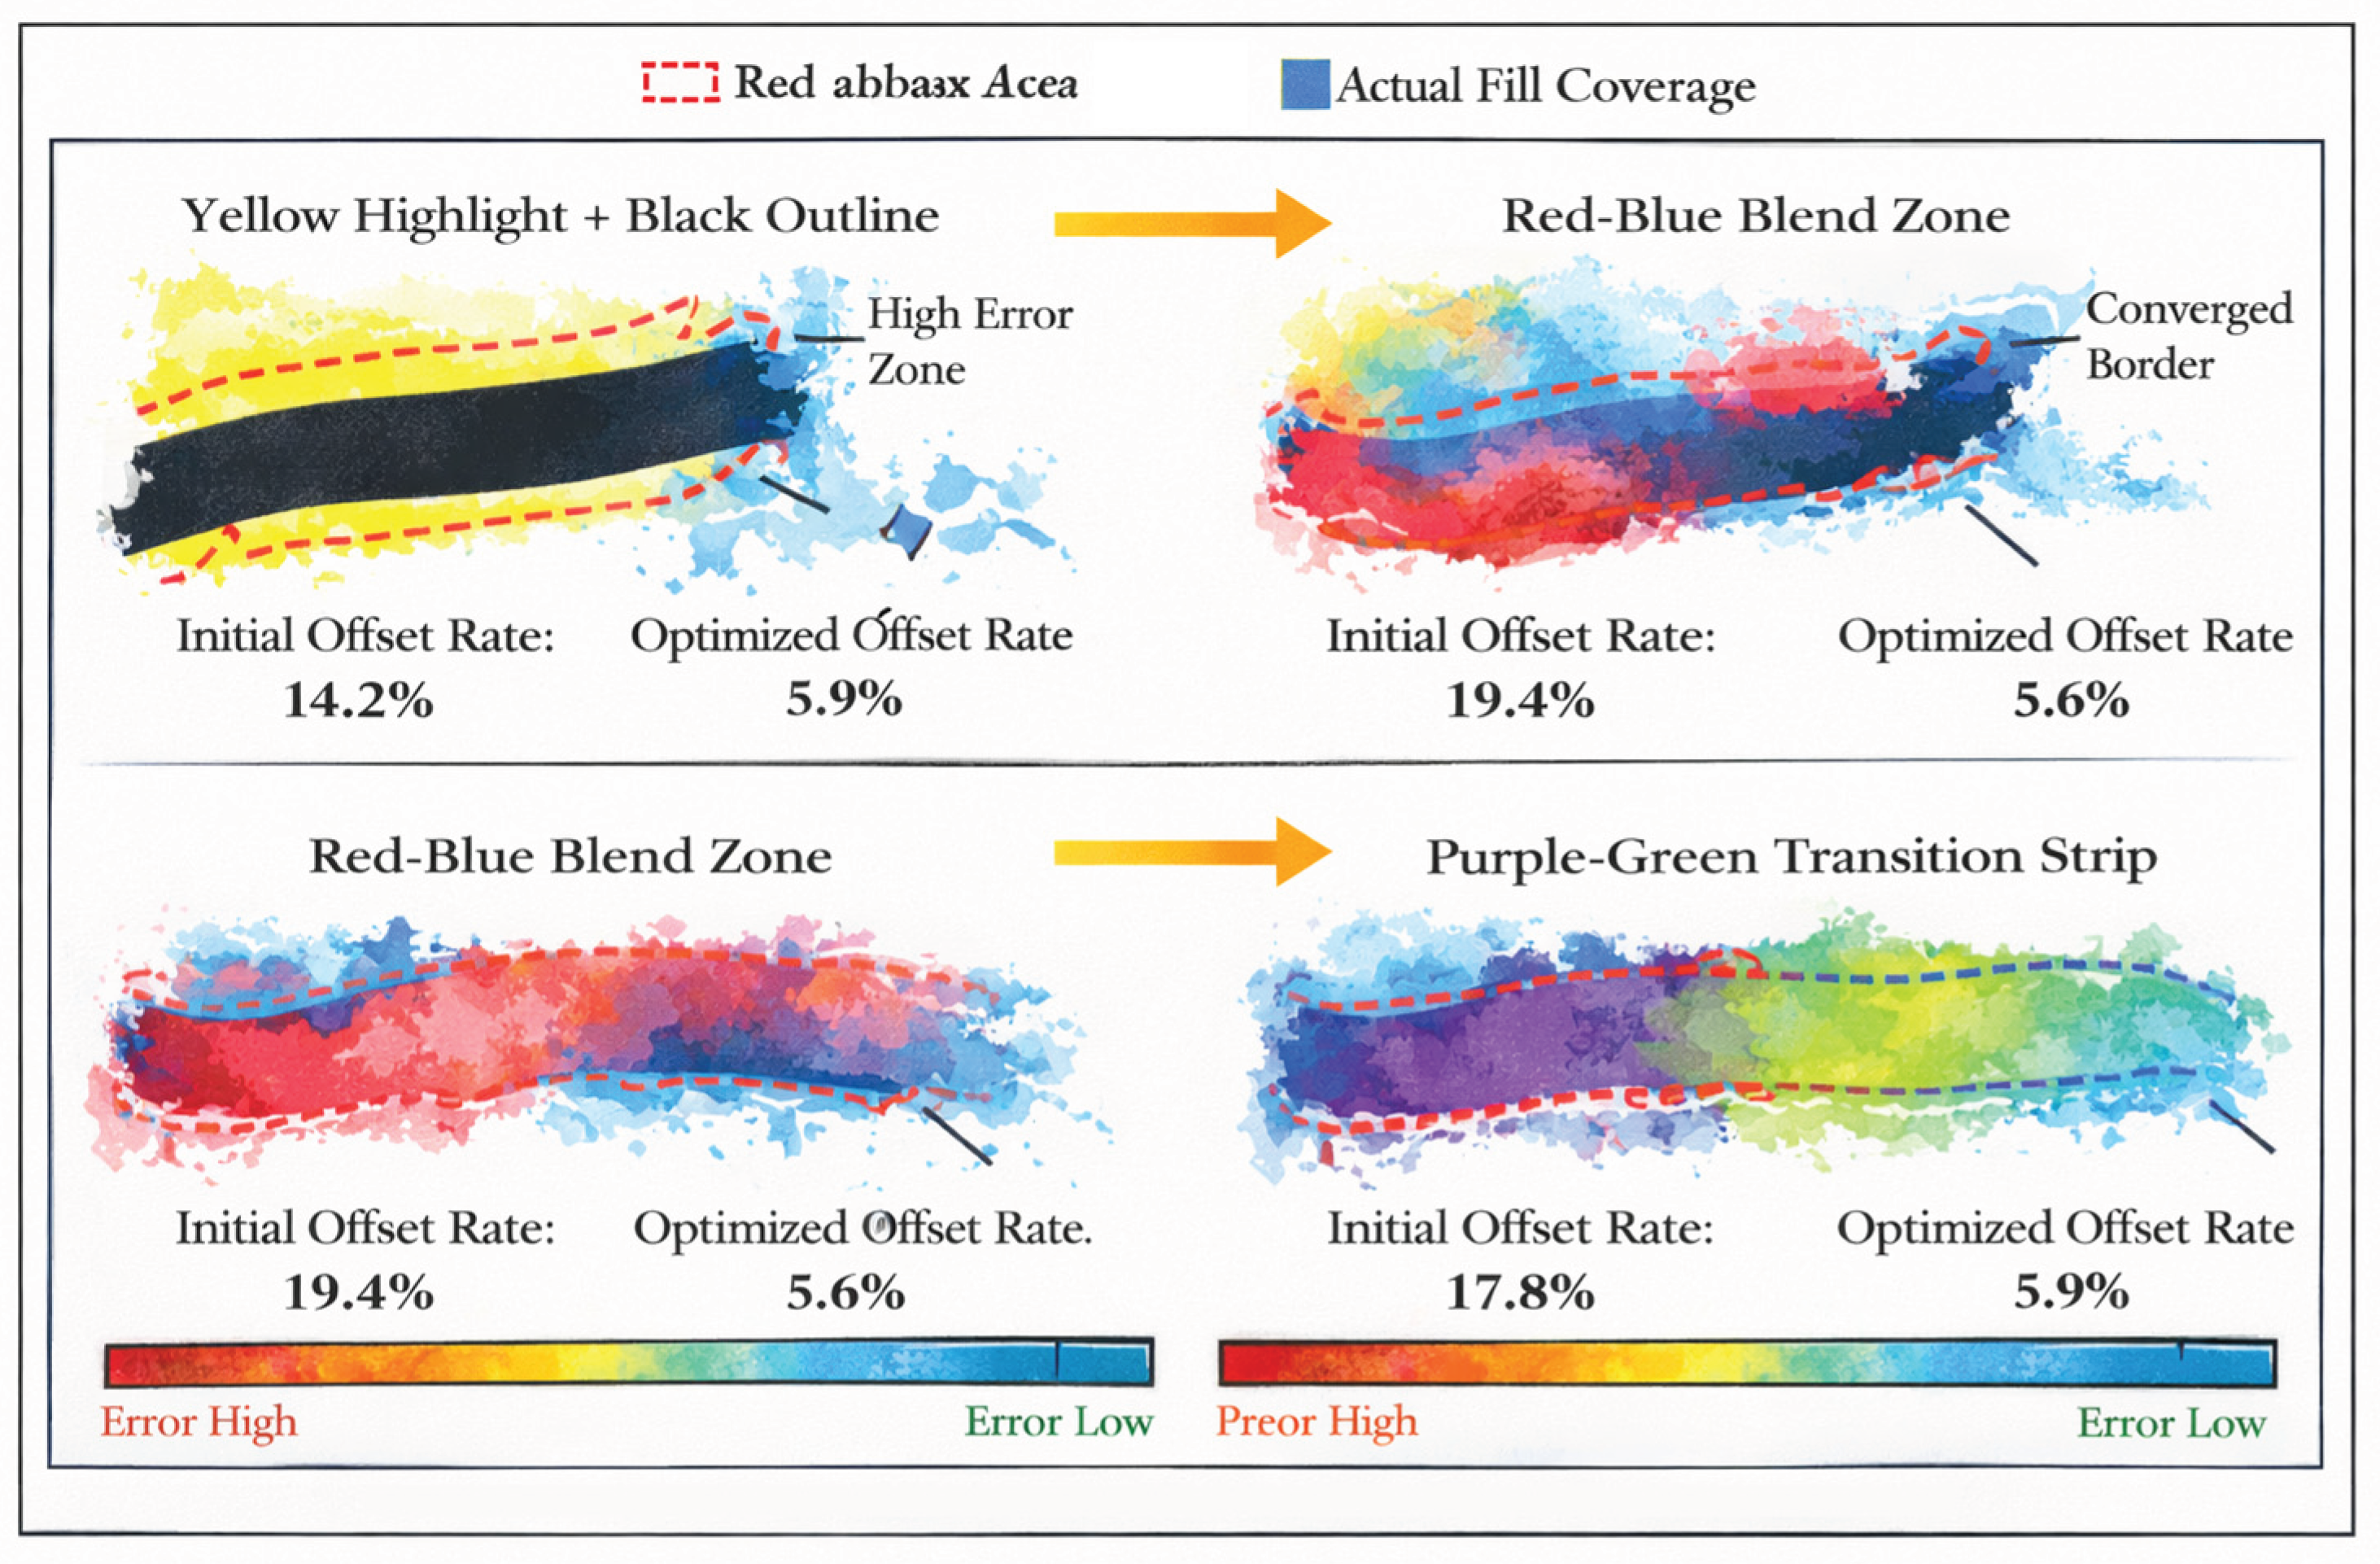

Table 1.
Mapping of Computational Techniques to Teaching Stages, Processes, and Outcomes.
| Teaching Phase | Computational Technique | Operation Workflow | Expected Teaching Outcomes |
| Theme Design | Histogram equalization + edge-preserving filtering (OpenCV) | Enhance visual structure of grayscale sketches for clearer contour identification | Improve layout clarity and thematic structure retention |
| Wall Planning | RGB-based photometric modeling (Radiance API) + Point cloud alignment | Simulate lighting effects; map 3D point cloud to 2D layout matrix | Reduce wall alignment deviation (<2cm); uniform light modeling |
| Process Control | Real-time color deviation detection + edge deviation tracker | Monitor color fidelity and border sharpness using RGB vector streams | Minimize color bleeding (↓ by 21.7%); edge control precision |
| Outcome Evaluation | SIFT-based vector similarity + spatial feedback scoring | Compute compositional consistency and spatial engagement scores from wall-image overlays | Enhance structure fidelity (+16.5%); quantify public acceptance |
Table 2.
Statistical Table of Changes in Public Space Acceptance Scoring Dimensions (5-point scale).
Table 2.
Statistical Table of Changes in Public Space Acceptance Scoring Dimensions (5-point scale).
| Evaluation Dimension | Pre-Teaching Average Score | Post-Teaching Average Score | Change Value (↑) |
| Clarity of Composition | 3.21 | 4.05 | 0.84 |
| Color Harmony | 3.37 | 4.28 | 0.91 |
| Information Conveyance | 3.1 | 3.92 | 0.82 |
| Visual Appeal | 3.44 | 4.33 | 0.89 |
| Environmental Integration | 3.62 | 4.21 | 0.59 |
| Disturbance Perception Control | 3.05 | 3.84 | 0.79 |
| Audience Retention Rate | 3.18 | 3.91 | 0.73 |
| Spatial memory trigger rate | 2.94 | 3.66 | 0.72 |
| Average | 3.24 | 4 | 0.76 |
Disclaimer/Publisher’s Note: The statements, opinions and data contained in all publications are solely those of the individual author(s) and contributor(s) and not of MDPI and/or the editor(s). MDPI and/or the editor(s) disclaim responsibility for any injury to people or property resulting from any ideas, methods, instructions or products referred to in the content. |
© 2026 by the authors. Licensee MDPI, Basel, Switzerland. This article is an open access article distributed under the terms and conditions of the Creative Commons Attribution (CC BY) license.
Copyright: This open access article is published under a Creative Commons CC BY 4.0 license, which permit the free download, distribution, and reuse, provided that the author and preprint are cited in any reuse.


