
Submitted:
11 November 2024
Posted:
12 November 2024
You are already at the latest version
Abstract
This study investigates cognitive processes during imagined assembly of visual-object and visual-spatial tasks across varying difficulty levels. We developed an Imagined Assembly Task showing visual-object and visual-spatial educational play materials and target outputs that can be made from those materials. Participants performed this task, visualizing assembly steps, reporting imagery distinctness, and counting mental steps, while also rating tasks’ educational value and at-attractiveness. They also reported their imagery skills and art- and STEM-related aptitudes. Results indicated that spatial tasks required fewer mental steps but did not differ in imagery distinctness from object tasks. Higher task difficulty led to increased mental steps and decreased imagery distinctness for both types, with spatial tasks showing greater declines in imagery distinctness. Spatial tasks were rated higher in educational value, linked to STEM, and expected to be more attractive to boys, especially at higher difficulty levels, while object tasks were associated with art education and rated as more attractive for girls. Participants with stronger object imagery skills showed fewer mental steps and greater imagery distinctness, while spatial imagery skills correlated with distinctness in spatial tasks. This research offers insights into object and spatial imagery processing, with implications for creating instructional tools across Arts and STEM domains.
Keywords:
imagery
; mental visualization
; object imagery
; spatial imagery
; mental simulation
; art and STEM
; educational toys
1. Introduction
1.1. Object vs. Spatial Imagery
Mental visualization, or "visual imagery," refers to mentally representing and processing visual information without direct perceptual input. Visual imagery plays a crucial role in tasks ranging from everyday problem-solving to professional performance in fields such as visual arts, design, engineering, and science [1]. Research has documented significant individual differences in visual imagery abilities and experiences [2,3,4,5,6]. Object and spatial imagery are identified as distinct cognitive faculties that rely on different neural mechanisms, indicating they represent separate dimensions of visual processing. The dissociation between object and spatial imagery aligns with ventral (“what”) and dorsal (“where”) cortical streams in the visual system [7,8], suggesting that these pathways support distinct imagery faculties. Object imagery, like visualizing the face of a friend, relies on the ventral pathway, while spatial imagery, such as mental rotation, relies on the dorsal pathway. Damage to these brain pathways selectively impairs object or spatial imagery abilities, supporting the separation of object and spatial imagery systems [9].
Research on individual differences in visual skills has distinguished between the two dimensions: object imagery, involving properties like color, shape, brightness, and texture, and spatial imagery, involving locations, spatial relations, and transformations [1,10]. Kozhevnikov et al. identified two types of visualizers: object visualizers and spatial visualizers. Object visualizers excel in visualizing pictorial properties, while spatial visualizers excel in representing spatial relations. These differences are reflected in cognitive performance across multiple measures; for example, object visualizers excel in tasks such as recognizing degraded objects, whereas spatial visualizers excel in tasks such as mental rotation. Object vs. spatial distinction also extends to cognitive styles, defined as consistent ways of acquiring and processing information [11]. Additionally, research reported that different types of imagery can be differentially recruited in object and spatial tasks, with variability in imagery experiences (e.g., subjective vividness) within individuals depending on task type. For example, research [12] examined imagery experiences elicited by reading visual-object versus visual-spatial texts. Participants rated higher their object imagery experiences (e.g., colors, textures, and details) during processing visual-object texts and rated higher their spatial imagery experiences (e.g., positions, movements) during processing visual spatial texts.
Previous literature highlights differences between object and spatial imagery in terms of imagery characteristics (e.g., overall vividness, color and spatial experiences) and processing strategies (e.g., holistic vs. part-by-part). Interviews conducted with professionals in visual arts and science revealed notable differences in how these groups describe their mental imagery processes [1]. Visual artists tend to generate imagery holistically, beginning with an overall structure and general color scheme. In contrast, scientists describe their imagery construction as a step-by-step, sequential process, focusing on intentional, controlled, flexible, and transformable spatial images. Artists, however, perceive their object imagery as more persistent, but less controllable and transformable. Other studies using think-aloud protocols and eye-tracking during physics problem-solving support the link between spatial visualization ability, mental visualization processing characteristics, and spatial problem-solving efficiency [13].
Imagery abilities and styles are linked to academic and career specialization in science and art fields. Spatial imagery is associated with success in STEM [1,14,15]. Conversely, low spatial imagery correlates with challenges in STEM, mathematics learning disabilities, poor spatial orientation, and motor coordination difficulties [16,17,18]. Object imagery relates to artistic creativity, while spatial imagery aligns with scientific creativity [19]. Studies with gifted adolescents also highlight distinctions in creative processes and outputs in art, science, and humanities, reflecting differences in object versus spatial visualization [20,21]. Remarkably, imagery can be used to simulate a potentially observable process, such as in mental simulations or thought experiments. It is often reported as a valuable tool for fostering creativity in the fields of science and art. This visualization process allows individuals to perform mental manipulations, leading to novel insights and innovative solutions in both domains [22,23].
Further, research shows that visual-spatial skills in early childhood can be developed through play activities that enhance spatial awareness, reasoning, and imagery [24]. Manipulative toys are known to support children's development of diverse visualization skills by engaging them in hands-on exploration and creative construction activities. Studies consistently link spatial play, such as building blocks and puzzles, with improved spatial visualization abilities, like mental rotation and transformation [25,26,27]. Experimental work also suggests that construction play can causally enhance spatial skills [28]. However, past research has often focused exclusively on spatial play and its connection to spatial visualization, leaving non-spatial visual skills and diverse play preferences less explored [29]. Recent findings [30] indicate a dissociation between preferences for visual-object play (e.g., drawing, crafting) and visual-spatial play (e.g., construction toys), which align with dissociation in object versus spatial visualization abilities and respective aptitudes in art and science. Notably, while females showed a preference for visual-object play and males for visual-spatial play, the structure of these preferences was similar across sexes, suggesting these differences are not solely due to gender.
While previous research has distinguished object and spatial imagery abilities and their links to performance in arts and STEM domains, less is known about how these skills operate and their processing-related characteristics. One problem that limits our understanding of the mechanisms differentiating visual-object and visual-spatial imagery, is related to the existing imagery assessments. That is, object imagery tends to be measured via self-reports, while spatial imagery is more frequently measured with performance tests [31]. Prior studies often lack an exploration of object and spatial visualization characteristics using comparable visual-object and visual-spatial tasks. Additionally, phenomenological experience of imagery is often assessed solely on vividness scales, while other approaches are rare. Moreover, previous research rarely simultaneously addresses both the social and cognitive aspects of imagery, which limits its applications in educational and psychometric contexts.
1.2. Present Study
Our study aimed to contribute to understanding how the mental imagery processes differ between visual-object and visual-spatial tasks, especially under different levels of difficulty. In our research, we developed the Imagined Assembly Task, where participants were shown images of creative materials and a target output, and were asked to mentally visualize the step-by-step assembly process without physically constructing anything. This required participants to mentally simulate the assembly process rather than engage in hands-on building, while recording their imagery vividness and counting each step in creating the final product from the provided materials. The current study examined subjective visualization processes in visual-object and visual-spatial imagery tasks at different difficulty levels. It investigated how participants visualize the assembly process, assessing the number of mental steps and vividness of mental imagery.
Besides, we investigated how individual differences — such as object and spatial imagery skills and aptitudes in art and STEM fields—relate to visualization processes during the imagined assembly of object vs. spatial tasks.
Finally, our research aimed to address both cognitive and social aspects that are often treated separately, providing insights for design of imagery tasks in educational and psychometric applications. We explored the perceptions of the educational purpose and attractiveness of object and spatial tasks, including their attractiveness for boys versus girls, and examined how these perceptions might vary by task type and difficulty.
2. Materials and Methods
2.1. Participants
Two hundred and forty-four participants from Turkey and Russia completed our online survey. Of these, 196 participants completed 100% of the survey, while 48 had partial completion. As our primary measure, the Imagined Assembly Task, consisted of multiple trials presented in a random order, we retained partial data from participants who completed the first part of the survey (imagery questionnaires) and at least three trials of the Imagined Assembly Task. The final data set included 156 participants from Turkey (105 females, 51 males, aged 18-34 years) and 88 participants from Russia (58 females, 30 males, aged 18-69 years). The survey was available in English (Turkish participants were university students with English as the language of instruction) and Russian. Survey completion took approximately 60-90 minutes. Participants received course credit or participated voluntarily. The study was approved by the institutional ethics board, and all participants provided their consent.
2.2. Assessments and Measures
2.2.1. Object-Spatial Imagery and Verbal Questionnaire (OSIVQ)
OSIVQ [32] is a self-report instrument measuring individual differences in object imagery, spatial imagery, and verbal skills. The object imagery scale assesses cognitive styles and skills related to processing colorful, pictorial, and vivid object representations; the spatial imagery scale assesses skills related to processing spatial relations and transformations; and the verbal scale assesses skills related to language use. Participants rated their agreement with 45 statements assessing object (e.g., “My images are very colorful and bright”), spatial (e.g., “My images are more like schematic representations of things and events”), and verbal (e.g., “When explaining something, I would rather give verbal explanations than make drawings or sketches”) dimensions on a 5-point Likert scale (1 = Totally disagree, 5 = Totally agree). Cronbach’s α for the object, spatial, and verbal scales are .83, .79, and .74, respectively [32]. Later we refer to these scales as Object imagery skills, Spatial imagery skills, and Verbal skills.
2.2.2. Aptitudes in Different Domains
Participants evaluated their abilities in different specialization domains on a scale from 1 to 5 (1 = very poor; 5 = extraordinary): 1) Visual art, design, realistic drawing with color; 2) Physics, math, computer programming, engineering; 3) Writing, history, philosophy, literature. This 3-item measure has been used in previous studies and has shown associations with measures of object and spatial imagery, verbal skills, and play [30,33]. Later we refer to these measures as Art aptitude, STEM aptitude, and Humanities aptitude.
2.2.3. Imagined Assembly Tasks
This task was created to measure visual-object and visual-spatial mental visualization processes. Participants were presented with 90 stimuli depicting visual assembly tasks using educational toys. These stimuli represented 15 visual-object tasks (Object tasks) and 15 visual-spatial tasks (Spatial tasks), each with 3 versions, at 3 levels of difficulty. The different types of tasks were designed based on previous literature [32] describing object vs. spatial processing differences, i.e., in terms of visual-object (e.g., color and texture) and visual-spatial (e.g., spatial relations and motion) visual characteristics. The complexity manipulation was achieved by progressively increasing the number of details and actions required to perform the task, ranging from the easiest level (L1) to the medium level (L2), and then to the hardest level (L3). Each stimulus consists of an image representing creative materials along with the target output to be made from these materials (see examples in Figure 1). The stimuli are available on OSF [34].
Notably, these stimuli were previously developed in a field edutainment study [35], where children received manipulative materials such as educational toys (e.g., painting sets or mechanical construction kits) along with step-by-step visual instructions and were asked to physically construct the given outputs from the provided materials. In the current study, only the first image, showing the materials, and the final image, showing the completed creative output, were included, while the step-by-step visual instructions were omitted.
For each stimulus block, participants were asked to mentally assemble the specific target output from the shown materials. All 90 stimulus blocks (45 Object tasks, 45 Spatial tasks, with 15 stimuli at each Difficulty Level) were presented in random order, but the questions within each block followed the sequence described below: mental assembly while counting steps, imagery clarity and distinctness rating, questions about the educational value and attractiveness of the play task.
Mental Steps Count. Participants were instructed: “Imagine (visualize in your mind) the step-by-step process of making this creative output (last image) from the provided materials (first image). While imagining, mentally count the steps needed to create this output,” and to “Write below the number of steps.” They entered their answer in the textbox below the image on the same page. To allow for natural variation in mental assembly, we deliberately chose not to define what a "step," leaving the interpretation up to each individual. This approach lets participants decide how to segment the assembly process based on their own mental strategies.
Imagery Clarity and Distinctness. After visualizing the process, the next page, participants viewed the same stimulus again as a reminder and were asked to evaluate their mental imagery vividness: “Evaluate on a 1-5 scale the clarity and distinctness of your visual imagery for the process of creating this output from the provided materials,” with the following scale: 1 = 'Nothing at all, you only know that you are thinking about it'; 2 = 'Vague and indistinct'; 3 = 'Moderately clear and distinct'; 4 = 'Clear and distinct'; 5 = 'Perfectly clear and distinct, just like you are really seeing it.' The current scale was modified from the Vividness of Visual Imagery Questionnaire [5] and replaced ‘vivid’ with ‘distinct’. As ‘vividness’ was found to be associated more with object rather than spatial imagery [33], we expected that ‘distinct’ could apply better to both object and spatial imagery. This modified scale was previously used [12] for assessing imagery evoked by object and spatial descriptions. Below, we refer to this measure as distinctness.
Educational Value in Different Domains (Art and STEM). Next, participants were asked to evaluate the play tasks using a Likert scale (1 = ‘Strongly disagree’; 8 = ‘Strongly agree’). They responded to the question: “This task develops children's abilities in…” separately for “visual art (drawing skills, aesthetic taste, sense of beauty)” and “STEM (science, technology, engineering, and mathematics).”
Attractiveness for Different Genders (Girls and Boys). Finally, using the Likert scale (1 = ‘Strongly disagree’; 8 = ‘Strongly agree’), participants answered: “This task would be preferred by a…” separately for “girl” and “boy.”
3. Results
As the results from the two cultural samples revealed highly consistent patterns (see Appendix A, Figure A1), below we report the data from the combined dataset (shared at OSF [34]).
3.1. The Effects of Difficulty Level and Task Type on Cognitive Imagery Processes
3.1.1. Mental Steps Count
The repeated measures analysis was conducted on mental steps count across Difficulty Levels (L1, L2, and L3) and Task Types (Object and Spatial), see Figure 2. Sphericity was violated for Difficulty Level variable and interaction, so a Greenhouse-Geisser correction was applied.
The analysis revealed significant effects of Difficulty Level, F(1.491, 337.004) = 35.903, p < .001, η² = .137. Pairwise comparisons showed significant differences in mental steps counts between each Difficulty Level (all p ≤ .001), confirming that our L1-L2-L3 tasks progressively increased the number of mental steps required for mental assembly. This data verifies that our Imagined Assembly tasks, designed to represent three levels of difficulty, were indeed perceived as such.
Additionally, there was a main effect of Task Type, F(1, 226.000) = 14.848, p < .001, η² = .062, with Object tasks involving more steps overall.
No interaction effect between Difficulty Level and Task Type was found, F(1.257, 284.117) = 1.471, p = .231, η² = .006, indicating that the difficulty-related increase in mental steps count was consistent across both Object and Spatial tasks.
3.1.2. Imagery Distinctness
The repeated measures analysis was conducted on distinctness ratings across Difficulty Levels (L1, L2, and L3) and for different Task Types (Object and Spatial), see Figure 3. Sphericity was violated for Difficulty Level variable, so Greenhouse-Geisser correction was applied.
The analysis revealed significant effects of Difficulty Level, F(1.706, 390.646) = 164.623, p < .001, η² = .418. Pairwise comparisons showed significant differences in distinctness between each difficulty level (all p ≤ .001), confirming that our L1-L2-L3 tasks progressively decreased the subjective imagery distinctness of mental assembly process.
There was no effect of Task Type, F(1, 229) = 0.010, p = .920, η²< .001. The distinctness of the Object and Spatial tasks did not differ.
The interaction effect between Difficulty Level and Task Type was significant, F(2, 458) = 26.554, p < .001, η² = .104, indicating that the difficulty-related decrease in distinctness was more pronounced for Spatial tasks.
3.2. The Effects of Difficulty Level and Task Type on Educational Value and Attractiveness
3.2.1. Educational Value in Art and STEM Domains
The repeated measures analysis was conducted on educational value ratings across Difficulty Levels (L1, L2, and L3), for different Task Types (Object and Spatial), and Educational Domain (Art and STEM) (see Figure 4, and Figure A1 in Appendix). The assumption of sphericity was not violated.
The effect of Difficulty Level, F(2, 458) = 29.907, p < .001, η² = .116, indicated that perceived educational value overall increased with Difficulty Level. Significant differences were only observed between all the levels, pairwise (all p < .001).
The effect of Task Type, F(1, 229) = 40.501, p < .001, η² = .150, showed that Spatial tasks were rated as having higher educational value than Object tasks.
The effect of Educational Domain, F(1, 229) = 40.154, p < .001, η² = .149, revealed that evaluations of our tasks in terms of their educational value were higher for Art Domain. Although this finding may seem unexpected, it could be explained by the significant interaction effects (i.e., low educational value of Object tasks in STEM domain considerably decreased the overall evaluations for STEM domain).
The interaction between Educational Domain and Task Type, F(1, 229) = 907.055, p < .001, η² = .798, indicated that in the Art domain, Object tasks were consistently rated higher in its education value than Spatial tasks, suggesting that Object tasks are more strongly associated with developing abilities in Art. In contrast, in the STEM domain, Spatial tasks received higher ratings than Object tasks, indicating a stronger association of Spatial tasks with skill development in STEM.
The interaction between Difficulty Level and Educational Domain, F(2, 458) = 6.720, p = .001, η² = .029, showed that in the Art domain, educational value ratings increased very slightly, while in the STEM domain, ratings increased more with higher difficulty levels.
The interaction between Difficulty Level and Task Type, F(2, 458) =2.790, p = .062, η² = .012, revealed a similar pattern, i.e., educational value ratings for Spatial task increased more as Difficulty Level increased, however this effect did not reach significance.
The 3-way interaction, F(2, 458) = 8.817, p < .001, η² = .037, demonstrated that the effect of task Difficulty Level on perceived educational value varied by both Task Type and Educational Domain. Specifically, while Object tasks were perceived as more effective for developing abilities in Art, Spatial tasks were seen as more effective for STEM, with educational value ratings increasing with Difficulty Level only for Spatial tasks within the STEM domain.
3.2.2. Attractiveness for Girls and Boys
The repeated measures analysis was conducted on preference (attractiveness) ratings across Difficulty Levels (L1, L2, and L3), Task Types (Object and Spatial), and Genders (Boys and Girls), as shown in Figure 5 (see also Figure A1 in Appendix). Mauchly's test for sphericity showed, violations of sphericity (Difficulty Levels variable and interactions with), thus Greenhouse-Geisser corrections were applied.
The effect of Difficulty Level, F(2, 418.928) =.463, p = .630, η² = .002, was not significant.
The effect of Task Type, F(1, 229) = 1.912, p = .168, η² = .008 was also not significant.
The effect of Gender, F(1, 229) = 5.865, p = .016, η² = .025, indicated that higher tasks attractiveness was expected for Boys’ preferences.
The interaction between Gender and Task Type, F(1, 229) = 322.581, p < .001, η² = .585, indicated that Boys were expected to have a higher attractiveness for Spatial tasks over Object tasks. Vise versa, that Girls were expected to have a higher attractiveness for Object tasks over Spatial tasks.
The interaction between Difficulty Level and Gender, F(2, 415.577) = 4.775, p = .009, η² = .020, indicated that Boys were expected to prefer the higher difficulty levels, while girls were expected to prefer easier tasks.
The interaction between Difficulty Level and Task Type, F(1, 456.887) = 2.796, p = .062, η² = .012, was not significant.
The 3-way interaction, F(1, 443.726) = 8.095, p < .001, η² = .034, showed that the effect of Difficulty Level on expected attractiveness ratings varied by both Task Type and Gender. While Object tasks were perceived as more attractive for Girls than for Boys, Spatial tasks were perceived as more attractive for Boys than for Girls. Additionally, attractiveness ratings for Spatial tasks increased with difficulty level only for Boys, whereas for Girls, a slight downward trend in attractiveness ratings was observed as difficulty increased.
3.3. Correlations Between Individual Differences Measures and Imagined Assembly Task Cognitive Processing Measures.
Given that some of our variables exhibit excessive skewness and kurtosis, we used Spearman's correlation for analyzing the relationships among variables. Intercorrelations between individual differences measures and our task processing-related measures are presented in Table 1.
The OSIVQ-object scale correlated positively with Art aptitude and, to a lesser extent, with humanities aptitude, while it negatively correlated with STEM aptitude. In contrast, OSIVQ-spatial showed a positive correlation with STEM aptitude and a negative correlation with humanities aptitude. OSIVQ-verbal was highly and positively associated with correlation with humanities aptitude.
Furthermore, the OSIVQ-object scale correlated negatively with the mental steps count for Object tasks, a trend also evident at each difficulty level. A similar, though weaker and inconsistent, pattern was observed for correlation between the OSIVQ-object scale and mental steps count for Spatial tasks. Furthermore, OSIVQ-object positively correlated with the distinctness of mental visualization during Object tasks, which was consistent across all difficulty levels, and to a lesser degree with imagery distinctness for Spatial tasks.
Neither OSIVQ-spatial nor OSIVQ-verbal correlated with mental steps counts for either Object or Spatial tasks. At the same time, OSIVQ-spatial was uniquely related to the distinctness of mental visualization during Spatial tasks, consistent across all difficulty levels. Similarly, STEM aptitude positively correlated with distinctness ratings of Spatial tasks at all difficulty Levels. OSIVQ-spatial imagery, however, was not associated with distinctness ratings of Object tasks, suggesting that spatial imagery skills may represent a more isolated cognitive ability. Moreover, spatial and verbal measures appeared to be negatively related: OSIVQ-verbal was negatively associated with both OSIVQ-spatial imagery and distinctness ratings of Spatial tasks. Humanities aptitude also negatively correlated with distinctness ratings of Spatial tasks across all difficulty levels.
Various measures of mental step count consistently correlated negatively with various distinctness measures, suggesting that clarity and distinctness of mental representation decline as task difficulty increases.
4. Discussion
Our study employed the Imagined Assembly Task to examine the effects of task type and difficulty level on imagery processes, measured through subjective mental steps count and imagery distinctness ratings. Notably, consistent patterns emerged in two independent samples from different cultures (Appendix B, Figure B1), adding robustness to our findings.
4.1. The Influence of Task Type and Difficulty Level on Imagery Processes
4.1.1. Difficulty Level
Our results showed that as Imagined Assembly Task became more difficult, the number of mental steps increased. This data supports our task difficulty manipulation, demonstrating that as imagined assembly becomes more challenging, more mental steps are required for completion. It also suggests that the segmentation of a visual process performed in imagery may serve as an estimate of cognitive effort related to difficulty.
The segmentation of experiences and defining events’ boundaries comes naturally to humans during perception of events [36,37]. Most of the segmentation studies used paradigms where an event was segmented during perceiving it (e. g., while watching video). In our study, however, the process occurred in mental imagery, which contributes to this literature and shows that experiencing a visual assembly process in imagery resembles perceptual experience. Besides, our data aligns with experiments showing that imagery processing time (e.g., mental scanning time) is linearly increasing with increasing distances or stimuli complexity, similar to perception [2]. For example, mental rotation of three-dimensional objects takes more time when the object must be rotated at a greater degree [38]. Our data indicate that imagined action resembles physical activity, supporting depictive view of imagery, and suggesting that information in visual imagery is represented in similar format with visual perception.
Furthermore, we found that as Imagined Assembly Task became more difficult, the distinctness of the mental imagery declined. Similarly, other studies reported that vividness of imagery declines as the complexity and number of stimuli increases [12], suggesting that there are capacity limits in imagery, similar to those in working memory [39,40]. Other studies also showed that vividness ratings may decrease in case of competition for the limited WM resources [41].
4.1.2. Task Type
Our results revealed that object tasks involved overall higher mental step count than spatial tasks. Since step count increased with task difficulty, this may indicate a higher complexity of object tasks compared to spatial tasks. This increased complexity could be due to greater visual richness of object imagery, requiring participants to mentally attend to multiple pictorial details and more mental rehearsal, resulting in segmentation of the imagined assembly process in more steps. Interestingly, however, despite involving more steps, the clarity and distinctness of object and spatial tasks did not differ significantly.
The higher mental step count for object tasks could be due to other factors, yet to be investigated. One explanation is that object task could be more time consuming, but not necessarily more difficult than spatial task. This increased time may relate to object tasks demanding fine motor skills and specific manipulative actions with materials, like using tools (e.g., brushes or scissors) or modifying materials (e.g., mixing colors or molding clay), compared to spatial tasks that typically involve rotating and connecting given parts. Observations during our field edutainment study [35] support this idea, as object tasks appeared more time-consuming than spatial tasks, with more time devoted to manipulation with tools requiring manual dexterity. As imagined activity resembles real-world physical actions [2,38], time to perform mental assembly may increase for more time-consuming tasks that occur in real world, leading to more segmented mental processing steps in object tasks. Manipulation of materials (such as cutting or painting) in object tasks may lead participants to mentally rehearse each step, increasing segmentation. Additionally, the greater diversity of materials and possible actions in object tasks may create more ambiguity in segmentation criteria, potentially resulting in higher counts of mental steps. Our study highlights the need for future research to examine potential differences in mental segmentation and compression rates during object and spatial imagery processing.
Fewer step counts for spatial tasks compared to object tasks may also relate to the processing costs associated with counting and the differential effects of interference on object versus spatial tasks. Specifically, the conscious effort of segmentation and simultaneously counting each mental step during mental assembly may be more detrimental for spatial tasks. Counting and spatial visualization may rely on similar resources, causing more interference. Participants may prioritize the spatial task's performance over counting, leading to fewer counted steps. In contrast, updating the count with each step during object tasks may be easier to combine with mental assembly, as these processes draw on more distinct cognitive resources. This reduces interference, resulting in more counted steps (with fewer steps missed). Alternatively, it is possible that interference in spatial tasks is not detrimental, but instead counting might aid spatial visualization, leading to fewer steps due to more efficient processing. To overcome counting-related effects, future studies might consider using a button-pressing procedure, a technique often used in event segmentation research [36].
4.1.3. Difficulty Level * Task Type
The increase in mental steps count with task difficulty was consistent across both object and spatial tasks, suggesting that this effect applies similarly to both types of imagery. At the same time, difficulty-related declines in distinctness were more pronounced for spatial than for object tasks.
The faster decline in distinctness for spatial tasks as difficulty increases suggests that spatial imagery could be more susceptible to cognitive load than object imagery. One possible explanation is that object imagery may benefit from holistic processing, encoding visual information as a single unit [10]. Thus, the distinctness of object tasks may remain relatively stable despite the complexity, whereas spatial tasks involve more sequential part-by-part processing are more affected by additional load. This reliance on sequential processing in spatial tasks may cause interference when difficulty increases. Possibly, spatial tasks rely more heavily on working memory resources to manage the relations among elements, which are vulnerable to overload as task complexity increases, resulting in distinctness declines. Conversely, object imagery might rely more on long-term memory resources, which may support stable vividness despite increasing complexity.
Besides, we observed negative correlations between mental steps count and distinctness ratings across object and spatial tasks, which may indicate that higher complexity impairs the distinctness of mental representations. However, these negative correlations between steps count and distinctiveness were higher for object imagery, regardless difficulty levels. This, again, indicates the number of mental steps, though sensitive to our manipulated tasks’ difficulty, may not necessarily directly reflect increased cognitive load, and could be affected by other factors. It could be some mechanism that would protect from subjective vividness decline by adding more mental steps. That is, more frequent updating during object processing would result in addicting more steps, which could be adaptive to maintain a clear and vivid mental image over time.
Our findings highlight how task type and difficulty affect mental imagery. Further research is needed to investigate the cognitive mechanisms underlying these effects, especially the distinct ways that task complexity and influence object and spatial visual imagery vividness and segmentation.
4.2. Individual Differences in Imagery and Imagery Processes
Our study identified several significant associations among individual differences and the Imagined Assembly Task processing measures. Visual-object skills were positively correlated with the clarity and distinctness of imagery for object tasks. This finding aligns with expectations, given the overlap in the constructs being measured (all related to object processing). At the same time, object skills also correlated, though to a lesser degree, with distinctness of imagery for spatial tasks. Similarly, a positive association was found not only between object imagery skills (also assessed by OSVIQ-object scale) and object imagery distinctness but also between object imagery skills and spatial imagery distinctness, albeit to a lesser extent [42]. It is possible that realistic visualizing details, including spatial ones, is supported by object imagery processing, therefore individuals with greater object imagery skills have more clear and vivid representations during visualization for either type of tasks, though with a greater advantage for object tasks. Notably, in the current study we also found the relationship between distinctness ratings for object and spatial tasks, suggesting that quality of imagery experience is a relatively stable individual trait. In line with these findings, object and spatial vividness, while being dissociated into separate dimensions, showed some common variance [33].
Our results demonstrated a negative correlation between object imagery skills and the number of mental steps in object tasks, and to a lesser degree, with mental steps counts in spatial tasks. Possibly, these associations reflect more efficient chunking of visual information in those with enhanced visual-object skills. The correlation between visual-object skills and fewer mental steps for object tasks suggests that individuals with stronger object imagery skills may employ more holistic processing. This strategy likely allows them to process object tasks as more unified wholes, reducing the need for a fine segmentation. Such a holistic strategy in individuals with high object imagery skills may also generalize, though to a lesser extent, to spatial tasks. Indeed, previous studies reported that individuals with strong object imagery skills tend to encode and process images holistically, as a unified perceptual whole, while those with high spatial imagery skills process images analytically, and constructing them incrementally, part by part [1,10]. We also found negative correlations between imagery distinctness (primarily for object tasks) and the number of mental steps (for both object and spatial tasks). This pattern suggests that more vivid and distinct object imagery may enhance processing efficiency across tasks, but more for object tasks. Notably, mental steps count for object and spatial tasks were also highly correlated with each other, likely indicating a general approach to mental segmentation across the tasks. As our object and spatial tasks were presented in multiple intermixed trials, the processing strategies reflected in mental steps counts and distinctness ratings, could have transferred from one task to another.
Additionally, we found object imagery skills positive correlation with art aptitude, and a weaker link with humanities aptitude, as well as between visual-spatial skills and STEM aptitude. Therefore, individual differences in object imagery, spatial imagery, and verbal skills were associated with corresponding abilities in different specialization domains. These results are consistent with previous literature [1,30,33,43], supporting the distinction between object imagery and spatial imagery, and highlighting that domains requiring artistic and technical thinking require different profiles of visual and verbal skills.
While object imagery skills were associated with both task processing measures (mental step count and imagery distinctness), art aptitudes were related to imagery distinctness ratings for object tasks, but unrelated to mental steps counts. For spatial imagery though, both visual-spatial skills and STEM aptitudes were related to imagery distinctness for spatial tasks, but both unrelated to mental steps counts. The observed pattern of correlations indicates that individual differences in visual-spatial information processing may represent more isolated ability, likely supported by more specialized cognitive faculties.
4.3. Educational Value and Expected Attractiveness for Different Genders
The findings of our study reveal important insights into the expected educational value and attractiveness of object and spatial tasks of different difficulty, particularly concerning gender expectations. Notably, our results appeared to be generally consistent between male and female participants (see Appendix C, Figure C1).
Consistent with previous literature [1,14,15], spatial tasks were perceived as developing skills in STEM, while object tasks were more associated with developing abilities in Art. These results validate our Imagined Assembly Task in the context of related educational fields. Overall, the tasks were rated more favorably in terms of their educational value with increasing difficulty, indicating a connection between cognitive effort and skill acquisition, but this was true mostly for spatial tasks and for STEM domain. Possibly, in the Art domain, educational value ratings remain fairly stable across difficulty levels since in this domain the complexity per sei does not make art more valuable, and instead simplicity may reflect an expertise.
Unlike educational value, the expected attractiveness of tasks did not depend on the difficulty level, but did interact with gender. Boys were expected to prefer more difficult tasks, while girls were expected to have decreased preferences with increasing task difficulty. We did not find differences in attractiveness of object vs. spatial tasks, but again, found differences depending on gender. Spatial tasks were viewed as more attractive for boys, while girls were expected to have relatively reduced overall interest in our tasks compared to boys, and more preferences for object tasks. The present research contributes to literature on sex differences in visual-spatial skills and play preferences. Previous studies have shown females tend to outperform males in object imagery abilities and tend to prefer visual-object and verbal play activities, whereas males tend to excel in spatial imagery tasks and show a preference for visual-spatial play activities [1,44]. Children's gender-specific play preferences have been linked to their differences in visual and verbal processing abilities [24,30,45], as well as to their subsequent educational preferences and career choices in the art and STEM fields. Relatedly, previous literature raises the concerns that females are underrepresented in STEM fields [46], which at least in part could be due to parental expectations and social demands.
While general direction of task preferences expected for girls and boys align with other literature on toy preferences, our data showed almost symmetrically opposite patterns for boys in girls. Other studies, however, debate the degree of variety in toy preferences for girls vs. boys. For example, Sutton-Smith and Rosenberg [47] in their review of historical shifts in play preferences, suggested that the broadening of girls' preferences for traditionally male-typed play may have led to a restriction in boys' preferences over time, potentially limiting their exposure to object-oriented play. However, during the field edutainment study [35], boys were actually engaged with both types of tasks, indicating a broader variety of preferences, while girls preferred mostly object tasks. This could be due to the characteristics of our tasks (we chose gender-neutral items like fish, leaf, house, or abstract constructions rather than dolls or guns) or due to the social setting (children were encouraged to choose freely and selected tasks individually with minimal peer pressure). The attractiveness of object vs. spatial toys for boys and girls may be flexible and potentially influenced. For example, the toy industry (e.g., Lego) offers gender-neutral themes in construction sets or makes spatial toys with characters and colors appealing to both boys and girls. Our findings have implications for providing a variety of visual-object and visual-spatial play options and educational activities that foster different visual skill development across genders. Indeed, research has documented gender differences in access to toys that foster the development of visual-spatial skills [48]. Studies show that children’s gender-typed toy preferences are shaped by parental and cultural practices [49,50,51].
In our study, object tasks were rated as more attractive for girls than for boys, the attractiveness ratings for these tasks remaining relatively consistent across all difficulty levels. Spatial tasks were perceived as more attractive for boys, with increasing attractiveness ratings at higher difficulty levels. That is, the most difficult tasks were expected to be more attractive only for boys, while for girls overall the decrease in preference was with increasing task difficulty. This suggests that more challenging tasks may be appealing, however, this applies only to the spatial domain and is mostly expected from boys. Our finding emphasizes the need to consider gender differences when designing tasks of varying difficulty levels to optimize engagement and educational effectiveness.
4.4. Applications
The Imagined Assembly Task used in our research has shown promise as a tool for assessing visual-object and visual-spatial imagery processing but may need further improvement. In our study, we did not define "step" explicitly, introducing variability in interpretation, which may be clarified in future research by providing illustrative examples or narrowing the definition. Another potential refinement involves including images showing intermediate assembly steps, which could guide participants' segmentation and lead to development of accuracy-based measure. Further adjustments may also be needed to achieve comparable difficulty across levels for object and spatial tasks.
This instrument provides a comparable visual-object and visual-spatial tasks, shows a promise as a research tool to examine mechanisms differentiating visual-object and visual-spatial imagery, such as their capacity and sensitivity to cognitive demands, involvement of working and long-term memory, or relation to verbal processing. Notably, object and spatial tasks did not differ in distinctness, and all our tasks were rated as attractive, i.e., at mid-scale value and above. The Imagined Assembly Task format establishes a foundation for future measures of visual-object and visual-spatial imagery and suggests the potential value of using mental step counts in assessing different types of imagery processing. We are currently working on adapting this task into a performance measure suitable for adults and children.
Developing tools like the Imagined Assembly Task, which engage visual-object and visual-spatial skills, represents a promising direction. Understanding segmentation during imagery processing of object and spatial tasks may support the creation of more effective learning tools and instructions for visualizing complex actions. For example, it may inform the design of visual guides for motor planning that involve a step-by-step mental simulation resembling physical task performance. Such research and applied instruments can be designed to appeal to both genders while fostering educational value, with applications in psychometrics, toy design, and improvements of educational materials. Our study offers insights for understanding experiences and performance on object and spatial imagery tasks in Arts and STEM domains, with implications for cognitive and educational psychology.
Author Contributions
Conceptualization, O.B., T.K and A.K.; methodology, O.B. and T.K; software, O.B.; validation, O.B; formal analysis, O.B. and A.K.; investigation, O.B.; resources, O.B.; data curation, O.B.; writing—original draft preparation, O.B.; writing—review and editing, O.B., TK and A.K.; visualization, A.K.; supervision, O.B.; project administration, O.B.; funding acquisition, O.B., TK. All authors have read and agreed to the published version of the manuscript.
Funding
This research was funded by Scientific and Technological Research Council of Turkey TÜBITAK, grant number 223S396. The APC was funded by the Personal Research Fund, Sabanci University and as part of the RANEPA state assignment research program (TK).
Institutional Review Board Statement
The study was conducted in accordance with the Declaration of Helsinki, and approved by the Institutional Review Board (or Ethics Committee) of Sabanci University (protocol code FASS-2023-52, approved on 16-11-2023).
Informed Consent Statement
Informed consent was obtained from all subjects involved in the study.
Data Availability Statement
The original data presented in the study are openly available at OSF Blazhenkova, O. (2024, July 15). Visual-object and visual-spatial play. Retrieved from osf.io/6nuzg.
Conflicts of Interest
The authors declare no conflicts of interest. The funders had no role in the design of the study; in the collection, analyses, or interpretation of data; in the writing of the manuscript; or in the decision to publish the results.
Appendix A
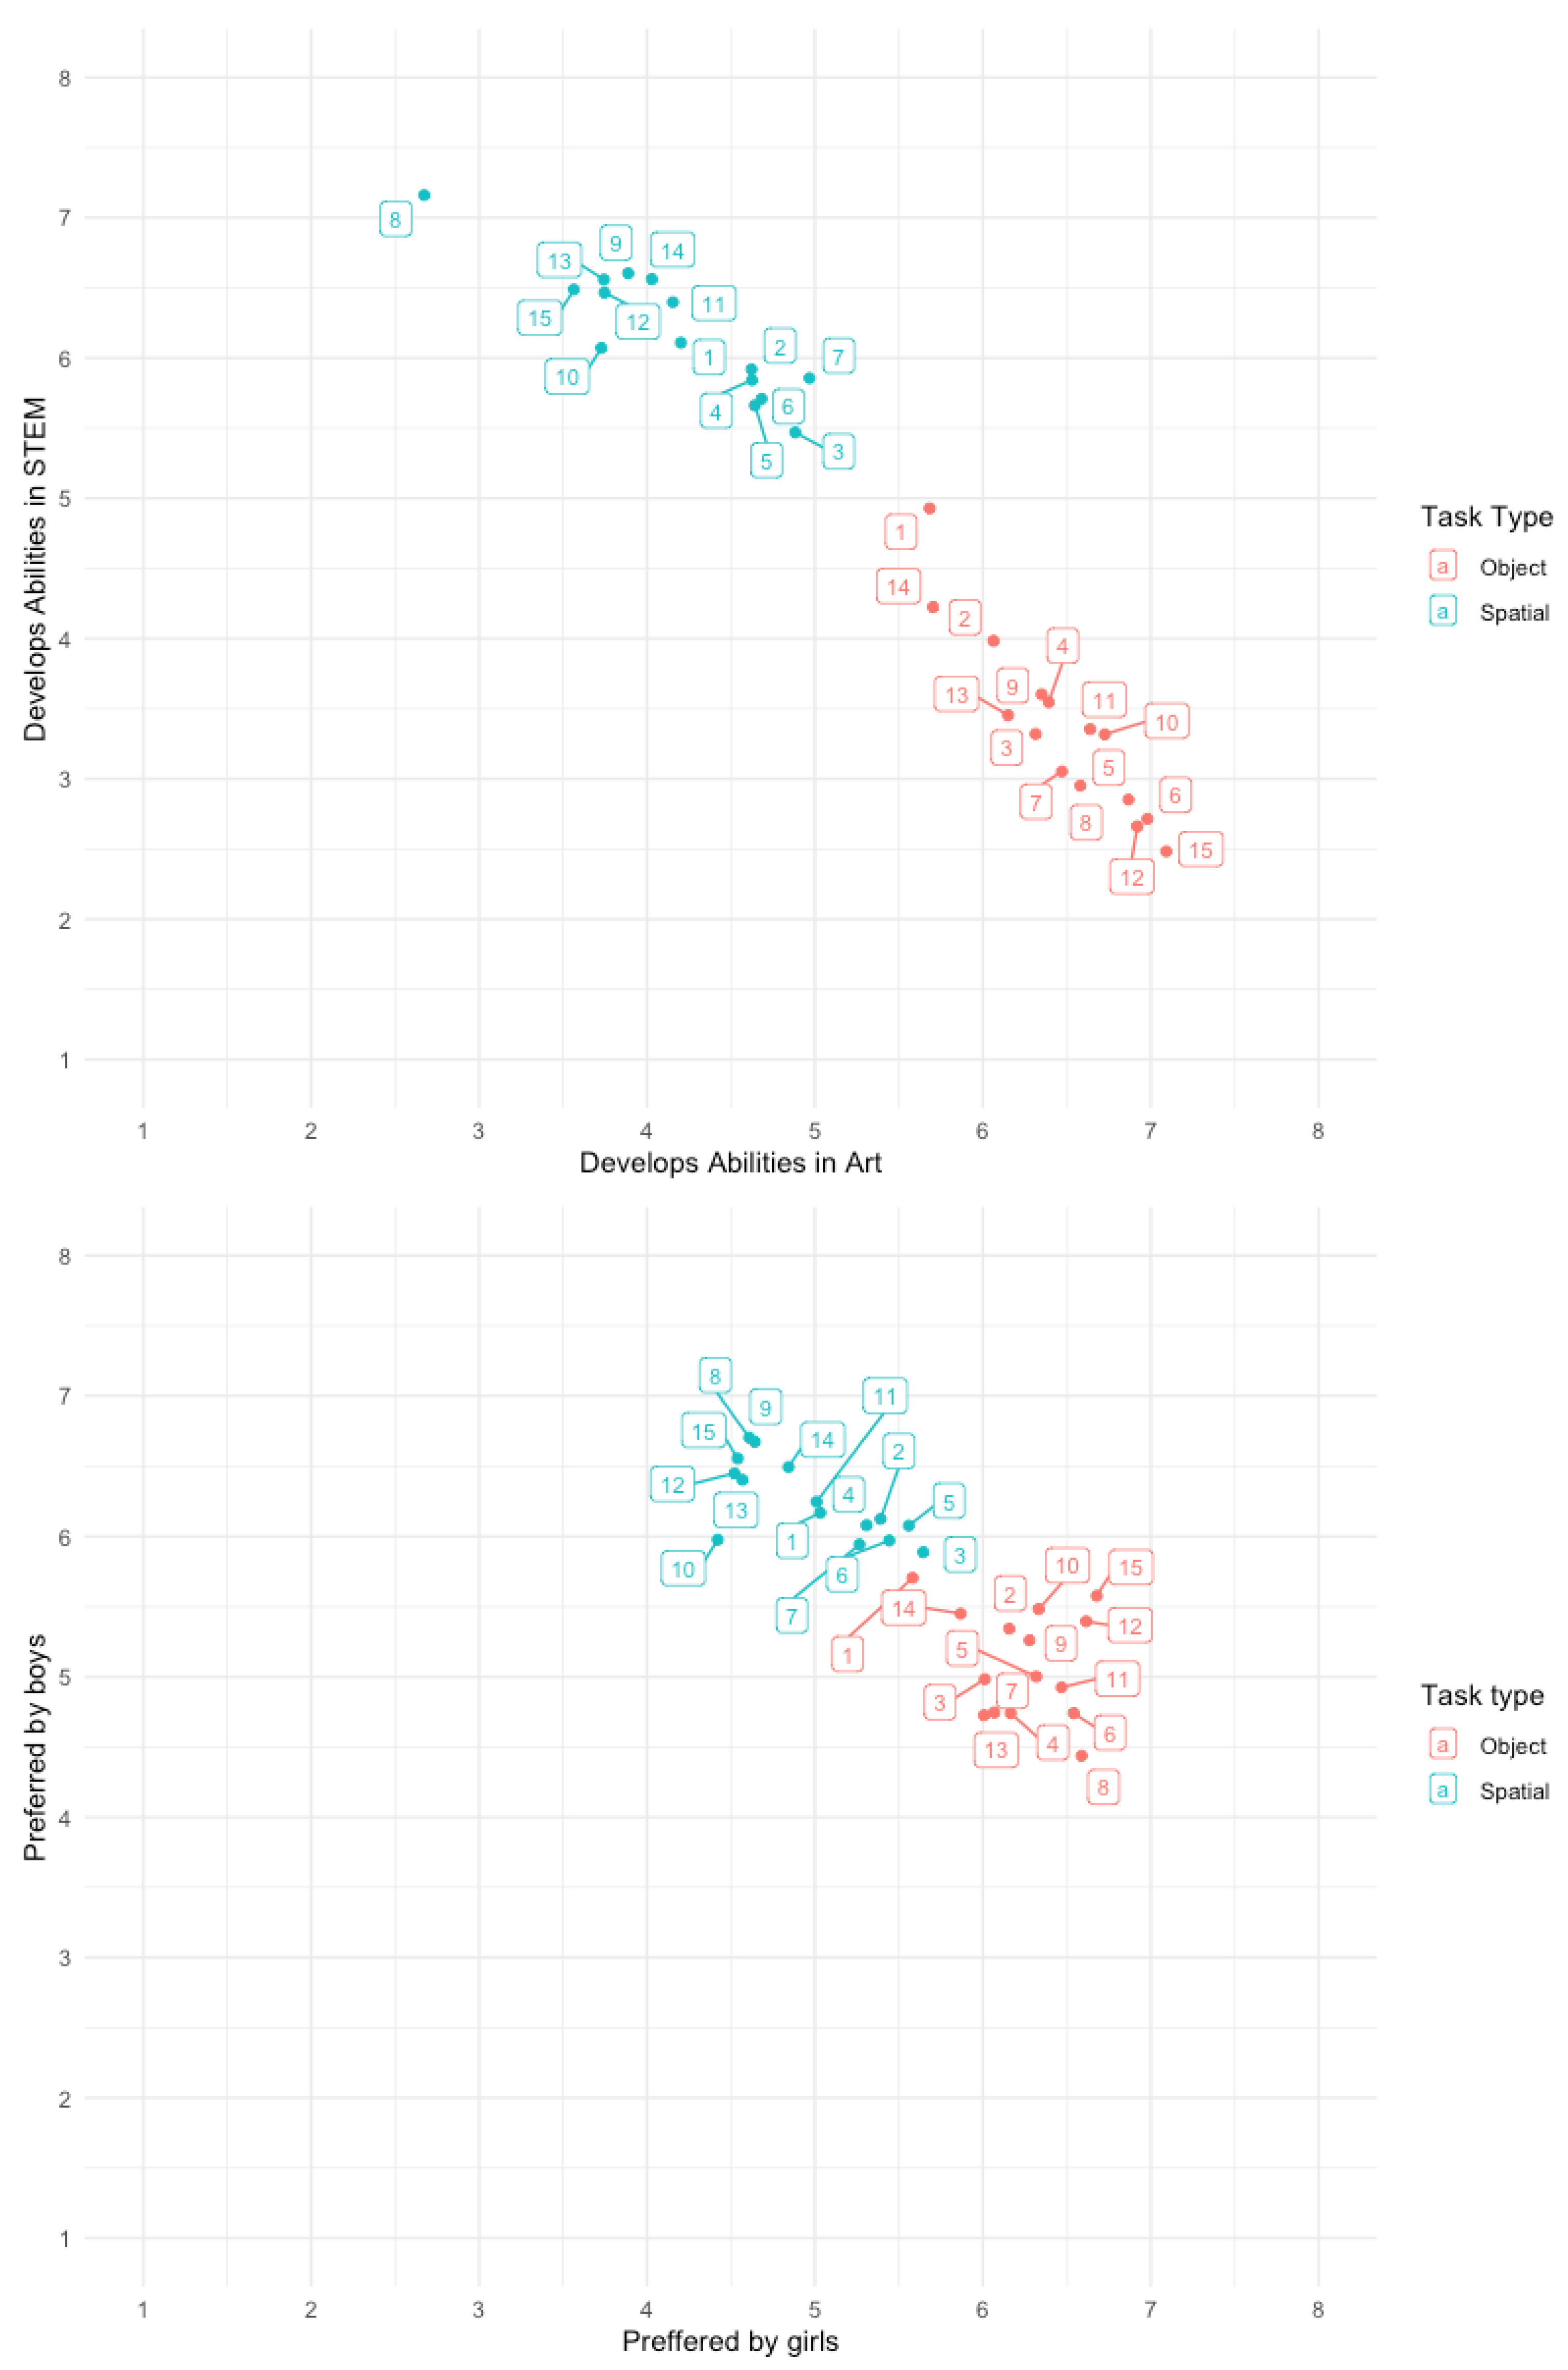
Figure A1.
Scatterplots showing (a) estimated Educational Value in STEM and Art domains; (b) Expected Attractiveness for Boys versus Girls. Task numbers correspond to those listed in Table 1.
Figure A1.
Scatterplots showing (a) estimated Educational Value in STEM and Art domains; (b) Expected Attractiveness for Boys versus Girls. Task numbers correspond to those listed in Table 1.
Appendix B
Figure B1.
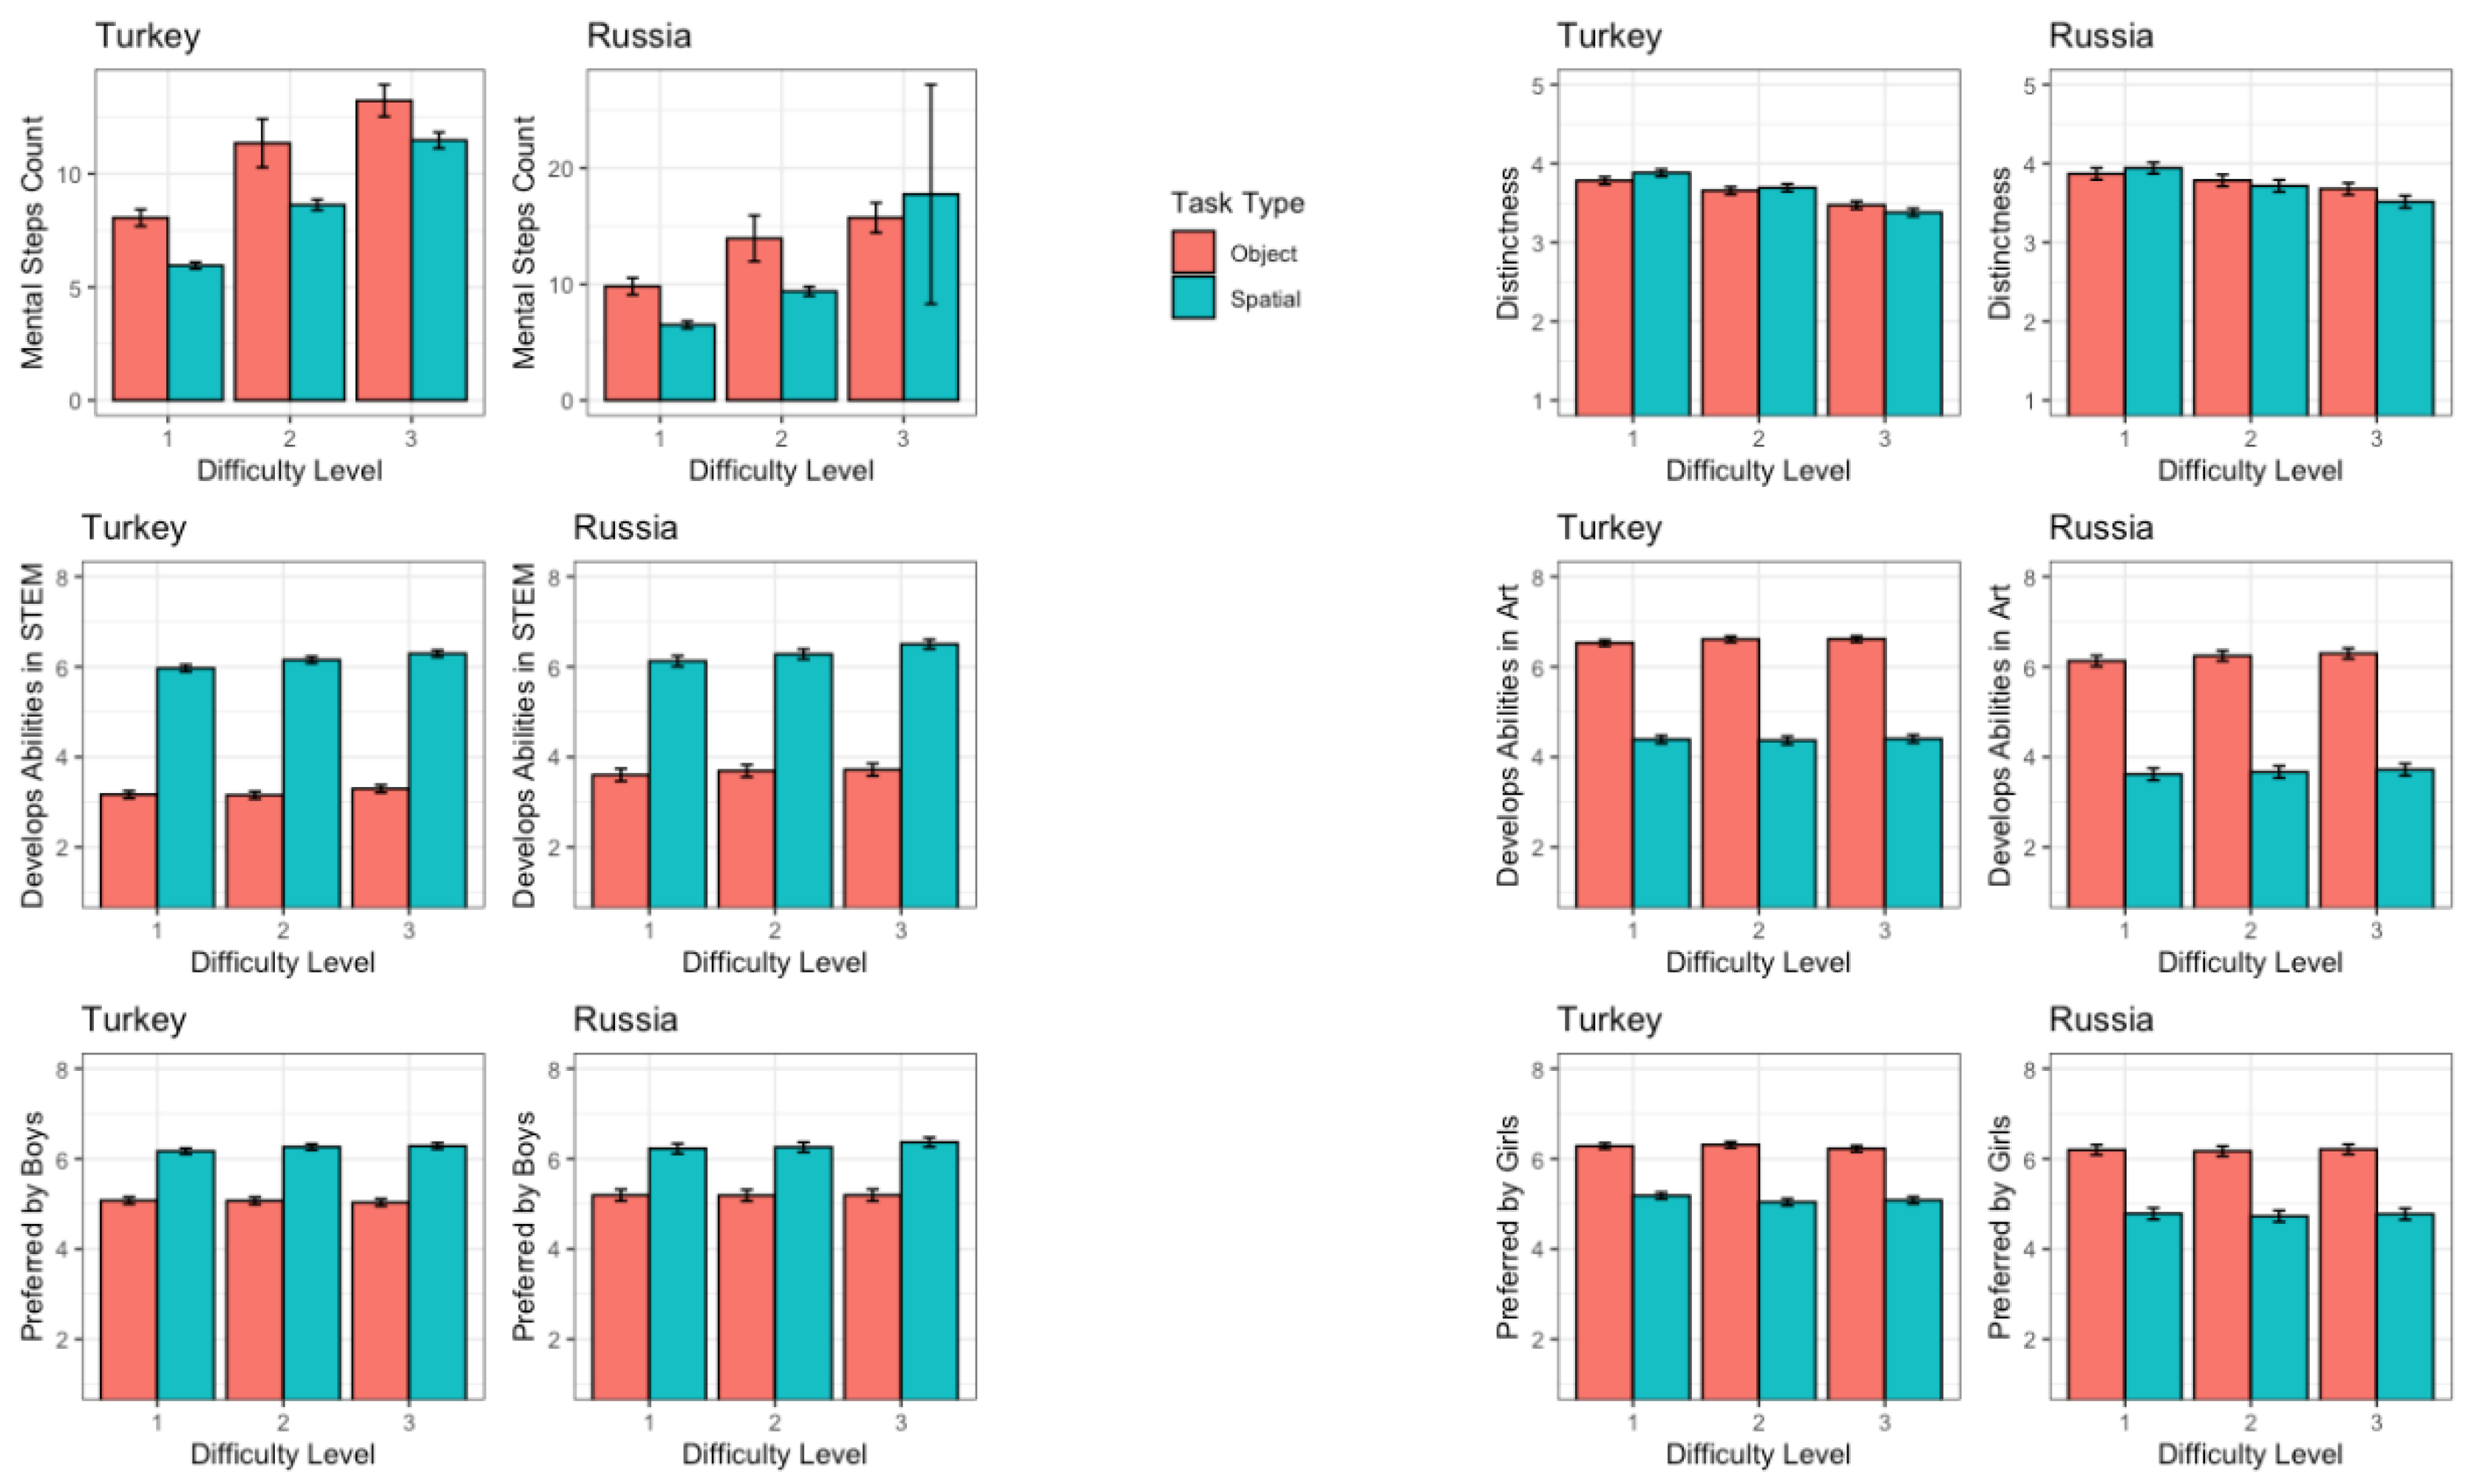
Data on Imagined Assembly Task Variables by Difficulty Level and Task Type, separated by participant Culture (Turkey and Russia). Graphs display measures across three difficulty levels for two types of tasks (object and spatial): Mental Steps Count, Distinctness, Educational Value in STEM and Art domains, and Expected Attractiveness for Boys and Girls. Data are presented separately for participants from Turkey (left) and Russia (right). Error bars indicate confidence intervals (CIs).
Figure B1.
Data on Imagined Assembly Task Variables by Difficulty Level and Task Type, separated by participant Culture (Turkey and Russia). Graphs display measures across three difficulty levels for two types of tasks (object and spatial): Mental Steps Count, Distinctness, Educational Value in STEM and Art domains, and Expected Attractiveness for Boys and Girls. Data are presented separately for participants from Turkey (left) and Russia (right). Error bars indicate confidence intervals (CIs).
Appendix C
Figure C1.
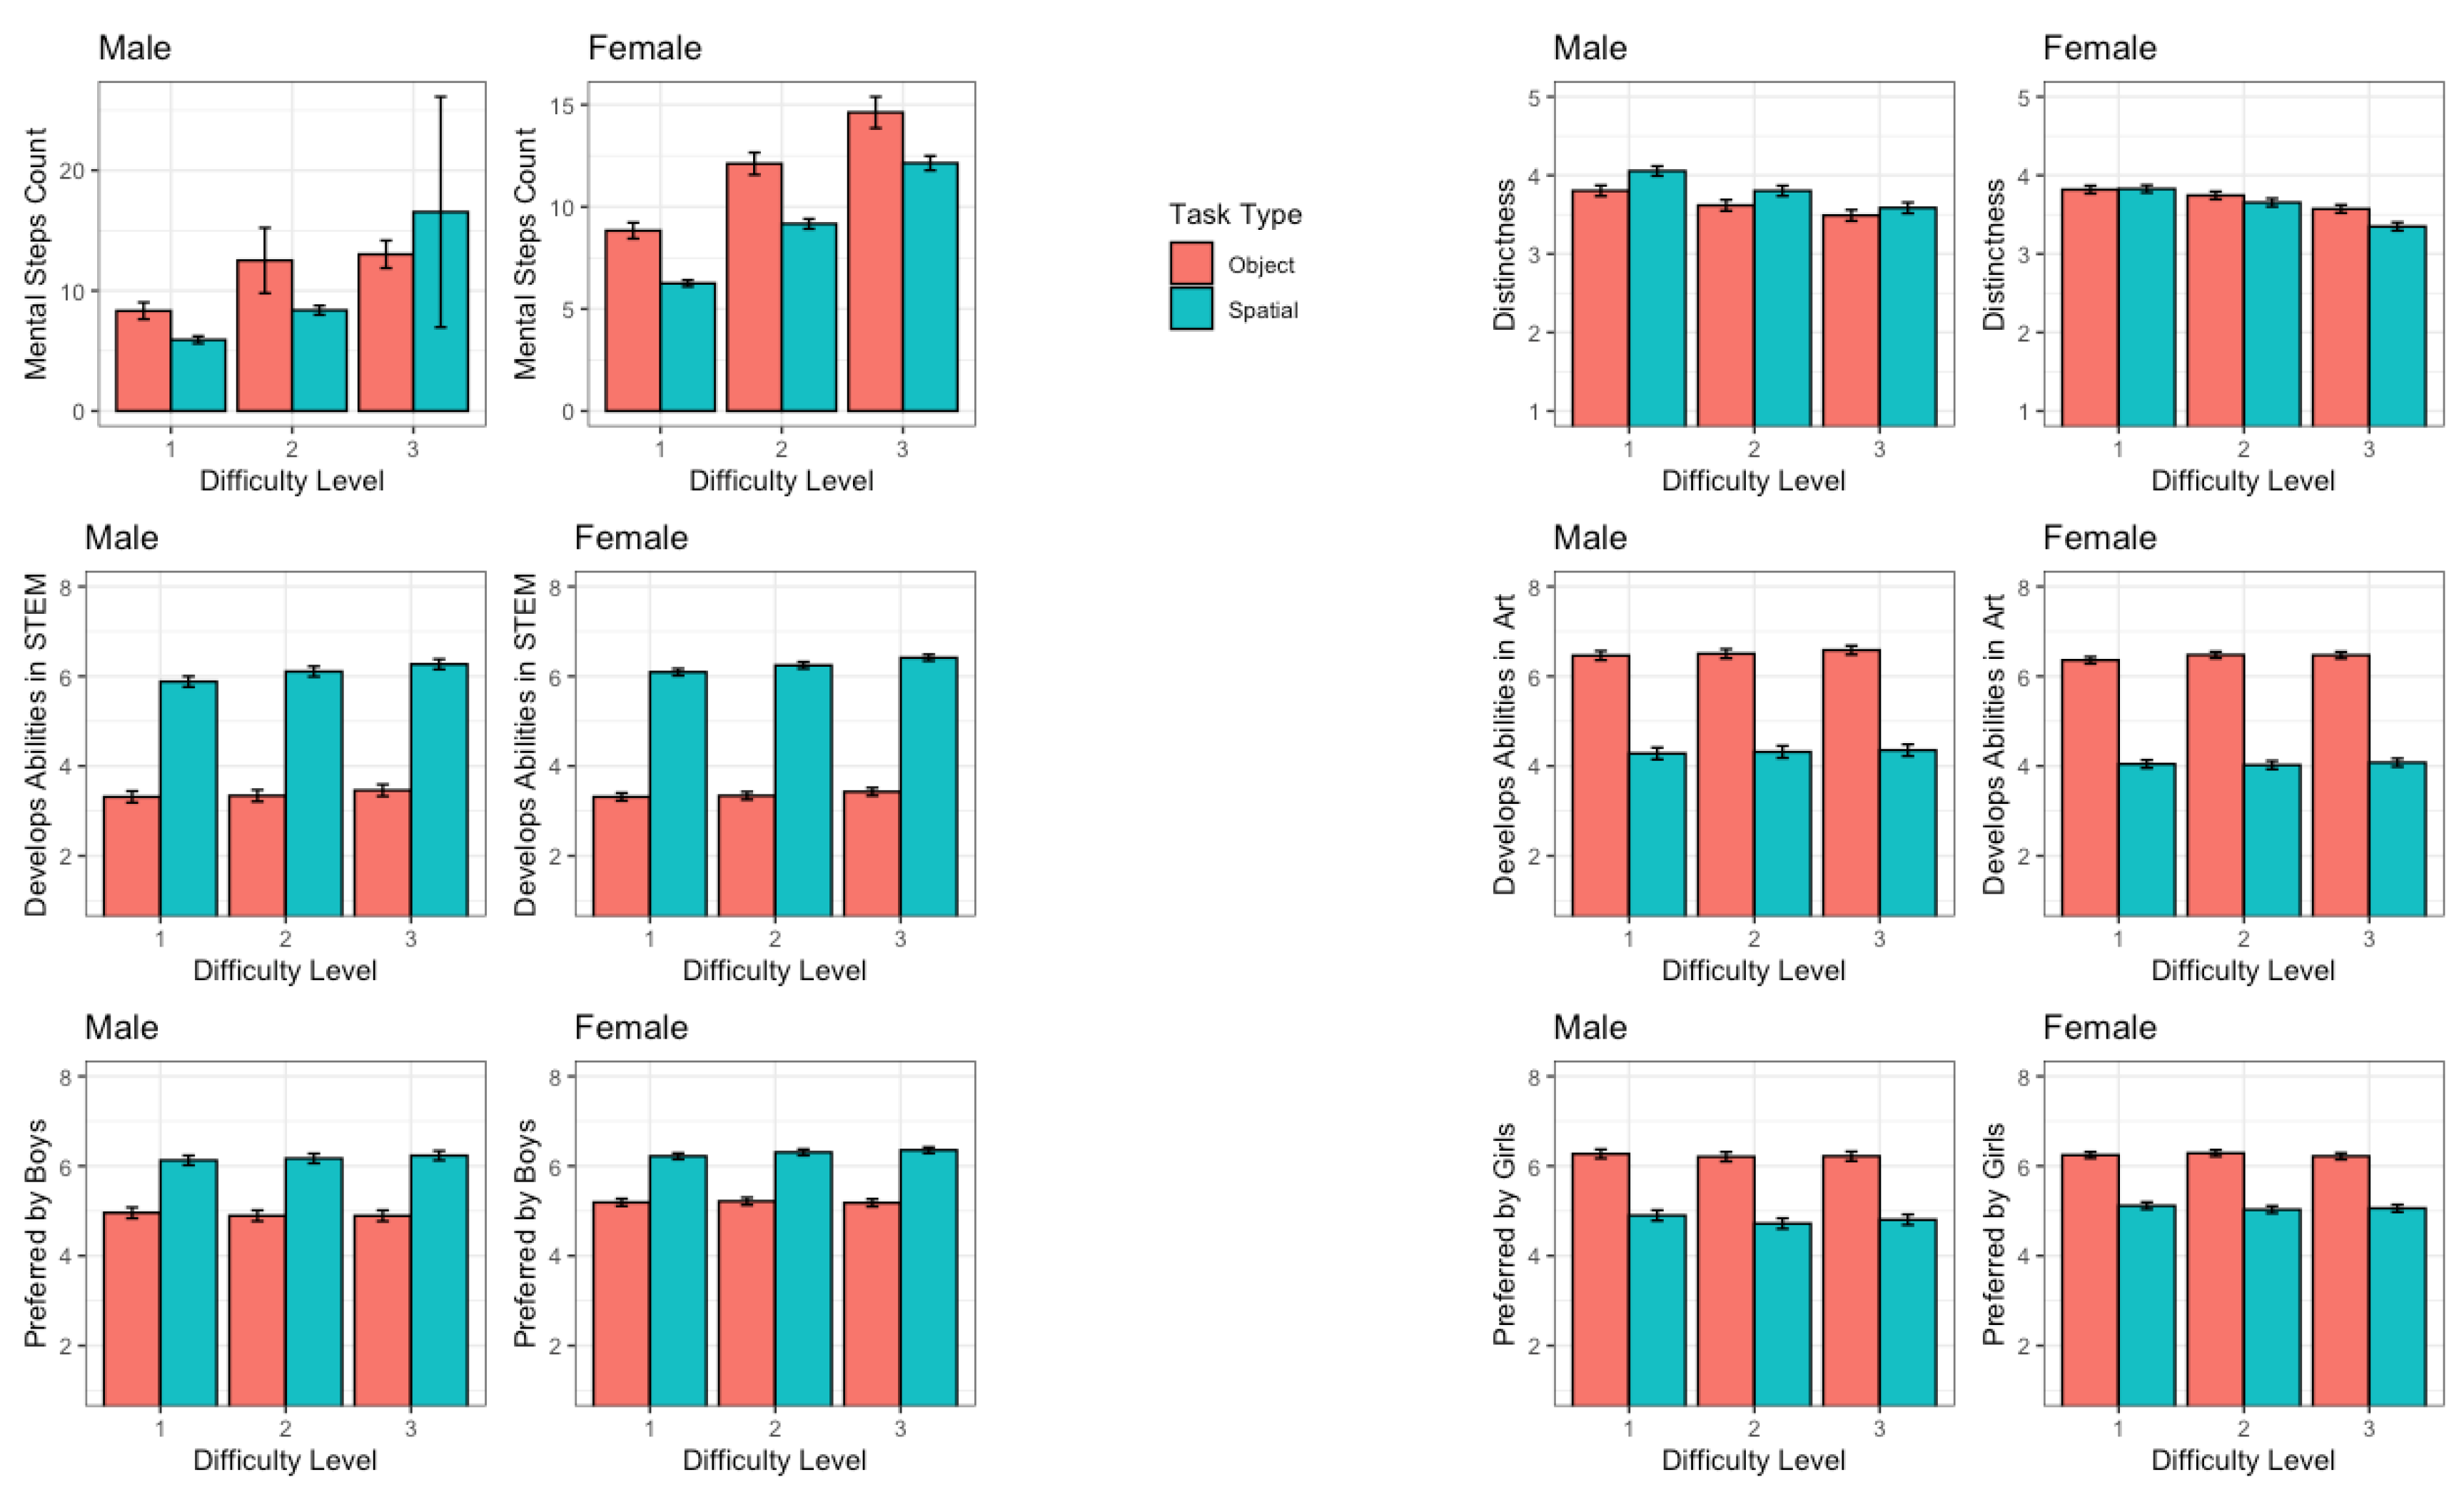
Data on Imagined Assembly Task Variables by Difficulty Level and Task Type, separated by participant Gender (Male and Female). Graphs display measures across three difficulty levels for two types of tasks (object and spatial): Mental Steps Count, Distinctness, Educational Value in STEM and Art domains, and Expected Attractiveness for Boys and Girls. Data are presented separately for male (left) and female (right) participants. Error bars indicate confidence intervals (CIs).
Figure C1.
Data on Imagined Assembly Task Variables by Difficulty Level and Task Type, separated by participant Gender (Male and Female). Graphs display measures across three difficulty levels for two types of tasks (object and spatial): Mental Steps Count, Distinctness, Educational Value in STEM and Art domains, and Expected Attractiveness for Boys and Girls. Data are presented separately for male (left) and female (right) participants. Error bars indicate confidence intervals (CIs).
References
- Blazhenkova, O.; Kozhevnikov, M. Visual-Object Ability: A New Dimension of Non-Verbal Intelligence. Cognition 2010, 117, 276–301. [Google Scholar] [CrossRef] [PubMed]
- Borst, G.; Kosslyn, S.M. Individual Differences in Spatial Mental Imagery. Q. J. Exp. Psychol. (Hove) 2010, 63, 2031–2050. [Google Scholar] [CrossRef] [PubMed]
- Cui, X.; Jeter, C.B.; Yang, D.; Montague, P.R.; Eagleman, D.M. Vividness of Mental Imagery: Individual Variability Can Be Measured Objectively. Vision Res. 2007, 47, 474–478. [Google Scholar] [CrossRef] [PubMed]
- D’Angiulli, A.; Runge, M.; Faulkner, A.; Zakizadeh, J.; Chan, A.; Morcos, S. Vividness of Visual Imagery and Incidental Recall of Verbal Cues, When Phenomenological Availability Reflects Long-Term Memory Accessibility. Front. Psychol. 2013, 4, 1. [Google Scholar] [CrossRef] [PubMed]
- Marks, D.F. Visual Imagery Differences in the Recall of Pictures. Br. J. Psychol. 1973, 64, 17–24. [Google Scholar] [CrossRef]
- Zeman, A. Aphantasia and Hyperphantasia: Exploring Imagery Vividness Extremes. Trends Cogn. Sci. 2024. [Google Scholar] [CrossRef]
- Mishkin, M.; Ungerleider, L.G.; Macko, K.A. Object Vision and Spatial Vision: Two Cortical Pathways. Trends Neurosci. 1983. [Google Scholar] [CrossRef]
- Dijkstra, N.; Bosch, S.E.; van Gerven, M.A.J. Shared Neural Mechanisms of Visual Perception and Imagery. Trends Cogn. Sci. 2019, 23, 423–434. [Google Scholar] [CrossRef]
- Farah, M.J. Is Visual Imagery Really Visual? Overlooked Evidence from Neuropsychology. Psychol. Rev. 1988, 95, 307–317. [Google Scholar] [CrossRef]
- Kozhevnikov, M.; Kosslyn, S.; Shephard, J. Spatial versus Object Visualizers: A New Characterization of Visual Cognitive Style. Mem. Cognit. 2005, 33, 710–726. [Google Scholar] [CrossRef]
- Ausburn, L.J.; Ausburn, F.B. Cognitive Styles: Some Information and Implications for Instructional Design. Educ. Commun. Technol. 1978, 26, 337–354. [Google Scholar] [CrossRef]
- Blazhenkova, O.; Kanero, J.; Duman, I.; Umitli, O. Read and Imagine: Visual Imagery Experience Evoked by First versus Second Language. Psychol. Rep. 2023, 332941231158059. [Google Scholar] [CrossRef]
- Kozhevnikov, M.; Motes, M.A.; Hegarty, M. Spatial Visualization in Physics Problem Solving. Cogn. Sci. 2007, 31, 549–579. [Google Scholar] [CrossRef] [PubMed]
- McGee, M.G. Human Spatial Abilities: Psychometric Studies and Environmental, Genetic, Hormonal, and Neurological Influences. Psychol. Bull. 1979, 86, 889–918. [Google Scholar] [CrossRef] [PubMed]
- Humphreys, L.G.; Lubinski, D.; Yao, G. Utility of Predicting Group Membership and the Role of Spatial Visualization in Becoming an Engineer, Physical Scientist, or Artist. J. Appl. Psychol. 1993, 78, 250–261. [Google Scholar] [CrossRef]
- Passolunghi, M.C.; Mammarella, I.C. Selective Spatial Working Memory Impairment in a Group of Children with Mathematics Learning Disabilities and Poor Problem-Solving Skills. J. Learn. Disabil. 2012, 45, 341–350. [Google Scholar] [CrossRef]
- Hegarty, M.; Waller, D.A. Individual Differences in Spatial Abilities. In The Cambridge Handbook of Visuospatial Thinking; Shah, P., Miyake, A., Eds.; Cambridge University Press: Cambridge, 2005. [Google Scholar] [CrossRef]
- Voyer, D.; Jansen, P. Motor Expertise and Performance in Spatial Tasks: A Meta-Analysis. Hum. Mov. Sci. 2017, 54, 110–124. [Google Scholar] [CrossRef]
- Kozhevnikov, M.; Kozhevnikov, M.; Yu, C.J.; Blazhenkova, O. Creativity, Visualization Abilities, and Visual Cognitive Style. Br. J. Educ. Psychol. 2013, 83 Pt 2, 196–209. [Google Scholar] [CrossRef]
- Blazhenkova, O.; Kozhevnikov, M. Types of Creativity and Visualization in Teams of Different Educational Specialization. Creat. Res. J. 2016, 28, 123–135. [Google Scholar] [CrossRef]
- Blazhenkova, O.; Kozhevnikov, M. Creative Processes during a Collaborative Drawing Task in Teams of Different Specializations. Creat. Educ. 2020, 11, 1751–1775. [Google Scholar] [CrossRef]
- Christensen, B.T.; Schunn, C.D. The Role and Impact of Mental Simulation in Design. Appl. Cogn. Psychol. 2009, 23, 327–344. [Google Scholar] [CrossRef]
- Clement, J.J. Analogical reasoning via imagery: The role of transformations and simulations. https://srri.umass.edu/sites/srri/files/Clement-Analogy-Imagery/index.pdf (accessed 2024-11-09).
- Kersh, J.; Casey, B.M.; Young, J.M. Research Spatial Skills Block Building Girls Boys. Contemporary Perspectives Mathematics Early Childhood Education.
- Brosnan, M.J. Spatial Ability in Children’s Play with Lego Blocks. Percept. Mot. Skills 1998, 87, 19–28. [Google Scholar] [CrossRef] [PubMed]
- Caldera, Y.M.; Culp, A.M.; O’Brien, M.; Truglio, R.T.; Alvarez, M.; Huston, A.C. Children’s Play Preferences, Construction Play with Blocks, and Visual-Spatial Skills: Are They Related? Int. J. Behav. Dev. 1999, 23, 855–872. [Google Scholar] [CrossRef]
- Levine, S.C.; Ratliff, K.R.; Huttenlocher, J.; Cannon, J. Early Puzzle Play: A Predictor of Preschoolers’ Spatial Transformation Skill. Dev. Psychol. 2012, 48, 530–542. [Google Scholar] [CrossRef]
- Sprafkin, J.; Swift, C.; Hess, R. The Changing Image of Television. Prev. Hum. Serv. 1983, 2, 1–5. [Google Scholar] [CrossRef]
- Robert, M.; Héroux, G. Visuo-spatial Play Experience: Forerunner of Visuo-spatial Achievement in Preadolescent and Adolescent Boys and Girls? Infant Child Dev. 2004, 13, 49–78. [Google Scholar] [CrossRef]
- Blazhenkova, O.; Booth, R.W. Individual Differences in Visualization and Childhood Play Preferences. Heliyon 2020, 6, e03953. [Google Scholar] [CrossRef]
- McAvinue, L.P.; Robertson, I.H. Measuring Visual Imagery Ability: A Review. Imagin. Cogn. Pers. 2007, 26, 191–211. [Google Scholar] [CrossRef]
- Blazhenkova, O.; Kozhevnikov, M. The New Object-Spatial-Verbal Cognitive Style Model: Theory and Measurement. Appl. Cogn. Psychol. 2009, 23, 638–663. [Google Scholar] [CrossRef]
- Blazhenkova, O. Vividness of Object and Spatial Imagery. Percept. Mot. Skills 2016, 122, 490–508. [Google Scholar] [CrossRef]
- Blazhenkova, O. (2024, July 15). Visual-object and visual-spatial play. Retrieved from osf.io/6nuzg.
- Blazhenkova, O.; Asilkefeli, E.; Kotov, A.; Kotova, T.; Bostancı, E.; Roshchina, V. Interrelations between Mothers’ and Children’s Abilities, Learning Interests, and Play in Object and Spatial Visual Domains, 2024. [CrossRef]
- Zacks, J.M.; Swallow, K.M. Event Segmentation. Curr. Dir. Psychol. Sci. 2007, 16, 80–84. [Google Scholar] [CrossRef] [PubMed]
- Ben-Yakov, A.; Henson, R.N. The Hippocampal Film Editor: Sensitivity and Specificity to Event Boundaries in Continuous Experience. J. Neurosci. 2018, 38, 10057–10068. [Google Scholar] [CrossRef] [PubMed]
- Shepard, R.N.; Metzler, J. Mental Rotation of Three-Dimensional Objects. Science 1971, 171, 701–703. [Google Scholar] [CrossRef] [PubMed]
- Ceja, C.R.; Franconeri, S.L. Difficulty Limits of Visual Mental Imagery. Cognition 2023, 236, 105436. [Google Scholar] [CrossRef]
- Keogh, R.; Pearson, J. The Perceptual and Phenomenal Capacity of Mental Imagery. Cognition 2017, 162, 124–132. [Google Scholar] [CrossRef]
- van Veen, S.C.; Engelhard, I.M.; van den Hout, M.A. The Effects of Eye Movements on Emotional Memories: Using an Objective Measure of Cognitive Load. Eur. J. Psychotraumatol. 2016, 7, 30122. [Google Scholar] [CrossRef]
- Blazhenkova, O.; Kotov, A.A.; Kotova, T. How People Estimate the Prevalence of Aphantasia and Hyperphantasia in the Population. PsyArXiv, 2024. [CrossRef]
- Blazhenkova, O.; Becker, M.; Kozhevnikov, M. Object–Spatial Imagery and Verbal Cognitive Styles in Children and Adolescents: Developmental Trajectories in Relation to Ability. Learn. Individ. Differ. 2011, 21, 281–287. [Google Scholar] [CrossRef]
- Voyer, D.; Voyer, S.; Bryden, M.P. Magnitude of Sex Differences in Spatial Abilities: A Meta-Analysis and Consideration of Critical Variables. Psychol. Bull. 1995, 117, 250–270. [Google Scholar] [CrossRef]
- Serbin, L.A.; Connor, J.M. Sex-Typing of Children’s Play Preferences and Patterns of Cognitive Performance. J. Genet. Psychol. 1979, 134, 315–316. [Google Scholar] [CrossRef]
- Lloyd, A.; Gore, J.; Holmes, K.; Smith, M.; Fray, L. Parental Influences on Those Seeking a Career in STEM: The Primacy of Gender. International Journal of Gender, Science, and Technology 2018, 10, 308–328. [Google Scholar]
- Sutton-Smith, B.; Rosenberg, B.G. Impulsivity and Sex Preference. J. Genet. Psychol. 1961, 98, 187–192. [Google Scholar] [CrossRef]
- Francis, B. Gender, Toys and Learning. Oxf. Rev. Educ. 2010, 36, 325–344. [Google Scholar] [CrossRef]
- Bussey, K.; Bandura, A. Social Cognitive Theory of Gender Development and Differentiation. Psychol. Rev. 1999, 106, 676–713. [Google Scholar] [CrossRef] [PubMed]
- Langlois, J.H.; Downs, A.C. Mothers, Fathers, and Peers as Socialization Agents of Sex-Typed Play Behaviors in Young Children. Child Dev. 1980, 51, 1237. [Google Scholar] [CrossRef]
- Boe, J.L.; Woods, R.J. Parents’ Influence on Infants’ Gender-Typed Toy Preferences. Sex Roles 2018, 79, 358–373. [Google Scholar] [CrossRef]
Figure 1.
Stimuli used in the Imagined Assembly Task: (a) Visual-object; (b) Visual-spatial.
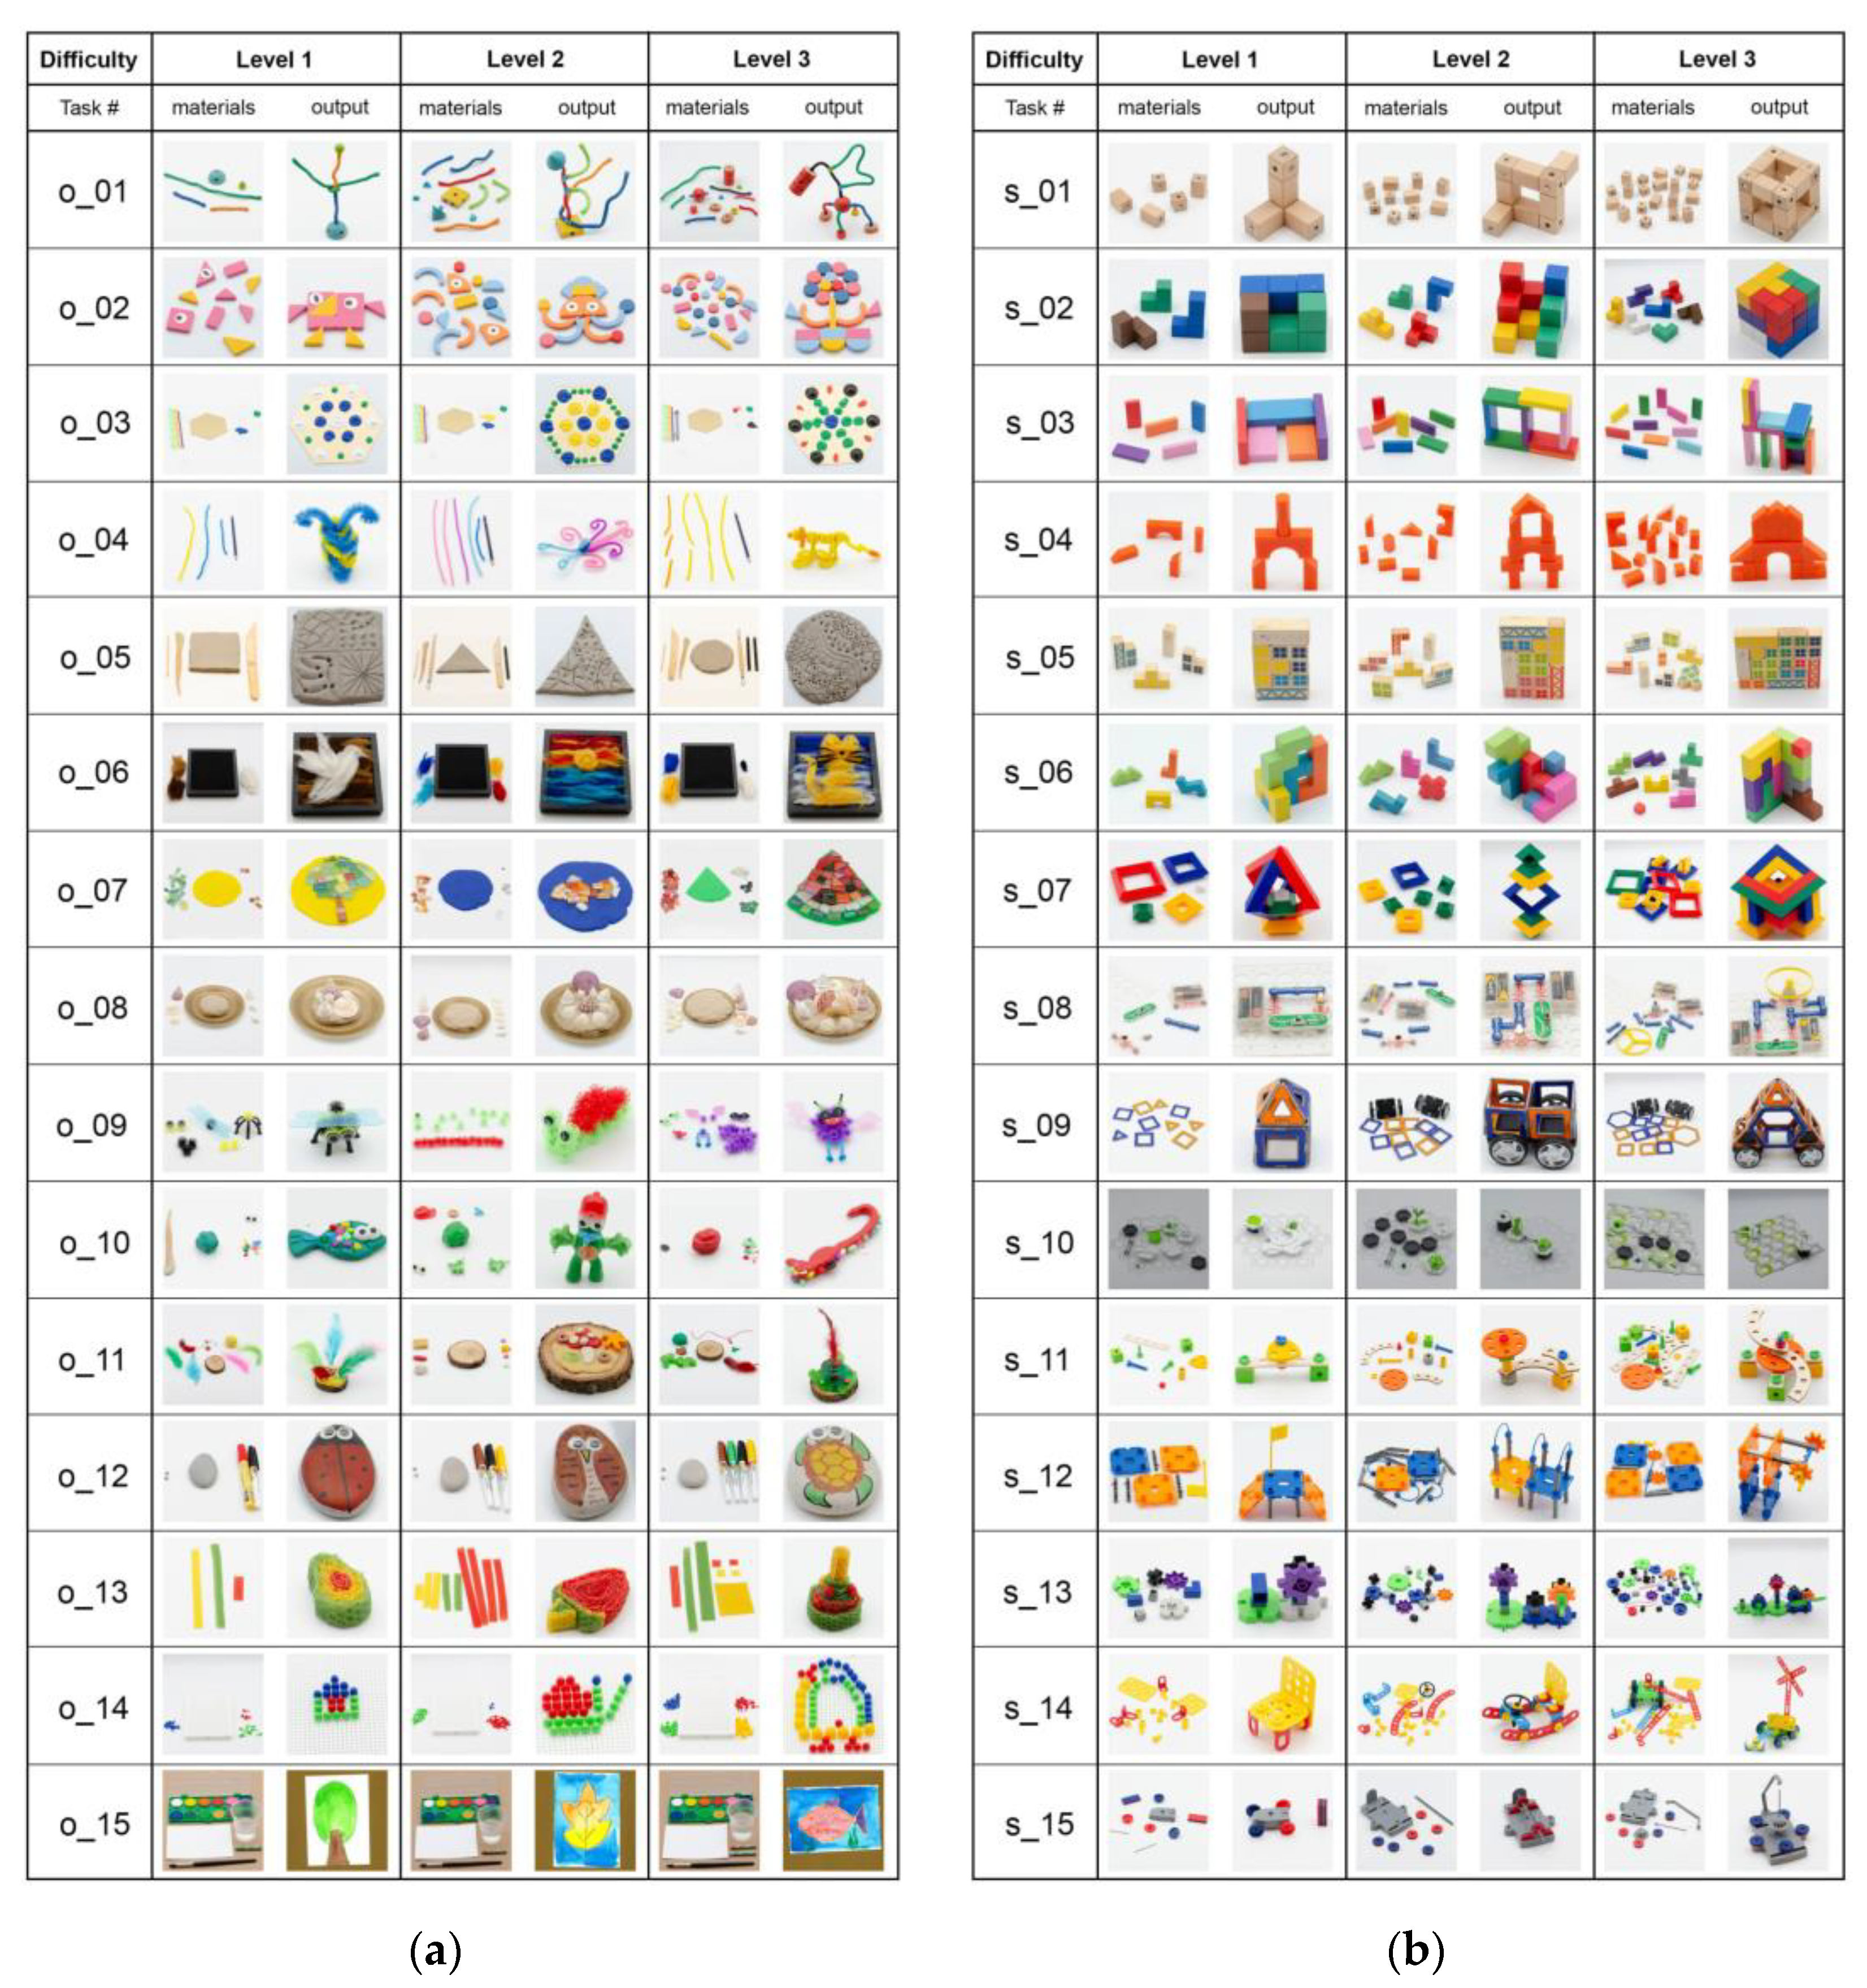
Figure 2.
Mean Mental Steps Count for Object and Spatial tasks at different Difficulty Levels. Error bars indicate confidence intervals (CIs).
Figure 2.
Mean Mental Steps Count for Object and Spatial tasks at different Difficulty Levels. Error bars indicate confidence intervals (CIs).
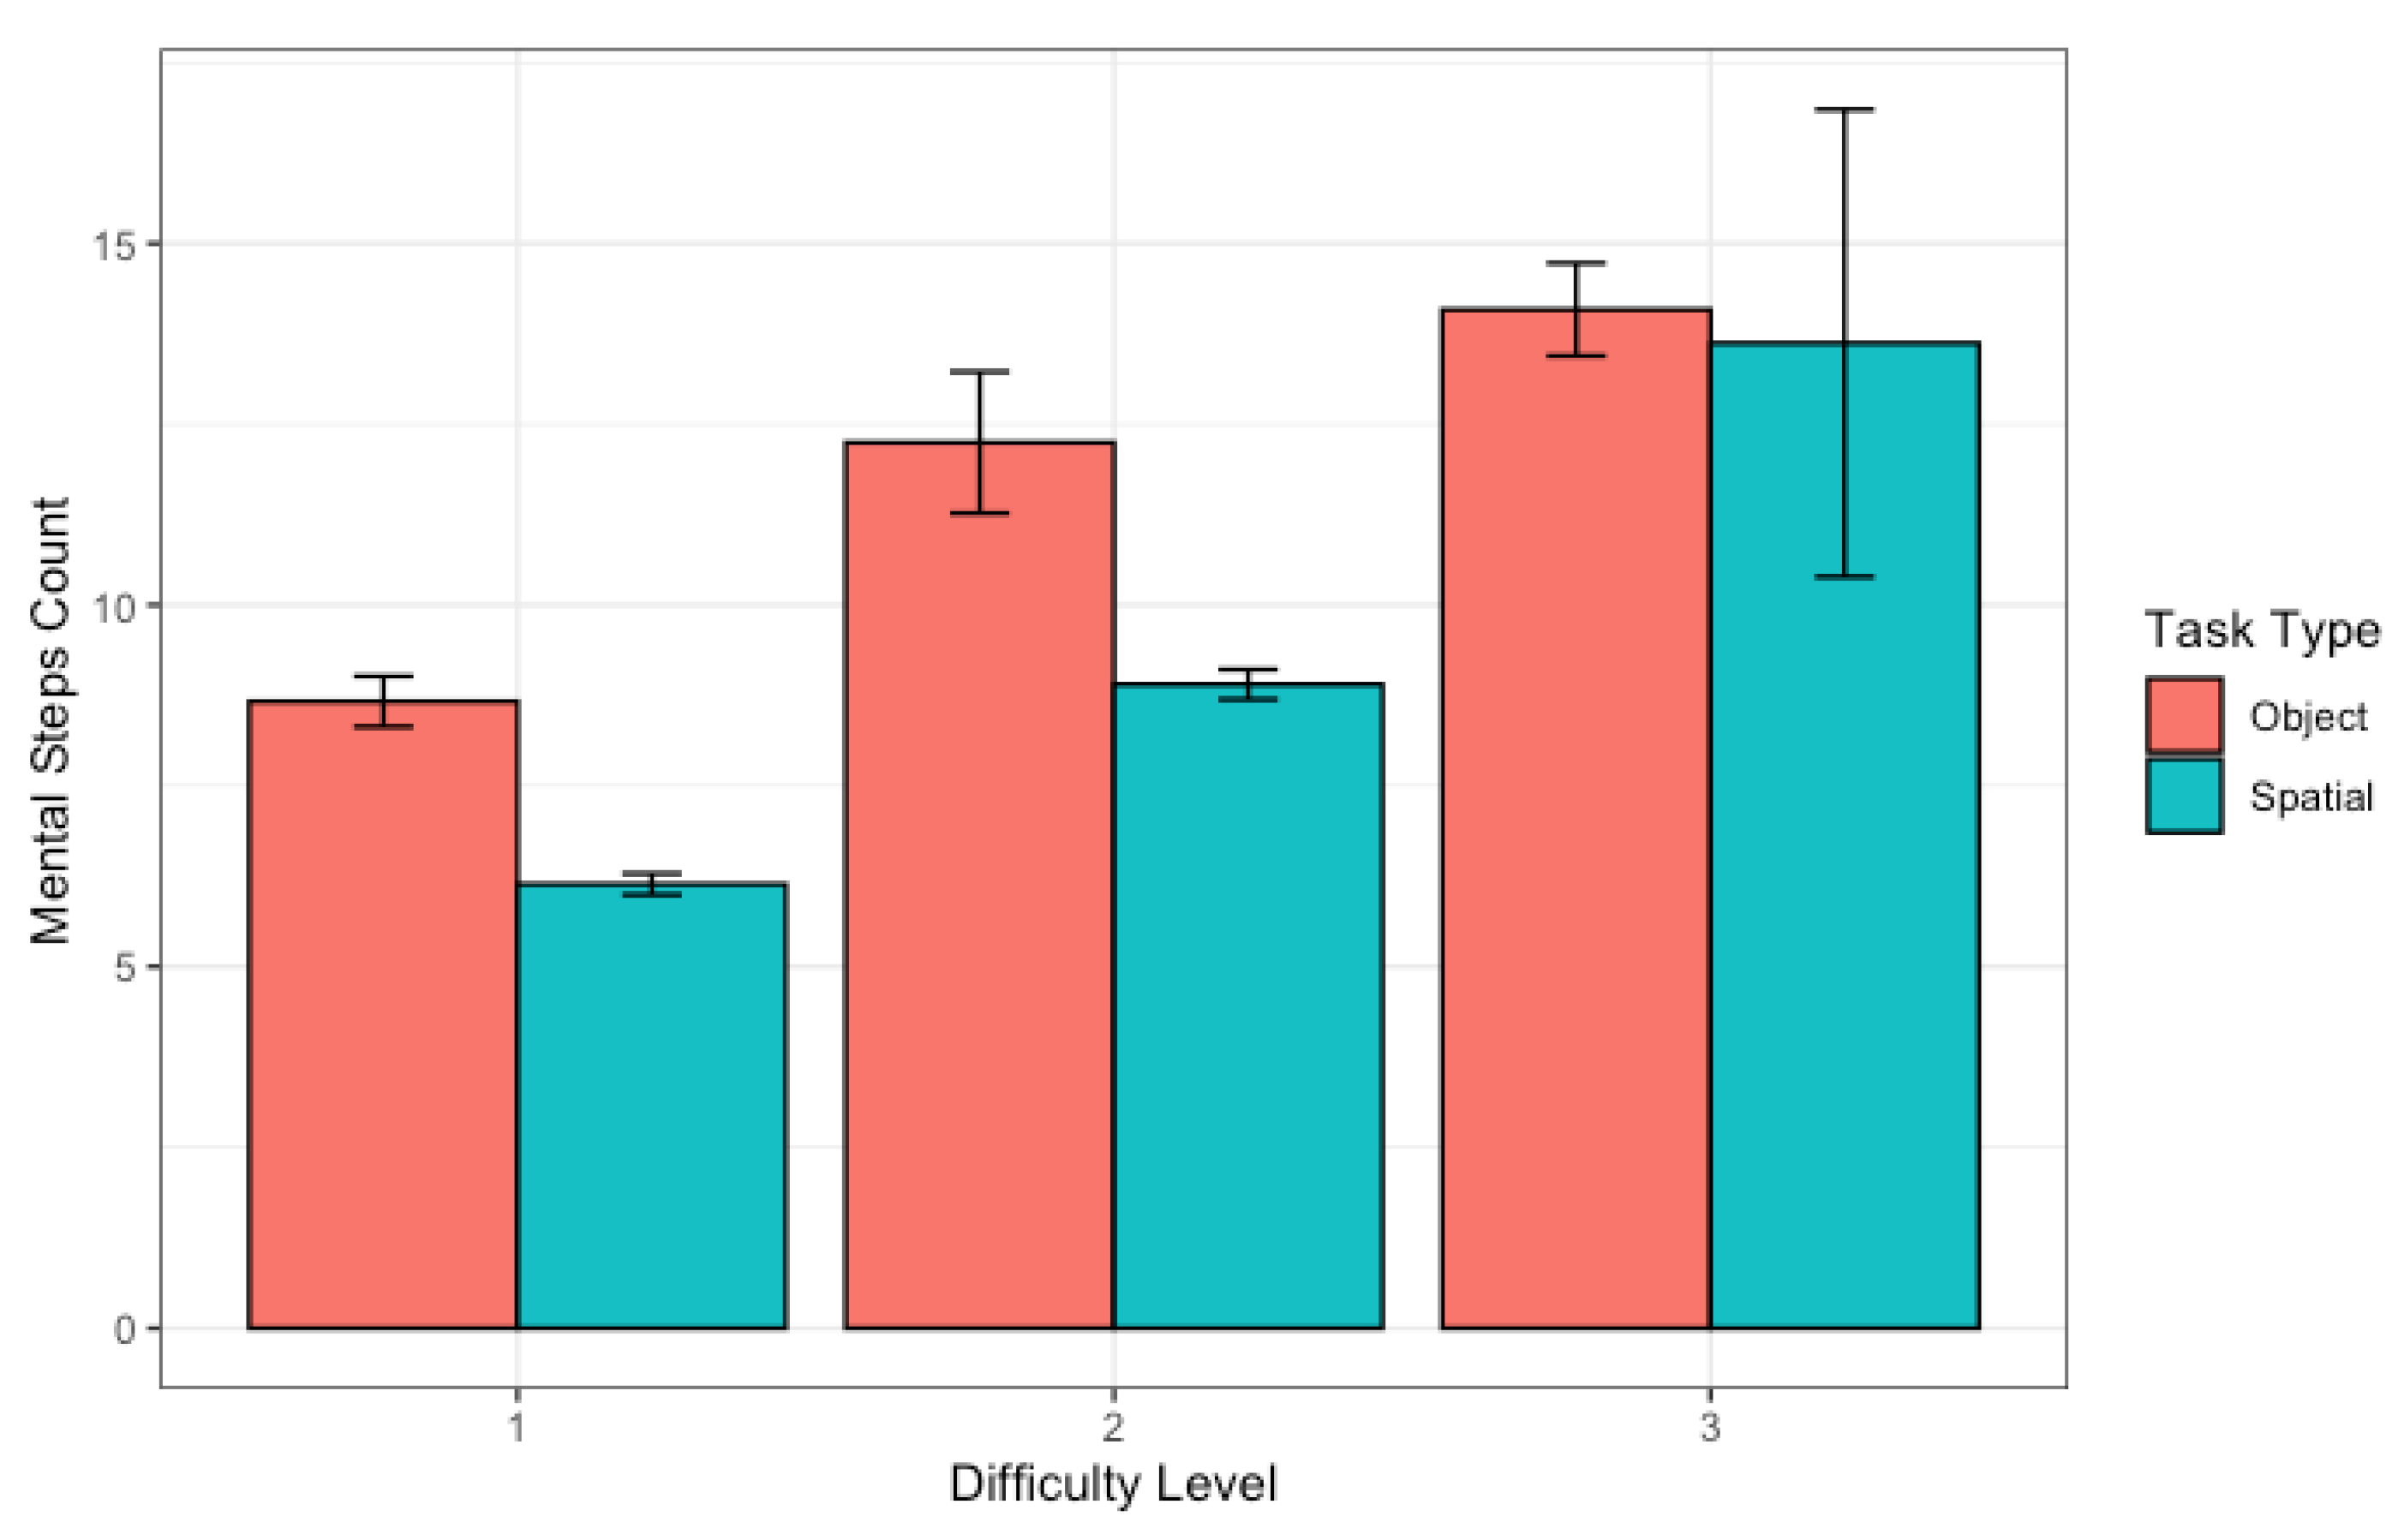
Figure 3.
Mean Distinctness ratings for Object and Spatial tasks at different Difficulty Levels. Error bars indicate confidence intervals (CIs).
Figure 3.
Mean Distinctness ratings for Object and Spatial tasks at different Difficulty Levels. Error bars indicate confidence intervals (CIs).
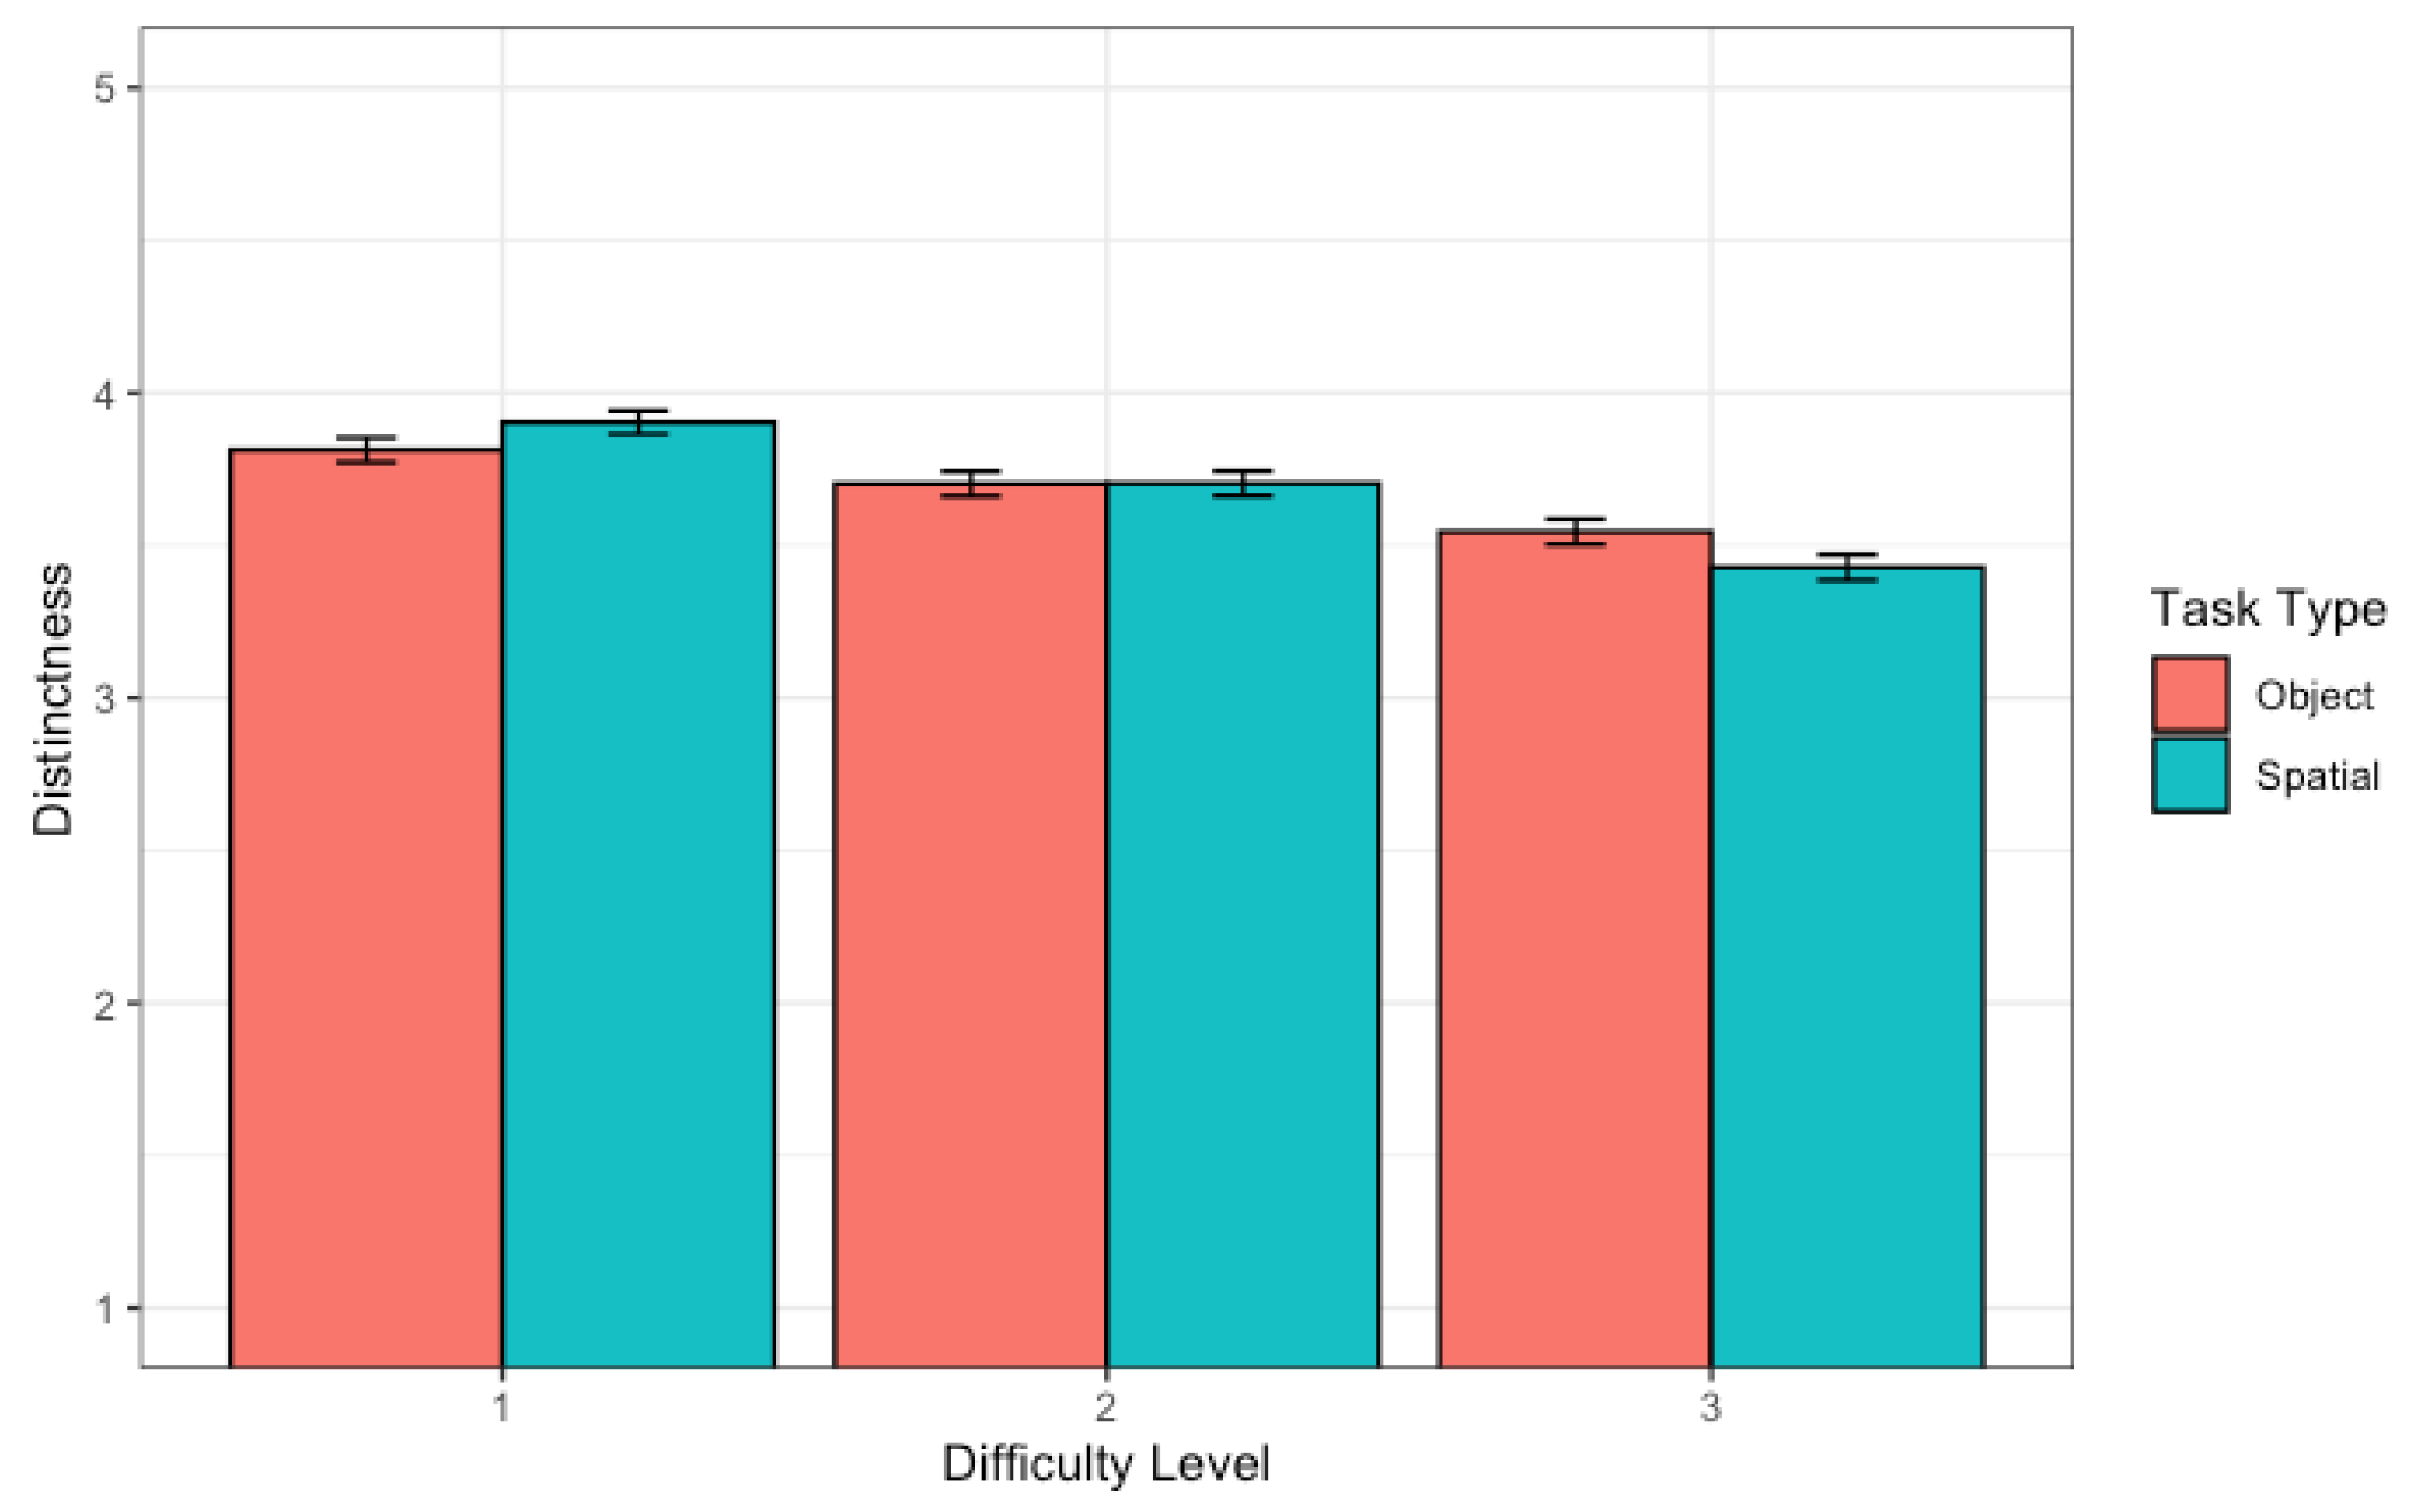
Figure 4.
Mean Educational Value ratings for Object and Spatial tasks at different Difficulty Levels: (a) Art educational domain; (b) STEM educational domain. Error bars indicate confidence intervals (CIs).
Figure 4.
Mean Educational Value ratings for Object and Spatial tasks at different Difficulty Levels: (a) Art educational domain; (b) STEM educational domain. Error bars indicate confidence intervals (CIs).
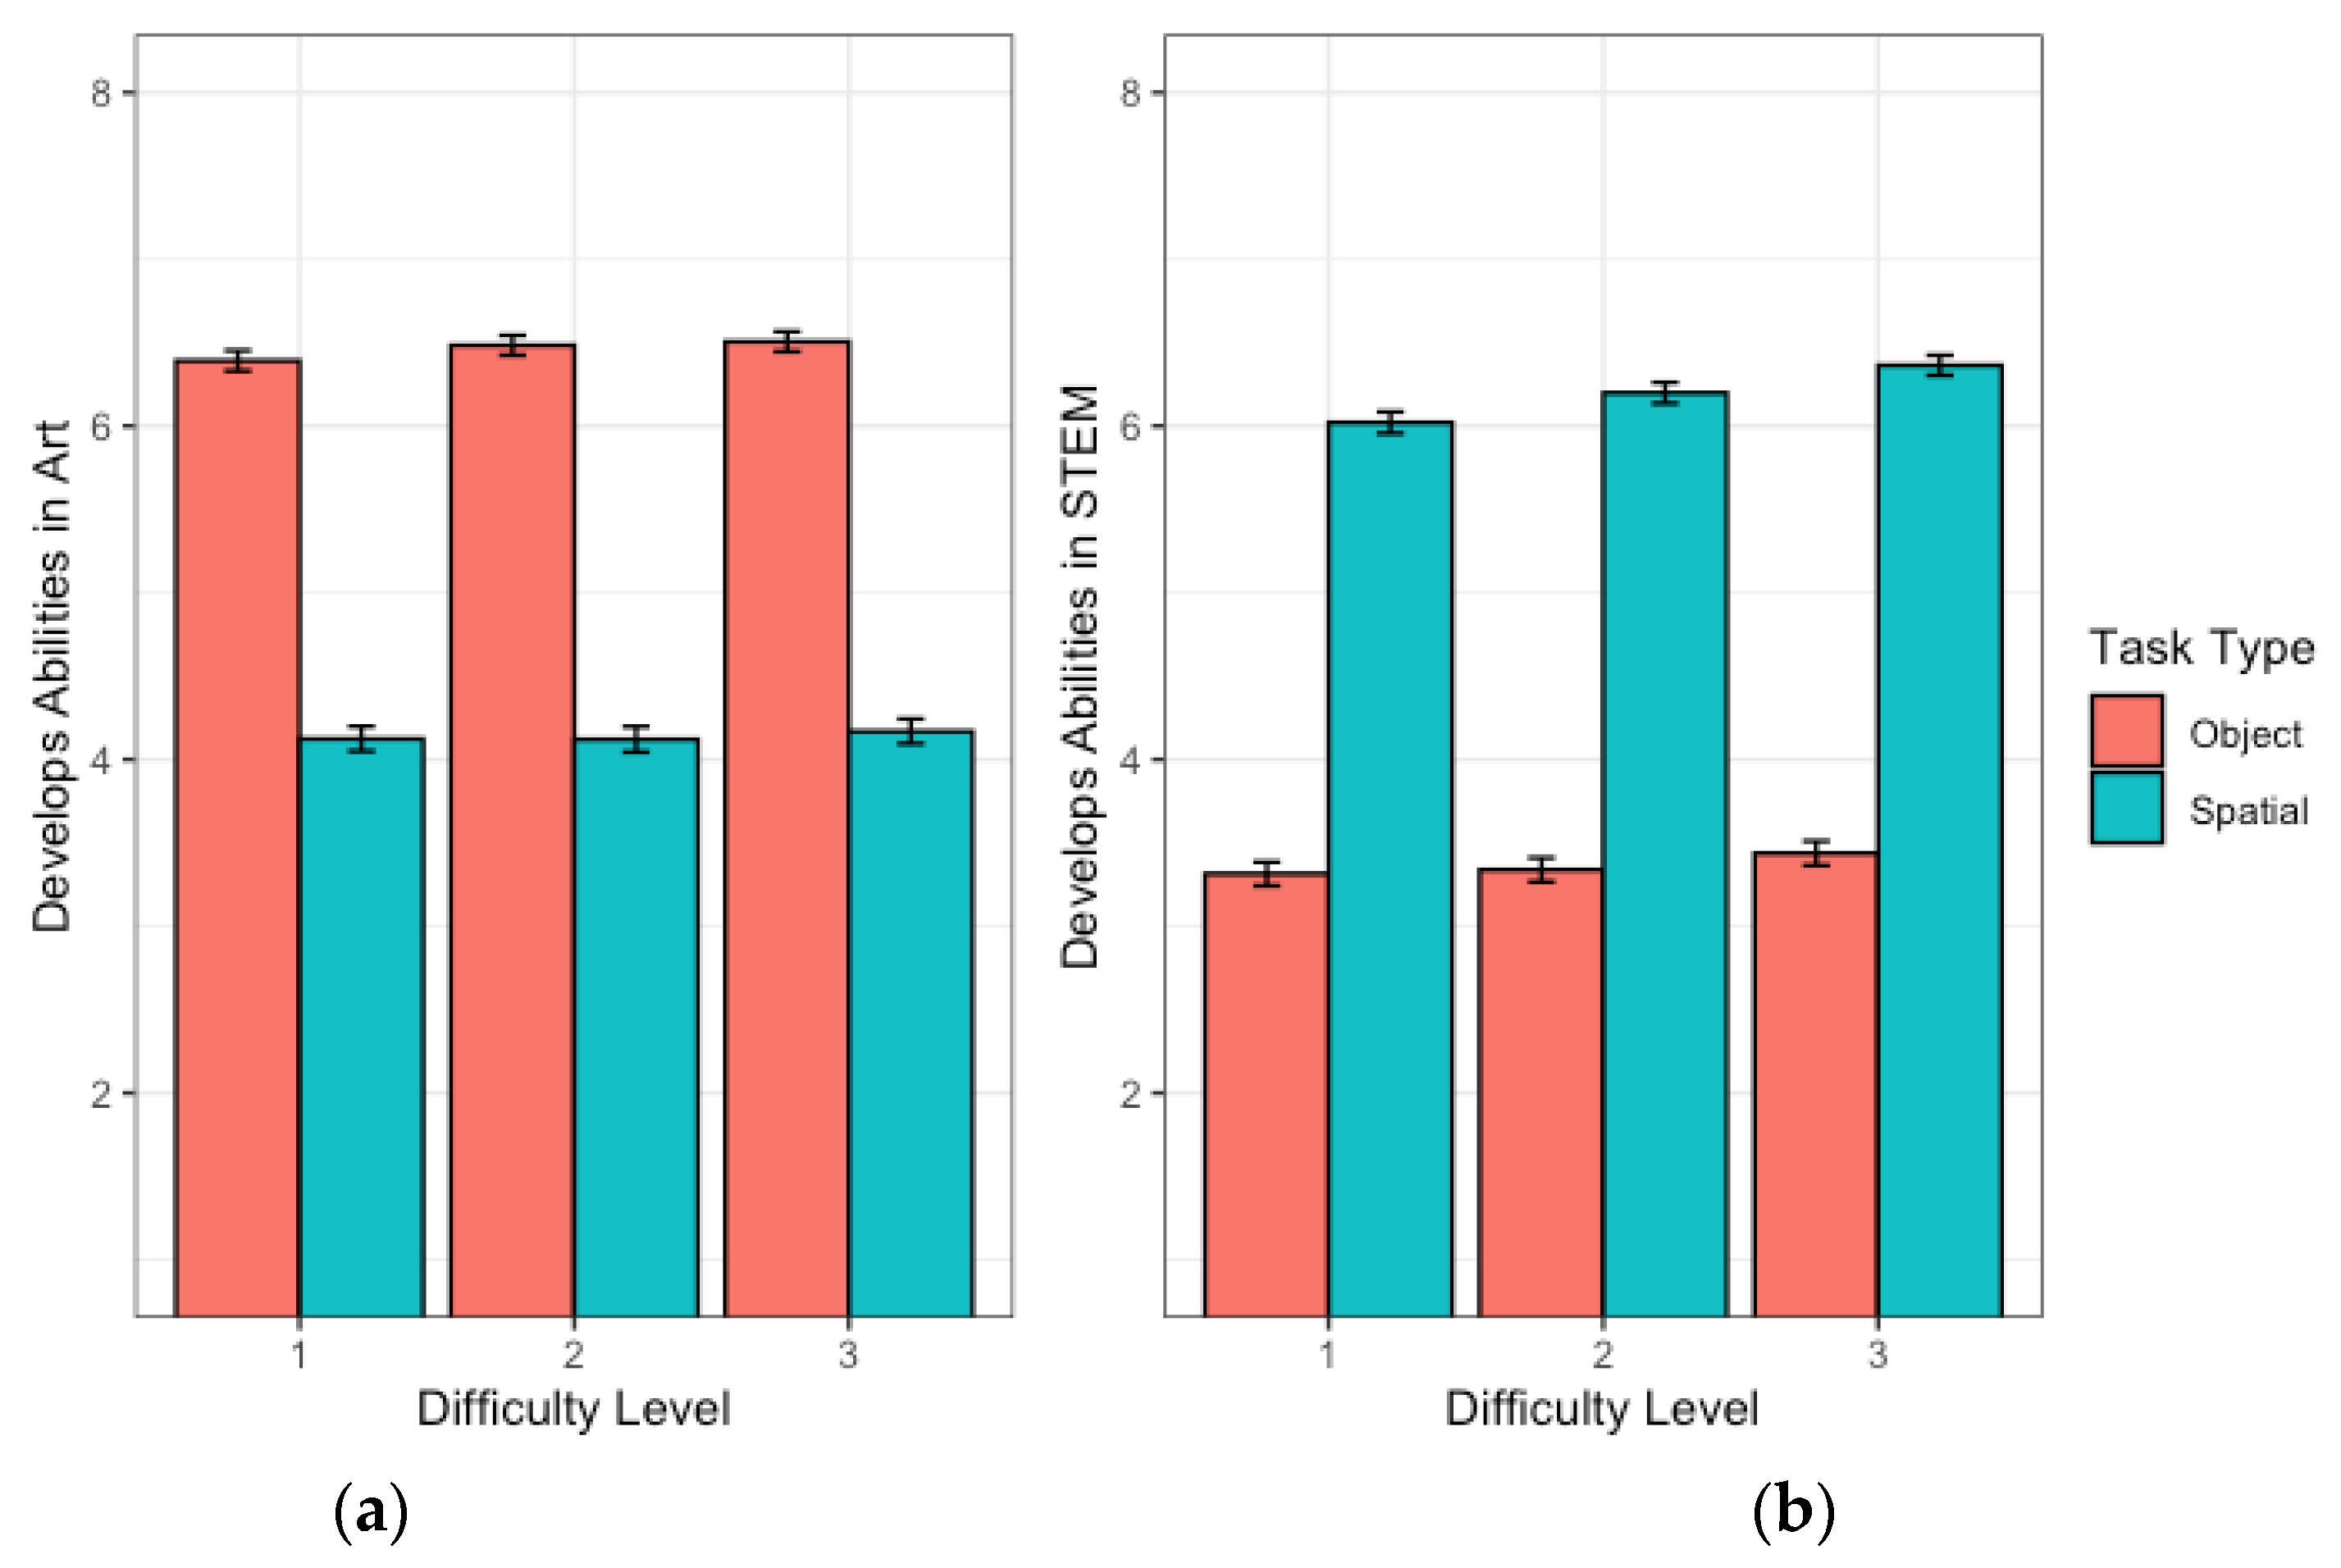
Figure 5.
Mean Attractiveness ratings for Object and Spatial tasks at different Difficulty Levels: (a) Expectations for Boys; (b) Expectations for Girls. Error bars indicate confidence intervals (CIs).
Figure 5.
Mean Attractiveness ratings for Object and Spatial tasks at different Difficulty Levels: (a) Expectations for Boys; (b) Expectations for Girls. Error bars indicate confidence intervals (CIs).
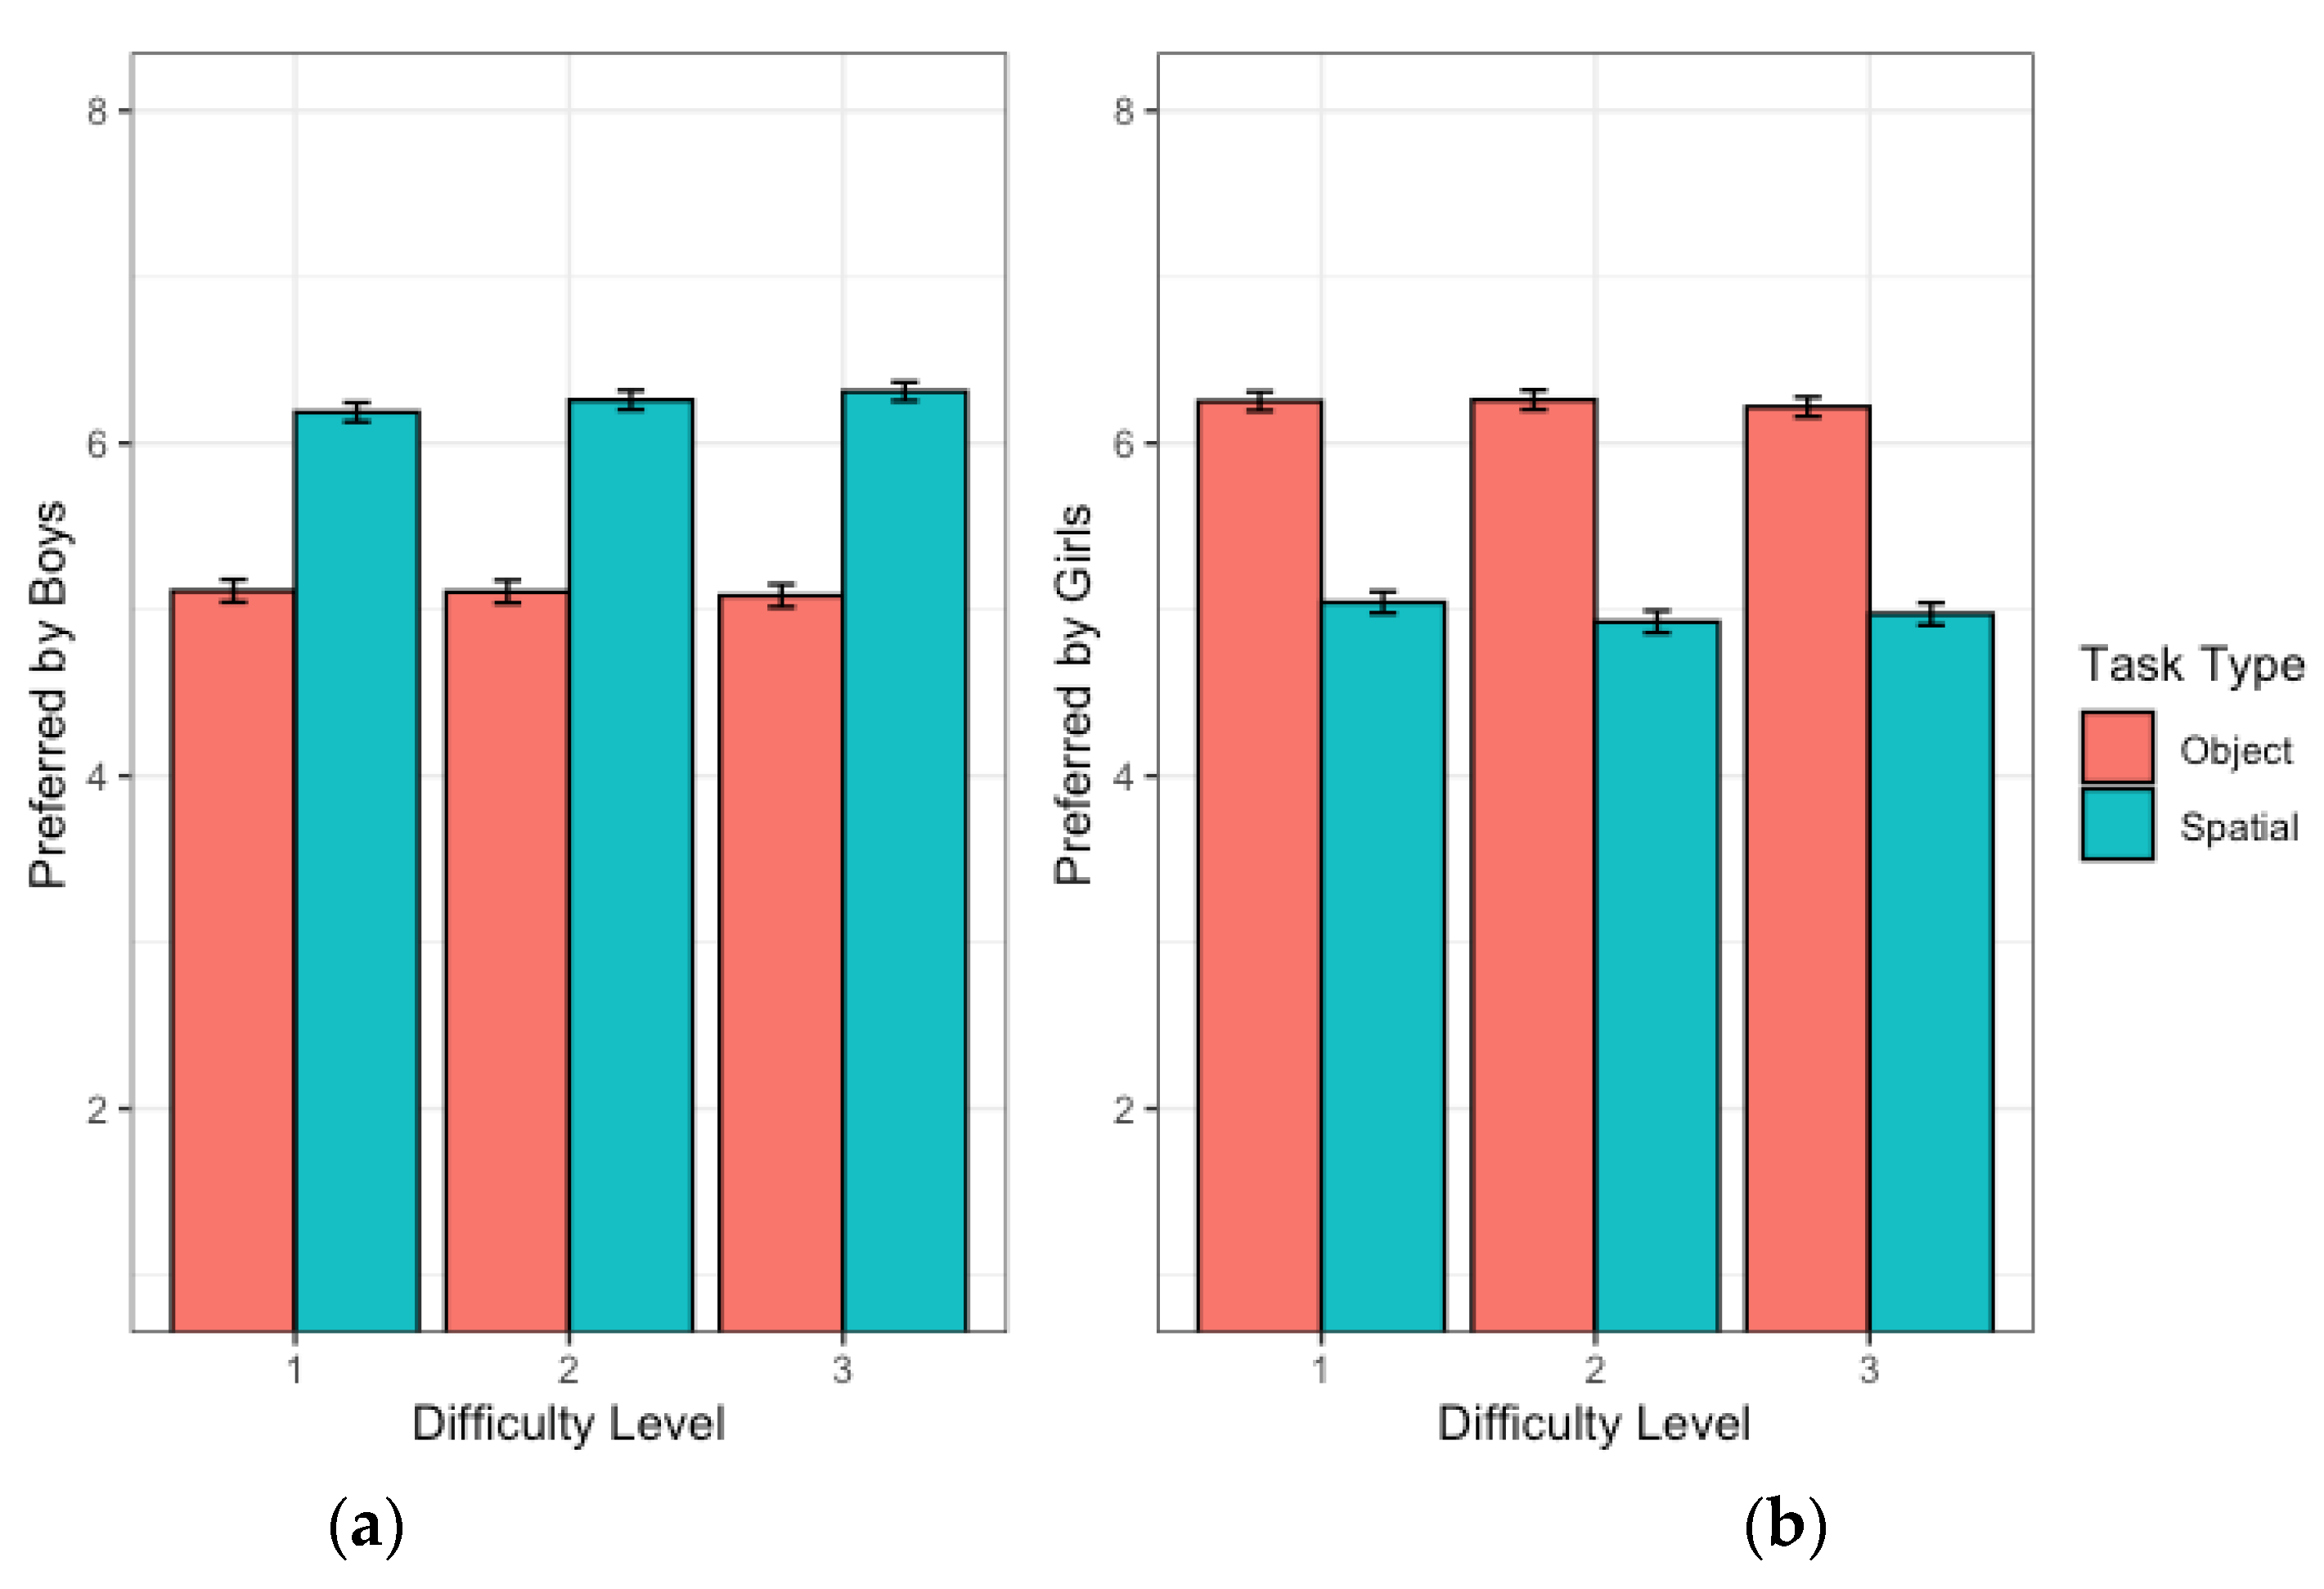

Table 1.
Intercorrelations between individual differences and Imagined Assembly Task measures.
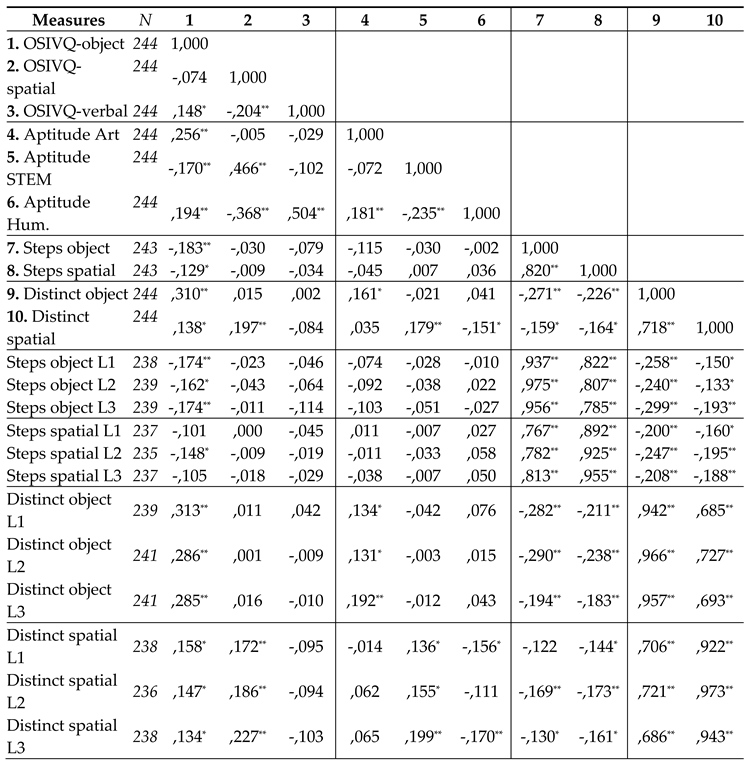 |
Note. ** p < .001 (two-tailed), * p < .05 (two-tailed).
Disclaimer/Publisher’s Note: The statements, opinions and data contained in all publications are solely those of the individual author(s) and contributor(s) and not of MDPI and/or the editor(s). MDPI and/or the editor(s) disclaim responsibility for any injury to people or property resulting from any ideas, methods, instructions or products referred to in the content. |
© 2024 by the authors. Licensee MDPI, Basel, Switzerland. This article is an open access article distributed under the terms and conditions of the Creative Commons Attribution (CC BY) license (http://creativecommons.org/licenses/by/4.0/).
Copyright: This open access article is published under a Creative Commons CC BY 4.0 license, which permit the free download, distribution, and reuse, provided that the author and preprint are cited in any reuse.


