
Submitted:
11 February 2026
Posted:
12 February 2026
You are already at the latest version
Abstract
The removal of nitrogen and phosphorus from wastewater with low organic carbon content requires the addition of an external carbon source. The objective of this study was to assess the influence of hydraulic retention time (HRT) on the efficiency of external carbon source utilization and on nitrogen and phosphorus removal in a Rotating Electro-Biological Disc Contactor (REBDC). The energy demand was evaluated based on energy consumption (E) and current efficiency (CE). Hydroponic tomato wastewater was treated in the REBDC at a constant current density of 2.5 A/m². Sodium acetate was used as the carbon source. Two C/N ratios were tested: 2.0 and 3.0, under HRT conditions of 24 h and 48 h. For both C/N ratios, extending the HRT resulted in decreased nitrogen removal efficiency. At HRT = 48 h and C/N = 3.0, the nitrogen concentration in the effluent was more than three times lower compared with C/N = 2.0. The highest phosphorus removal efficiency was achieved at C/N = 3.0 and HRT= 48h (98.8%). Increasing the HRT led to reduced TOC utilization for both C/N ratios. As a consequence of extended HRT, lower CE values and higher E values were observed, indicating increased energy demand for nutrient removal.
Keywords:
nutrient removal
; external carbon source utilization
; rotating electro-biological disc contactor (REBDC)
; effects of HRT extension
; energy consumption
; current efficiency
1. Introduction
When wastewater contains insufficient biodegradable organic compounds relative to its nitrogen and phosphorus load, biological denitrification and enhanced biological phosphorus removal require the addition of an external carbon source [1]. The efficiency of heterotrophic denitrification in biological and electro-biological systems depends not only on environmental conditions but also on the quantity and type of organic carbon available. This carbon may originate from internal sources (i.e., organic matter present in wastewater) or from externally supplied compounds. Denitrifying microorganisms oxidize organic substrates and use them as electron donors in the respiratory pathway.
External carbon sources previously applied in wastewater treatment include acetic acid, citric acid, methanol, ethanol, molasses, starch, acetone, alanine, casein, citrates, glucose, glycol, acetates, and various industrial waste streams from the agri-food sector [2].
In reactors with suspended biomass, complete denitrification is achievable with an organic matter to nitrogen ratio of 2.3 mg BOD5/mg NO3-–N. Approximately 4–5 mg COD is required to convert 1 mg NO3-–N to N2. When methanol is used, the requirement is approximately 2.5 mg methanol per mg NO3-–N, accounting for biomass synthesis [3]. In the denitrification process, the removal of 1 mg nitrate requires 3.0–4.0 mg COD in the form of acetic acid. Substrate consumption ranges from 0.07 mg LKT/(g MLVSS·d) at C/N < 2 to 0.26 mg LKT/(g MLVSS·d) at C/N > 2 [4].
In electro-biological systems where hydrogenotrophic denitrification occurs, the theoretical carbon requirement is markedly lower. For every 1 mg of NO3-–N reduced to nitrogen gas, only 0.20 mg C as bicarbonate or 0.12–0.21 mg C as carbon dioxide is needed, allowing complete hydrogenotrophic denitrification under favorable conditions [5].
Despite these theoretically low requirements, experimental studies indicate that carbon availability rarely limits microbial acclimation under elevated carbon doses. An excessive C/N ratio may lead to nitrite (NO2-) accumulation or formation of non-gaseous nitrogen compounds, whereas too low of a ratio results in incomplete denitrification [6]. A C/N ratio of 7.85 mg C/mg N has been shown to ensure complete denitrification, while full removal of nitrate and nitrate was achieved at a mass ratio of 0.504 mg C/mg N [7].
Compared with nitrogen removal, organic carbon supplementation has a substantially weaker influence on phosphorus removal efficiency. Studies indicate that high C/N ratios reduce biological phosphorus removal due to the proliferation of glycogen-accumulating organisms (GAO), which compete with phosphorus-accumulating organisms (PAO) for carbon and do not store phosphorus [8].
Excessive carbon dosing may also negatively affect effluent quality. Elevated concentrations of BOD5, COD, TC, TOC, and DOC have been observed in systems receiving external carbon inputs. Although additional carbon may enhance nitrogen and phosphorus removal, it may simultaneously increase the concentration of residual organic matter in the treated effluent relative to the influent [9].
Extending the hydraulic retention time (HRT) may improve the utilization efficiency of externally supplied carbon in both biological and electro-biological reactors. Longer HRT enhances the duration of biochemical and electrochemical reactions, supports biofilm stabilization, maintains favorable redox conditions, and promotes efficient denitrification, nitrate electroreduction, and biological phosphorus removal. Simultaneously, in reactors containing biofilm and suspended biomass, extended HRT may induce secondary processes that limit complete carbon oxidation, resulting in residual organic compounds in the effluent [10,11].
Previous studies by the authors on biological and electro-biological reactors treating wastewater from hydroponic tomato production (operated at a current density of J = 2.5 A/m2) demonstrated that extending HRT should increase nitrogen removal efficiency and improve external carbon utilization [10,11]. Increasing current density was deemed unfavorable, as it would raise both operational and capital costs [12]. Those studies further indicated that the optimal C/N ratio should range between 2.0 and 3.0, as this range ensured high nitrogen removal efficiency together with enhanced phosphorus removal [9].
In reactors operating under applied electrical current, such as REBDC, it is essential to assess the effect of HRT not only on nitrate removal but also on current efficiency (CE), a key indicator of denitrification performance in bio-electrochemical systems. CE represents the fraction of applied electrical current used for hydrogen generation, which serves as the electron donor for hydrogenotrophic denitrification [13]. Previous studies have shown that improperly selected HRT and current settings reduce CE, primarily due to hydrogen losses caused by insufficient contact between substrates and active biofilm. In contrast, energy consumption (E) indicates the specific energy demand of the phosphorus removal process via electrocoagulation occurring in REBDC [13,14]. Thus, while increasing HRT may enhance nutrient removal due to more complete carbon utilization, it may also increase energy demand and decrease CE.
The objective of this study was to evaluate the effect of extended HRT in an electro-biological reactor on nitrogen and phosphorus removal efficiency, external carbon source utilization, and reduction of residual organic compounds in the effluent, as well as to assess the energy-related implications of extended retention time.
The study included determining nitrogen, phosphorus, and carbon removal efficiencies in an REBDC supplemented with an external carbon source and comparing the results to those obtained in a Rotating Biological Disc Contactor (RBDC). Additionally, the effect of prolonged HRT on energy consumption during denitrification and phosphorus removal processes was assessed by calculating E and CE at HRT values of 24 h and 48 h.
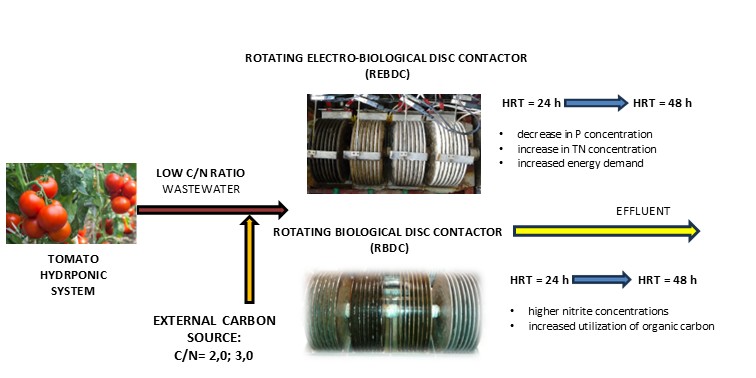
The experiments were conducted using wastewater from soilless tomato cultivation characterized by low carbon content and high nitrogen and phosphorus concentrations. Due to the low initial C/N ratio, sodium acetate was added to achieve C/N ratios of 2.0 and 3.0. A constant direct current density of 2.5 A/m² was applied in the electro-biological reactor.
2. Materials and Methods
Effluent from hydroponic tomato cultivation on mineral wool substrate operated in an open-loop system was used in this study. The cultivation facility was located in Legajny, Poland. Wastewater was collected during a defined growth phase and stored for use throughout the three-month research period to ensure stable influent characteristics. The raw wastewater quality parameters were as follows: pH 7.69 ± 0.37; electrical conductivity (EC) 5.66 ± 0.10 mS/cm; temperature 21.5 ± 1.4 °C; total organic carbon (TOC) 24.56 ± 1.2 mg C/L; total carbon (TC) 39.07 ± 1.2 mg C/L; inorganic carbon (IC) 16.7 ± 1.2 mg C/L; total nitrogen (TN) 357.1 ± 9.7 mg N/L; ammonium nitrogen (NH₄⁺–N) 0.05 ± 0.01 mg N/L; nitrites (NO₂⁻–N) 1.69 ± 0.07 mg N/L; and total phosphorus (TP) 11.06 ± 4.4 mg P/L.
The wastewater exhibited a low carbon-to-nitrogen ratio (C/N), with more than 99% of total nitrogen present in the form of nitrate (NO₃⁻).
The treatment trials were performed using laboratory-scale rotating disc reactors (RDCs), consisting of a Rotating Biological Disc Contactor (RBDC) and a Rotating Electro-Biological Disc Contactor (REBDC), with four parallel units of each type. Each reactor contained eight discs with a diameter of 22 cm, providing a total active surface area of 0.56 m². The discs were immersed to 40% of their diameter in the liquid phase. The working liquid volume of each unit was 2.0 L, and the rotation speed was maintained at 10 rpm (Figure 1).
In the REBDC, aluminum plate electrodes mounted on the reactor walls served as the anode, while stainless steel discs served as the cathode. A programmable DC power supply (HANTEK PPS2116A, China) provided a constant current density of 2.5 A/m². Sodium acetate was dosed to maintain C/N ratios of 2.0 and 3.0 (TOC = 592 ± 4.2 mg C/L) to support biofilm growth. Activated sludge collected from the denitrification zone of a municipal wastewater treatment plant in Olsztyn was used as inoculum. A four-week acclimation period was applied, after which the reactors operated for an additional two months. Experimental conditions included hydraulic retention times of 24 h and 48 h at a controlled temperature of 20–22 °C. A schematic of the experimental setup is presented in Figure 2.
Physicochemical analyses of raw and treated wastewater were performed on filtered samples. Samples were collected every 24 h, and 24 analytical results per operating condition were used to calculate mean values. TOC, TC, IC, and TN concentrations were measured using a TOC-L CPH/CPN analyzer (Shimadzu, Japan) employing oxidative combustion–infrared detection for carbon and combustion–chemiluminescence for nitrogen. Additional physicochemical parameters were measured using a UV-VIS DR 5000 spectrophotometer (HACH Lange, Germany) with standard cuvette test procedures for total phosphorus (TP) (LCK 348–350), ammonium nitrogen (NH₄⁺–N), and nitrites (NO₂⁻–N) (LCK 303 and LCK 342). Electrical conductivity, pH, and temperature were monitored using a CX-461 multiparameter meter (Elmetron, Poland).
The efficiency of hydrogenotrophic denitrification was calculated using Equation (1) [15]:
where:
—nitrate concentration in the influent (mg N/L),
—nitrate concentration in the effluent (mg N/L),
—nitrite concentration in the effluent (mg N/L),
Q—flow rate (mL/h),
I—current applied in the reactor (mA);
Energy consumption associated with phosphorus removal via electrocoagulation was calculated using Equation (2) [16]:
where:
U—cell voltage (V),
I—current applied in the reactor (A),
t—electrocoagulation time (h),
CPin—phosphorus compounds concentration in the influent (mg P/L),
CPeff—phosphorus compounds concentration in the effluent (mg P/L),
V—treated wastewater volume (L).
3. Results and Discussion
3.1. pH
The initial pH of the influent wastewater was 7.69 ± 0.37, which reflected the hydroponic nutrient composition and the additives used during the cultivation period. The measured value was consistent with previously reported ranges for similar wastewater types [10,11]. During treatment, an increase in pH was observed in both reactors (Figure 3), and similar growth patterns were noted regardless of operational conditions. Extending the HRT contributed to a higher pH in both the biological and electro-biological systems, with consistently higher values recorded in the REBDC. Additionally, higher C/N ratios resulted in elevated pH levels compared with those obtained at C/N = 2.0, confirming trends reported earlier by Rodziewicz et al. [9].
In all cases, the pH of the effluent became alkaline, exceeding 9.2. The highest values were recorded in the REBDC, reaching 9.63 and 9.81 at HRT = 48 h for C/N ratios of 2.0 and 3.0, respectively. In the RBDC, the highest effluent pH values were 9.36 and 9.45, both observed at C/N = 3.0 and HRT = 48 h.
The pH value was primarily influenced by sodium acetate addition, which is alkaline and was supplied to achieve the target C/N ratio. Therefore, wastewater supplemented to C/N = 2.0 initially exhibited lower pH than wastewater at C/N = 3.0 immediately after dosing. Subsequent differences between RBDC and REBDC pH values resulted from reactor-specific biochemical and electrochemical processes.
In the RBDC, the pH increase was attributed to heterotrophic denitrification, where conversion of one mole of NO₃⁻ results in the formation of one mole of OH⁻, elevating alkalinity. Additionally, the biochemical reduction of nitrate to gaseous nitrogen contributes to increased pH [12].
In the REBDC, the same biological processes occurred; however, additional mechanisms further elevated pH. Electrolysis of water generated OH⁻ ions at the cathode, increasing alkalinity, and hydrogenotrophic denitrification consumed one mole of H⁺ per mole of NO₂⁻ reduced to N₂ gas. This reaction increases the system’s alkalinity by approximately one equivalent of base per equivalent of nitrogen removed, corresponding to 3.57 mg CaCO₃ per mg N [12].
3.2. Electrical Conductivity (EC)
Electrical conductivity is a parameter commonly used to assess the concentration of dissolved nutrients in hydroponic solutions. During the experiment, the EC of the raw wastewater averaged 5.60 mS/cm (Figure 4), which was slightly higher than typical values reported in the literature. Standard EC values for hydroponic nutrient solutions range from 1.5 to 4.5 mS/cm [10]. This increase reflects partial nutrient uptake during tomato cultivation.
EC values measured in the biological reactor were higher than those observed in the electro-biological reactor for both C/N ratios. Extending the hydraulic retention time contributed to an increase in EC in the effluent from both the RBDC and REBDC. At C/N = 2.0, EC values in the RBDC were 9.07 and 11.46 mS/cm for HRT = 24 h and 48 h, respectively, while corresponding values in the REBDC were 8.01 and 9.37 mS/cm. When a higher carbon dose was applied (C/N = 3.0), the EC values increased further, reaching 11.32 and 15.09 mS/cm for the RBDC and 10.71 and 12.46 mS/cm for the REBDC at HRT = 24 h and 48 h, respectively.
These results demonstrate that EC increased with higher organic substrate doses in both reactors. The change was influenced by the addition of sodium acetate, which is a strong electrolyte with high conductivity, as well as by biological and electrochemical reactions occurring simultaneously, including heterotrophic denitrification, hydrogenotrophic denitrification, and electrochemical nitrate reduction, which reduce nitrate concentrations in the treated wastewater [17].
Nitrogen removal via denitrification in the REBDC contributes to a reduction in solution conductivity [18]. Previous findings confirmed that lower EC values in effluent from electro-biological systems result from the higher denitrification efficiency and lower residual nitrogen concentration compared with biological systems [9].
Therefore, the lower EC values recorded in the REBDC effluent were most likely associated with more efficient nitrate removal and consequently lower nitrogen concentrations in the treated wastewater [9].
3.3. Total Nitrogen (TN)
Nitrogen removal efficiency in the electro-biological reactor was higher than in the biological reactor for both applied C/N ratios (Figure 5). This trend is reflected in the effluent nitrogen concentrations. At C/N = 2.0 and HRT = 24 h, the effluent TN concentration from the RBDC was 147.80 ± 13.2 mg N/L, whereas in the REBDC it was significantly lower at 32.61 ± 2.3 mg N/L, corresponding to nitrogen removal efficiencies of 58.6% and 90.9%, respectively. Extending the HRT to 48 h resulted in decreased nitrogen removal efficiency in both systems, reaching 55.9% in the RBDC and 71.1% in the REBDC, with effluent concentrations of 157.67 ± 11.3 mg N/L and 103.10 ± 10.9 mg N/L, respectively.
At C/N = 3.0 and HRT = 24 h, effluent TN concentrations were 38.42 ± 5.65 mg N/L for the RBDC and 27.41 ± 3.70 mg N/L for the REBDC. Under these conditions, both reactors demonstrated substantially higher nitrogen removal efficiencies than at C/N = 2.0, reaching 89.4% in the RBDC and 92.3% in the REBDC. Given an influent TN concentration of 357.06 ± 21.2 mg N/L, these results confirm that at C/N = 3.0 and HRT = 24 h, removal efficiencies approaching 90% can be achieved, with the electro-biological configuration performing slightly better.
Increasing the amount of external organic carbon was therefore an effective operational strategy, even though the initial nitrogen and phosphorus concentrations in the wastewater were lower than those reported in earlier research [9]. In the RBDC, nitrogen removal resulted from heterotrophic denitrification and assimilation by biofilm microorganisms. In contrast, nitrogen removal in the REBDC was additionally supported by hydrogenotrophic denitrification and electrochemical nitrate reduction, processes characteristic of systems with direct current application. These findings are consistent with previously reported work by Rodziewicz et al. [19] and Chen et al. [20].
The efficiency of hydrogenotrophic denitrification is influenced by wastewater pH, with an optimal range of 7.6–8.6 [20]. However, denitrifying microorganisms may have varying pH tolerance ranges depending on microbial composition [21]. In electro-biological reactors, pH increases due to both biological denitrification and electrochemical reactions, resulting in elevated alkalinity. This condition promotes nitrite accumulation and may inhibit the rate of further nitrate removal. Additionally, nitrite formation is a known intermediate of electrochemical nitrate reduction [18]. In the biological reactor, increased nitrite concentrations may also result from limited diffusion of acetate into deeper biofilm layers, where the final reduction step from NO2⁻ to N2 occurs [18,22]. This effect was less pronounced in the REBDC, likely due to the release of gaseous electrochemical reaction products, which enhanced mass transfer within the biofilm [12].
At the same C/N ratio (3.0) and extended HRT of 48 h, effluent TN concentrations increased in both systems, reaching 105.5 ± 19.8 mg N/L in the RBDC and 34.6 ± 6.80 mg N/L in the REBDC. In the biological reactor, this value was 2.7 times higher than at HRT = 24 h, whereas in the electro-biological reactor the increase was only 1.26-fold. Notably, at C/N = 3.0 and HRT = 48 h, effluent TN in the REBDC was more than three times lower than at the same HRT with C/N = 2.0.
These results indicate that extending the HRT in the electro-biological reactor is technologically justified, as it supports higher nitrogen removal efficiency when sufficient organic carbon is supplied.
3.4. Nitrites and Ammonium Nitrogen
The results indicate that nitrite accumulation occurred during treatment in both the biological and electro-biological reactors at C/N = 2.0 (Figure 6). Nitrite concentrations increased from an initial 1.69 ± 0.09 mg NO2–N/L to 5.69 ± 0.08 mg NO2–N/L and 9.95 ± 0.25 mg NO2–N/L in the effluent from the RBDC at HRT values of 24 h and 48 h, respectively. In the REBDC, nitrite concentrations were higher and reached 10.29 ± 0.08 mg NO2–N/L and 10.05 ± 0.32 NO2–N/L at the same HRT conditions. While nitrite accumulation increased markedly with HRT extension in the biological reactor, the concentrations in the REBDC remained relatively consistent, suggesting that HRT had limited influence on nitrite accumulation in the electro-biological system.
At C/N = 3.0, nitrite concentrations decreased during treatment in the RBDC at HRT = 24 h—from 1.69 ± 0.07 mg NO2–N/L in raw wastewater to 0.5 ± 0.1 NO2–N/L in the effluent. However, extending HRT to 48 h resulted in a notable increase to 7.62 ± 0.16 mg NO2–N/L. A similar trend occurred in the REBDC, where nitrite concentrations increased from 2.49 ± 0.06 mg NO2–N/L at HRT = 24 h to 7.46 ± 0.16 mg NO2–N/L at HRT = 48 h. At C/N = 3.0, nitrite accumulation in the REBDC effluent was lower than at C/N = 2.0, indicating that additional carbon improved reduction beyond the nitrite stage. At the same time, HRT extension produced a clearer difference in nitrite levels between 24 h and 48 h compared with C/N = 2.0.
In previous studies [9], an increase in nitrite concentration was observed in both reactors when higher substrate doses were applied, which also altered pH conditions. It should be noted that the raw wastewater used in the earlier research had a significantly higher influent nitrogen concentration (609.98 ± 11.52 mg NO2–N/L), along with higher acetate dosing. As a result, nitrite concentrations in the effluent reached 12.8 and 29.6 NO2–N/L in the biological reactor and 34.4 and 43.5 mg NO2–N/L in the electro-biological reactor at C/N = 2.0 and 3.0, respectively. In the present work, influent nitrogen levels were lower (357.0 ± 1.69 mg NO2–N/L), and the amount of carbon added was reduced accordingly. As a result, nitrite concentrations in the effluent did not exceed 11.0 mg NO2–N/L for C/N = 2.0 and 8.0 mg NO2–N/L for C/N = 3.0.
Nitrite accumulation may result from oxygen stratification within the biofilm, creating anoxic microzones with limited access to electron donors. Under such conditions, nitrate reduction may halt at the nitrite stage rather than proceed to nitrogen gas [22].
Ammonium nitrogen was detected in the effluent of both reactors at very low concentrations, below 1.0 mg NH4–N/L (Figure 7). The highest concentration (0.69 ± 0.01 mg NH4–N/L) occurred in the RBDC at C/N = 3.0 and HRT = 24 h, while the lowest concentration (0.01 ± 0.03 mg NH4–N/L) was recorded in the same reactor at C/N = 2.0 and HRT = 48 h. At C/N = 2.0, higher ammonium concentrations occurred at the shorter HRT, while the opposite trend was observed at C/N = 3.0. At HRT = 48 h, ammonium concentrations in both reactors were approximately ten times lower than at HRT = 24 h.
In the REBDC, extending HRT resulted in lower ammonium concentrations for both C/N ratios, with similar trends observed in the RBDC. The presence of ammonium in the effluent may be attributed to biofilm decay and mineralization of organic nitrogen. Over prolonged retention periods, aging biofilm and autolysis may enhance ammonium release, potentially exceeding its biochemical oxidation rate [23,24].
3.5. Total Phosphorus (TP)
Phosphorus removal in the electro-biological reactor occurred primarily through electrocoagulation, followed by incorporation of phosphorus into biofilm biomass and enhanced biological phosphorus removal (EBPR) driven by phosphorus-accumulating organisms (PAOs). In the biological reactor, the decrease in phosphorus concentration resulted mainly from biomass growth and phosphorus uptake by PAOs [8,9].
The influent contained 11.06 ± 0.89 mg P/L. In the biological reactor, phosphorus concentrations decreased to 7.23 ± 0.23 mg P/L at C/N = 2.0 and to 7.58 ± 0.39 mg P/L at C/N = 3.0 (Figure 8), corresponding to biological phosphorus removal efficiencies of 37.7% and 34.7%, respectively. Increasing the external carbon dose was associated with lower biological phosphorus removal efficiency. When HRT was extended to 48 h, phosphorus removal efficiency in the RBDC increased at C/N = 2.0, as evidenced by the reduced effluent concentration (6.98 ± 0.54 mg P/L vs. 7.23 ± 0.23 mg P/L for HRT = 48 h and 24 h, respectively). However, at C/N = 3.0, the opposite trend was observed, with effluent phosphorus increasing from 7.58 ± 0.39 mg P/L (24 h) to 8.96 ± 0.36 mg P/L (48 h).
In contrast, effluent phosphorus concentrations in the electro-biological reactor were substantially lower than in the biological system. At C/N = 2.0, phosphorus concentrations reached 0.45 ± 0.03 mg P/L and 0.16 ± 0.01 mg P/L at HRT values of 24 h and 48 h, corresponding to removal efficiencies of 91.5% and 98.6%, respectively. Thus, extending HRT significantly enhanced phosphorus removal.
A similar effect was observed at C/N = 3.0, where effluent TP concentrations were 0.31 ± 0.04 mg P/L at HRT = 24 h and 0.13 ± 0.02 mg P/L at HRT = 48 h, corresponding to removal efficiencies of 97.2% and 98.8%, respectively. Additionally, phosphorus concentrations in the REBDC effluent were lower at C/N = 3.0 than at C/N = 2.0, demonstrating that both extended HRT and increased availability of carbon supported more effective phosphorus removal in the electro-biological system.
3.6. Chemical Oxygen Demand (COD)
The COD concentration in the raw wastewater was 51.45 ± 7.3 mg O2/L (Figure 9). After sodium acetate supplementation based on the applied C/N ratio, COD values increased due to the presence of the external carbon source. COD concentrations fluctuated during treatment and were higher at C/N = 3.0 compared with C/N = 2.0. The lowest COD concentration in the effluent was observed in the RBDC at C/N = 2.0 and HRT = 48 h (138.0 ± 11.5 mg O2/L), whereas the highest value was recorded in the REBDC at C/N = 3.0 and HRT = 48 h (329.0 ± 24.8 mg O2/L).
In the biological reactor, extending the HRT improved utilization of the organic substrate for both C/N ratios, as evidenced by lower effluent COD values. At C/N = 2.0, COD decreased from 228.0 ± 11.2 mg O2/L at HRT = 24 h to 138.0 ± 11.5 mg O2/L at HRT = 48 h. A similar pattern was observed at C/N = 3.0, where COD decreased from 287.0 ± 15.9 mg O2/L /L to 195.0 ± 17.0 mg O2/L with extended HRT.
A different trend was observed in the electro-biological reactor. In the REBDC, extending HRT resulted in higher effluent COD. At C/N = 2.0, COD increased from 161.0 ± 16.3 mg O2/L (HRT = 24 h) to 226.0 ± 21.3 mg O2/L (HRT = 48 h). Likewise, at C/N = 3.0, COD increased from 229.0 ± 14.6 mg O2/L to 329.0 ± 24.6 mg O2/L.
The best utilization of the external carbon source was observed in the biological reactor at HRT = 48 h for both C/N ratios, demonstrating that increased retention time positively affected substrate consumption. In contrast, the same operational change in the REBDC resulted in reduced substrate utilization efficiency.
Considering the relatively low COD of the untreated wastewater (51.45 ± 7.3 mg O2/L) compared with the COD measured in treated effluent, it can be concluded that a substantial portion of the added external carbon remained unused.
The reduced utilization of the external carbon source in the REBDC may be attributed to altered microbial activity under electric field exposure, generation of electrochemical intermediates, or disruption of metabolic pathways [27,28]. It is also possible that the applied HRT was excessively long or that the dosage of sodium acetate exceeded the metabolic demand of the biofilm-forming microorganisms [29].
3.7. Total Carbon (TC), Inorganic Carbon (IC), and Total Organic Carbon (TOC)
Changes in total carbon (TC), inorganic carbon (IC), and total organic carbon (TOC) concentrations illustrate the extent to which the carbon supplied to the reactors was utilized.
For TC, similar trends were observed for both tested C/N ratios. In the biological reactor, extending the hydraulic retention time supported more complete carbon utilization. At C/N = 2.0 and HRT = 24 h, the effluent TC concentration was 86.0 ± 8.9 mg/L, whereas at HRT = 48 h it decreased to 53.0 ± 4.8 mg/L (Figure 10). This value was only slightly higher than the influent TC concentration prior to sodium acetate addition (41.00 ± 5.6 mg/L). In reactors supplied with a higher external carbon dose (C/N = 3.0), the TC values were higher, amounting to 109.0 ± 6.7 mg/L and 78.0 ± 7.1mg/L for HRT values of 24 h and 48 h, respectively.
In contrast, the opposite trend was observed in the electro-biological reactor, where increasing HRT resulted in higher TC concentrations. At C/N = 2.0, TC increased from 58.00 ± 4.5 mg/L to 95.00 ± 7.6 mg/L with extended retention time. At C/N = 3.0, the increase was much more pronounced, from 91.00 ± 5.3 mg/L to 288.00 ± 15.8 mg/L.
These findings indicate that, at HRT = 24 h, the REBDC demonstrated more effective utilization of sodium acetate than the RBDC. However, at HRT = 48 h, the biological reactor demonstrated superior carbon utilization, while the electro-biological system accumulated substantially more residual carbon.
A similar pattern was observed for inorganic carbon (Figure 11). At both C/N ratios and at HRT = 24 h, the REBDC produced lower IC concentrations in the effluent compared with the biological reactor. At HRT = 48 h, this trend reversed, and lower IC concentrations were observed in the effluent from the biological system. However, IC concentrations ranging from 16 ± 2.3 mg/L to 68 ± 7.9 mg/L, when compared with TC values, suggest that the utilization of the added carbon source remained limited. This is further confirmed by TOC measurements, which represent the fraction of organic carbon available for denitrification and phosphorus removal.
The relationships observed for TC and IC also applied to TOC concentrations (Figure 12). In the REBDC, TOC concentrations ranged from 40.00 ± 8.9 mg/L (C/N = 2.0, HRT = 24 h) to 220.00 ± 24.3 mg/L (C/N = 3.0, HRT = 48 h). At HRT = 24 h and C/N = 2.0, the residual organic carbon remained relatively low compared with the influent wastewater before sodium acetate addition (24.5 ± 8.9 mg/L). However, at HRT = 48 h the effluent contained substantially higher TOC concentrations - 69.0 ± 10.3 mg/L at C/N = 2.0 and 220.0 ± 24.3 mg/L at C/N = 3.0. Reduced carbon utilization in the REBDC may be associated with altered microbial activity under the electric field, accumulation of intermediate products, or disruption of metabolic pathways [28,30,31].
In the biological reactor, carbon utilization during treatment was more complete. At C/N = 2.0 and HRT = 48 h, the effluent TOC concentration was 37.0 ± 6.8 mg/L, while the influent contained 24.5 ± 8.9 mg/L before carbon supplementation—indicating that nearly all of the externally supplied carbon had been consumed. Under conditions of increased external carbon availability (C/N = 3.0), the effluent TOC was 59.0 ± 7.3 mg/L (compared with 220.0 ± 24.3 mg/L in the REBDC), confirming that the biological reactor used the supplied substrate more efficiently.
3.8. Current Efficiency (CE)
The efficiency of nitrate removal through denitrification in electro-biological reactors depends on both current density and hydraulic retention time [19]. When nitrogen, phosphorus, and residual organic carbon from an external carbon source are removed simultaneously, evaluation should not be based on a single pollutant. The results demonstrated that extending HRT reduced phosphorus concentrations in the REBDC effluent (Figure 8), yet did not improve the degree of organic substrate utilization (Figure 9, Figure 12). This may be attributed to an excessive carbon dose relative to the metabolic requirements of heterotrophic denitrifiers present in the biofilm, which compete with hydrogenotrophic denitrifiers for the available electron donor [19]. Other concurrent processes—including incomplete electrochemical oxidation, partial organic carbon mineralization, and formation of aldehydes or other oxidation by-products at the anode—may also contribute to the organic matter remaining in the effluent [32,33].
Extending HRT from 24 h to 48 h was technologically justified with respect to phosphorus removal efficiency at both tested C/N ratios (Figure 8). In terms of nitrogen removal, increasing HRT to 48 h combined with raising the carbon dose to C/N = 3.0 resulted in noticeably higher TN removal compared with C/N = 2.0 (Figure 5). However, when comparing nitrogen removal efficiency at C/N = 3.0 between HRT values of 24 h and 48 h, the longer retention time did not improve performance. Effluent nitrogen at HRT = 48 h was 7.21 mg N/L higher than at HRT = 24 h, indicating a decline in removal efficiency under extended retention conditions.
Current efficiency reflects the contribution of electrochemical denitrification to overall nitrogen removal in electro-biological systems. The results clearly show that extending HRT reduces CE by approximately half for both tested C/N ratios (Figure 13). At C/N = 2.0, CE decreased from 19.5% at HRT = 24 h to 8.5% at HRT = 48 h. At C/N = 3.0, CE values were similar for HRT = 24 h (19.4%) and declined to 9.67% at HRT = 48 h. While CE values at 24 h were comparable for both C/N ratios, the longer HRT resulted in a slightly higher CE at C/N = 3.0 than at C/N = 2.0.
Figure 13 additionally presents CE values calculated for the second 24-hour period of reactors operating at 48 h HRT. These values were estimated assuming that nitrogen concentrations at the beginning of the 25th hour matched the final effluent concentrations of reactors operated at HRT = 24 h. Under these conditions, the CE values were negative for both C/N ratios, indicating that extended retention increases energy costs and is not economically efficient. Similar trends were reported by Rodziewicz et al. [14], where CE decreased with increasing HRT. At the same time, CE values obtained in that study for J = 2.5 A/m² and HRT = 24 h (7.5%) were lower than those observed in the present work (19.5% and 19.4%). This difference may be attributed to the much lower C/N ratio used previously (C/N = 0.5), compared with C/N = 2.0 and 3.0 applied in this experiment.
Feng et al. [34], using methanol and starch as external carbon sources, reported CE values of 23.0% and 19.0%, respectively. These results remain significantly lower than those obtained in studies by Wan et al. [35,36], where sodium bicarbonate (NaHCO₃) was used as the carbon source. Even greater values—exceeding 240% CE—were reported for three-dimensional (3D) bio-electrochemical reactors [37]. For comparison, in two-dimensional (2D) reactors such as the REBDC, CE values reported in literature do not exceed 100%.
3.9. Energy Consumption in Phosphorus Compounds Removal Process (E)
Previous studies conducted by the authors demonstrated that phosphorus removal efficiencies exceeding 90% can be achieved in electro-biological reactors at hydraulic retention times longer than 4 h [14,19]. However, extending HRT is associated with increased energy demand, as reflected in the calculated energy consumption values (E).
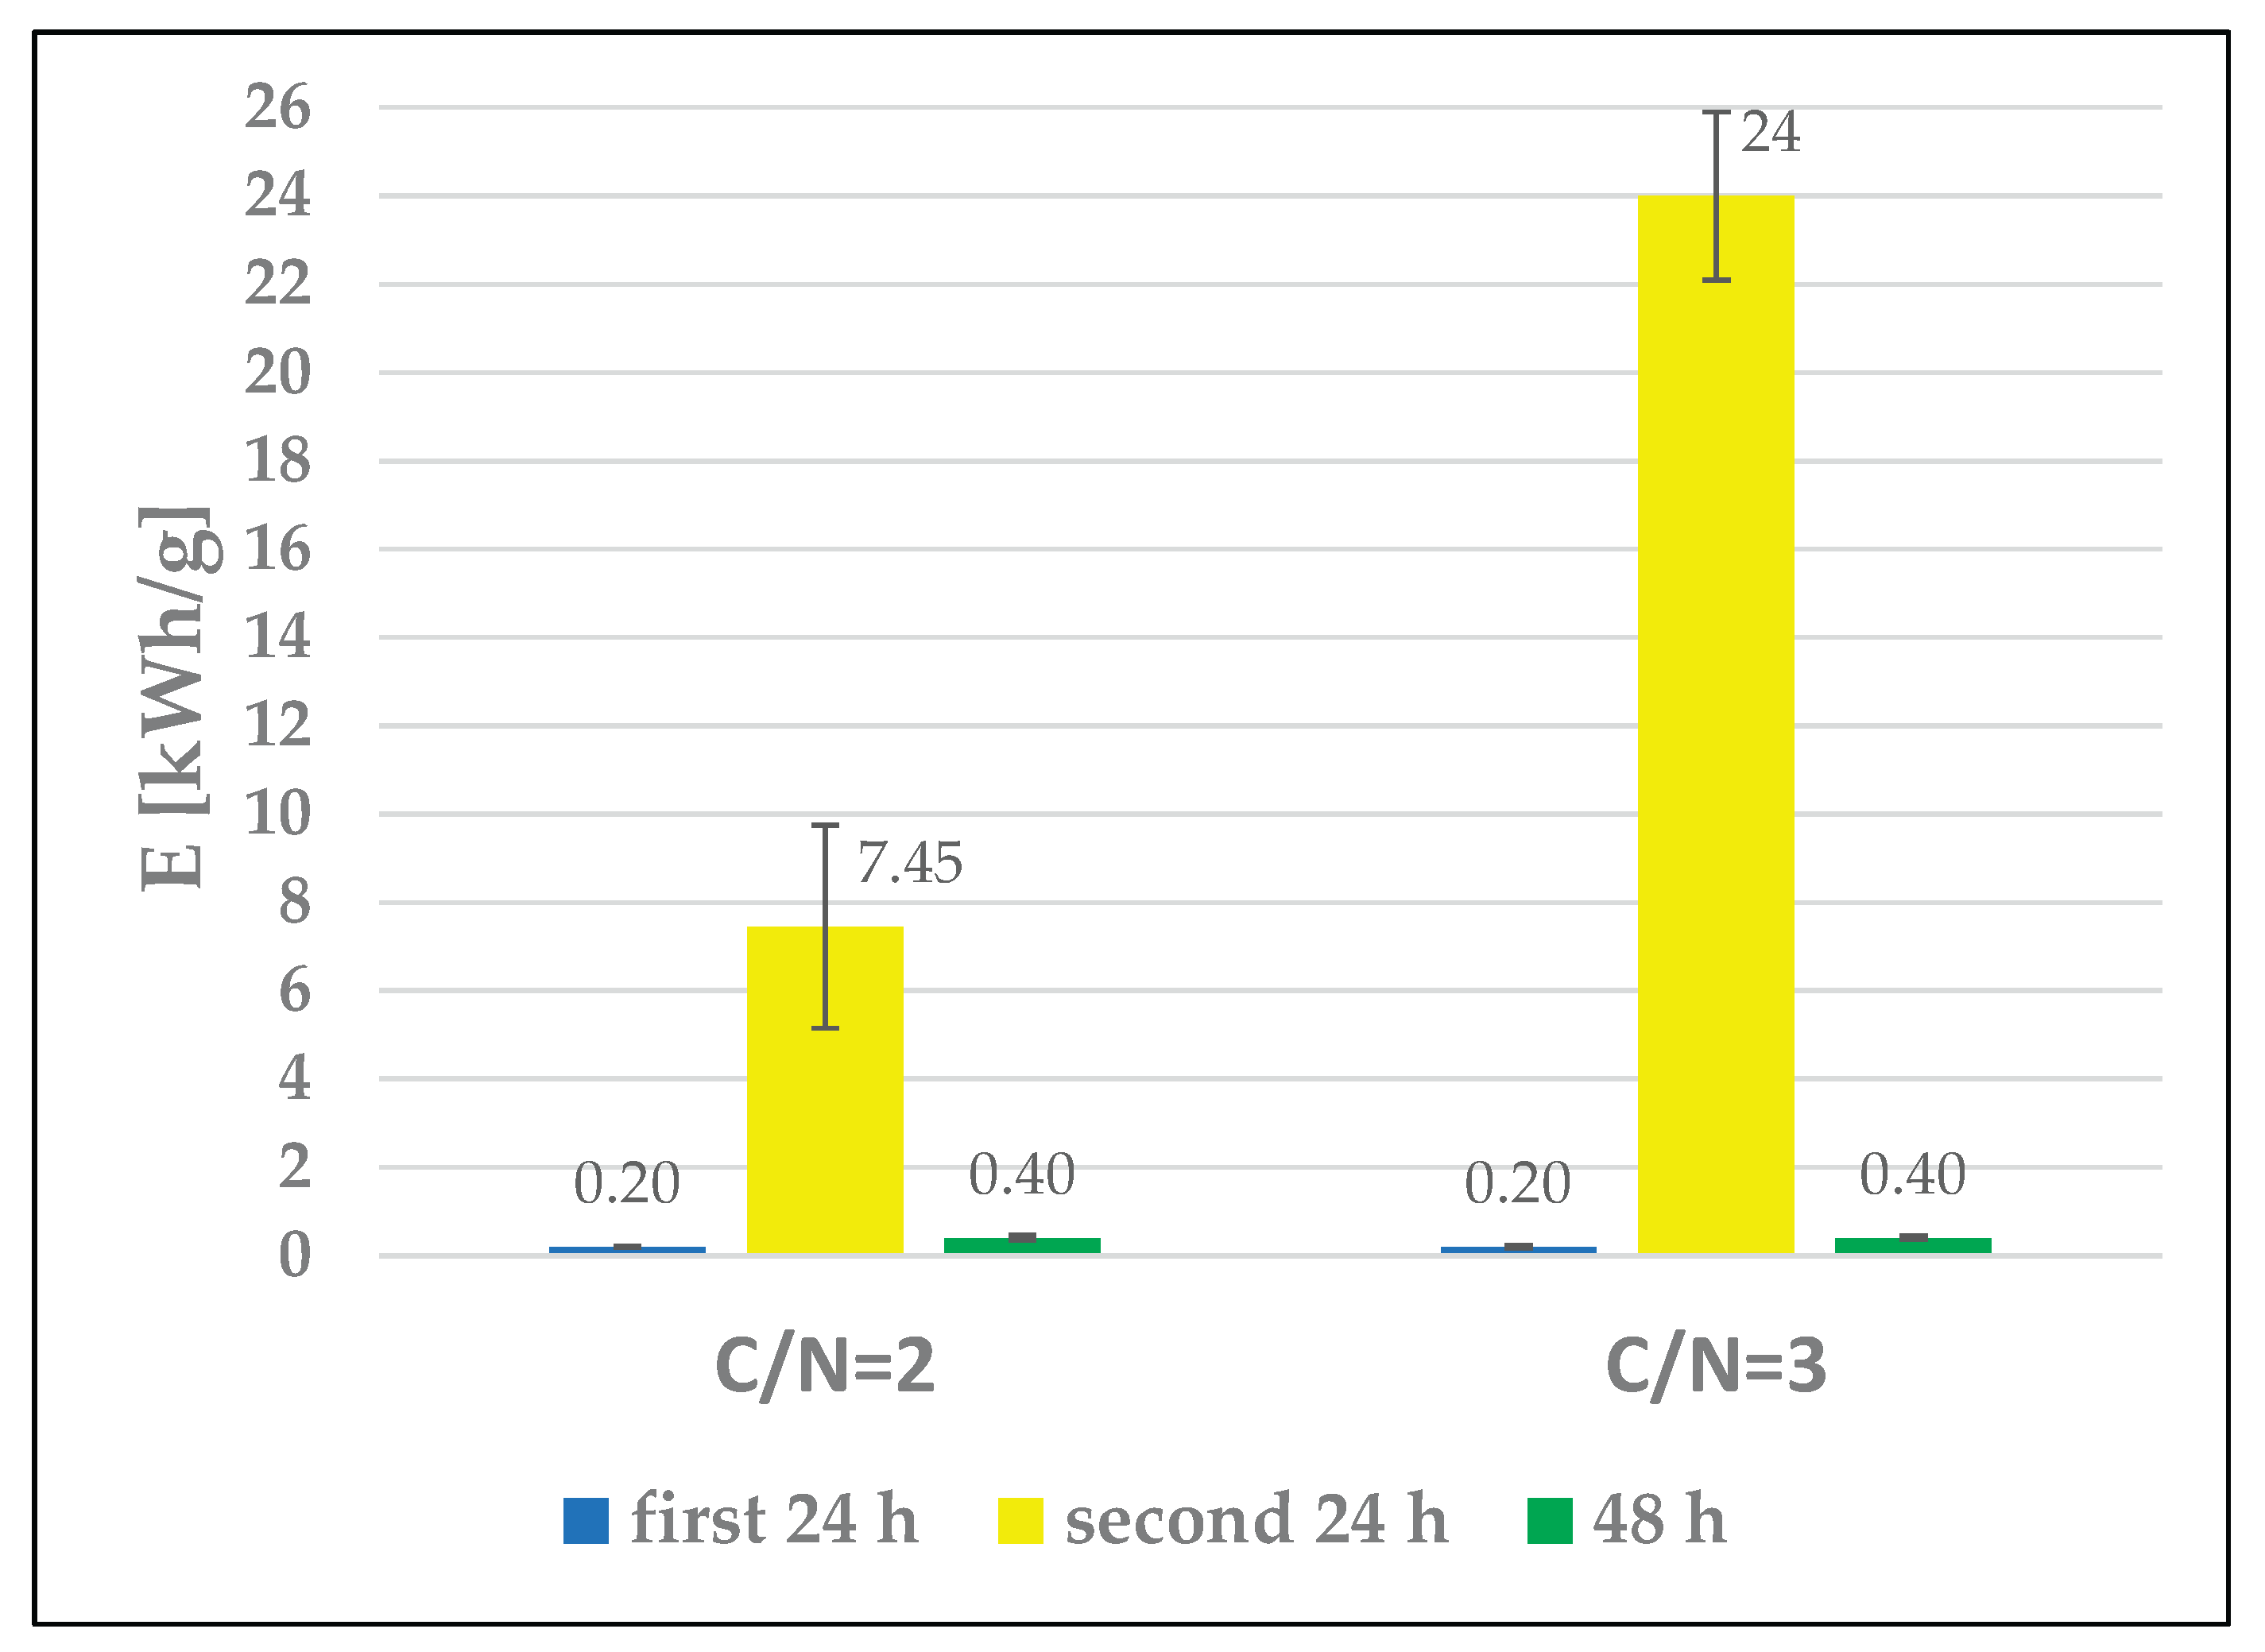
Similar to the CE analysis, energy consumption was evaluated for reactors operating at HRT values of 24 h, 48 h, and during the “second retention interval” (hours 25–48 in the reactor operated at HRT = 48 h). The amount of external carbon supplied to the REBDC (i.e., the C/N ratio) did not influence the electric energy consumption per unit of phosphorus removed (Figure 14). For both C/N = 2.0 and C/N = 3.0, energy consumption at HRT = 24 h was 0.20 kWh/g P, increasing to 0.40 kWh/g P at HRT = 48 h. Thus, doubling the hydraulic retention time resulted in a twofold increase in energy demand per gram of phosphorus removed.
During the second 24-hour period of the 48-hour cycle, energy consumption increased significantly, reaching 7.45 kWh/g P at C/N = 2.0 and 24.0 kWh/g P at C/N = 3.0. The higher value is comparable with results published in a related study [38], where E reached 2360 kWh/kg P under similar operational conditions (HRT = 24 h and current density of 2.50 A/m²).
These findings indicate that most phosphorus removal driven by electrochemical reactions occur within the first 24 hours. Between hours 25 and 48, only marginal improvements in effluent phosphorus concentration were observed—from 0.45 to 0.16 mg P/L at C/N = 2.0 and from 0.31 to 0.13 mg P/L at C/N = 3.0—while the associated energy cost increased disproportionately. This suggests that similar levels of phosphorus removal may be achievable within a shorter operating time than 48 hours.
Rodziewicz [14] reported an energy demand of 2.36 kWh/g P at a current density of 2.50 A/m² and 24 h HRT, which was higher than values obtained in the present study. It should be noted, however, that the referenced study was performed using synthetic wastewater with a C/N ratio of 0.5. Lower organic carbon concentrations are associated with reduced energy consumption for electrochemical oxidation processes [39,40,41].
4. Conclusions
In the biological reactor (RBDC), extending the hydraulic retention time resulted in:
- a slight reduction in phosphorus concentration in the effluent (by 0.25 mg P/L) at C/N = 2.0, and a noticeable deterioration of effluent quality at C/N = 3.0 (increase of 1.38 mg P/L);
- a minor increase in total nitrogen in the effluent (by 6.8%) from 147.8 to 157.7 mg N/L at C/N = 2.0, and a substantial deterioration of effluent quality (276%) from 38.4 to 105.5 mg N/L at C/N = 3.0. Increasing carbon availability significantly improved nitrogen removal efficiency and resulted in a much lower final TN concentration;
- higher nitrate concentrations in the effluent at both C/N ratios, likely due to limited penetration of the organic substrate into deeper biofilm layers, where the final reduction step (NO2⁻ → N2) occurs;
- reduced ammonium nitrogen concentration in the effluent at both C/N ratios;
- increased utilization of the available organic carbon expressed as TOC for both C/N ratios, with near-complete consumption observed at C/N = 2.0.
Overall, the biological reactor demonstrated lower nitrogen and phosphorus removal efficiency than the electro-biological reactor at both C/N ratios and both HRT values.
In the electro-biological reactor (REBDC), extending the hydraulic retention time resulted in:
- a substantial decrease in phosphorus concentration in the effluent for both C/N ratios—more than a 2.8-fold reduction at C/N = 2.0 (down to 0.16 mg P/L) and a 2.38-fold reduction at C/N = 3.0 (to 0.13 mg P/L);
- a significant increase in total nitrogen concentration in the effluent (316.3%) from 32.6 to 103.1 mg N/L at C/N = 2.0, and a moderate deterioration of effluent quality (26.3%) from 27.4 to 34.6 mg N/L at C/N = 3.0;
- increased nitrite concentrations for both C/N ratios, associated with elevated pH caused by denitrification, increased alkalinity, and electrochemical nitrate reduction (where nitrite is an intermediate product);
- a marked (multi-fold) reduction in ammonium nitrogen concentrations in the effluent for both C/N ratios;
- reduced utilization of available organic carbon (lower TOC removal) at both C/N ratios;
- increased energy demand for hydrogenotrophic denitrification (lower current efficiency) and electrochemical phosphorus removal (higher energy consumption).
The electro-biological reactor demonstrated superior nitrogen and phosphorus removal efficiency under all tested conditions. Increasing the carbon dose improved nitrogen removal performance and resulted in substantially lower residual TN in the effluent.
Further research should focus on determining the dose of an external carbon source within a C/N range of 2.0 to 3.0 and the hydraulic retention time within a range of 24 to 48 hours, at which high efficiency of biogenic compound removal coincides with nearly complete utilization of the introduced carbon source and low energy costs.
Author Contributions
Conceptualization, J.R. and W.J.; methodology, K.B. and K.K.; validation, K.K.; formal analysis, J.R. and K.B.; data curation, K.B. and J.R.; writing—original draft preparation, W.J.; writing—review and editing, J.R. and K.K.; supervision, W.J. All authors have read and agreed to the published version of the manuscript.
Funding
This research was funded in the framework of a Project No. 29.610.023-300 of the University of Warmia and Mazury in Olsztyn, Poland.
Data Availability Statement
The data presented in this study are available in the article.
Conflicts of Interest
Author Kamil Bryszewski was employed by the company Hanna Instruments Sp. z.o.o., Al. J. Piłsudskiego St. 73, 10-449 Olsztyn, Poland. The remaining authors declare that the research was conducted in the absence of any commercial or financial relationships that could be construed as a potential conflict of interest.
References
- Han, Y.; Zhao, J.; Liao, Y.; Tian, Y.; Li, W.; Li, A. External carbon sources shape the distinction of advanced nitrogen removal system: Insights into organic matters and microbial characteristics. J. Environ. Chem. Eng. 2025, 13(5), 119001. [Google Scholar] [CrossRef]
- Fu, X.; Hou, R.; Yang, P.; Qian, S.; Feng, Z.; Chen, Z.; Wang, F.; Yuan, R.; Chen, H.; Zhou, B. Application of external carbon source in heterotrophic denitrification of domestic sewage: A review. Sci. Total Environ. 2022, 817, 153061. [Google Scholar] [CrossRef]
- Liu, S.; Hu, D.; Hou, P.; Zhang, G.; Liang, J. Comprehensive review of methods, microbial mechanism, and model evaluation of internal carbon source—biological nitrogen removal. Chem. Eng. J. 2025, 515, 163590. [Google Scholar] [CrossRef]
- Chen, H.; Feng, Z.; Yin, Z.; Wang, J.; Liu, S.; Hou, R. eVOCs absorption liquid enhanced nitrogen removal in A/O reactor treating low C/N wastewater. J. Environ. Chem. Eng. 2025, 13(5), 118863. [Google Scholar] [CrossRef]
- Ortega-Martínez, E.; Toledo-Alarcón, J.; Fernández, E.; Campos, J.L.; Oyarzún, R.; Etchebehere, C.; Cardeña, R.; Cabezas, A.; Koók, L.; Bakonyi, P.; Magdalena, J.A.; Trably, E.; Bernet, N.; Jeison, D. A review of autotrophic denitrification for groundwater remediation: A special focus on bioelectrochemical reactors. J. Environ. Chem. Eng. 2024, 12(1), 111552. [Google Scholar] [CrossRef]
- Chiu, Y.-C.; Chung, M.-S. Determination of Optimal COD/Nitrate Ratio for Biological Denitrification. Int. Biodeter. Biodegr. 2003, 51(1), 43–49. [Google Scholar] [CrossRef]
- Ebrahimzadeh, P.; Navidjouy, N.; Khorsandi, H.; Rahimnejad, M. Application of Bioelectrochemical System in Nitrogen Removal via Simultaneous Autotrophic Nitrification and Denitrification from Wastewater. ChemElectroChem. 2024, 11, e202400432. [Google Scholar] [CrossRef]
- Gaspar, E.; Munteanu, I.; Sintea, S. Removal of N and P in a Rotating Biological Contactor Plant: Case Study Agnita, Romania. Water 2022, 14(22), 3670. [Google Scholar] [CrossRef]
- Rodziewicz, J.; Mielcarek, A.; Bryszewski, K.; Kwietniewski, M.; Janczukowicz, W. Limited Utilization of an External Carbon Source in a Rotating Electro-Biological Disc Contactor (REBDC). Processes 2025, 13, 3115. [Google Scholar] [CrossRef]
- Mielcarek, A.; Rodziewicz, J.; Janczukowicz, W.; Dobrowolski, A. Analysis of wastewater generated in greenhouse soilless tomato cultivation in central Europe. Water 2019, 11, 2538. [Google Scholar] [CrossRef]
- Van Der Salm, C.; Voogt, W.; Beerling, E.; van Ruijven, J.; van Os, E. Minimising emissions to water bodies from NW European greenhouses; with focus on Dutch vegetable cultivation. Agric. Water Manag. 2020, 242, 106398. [Google Scholar] [CrossRef]
- Di Capua, F.; Pirozzi, F.; Lens, P.N.L.; Esposito, G. Electron donors for autotrophic denitrification. Chem. Eng. J. 2019, 362, 922–937. [Google Scholar] [CrossRef]
- Mousset, E.; Trellu, C.; Olvera-Vargas, H.; Pechaud, Y.; Fourcade, F.; Oturan, M.A. Electrochemical technologies coupled with biological treatment. Curr. Opin. Electrochem. 2021, 26, 100668. [Google Scholar] [CrossRef]
- Rodziewicz, J.; Mielcarek, A.; Janczukowicz, W.; Bryszewski, K. Electric power consumption and current efficiency of electrochemical and electrobiological rotating disk contactors removing nutrients from wastewater generated in soil-less plant cultivation systems. Water 2020, 12(1), 213. [Google Scholar] [CrossRef]
- Feng, H.; Huang, B.; Zou, Y.; Li, N.; Wang, M.; Yin, J.; Cong, Y.; Shen, D. The effect of carbon sources on nitrogen removal performance in bioelectrochemical systems. Bioresour. Technol. 2013, 128, 565–570. [Google Scholar] [CrossRef]
- Hooshmandfar, A.; Ayati, B.; Khodadadi Darban, A. Optimization of material and energy consumption for removal of Acid Red 14 by simultaneous electrocoagulation and electroflotation. Water Sci. Technol. 2016, 73, 192–202. [Google Scholar] [CrossRef]
- Huang, W.; Gong, B.; Wang, Y.; Lin, Z.; He, L.; Zhou, J.; He, Q. Metagenomic analysis reveals enhanced nutrients removal from low C/N municipal wastewater in a pilot-scale modified AAO system coupling electrolysis. Water Res. 2020, 173, 115530. [Google Scholar] [CrossRef]
- Zhang, L.; Hao, S.; Wang, Y.; Lan, S.; Dou, Q.; Peng, Y. Rapid start-up strategy of partial denitrification and microbially driven mechanism of nitrite accumulation mediated by dissolved organic matter. Bioresour. Technol. 2021, 340, 125663. [Google Scholar] [CrossRef]
- Rodziewicz, J.; Mielcarek, A.; Janczukowicz, W.; Jóźwiak, T.; Struk–Sokołowska, J.; Bryszewski, K. The share of electro-chemical reduction, hydrogenotrophic and heterotrophic denitrification in nitrogen removal in rotating electrobiological contactor (REBC) treating wastewater from soilless cultivation systems. Sci. Total Environ. 2019, 683, 21–28. [Google Scholar] [CrossRef] [PubMed]
- Chen, Y.Z.; Zhang, L.J.; Ding, L.Y.; Zhang, Y.Y.; Wang, X.S.; Qiao, X.J.; Pan, B.Z.; Wang, Z.W.; Xu, N.; Tao, H.C. Sustainable treatment of nitrate-containing wastewater by an autotrophic hydrogen-oxidizing bacterium. Environ. Sci. Ecotechnol. 2022, 9, 100146. [Google Scholar] [CrossRef]
- Lee, K.C.; Rittmann, B.E. Effects of pH and precipitation on autohydrogenotrophic denitrification using the hollow-fiber membrane-biofilm reactor. Water Res. 2003, 37, 1551–1556. [Google Scholar] [CrossRef]
- Pan, Y.; Liu, Y.; Peng, L.; Ngo, H.H.; Guo, W.; Wei, W.; Wang, D.; Ni, B.-J. Substrate Diffusion within Biofilms Significantly Influencing the Electron Competition during Denitrification. Environ. Sci. Technol. 2019, 53(1), 261–269. [Google Scholar] [CrossRef]
- Rigby, H.; Clarke, B.O.; Pritchard, D.L.; Meehan, B.; Beshah, F.; Smith, S.R.; Porter, N.A. A critical review of nitrogen mineralization in biosolids-amended soil, the associated fertilizer value for crop production and potential for emissions to the environment. Sci. Total Environ. 2016, 541, 1310–1338. [Google Scholar] [CrossRef]
- Młyńska, A.; Chmielowski, K. The changes of nitrogen content during sewage treatment: A study of a two-stages wastewater treatment plant. J. Water. Land. Dev. 2024, 61, 106–114. [Google Scholar] [CrossRef]
- Rodziewicz, J.; Mielcarek, A.; Bryszewski, K.; Janczukowicz, W.; Kłobukowska, K. Energy consumption for nutrient removal from high-nitrate and high-phosphorus wastewater in aerobic and anaerobic bioelectrochemical reactors. Energies 2022, 15, 7251. [Google Scholar] [CrossRef]
- Sandeep, R.; Madsen, J.S.; Marzocchi, U.; Vergeynst, L. Synergizing carbon and phosphorus recovery from wastewater: Integrating biofilm-based phosphorus removal in high-rate activated sludge. Water Res. 2025, 280, 123546. [Google Scholar] [CrossRef] [PubMed]
- Corona-Martínez, D.A.; Martínez-Amador, S.Y.; Rodríguez-De la Garza, J.A.; Laredo-Alcalá, E.I.; Pérez-Rodríguez, P. Recent advances in scaling up bioelectrochemical systems: challenges and perspectives. BioTech 2025, 14(1), 8. [Google Scholar] [CrossRef] [PubMed]
- Ndayisenga, F.; Yu, Z.; Wang, B.; Zhou, D. Effects of the applied voltage on electroactive microbial biofilm viability and hydrogen production in a recalcitrant organic waste-fed single-chamber membrane-free microbial electrolysis cell performance. Chem. Eng. J. 2023, 469, 1444002. [Google Scholar] [CrossRef]
- Sikarwar, D.; Bashir, Y.; Sharma, N.; Rasheed, A.; Das, S. Critical perspective on the elimination of emerging contaminants from industrial wastewater via microbial electrochemical technologies. Clean-Soil Air Water 2024, 2300346. [Google Scholar] [CrossRef]
- Sun, J; Zhang, L.; Loh, K.C. Review and perspectives of enhanced volatile fatty acids production from acidogenic fermentation of lignocellulosic biomass wastes. Bioresour. Bioprocess. 2021, 8, 68. [Google Scholar] [CrossRef] [PubMed]
- Liu, C.; Yin, Y.; Chen, C.; Zhang, X.; Zhou, J.; Zhang, Q.; Chen, Y. Advances in Electricity-Steering Organic Waste Bio-Valorization for Medium Chain Carboxylic Acids Production. Energies 2023, 16, 2571. [Google Scholar] [CrossRef]
- Cheng, H.; Ma, S.; Liao, K.; Wang, J.; Wu, B.; Hu, H.; Ren, H. Effect of external carbon source type on effluent dissolved organic nitrogen characteristics in post-denitrifying moving bed biofilm reactors: chemical, molecular and microbial insights. Chem. Eng. J. 2023, 466, 143338. [Google Scholar] [CrossRef]
- Mohamed, A.A.R.; El-Dissouky, A.; El-Din Hassouna, M.S.; Elhusseiny, A.F.; He, Z.; Moustafa, H. Efficacy of bioelectrochemical and electrochemical systems in ammonia recovery from slaughterhouse wastewater. Appl. Water Sci. 2025, 15, 28. [Google Scholar] [CrossRef]
- Feng, H.; Huang, B.; Zou, Y.; Li, N.; Wang, M.; Yin, J.; Cong, Y.; Shen, D. The effect of carbon sources on nitrogen removal performance in bioelectrochemical systems. Bioresour. Technol. 2013, 128, 565–570. [Google Scholar] [CrossRef]
- Wan, D.; Liu, H.; Liu, R.; Qu, J. Study of a combined sulfur autotrophic with proton-exchange membrane electrodialytic denitrification technology: Sulfate control and pH balance. Bioresour. Technol. 2011, 102, 10803–10809. [Google Scholar] [CrossRef]
- Wan, D.; Li, Q.; Chen, J.; Niu, Z.; Liu, Y.; Li, H.; Xiao, S. Simultaneous bio-electrochemical reduction of perchlorate and electro-disinfection in a novel Moving-Bed Biofilm Reactor (MBBR) based on proton-exchange membrane electrolysis. Sci. Total. Environ. 2019, 679, 288–297. [Google Scholar] [CrossRef]
- Wu, Z.-Y.; Xu, J.; Wu, L.; Ni, B.-J. Three-dimensional biofilm electrode reactors (3D-BERs) for wastewater treatment. Bioresour. Technol. 2022, 344, 126274. [Google Scholar] [CrossRef]
- Rodziewicz, J.; Mielcarek, A.; Bryszewski, K.; Janczukowicz, W.; Kłobukowska, K. Energy consumption for nutrient removal from high-nitrate and high-phosphorus wastewater in aerobic and anaerobic bioelectrochemical reactors. Energies 2022, 15, 7251. [Google Scholar] [CrossRef]
- Najafinejad, M.S.; Chianese, S.; Fenti, A.; Iovino, P.; Musmarra, D. Application of Electrochemical Oxidation for Water and Wastewater Treatment: An Overview. Molecules 2023, 28, 4208. [Google Scholar] [CrossRef]
- Yao, J.; Mei, Y.; Jiang, J.; Xia, G.; Chen, J. Process Optimization of Electrochemical Treatment of COD and Total Nitrogen Containing Wastewater. Int. J. Environ. Res. Public Health 2022, 19, 850. [Google Scholar] [CrossRef] [PubMed]
- Hu, M.; Luo, T.; Li, Q.; Xie, Y.; Liu, G.; Wang, L.; Peijnenburg, W.J.G.M. Remediation of low C/N wastewater by iron–carbon micro-electrolysis coupled with biological denitrification: Performance, mechanisms, and application. J. Water Process Eng. 2022, 48, 102899. [Google Scholar] [CrossRef]
Figure 1.
Scheme of unit experimental model: 1 – laboratory power supply, 2 – discs (cathode), 3 – anode, 4 – tank, 5 – electric engine.
Figure 1.
Scheme of unit experimental model: 1 – laboratory power supply, 2 – discs (cathode), 3 – anode, 4 – tank, 5 – electric engine.
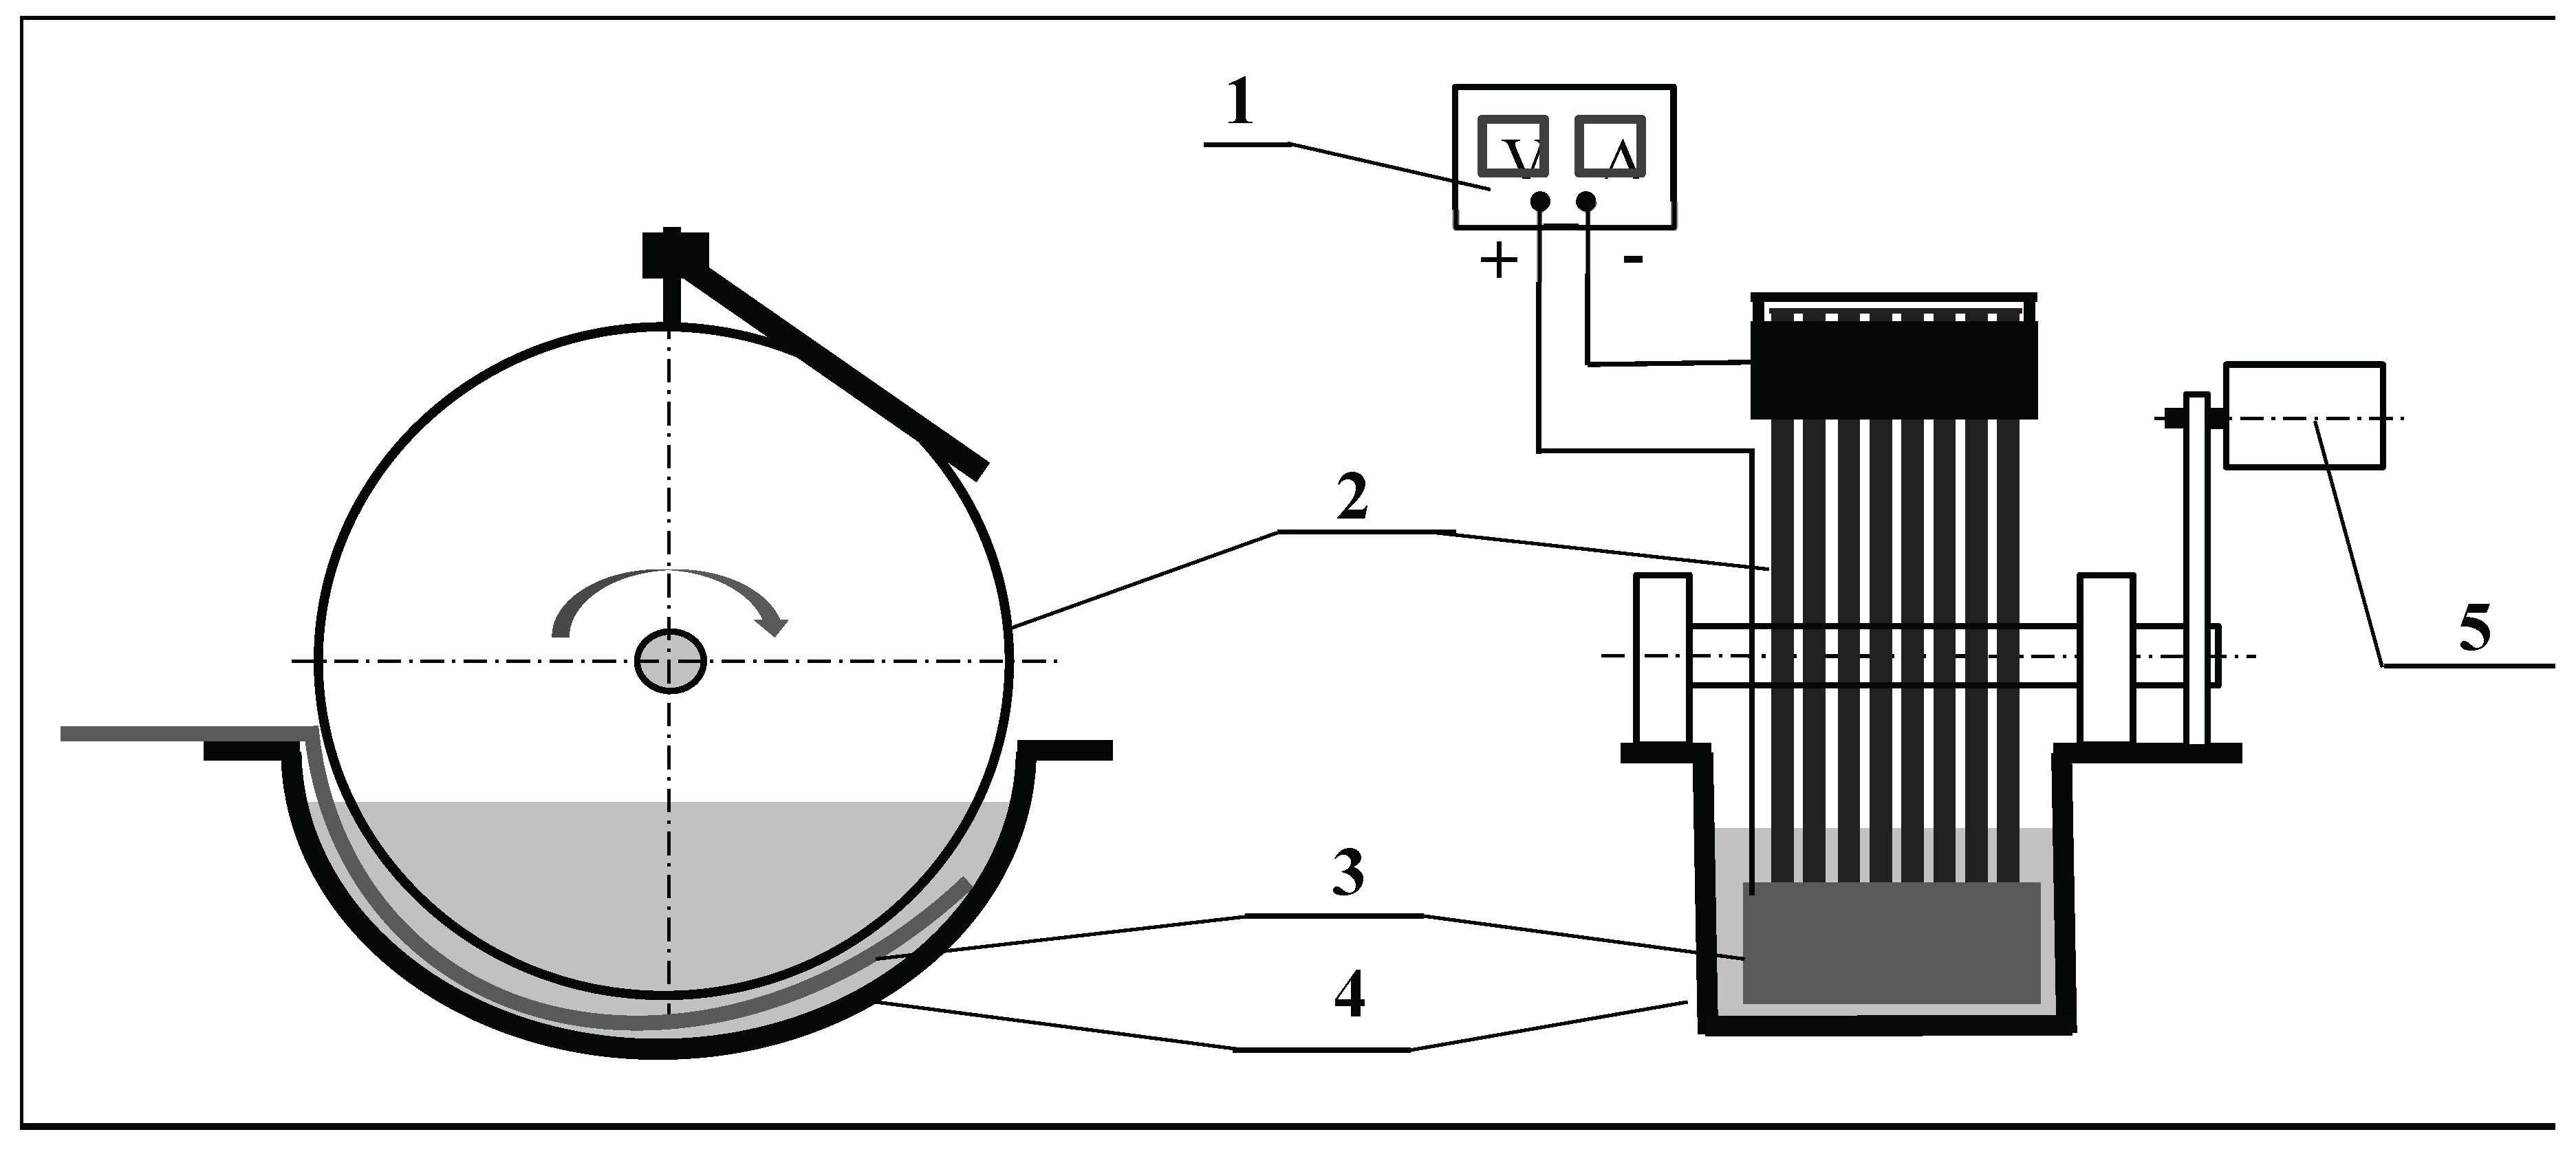
Figure 2.
The research scheme.
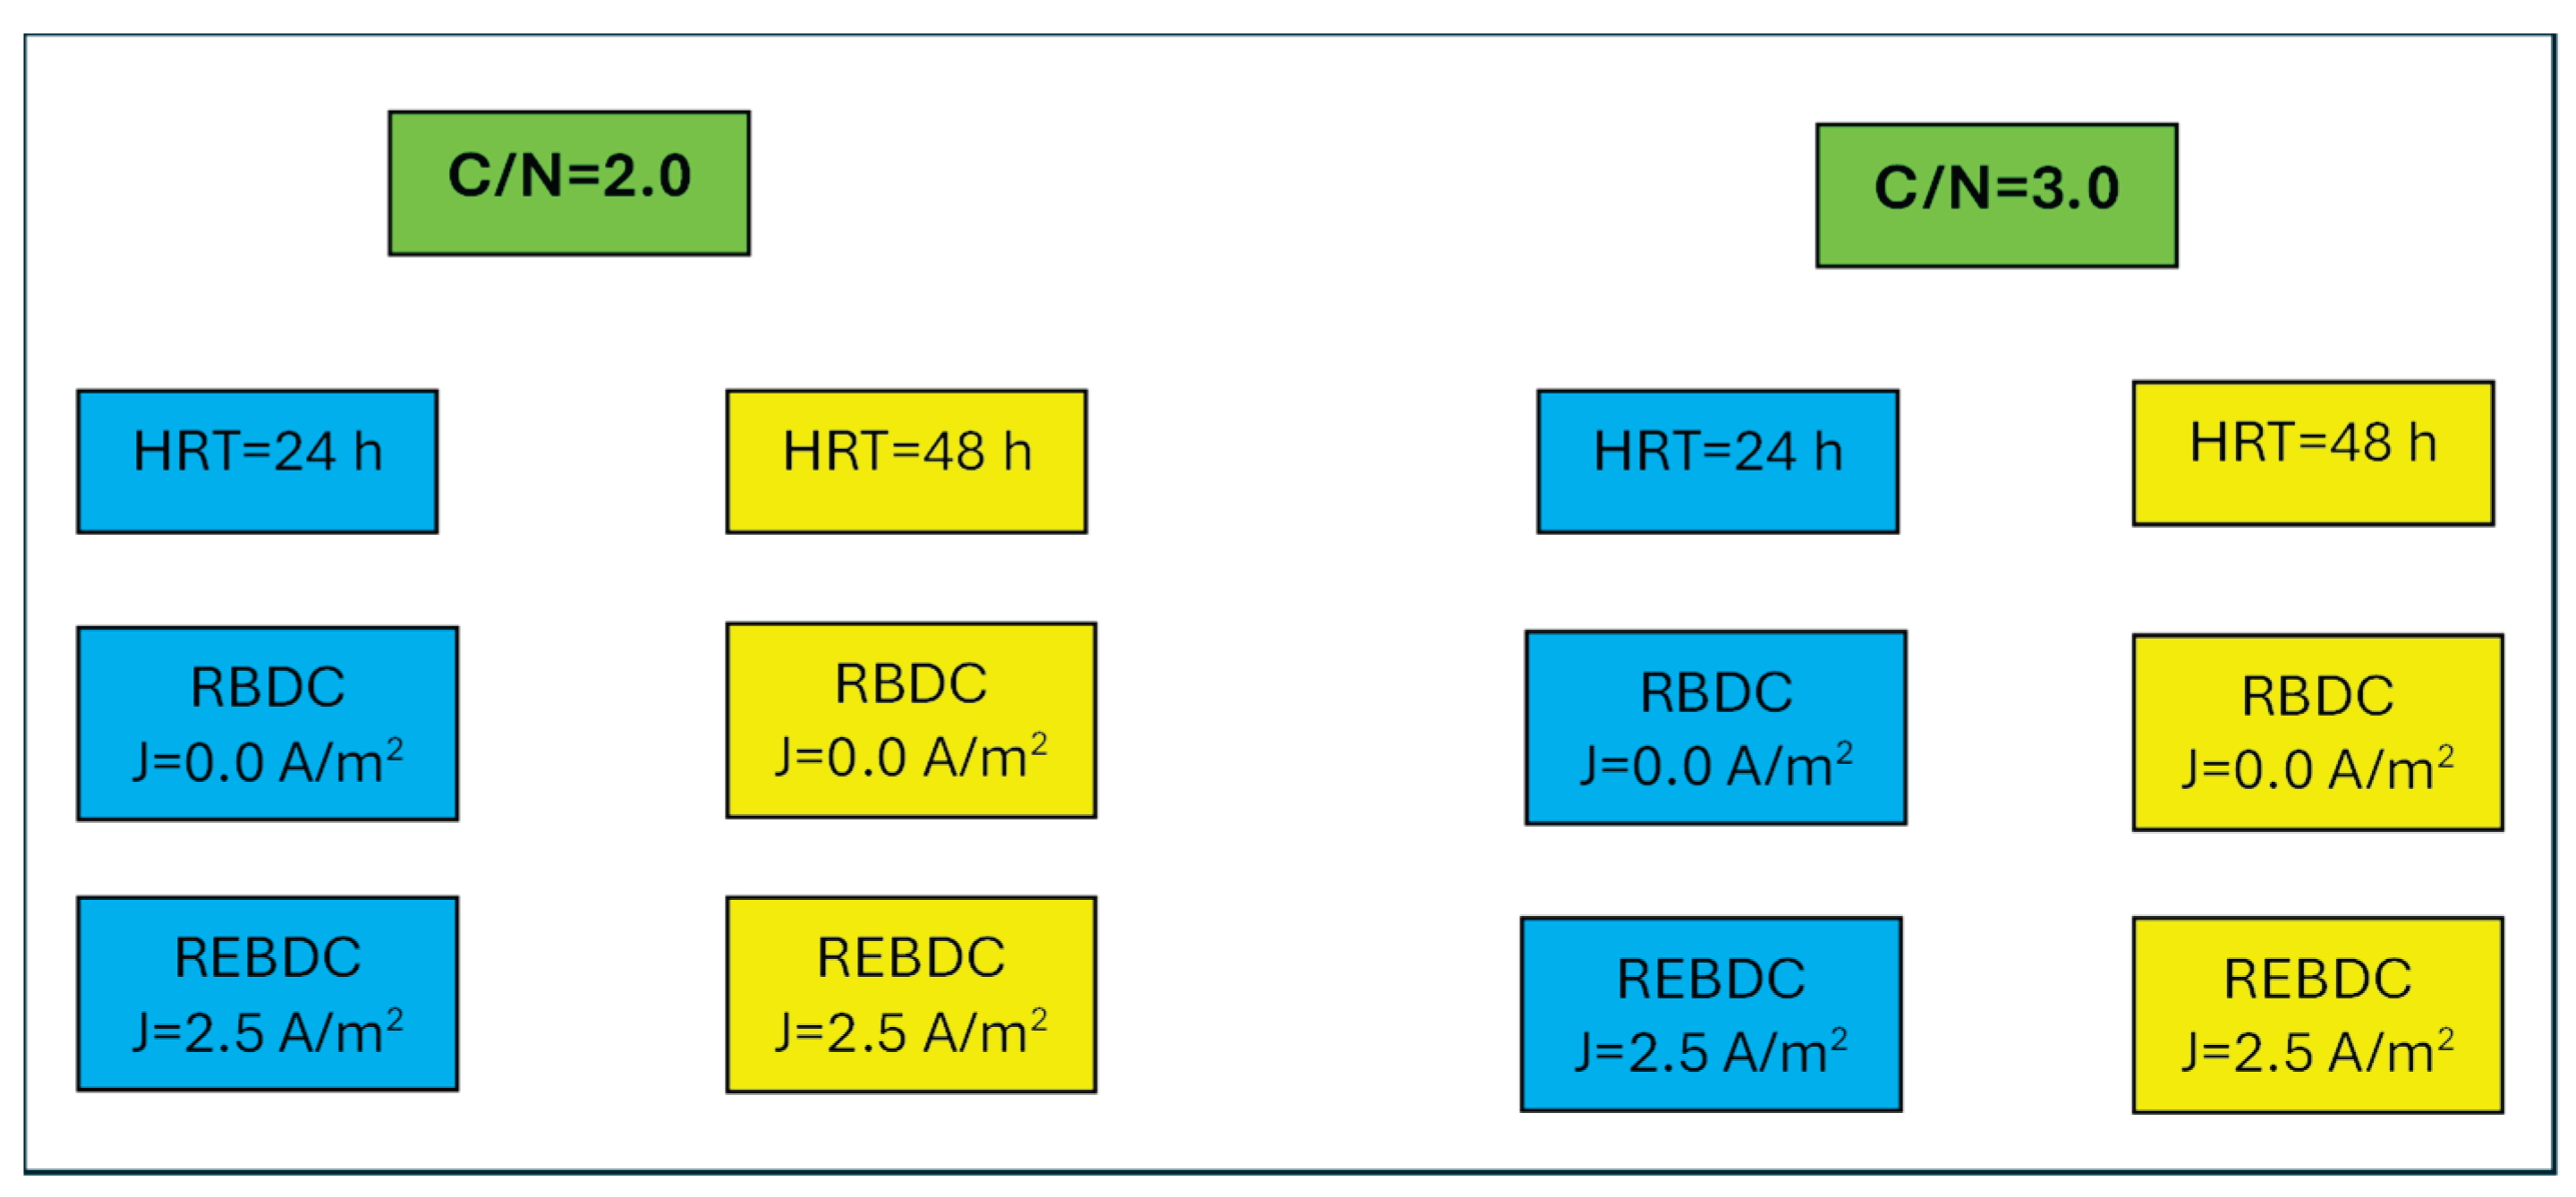
Figure 3.
The effect of the C/N ratio and HRT on effluent pH.
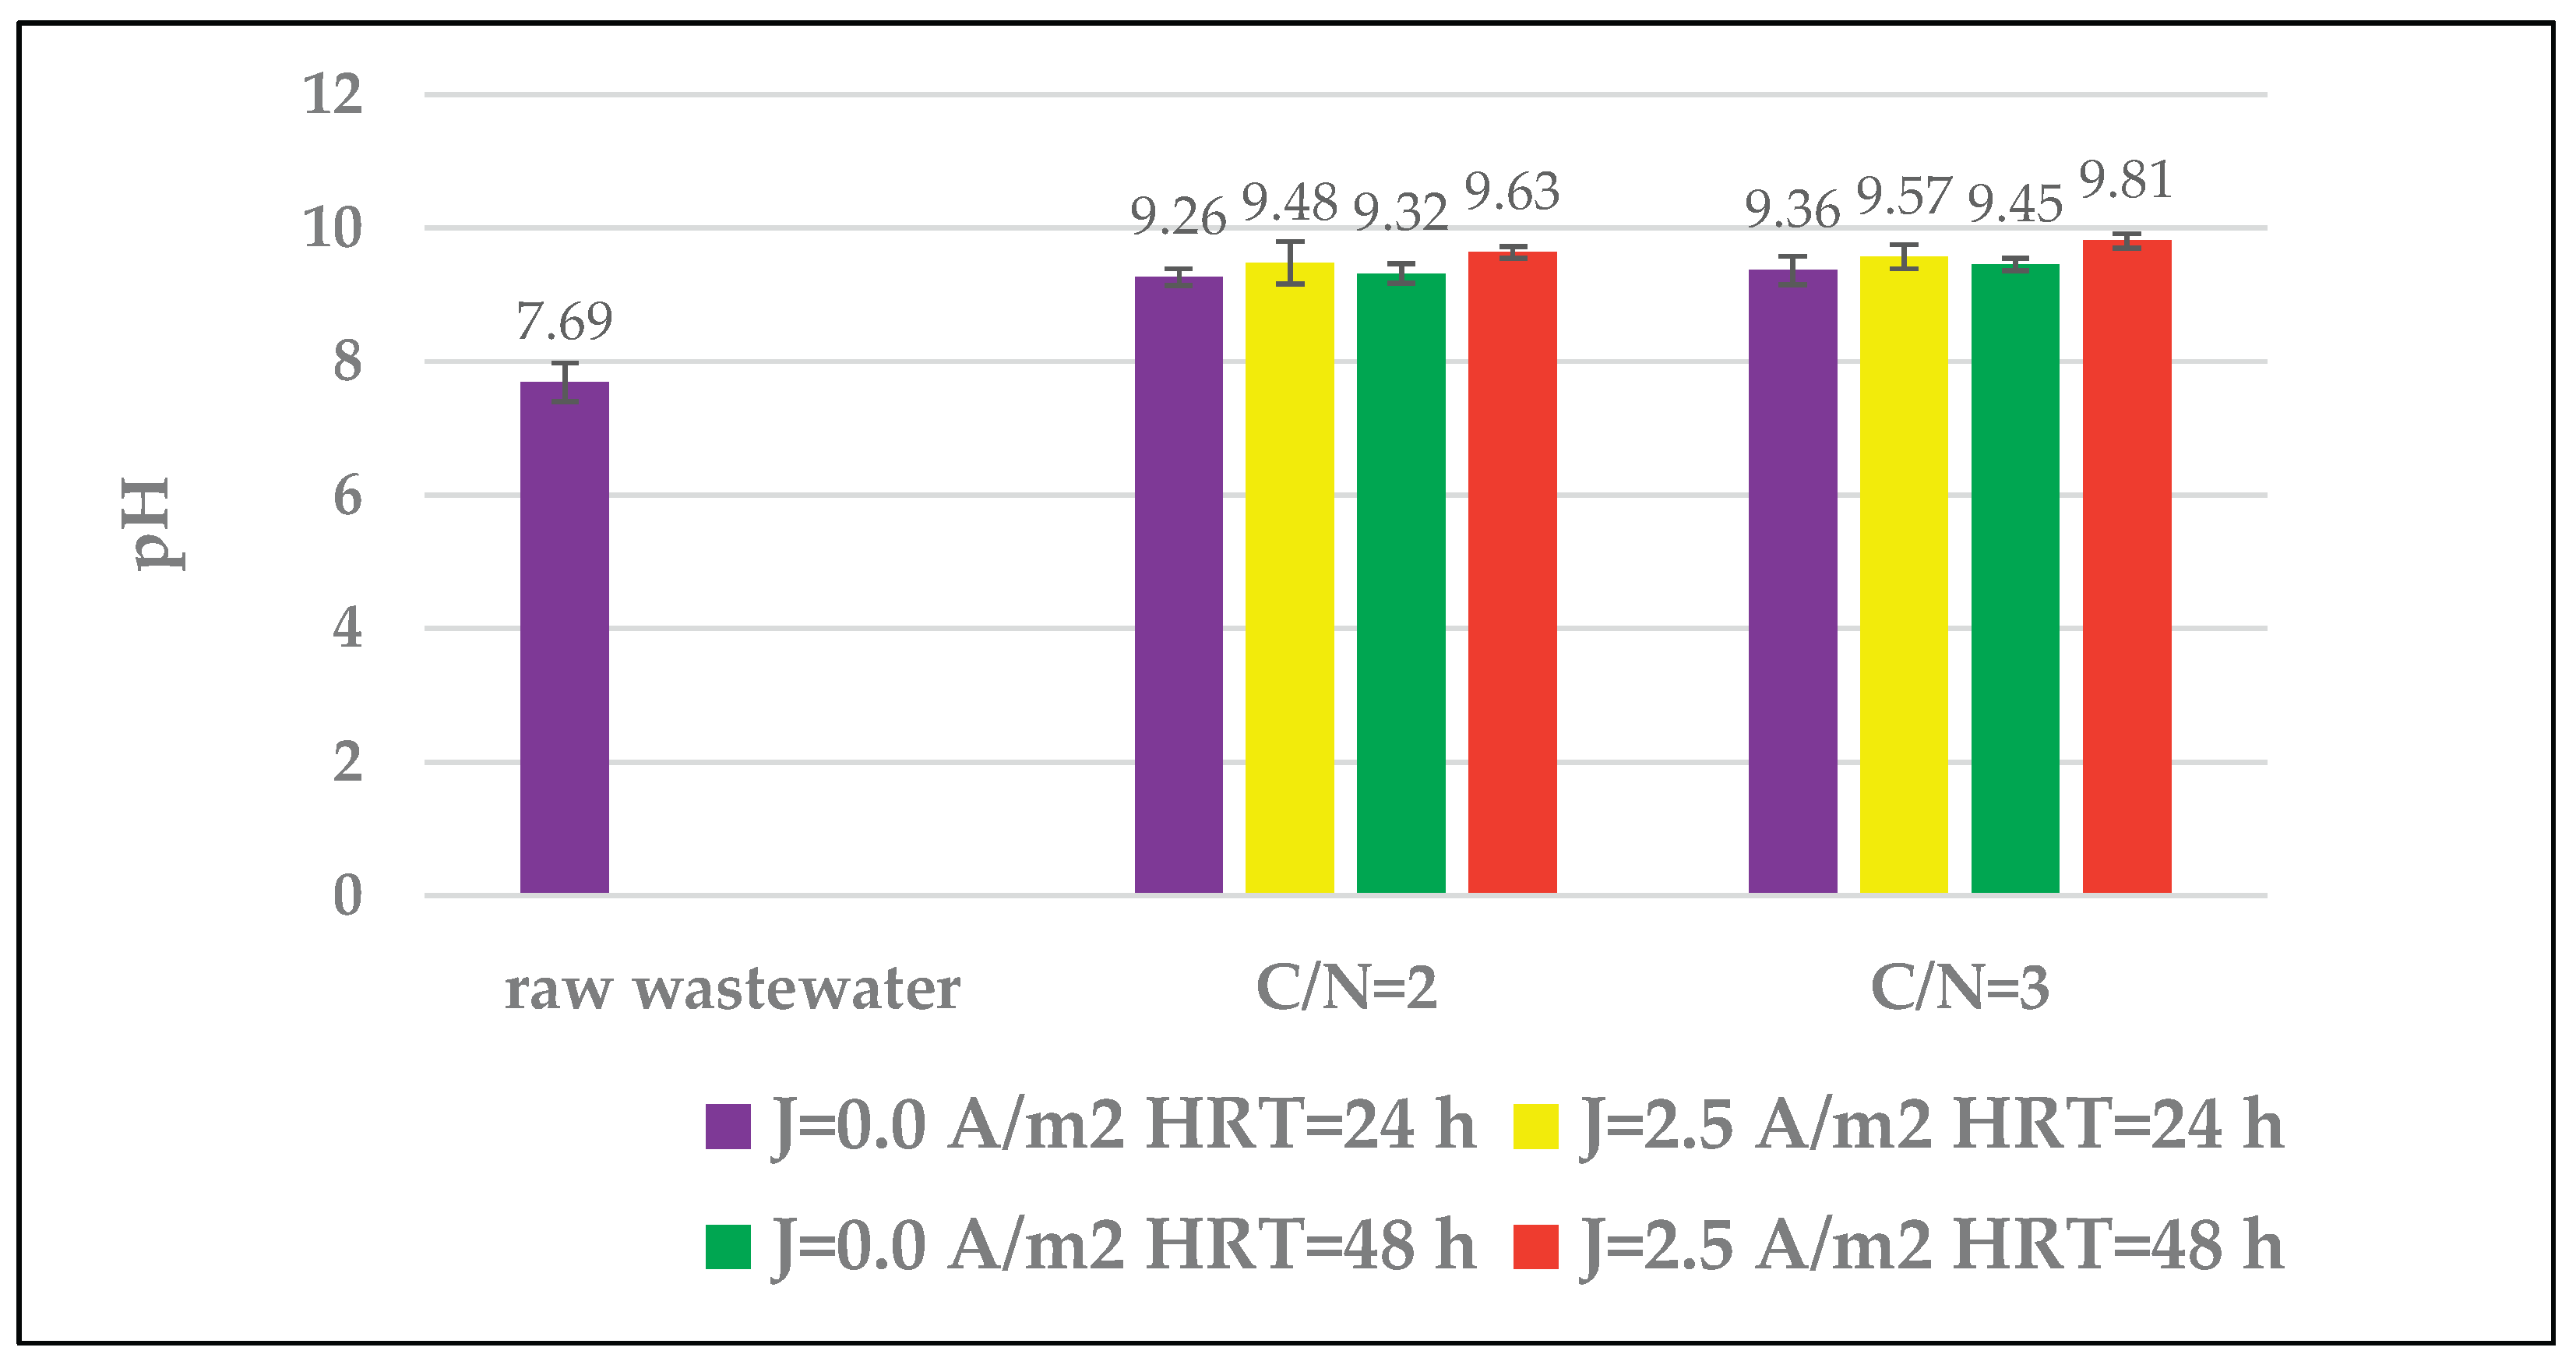
Figure 4.
The effect of the C/N ratio and HRT on the electrical conductivity (EC) of the effluent.
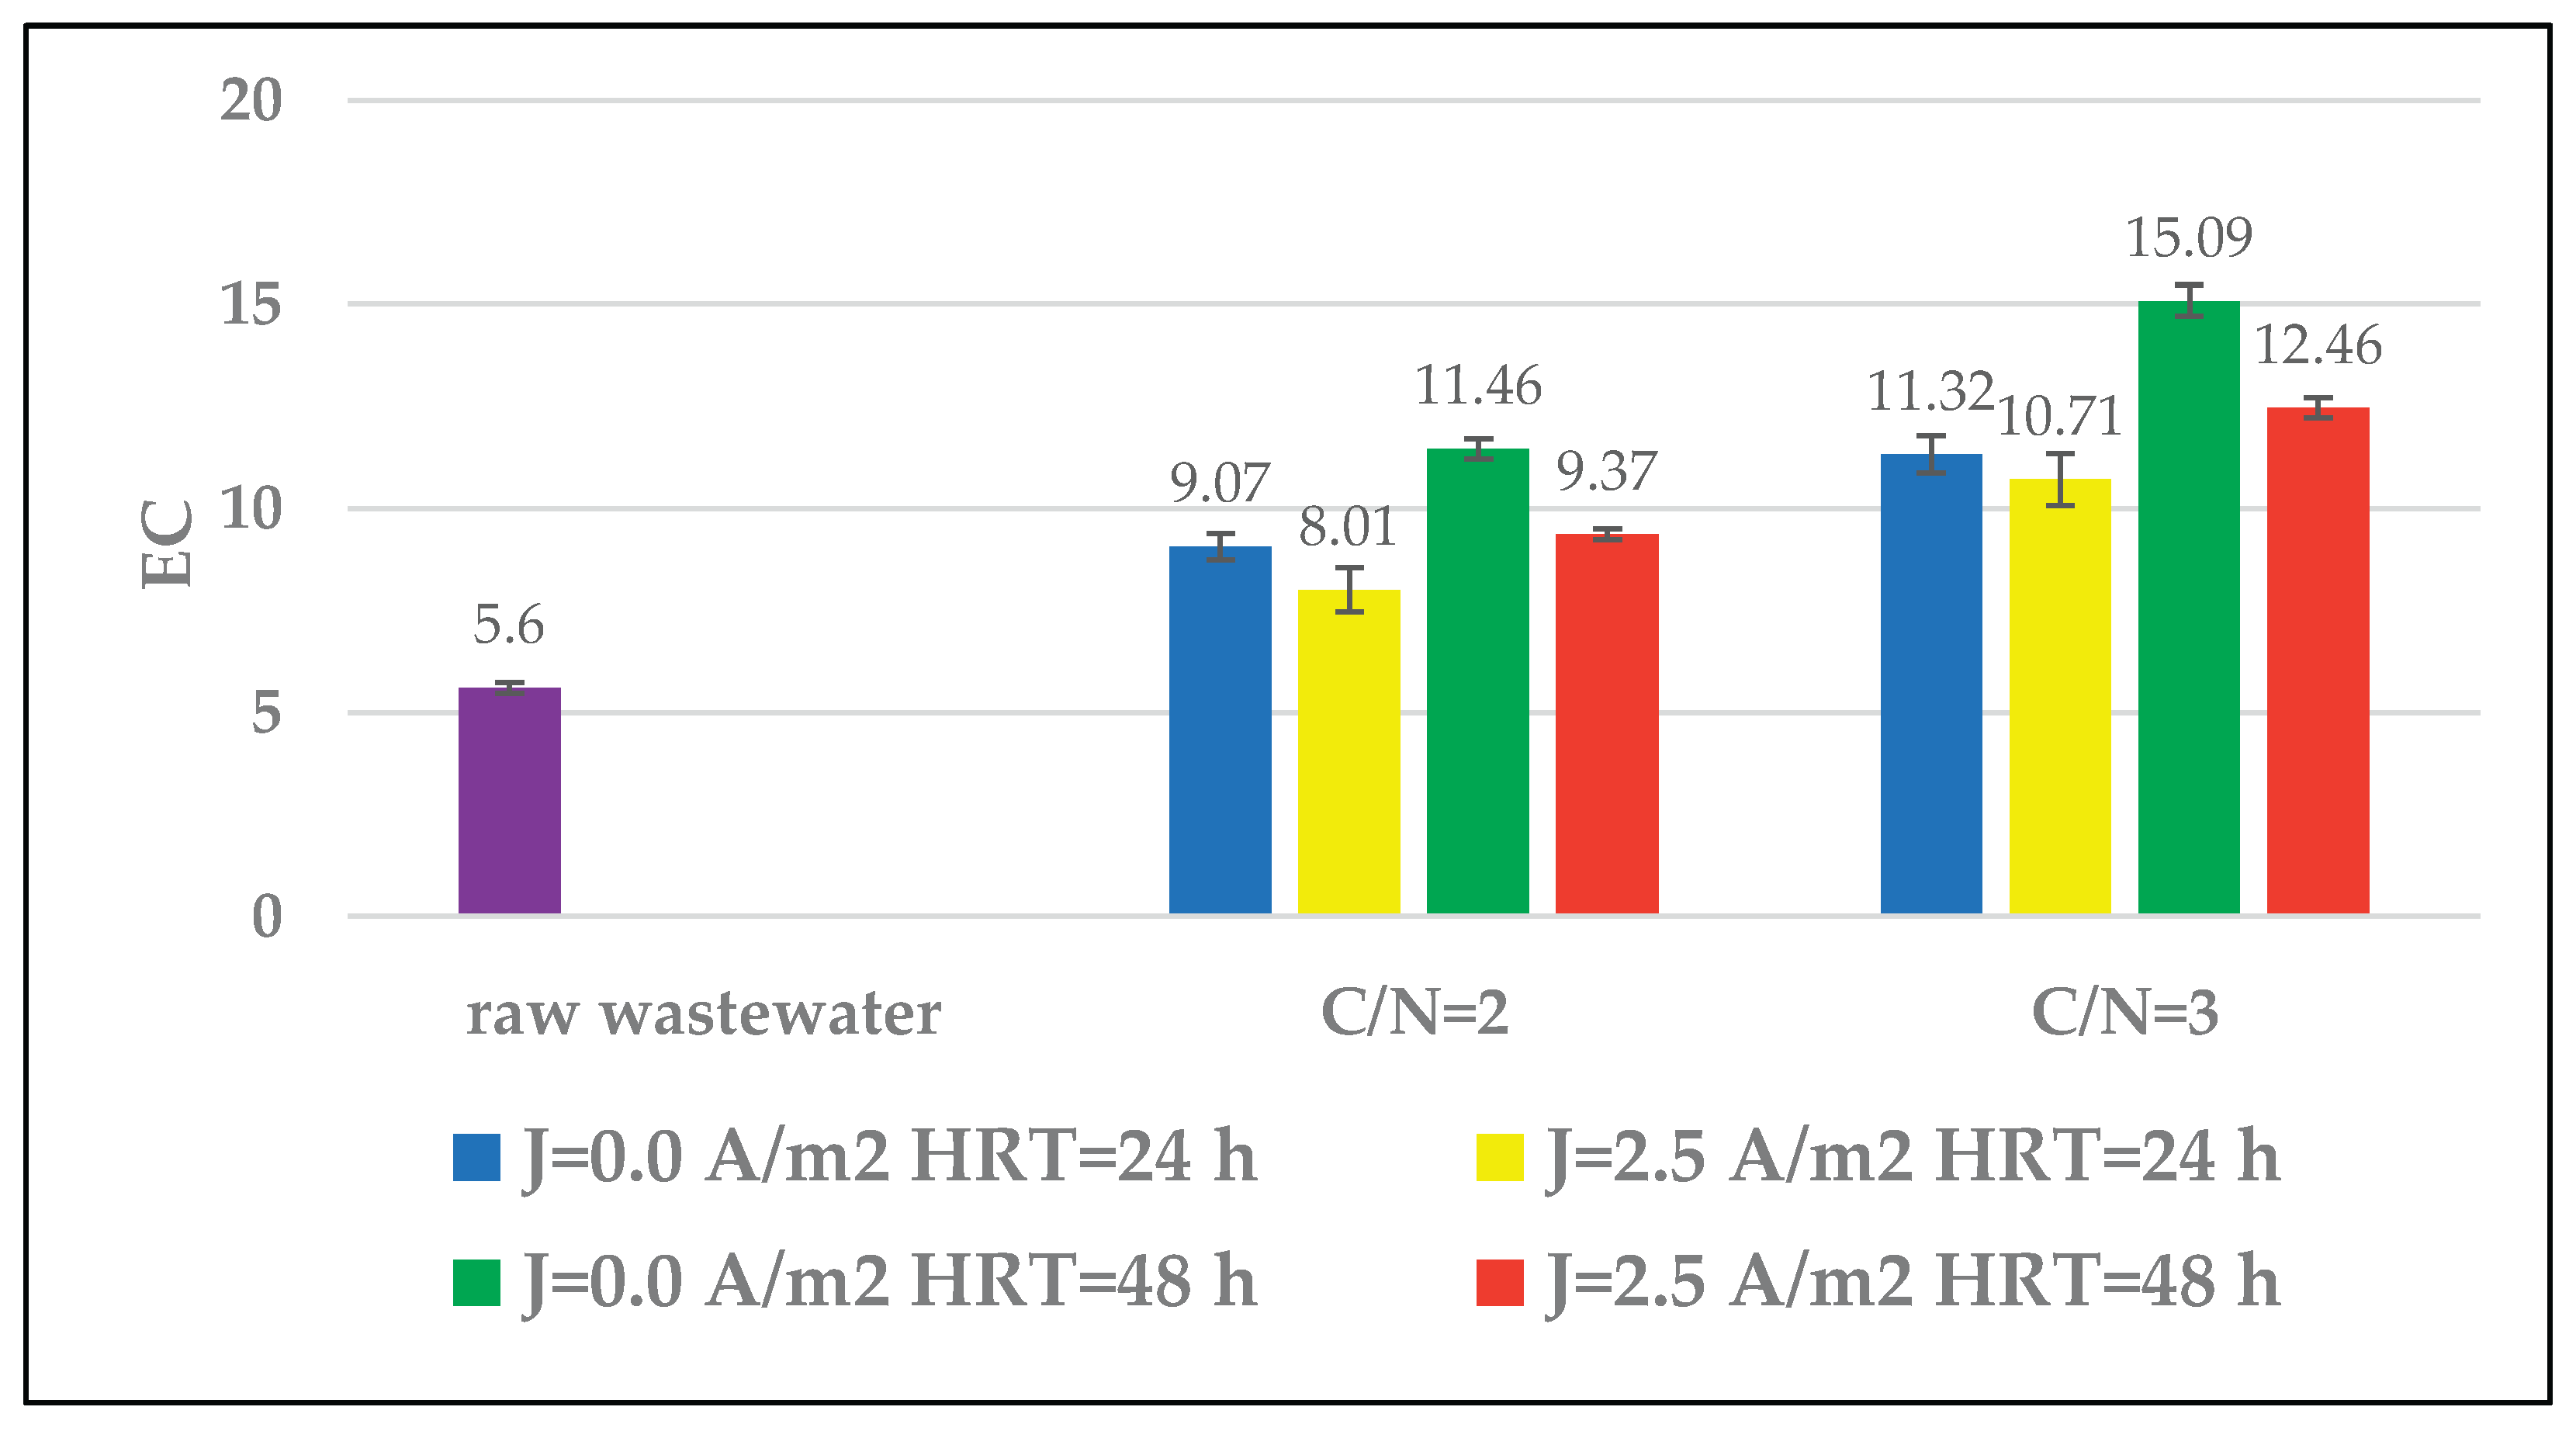
Figure 5.
The effect of the C/N ratio and HRT on the concentration of total nitrogen (TN) in the effluent.
Figure 5.
The effect of the C/N ratio and HRT on the concentration of total nitrogen (TN) in the effluent.
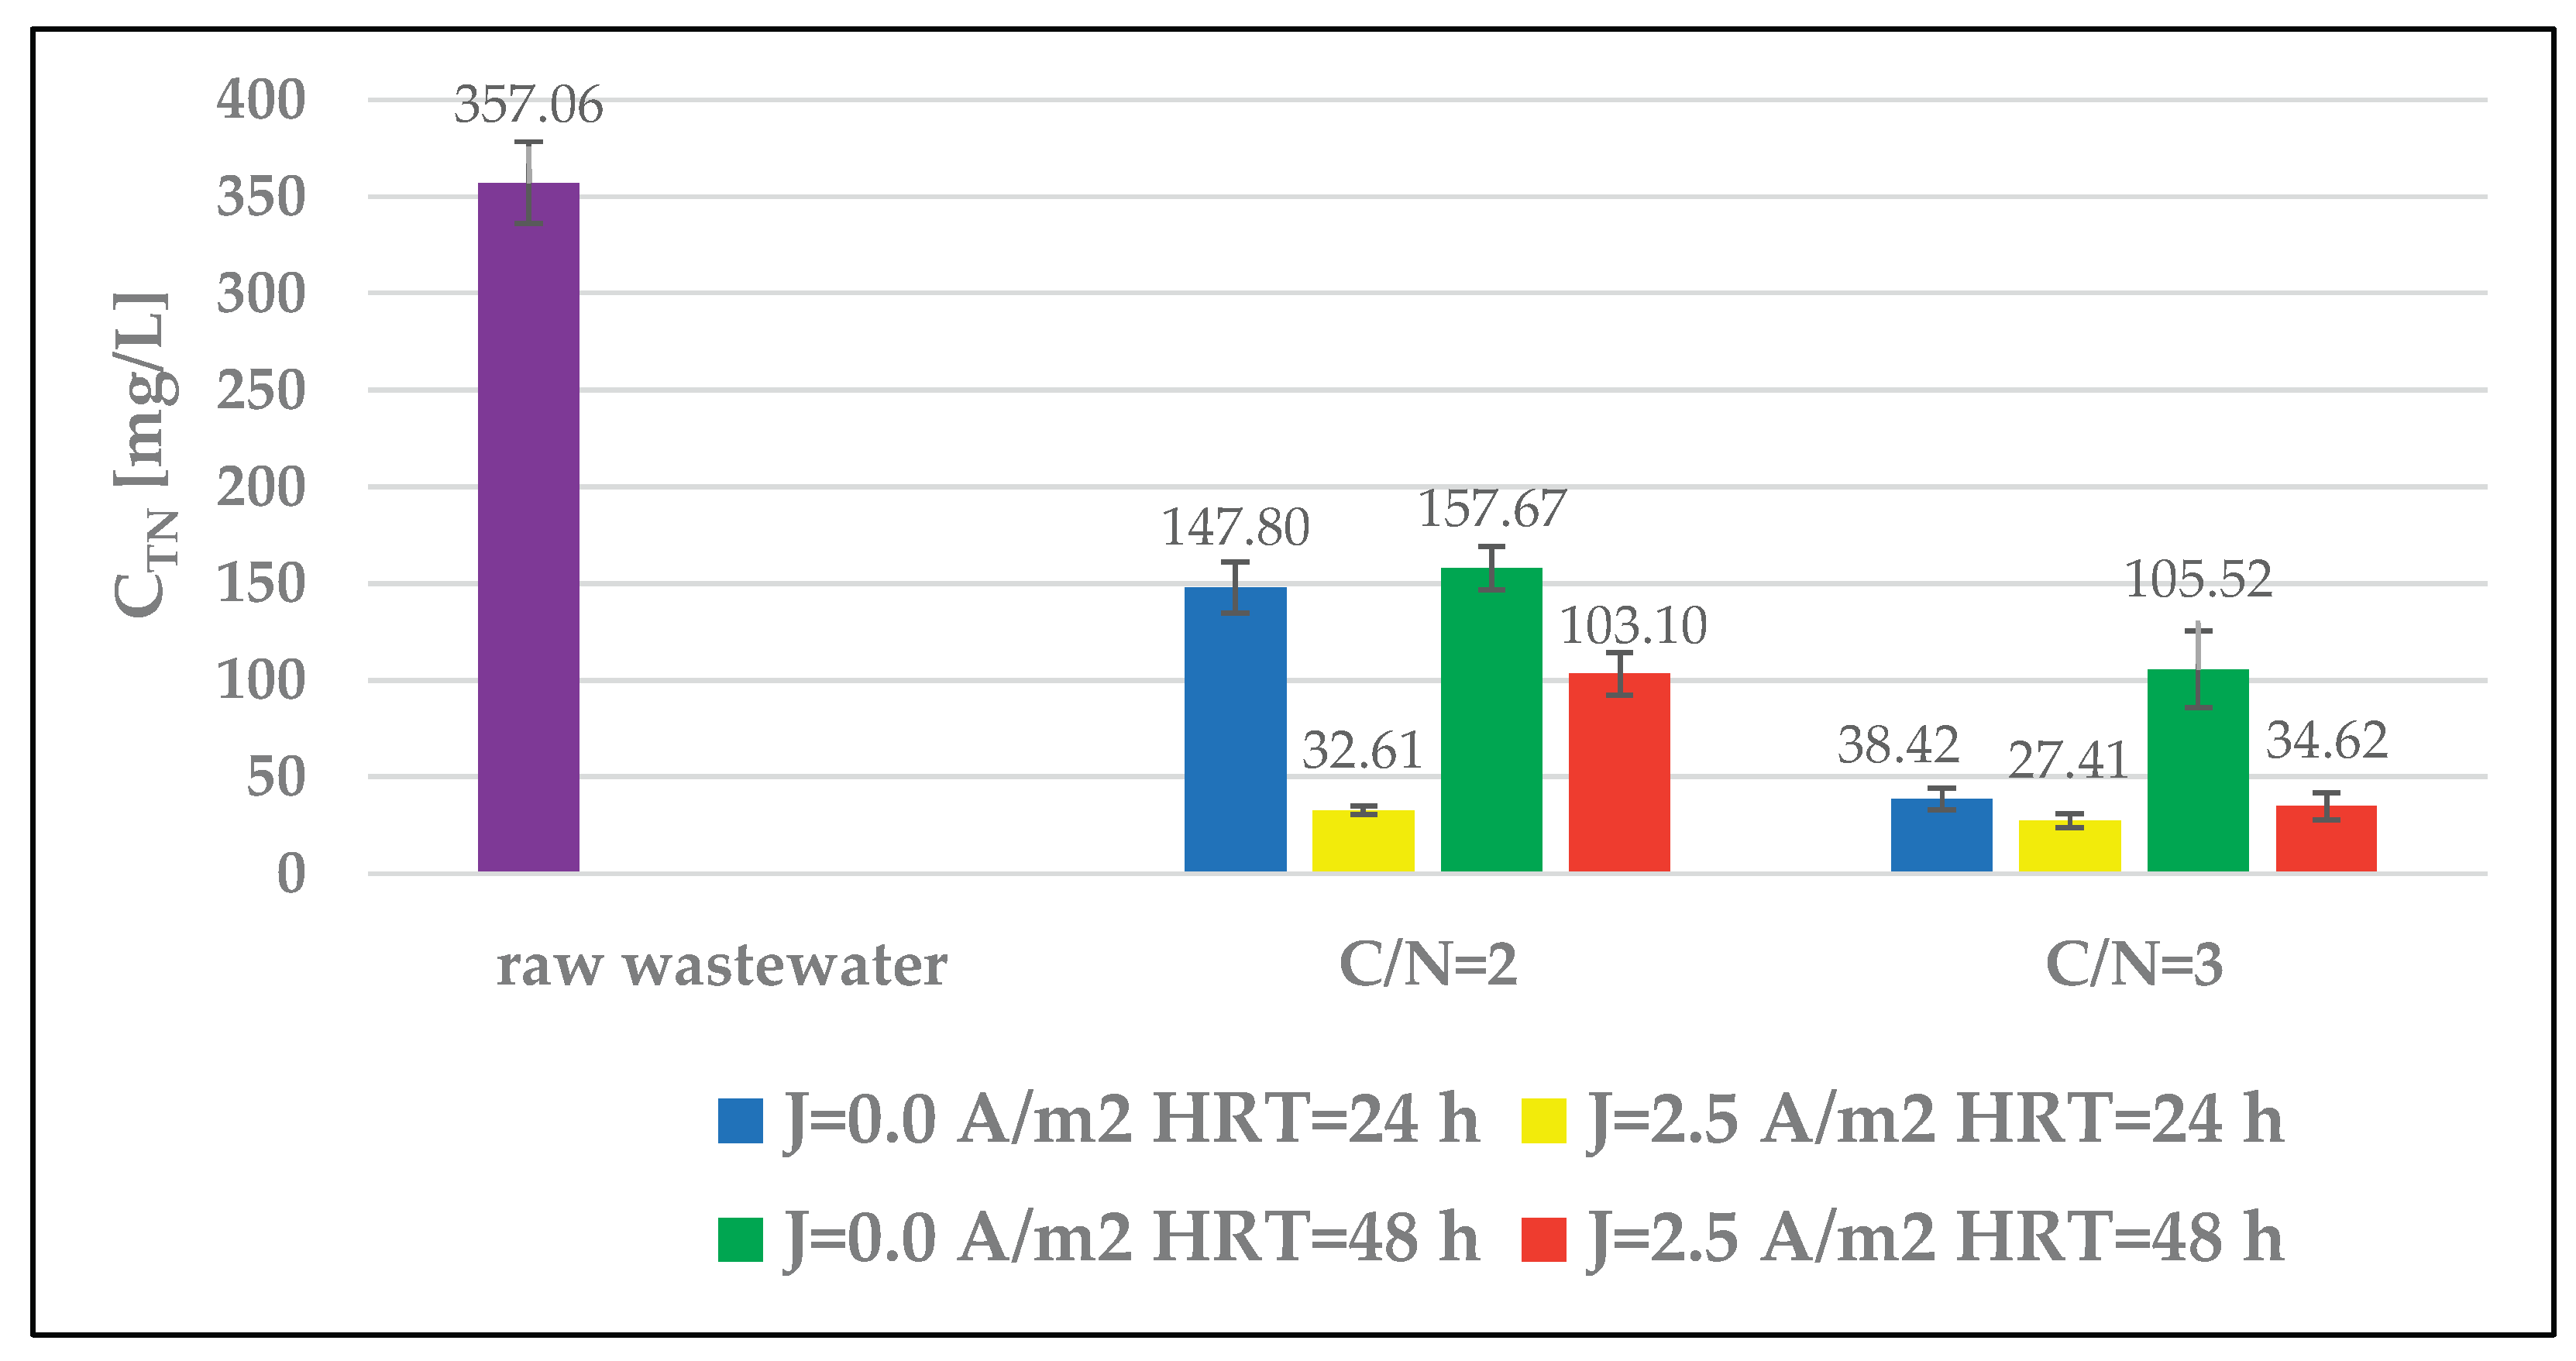
Figure 6.
The effect of the C/N ratio and HRT on the concentration of nitrites in the effluent.
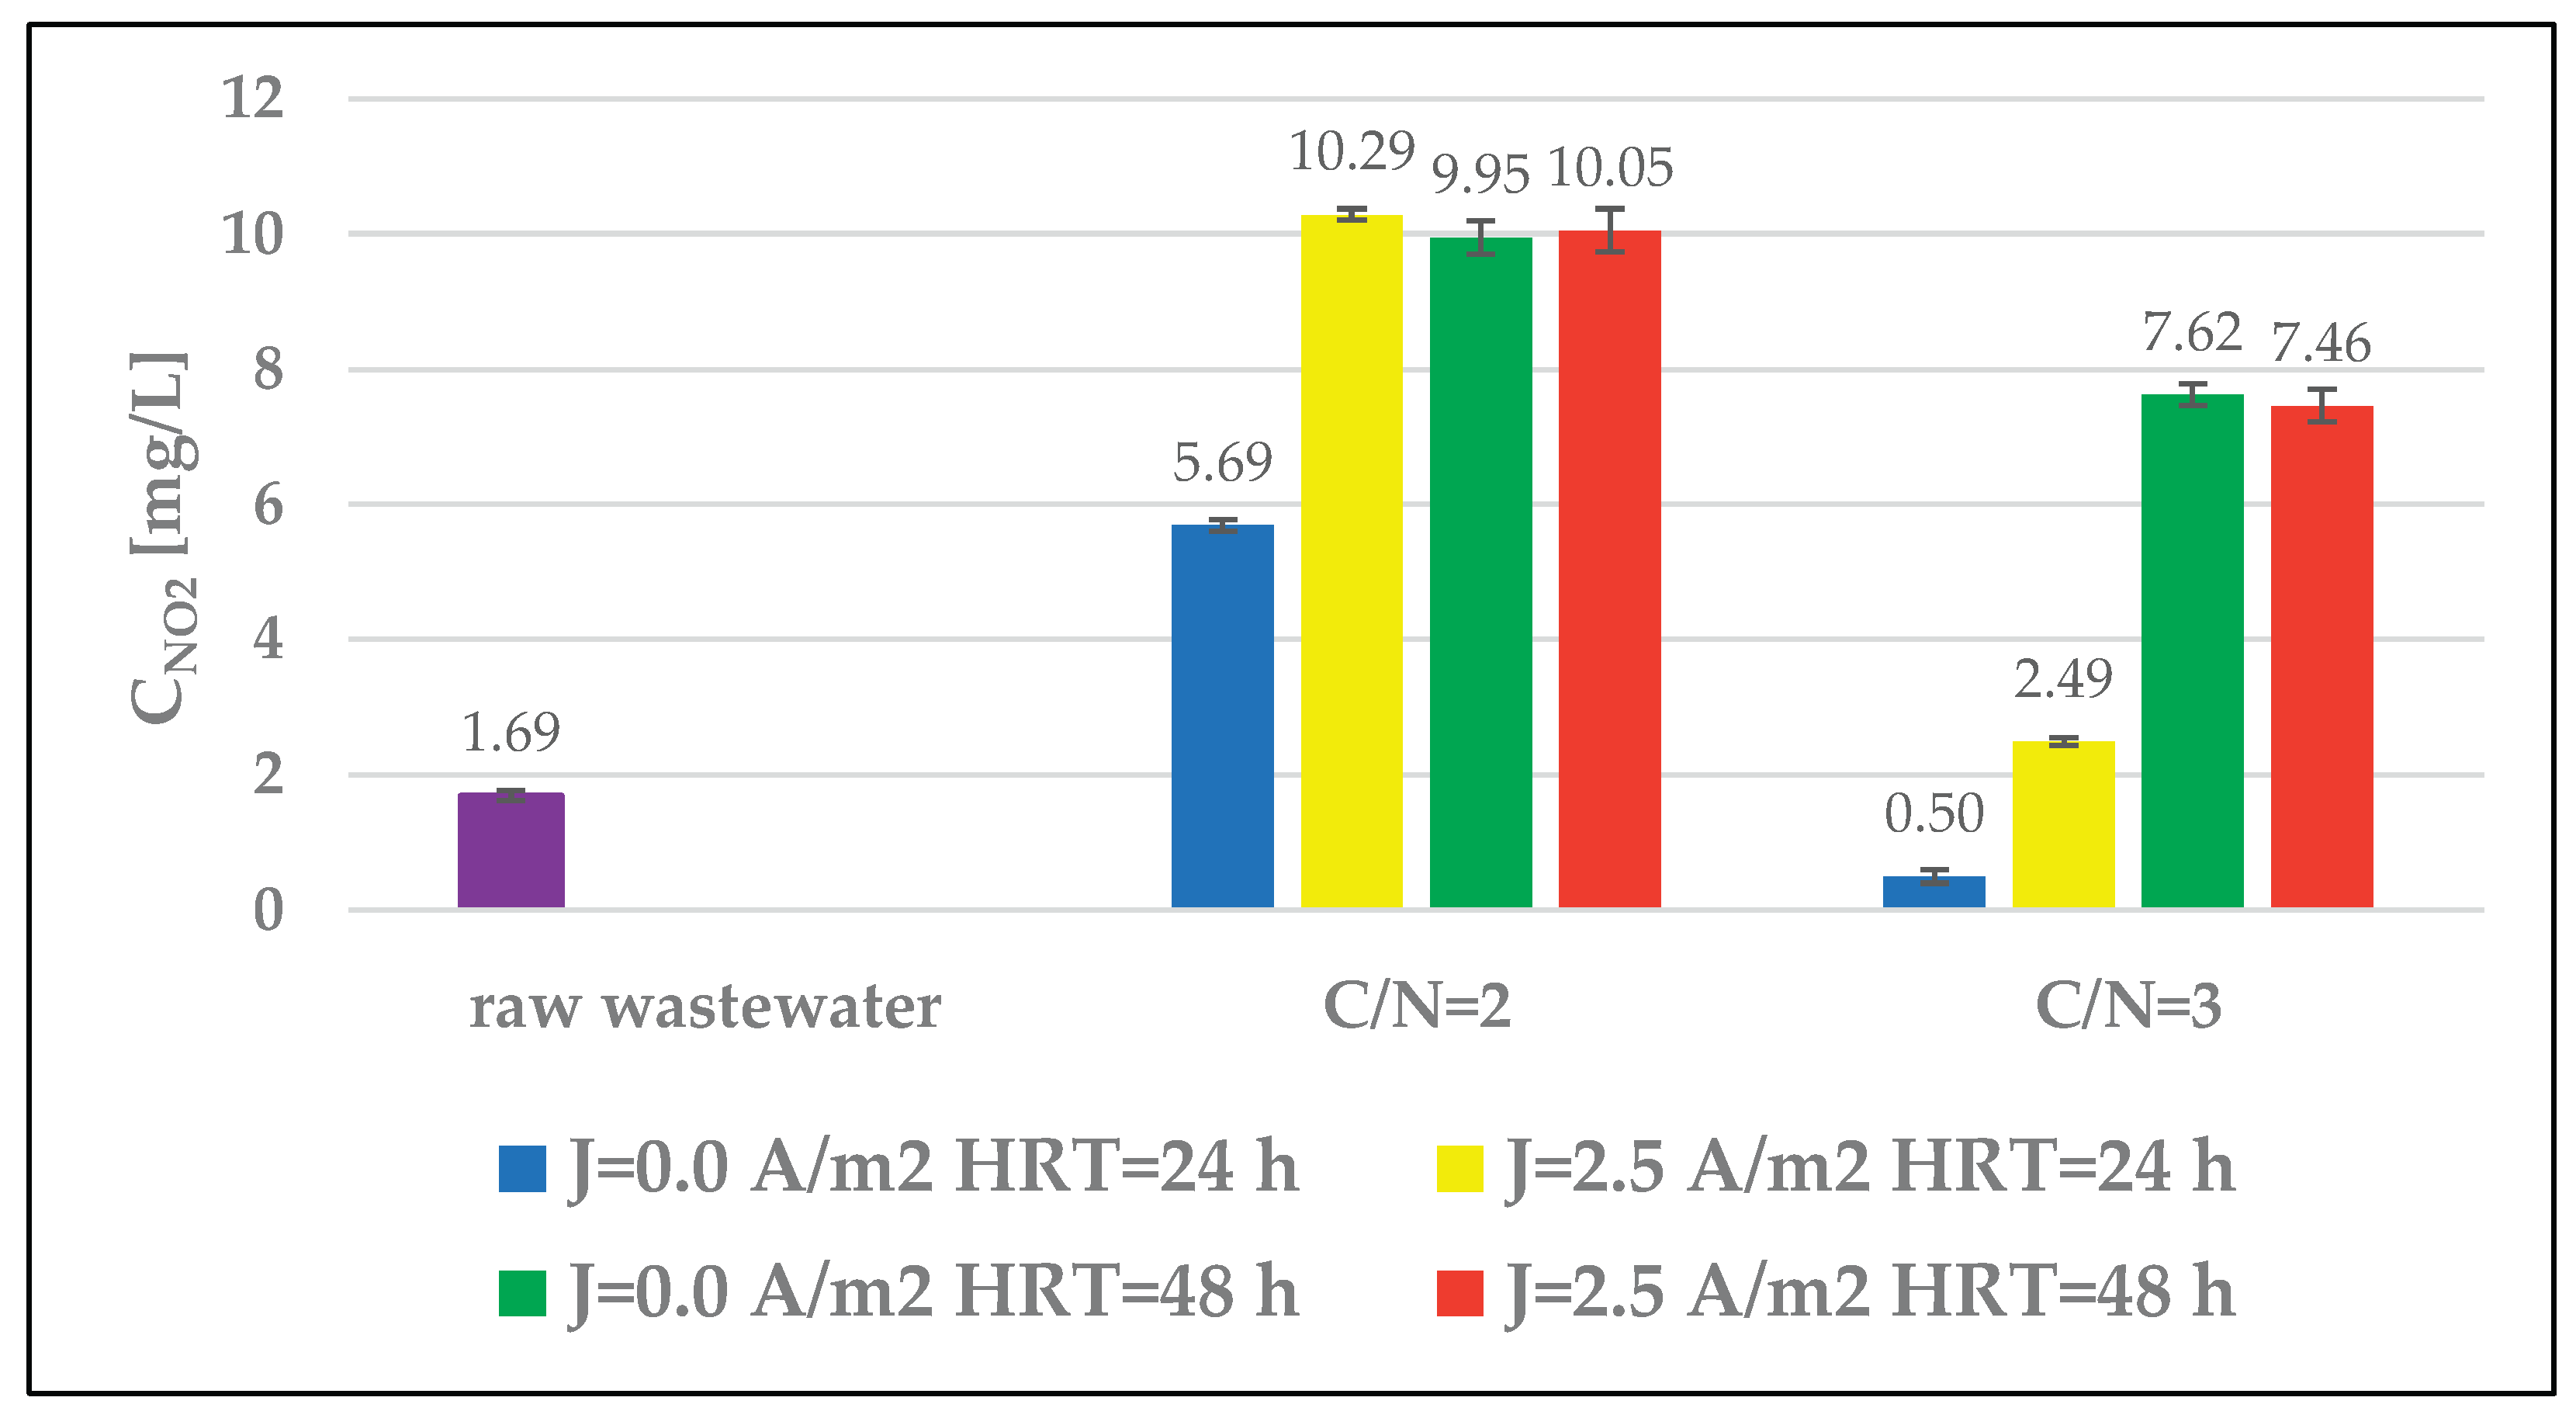
Figure 7.
The effect of the C/N ratio and HRT on the ammonium nitrogen concentration in the effluent.
Figure 7.
The effect of the C/N ratio and HRT on the ammonium nitrogen concentration in the effluent.
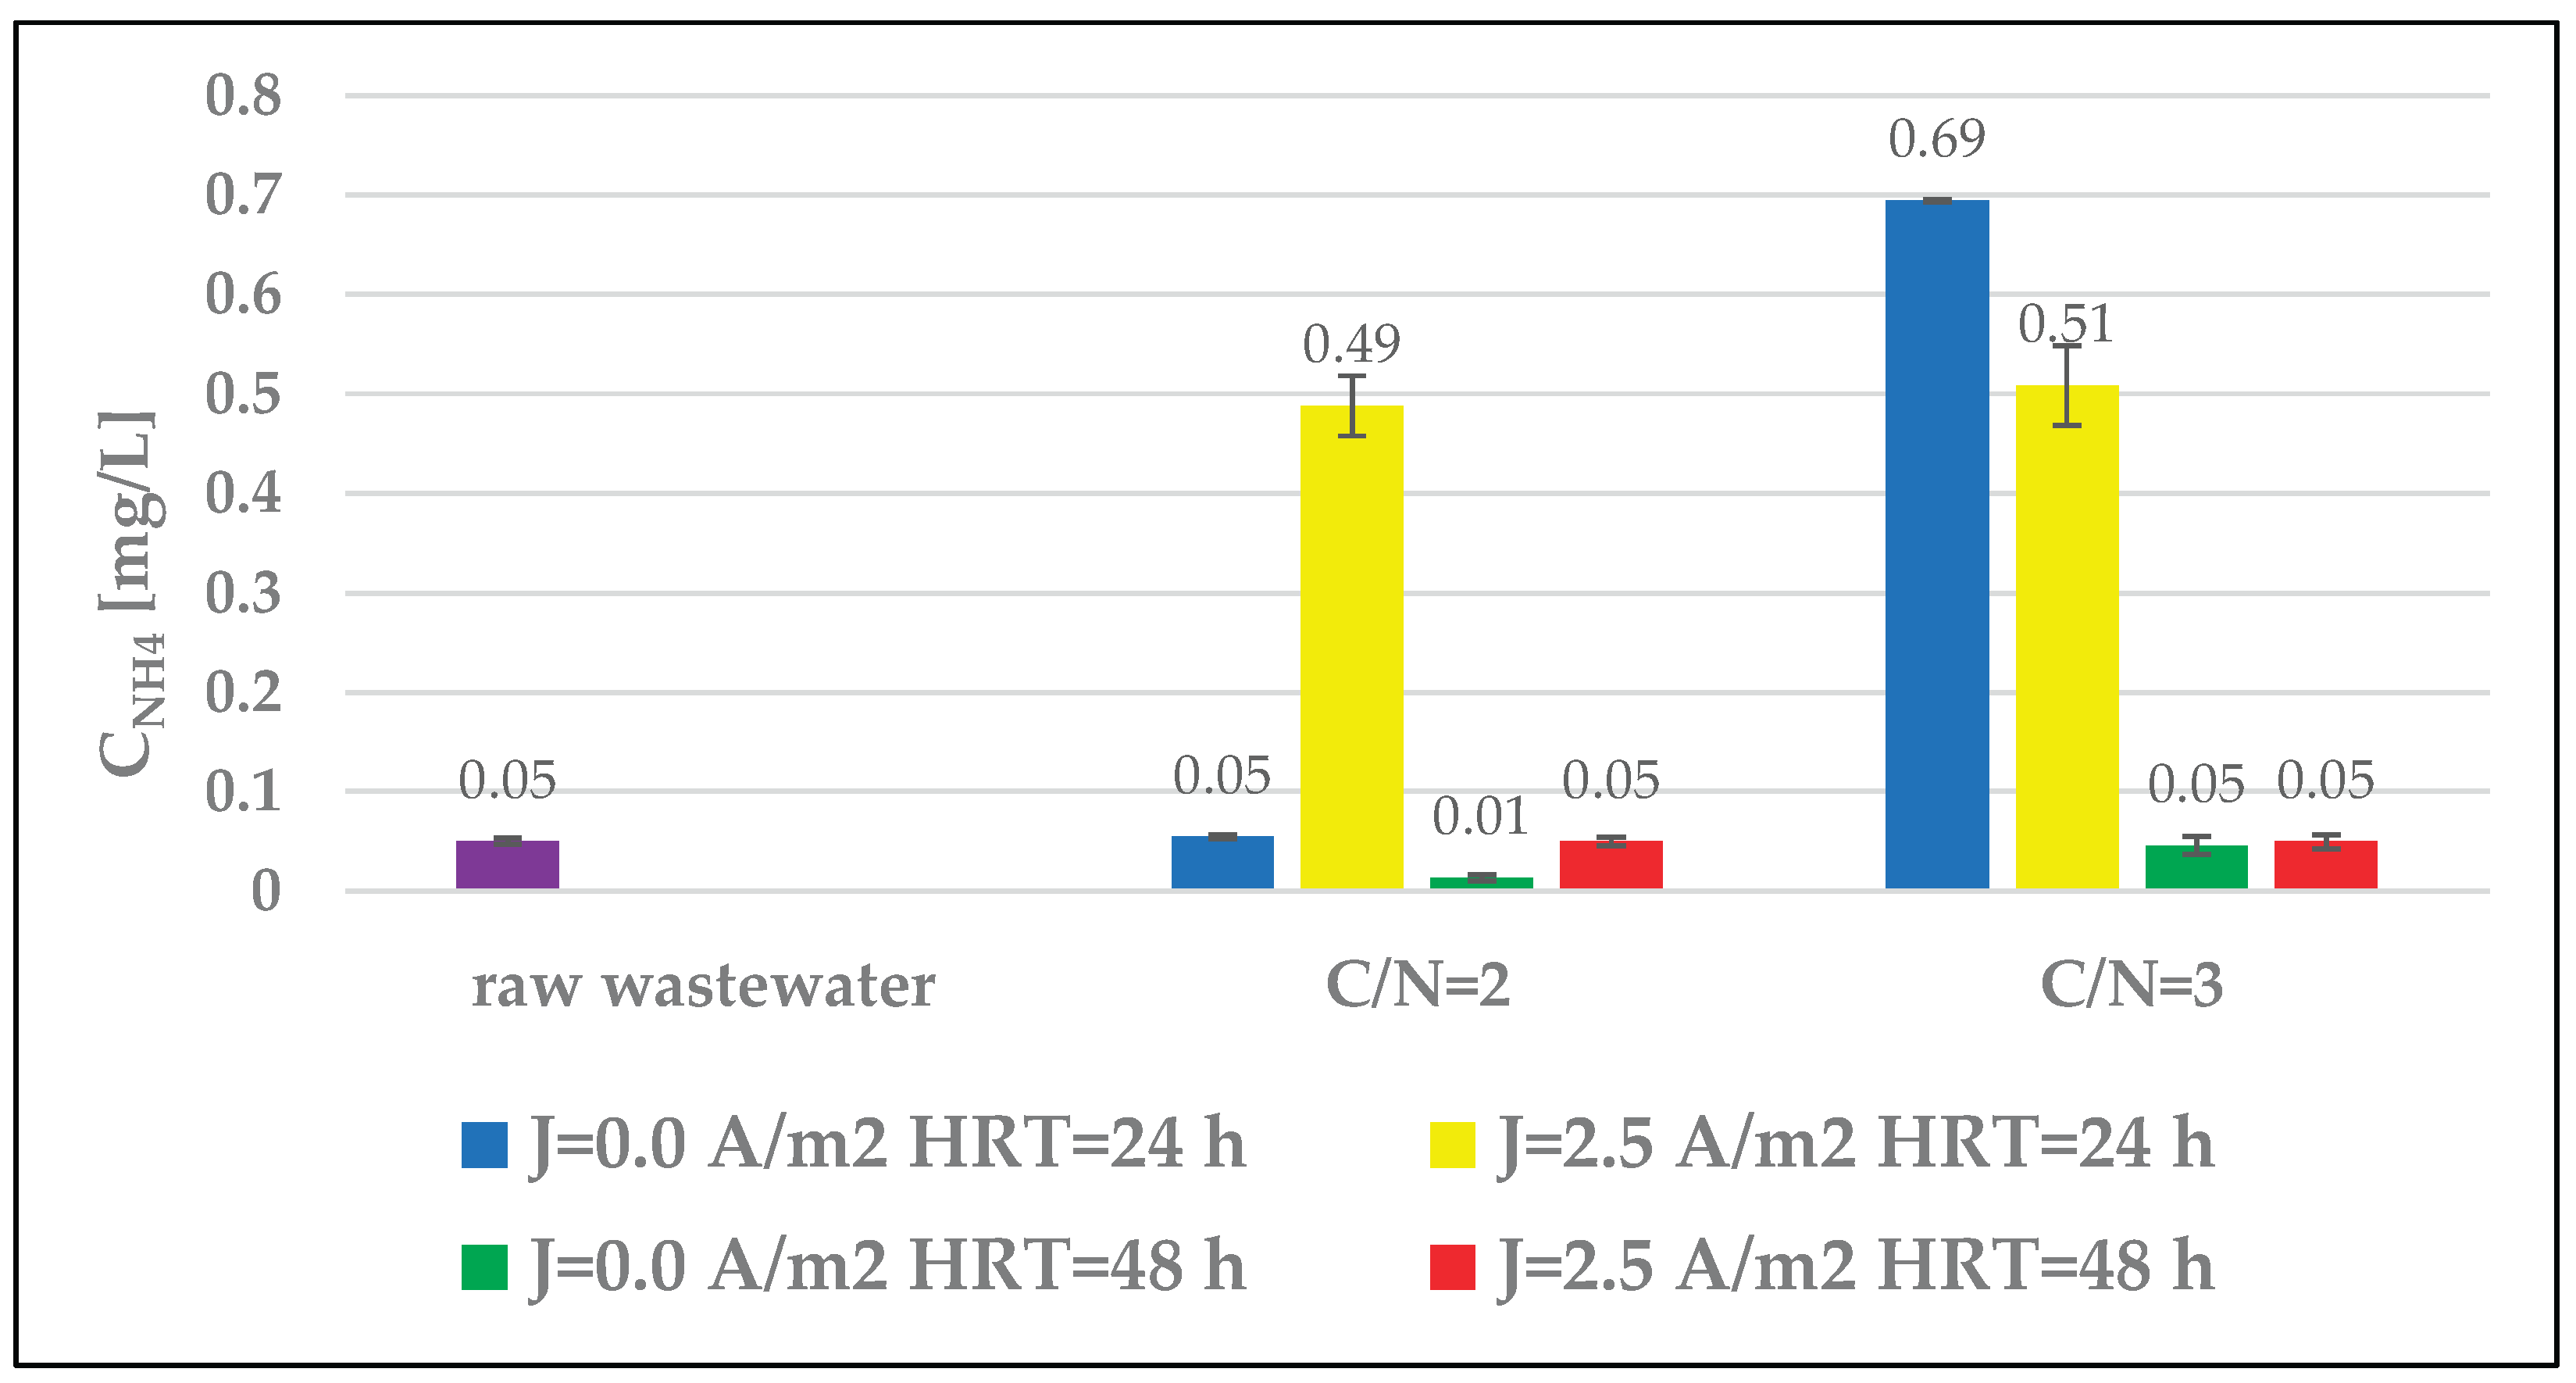
Figure 8.
The effect of the C/N ratio and HRT on the concentration of total phosphorus (TP) in the effluent.
Figure 8.
The effect of the C/N ratio and HRT on the concentration of total phosphorus (TP) in the effluent.
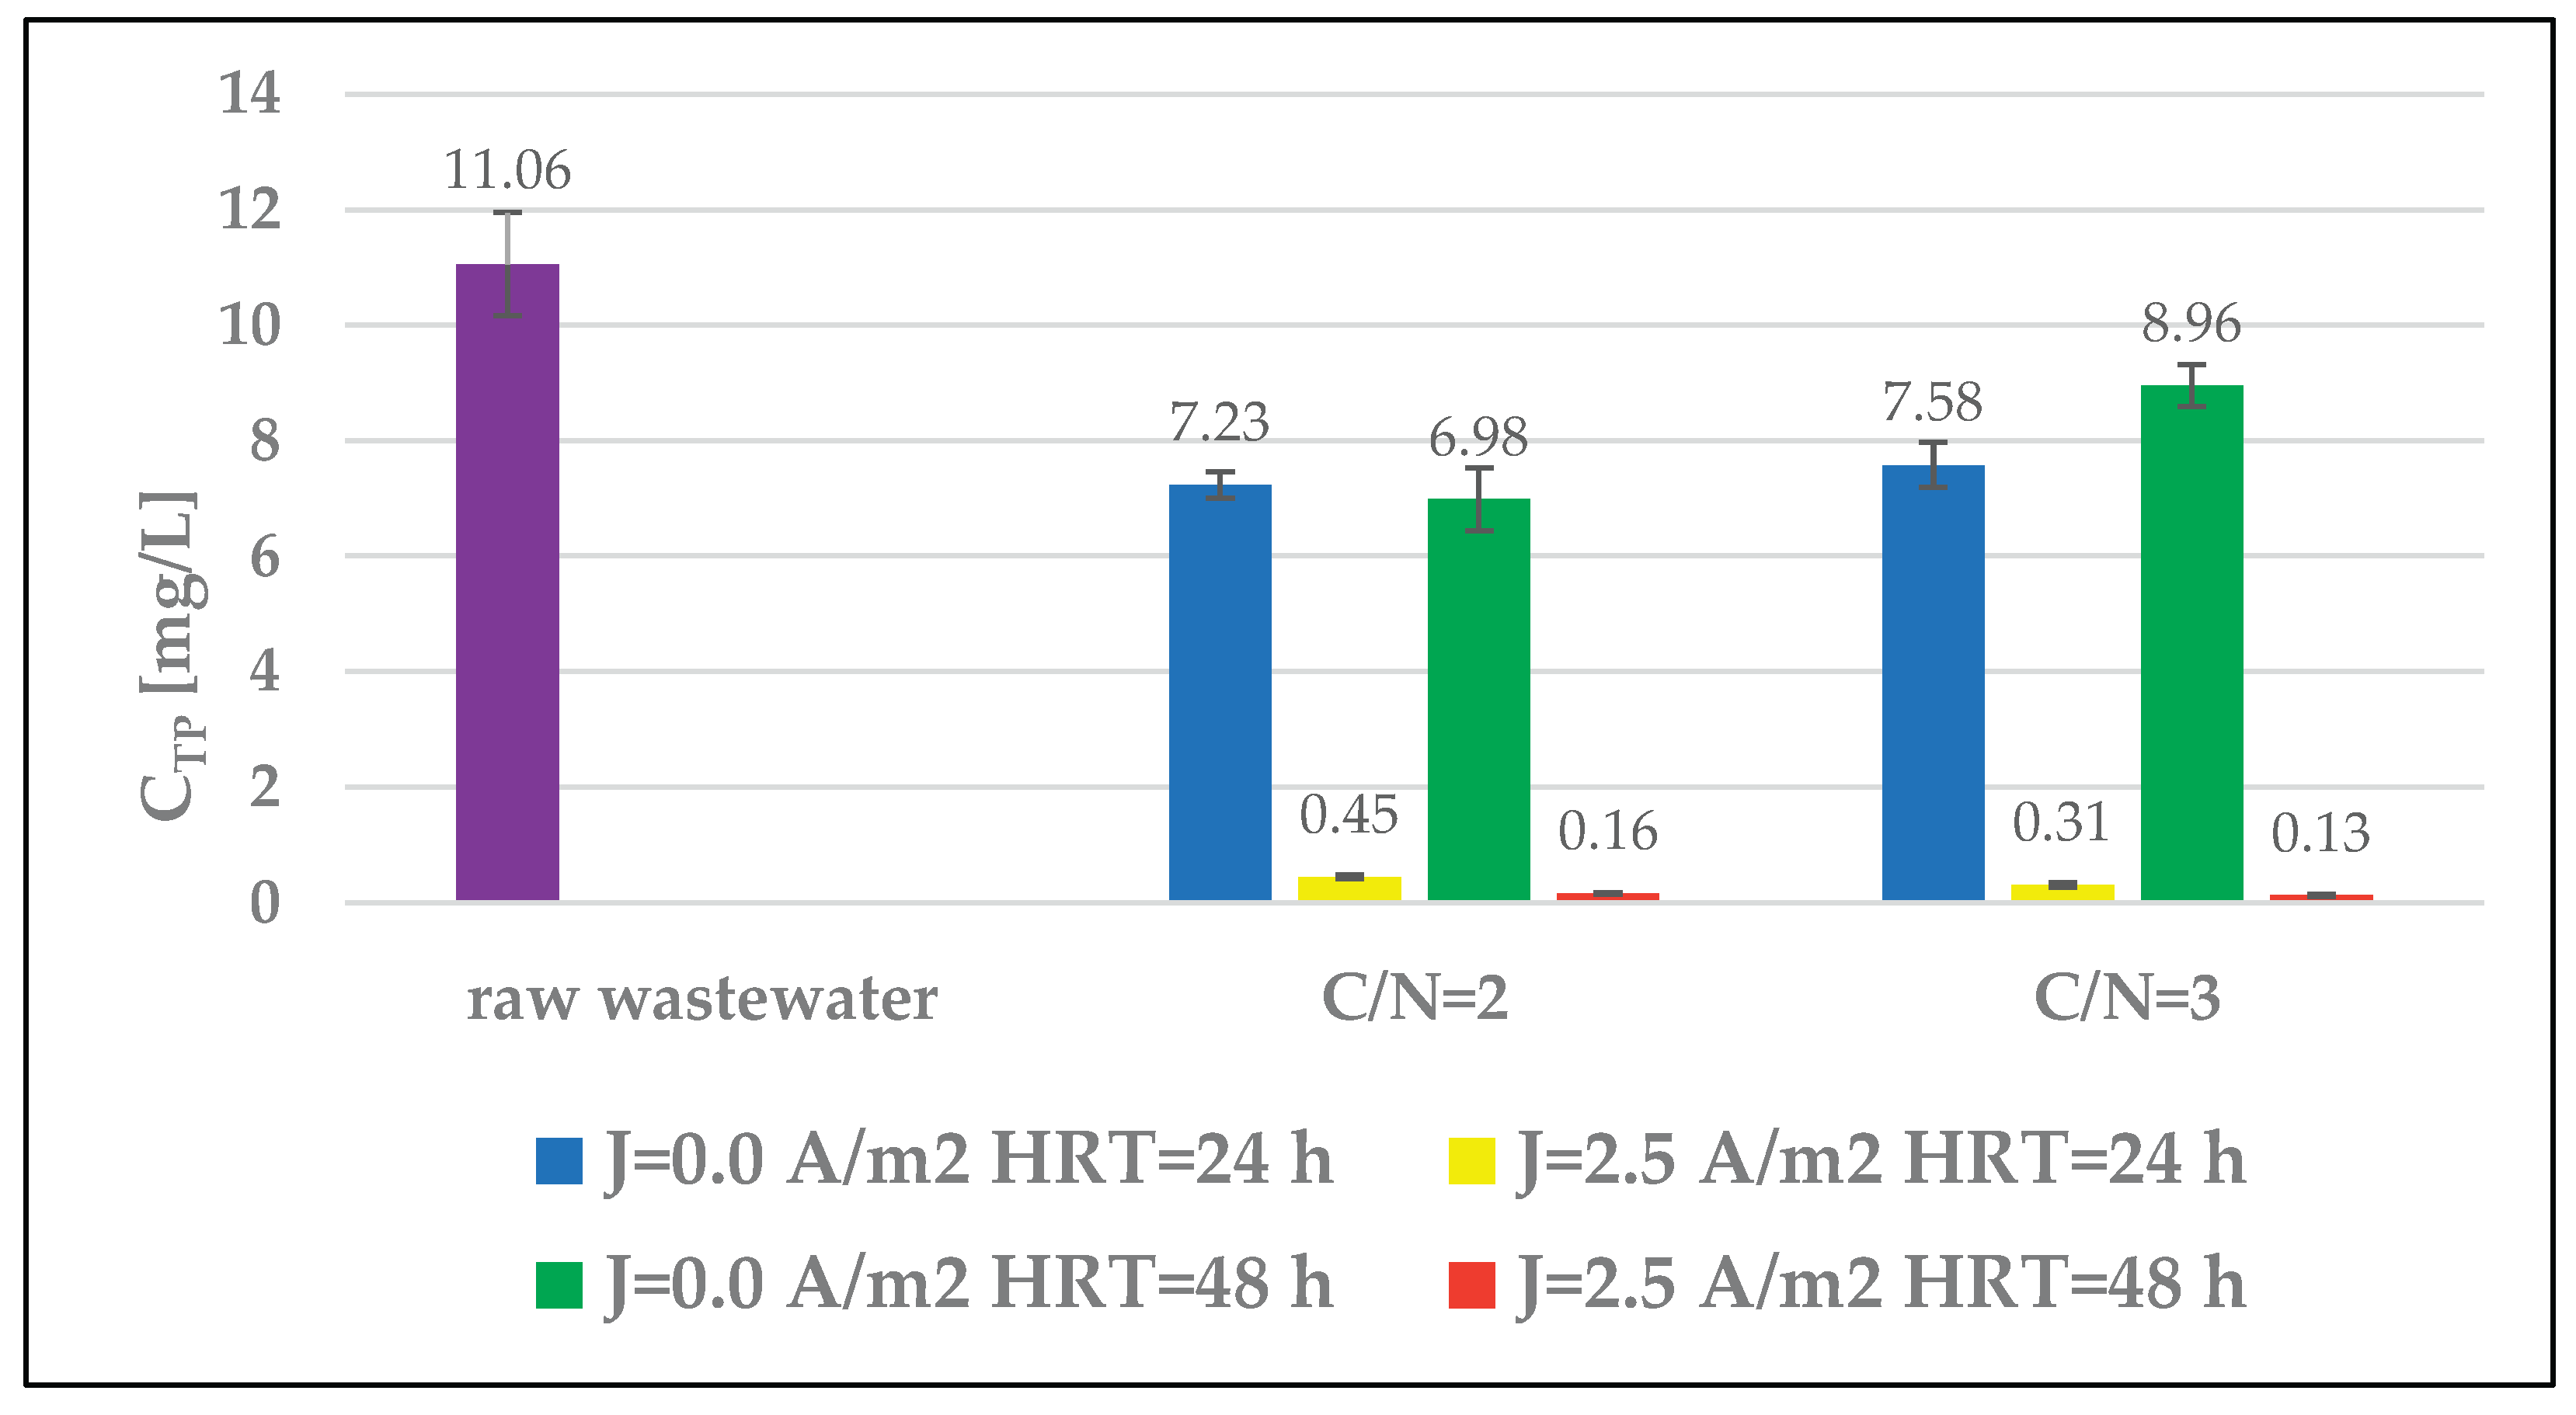
Figure 9.
The effect of the C/N ratio and HRT on COD concentration in the effluent.
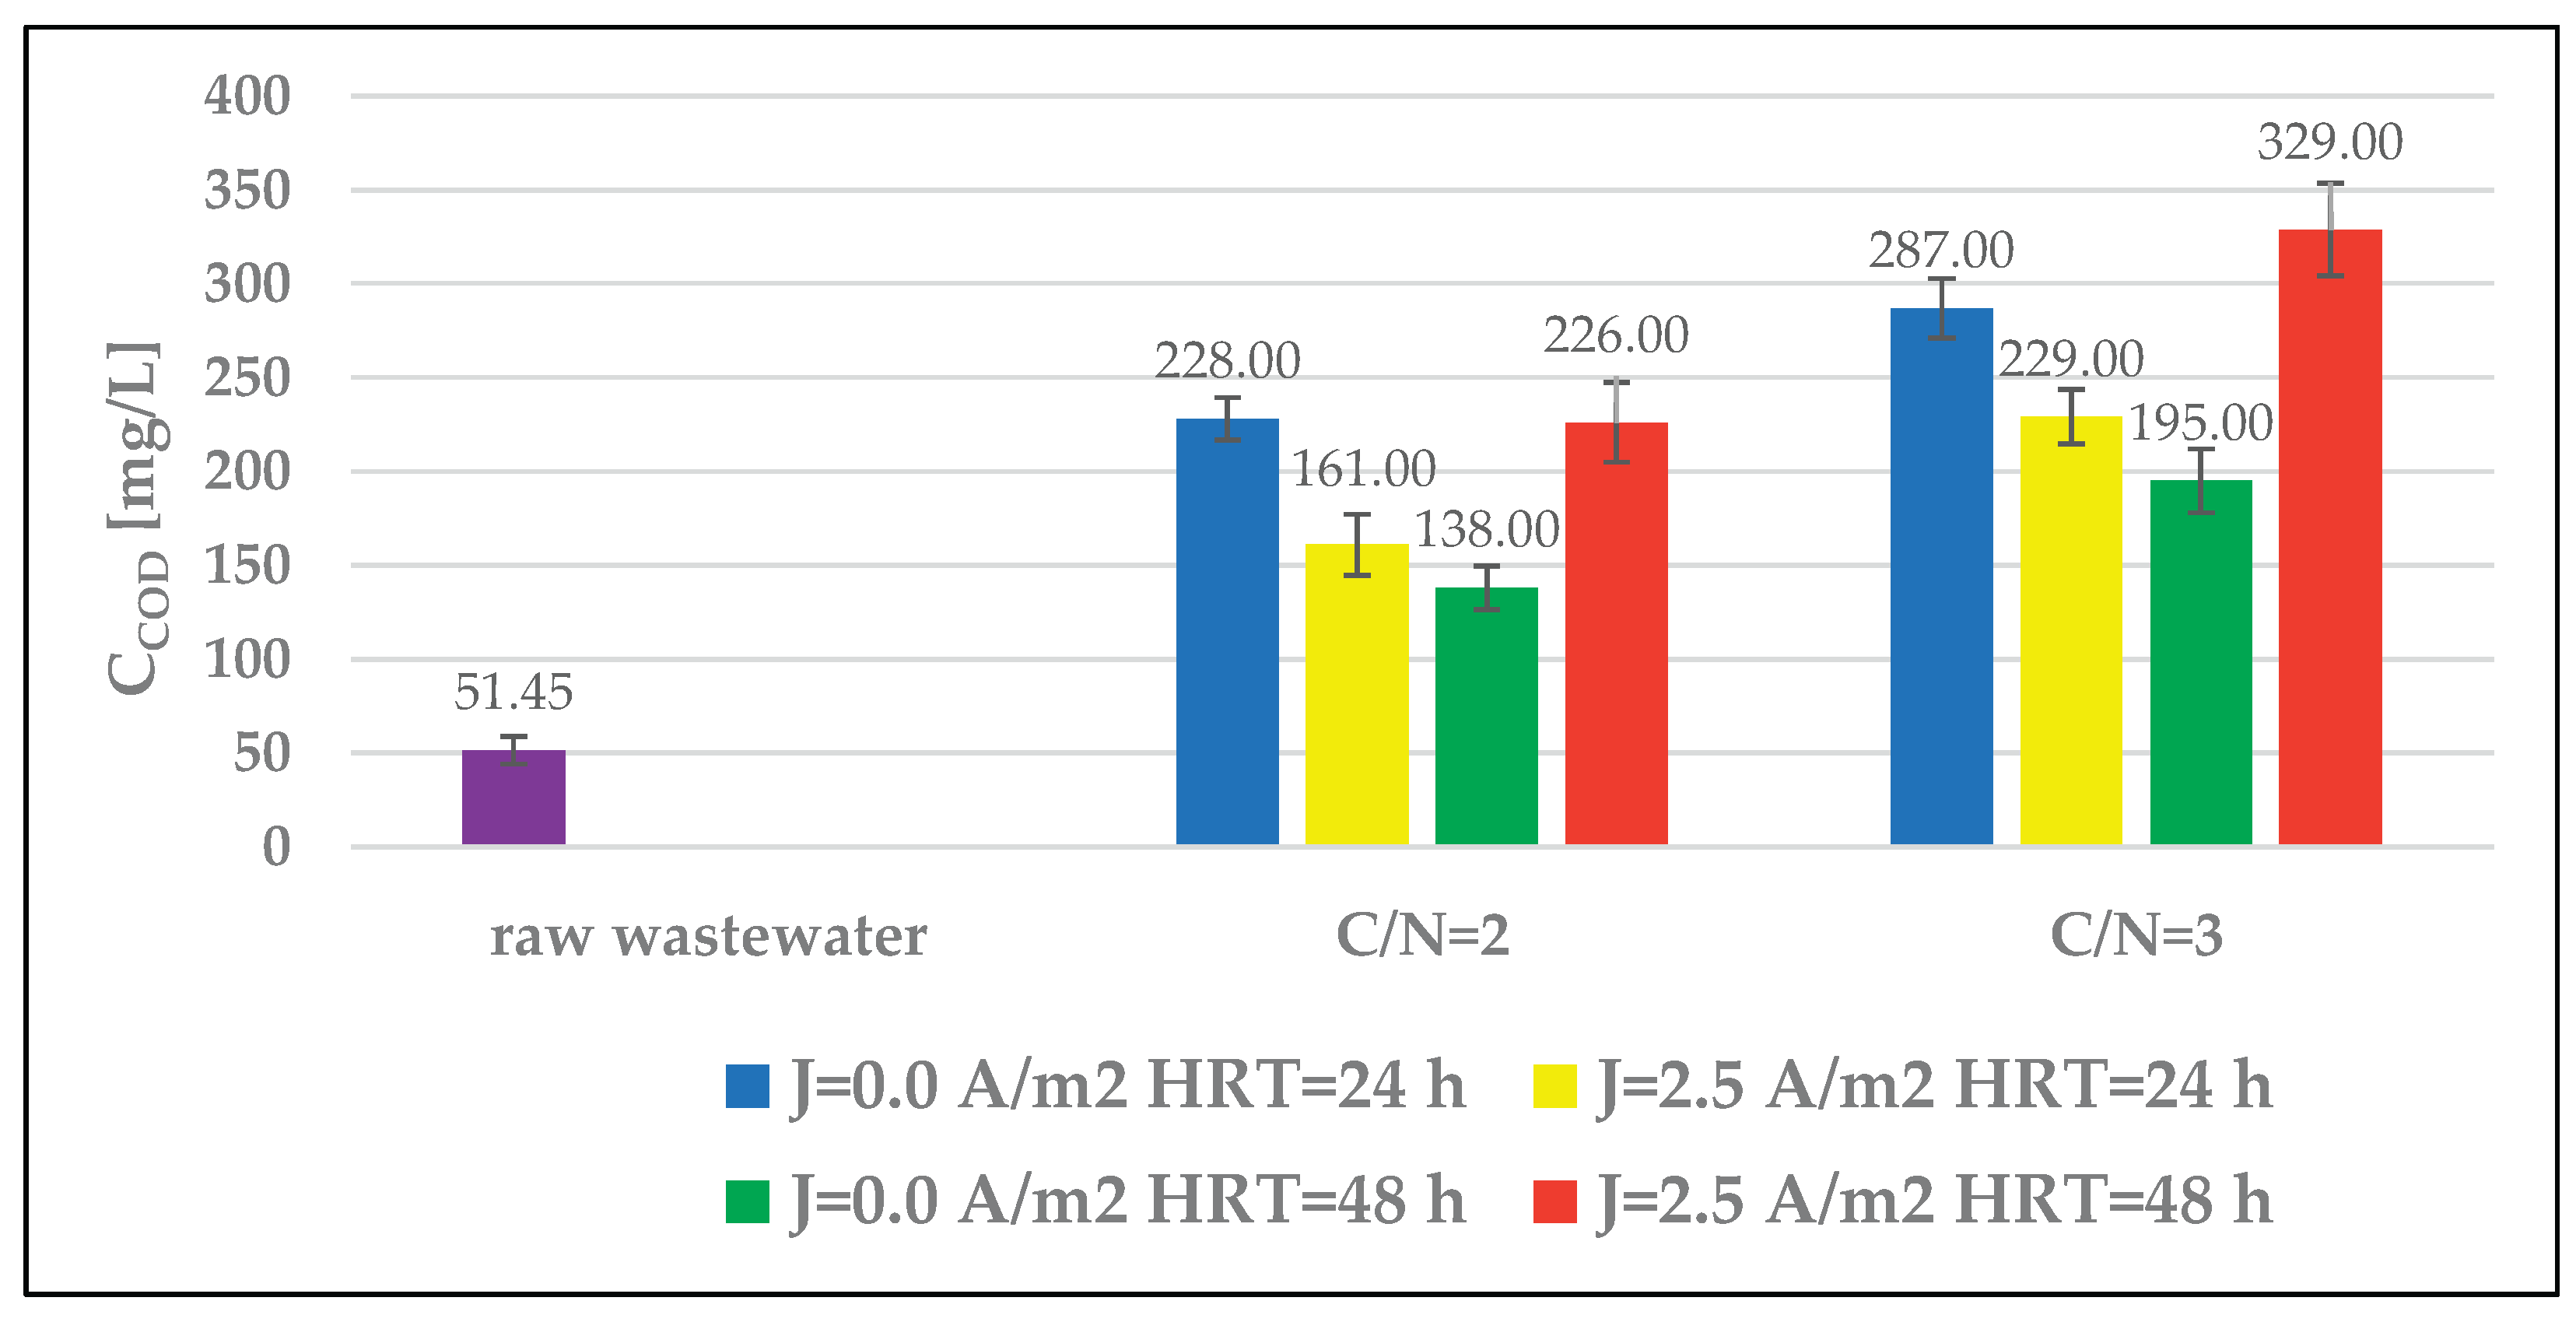
Figure 10.
The effect of the C/N ratio and HRT on TC concentration in the effluent.
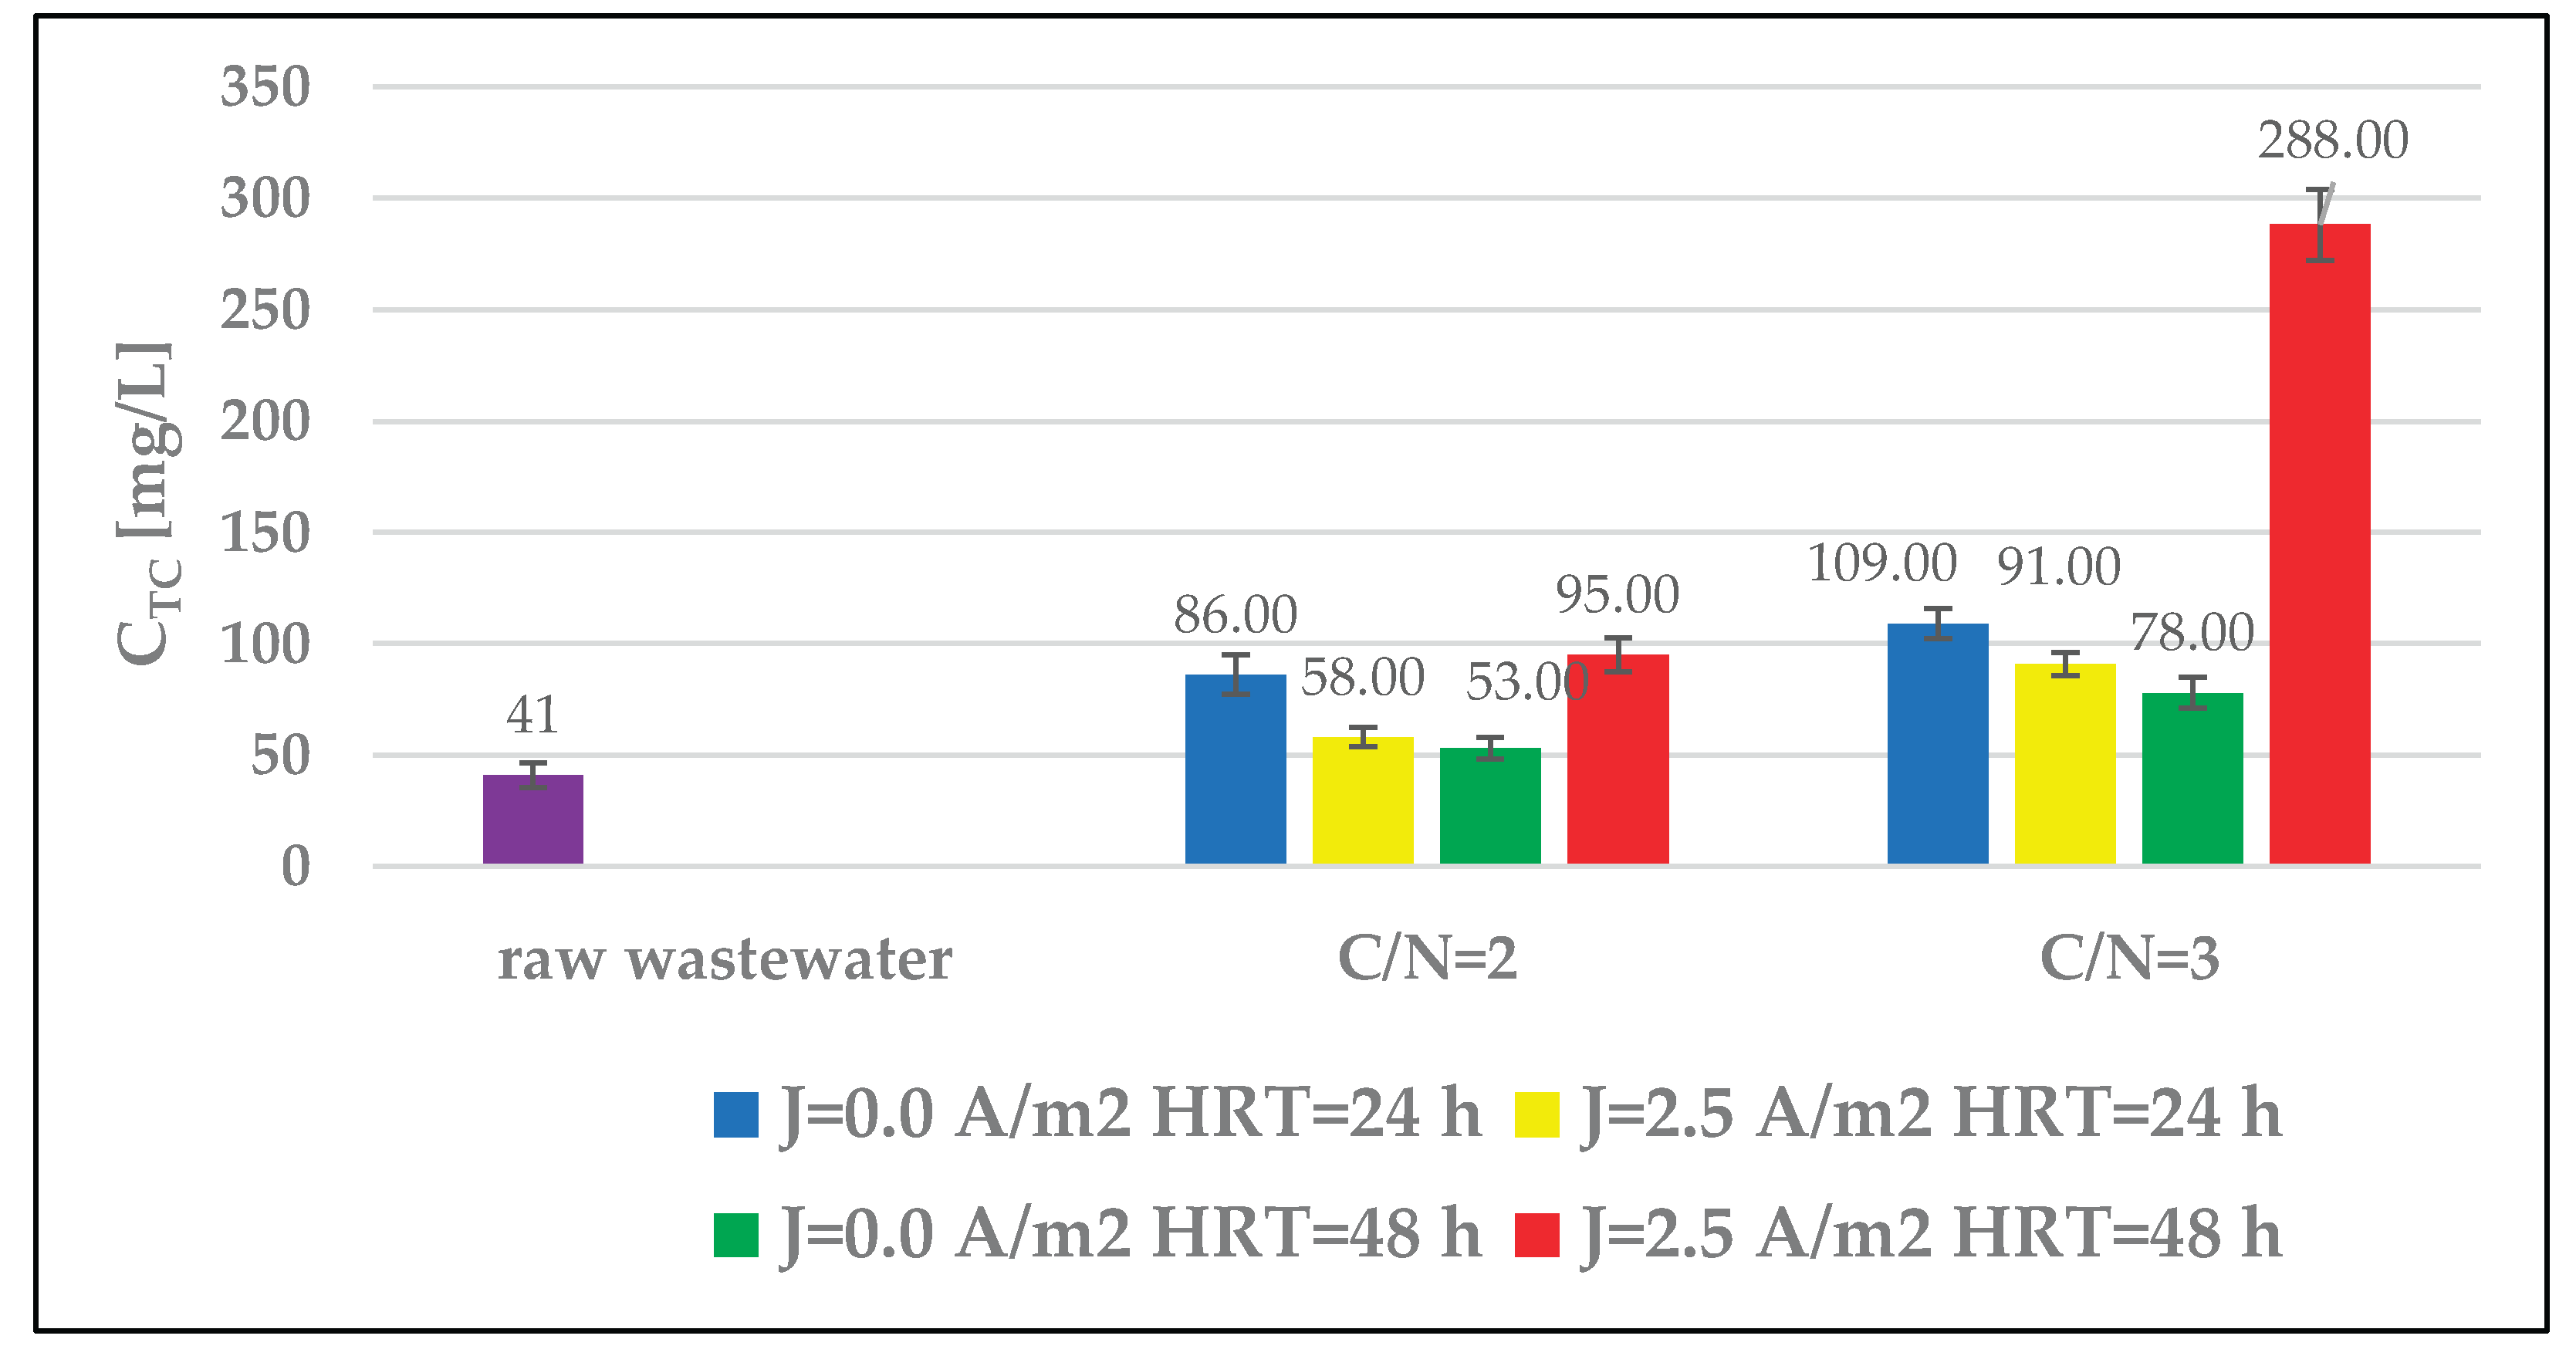
Figure 11.
The effect of the C/N ratio and HRT on IC concentration in the effluent.
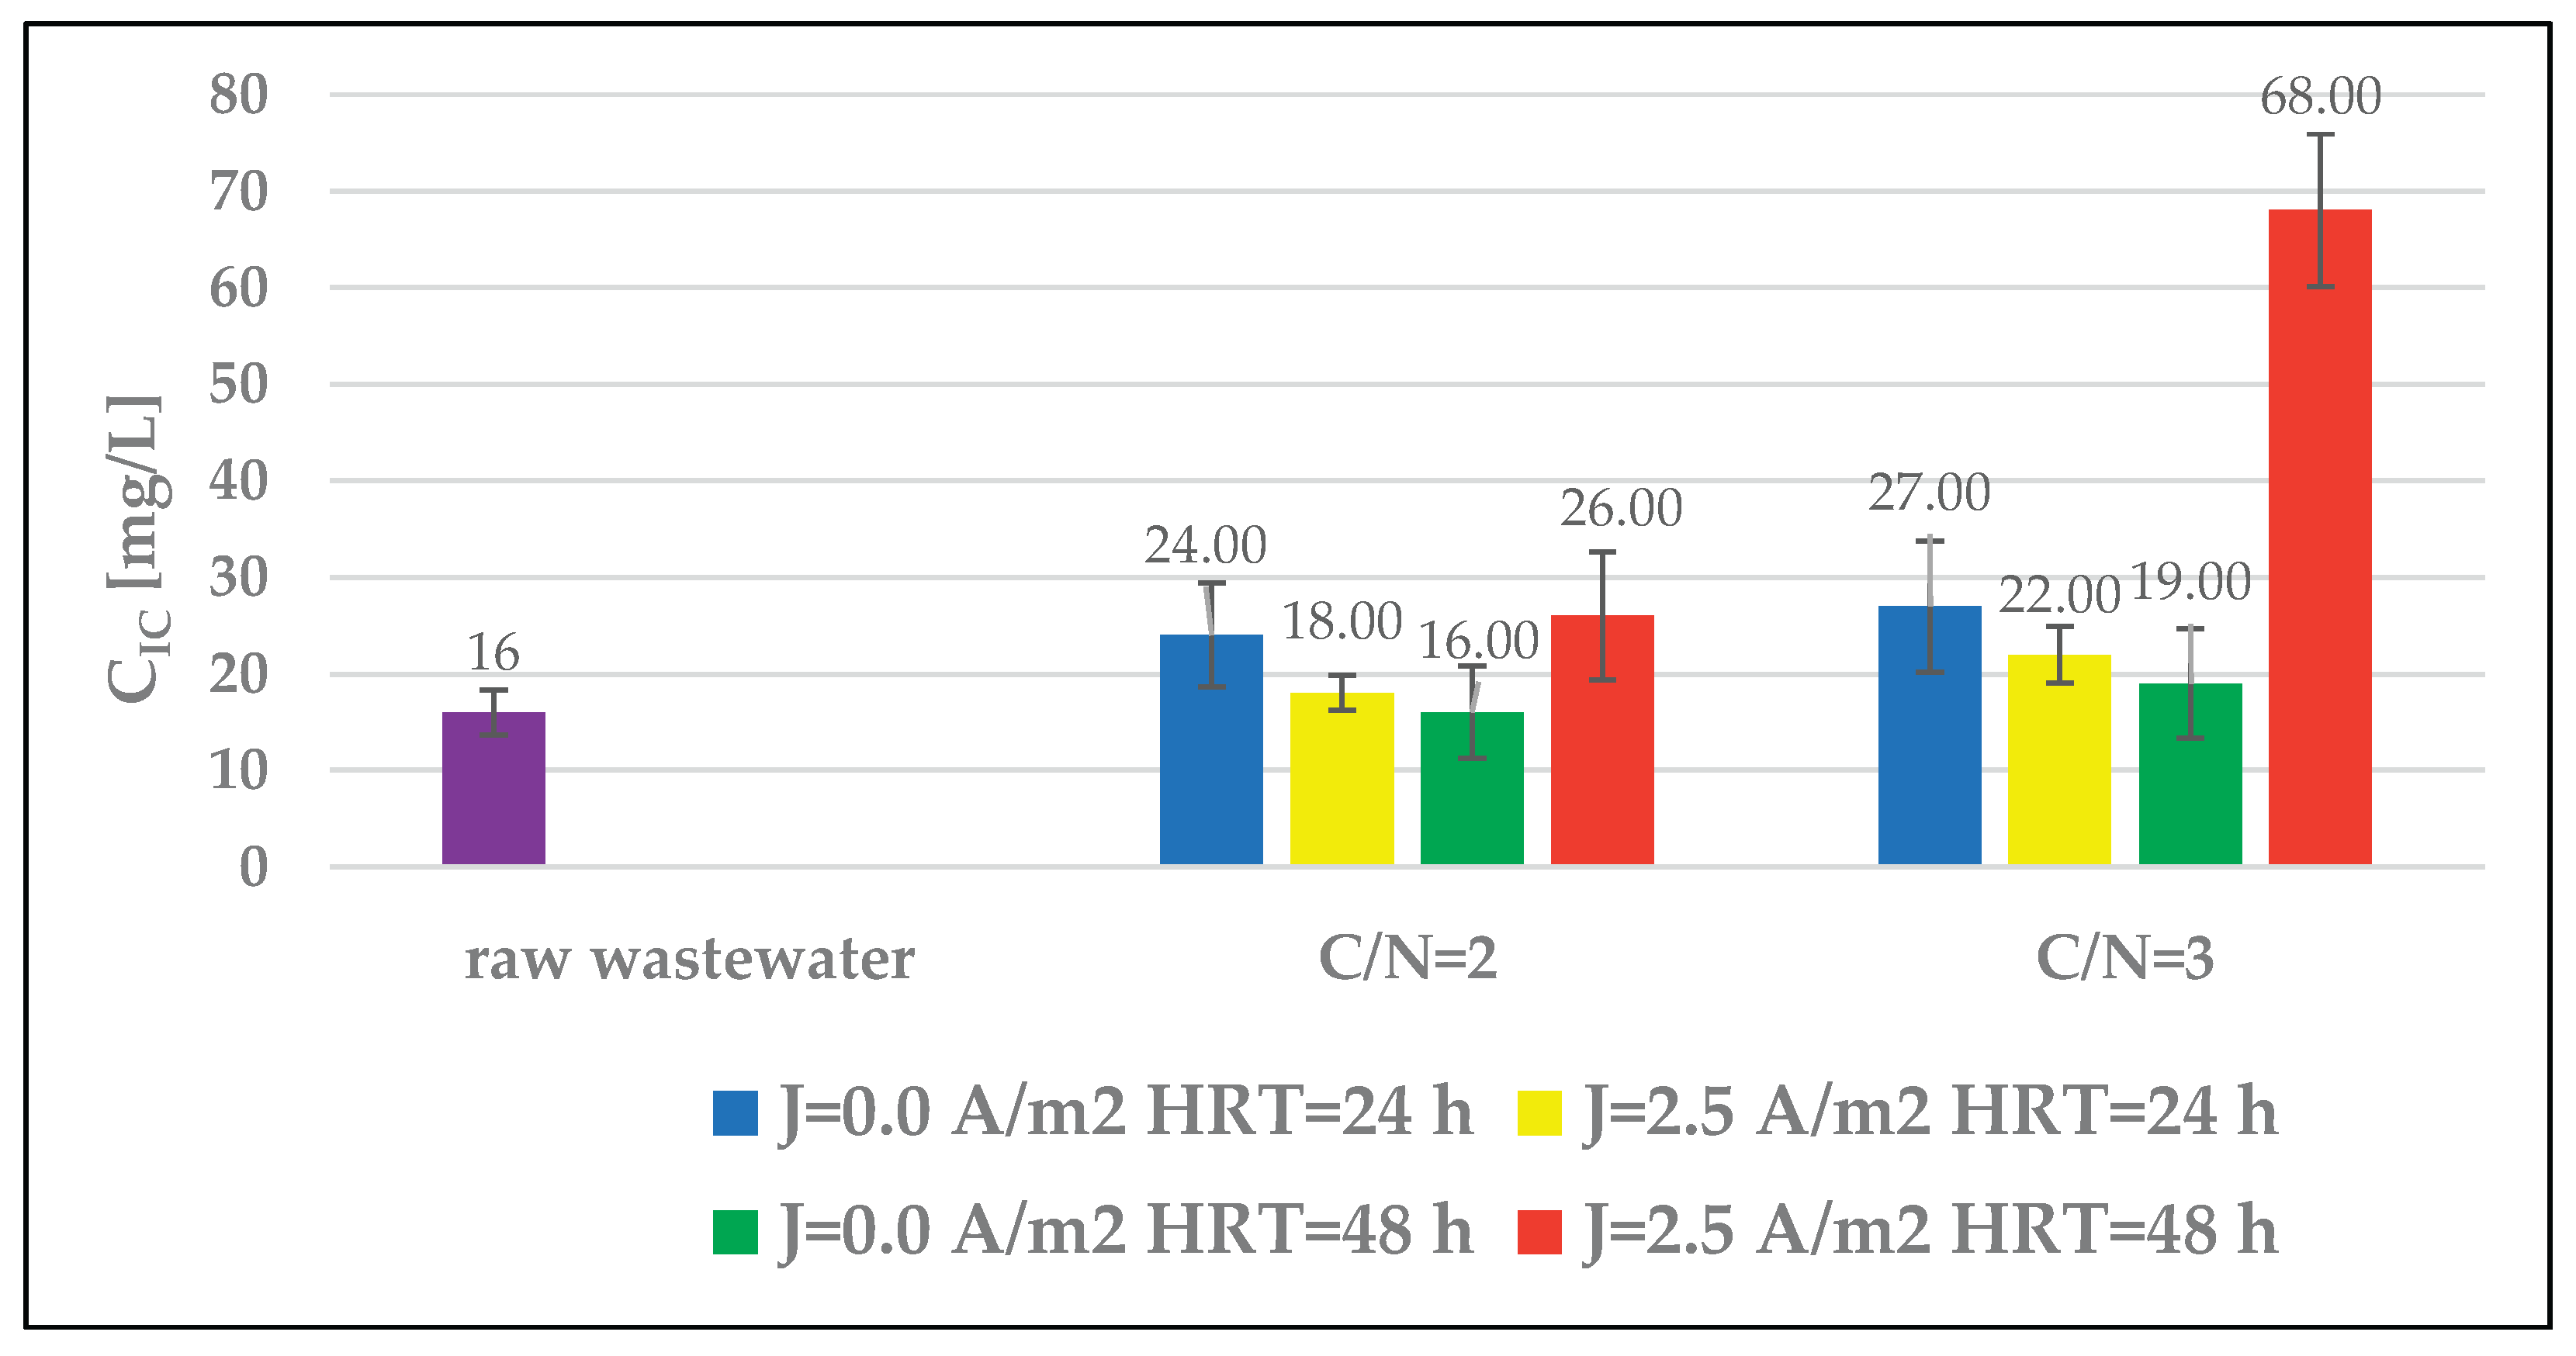
Figure 12.
The effect of the C/N ratio and HRT on TOC concentration in the effluent.
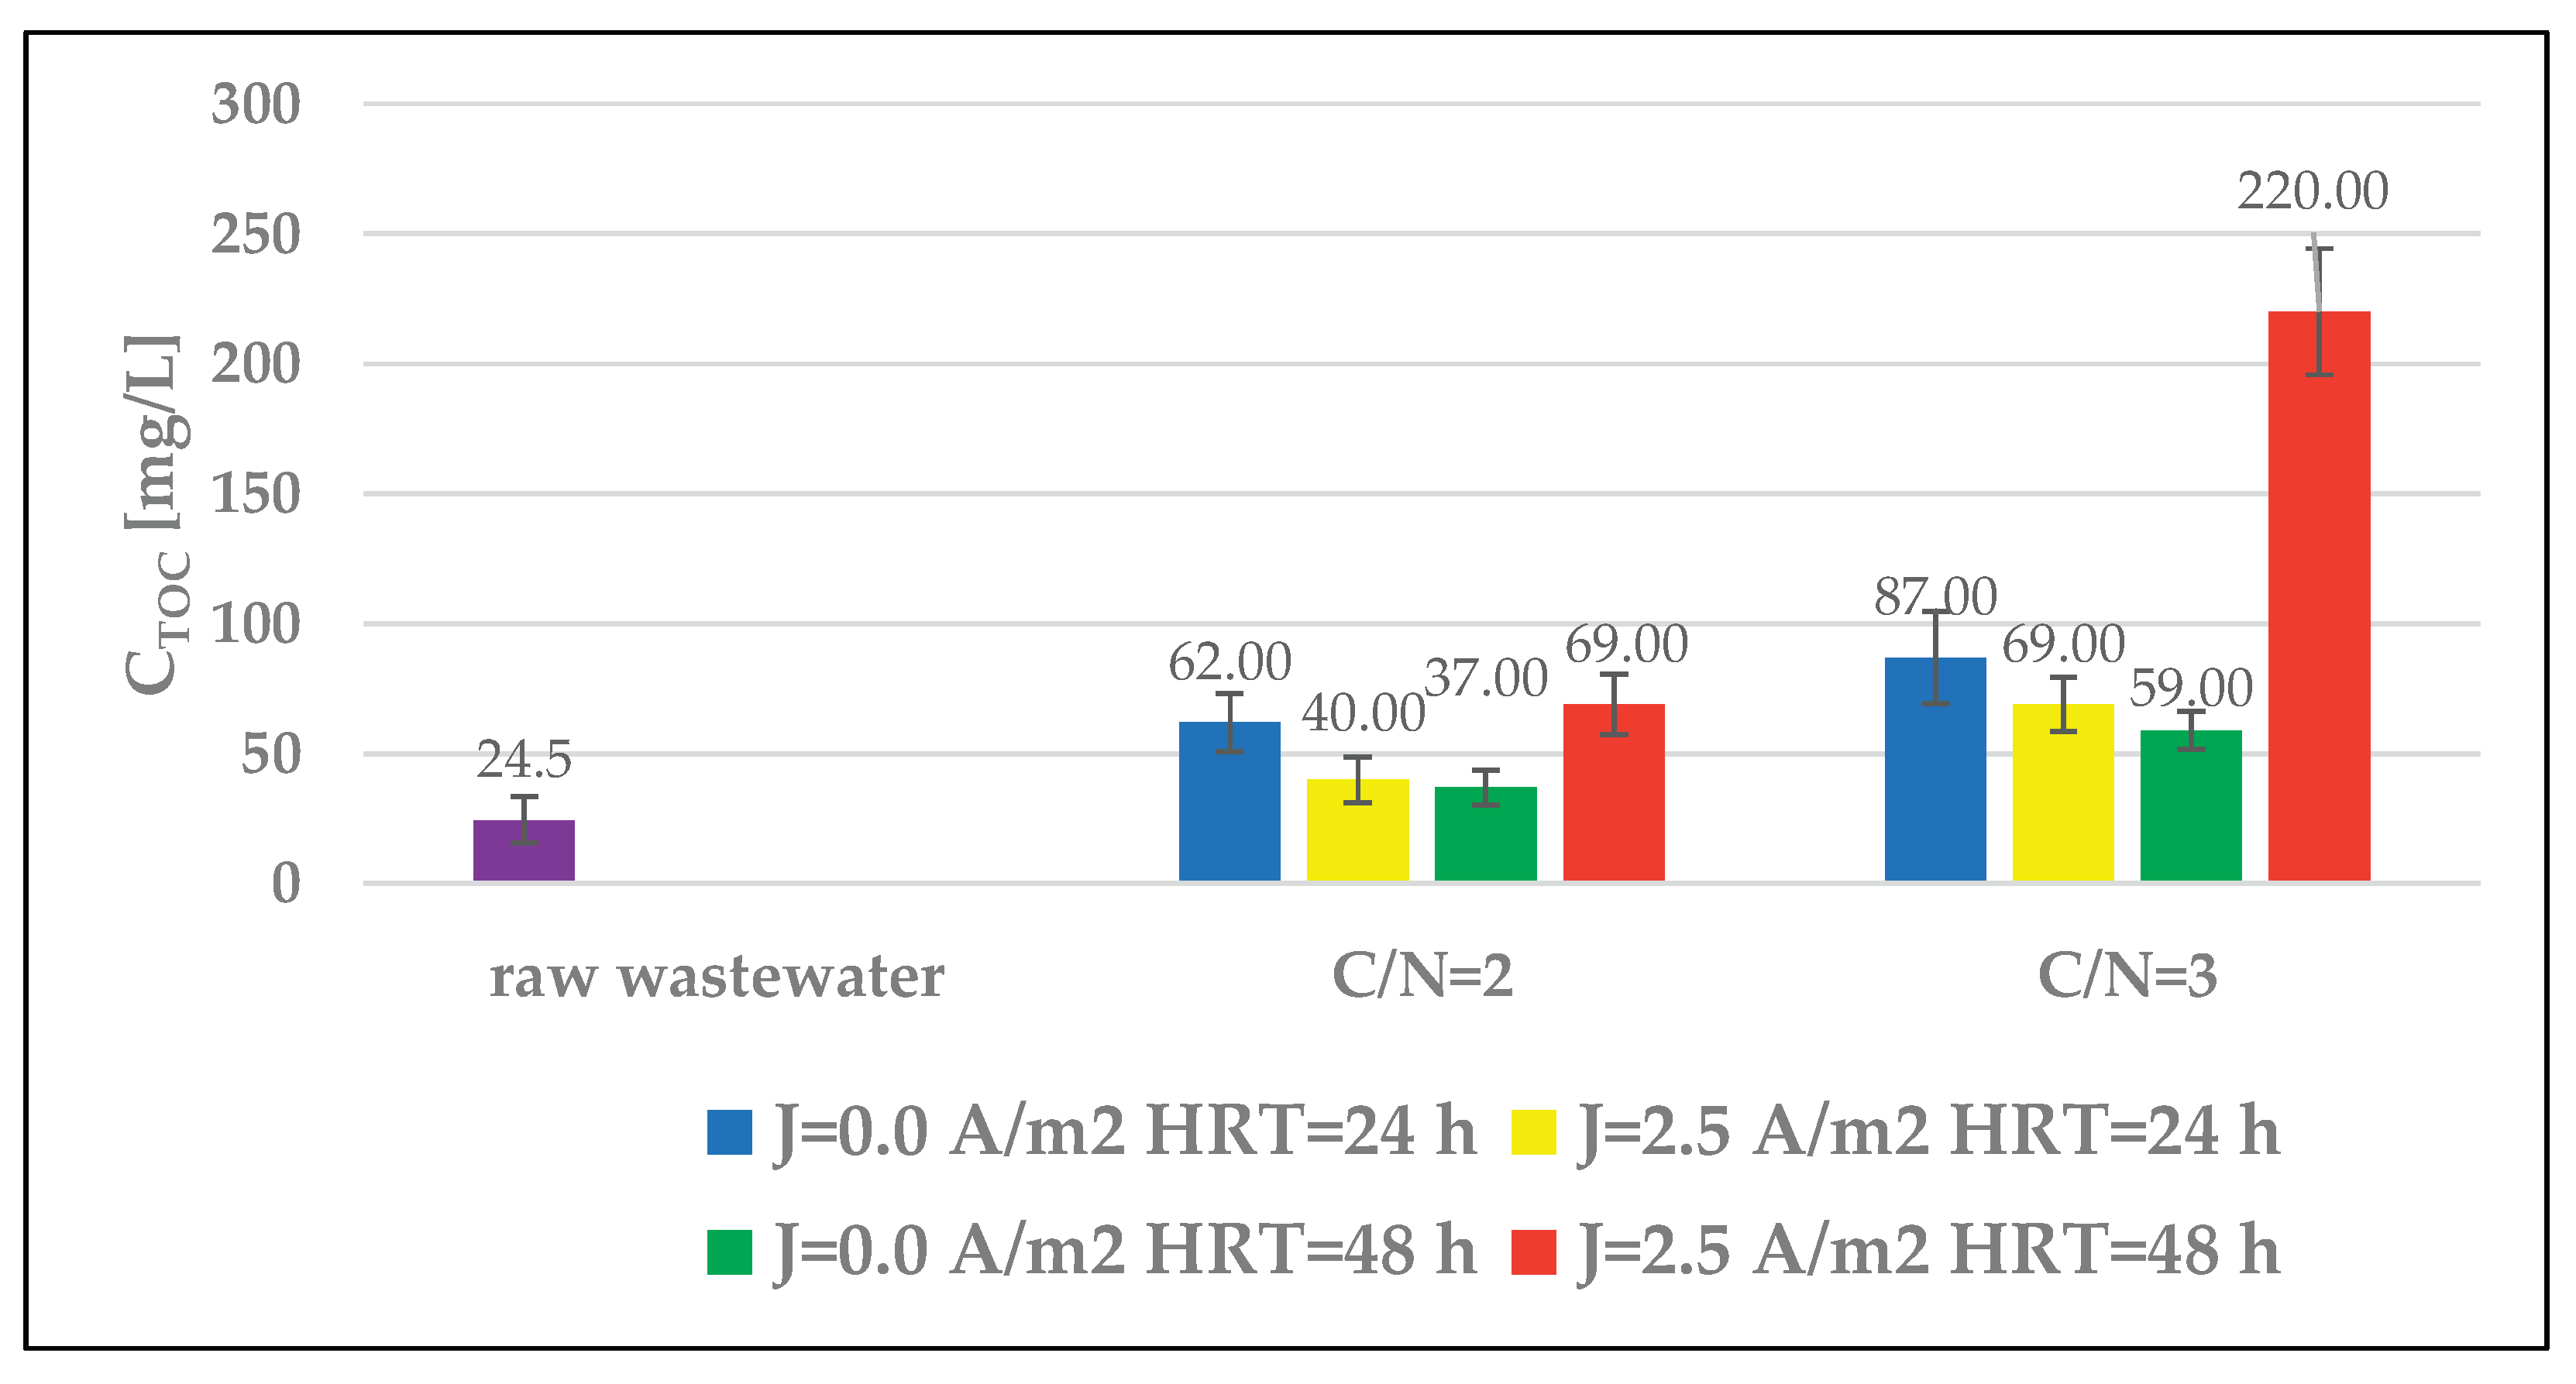
Figure 13.
Current efficiency (CE) of REBDC depending on HRT and C/N ratio.
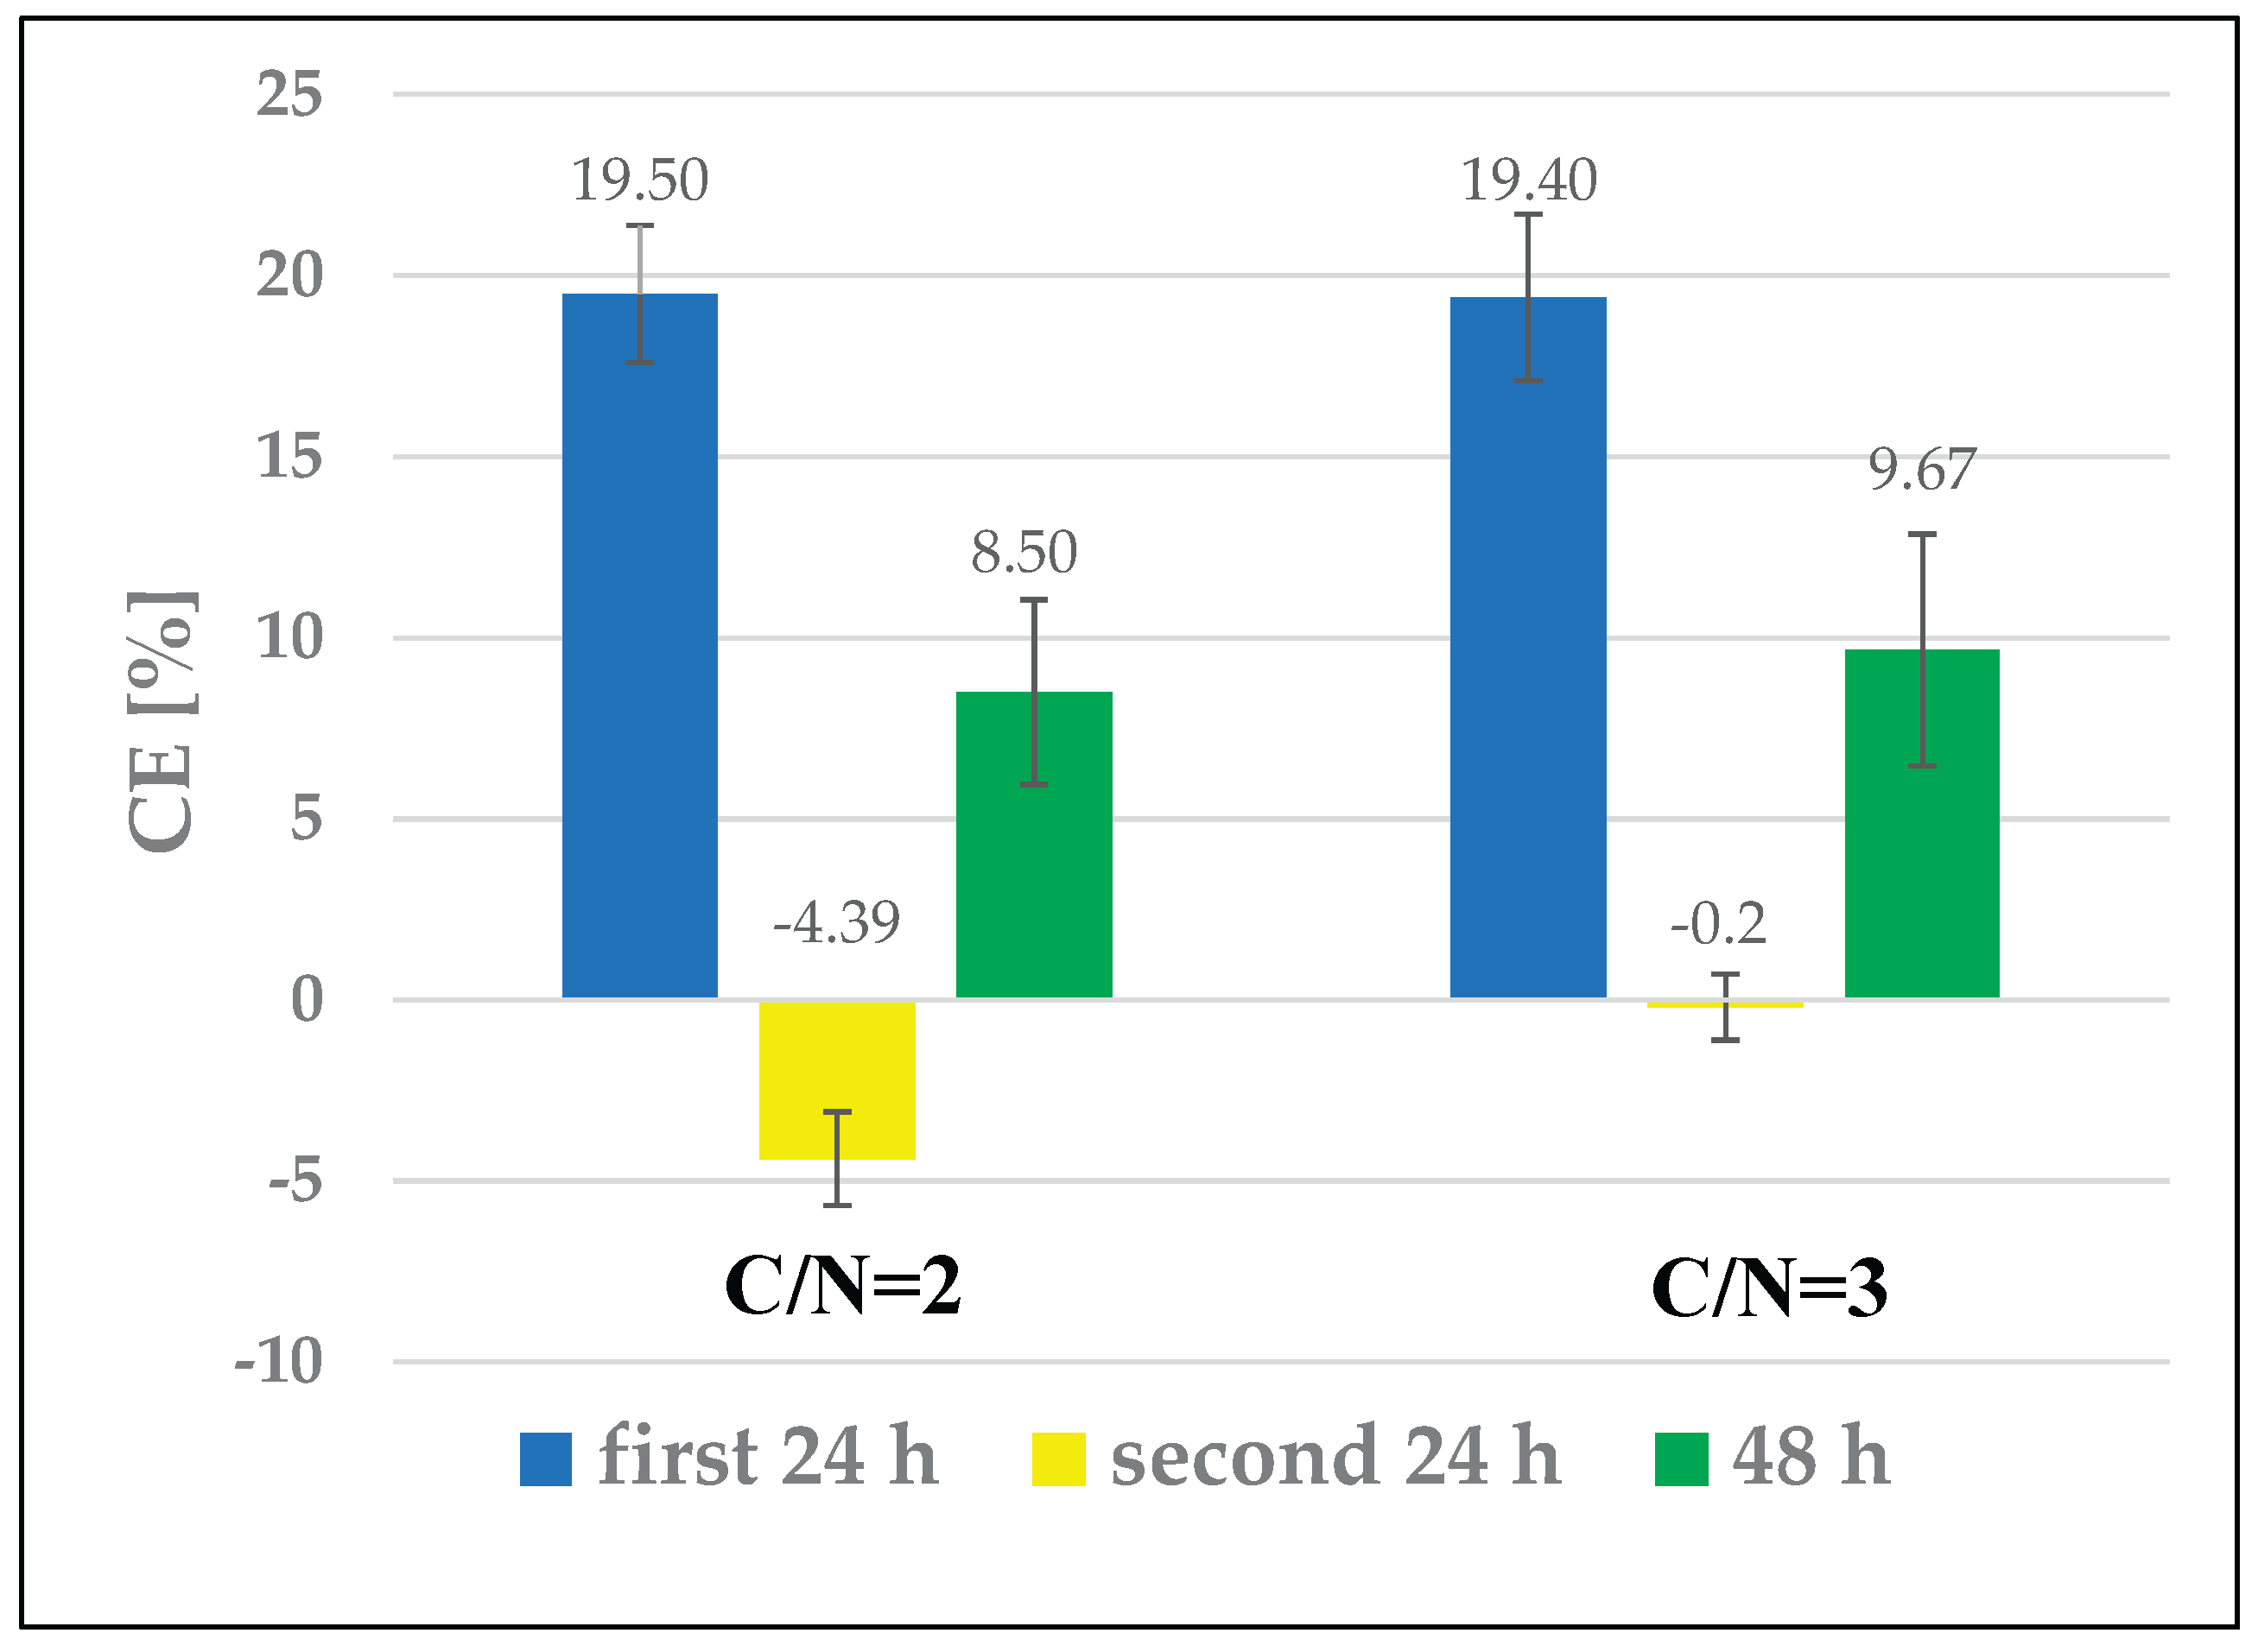
Figure 14.
Influence of HRT and C/N ratio on electric power consumption in the removal of phosphorus in REBDC.
Figure 14.
Influence of HRT and C/N ratio on electric power consumption in the removal of phosphorus in REBDC.
Disclaimer/Publisher’s Note: The statements, opinions and data contained in all publications are solely those of the individual author(s) and contributor(s) and not of MDPI and/or the editor(s). MDPI and/or the editor(s) disclaim responsibility for any injury to people or property resulting from any ideas, methods, instructions or products referred to in the content. |
© 2026 by the authors. Licensee MDPI, Basel, Switzerland. This article is an open access article distributed under the terms and conditions of the Creative Commons Attribution (CC BY) license (http://creativecommons.org/licenses/by/4.0/).
Copyright: This open access article is published under a Creative Commons CC BY 4.0 license, which permit the free download, distribution, and reuse, provided that the author and preprint are cited in any reuse.


