Submitted:
11 February 2026
Posted:
11 February 2026
You are already at the latest version
Abstract
Testicular metabolism can be noninvasively assessed using FDG-PET/CT, which provides insights into physiological and age-related changes. Understanding normal testicular FDG uptake is essential to distinguish between benign variation and pathological findings. In this retrospective study, 80 men (mean age 54.7 years, range 26–79) undergoing PET/CT for lung nodule evaluation were analyzed, excluding individuals with testicular disease, prior surgery, or elevated blood glucose (>180 mg/dL). FDG uptake (SUV_mean) and testicular volume were measured for each testis, and correlations with age, blood glucose, and volume were assessed using standard statistical methods. The mean testicular SUV_mean was 2.62 ± 0.50, showing a significant negative correlation with age and a weak positive correlation with testicular volume. After adjusting for volume, the negative association with age persisted, while no significant relationship with blood glucose was observed. These findings indicate that physiological testicular FDG uptake gradually declines with age, reflecting both metabolic and structural alterations. Recognizing these normal patterns is critical for accurate PET/CT interpretation and reducing the risk of false-positive findings.
Keywords:
testis
; FDG
; physiological uptake
; aging
1. Introduction
18F-fluoro-2-deoxyglucose (FDG) positron emission tomography (PET) is widely used to image tumor glucose metabolism [1]; however, physiological uptake in normal tissues can mimic pathology [2], requiring familiarity with normal patterns. FDG accumulation occurs in multiple organs, including the head and neck [3,4], endometrium and ovary [5,6], and breast [7].
The testes demonstrate variable FDG uptake due to metabolic activity. Recognizing normal uptake patterns is essential to prevent diagnostic errors [8,9,10]. This study ecamines age-related and structural factors influencing testicular FDG uptake.
We quantified testicular FDG uptake in healthy men to investigate whether it correlates with age, blood glucose and testicular volume, aiming to establish values that distinguish normal from abnormal testicular metabolic activity on PET/ computered tomography (CT).
2. Materials and Methods
2.1. Study Population
FDG-PET/CT scans were retrospectively analyzed in 83 male matients referred for evaluation of solitary pulmonary nodules. After three patients with pre-scan blood glucose levels exceeding 180 mg/dL were excluded, the final study cohort comprised 80 men with no history of chemotherapy, pelvic or testicular surgery, prostate cancer, orchiectomy, or hormonal therapy, with no evidence of testicular pathology on PET/CT or in their clinical records.
Participants were stratified into six age groups: Group A, 20-29 years (n = 9); Group B, 30-39 years (n = 12); Group C, 40-49 years (n = 16); Group D, 50-59 years (n = 17); Group E, 60-69 years (n = 15); and Group F, 70-79 years (n = 11).
In summary, the mean age of the study population ws 54.7 ± 15.2 years (range, 26-79 years). All procedures were performed in accordance with institutional PET center protocols, and written informed consent was obtainde from all participants before imaging.
All procedures were performed in accordance with institutional PET center protocols, and written informed consent was obtained from all participants before imaging.
The study was conducted in accordance with the principles of the Declaration of Helsinki, and ethical approval was obtained from the Ethics Committee of Mersin City Training and Research Hospital.
2.2. FDG-PET/CT Protocol
All PET/CT studies were performed using a Discovery IQ scanner (GE Healthcare, Waukesha, WI,USA). Patients fasted for at least six hours before the examination. FDG was administered intravenously at a standardized dose of 144 µCi/kg. this was followed by a 150 mL saline flush. After a 60-minute uptake period in the supine position, whole-body PET/CT imaging was acquired from the vertex to the proximal thighs.
To monitor potential confounders, blood glucose levels were measured immediately before FDG injection, with an upper acceptable limit of 180 mg/dL.
CT acquisition parameters were: 110 Kv, 70 mA, and 0.75 mm collimation. PET data were collected in 7-9 bed positions, depending on patient height. The acquisition time was 2.5 minutes per bed position. PET images were attenuation-corrected with CT data and reconstructed in axial, sagittal, and coronal planes. Slice thickness was 5mm.
2.3. Image Analysis
Testes were identified on low-dose CT images as oval or round soft-tissue structures (Figure 1). These structures typically exhibit density values between 30 and 50 Hounsfield units. Visual assessment and standardized region-of-interest (ROI) placement were employed instead of fixed cutoff values.
For each testis, a circular or oval ROI was placed to encompass the tissue. The total area was multiplied by the slice thickness of 5 mm to calculate volume. Testicular long axis was also recorded for reference.
PET images were used to automatically estimate the mean FDG uptake within each testicular region (Figure 2). Adjacent tissues and unrelated signals were excluded.
2.4. Statistical Analysis
Pearson’s correlation was used to assess associations between testicular FDG uptake and age, blood glucose, and size. In addition, the relationship between testicular size and age was also evaluated. Potential confounding effects on FDG results were controlled using appropriate statistical methods.
Differences among the six age groups were assessed using t-tests with Bonferroni correction for multiple comparisons. Associations between FDG dose or body weight and uptake were also evaluated. Statistical significance was p ≤ 0.05.
Statistical analyses were performed using SPSS version 26.0.
All subjects gave their informed consent for inclusion before they participated in the study. The study was conducted in accordance with the Declaration of Helsinki, and the protocol was approved by the Ethics Committee of the Mersin City Training and Research Hospital (approval number, 2023-86).
3. Results
3.1. SUVmean and Blood Glucose
The mean blood glucose level before FDG administration was 101.8 ± 19.9 mg/dL (range, 68-172 mg/dL). None of the participants received insulin before imaging. There was no significant correlation between pre-scan blood glucose level and testicular SUVmean (r = -0.057, p = 0.372) (Table 1).
3.2. SUVmean and Age
The mean testicular SUVmean across 160 testes from 80 participants was 2.62 ± 0.50 (range, 1.31-4.11).
Group-wise mean SUVmean values were as follows: Group A, 3.00 ± 0.46; Group B, 2.81 ± 0.48; Group C, 2.63 ± 0.37; Group D, 2.68 ± 0.43; Group E, 2.58 ± 0.50; and Group F, 2.33 ± 0.48 (Table 1).
After Bonferroni correction, significant differences were observed between Groups A and F, Group B and F, and Group D and F.
Overall, SUVmean demonstrated a modest but significant negative correlation with age (r = -0.210, p < 0.0001). This findings indicates a gradual decline in testicular FDG uptake with age.
3.3. SUVmean and Testicular Volume
A weak but significant positive correlation was found between SUVmean and mean testicular volume (r = +0.135, p < 0.0001) (Table 1). Partial correlation analysis adjusted for testicular volume confirmed that the inverse relationship between SUVmean and age remained significant (r = -0.220, p < 0.001). This suggestes that reduced testicular metabolic activity with age is not due only to volume loss.
No significant correlation was identified between SUVmean and either the administered FDG dose or body weight.
3.4. Testicular Volume and Age
The mean testicular volume for 160 testes was 20.45 ± 5.9 cm³ (range, 3.5-38.4 cm³).
Group-wise mean testicular volumes were: Group A: 26.5 ± 6.1; Group B: 22.6 ± 6.3; Group C: 21.1 ± 6.3; Group D: 19 ± 5.9; Group E: 20.0 ± 7.3; Group F: 18.5 ± 7.1.
After Bonferroni correction, a significant difference in bilateral testicular SUVmean was observed between Group B and F.
A weak negative correlation was noted between age and testicular volume (r = -0.129, p < 0.0001) (Table 2).
4. Discussion
This study examined physiological FDG uptake in testes across a broad age range and its relationships with age, blood glucose, and testicular volume. The mean SUVmean was 2.62 ± 0.50, showing a modest, significant negative correlation with age (r = −0.210, P < 0.0001), independent of testicular volume. No significant correlation was found between blood glucose and testicular FDG uptake, and a weak positive correlation was noted for testicular volume. These results indicate a gradual decline in testicular glucose metabolism with age, involving both atrophy and metabolic/endocrine alterations.
Our results align with previous studies documenting an inverse association between age and testicular FDG uptake. For instance, Kitajima et al. [8] first reported a significant age-dependent reduction in testicular SUV in healthy men, suggesting decreased metabolic activity of germ and Leydig cells. Similarly, Harper et al. [11] and Parida et al. [12] confirmed progressive declines in mean SUVmean with aging, independent of FDG dose or glucose levels. Meij-de Vries et al. [9] also established normative SUV ranges for healthy young men comparable to our youngest group (mean SUVmean ≈ 3.0), supporting our findings.
Physiologically, the testes show high metabolic activity due to continuous spermatogenesis and steroidogenesis, both of which need abundant glucose. Mechanistically, FDG uptake in the testis mainly reflects glucose transport via GLUT transporters and glycolytic activity in Sertoli and Leydig cells. As age advances, decreased Leydig cell number and function, and reduced testosterone synthesis, are well documented [13,14,15,16]. Experimental data further show that aging Leydig cells have impaired steroidogenic enzyme expression and mitochondrial function [15]. A decline in serum testosterone links with reduced testicular glucose metabolism [14,16,17]. Thus, the observed age-related decline in SUV_mean in our study likely reflects a physiological reduction in both germ cell energy demand and Leydig cell metabolic activity.
Hormonal and cytological studies provide additional insight into this relationship. Moon et al. [17] demonstrated a positive correlation between serum testosterone and testicular FDG uptake, indicating that endocrine function modulates metabolic activity visualized on PET/CT. Similarly, age-related Leydig cell senescence and decreased responsiveness to LH stimulation have been reported [16], which may explain the persistent decline in FDG accumulation observed even after adjusting for testicular volume in our study. Furthermore, single-cell transcriptomic analyses [13] have revealed that testicular aging is associated with decreased expression of glycolytic and oxidative phosphorylation genes, consistent with our metabolic imaging findings.
The absence of correlation between blood glucose and SUVmean in our cohort supports previous findings that testicular FDG uptake reflects intrinsic metabolic activity rather than systemic glucose fluctuations (9, 12). This observation also parallels physiological data from other hormonally active organs, such as the ovaries and adrenal glands, in which metabolic tracer uptake varies with endocrine activity rather than circulating glucose concentration [1,3,5].
Collectively, the present data and prior literature indicate that physiological testicular FDG uptake declines progressively with age due to metabolic and hormonal changes associated with gonadal senescence. Recognition of this normal age-related pattern is important for clinical interpretation of PET/CT scans, particularly in distinguishing physiological from pathological uptake in the scrotal region [4,10,13]. Future studies incorporating concurrent hormonal assays, such as serum testosterone and LH/FSH levels, may further elucidate the relationship between testicular metabolism and endocrine aging.
Limitations
Several limitations should be acknowledged.
First, serum levels of reproductive hormones such as testosterone, LH, and FSH were not available for correlation, which limits interpretation of the metabolic–endocrine relationship. Second, the study was cross-sectional; longitudinal assessment could better capture dynamic metabolic changes over time. Third, partial-volume effects and differences in scanner calibration may have influenced absolute SUV values despite uniform imaging protocols.
Finally, the study population consisted solely of men without known testicular disease, and the findings may not be generalizable to patients with subclinical or treated gonadal disorders.
Future research that integrates simultaneous hormonal profiling, histopathological correlation, and advanced metabolic imaging using tracers such as 18F-FLT or FAPI is warranted to further elucidate the mechanisms underlying age-related testicular metabolic decline.
5. Conclusions
This study demonstrates a significant but modest age-related decline in physiological 18F-FDG uptake in the testes of healthy adult men. The reduction in SUV_mean occurs independently of testicular volume, indicating that testicular glucose metabolism decreases with advancing age due to intrinsic metabolic and endocrine alterations rather than solely structural atrophy. No association was found between serum glucose level and testicular FDG uptake, supporting the notion that testicular metabolic activity reflects local physiological regulation rather than systemic glycemia. Recognition of this age-dependent physiological pattern is essential for accurate interpretation of PET/CT findings in the scrotal region, helping to avoid misdiagnosis of benign metabolic variation as pathological uptake.
Supplementary Materials
The following supporting information can be downloaded at the website of this paper posted on Preprints.org.
Author Contributions
Conceptualization, M.K.; methodology, M.K.; software, M.K.; validation, M.K.; formal analysis, M.K.; investigation, M.K.; resources, M.K.; data curation, M.K.; writing—original draft preparation, M.K.; writing—review and editing, M.K.; visualization, M.K.; supervision, M.K.; project administration, M.K.; funding acquisition, M.K. All authors have read and agreed to the published version of the manuscript.
Funding
This research received no external funding.
Institutional Review Board Statement
The study was conducted in accordance with the Declaration of Helsinki, and approved by the Ethics Committee of the Mersin Provincial Health Directorate-Mersin City Training and Research Hospital (approval date-number, 2023-86).
Informed Consent Statement
Informed consent was obtained from all subjects involved in the study. Written informed consent has been obtained from the patients to publish this paper.
Data Availability Statement
The data presented in this study are available on reasonable request from the corresponding author. The data are not publicly available due to ethical and privacy restrictions involving human participants.
Conflicts of Interest
The authors declare no conflicts of interest. The funders had no role in the design of the study; in the collection, analyses, or interpretation of data; in the writing of the manuscript; or in the decision to publish the results.
References
- Choi J, Chae Y, Kang BT, Lee S. An evaluation of the physiological uptake range of 18F-fluoro-2-deoxy-D-glucose in normal ovaries of seven dogs using positron emission tomography/computed tomography. Front Vet Sci. 2024 Feb 2;11:1343695.
- Olkowski C, Fernandes B, Griffiths GL, Lin F, Choyke PL. Preclinical Imaging of Prostate Cancer. Semin Nucl Med. 2023 Sep;53(5):644-662.
- Lee H, Hwang KH. Unexpected focal fluorodeoxyglucose uptake in main organs; pass through or pass by? World J Clin Cases. 2024 Apr 16;12(11):1885-1899.
- Blodgett TM, Fukui MB, Snyderman CH, et al. Combined PET-CT in the head and neck: part 1. Physiologic, altered physiologic, and artifactual FDG uptake. Radiographics. 2005 Jul-Aug;25(4):897-912.
- Narayanan P, Sahdev A. The role of 18F-FDG PET CT in common gynaecological malignancies. Br J Radiol. 2017 Nov;90(1079):20170283.
- Li T, Zhang J, Yan Y, Tan M, Chen Y. Applications of FAPI PET/CT in the diagnosis and treatment of breast and the most common gynecologic malignancies: a literature review. Front Oncol. 2024 Mar 5;14:1358070.
- Mori M, Fujioka T, Ichikawa R, et al. Comparison of 18F-fluorothymidine Positron Emission Tomography/Computed Tomography and 18F-fluorodeoxyglucose Positron Emission Tomography/Computed Tomography in Patients with Breast Cancer. Tomography. 2022 Oct 11;8(5):2533-2546.
- Kitajima K, Nakamoto Y, Senda M, Onishi Y, Okizuka H, Sugimura K. Normal uptake of 18F-FDG in the testis: an assessment by PET/CT. Ann Nucl Med. 2007 Sep;21(7):405-10.
- Meij-de Vries A, Knol RJ, Lazarenko SV, Meijer RW, van der Plas EM, Heij HA. Uptake of (18)F-fluoro-2-deoxyglucose in the Healthy Testes of Young Men as Assessed by Positron Emission Tomography/Computed Tomography; Including the Inter- and Intra-observer Variation. World J Nucl Med. 2014 May;13(2):88-93.
- Townsend DW. Positron emission tomography/computed tomography. Semin Nucl Med. 2008 May;38(3):152-66.
- Harper L, Simmons C, Nathan M, Thanarajasingam G, Kim H, Young J. Establishing Normal Testicular 18F-FDG PET/CT SUVs. AJR Am J Roentgenol. 2021 Jun;216(6):1634-1640.
- Parida GK, Muthu GS, Suman A, Kumar A, Mitra S. Physiologic Testicular Uptake of 18-F Fluorodeoxyglucose in the Indian Population. Indian J Nucl Med. 2021 Jul-Sep;36(3):261-266.
- Nie X, Munyoki SK, Sukhwani M, et al. Single-cell analysis of human testis aging and correlation with elevated body mass index. Dev Cell. 2022 May 9;57(9):1160-1176.e5.
- Anawalt BD, Matsumoto AM. Aging and androgens: Physiology and clinical implications. Rev Endocr Metab Disord. 2022 Dec;23(6):1123-1137.
- Wang Y, Chen F, Ye L, Zirkin B, Chen H. Steroidogenesis in Leydig cells: effects of aging and environmental factors. Reproduction. 2017 Oct;154(4):R111-R122.
- Chen H, Hardy MP, Zirkin BR. Age-related decreases in Leydig cell testosterone production are not restored by exposure to LH in vitro. Endocrinology 2002;143:1637–42.
- Moon SH, Eo JS, Lee JJ, Chung JK, Lee DS, Lee MC. (18)F-FDG Uptake of Human Testis on PET/CT: Correlation with Age, Sex Hormones, and Vasectomy. Nucl Med Mol Imaging. 2011 Dec;45(4):291-8.
Figure 1.
A 32-year-old man patient. A: Axial computed tomography image of testis. B: Axial PET/CT image of with symmetric testicular uptake of 18F-FDG (white arrow) C: Coronal PET/CT image of with symmetric testicular uptake of 18F-FDG (white arrow), and D: maximum intensity projection image. PET/CT=positron emission tomography/computed tomography, 18F-FDG=18F-fluoro-2-deoxyglucose.
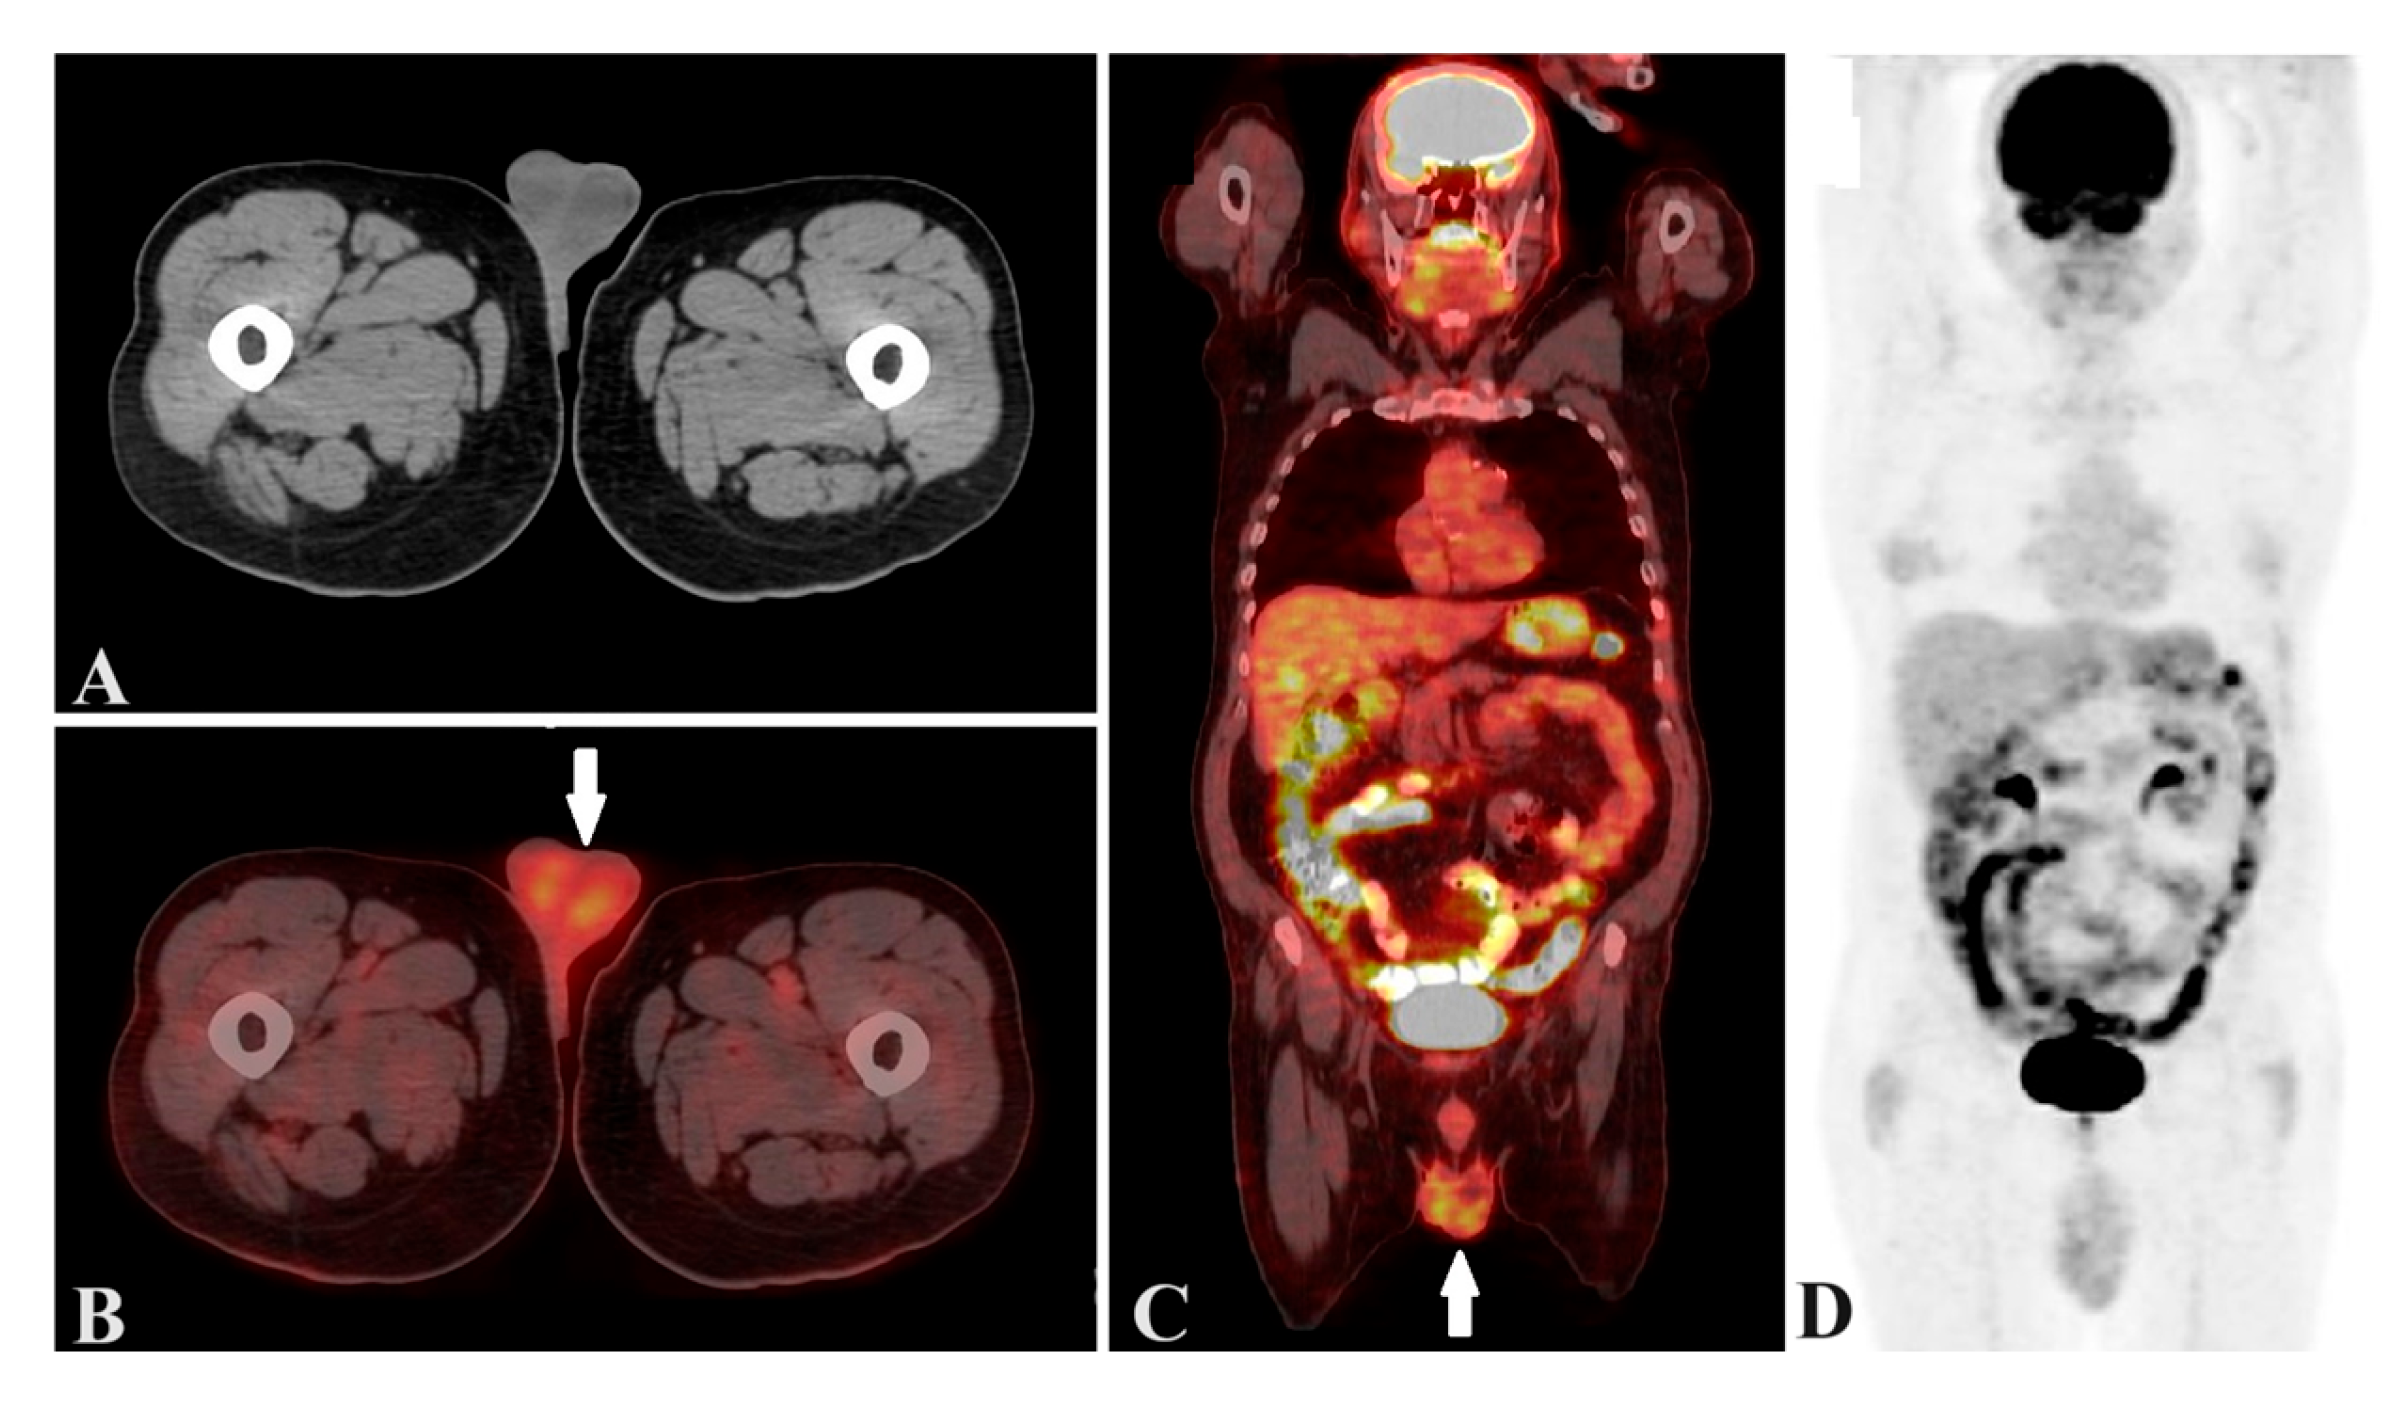
Figure 2.
For each slice, a specific location inside the testis was chosen as the roi. A: Right testicular (red roi) and left testicular (yellow roi) volumes were determined by multiplying the area by the thickness of the slice. B: The mean standardized uptake value of the testis was measured by manually positioning the roi ring (white roi) on PET/CT images. roi = region of interest, PET/CT =positron emission tomography/computed tomography.
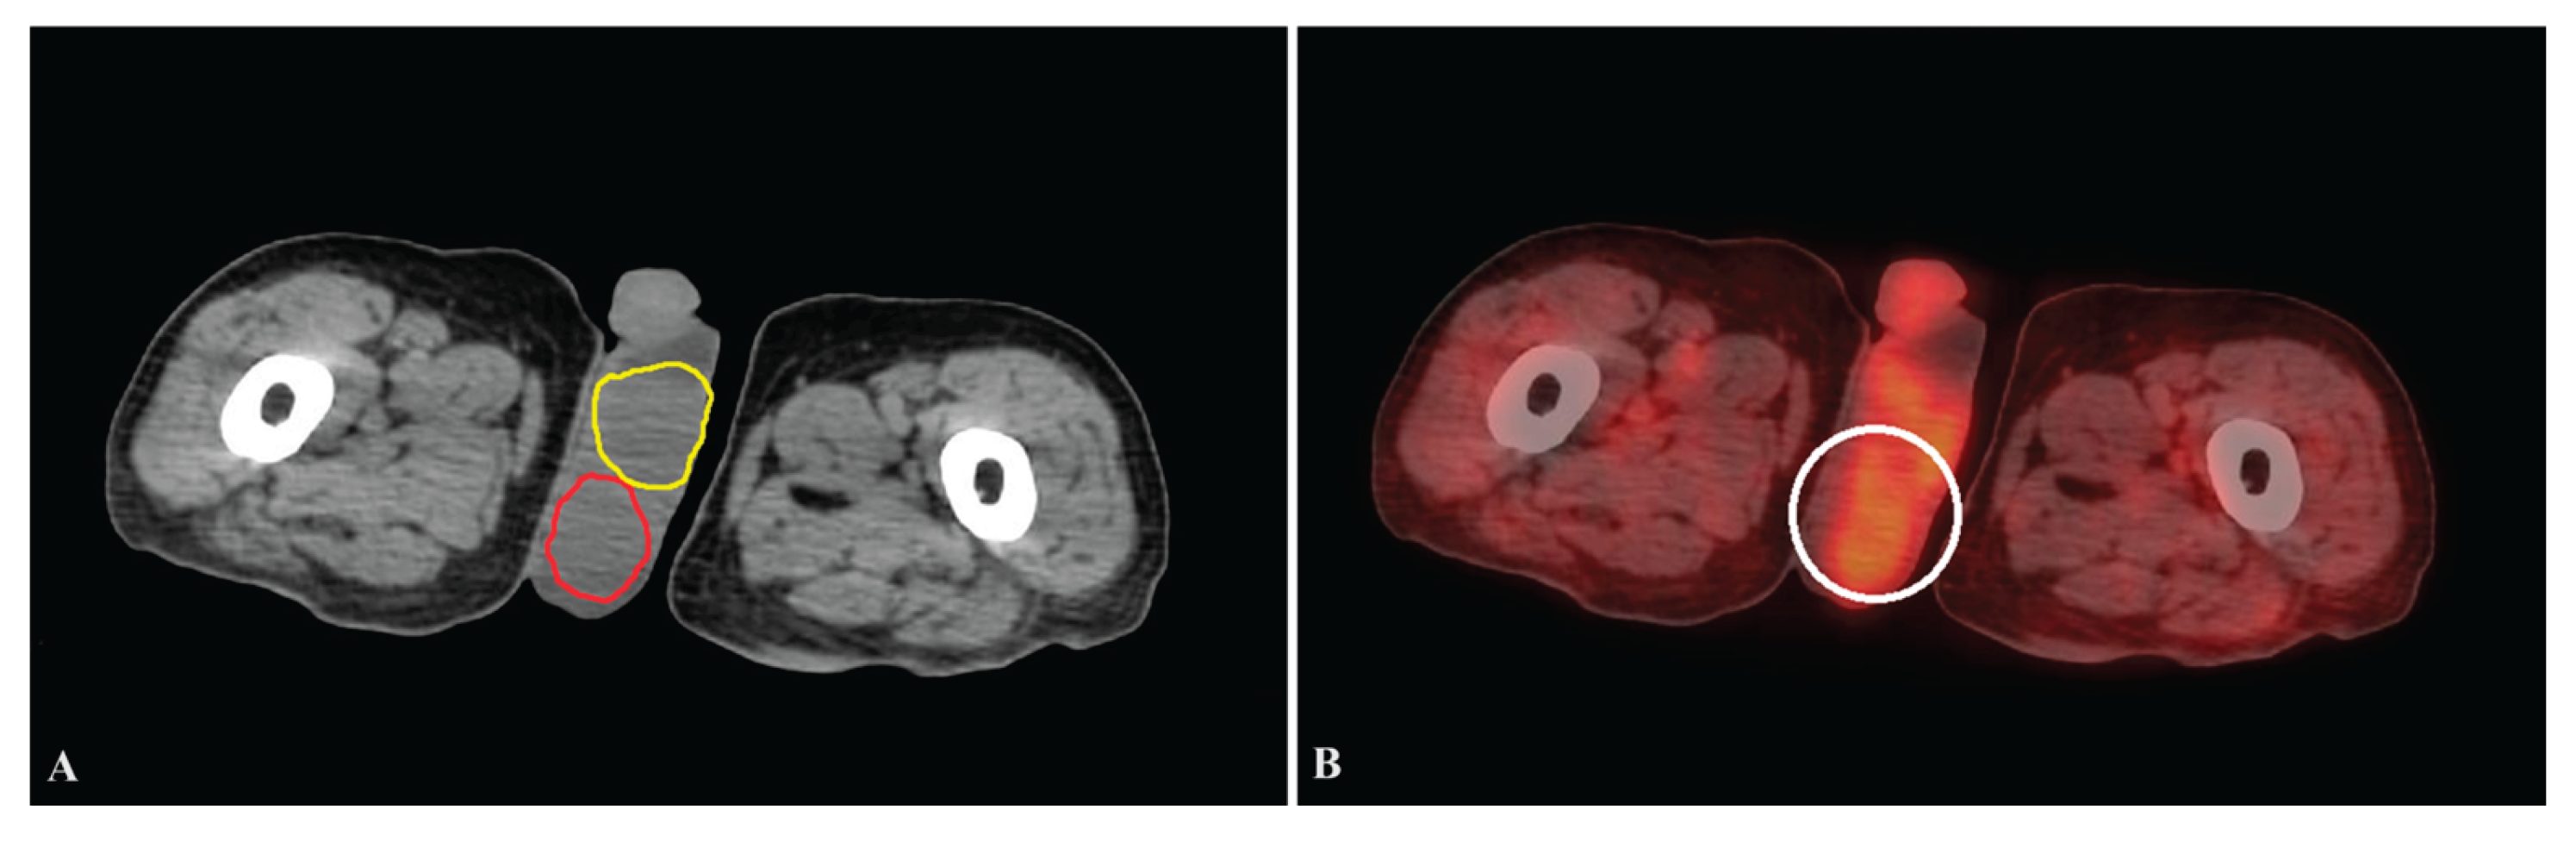

Table 1.
Correlation of testicular mean standardized uptake value between age, blood glucose level, and testicular volume.
Table 1.
Correlation of testicular mean standardized uptake value between age, blood glucose level, and testicular volume.
| Correlation between | Testicular uptake | Correlation co-efficient (r) | p |
| Age | SUV1mean | -0.210 | <0.001 |
| Blood glucose level (mg/dl) | SUVmean | -0.057 | 0.372 |
| Testicular volume (cm3) | SUVmean | +0.135 | <0.001 |
1SUV Standardized uptake value.
Table 2.
Volumetric and FDG uptake measurements of the testes.
| Group | Age | n | Mean SUV2 of testis | Volume (cm3) | ||
| Mean ± SD1 | Range | Mean ± SD | Range | |||
| A | 20-29 | 9 | 3.00 ± 0.46 | 2.43-4.11 | 26.5 ± 6.1 | 17.7-38.05 |
| B | 30-39 | 12 | 2.81 ± 0.48 | 1.89-4.01 | 22.6 ± 6.3 | 3.5-38.4 |
| C | 40-49 | 16 | 2.63 ± 0.37 | 1.49-3.37 | 21.1 ± 6.3 | 11.3-35.2 |
| D | 50-59 | 17 | 2.68 ± 0.43 | 1.60-3.70 | 19.5 ± 5.9 | 8.8-36.2 |
| E | 60-69 | 15 | 2.58 ± 0.50 | 1.51-3.52 | 20.0 ± 7.3 | 9.7-32.7 |
| F | 70-79 | 11 | 2.33 ± 0.48 | 1.31-3.24 | 18.5 ± 7.1 | 7.6-33.0 |
| Total | 80 | 2.62 ± 0.50 | 1.31-4.11 | 20.45 ± 5.9 | 3.5-38.4 | |
1SD Standard deviation, 2SUV Standardized uptake value.
Disclaimer/Publisher’s Note: The statements, opinions and data contained in all publications are solely those of the individual author(s) and contributor(s) and not of MDPI and/or the editor(s). MDPI and/or the editor(s) disclaim responsibility for any injury to people or property resulting from any ideas, methods, instructions or products referred to in the content. |
© 2026 by the author. Licensee MDPI, Basel, Switzerland. This article is an open access article distributed under the terms and conditions of the Creative Commons Attribution (CC BY) license.
Copyright: This open access article is published under a Creative Commons CC BY 4.0 license, which permit the free download, distribution, and reuse, provided that the author and preprint are cited in any reuse.


