
Submitted:
10 February 2026
Posted:
12 February 2026
You are already at the latest version
Abstract
Fungal diseases such as soybean stem canker (SSC), frogeye leaf spot (FLS), and sudden death syndrome (SDS) cause substantial yield losses in the soybean crop worldwide. This study aimed to pyramid major resistance genes and QTLs against these diseases through marker-assisted backcrossing (MABC). Diagnostic SSR markers, linked to Rdm4 (SSC), Rcs3 (FLS), and SDS resistance QTLs, were validated and successfully employed for foreground and background selection in crosses between the elite cultivar A8100RR and the resistant donor ‘Forrest’. Molecular analyses confirmed the effective introgression and fixation of multiple resistance loci in BC₂F₅ lines. Under artificial inoculation, lines R30-11 and R25-13 displayed high resistance levels to Diaporthe aspalathi, Cercospora sojina, Fusarium virguliforme, and F. tucumaniae. Genotype R30-11 exhibited the most consistent resistance across pathogens, while R25-13 combined multi-disease resistance with glyphosate tolerance and stable agronomic performance comparable to commercial cultivars. These results provide the first evidence of successful pyramiding of major resistance genes and QTLs to multiple fungal diseases in soybean through MABC. The developed lines represent valuable germplasm for breeding programs, targeting durable and sustainable disease management.
Keywords:
Cercospora sojina
; Diaporthe aspalathi
; Fusarium spp.
; gene-stacking
; marker-assisted selection (MAS)
; Simple sequence repeats (SSR)
1. Introduction
Soybean (Glycine max (L.) Merrill) is one of the most nutritionally and economically important legume crops worldwide, providing a major source of protein and oil for both human and animal nutrition (Childs et al., 2018). Global soybean production reached approximately 397 million metric tons across 140 million hectares in 2023/24, reflecting its central role in global food and feed systems. However, sustaining soybean productivity is increasingly challenged by biotic and abiotic stresses that significantly reduce yield stability and seed quality (Tripathi et al., 2022). Over recent decades, yield losses attributable to biotic stress have increased markedly, with fungal pathogens representing the most damaging group affecting soybean production at a global scale (Lin et al., 2022; Savary et al., 2019). In the context of climate change and rising food demand, the development of high-yielding cultivars with durable, broad-spectrum disease resistance has become a critical objective of modern soybean breeding programs (Singer et al., 2023).
Among the most economically important fungal diseases of soybean worldwide are soybean stem canker (SSC), frogeye leaf spot (FLS), and sudden death syndrome (SDS), which affect aerial tissues, roots, and vascular systems, respectively (Pioli et al., 1997; Ploper et al., 2001; Scandiani et al., 2004). Although integrated disease management strategies based on fungicides, crop rotation, and seed sanitation are widely used, host genetic resistance remains the most effective, economical, and environmentally sustainable approach for long-term disease control. SSC is a destructive disease that typically manifests from mid-season to crop maturity, often leading to plant death and severe yield losses (Lin et al., 2022). It is caused primarily by two causal agents: Diaporthe aspalathi (E. Jansen, Castl. & Crous), Da (syn. Diaporthe phaseolorum var. meridionalis) and D. caulivora, Dc (Athow & Caldwell) J.M. Santos, Vrandecic & A.J.L. Phillips (syn. D. phaseolorum var. caulivora, Dpc) (Athow, 1951; Fernández & and Hanlin, 1996; Pioli et al., 2003; Udayanga et al., 2015). Five non-allelic resistance (R) genes (Rdm1–Rdm5) control SSC caused by D. aspalathi (Bowers et al., 1993; Chiesa et al., 2009; Kilen et al., 1985; Tyler, 1996), although none individually provide complete resistance across all pathogen races (Pioli et al., 2003). Particularly, Rdm4 and Rdm5 were mapped on soybean chromosome 8, enabling the identification of tightly linked molecular markers suitable for marker-assisted selection (MAS) (Chiesa et al., 2017). Previous studies have demonstrated that Rdm4 is a particularly stable and effective source of resistance across diverse genetic backgrounds (Chiesa et al., 2009).
FLS, caused by Cercospora sojina Hara, reduces yields up to 60 % under warm, humid conditions (Gu et al., 2021; Mian et al., 2009). The pathogen exhibits high genetic and physiological diversity, with multiple races reported worldwide (Kim et al., 2013). Resistance to FLS is conferred by several dominant genes, including Rcs1, Rcs2, Rcs3, and RcsPeking (Athow, 1951; Baker et al., 1999; Mian et al., 1998; Yang et al., 2001), later an additional resistance sources, RcsMte.Rdo., was identified in cv. ‘Monte Redondo’ (Bulos, personal communication). Notably, Rcs3 has shown broad effectiveness against all currently characterized isolates (McDonald et al., 2023). The genetic mapping of Rcs3 led to the identification of diagnostic SSR markers such as Satt244, which have been widely used to accelerate the development of FLS-resistant cultivars through MAS (Mian et al., 2009; Yang et al., 2001).
SDS, caused by soil-borne species of Fusarium, including F. virguliforme and F. tucumaniae, represents another major constraint to soybean production across continents (Aoki et al., 2003, 2005). The disease induces root necrosis and toxin-mediated foliar symptoms, resulting in yield losses ranging from 20% to over 80% under favorable conditions (Chang et al., 2018; Hartman et al., 2015; Spampinato et al., 2021). Resistance is conferred by several quantitative trait loci (QTLs) and strongly influenced by environmental factors (Luckew et al., 2012). More than 200 quantitative trait loci (QTLs) associated with SDS resistance have been reported (Bao et al., 2015; Njiti et al., 2002; Wen et al., 2014; Zhang et al., 2015). Interestingly, key QTLs mapped in cv. `Forrest´ explain almost 91 % of resistance variance (Iqbal et al., 2001).
A main goal of current soybean breeding programs is the development of elite cultivars combining high yield potential with durable, broad-spectrum resistance to multiple pathogens. Molecular markers facilitate efficient germplasm screening and enable the identification and combination of specific resistance loci, helping to overcome the narrow genetic base characteristic of modern soybean breeding (Li et al., 2023). In this context, gene pyramiding strategy, defined as the combination of multiple resistance genes and/or QTLs into a single genetic background, through targeted crosses represents a powerful yet underutilized strategy for enhancing disease durability and stability across environments.
Therefore, the aims of this work were: (i) to validate molecular markers (MM) linked to Rdm4-5 and Rcs3, RcsMte.Rdo, and RcsPeking genes; (ii) to identify prevalent alleles conferring resistance to SSC and FLS in elite soybean germplasm using SSR-based genotyping; and (iii) to develop improved soybean lines carrying pyramided resistance to SSC, FLS, and SDS through marker-assisted backcrossing (MABC), providing a breeding strategy with broad applicability for sustainable soybean disease management.
2. Materials and Methods
2.1. Plant Material
A total of 56 soybean genotypes belonging to the Soybean Breeding Program (SBP) of the Estación Experimental Agroindustrial Obispo Colombres (EEAOC) germplasm collection, including commercial varieties and experimental lines, were characterized. Reference genotypes for each disease carrying different R genes were also pheno- and geno-typically evaluated. Cultivar `Dowling´ was used as a reference for Rdm4 presence, cv. `Hutcheson´ for Rdm4 and Rdm5, cv. `Davis´ for Rcs3, cv. `Monte Redondo´ for RcsMte.Rdo, cv. `Peking´ for RcsPeking, and cv. `Forrest´ for SDS QTLS (Table S1). Behavior of genotypes against inoculum of D. aspalathi, C. sojina, and Fusarium spp. under field conditions was recorded in two seasons in macro plots situated at different locations across the northwest region of Argentina (NWA).
2.2. Genotyping
2.2.a. DNA Purification
Seedlings of the cultivars were grown under greenhouse conditions in EEAOC, Las Talitas, Tucumán, Argentina (S 26° 50´, W 65° 12). Young leaf tissue was collected at vegetative stage V2 and flash frozen in liquid nitrogen. Total DNA was extracted using the CTAB method (Saghai-Maroof et al., 1984) with minor modifications. DNA concentration was measured with a spectrophotometer, and DNA quality was assessed by running the samples in agarose gel (0.7 % w/v) electrophoresis, stained with GelRed® (1/100 dilution) (Biotium, Inc., Hayward, CA, USA). DNA concentration of each sample was estimated, and dilutions of 100 ng/μL were prepared.
2.2.b. SSR Amplifications
DNA samples from each cultivar were characterized by amplification of SSR Sat_162 and Satt233 linked to Rdm4 and Rdm5 genes, respectively (Chiesa et al., 2017); Satt244 linked to Rcs3, RcsPeking (Mian et al., 1998) and RcsMte.Rdo (Bulos, personal communication) and Satt163, Satt214, Satt270, Satt309, Satt354, Satt371, Satt570, linked to different QTLs for SDS resistance (Iqbal et al., 2001) (Table S1). SSRs were amplified according to Chiesa et al. (2017) by using a MyCycler Bio-Rad thermal cycler (Hercules, CA, USA). Amplification products were separated by electrophoresis on denaturing polyacrylamide gels in a 4300 DNA Analyzer (LI-COR). Images were analyzed by using the SagaMX AFLP Software (LI-COR). The size of the amplicons was determined by comparison with the LI-COR IRDye 50-700 bp Size Standard (LICOR Biosciences) weight marker.
2.3. Disease Evaluation Under Semi-Controlled Conditions
2.3.1. Soybean Stem Canker
SSC was evaluated under semi-controlled conditions in a greenhouse at the Laboratorio de Ecofisiología Vegetal (LEFIVE) of Instituto de Investigaciones en Ciencias Agrarias de Rosario, Universidad Nacional de Rosario (IICAR-UNR), Zavalla, Santa Fe, Argentina. The phenotyping of the selected genotypes was performed under natural sunlight during the spring of 2019. Inoculation assays were carried out with isolate CCC123-09 of D. aspalathi (Table S2) obtained from Centro de Referencia de Micología (CEREMIC-UNR). For each genotype, 10 inoculated and 10 non-inoculated seedlings were analyzed. All inoculations were performed on seedlings in the fully expanded trifoliate leaf stage V2, evaluated from 7 to 42 days post-inoculation (dpi). Inoculation methodology and phenotypic response of the genotypes were characterized according to Chiesa et al., (2009). The cv. `RA702´ (rdm/rdm) and the experimental line J77-339 (rdm/rdm) were used as susceptible (S) controls (Chiesa et al., 2013); meanwhile, Tracy-M (Rdm1/Rdm1; Rdm2/Rdm2), Crockett (Rdm3/Rdm3), Dowling (Rdm4/Rdm4), and `Hutcheson´ (Rdm4/Rdm4; Rdm5/Rdm5) were used as reference resistant genotypes carrying the known Rdm genes.
2.3.2. Frogeye Leaf Spot
FLS evaluation under semi-controlled conditions was conducted in an inoculation chamber at the laboratory of Biotechnology of EEAOC, Las Talitas, Tucumán, Argentina. Artificial inoculations were carried out with isolate CCC232-10 of C. sojina obtained from CEREMIC (Table S2). For each genotype, the experimental unit consists in five pots with three seedlings each. All inoculations were performed on seedlings in the fully expanded trifoliate leaf stage V3. Two trifoliate leaves per plant were inoculated with 0.3 mL of the conidial suspension adjusted to 6x10⁴ conidia mL−1 on the upper leaf surface (Mian et al., 2009). Untreated plants were sprayed with sterile distilled water. Plants were maintained at a humidity of 80 % and 26 °C for 72 h in the inoculation chamber. Then, the environmental conditions were returned to 26 °C and 40 % of humidity. Plants were visually assessed for disease symptoms at 14 and 21 dpi. Severity of the disease (as % of the leaf area affected with symptoms) was evaluated using a disease evaluation scale based on a protocol proposed by Martins et al. (2004) for end-of-cycle diseases, adapted for FLS. The cv. `Anta 8.2´ (rcs/rcs) and HO6620 were used as susceptibility controls; meanwhile, `Davis´ (Rcs3/Rcs3), `Peking´ (RcsPeking/RcsPeking), and `Monte Redondo´ (RcsMte Rdo/ RcsMte Rdo) were used as resistant control genotypes carrying the known Rcs genes.
2.3.3. Sudden Death Syndrome
SDS evaluation under semi-controlled conditions was conducted in an inoculation chamber at the laboratory of Biotechnology of EEAOC. Inoculation assays were carried out independently with isolates of F. tucumaniae and F. virguliforme obtained from the Phytopathology laboratory of EEAOC (Table S2). Artificial fungal inoculation was performed using the soil infestation method (Hartman et al., 1997; Scandiani et al., 2011). Autoclaved sorghum seeds were infested with five agar plugs (6 mm diameter) of each fungal mycelium and incubated for 2 weeks at 25°C in the dark. A layer of infested sorghum (3 g) was placed at the time of planting before placing seeds in pots (diameter: 8 cm, height: 11 cm) filled with 250 g of GrowMix® Multipro commercial substrate (Terrafertil S.A., Argentina). The experimental design comprised five pots for each genotype and five seedlings per pot. Controls consisted of five pots with five non-inoculated seedlings per genotype. Pots were maintained at 25 ± 3°C, and 30 dpi plants were evaluated for foliar and root severity based on visual assessments, shoot and root fresh weight at 30 dpi as described by Scandiani et al., 2011. Mean foliar and root severity and mean of root weight were averaged for each experimental unit (5 plants per pot). The cv. A8000 was used as susceptible control and cv. Forrest as resistant control.
For the three evaluated diseases, the pathogenicity tests were performed at least three times.
2.4. Validation of MM for SSC and FLS
The accuracy of MMs linked to Rdm4, Rdm5, and Rcs3 genes to predict resistance to SSC and FLS, respectively, was evaluated by correlating and comparing the genotypic and phenotypic data in a set of selected genotypes under semi-controlled conditions with local isolates of Da and C. sojina. Then, to correlate the presence or absence of the MM Sat_162, Satt233, and Satt244 with resistant or susceptible phenotypes, respectively, the Phi coefficient was calculated by regression analysis using the InfoStat softare (Di Rienzo et. al., 2008).
3. Gene Pyramiding Scheme and Marker-Assisted Backcrossing Scheme (MABC)
3.1. Marker-Assisted Backcrossing Scheme (MABC)
Initial cross: Single crosses to obtain the initial F1 were made between the recurrent parent (RP) cv. A8100RR (carrying the alleles linked to the Rdm4 and Rcs3 genes) and as a donor parent (DP) cv. Forrest (carrying all the alleles linked to the QTLs for resistance to SDS) (Figure 1), during the 2015/2016 season at Monte Redondo EEAOC substation, Cruz Alta, Tucumán, Argentina (26°49'25"S 64°51'01" W).
BC1: The F1 plants obtained were analyzed with polymorphic SSR, and hybrids were used to perform the crosses with the RP A8100RR (BC1). The crosses between the effective F1 and RP A8100 were conducted at the field in the 2016/2017 crop season at Monte Redondo EEAOC substation. Seeds BC1F1 were obtained (Figure 1).
BC2: Selected plants at this stage were screened with SSR for selection of the target genes to identify plants with all gene combinations (foreground selection), while background selection was applied to accelerate the recovery of the RP genome. The selected ones were used to perform BC2 with RP in September/October 2017, under greenhouse conditions in the Plant Physiology Laboratory (UNR-IICAR), Zavalla, Santa Fe, Argentina (33°1'52.76"S, 60°53'22.27"W). The BC2F1 seeds obtained were planted in 2018 in field plots at Monte Redondo-EEOAC substation.
Plants carrying the desired resistance loci and higher genetic similarity to the RP were selected and advanced. The BC2F2 seeds were obtained in April of 2018 (Figure 1). Homozygous BC₂F₂ individuals were advanced through the single-seed descent (SSD) method up to the BC₂F₅ generation from the 2019/20 to the 2022/23 crop seasons.
Based on molecular profiles, a set of fixed BC₂F₅ lines carrying all resistance loci was selected and tested to verify the putative stacked resistance loci in the new genetic background (resistance response or phenotypic reaction) against D. aspalathi, C. sojina, F. virguliforme, and F. tucumaniae, as described previously.
3.2. Molecular Marker Analysis
Foreground selection. After the initial crosses in each generation (F1, BC₁ to BC5), seeds obtained were planted, leaf samples collected, and the extraction of genomic DNA from each plant was performed. A parental polymorphism survey for target genes Rdm4, Rcs3, and SDS7-1, SDS7-2, SDS7-3, SDS7-5, SDS15-9 was conducted using linked SSR to ensure the presence of all target loci (Table S1). Individuals carrying the alleles linked to the resistance loci were crossed to the RP cv. A8100RR (Figure 1).
Background selection. Simultaneously in BC2, the background selection was conducted to identify plants with maximum recovery and proportion of the genome of the RP. A set of 38 SSR (highly polymorphic, informative, randomly distributed in the 20 soybean molecular linkage groups (MLG) and that are used routinely in the EEAOC germplasm bank for genotyping), were tested. Similarity between the RC2F1 lines and the RP was calculated taking into account only the polymorphic SSR. A distance matrix was calculated with the Jaccard coefficient using Info-Gen software (Di Rienzo et al., 2008).
4. Evaluation of Agronomic Performance
Herbicide test. The selected lines BC2F5 R30-6, 30-9, 30-11, 25-13 were tested for herbicide resistance under greenhouse conditions. Plants were grown in pots (diameter: 20 cm, height: 50 cm) filled with 750 g of GrowMix® Multipro commercial substrate (Terrafertil S.A., Argentina). Ten pots of each line were planted with five seeds/pot. The herbicide glyphosate 1.5 % (v/v) was applied at growth stage V4. Also, two cultivars glyphosate-tolerant A8100 (RR) and glyphosate-sensitive Macxy, were included as controls.
Yield evaluation. Line R25-13 was evaluated for its performance by comparative test of yield in two cropping seasons (2023/2024 and 20124/2025) at three different experimental locations that represent different environments: Monte Redondo (26°49'25"S 64°51'01"W), Piedra Blanca (26°37'57"S 64°42'09"W) and Piedra Buena (26°45'21"S 64°39'59"W), Tucumán, Argentina. Plots were arranged in a complete randomized block design, with three repetitions and 2.6 m2 per plot. The plant density was 18 plants per lineal meter. DM 67i70 and CZ 6505 were used as commercial standard genotypes. Insects, fungal pathogens, and weeds were chemically controlled following local agronomic practices. Data on agronomic traits as plant height, lodging tolerance, 1000 seeds weight, were recorded.
5. Statistical Analysis
The disease response of the pyramided lines to SSC and FLS was evaluated using a generalized linear model (GLMs) with genotype as a fixed effect and a binomial distribution. Mean comparisons were performed using Fisher’s LSD test (α = 0.05).
For SDS, a linear model was applied to analyze root biomass, including genotype, inoculation treatment (inoculated/non-inoculated), and their interaction as fixed effects. A varIdent variance structure was used to allow heterogeneous variances between the two inoculation levels (k = 2). For both foliar and root disease severity index (DSI), linear models were fitted with genotype as a fixed effect, also applying a varIdent variance structure (k = 2). In all SDS analyses, mean comparisons were performed using the DGC test at α = 0.05. All analyses were conducted in Navure software v. 2023 (Di Rienzo, 2025).
6. Results
Molecular Screening for Rdm4 and Rdm5 Resistance Genes
Sixty soybean genotypes, including reference lines and key progenitors from the elite breeding germplasm panel, were selected based on their phenotypic reaction to D. aspalathi (disease response) under natural inoculum pressure (Table S3). Then, these cultivars were genotyped using SSR Sat_162 and Satt233 to detect the presence of Rdm4 and Rdm5 genes, respectively. Reference cultivars carrying different Rdm genes used were: Hutcheson (Rdm4/Rdm4; Rdm5/Rdm5), Dowling (Rdm4/Rdm4), and Tracy-M (Rdm1/Rdm1, Rdm2/Rdm2), while J77-339 (rdm/rdm) was used as susceptible control (Table S3).
Under natural inoculum pressure, 47 genotypes were classified as resistant (R), four as moderately resistant (MR), and ten as susceptible (S) to D. aspalathi. Among the 51 genotypes characterized as R or MR, 35 (68.6 %) carried the Sat_162 marker allele linked to the Rdm4 gene in cultivar Hutcheson, seven (13.7 %) carried the Satt233 allele linked to Rdm5, and five genotypes (9.8 %) carried both alleles (Figure S1a). In contrast, from the 10 susceptible genotypes, nine lacked both Sat_162 and Satt233 MM. Within the R/MR group, Sat_162 was absent in 15 genotypes (29 %), while Satt233 was absent in 14 genotypes (27 %). Notably, one susceptible genotype carried the MM Sat_162, whereas none of the susceptible genotypes carried the Satt233 MM. However, in 24 cultivars (39 %), MM Sat_162 was not detected, while the MM Satt233 allele was not found in 23 analyzed cultivars (37%) (Table S3).
The results obtained were analyzed as the frequency of Sat_162 and Satt233 in the selected cultivars. The allele associated with the Rdm4 gene showed a higher frequency of occurrence (0.6) in the set of analyzed genotypes compared to Satt233, linked to the Rdm5 gene, which was found with a frequency of 0.11. In addition, the frequency of the presence of both gene alleles was 0.08 (Figure S1b).
Correlation Analysis Between Phenotypic Reaction to SSC and the MM Presence
From the 60 previously screened soybean cultivars, a set of 17 were artificially inoculated with the CCC123-09 isolate of D. aspalathi and tested for the disease reaction under semi-controlled conditions (Table 1). After 42 dpi, 14 cultivars were characterized as R/MR.
From the 14 cultivars characterized as R or MR, 12 (85.7 %) amplified only the Sat_162 allele (indicating the presence of Rdm4 gene), six (42.8 %) presented Satt233 MM allele (presence of Rdm5 gene) and five (35.7 %) both MM, associated with the Rdm4 and Rdm5 genes, respectively (Table 1). The correlation analysis between the presence of diagnostic MM and the phenotypic response showed a statistically significant positive and directly proportional correlation [r= 0.72, p ≤ 0.05] between the presence of Sat_162 (Rdm4 gene) and the resistance response. However, the correlation between the presence of Satt233 (associated with the Rdm5 gene) and the resistance was not significant [r = 0.32; p = 0.2011].
Molecular Screening for Rcs3, RcsMte.Rdo and RcsPeking Resistance Genes
Sixty genotypes previously screened were also analyzed for the presence of MM-Satt244 linked to Rcs3, RcsMte.Rdo and RcsPeking genes for FLS resistance. Reference cultivars carrying different Rcs genes were included: `Davis´ (Rcs3/Rcs3), `Monte Redondo´ (RcsMte.Rdo./RcsMte.Rdo.), and `Peking´ (RcsPeking/RcsPeking), and Anta 8.2 (rcs/rcs) as susceptible genotype. Phenotypic information was obtained from field evaluation conducted under natural inoculum pressure of C. sojina (Table S4). From this set, 25 (41.6 %) were classified as R, six (10 %) as MR, eight genotypes (13 %) were classified as S, and the rest could not be phenotype under field conditions (Table S4). Genotypic analysis showed that among the 31 genotypes classified as R or MR, only 12 (38.7 %) presented the Satt244 allele associated with the Rcs3 gene, and four (13 %) amplified the alleles associated with RcsMte.Rdo. Meanwhile, the allele of Satt244 associated with RcsPeking was not detected in the analyzed genotypes. Besides, one genotype classified as S presented the RcsMte.Rdo. (Figure S2a).
The haplotype of the Rcs3 gene was more frequent (0.4), followed by the haplotype of the RcsMte.Rdo (0.1), while the haplotype of RcsPeking was found only in the reference cultivar (0.08) (Figure S2b). In 13 cultivars, classified as R/MR under field conditions, the Rcs3, RcsMte.Rdo and RcsPeking alleles were not detected. This could indicate that the observed phenotypic resistance may be associated with the presence of some of the remaining known genes (Rcs1 and Rcs2) or could be due to new sources of resistance to FLS.
Correlation Analysis Between Diagnostic MM and Rcs Genes
From the 60 previously screened soybean cultivars, a set of 14 genotypes was tested for the disease reaction to the isolate CCC232-10 of C. sojina under semi-controlled conditions. The phenotypic responses showed that 12 were characterized as R, and only one as S (Table 2). Among the 12 cultivars characterized as R, six (50 %) showed only the haplotype of the Satt244 linked to the Rcs3 gene, meanwhile RcsMte.Rdo and RcsPeking haplotypes were not found in the tested genotypes (Table 2).
The correlation between the presence of diagnostic MM Satt244 and the phenotypic response to the local isolate of C. sojina was analyzed. The analysis showed a statistically significant correlation, positive and directly proportional, r= 0.55, p ≤ 0.05, between the presence of the diagnostic marker Satt244 and the resistance to C. sojina.
Thus, both SSR Sat_162 and Satt244 were used as diagnostic MM to MAS of the Rdm4 and Rcs genes, respectively.
Molecular Screening for SDS QTLs
A total of 60 soybean genotypes, including the resistant reference genotype Forrest, were analyzed using SSR markers associated with SDS resistance QTLs: Satt214 (SDS7-1); Satt309 (SDS7-2); Satt163 (SDS8-1); Satt570 (SDS7-3); Satt371, Satt357, Satt202, Satt316, and Satt307 (SDS7-5); Satt354 (SDS7-6); Satt270 (SDS 15-9). Among genotypes analyzed, nine (15%) presented QTLS in two different LG: QTLs SDS7-5 on LG C2; SDS 7-2 and SDS 7-3 on LG G (Table 3). Together these QTLs explain about 47% of the resistance. From these, seven genotypes presented markers linked to QTL SDS7-5 on LG C2 (Satt371 and the additional SSR within the same genomic region Satt357, Satt202, Satt316, and Satt307). In addition, SSR markers associated with the SDS7-6 and SDS 15-9 (LG I) and SDS7-1 and SDS8-1 (LG G) (which explain about 35 % of the resistance) did not amplify in any of the molecularly analyzed genotypes, except for the reference genotype Forrest (Table 3). According to the analysis, it was observed that three (SDS7-2, SDS7-3, and SDS7-5) of the five QTLs for SS resistance mapped in the cv. Forrest were found in our elite breeding germplasm panel, with SDS7-5 being the most frequent. Meanwhile cv Forrest was the only one that presented all QTLs for SDS.
Stacking of Resistance Genes
Based on the genotyping survey, donor and recurrent parents carrying complementary resistance loci were selected to implement a marker-assisted backcrossing strategy (MABC).
Initial crosses were carried out between the cv. A8100RR (RP), carrying the alleles linked to the Rdm4 and Rcs3 resistance genes, and cv. Forrest (DP), carrying the QTLs for SDS resistance (Figure 1). After artificial crossing, 46 putative F1 hybrid seeds were obtained in 2016/17. Then, seeds were planted and the effective hybrids were molecularly verified using the specific foreground MM linked to the resistance genes/QTLs associated with the three diseases (SSR Sat_162, Satt233, Satt244). According to this analysis, 33 effective F1 hybrid plants were obtained (71 % effectiveness). The selected F1 hybrids were backcrossed to the RP A8100RR, and the 31 BC1F1 obtained lines were screened with the same specific foreground MM (Figure 1). According to the introgression of the target genes into the RP, a total of nine heterozygous BC1F1 lines were obtained. One line presented all desirable resistance alleles; four lines presented the resistances alleles for Rcs3, Rdm4, and SDS7-1, SDS7-2, and SDS7-3; two lines showed resistance alleles Rcs3 and SDS7-1, SDS7-2 and SDS7-3 (Table S5).
These lines were selected and used to generate BC2 lines. Thirty-one BC₂F₁ lines were obtained. Nine lines were selected based on the presence of different combinations of resistance alleles in heterozygous condition and percentage of recovery of the genome of the RP. Among them, line R30 carried all six resistance loci Rcs3, Rdm4, and the four SDS resistance QTLs (SDS7-1, SDS7-2, SDS7-3, SDS7-5, SDS15-9) and showed a 50% recovery of the recurrent parent genome (RPG). Four lines R25, R27, R28, and R31 carried five of the six resistance loci (Rcs3, Rdm4, SDS7-1, SDS7-2, SDS7-3), with RPG similarities ranging from 70 to 91%. Line R26 carried Rdm4 and the three SDS QTLs (SDS7-1, SDS7-2, SDS7-3), lacking Rcs3, and presented 87% similarity to the recurrent parent. Line R8 carried Rcs3, Rdm4, and two SDS QTLs (SDS7-3 and SDS15-9), while line R1 carried Rcs3, Rdm4 and QTL SDS7-3; their RPG recoveries were 65%, respectively (Table 4).

Table 4.
Summary of the presence of the MM SSRs associated with the resistance genes to the three diseases under study in nine BC2F1 lines.
Table 4.
Summary of the presence of the MM SSRs associated with the resistance genes to the three diseases under study in nine BC2F1 lines.
| BC2F1 | Satt214 SDS7-1 (23.6%*) | Satt309 SDS7-2 (19.6%*) | Satt570 SDS7-3 (18.1%*) | Satt371 SDS7-5 (12%*) | Satt270 SDS15-9 (12%*) | Sat_162 (Rdm4) | Satt244 (Rcs3) | Similarity RP (%) | |
|---|---|---|---|---|---|---|---|---|---|
| R1 | + | + | + | 65 | |||||
| R8 | + | + | + | + | 65 | ||||
| R25b | + | + | + | + | + | + | 65 | ||
| R26 | + | + | + | + | 87 | ||||
| R27 | + | + | + | + | + | 60 | |||
| R28 | + | + | + | + | + | 91 | |||
| R29 | + | + | + | + | 44 | ||||
| R30a | + | + | + | + | + | + | + | 50 | |
| R31 | + | + | + | + | + | 70 |
* % resistance phenotype explained by the QTL. a: BC2F1 line with all the MM-SSR associated with the pyramided resistance genes. b: BC2F1 line with six from seven MM-SSR associated with the pyramided resistance genes.
Table 5.
Agronomic performance of the pyramided line R25-13. Data show mean values of yield and plant height of the pyramided line R25-13 and the commercial cultivars DM 67i70 and CZ 6505 across three environments during two consecutive growing seasons.
Table 5.
Agronomic performance of the pyramided line R25-13. Data show mean values of yield and plant height of the pyramided line R25-13 and the commercial cultivars DM 67i70 and CZ 6505 across three environments during two consecutive growing seasons.
| Crop Season | Location | Genotype identity | Yield (kg/ha)* | Plant high (cm)* |
| 2023/2024 | Monte redondo | R25-13 | 3.180 | 80 |
| DM 67i70# | 3.159 | 68 | ||
| Piedra Blanca | R25-13 | 3.510 | 75 | |
| CZ 6505# | 3.933 | 90 | ||
| Piedra Buena | R25-13 | 2.962 | 78 | |
| CZ 6505# | 3.307 | 81 | ||
| 2024/2025 | Monte redondo | R25-13 | 2.519 | 85 |
| DM 67i70# | 3.159 | 68 | ||
| Piedra Blanca | R25-13 | 3.390 | 60 | |
| DM 67i70# | 3.680 | 95 | ||
| Piedra Buena | R25-13 | 2.324 | 97 | |
| CZ 6505# | 3.307 | 81 |
*Mean values of yield and plant height were recorded over three replicates per location. # The commercial cultivars DM 67i70 and CZ 6505 were used as local commercial standards.
All BC₂F₁ lines carrying combinations of three or more resistance loci were self-pollinated to produce BC₂F₂ progeny (Figure 1). Then, these lines were subjected to foreground selection with SSR markers linked to the resistance genes to confirm the presence of the target loci in heterozygous condition before fixation. Based on foreground selection, lines BC2F1 R30, which presented all the MM linked to the resistance genes and exhibited the presence of 50 % of the RPG and R25 presented all de MM, except for one SSR inked to QTL SDS7-3, and a highly significant similarity to the RPG, were selected for further development. Line BC₂F₁ R31, was not advanced further as it was lost during the trial.
In the 2019/20 season, BC2F2 lines were obtained, foreground selection was carried out in these lines for identifying the lines carrying a combination of genes/QTLs using the respective foreground markers. Based on these results, four homozygous lines BC2F3 were selected: R30-9, R30-6, R30-11, having all the MMs linked to the resistance genes for the three diseases, and R25-13 with three QTLSDS + Rcs3 + Rdm4 genes. The four lines were self-pollinated and advanced to BC2F5 in the 2022/2023 crop season, and molecular analysis showed that all SSR linked to R genes and QTLS were present was performed with all the SSR mentioned (Table 4).
Phenotypic Validation of the R Gene-Pyramided Lines
Phenotypic resistance to SSC. To validate the functionality of the Rdm4 gene in the genetic background of the four R gene-pyramided lines (BC₂F₅ lines), and consequently, the resistance to D. aspalathi, artificial inoculation assays were conducted using CCC123-09 isolate (Figure 2). At 42 and 49 dpi, disease response of the pyramided lines showed significant differences among genotypes for severity (F = 10.28, p < 0.0001). The susceptible control cv. RA702 exhibited the highest severity and % of death plants (DP) values: 0.78 in severity and an average 70 % mortality when inoculated. In contrast, the pyramided lines R30-11, R30-6, and R30-9, along with cv. Hutcheson (Rdm4) as the resistant control, formed a statistically homogeneous group with the lowest severity scores. Among them, R30-11 displayed the greatest resistance, with the lowest severity and 0 % DP. The lines R30-6 and R30-9 also exhibited strong resistance with low severity levels and values of 5 % DP and 0 % DP with CCC123-09, respectively. Line R25-13 presented intermediate resistance, with moderate severity and DP values (35 % DP) (Figure 2).
Phenotypic resistance to FLS. To validate the functionality of the Rcs3 gene in the genetic background of the R gene-pyramided lines (BC₂F₅ lines), and consequently the resistance to C. sojina, artificial inoculation assays were conducted (Figure 3). Genotype HO6620 was used as S control, meanwhile cv. A8000RR (Rcs3) was used as R control.
The results showed significant differences among genotypes (F = 14.13, p < 0.0001), indicating a strong genotypic effect on foliar disease severity. The pyramided lines R30-9, R30-11, and R30-6 showed the lowest disease severity, being similar to the resistant cv. A8000RR (α = 0.05). In contrast, the genotype HO6620 showed the highest disease severity and the line R25-13 presented significantly higher disease levels than the rest of the lines (Figure 3). These results suggest that the lines R30-9, R30-11, and R30-6 carrying the MM linked to the Rcs3 gene showed high resistance levels to C. sojina, demonstrating the functionality of the gene, while line R25-13 showed a moderately resistant (MR) phenotype under the evaluated conditions.
Phenotypic Resistance to SDS
To evaluate the phenotypic performance of the BC₂F₅ pyramided lines under the inoculation of a local isolate of F. virguliforme, three variables were analyzed: root dry weight (comparing inoculated and non-inoculated plants), root and foliar disease severity index (DSI) (Figure 4).
Line R30-11 showed the most consistent resistance response, showing no differences when compared with cv. Forrest. It maintained a high root weight under pathogen inoculation (3.17 vs. 3.62 g in the control) and showed a low root and foliar DSI (0.30 and 0.25 respectively), indicating minor symptom development. Line R25-13 had one of the highest root weights in the non-inoculated condition (4.00 g), but exhibited a pronounced reduction under pathogen infection (1.03 g). Despite this, it maintained low root DSI (0.36) and the lowest foliar DSI among the pyramided lines (0.12), suggesting good symptom control but high sensitivity in terms of biomass loss. Line R30-6 showed a substantial reduction in root biomass under infection (from 4.30 to 1.23 g), accompanied by relatively high root DSI (0.56) and a moderate foliar DSI (0.36), indicating a more susceptible profile in both root damage and symptom expression. Similarly, line R30-9 showed a notable decrease in root weight (4.22 to 1.35 g) and presented the highest root DSI (0.57), although foliar DSI remained low (0.30), comparable to the other pyramided lines. Statistical analyses confirmed significant differences in root weight and root DSI among genotypes (p < 0.05), but no significant differences were found in foliar severity. Overall, line R30-11 displayed the best integrated resistance profile after F. virguliforme inoculation, combining reduced disease severity and minimal biomass loss.
Also, to evaluate the impact of F. tucumaniae inoculation, root dry weight, root, and foliar DSI were analyzed across BC₂F₅ pyramided lines. Significant differences among genotypes were observed for all traits (p < 0.05), confirming differential responses to inoculation (Figure S4). Upon inoculation, all pyramided genotypes exhibited a significant reduction in root weight; however, no significant differences were observed among them when compared with the fungicide control (Figure S4). When analyzing foliar and root disease severity, the fungicide-treated control consistently exhibited the lowest severity levels in both tissues. Pyramided lines R30-11 and R25-13 showed similar severity values when measuring foliar and root severity. Line R30-6 also exhibited high severity values in both root and foliar tissues, clustering with more susceptible genotypes. R30-9 showed the highest root and foliar DSI among all lines, clustering separately in both traits, and indicating a more susceptible response. These results demonstrate that the pyramided line R30-11 expresses resistance response against F. virguliforme and F. tucumaniae, indicating the effective incorporation of the QTLs.
Evaluation of Agronomic Performance of Selected Pyramided Lines
The agronomic performance of the BC₂F₅ lines carrying stacked resistance genes was evaluated under field conditions to ensure that the incorporation of multiple disease resistance loci did not compromise key productive traits.
Herbicide test. In herbicide tolerance assays, lines R30-6, R30-9, and R30-11 exhibited visible symptoms of susceptibility 10 days after application. Whereas R25-13 demonstrated tolerance, consistent with the RP background, indicating compatibility with glyphosate-based weed management systems. This characteristic enabled its inclusion in field trials under traditional management practices, allowing for a reliable evaluation of agronomic traits such as plant height, architecture, and yield. Meanwhile, lines R30-6, R30-9, and R30-11 are conventional RR-free genotypes.
Yield Evaluation
Agronomic evaluation of the pyramided line R25-13 was carried out during the 2023/24 and 2024/25 growing seasons at three different locations. Across environments, R25-13 showed comparable plant height, depending on the environment (values between 60 and 97 cm), similar to the commercial standards (60–95 cm) and to the RP A8100RR (~90 cm) and competitive yield performance.
In the 2023/24 season, yields of R25-13 ranged from 2.962 to 3.510 kg/ha (average 3.217 kg/ha), close to the commercial standards (average 3.466 kg/ha). During the 2024/25 season, yields of R25-13 ranged from 2.324 to 3.390 kg/ha (average 2.744 kg/ha), values lower than the commercial standards (average 3.382 kg/ha).
7. Discussion
One of the main factors that limits grain production and causes millions of dollars in economic losses is biotic stress caused by different pathogens. Specifically, SSC, FLS, and SDS are potentially very destructive fungal diseases, considered responsible for severe reductions in yield and grain quality in major production areas (Lin et al., 2022). The use of resistant cultivars is the most effective and sustainable strategy for disease control, reducing direct crop losses and minimizing the use of fungicides; and consequently, its potential negative impact on health and the environment, and the production costs. Therefore, the main objective of this work was to stack the available resistance genes for SSC, FLS, and SDS into an agronomically competitive elite background.
Marker-assisted selection is a widely useful technique and has become a fundamental tool in soybean breeding programs, enabling the early and accurate identification of individuals carrying alleles of interest. This approach accelerates the breeding process and minimizes the need for constant phenotypic evaluations, which are often influenced by environmental variability, particularly for disease resistance, which is highly dependent on the environment. This technology also allows pyramiding more than one resistance gene for the same disease or different ones in the same genotype. This has proven to be a powerful strategy to enhance multiple resistance to diseases, leading to durability and stability (Gebremedhn et al., 2024). In soybean, previous pyramiding efforts had focused on combining resistance genes for a single pathogen, such as Rpp genes for Asian soybean rust (ASR) (Kashiwa et al., 2020; Meira et al., 2022; Panho et al., 2022; Yamanaka et al., 2015; Yamanaka & Hossain, 2019); Rps genes against Phytophthora sojae (Li et al., 2010) or Rsv genes for Soybean Mosaic Virus (SMV) resistance (Saghai Maroof et al., 2008; Shi et al., 2009). Particularly, Wang et al., 2017 combined three SMV resistance genes (Rsc4, Rsc8, and Rsc14Q ) to develop lines highly resistant to multiple virus strains by using linked SSR. For ASR, pyramiding loci such as Rpp2, Rpp3, Rpp4, and Rpp5 has led to an enhanced and more stable resistance compared to single-gene lines (Kato & Soares, 2022). The combination of multiple genes in a single genotype may increase resistance due to the cumulative effects of combined genes (Tripathi et al., 2022).
However, to our knowledge, there are no reports of pyramiding multiple resistance genes for two or more different diseases in soybean. To our knowledge, this is the first report of a gene pyramiding strategy in soybean that combines resistance to three distinct fungal diseases: SSC (D. aspalathi), FLS (C. sojina), and SDS (F. virguliforme and F. tucumaniae). This approach has been successfully implemented in other major crops where the combination of distinct resistance genes has proven to be an effective strategy for durable, broad-spectrum disease control. In rice, three bacterial blight (BB) resistance genes, along with a phosphorus starvation tolerance gene (OsPSTOL 1), were pyramided (Chithrameenal et al., 2018). Moreover, the introgression of the Xa21, Bph14, and Bph15 genes in rice improves resistance to BB and BPH (brown planthopper) (He et al., 2019).
In this work, the availability of SSR linked to the Rdm4, Rcs3 genes and several QTLs for SDS resistance allowed the development of a strategy to identify and select genotypes resistant to SSC, FLS, and SDS (Chiesa et al., 2017; Mengistu et al., 2011; Mian et al., 2009). These MM were used to screen an elite breeding germplasm bank and were highly associated with resistant genotypes tested under natural inoculum pressure. First, MM Sat_162 and Satt244, associated with the Rdm4 and Rcs3 resistance genes (the most prevalent genes in the germplasm bank), respectively, were validated in a panel of soybean genotypes with known field resistance to SSC and FLS, and also confirmed by phenotyping with representative isolates under semi-controlled conditions. As a first result, their consistent association with resistant phenotypes validates their reliability for MAS. The validation of SSR markers linked to major resistance genes was a critical step in the pyramiding strategy implemented in this work. Thus, these diagnostic markers were subsequently used to screen genotypes carrying the target alleles, and then in each backcross generation.
In soybean, MABC has been effectively used to introduce single as well as polygenic traits, demonstrating accelerated breeding cycles (Santana et al., 2014; Shi et al., 2009; Wang et al., 2017; Zhang et al., 2022). Furthermore, MABC has been proven to be effective in improving quantitative traits that contribute to soybean nutritional value, such as seed protein content and oil quality (Pham et al., 2011; Zhang et al., 2015).
In this study, MABC with a two-step approach was used: gene pyramiding and gene fixation through backcrossing and selfing. Introgression of multiple loci through conventional breeding requires multiple generations and extensive phenotyping. This method enables the targeted introgression of multiple resistance alleles while simultaneously recovering the elite genetic background through background selection. The availability of tightly linked diagnostic SSR markers, Sat_162 for Rdm4, Satt244 for Rcs3, and additional markers for SDS QTLs (Satt163, Satt214, Satt270, Satt371, Satt570,) enabled efficient MAS, accelerating the introgression and fixation of the genes in the desired genotypes. The stringent genotyping selection performed in this work at an earlier vegetative stage allowed an increase in the genotyping efficiency. This molecular-assisted approach not only reduced breeding time but also succeeded in the introgression of QTLs and ensured the precise selection of soybean lines with stable, multi-disease resistance.
Moreover, the effectiveness of the pyramided resistances was confirmed through an exhaustive phenotypic validation under artificial inoculation with isolates of D. aspalathi, C. sojina, F. virguliforme, and F. tucumaniae. Disease severity and physiological parameters were evaluated under controlled conditions to assess the level of expression and functional stability of the stacked resistance loci. Among the BC₂F₅ lines developed, two exhibited the most consistent and broad-spectrum resistance across the three fungal diseases. Line R30-11 showed the lowest levels of DSI against FLS and plant mortality against SSC, and maintained high root biomass and low symptom expression under F. virguliforme inoculation. Although more affected by F. tucumaniae, this line still outperformed the other pyramided lines, confirming the effective expression and compatibility of the Rdm4, Rcs3, and SDS resistance QTLs within an elite non-RR genetic background. Meanwhile, line R25-13 also combined resistance to FLS and SSC, with a resistance level to F. virguliforme similar to R30-11 but showing greater susceptibility to F. tucumaniae. Despite this, R25-13 maintained glyphosate tolerance and stable agronomic performance, representing a valuable source of stacked resistances and herbicide tolerance for breeding programs aiming to develop durable, multi-disease-resistant soybean cultivars.
In this study, the pyramided lines carrying Rdm4 and Rcs3 showed a consistently resistant response to D. aspalathi and C. sojina, confirming the stable expression of these major resistance genes. This stability is possible because resistance is largely controlled by single dominant loci (Chiesa et al., 2017; Mian et al., 2009). In contrast, resistance to both Fusarium spp. was more variable among the pyramided lines. First, because the quantitative nature of SDS resistance, where multiple QTLs of small effect contribute to partial resistance. These findings supported the importance of genetic background interactions and highlighted the importance that pyramided lines maintain the stable expression of resistance loci. In addition, the key QTLs mapped in cv. `Forrest´ were identified through inoculation with F. virguliforme (Iqbal et al., 2001); however, its functionality against isolates of Fusarium spp. was demonstrated in this work.
Therefore, our results demonstrate that R30-11 and R25-13 were the promising lines for pre-commercial evaluation. Although line R30-11 exhibited the most consistent resistance against the three fungal diseases and is a suitable candidate for a conventional breeding scheme, line R25-13 revealed glyphosate tolerance, making it a candidate for agronomic trials under conventional herbicide-based weed management. Field evaluation of the R25-13 line revealed competitive agronomic traits, including plant height, lodging resistance, and average yield levels comparable to commercial cultivars, depending on the crop season and the tested environment. The lower yield value obtained in 2024/2025 compared with the 2023/2024 season could be explained because this last season was characterized by water deficit during the grain-filling period. Overall, this demonstrates strong agronomic performance.
Finally, we have successfully obtained two soybean improved lines with enhanced and broad-spectrum resistance to three important fungal diseases with stable performance in terms of yield potential and glyphosate tolerance, making them strong candidates for future cultivar development.
8. Conclusions
This study demonstrates the feasibility of pyramiding resistance loci to multiple fungal diseases in soybean integrating a marker-assisted backcrossing strategy with validated SSR molecular markers. By stacking major resistance genes for soybean stem canker (Rdm4), frogeye leaf spot (Rcs3), and key quantitative trait loci associated with sudden death syndrome, we developed elite soybean lines with broad-spectrum disease resistance while maintaining agronomic performance. The resulting lines illustrate the versatility of resistance pyramiding, functioning either as robust donors of stacked resistance alleles or as agronomically competitive genotypes combining multi-disease resistance with glyphosate tolerance. Overall, the integration of validated diagnostic markers, robust geno-phenotyping, and molecular-assisted breeding provides a transferable framework for accelerating the development of elite soybean germplasm with broad-spectrum and durable resistance to diseases in complex scenarios.
Supplementary Materials
The following supporting information can be downloaded at the website of this paper posted on Preprints.org.
Author Contributions
Carla M. L. Rocha: Visualization, Investigation, Methodology, Formal analysis, Writing – original draft. María G. García: Investigation, Methodology. José R. Sanchez: Investigation, Resources.Atilio P. Castagnaro: Conceptualization, Funding acquisition, Supervision. Esteban M. Pardo: Conceptualization, Writing – review & editing, Project administration. María A. Chiesa: Conceptualization, Writing – review & editing, Funding acquisition. All authors have read and agreed to the published version of the manuscript.
Funding
This research was funded by the Estación Experimental Agroindustrial Obispo Colombres , by Instituto de Tecnologia Agroindustrial del Noroeste Argentino - Consejo Nacional de Investigaciones Científicas y Técnicas” (EEAOC, ITANOA -CONICET) as part of the “Evaluation and characterization of soybean genotypes and related pathogens for the identification of DNA segments associated with agronomic important traits (GrB2)” ; PDTS 0590: “Genetic improvement in important crops in the NOA region” and through PUE 22920160100043CO (IICAR-CONICET/UNR). C.M.L. Rocha was awarded a scholarship by CONICET. A.P. Castagnaro and M.A. Chiesa are CONICET Career Researchers.
Acknowledgments
We would like to express our gratitude to Francisca Perera and Daniel Ploper for kindly reading the manuscript and to Andrea Peña Malavera for her invaluable contribution to the statistical analysis of the data. We would also like to express our gratitude to Agustin Padilla and Nahuel Ruiz de Huidobro for been responsible for the agronomic management of field assays.
Declaration of Competing Interest
The authors declare that they have no conflict of interest.
References
- Aoki, T.; O’dOnnell, K.; Scandiani, M.M. Sudden death syndrome of soybean in South America is caused by four species of Fusarium: Fusarium brasiliense sp. nov., F. cuneirostrum sp. nov., F. tucumaniae, and F. virguliforme. Mycoscience 2005, 46, 162–183. [Google Scholar] [CrossRef]
- Aoki, T.; O'DOnnell, K.; Homma, Y.; Lattanzi, A.R. Sudden-death syndrome of soybean is caused by two morphologically and phylogenetically distinct species within theFusarium solanispecies complex—F. virguliformein North America andF. tucumaniaein South America. Mycologia 2003, 95, 660–684. [Google Scholar] [CrossRef] [PubMed]
- Athow, K. L. A Comparative Study of Diaporthe Stem Canker and Pod and Stem Blight of the Soybean. In Theses and Dissertations Available from ProQuest; 1951; pp. 1–111. [Google Scholar]
- Baker, W.A.; Weaver, D.B.; Qui, J.; Pace, P.F. Genetic Analysis of Frogeye Leaf Spot Resistance in PI54610 and Peking Soybean. Crop. Sci. 1999, 39, 1021–1025. [Google Scholar] [CrossRef]
- Bao, Y.; Kurle, J.E.; Anderson, G.; Young, N.D. Association mapping and genomic prediction for resistance to sudden death syndrome in early maturing soybean germplasm. Mol. Breed. 2015, 35, 1–14. [Google Scholar] [CrossRef] [PubMed]
- Bowers, G.R.; Ngeleka, K.; Smith, O. Inheritance of Stem Canker Resistance in Soybean Cultivars Crockett and Dowling. Crop. Sci. 1993, 33, 67–70. [Google Scholar] [CrossRef]
- Chang, H.-X.; Roth, M.G.; Wang, D.; Cianzio, S.R.; Lightfoot, D.A.; Hartman, G.L.; Chilvers, M.I. Integration of sudden death syndrome resistance loci in the soybean genome. Theor. Appl. Genet. 2018, 131, 757–773. [Google Scholar] [CrossRef]
- Chiesa, M.A.; Cambursano, M.V.; Pioli, R.N.; Morandi, E.N. Molecular mapping of the genomic region conferring resistance to soybean stem canker in Hutcheson soybean. Mol. Breed. 2017, 37, 1–12. [Google Scholar] [CrossRef]
- Chiesa, M.A.; Pioli, R.N.; Cambursano, M.V.; Morandi, E.N. Differential expression of distinct soybean resistance genes interacting with Argentinean isolates of Diaporthe phaseolorum var. meridionalis. Eur. J. Plant Pathol. 2012, 135, 351–362. [Google Scholar] [CrossRef]
- Chiesa, M.A.; Pioli, R.N.; Morandi, E.N. Specific resistance to soybean stem canker conferred by the Rdm4 locus. Plant Pathol. 2009, 58, 1032–1038. [Google Scholar] [CrossRef]
- Childs, S.P.; Buck, J.W.; Li, Z. Breeding soybeans with resistance to soybean rust (Phakopsora pachyrhizi). Plant Breed. 2018, 137, 250–261. [Google Scholar] [CrossRef]
- Chithrameenal, K.; Alagarasan, G.; Raveendran, M.; Robin, S.; Meena, S.; Ramanathan, A.; Ramalingam, J. Genetic enhancement of phosphorus starvation tolerance through marker assisted introgression of OsPSTOL1 gene in rice genotypes harbouring bacterial blight and blast resistance. PLOS ONE 2018, 13, e0204144. [Google Scholar] [CrossRef] [PubMed]
- Di Rienzo, J. A. Navure Team (2023). Navure (2.8.0): A data-science-statistic oriented application for making evidence-based decisions. (Version 3.12) [Computer software]. 2025. Available online: https://www.navure.com/.
- Di Rienzo, J.A.; Casanoves, F.; Balzarini, M.G.; Gonzales, L.; Tablada, M.; Robledo, C.W. InfoStat Versión 2013. Grupo InfoStat, FCA, Universidad Nacional de Córdova, Argentina. Available online: http://www.infostat.com.ar.
- Fernández, F.A.; Hanlin, R.T. Morphological and RAPD analyses of Diaporthe phaseolorum from soybean. Mycologia 1996, 88, 425–440. [Google Scholar] [CrossRef]
- Gebremedhn, H.M.; Weldemichael, M.Y.; Weldekidan, M.B. Advanced biotechnology techniques for disease resistance in soybean: a comprehensive review. Discov. Appl. Sci. 2024, 6, 1–24. [Google Scholar] [CrossRef]
- Gu, X.; Huang, S.; Zhu, Z.; Ma, Y.; Yang, X.; Yao, L.; Gao, X.; Zhang, M.; Liu, W.; Qiu, L.; et al. Genome-wide association of single nucleotide polymorphism loci and candidate genes for frogeye leaf spot (Cercospora sojina) resistance in soybean. BMC Plant Biol. 2021, 21, 1–12. [Google Scholar] [CrossRef]
- Hartman, G.; Chang, H.-X.; Leandro, L. Research advances and management of soybean sudden death syndrome. Crop. Prot. 2015, 73, 60–66. [Google Scholar] [CrossRef]
- Hartman, G.L.; Huang, Y.H.; Nelson, R.L.; Noel, G.R. Germplasm Evaluation of Glycine max for Resistance to Fusarium solani, the Causal Organism of Sudden Death Syndrome. Plant Dis. 1997, 81, 515–518. [Google Scholar] [CrossRef]
- He, C.; Xiao, Y.; Yu, J.; Li, J.; Meng, Q.; Qing, X.; Xiao, G. Pyramiding Xa21, Bph14, and Bph15 genes into the elite restorer line Yuehui9113 increases resistance to bacterial blight and the brown planthopper in rice. Crop. Prot. 2019, 115, 31–39. [Google Scholar] [CrossRef]
- Iqbal, M.J.; Meksem, K.; Njiti, V.N.; Kassem, M.A.; Lightfoot, D.A. Microsatellite markers identify three additional quantitative trait loci for resistance to soybean sudden-death syndrome (SDS) in Essex × Forrest RILs. Theor. Appl. Genet. 2001, 102, 187–192. [Google Scholar] [CrossRef]
- Kashiwa, T.; Muraki, Y.; Yamanaka, N. Near-isogenic soybean lines carrying Asian soybean rust resistance genes for practical pathogenicity validation. Sci. Rep. 2020, 10, 1–7. [Google Scholar] [CrossRef]
- Kato, M.; Soares, R.M. Field trials of a Rpp-pyramided line confirm the synergistic effect of multiple gene resistance to Asian soybean rust (Phakopsora pachyrhizi). Trop. Plant Pathol. 2021, 47, 222–232. [Google Scholar] [CrossRef]
- Kilen, T.C.; Keeling, B.L.; Hartwig, E.E. Inheritance of Reaction to Stem Canker in Soybean 1. Crop. Sci. 1985, 25, 50–51. [Google Scholar] [CrossRef]
- Kim, H.; Newell, A.D.; Cota-Sieckmeyer, R.G.; Rupe, J.C.; Fakhoury, A.M.; Bluhm, B.H. Mating-Type Distribution and Genetic Diversity ofCercospora sojinaPopulations on Soybean from Arkansas: Evidence for Potential Sexual Reproduction. Phytopathology® 2013, 103, 1045–1051. [Google Scholar] [CrossRef]
- Li, D.; Zhang, Z.; Gao, X.; Zhang, H.; Bai, D.; Wang, Q.; Zheng, T.; Li, Y.-H.; Qiu, L.-J. The elite variations in germplasms for soybean breeding. Mol. Breed. 2023, 43, 1–18. [Google Scholar] [CrossRef] [PubMed]
- Li, X.; Han, Y.; Teng, W.; Zhang, S.; Yu, K.; Poysa, V.; Anderson, T.; Ding, J.; Li, W. Pyramided QTL underlying tolerance to Phytophthora root rot in mega-environments from soybean cultivars ‘Conrad’ and ‘Hefeng 25’. Theor. Appl. Genet. 2010, 121, 651–658. [Google Scholar] [CrossRef] [PubMed]
- Lin, F.; Chhapekar, S.S.; Vieira, C.C.; Da Silva, M.P.; Rojas, A.; Lee, D.; Liu, N.; Pardo, E.M.; Lee, Y.-C.; Dong, Z.; et al. Breeding for disease resistance in soybean: a global perspective. Theor. Appl. Genet. 2022, 135, 3773–3872. [Google Scholar] [CrossRef] [PubMed]
- Luckew, A.S.; Cianzio, S.R.; Leandro, L.F. Screening Method for Distinguishing Soybean Resistance to Fusarium virguliforme in Resistant × Resistant Crosses. Crop. Sci. 2012, 52, 2215–2223. [Google Scholar] [CrossRef]
- Martins, M.C.; Guerzoni, R.A.; Câmara, G.M.d.S.; Mattiazzi, P.; Lourenço, S.A.; Amorim, L. Escala diagramática para a quantificação do complexo de doenças foliares de final de ciclo em soja. Fitopatol. Bras. 2004, 29, 179–184. [Google Scholar] [CrossRef]
- McDonald, S.C.; Buck, J.W.; Li, Z. Pinpointing Rcs3 for frogeye leaf spot resistance and tracing its origin in soybean breeding. Mol. Breed. 2023, 43, 1–14. [Google Scholar] [CrossRef]
- Meira, D.; Panho, M.C.; Beche, E.; Woyann, L.G.; Madella, L.A.; Milioli, A.S.; Colonelli, L.L.; Malone, G.; Brito, S.L.; Benin, G. Gene pyramiding combinations confer resistance of Asian soybean rust. Crop. Sci. 2021, 62, 792–801. [Google Scholar] [CrossRef]
- Mengistu, A.; Bond, J.; Mian, R.; Nelson, R.; Shannon, G.; Wrather, A. Identification of Soybean Accessions Resistant to Cercospora sojina by Field Screening, Molecular Markers, and Phenotyping. Crop. Sci. 2011, 51, 1101–1109. [Google Scholar] [CrossRef]
- Mian, M.A.R.; Boerma, H.R.; Phillips, D.V.; Kenty, M.M.; Shannon, G.; Shipe, E.R.; Blount, A.R.S.; Weaver, D.B. Performance of Frogeye Leaf Spot-Resistant and -Susceptible Near-Isolines of Soybean. Plant Dis. 1998, 82, 1017–1021. [Google Scholar] [CrossRef]
- Mian, R.; Bond, J.; Joobeur, T.; Mengistu, A.; Wiebold, W.; Shannon, G.; Wrather, A. Identification of Soybean Genotypes Resistant to Cercospora sojina by Field Screening and Molecular Markers. Plant Dis. 2009, 93, 408–411. [Google Scholar] [CrossRef] [PubMed]
- Njiti, V.N.; Meksem, K.; Iqbal, M.J.; Johnson, J.E.; Kassem, M.A.; Zobrist, K.F.; Kilo, V.Y.; Lightfoot, D.A. Common loci underlie field resistance to soybean sudden death syndrome in Forrest, Pyramid, Essex, and Douglas. Theor. Appl. Genet. 2002, 104, 294–300. [Google Scholar] [CrossRef] [PubMed]
- Panho, M.C.; Fernandes, R.A.T.; Menegazzi, C.P.; Campagnolli, O.R.; de Quadra, F.C.; Madella, L.A.; Meira, D.; Malone, G.; Junior, S.L.B.; Benin, G. Rpp-Gene pyramiding confers higher resistance level to Asian soybean rust. Euphytica 2022, 218, 1–11. [Google Scholar] [CrossRef]
- Pham, A.-T.; Lee, J.-D.; Shannon, J.G.; Bilyeu, K.D. A novel FAD2-1 A allele in a soybean plant introduction offers an alternate means to produce soybean seed oil with 85% oleic acid content. Theor. Appl. Genet. 2011, 123, 793–802. [Google Scholar] [CrossRef]
- Pioli, R.; Gattuso, S.; Prado, D.; Borghi, A. Recent Outbreak of Stem Canker (Diaporthe phaseolorum var. meridionalis) of Soybean in Santa Fe, Argentina. Plant Dis. 1997, 81, 1215–1215. [Google Scholar] [CrossRef]
- Pioli, R.N.; Morandi, E.N.; Martínez, M.C.; Lucca, F.; Tozzini, A.; Bisaro, V.; Hopp, H.E. Morphologic, Molecular, and Pathogenic Characterization of Diaporthe phaseolorum Variability in the Core Soybean-Producing Area of Argentina. Phytopathology® 2003, 93, 136–146. [Google Scholar] [CrossRef]
- Ploper, L.D.; González, V.; Gálvez, M.R.; Devani, M.R.; Ledesma, F.; Zamorano, M.A. Frogeye Leaf Spot of Soybean Caused by Cercospora sojina in Northwestern Argentina. Plant Dis. 2001, 85, 801–801. [Google Scholar] [CrossRef]
- Maroof, M.A.S.; Jeong, S.C.; Gunduz, I.; Tucker, D.M.; Buss, G.R.; Tolin, S.A. Pyramiding of Soybean Mosaic Virus Resistance Genes by Marker-Assisted Selection. Crop. Sci. 2008, 48, 517–526. [Google Scholar] [CrossRef]
- A Saghai-Maroof, M.; Soliman, K.M.; A Jorgensen, R.; Allard, R.W. Ribosomal DNA spacer-length polymorphisms in barley: mendelian inheritance, chromosomal location, and population dynamics. Proc. Natl. Acad. Sci. 1984, 81, 8014–8018. [Google Scholar] [CrossRef]
- Santana, F.A.; da Silva, M.F.; Guimarães, J.K.F.; Ferreira, M.F.d.S.; Pereira, W.D.; Piovesan, N.D.; de Barros, E.G. Marker-assisted selection strategies for developing resistant soybean plants to cyst nematode. Crop. Breed. Appl. Biotechnol. 2014, 14, 180–186. [Google Scholar] [CrossRef]
- Savary, S.; Willocquet, L.; Pethybridge, S.J.; Esker, P.; McRoberts, N.; Nelson, A. The global burden of pathogens and pests on major food crops. Nat. Ecol. Evol. 2019, 3, 430–439. [Google Scholar] [CrossRef] [PubMed]
- Scandiani, M.M.; Ruberti, D.S.; Giorda, L.M.; Pioli, R.N.; Luque, A.G.; Bottai, H.; Ivancovich, J.J.; Aoki, T.; O'Donnell, K. Comparison of inoculation methods for characterizing relative aggressiveness of two soybean sudden-death syndrome pathogens, Fusarium virguliforme and F. tucumaniae. Trop. Plant Pathol. 2011, 36, 133–140. [Google Scholar] [CrossRef]
- Scandiani, M.; Ruberti, D.; O'DOnnell, K.; Aoki, T.; Pioli, R.; Giorda, L.; Luque, A.; Biasoli, M. Recent Outbreak of Soybean Sudden Death Syndrome Caused by Fusarium virguliforme and F. tucumaniae in Argentina. Plant Dis. 2004, 88, 1044–1044. [Google Scholar] [CrossRef] [PubMed]
- Shi, A.; Chen, P.; Li, D.; Zheng, C.; Zhang, B.; Hou, A. Pyramiding multiple genes for resistance to soybean mosaic virus in soybean using molecular markers. Mol. Breed. 2008, 23, 113–124. [Google Scholar] [CrossRef]
- Shi, A.; Chen, P.; Li, D.; Zheng, C.; Zhang, B.; Hou, A. Pyramiding multiple genes for resistance to soybean mosaic virus in soybean using molecular markers. Mol. Breed. 2008, 23, 113–124. [Google Scholar] [CrossRef]
- Singer, W.M.; Lee, Y.; Shea, Z.; Vieira, C.C.; Lee, D.; Li, X.; Cunicelli, M.; Kadam, S.S.; Khan, M.A.W.; Shannon, G.; et al. Soybean genetics, genomics, and breeding for improving nutritional value and reducing antinutritional traits in food and feed. Plant Genome 2023, 16, e20415. [Google Scholar] [CrossRef]
- Spampinato, C.P.; Scandiani, M.M.; Luque, A.G. Soybean sudden death syndrome: Fungal pathogenesis and plant response. Plant Pathol. 2020, 70, 3–12. [Google Scholar] [CrossRef]
- Tripathi, N.; Tripathi, M.K.; Tiwari, S.; Payasi, D.K. Molecular Breeding to Overcome Biotic Stresses in Soybean: Update. Plants 2022, 11, 1967. [Google Scholar] [CrossRef]
- Tripathi, N.; Tripathi, M.K.; Tiwari, S.; Payasi, D.K. Molecular Breeding to Overcome Biotic Stresses in Soybean: Update. Plants 2022, 11, 1967. [Google Scholar] [CrossRef]
- Tyler, J.M. Characterization of Stem Canker Resistance in ‘Hutcheson’ Soybean. Crop. Sci. 1996, 36, 591–593. [Google Scholar] [CrossRef]
- Udayanga, D.; Castlebury, L.A.; Rossman, A.Y.; Chukeatirote, E.; Hyde, K.D. The Diaporthe sojae species complex: Phylogenetic re-assessment of pathogens associated with soybean, cucurbits and other field crops. Fungal Biol. 2015, 119, 383–407. [Google Scholar] [CrossRef] [PubMed]
- Wang, D.-G.; Zhao, L.; Li, K.; Ma, Y.; Wang, L.-Q.; Yang, Y.-Q.; Yang, Y.-H.; Zhi, H.-J. Marker-assisted pyramiding of soybean resistance genes R, R, and R to soybean mosaic virus. J. Integr. Agric. 2017, 16, 2413–2420. [Google Scholar] [CrossRef]
- Wen, Z.; Tan, R.; Yuan, J.; Bales, C.; Du, W.; Zhang, S.; I Chilvers, M.; Schmidt, C.; Song, Q.; Cregan, P.B.; et al. Genome-wide association mapping of quantitative resistance to sudden death syndrome in soybean. BMC Genom. 2014, 15, 1–11. [Google Scholar] [CrossRef]
- Yamanaka, N.; Hossain, M. Pyramiding three rust-resistance genes confers a high level of resistance in soybean (Glycine max). Plant Breed. 2019, 138, 686–695. [Google Scholar] [CrossRef]
- Yamanaka, N.; Morishita, M.; Mori, T.; Lemos, N.G.; Hossain, M.; Akamatsu, H.; Kato, M.; Yamaoka, Y. Multiple Rpp-gene pyramiding confers resistance to Asian soybean rust isolates that are virulent on each of the pyramided genes. Trop. Plant Pathol. 2015, 40, 283–290. [Google Scholar] [CrossRef]
- Yang, W.; Weaver, D.B.; Nielsen, B.L.; Qiu, J.; Salamini, F. Molecular mapping of a new gene for resistance to frogeye leaf spot of soya bean in ‘Peking’. Plant Breed. 2001, 120, 73–78. [Google Scholar] [CrossRef]
- Zhang, J.; Singh, A.; Mueller, D.S.; Singh, A.K. Genome-wide association and epistasis studies unravel the genetic architecture of sudden death syndrome resistance in soybean. Plant J. 2015, 84, 1124–1136. [Google Scholar] [CrossRef]
- Zhang, Y.H.; Liu, M.F.; He, J.B.; Wang, Y.F.; Xing, G.N.; Li, Y.; Yang, S.P.; Zhao, T.J.; Gai, J.Y. Marker-assisted breeding for transgressive seed protein content in soybean [Glycine max (L.) Merr.]. Theor. Appl. Genet. 2015, 128, 1061–1072. [Google Scholar] [CrossRef]
- Zhang, Y.; Song, J.; Wang, L.; Yang, M.; Hu, K.; Li, W.; Sun, X.; Xue, H.; Dong, Q.; Zhang, M.; et al. Identifying Quantitative Trait Loci and Candidate Genes Conferring Resistance to Soybean Mosaic Virus SC7 by Quantitative Trait Loci-Sequencing in Soybean. Front. Plant Sci. 2022, 13, 843633. [Google Scholar] [CrossRef]
Figure 1.
Marker-assisted backcross (MABC) breeding scheme performed for developing new soybean pyramided lines carrying molecular markers Sat_162 (linked to Rdm4) for resistance to SSC, Satt244 (linked to Rcs3) for resistance to FLS and QTLs (SDS7-1, SDS7-2, SDS7-3, SDS7-5, SDS715-9) associated with SDS resistance.
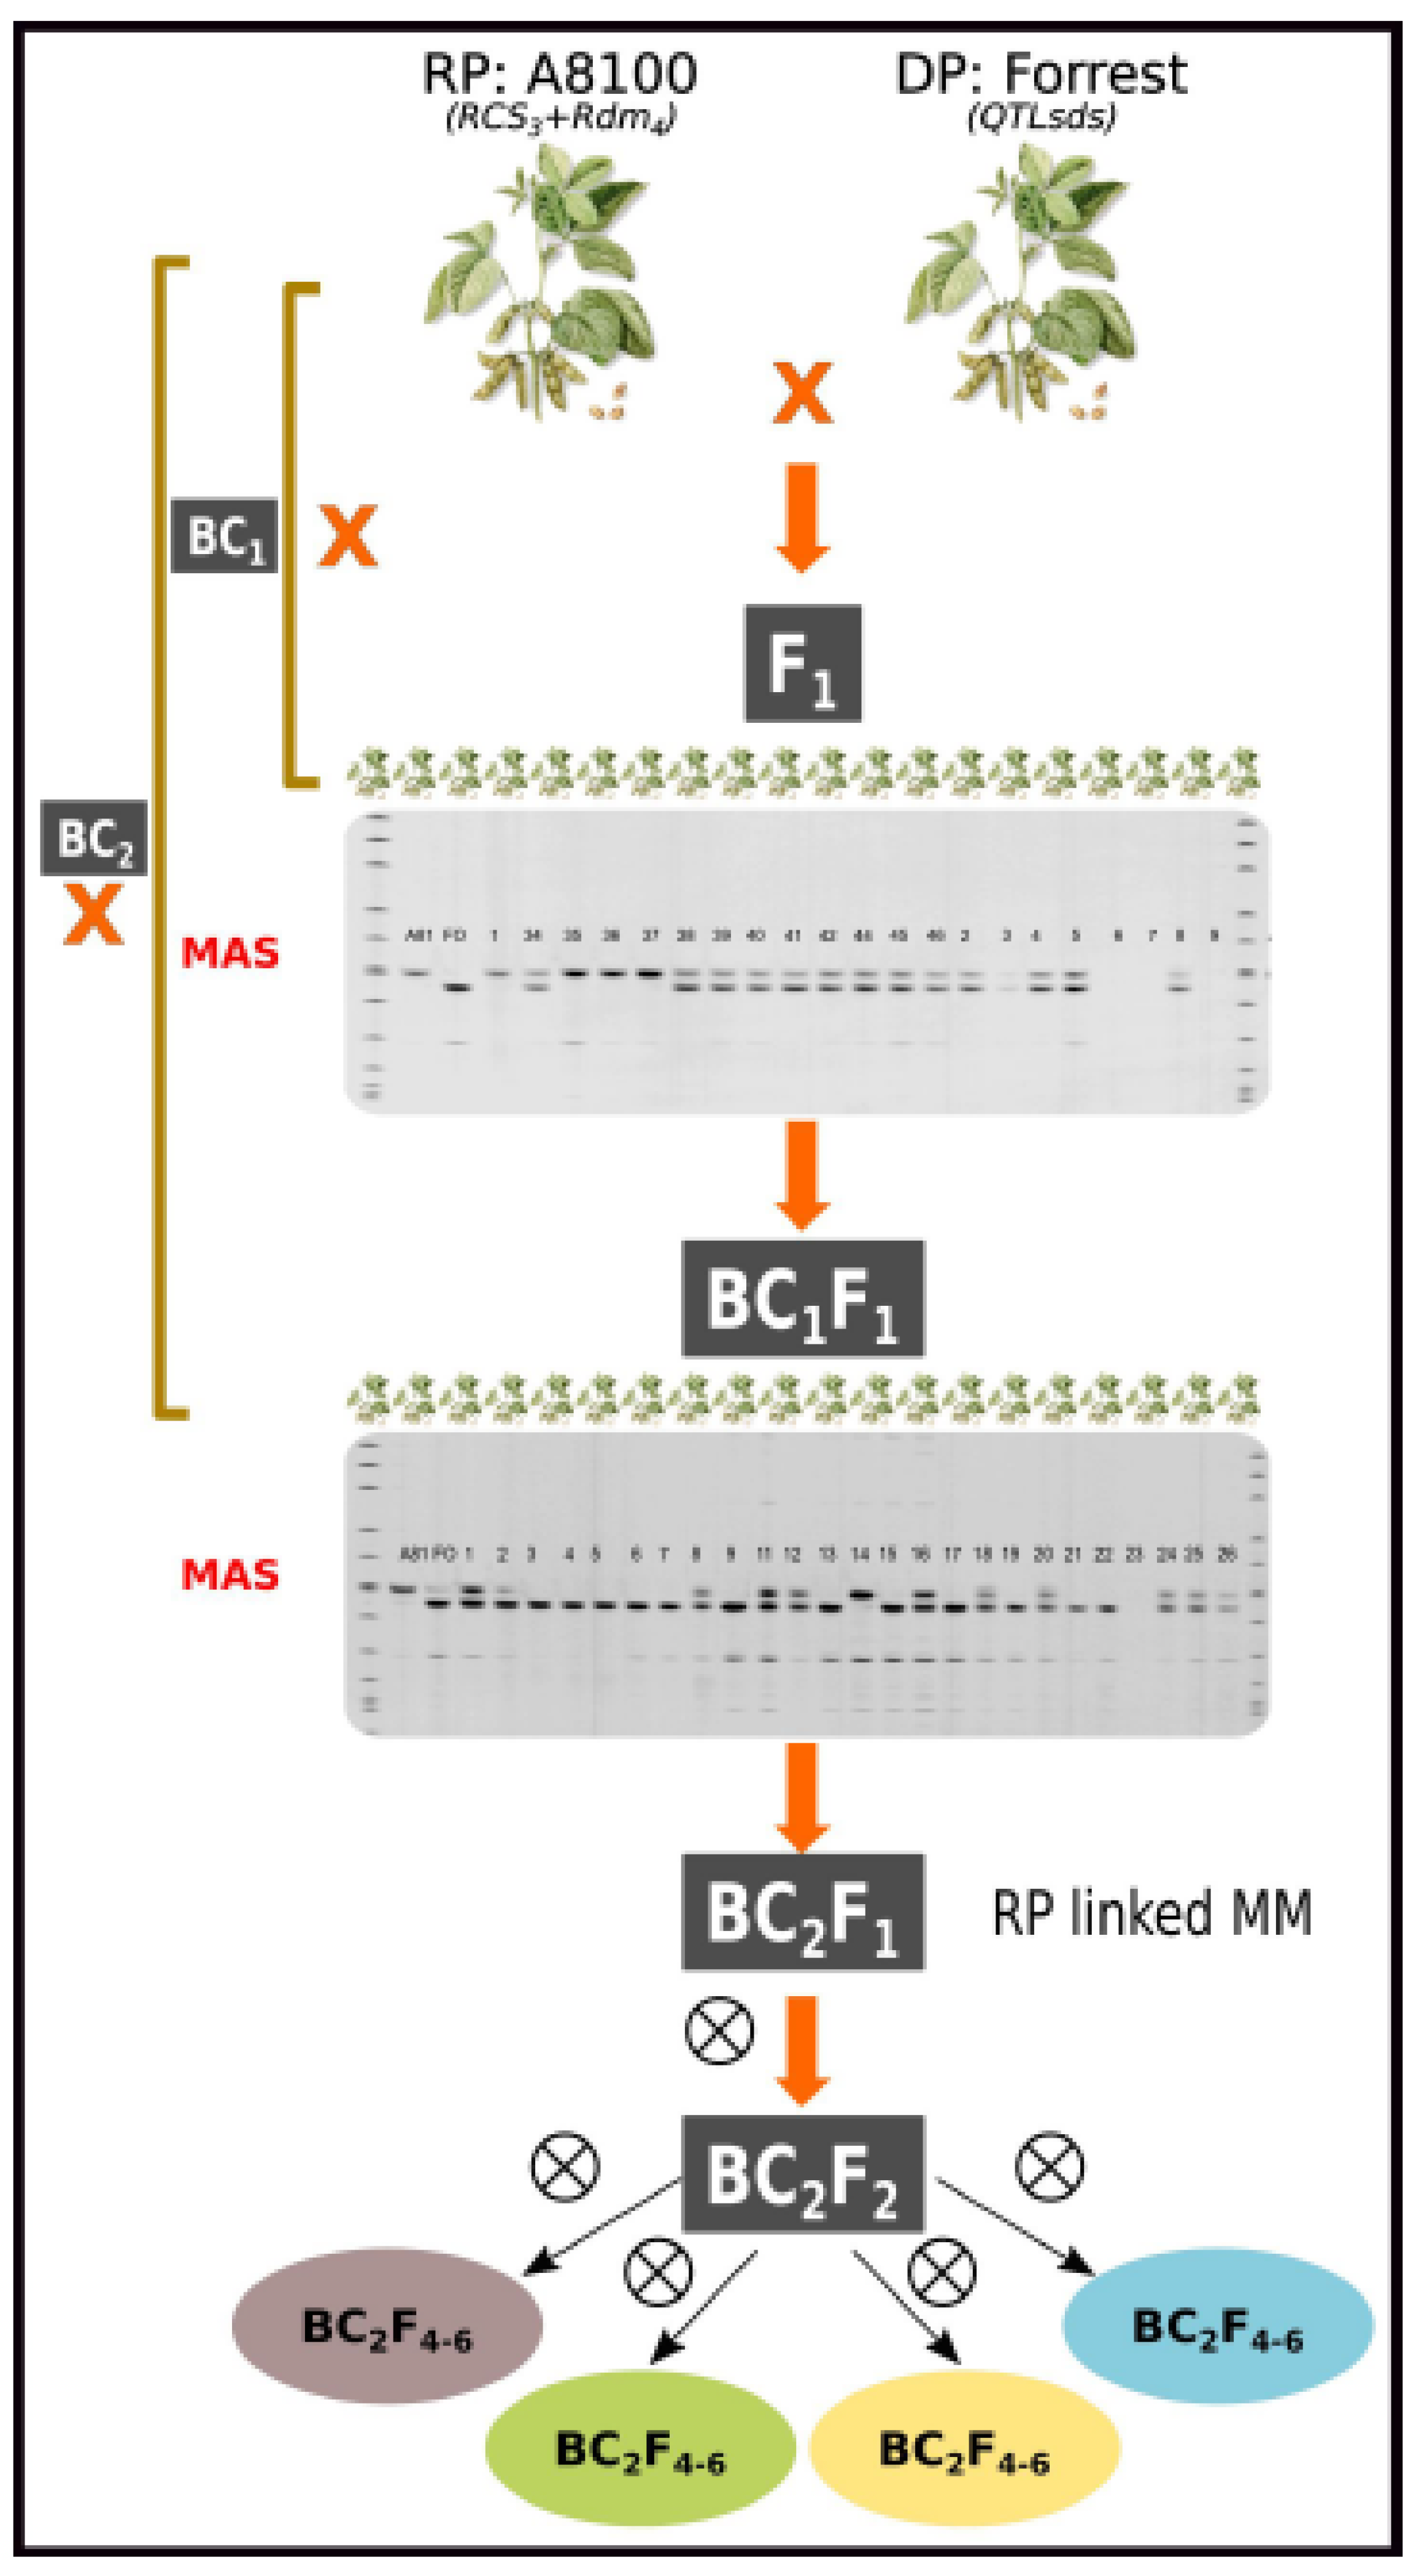
Figure 2.
Phenotypic validation of the R gene-pyramided lines under artificial inoculation with D. aspalathi, the causal agent of SSC. At 49 days post inoculation, pyramided lines were evaluated by disease severity index (DSI) and % of dead plants (DP). Cultivar RA702 was used as a susceptible control and Hutcheson (Rdm4) as resistance control. Values are expressed as mean ± SE. Different letters indicate significant differences according to LSD Fisher´s Test, p<0.05.
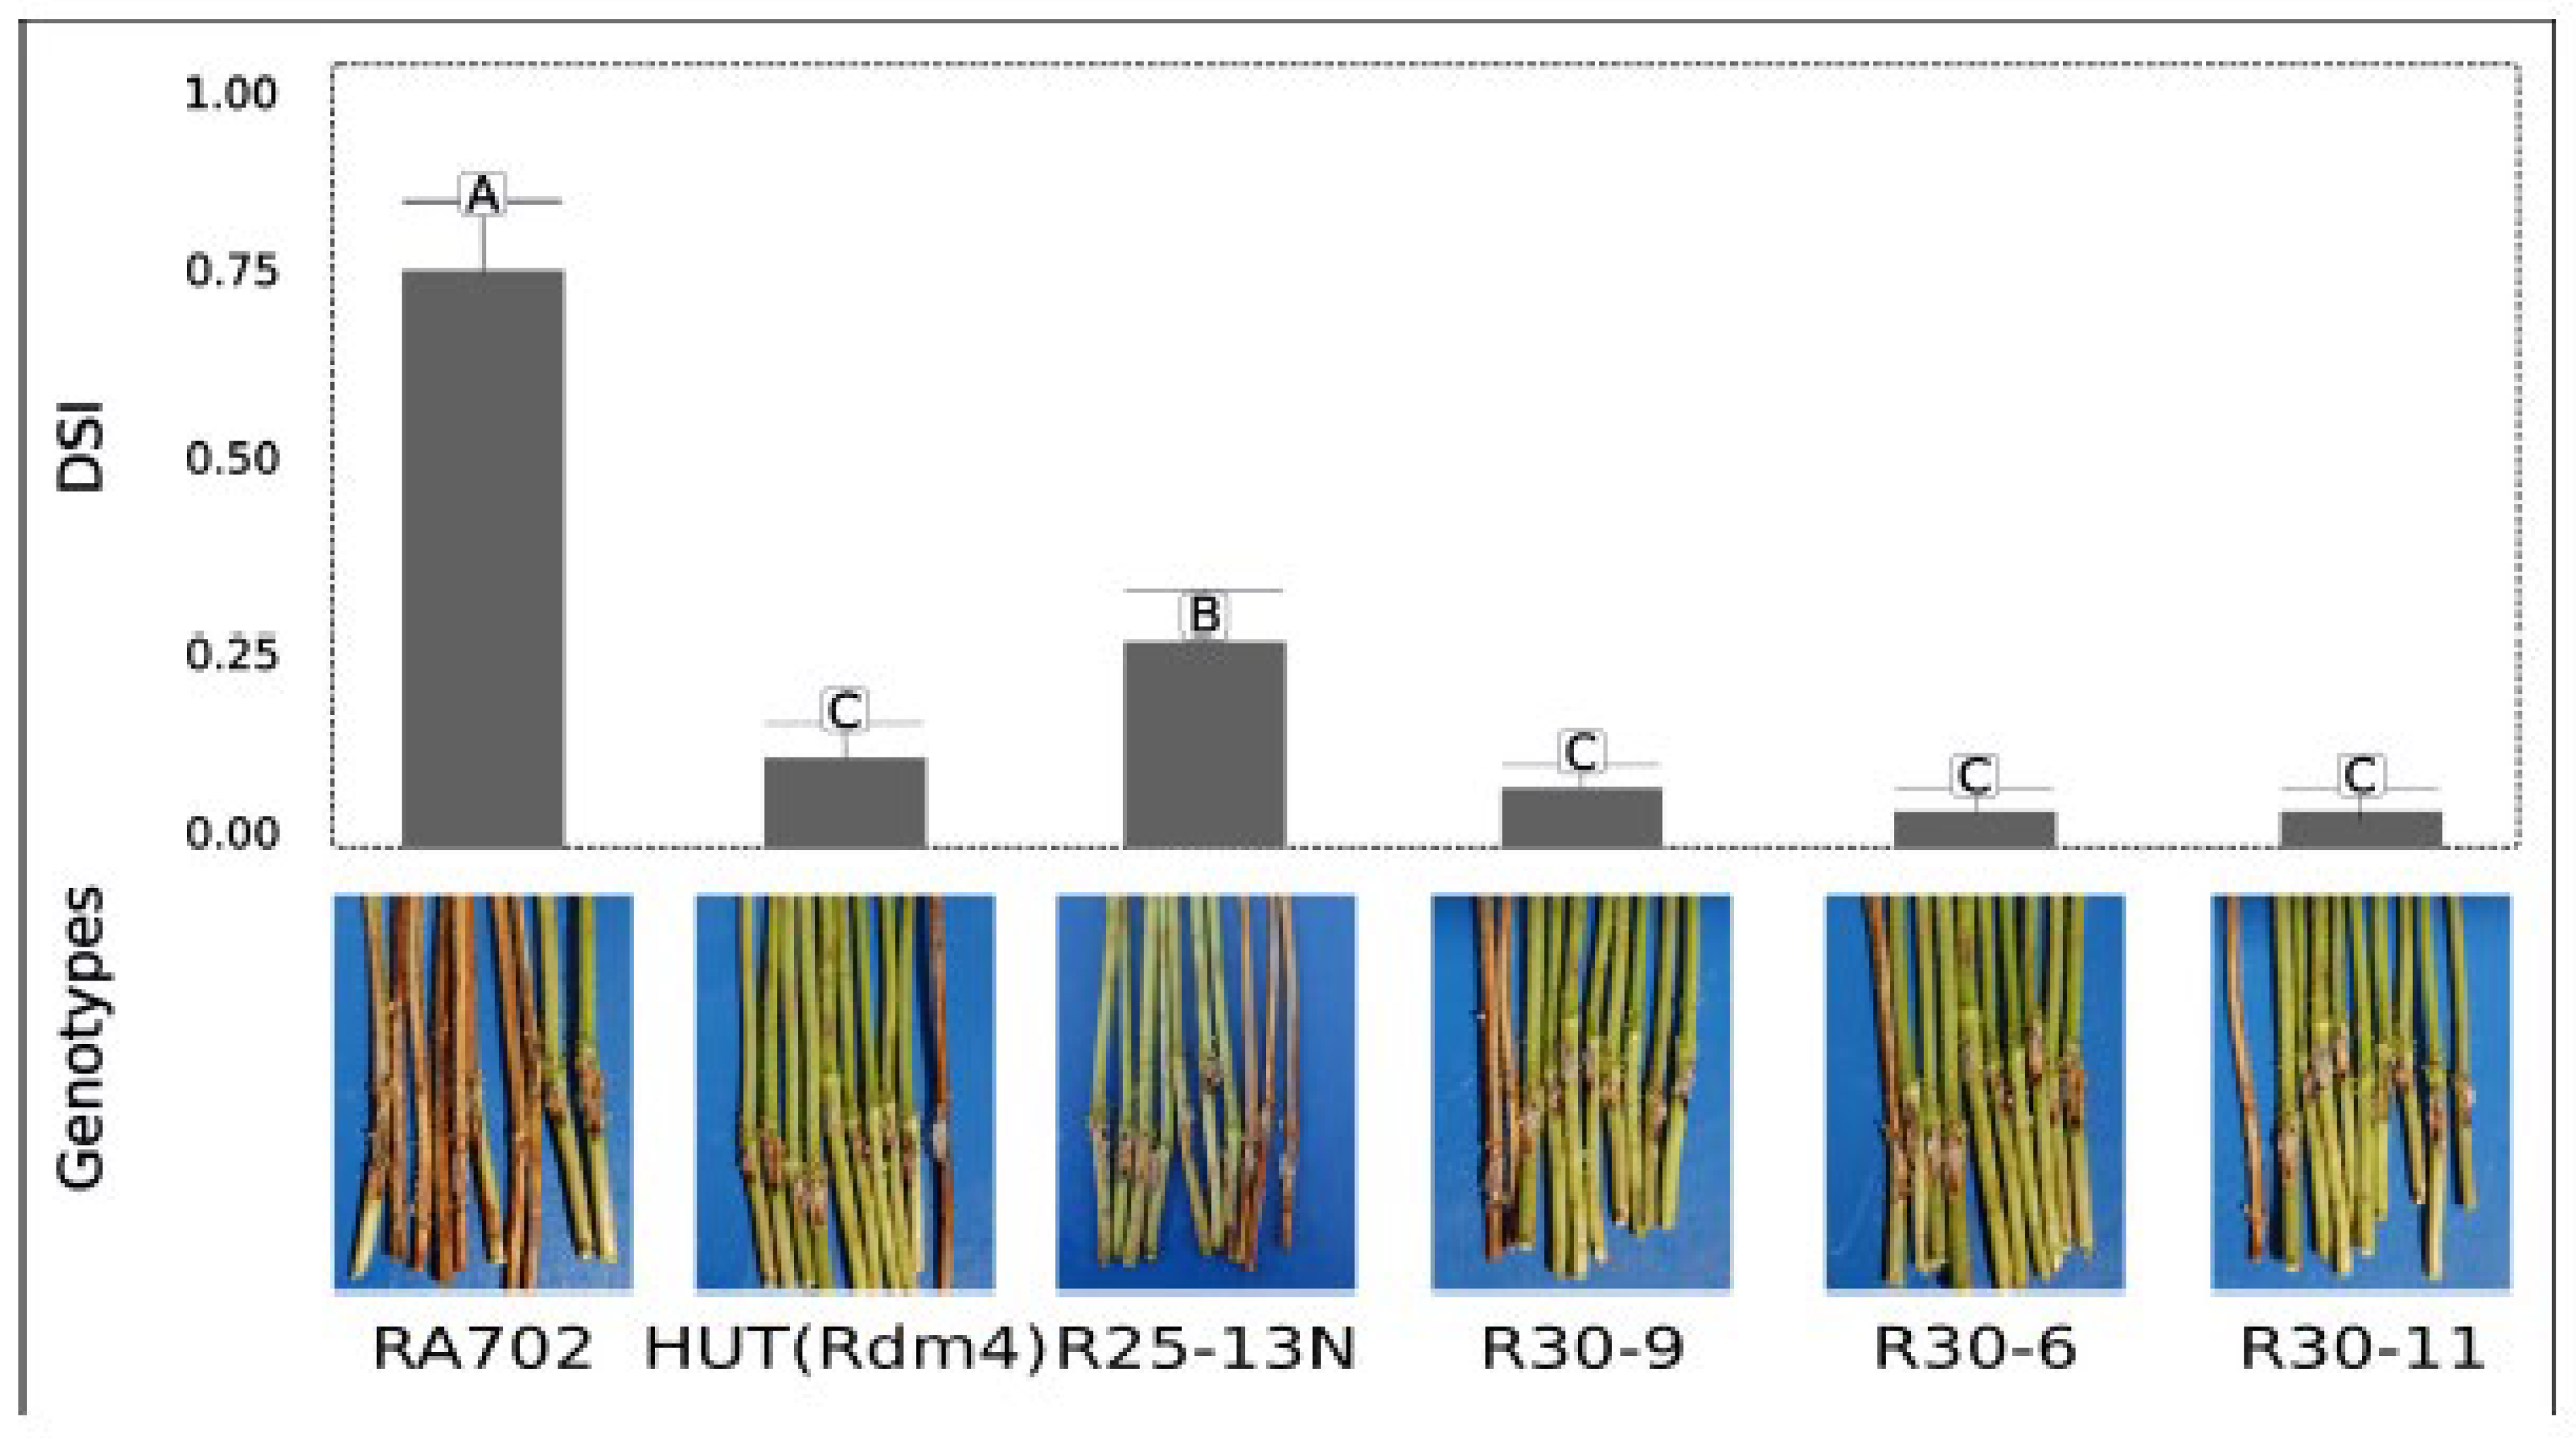
Figure 3.
Phenotypic evaluation of the R gene-pyramided lines under artificial inoculation with C. sojina, causal agent of FLS. At 30 days post-inoculation, disease severity index (DSI) of the pyramided lines was evaluated. Genotype HO6620 was used as susceptible control meanwhile A8000 (Rcs3) was used as resistant control. Values are expressed as mean ± SE. Different letters indicate significant differences according to LSD Fisher´s Test, p<0.05.
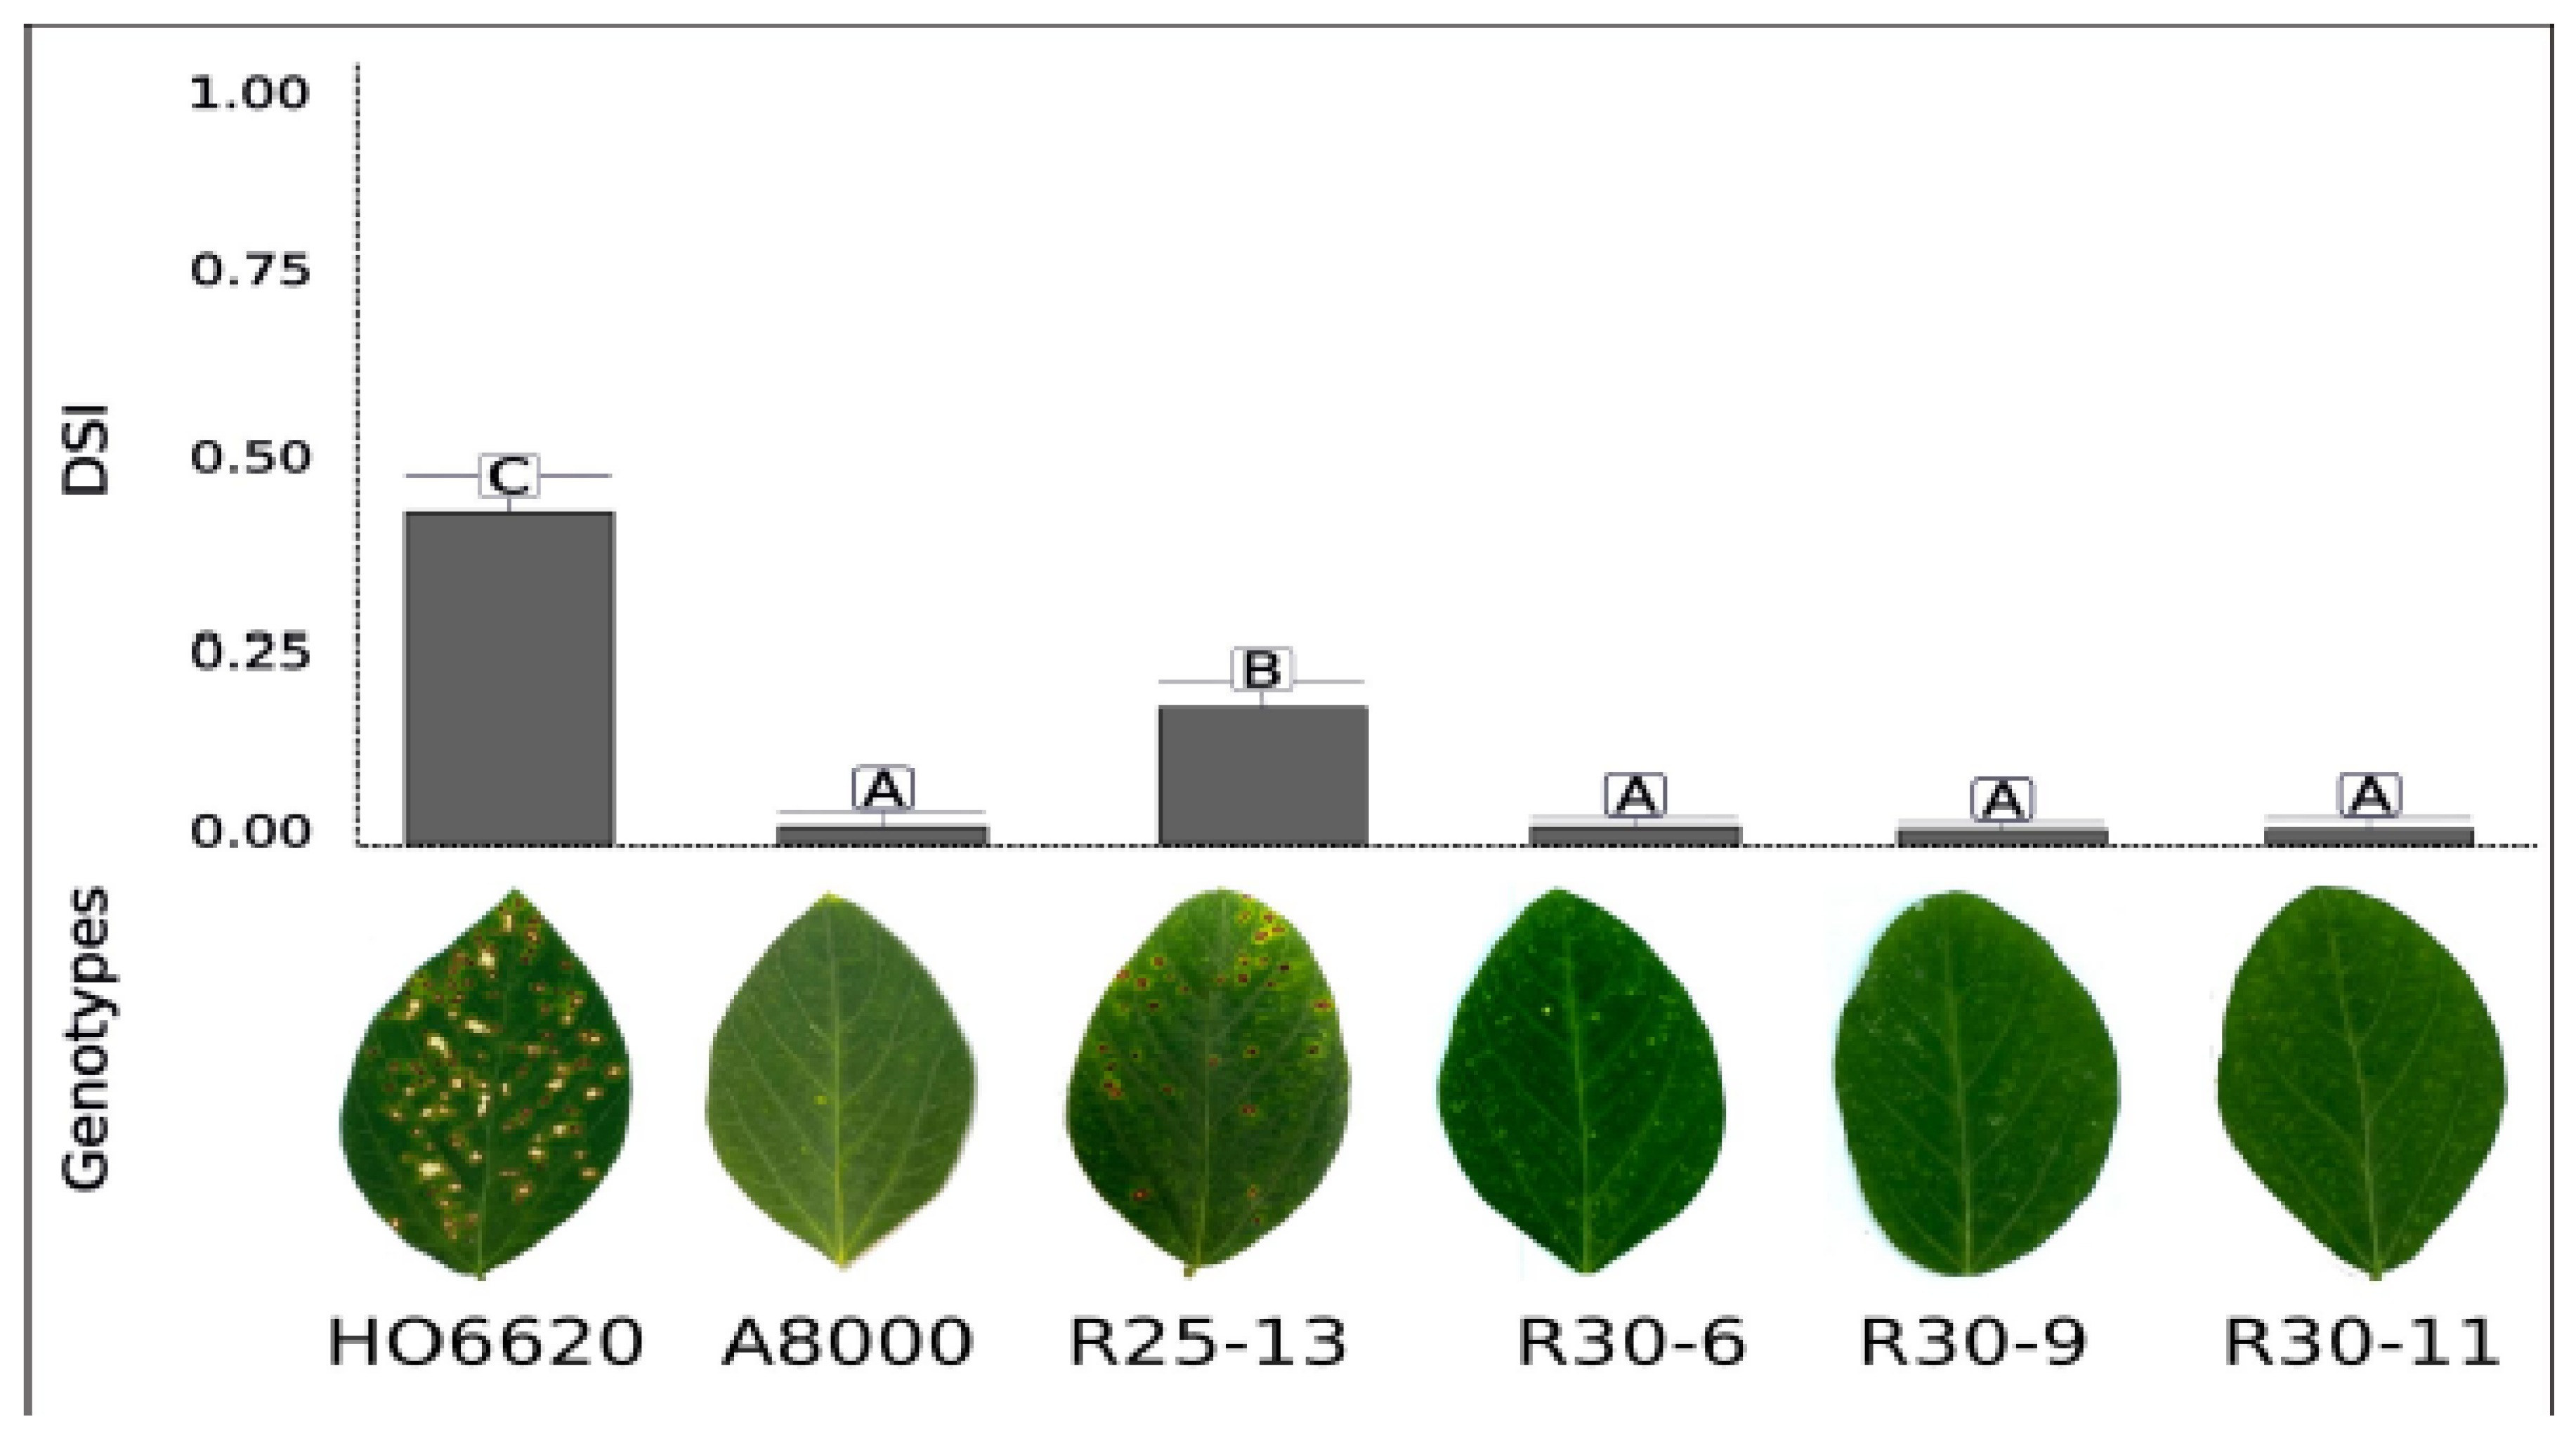
Figure 4.
Phenotypic evaluation of soybean pyramided lines under artificial inoculation with Fusarium virguliforme at 30 days after sowing. Foliar disease severity index (DSI), root DSI and root dry weight between inoculated (light gray bars) and not inoculated (dark gray bars) plants were assessed to determine the resistance of the lines. Values are expressed as mean ± SE. Different letters indicate significant differences according to DGC Test, p<0.05.
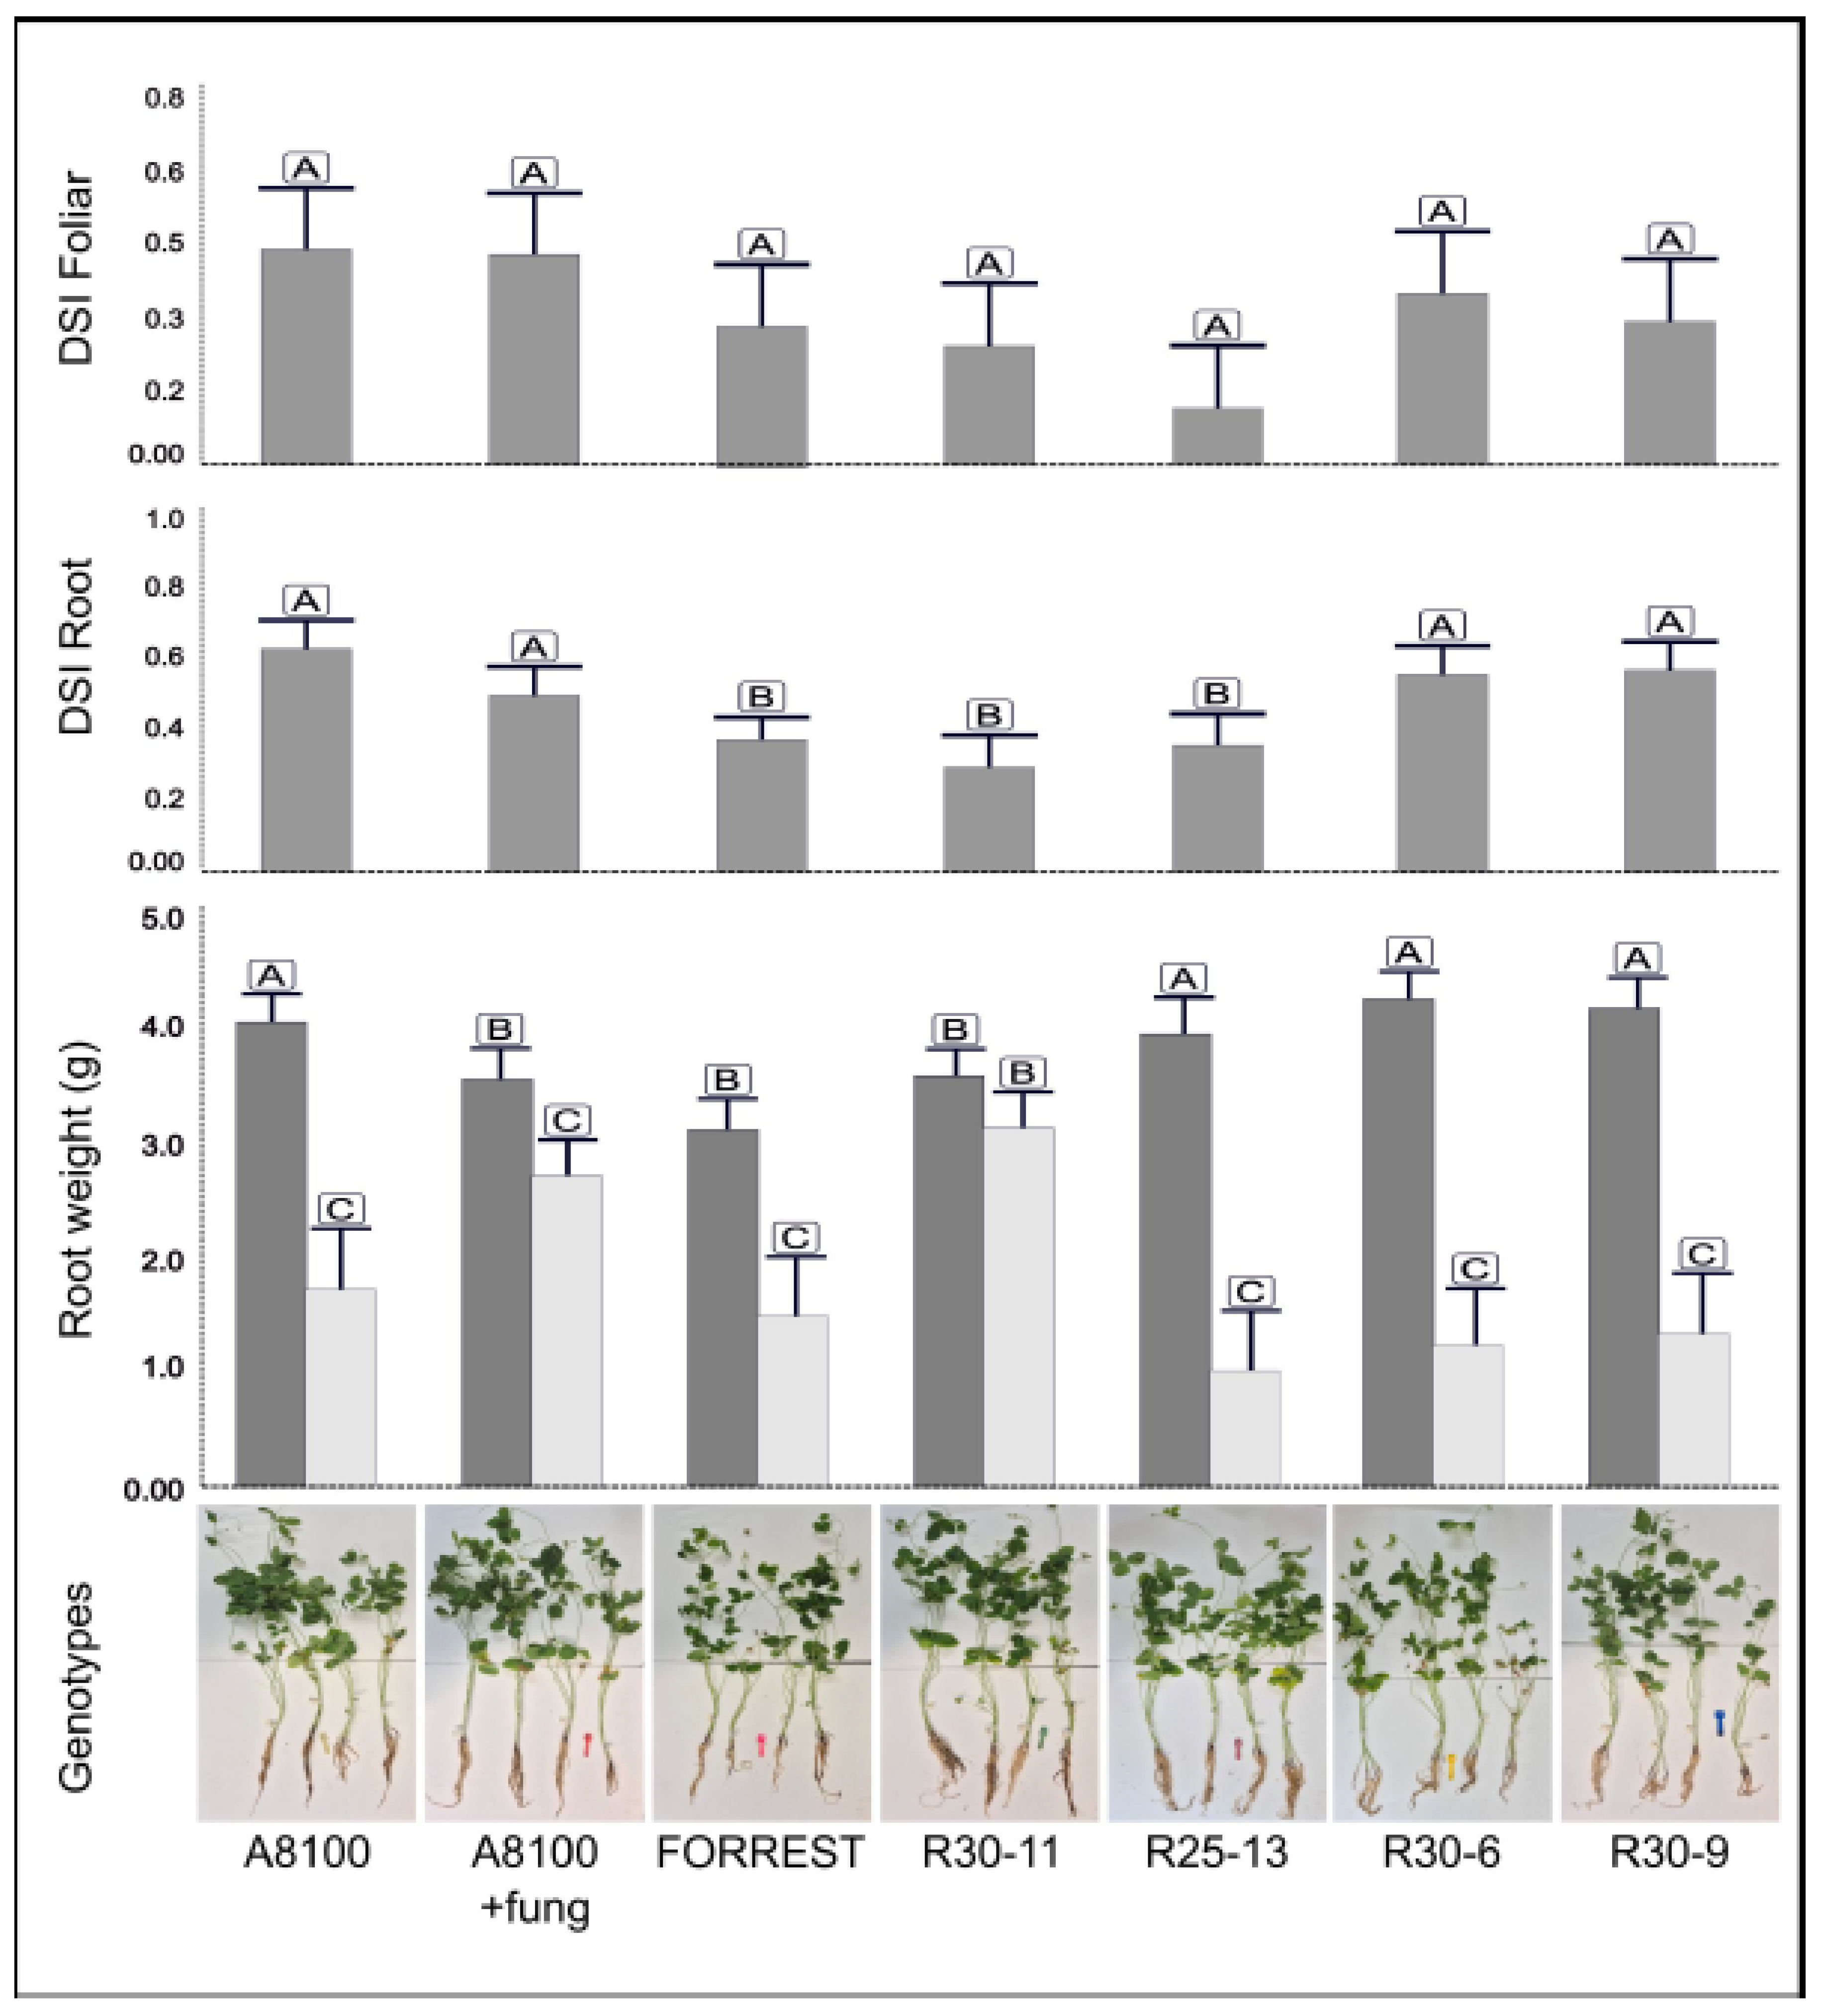
Table 1.
Phenotypic response of a set of genotypes inoculated with D. aspalathi, the causal agent of soybean stem canker (SSC), under semi-controlled conditions to validate the association between SSR-MM and the resistance conferred by the Rdm genes in cultivars of the SBP-EEAOC, Tucumán, Argentina.
|
Cultivars |
Phenotypea |
Genes | Controlled conditionsc | |||
|---|---|---|---|---|---|---|
| Rdm4 (Sat_162) b | Rdm5 (Satt233) | DPd (%) | Phenotypee | |||
| A8100 RG | R | + | - | 7.4 | R | |
| Stonewall C | MR | - | + | 44.4 | MS | |
| A 6401 RR | R | + | + | 7.4 | R | |
| DM 8002 | R | + | - | 11.1 | R | |
| Munasqa RR | R | + | + | 7.5 | R | |
| NA 6126 RR | R | + | + | 3.7 | R | |
| Qaylla RR | R | + | + | 7.9 | R | |
| Lax | S | - | - | 100 | S | |
| A8000 RR Yanasu |
R R |
+ + |
- - |
13.9 6.3 |
R R |
|
| DM 6200 | R | + | - | 4.2 | R | |
| Huayra | R | - | - | 6.0 | R | |
| Lax | R | + | - | 3.7 | R | |
| RA702* | S | - | - | 80.5 | S | |
| J77-339* | S | - | - | 60.6 | S | |
| Dowling ** | R | + | - | 0 | R | |
| Hutcheson** | R | + | + | 0 | R | |
a Results of field evaluations carried out in the 2010 and 2011 crop seasons in macro plots located in different locations in northwest (NW) Argentina with natural inoculum. R: resistant; MR: moderately resistant; S: susceptible. b The diagnostic MM Sat_162 and Satt233 were used to detect the presence of Rdm4 and Rdm5 genes, respectively, (+) presence/ (-) absence of the allele of Hutcheson genotype of reference. c Phenotypic response to isolate CCC123-09 of D. aspalathi under semi-controlled conditions. d Percentage of dead plants (% DP). d R: resistant; MS: moderately susceptible; S: susceptible. * Reference susceptible genotypes for SSC. ** Reference resistant genotypes for SSC carrying Rdm4/5 genes.
Table 2.
Table 2. Results of phenotypic response of a set of genotypes inoculated with C. sojina, the causal agent of Frogeye leaf spot (FLS), under semi-controlled conditions to validate the association between MM and Rcs3, RscMte Red. and RscPeking genes.
Table 2.
Table 2. Results of phenotypic response of a set of genotypes inoculated with C. sojina, the causal agent of Frogeye leaf spot (FLS), under semi-controlled conditions to validate the association between MM and Rcs3, RscMte Red. and RscPeking genes.
| Cultivar | Phenotypea | Genesb | Controlled conditionsc | |||
|---|---|---|---|---|---|---|
| Rcs3 | RcsMte.Red | RcsPeking | DSI | Phenotyped | ||
| A8100 RR | R | + | - | - | 0.05 | R |
| A8000 RR | R | + | - | - | 0.06 | R |
| Carver C | ND | + | - | - | 0.09 | R |
| A 6401 RR | R | - | - | - | 0.13 | R |
| A 6411 RR | R | + | - | - | 0.11 | R |
| Munasqa RR | R | - | - | - | 0.09 | R |
| NA 6126 RR | R | - | - | - | 0.12 | R |
| Qaylla RR | R | - | - | - | 0.08 | R |
| Maxcy C | ND | + | - | - | 0.06 | R |
| Yanasu | MR | + | - | - | 0.12 | R |
| Davis** | R | + | - | - | 0.07 | R |
| Mte Red** | R | - | + | - | 0.10 | R |
| Peking** | R | - | - | + | 0.05 | R |
| Anta 8.2* | S | - | - | - | 0.70 | S |
a Results of field evaluations carried out in the 2010 and 2011crop seasons in macro plots located in different locations in NW Argentina with natural inoculum. R: resistant; MR: moderately resistant; S: susceptible. b The diagnostic MM Satt244 detected the presence of Rcs3, RcsMte.Red, RcsPeking. c Phenotypic response to isolate CCC232-109 of C. sojina under semi-controlled conditions. d Disease severity index (DSI). * Reference susceptible genotypes for FLS. ** Reference genotypes for FLS resistance genes.
Table 3.
Results of genotyping performed with MM SSRs associated with the QTLs for SDS resistance in soybean genotypes of the SBP of EEAOC, Tucumán, Argentina.
Table 3.
Results of genotyping performed with MM SSRs associated with the QTLs for SDS resistance in soybean genotypes of the SBP of EEAOC, Tucumán, Argentina.
| SDS | ||||||||||||||
|---|---|---|---|---|---|---|---|---|---|---|---|---|---|---|
| Cultivar | Phenotype* | QTLs | ||||||||||||
| SDS7-1 | SDS7-2 | SDS7-3 | SDS8-1 | SDS7-5 | SDS7-6 | SDS15-9 | ||||||||
| Satt | Satt | Satt | Satt | Satt | Satt | Satt | Satt | Satt | Satt | Satt | ||||
| 214a | 309a | 570a | 163a | 371b | 357b | 202b | 316b | 307b | 354c | 270c | ||||
| Forrest** | R | + | + | + | + | + | + | + | + | + | + | + | ||
| A8100 RG | MR | + | + | + | + | |||||||||
| Agustina 49 RR | ND | + | + | + | + | + | ||||||||
| AW 5581 | R | + | + | + | + | + | ||||||||
| DM 4800 RR | R | + | + | |||||||||||
| Hartwing C | R | + | + | + | ||||||||||
| Munasqa RR | MR | + | + | + | ||||||||||
| Nueva Andrea 66 | MR | + | + | + | + | + | ||||||||
| Qaylla RR | ND | + | + | + | + | |||||||||
| A8000 | MR | + | + | + | ||||||||||
* Results of field evaluations carried out in two different crop seasons in macroplots located in different regions of NW Argentina, under natural inoculum conditions. R: resistant; S: susceptible; MR: moderately resistant. ND: not determined. (+) Indicates the presence of the SSRs associated with the different QTLs in the genotypes analyzed. **Reference resistant genotype for SDS. ND, no phenotypic data available. aQTLs in LG- G, bQTLs in LG C2, cQTLs in LG I.
Disclaimer/Publisher’s Note: The statements, opinions and data contained in all publications are solely those of the individual author(s) and contributor(s) and not of MDPI and/or the editor(s). MDPI and/or the editor(s) disclaim responsibility for any injury to people or property resulting from any ideas, methods, instructions or products referred to in the content. |
© 2026 by the authors. Licensee MDPI, Basel, Switzerland. This article is an open access article distributed under the terms and conditions of the Creative Commons Attribution (CC BY) license.
Copyright: This open access article is published under a Creative Commons CC BY 4.0 license, which permit the free download, distribution, and reuse, provided that the author and preprint are cited in any reuse.


