Submitted:
10 February 2026
Posted:
11 February 2026
You are already at the latest version
Abstract
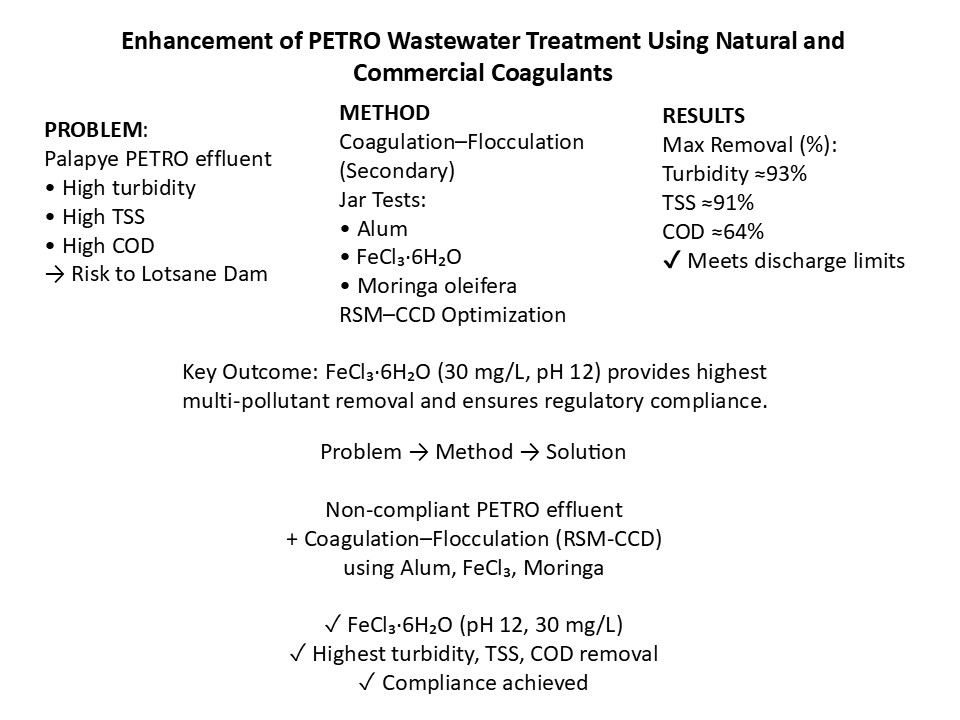
Water pollution due to insufficient wastewater treatment is a global concern. In this paper coagulation and flocculation as a tertiary unit process was investigated to find the solution for a non-complying wastewater treatment facility. The Palapye Pond Enhanced Treatment and Operation (PETRO) system has not been compliant for a long time with effluent characterised by high turbidity, Biological Oxygen Demand/Chemical Oxygen Demand (BOD/COD), Total Suspended Solids (TSS), Nitrates (NO3), and Phosphates (PO4.) The effluent from the plant is released into the stream that drains into the nearby Lotsane dam, posing a lot of danger to the water quality of the dam. The main objective of the project was to investigate the effect of coagulation and flocculation processes at the secondary stage of the wastewater treatment. Response Surface Methodology (RSM), Central Composite Design (CCD) and Multi Response Surface (MRS) were used to optimize the coagulation process and generate regression models to predict the coagulation and flocculation. The performance was evaluated using turbidity, Colour, COD and TSS as response variables. Response surface analysis indicated that the experimental data could be adequately Fitted to quadratic polynomial models. Under optimum conditions the removal efficiency for Al2(SO4)3·18H2O: 91.1% (turbidity), 88.2% (colour), 58.9% (COD), 83.0% (TSS); for FeCl3·6H2O: 93.2%, 88.7%, 63.8%, 91.3%; for Moringa: 91.8%, 85.4%, 56.6%, 83.7%. The optimal removals based on MRS for Al2(SO4)3.18H2O, FeCl3.6H2O and Moringa were 90.7%, 89.7%, 59.9% and 88.5%; 94.7%, 90.8%, 58.1% and 93.8%; 94.0%, 87.2%, 60.1% and 82.1% for turbidity, colour, COD and TSS respectively. This research has demonstrated that the coagulation/flocculation process can be incorporated into the secondary stage of the wastewater treatment facility and the treatment process optimized using RSM, CCD and MRS. The study introduces comparative evaluation of three coagulants within a single RSM-CCD optimization framework, employing desirability functions for multi-response optimization.
Keywords:
response surface methodology
; central composite design
; multi response surface
; ph-induced coagulation
; flocculation
; petro
; wastewater treatment
1. Introduction
Wastewater treatment is a critical process aimed at eliminating pollutants and contaminants from water after it has been utilized, ensuring that the treated water meets acceptable environmental standards before being released. Two predominant methods for wastewater treatment are widely employed: the Activated Sludge (AS) system and the Pond system [1,2]. The selection between these two approaches hinges on factors such as available land and capital resources. The Pond system necessitates ample land, while the AS system is typically adopted in areas with limited land but requires significant initial capital investments.
Over time, both these wastewater treatment systems encounter challenges, whether due to a burgeoning population, exerting excessive loads beyond their original design capacity, or operational and maintenance issues. Achieving enhanced treatment efficiency within these systems mandates rigorous maintenance and operational protocols or expansion to accommodate increased treatment demands. Additional unit processes may also be incorporated to achieve the desired treatment efficiency.
Recent research by [3], evaluating the performance of the Palapye Waste Stabilization Ponds (WSPs), revealed that the system was not meeting its intended performance due to several operational problems. One significant limitation of this system was its inability to sufficiently remove suspended solids (SS) to meet the required standards, as highlighted by [4]. To address this issue, the Palapye pond system was upgraded in 2005, incorporating trickling filters (TFs) followed by humus tanks (HTs) to separate solids from the effluent before disinfection. This combined system is referred to as the PETRO system, where the effectiveness of the TFs relies on the preliminary organic material removal by the waste stabilization ponds.
In response to the limitations of existing wastewater treatment methods, chemical coagulation followed by flocculation has emerged as a primary treatment stage. [5] recommended the use of chemical coagulation as a pre-treatment for municipal wastewater. This approach has been studied in various industrial contexts, including textile [6], dairy [7], pulp/paper [8], and even in leachate treatment from landfills [9]. Additionally, the utilization of natural coagulants has been explored in diverse wastewater treatment scenarios, including oil refineries [10], textile industries [11], and municipal wastewater treatment [12].
However, it is important to note that the majority of these studies have focused on the primary stage of wastewater treatment. This study introduces several novel contributions: (1) it comparatively evaluates three distinct coagulants (Al2(SO4)3·18H2O, FeCl3·6H2O, and Moringa) within a single framework; (2) it employs Response Surface Methodology (RSM) with Central Composite Design (CCD) to systematically optimize multiple factors and their interactions; and (3) it utilizes a desirability function approach to simultaneously optimize multiple water quality parameters (turbidity, colour, COD, and TSS). The principal objective is therefore to investigate the impact of coagulation and flocculation processes in the secondary stage of treatment, utilizing these innovative approaches.
1.1. Study Area
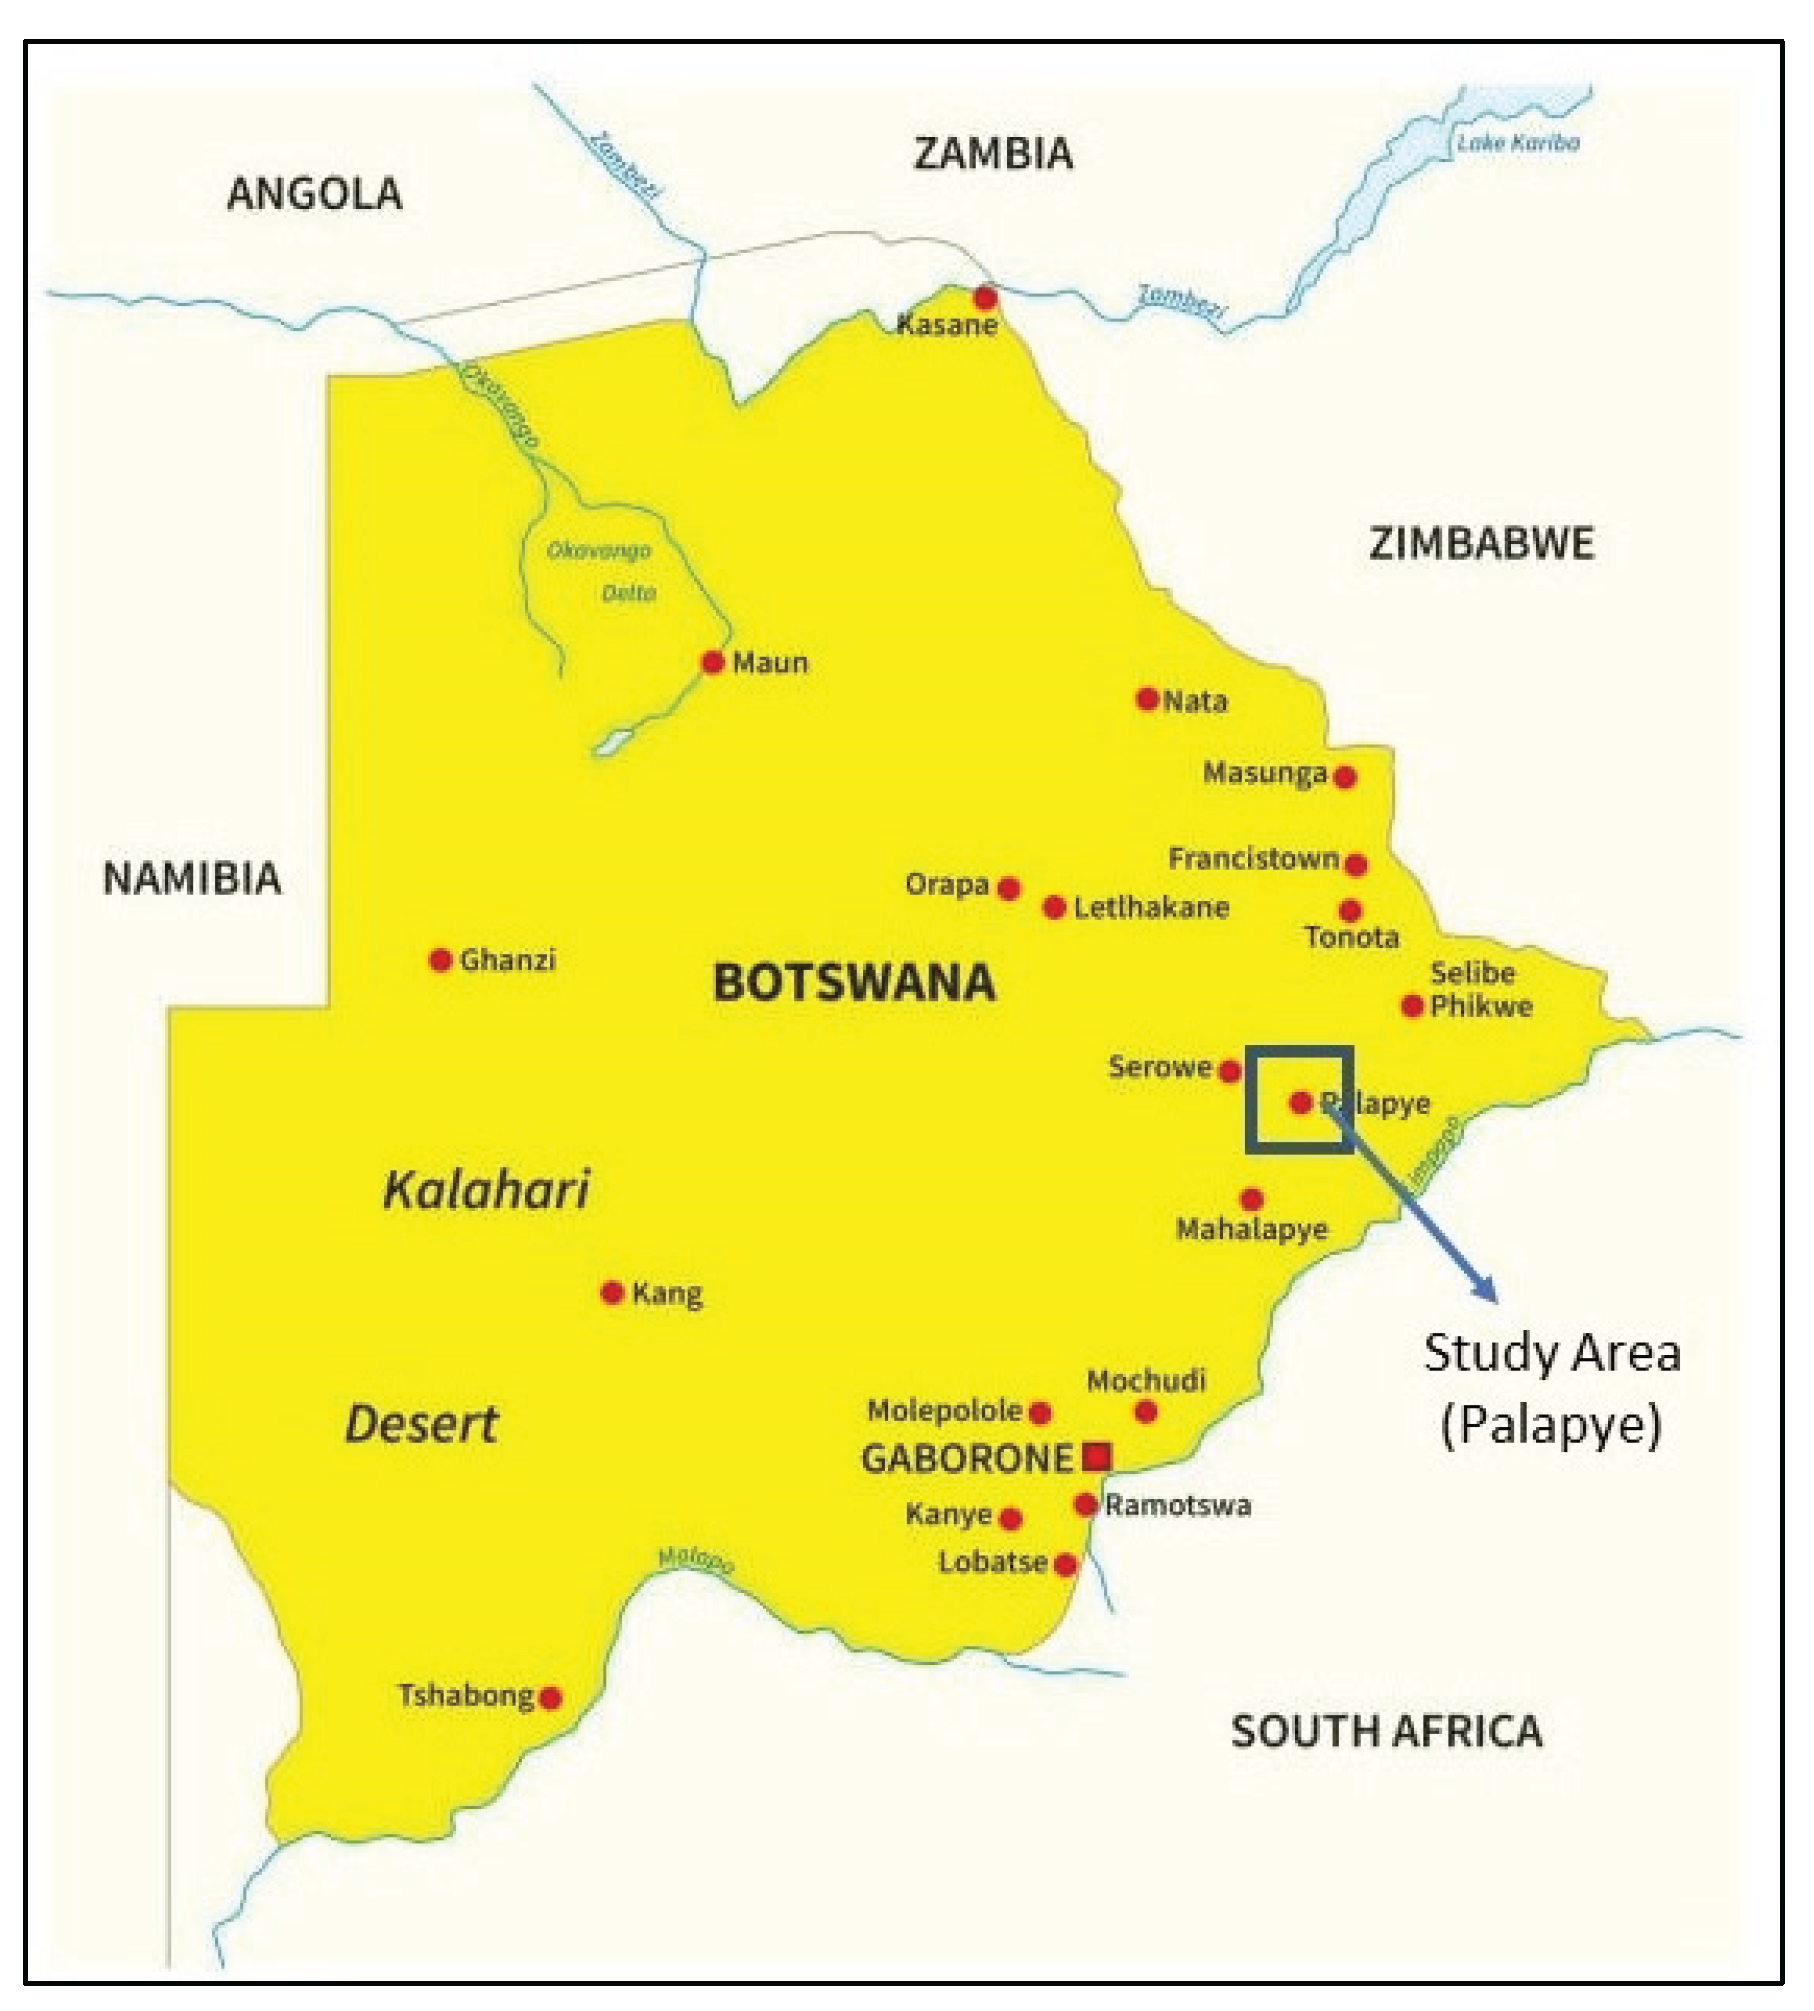
Palapye is a large village in Botswana with suburbs and is growing rapidly. Originally Palapye served as a railway siding. It is situated in the Central District some 271 km from the capital Gaborone along the A1 Road as you travel towards the northern side of the country. The Palapye 2011 population census was 37, 000. Located 5 km to the west of the village is the Morupule coal mine and power station that supplies electricity to the whole country of Botswana. The construction to expand the power station to meet the demand of the country started in 2010, with the construction of the Morupule Power B station. The geographical location of Palapye wastewater treatment plant (PWWTP) is latitude 22032′26.13” S and longitude 27010′22.65” E. The treatment plant is located northeast of the village. The Palapye Petro system comprises of 4 facultative ponds (FPs), 1 primary and 3 secondary ponds; and 6 oxidation ponds as a primary treatment stage. In this system the TF and HT, all which make a secondary treatment are used. The FP 1, TFs and HTs, were introduced to enhance the performance of the already existing pond system that consisted of 3 anaerobic ponds (APs), 2 FPs and 4 maturation ponds (MPs).
Figure 1.
Location of the Palapye Wastewater Treatment plant PWWTP) Study Area, Botswana.
2. Materials and Methods
2.1. Sampling
The samples were collected between the TFs and the HTs, using 25-liter containers and subsequently transported to the Mmamashia laboratory for jar tests. The collected TF effluent and jar test samples were meticulously preserved and analyzed for turbidity, colour, COD, and TSS, in accordance with the Standard Methods for the Examination of Water and Wastewater (23rd Edition) [13]. Sampling was conducted on eight occasions between March and September 2020. Preliminary studies involved triplicate testing for each parameter. Subsequently, the 39 experimental runs required by the Response Surface Methodology (RSM) design were performed with a single test per parameter. All collected samples were stored in a cold room maintained at a temperature range of 6 to 8 °C and analyzed immediately upon arrival at the laboratory.
Figure 2.
The Schematic diagram of the Pond Enhanced Treatment and Operation (PETRO) System at Palapye wastewater treatment plant.
Figure 2.
The Schematic diagram of the Pond Enhanced Treatment and Operation (PETRO) System at Palapye wastewater treatment plant.
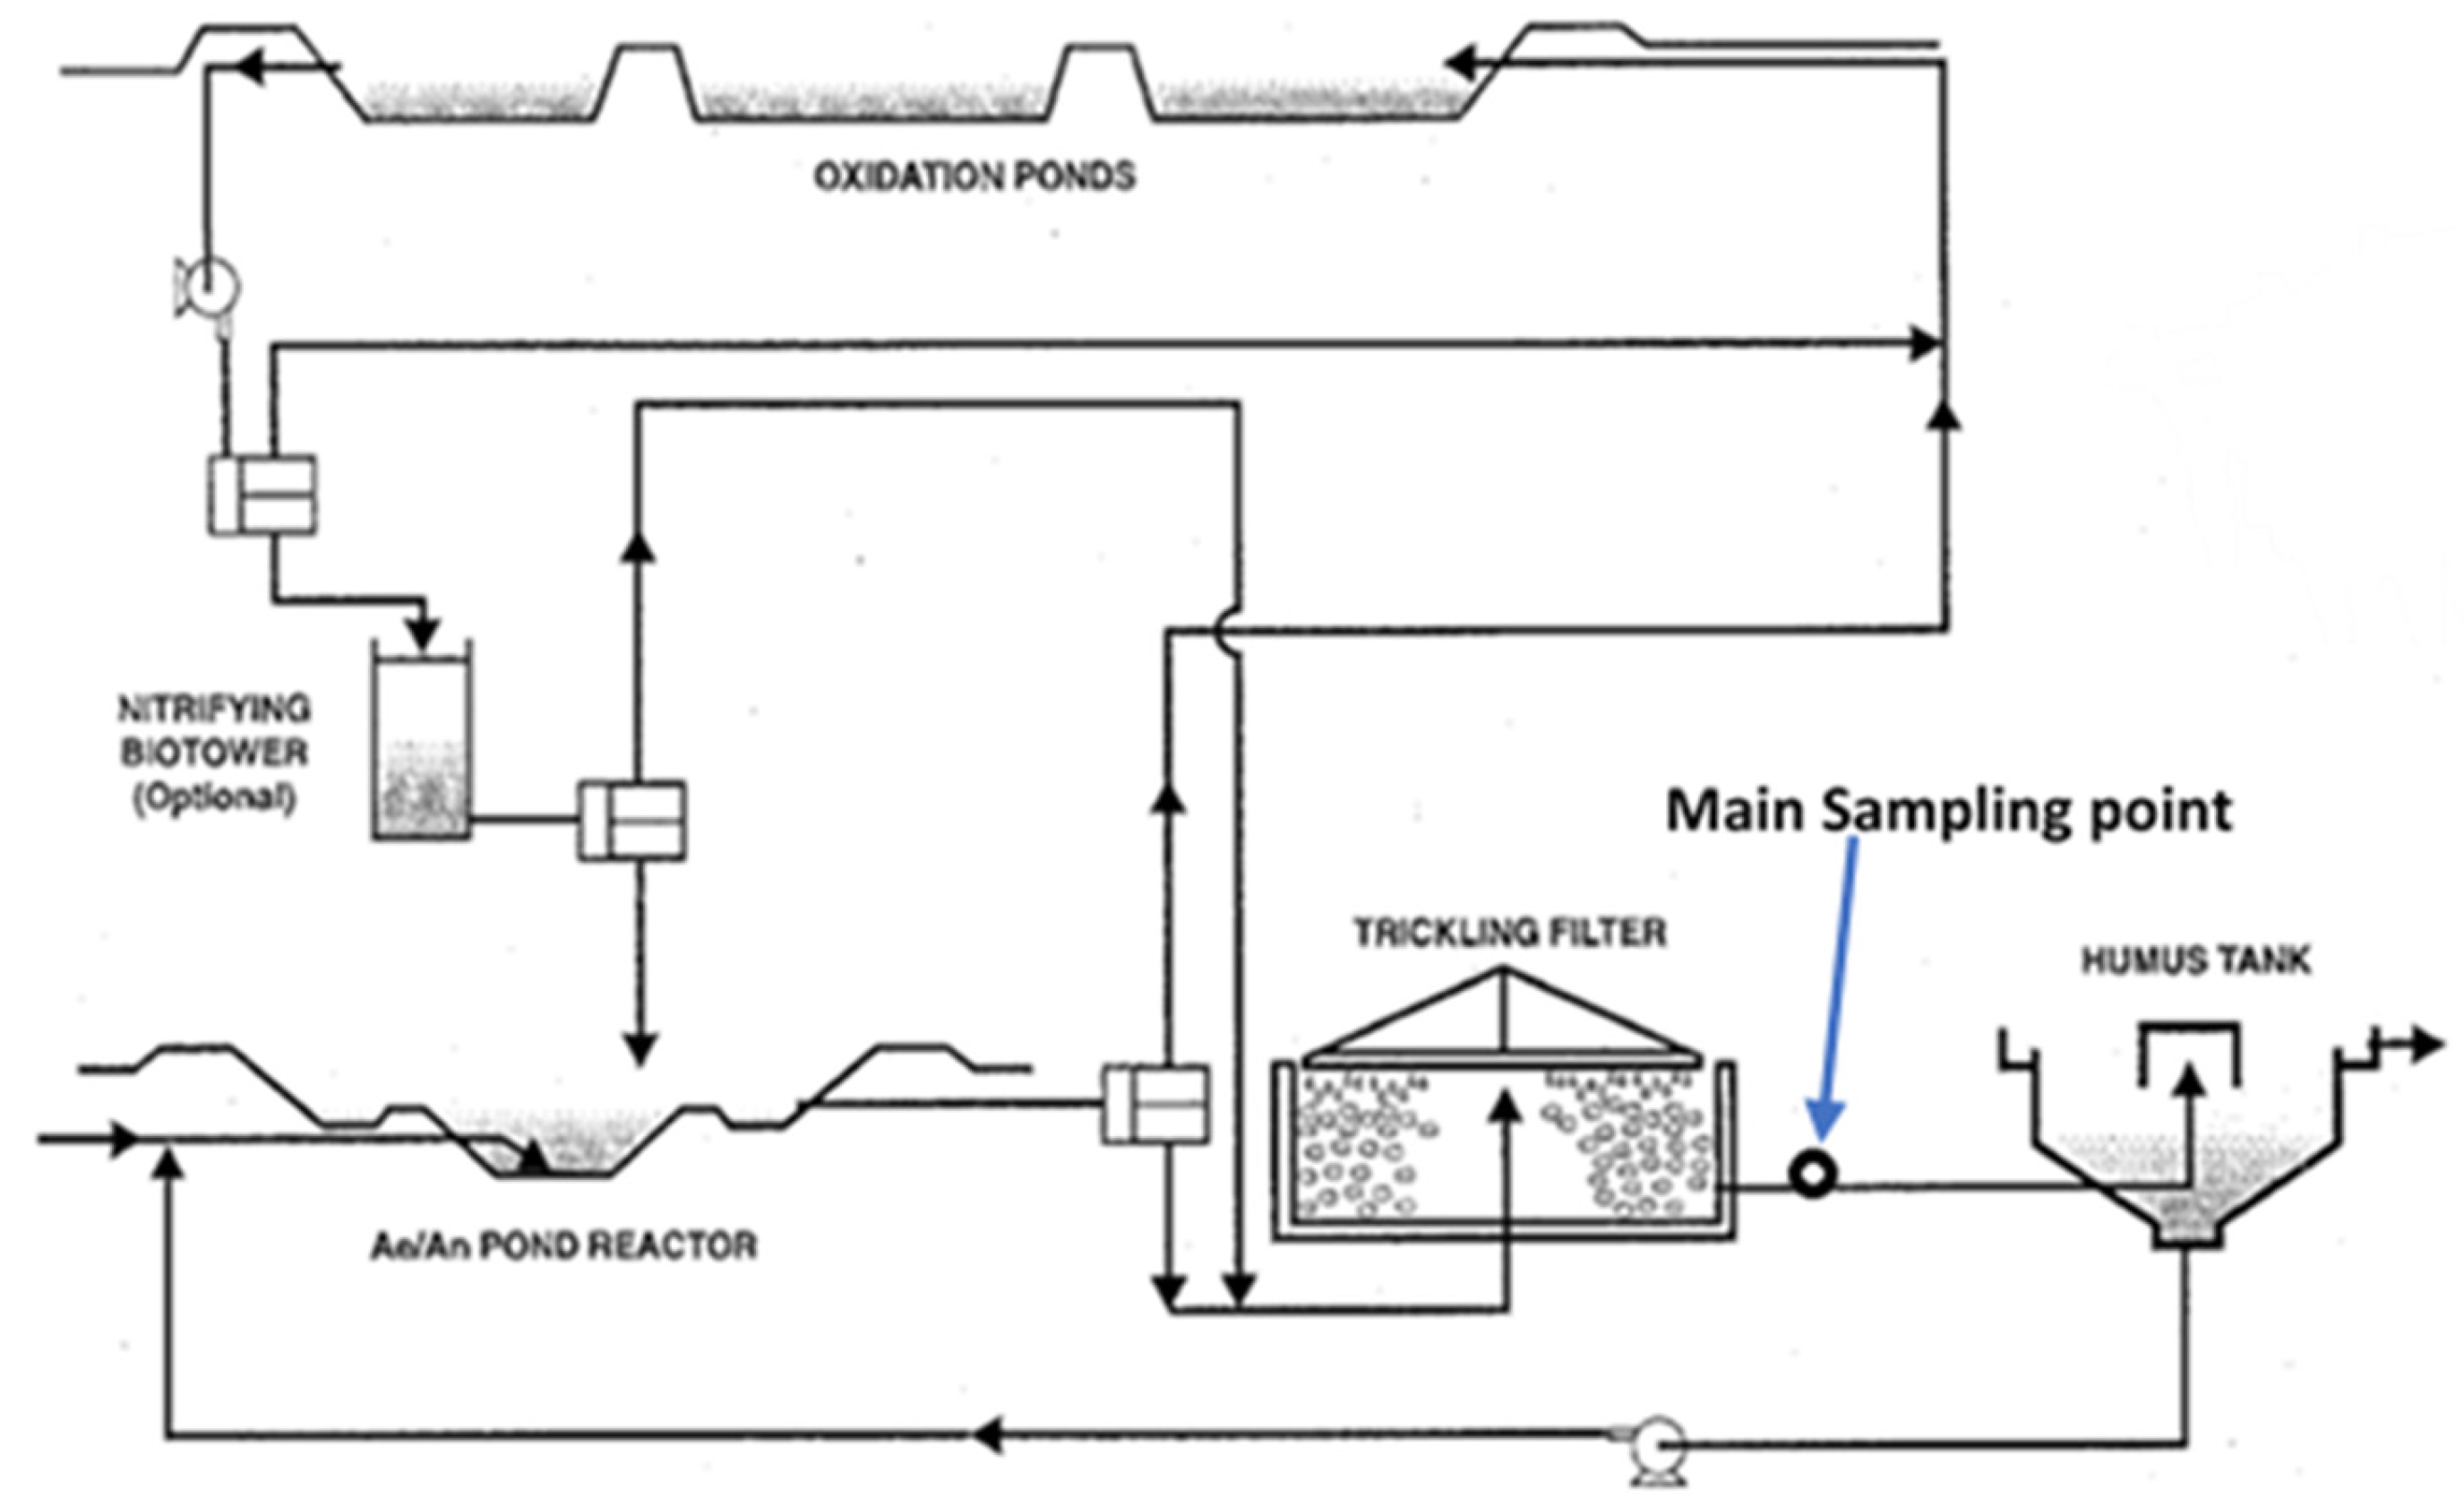
The Pond Enhanced Treatment and Operation (PETRO) system is an integrated wastewater treatment process that combines natural and engineered systems to effectively treat sewage and industrial effluents. The system typically includes oxidation ponds, where algae and aerobic bacteria work synergistically to degrade organic matter. A nitrifying biotower facilitates the conversion of ammonia to nitrates, while a trickling filter further breaks down pollutants through a biofilm of microorganisms. Settled biological solids are removed in a humus tank, and an Anaerobic/Anoxic (AL/An) pond reactor promotes denitrification and anaerobic digestion, converting nitrates to nitrogen gas and breaking down organic matter in oxygen-deprived conditions. This multi-stage approach ensures comprehensive removal of organic pollutants, nutrients, and pathogens, making the PETRO system a robust solution for sustainable wastewater treatment.
2.2. Materials
The following materials were used in this study: Aluminium sulfate octadecahydrate (Al2(SO4)3.18H2O) from Sigma-Aldrich (Lot number BCBX4913) Iron (III) chloride hexahydrate (FeCl3.6H2O) from Sigma-Aldrich (Lot number STBJ3986) Organic Moringa olifera powder (Batch 20003, imported and marketed by Tech-Link). Nitric acid (HNO3) from Sigma-Aldrich (Lot number MKCJ9713). Sodium hydroxide (NaOH) from Sigma-Aldrich (Lot number SLCC8729). All chemicals were of analytical grade.
2.3. Statistical Analysis and Model Evaluation
Statistical analysis was performed using Design Expert software (version 12, StatEase, USA). Polynomial models were fitted to the experimental data, and model selection was guided by FIT statistics including R2, adjusted R2, predicted R2, and adequate precision. Model terms with p-values < 0.05 were considered statistically significant. Analysis of Variance (ANOVA) was used to assess overall model significance, with F-tests evaluating regression coefficients. The lack-of-FIT test was examined to ensure model adequacy, and diagnostic plots (normal probability plots, residuals vs. predicted, etc.) were used to verify ANOVA assumptions.
In addition to the diagnostic statistics generated by Design Expert software, external validation was performed using 6 independent experimental runs (not included in the original 39-run CCD design). These validation experiments were conducted at random points within the design space, and predicted values from the regression models were compared with actual measured values using percent error and root mean square error (RMSE) calculations. Additionally, residual analysis was performed to check for homoscedasticity and normal distribution of errors.
2.4. Model Graphs
Model graphs were employed to aid in interpreting the selected model. A 3D Surface plot illustrated how the response varied as factors changed in a three-dimensional display encompassing the actual design points. These plots depicted the impact of Al2(SO4)3.18H2O, FeCl3.6H2O, and Moringa dosage on turbidity, colour, COD, and TSS as pH and dosage changed.
2.5. Quality Assurance and Replication
All jar test experiments were conducted in triplicate to ensure reproducibility, and results are reported as mean ± standard deviation. Laboratory blanks and control samples (without coagulant) were included in each experimental run. Analytical measurements followed [13] with appropriate quality controls: turbidity was measured using a calibrated Hach 2100N turbidimeter with daily verification against standard formazin suspensions; COD analyses included potassium hydrogen phthalate standards and blank corrections; TSS determinations used pre-weighed glass fiber filters (Whatman GF/C) dried at 105 °C to constant weight. Instrument calibration was verified before each analytical batch.
2.6. Final Equation in Terms of Coded and Actual Factors
The regression computations were performed using the coded scale, allowing predictions about the response for specific factor levels. High levels were coded as +1, and low levels as -1 by default. The coded equation was valuable for comparing factor coefficients’ relative impact. Subsequently, the coded model was converted to the actual model, represented by the final equation in terms of actual factors.
2.7. Response Surface Methodology
The data acquired from preliminary studies was employed in conjunction with the Central Composite Design (CCD, rotatable) and Response Surface Methodology (RSM) to optimize coagulation and flocculation parameters. The efficiency of pollutant removal was calculated using the following equation:
where:
= the initial concentration
= the final concentration
The limitations of the one-factor-at-a-time (OFAOT) approach, including its time and resource-intensive nature, limited statistical analysis, and inability to bridge gaps between tested values, prompted the adoption of Response Surface Methodology (RSM). RSM is a statistical technique capable of comprehensively evaluating experimental data and developing mathematical models [14].
It’s worth noting that [15] highlighted the scarcity of studies utilizing RSM to model coagulant dosage. In the literature, RSM has been applied with various experimental designs, including the Box-Behnken design [15], Central Composite Design (CCD) [14,16], and Uniform Design (UD) [17]. The primary objective of our Design of Experiment (DOE) was to determine factor settings that maximize the removal efficiency of turbidity, colour, Chemical Oxygen Demand (COD), and Total Suspended Solids (TSS) for optimizing the treatment process.
To achieve this, we employed Central Composite Design (CCD) and Response Surface Methodology (RSM) using Design Expert (DX) software version 12, obtained from StatEase, Minneapolis, MN, USA. The categorical factor in our study consisted of three levels: Al2(SO4)3·18H2O, FeCl3·6H2O, and Moringa. These coagulants were evaluated based on their effectiveness in achieving optimum dosage and pH for turbidity, colour, COD, and TSS removal. The equation model used for predicting the optimal conditions is as follows [18]:
where:
i—represents the linear coefficient.
j—represents the quadratic coefficient.
β—denotes the regression coefficient.
k—signifies the number of factors studied and optimized in the experiment.
e—represents the random error.
We conducted a total of 39 experimental runs, as recommended by CCD for robust design purposes. Table 1 below presents the actual and coded values for the independent variables and their respective levels used in the RSM and CCD experimental design:
3. Results
3.1. Preliminary Experiments
Preliminary studies were conducted to establish the optimum conditions for coagulation and flocculation using aluminum sulfate (Al2(SO4)3·18H2O), ferric chloride (FeCl3·6H2O), and Moringa oleifera seed extract. The initial stage focused on identifying the optimum pH for turbidity removal.
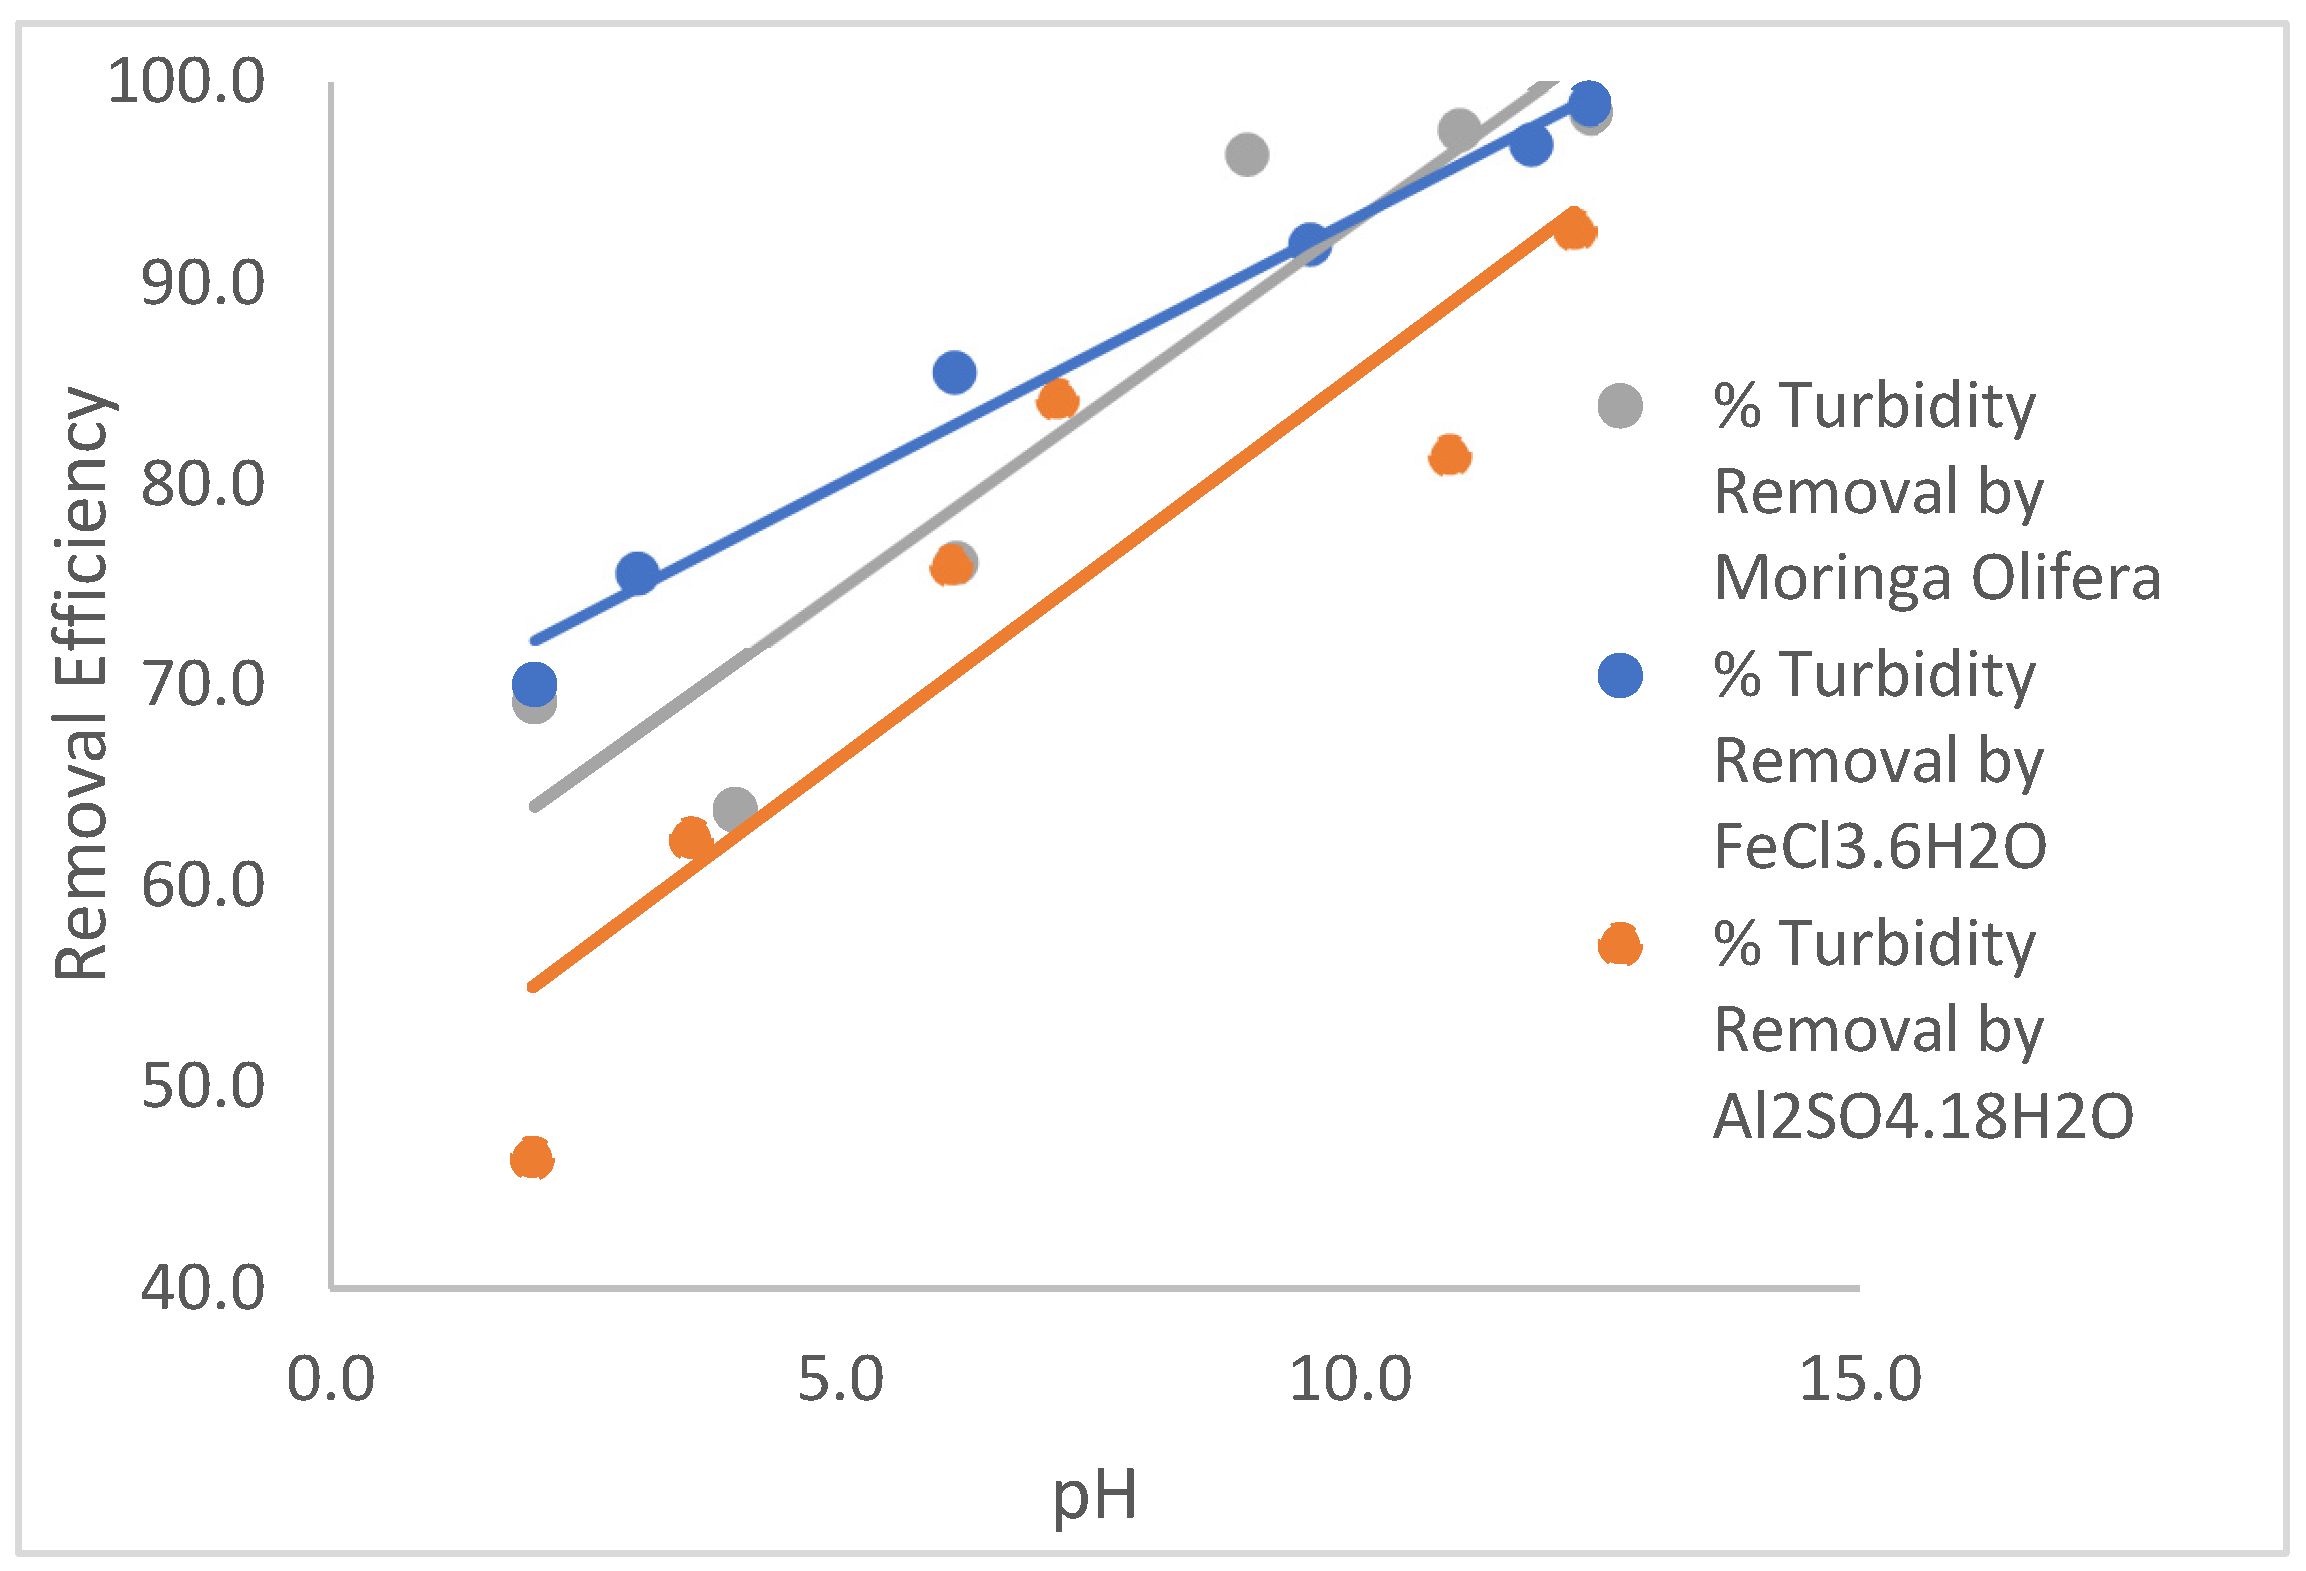
As shown in Table 2, turbidity removal efficiency increased with increasing pH for all three coagulants, confirming that coagulation–flocculation performance is strongly influenced by pH. Ferric chloride exhibited the highest removal efficiencies across most pH levels, reaching nearly 99% at pH 12.4. Moringa showed comparable removal to ferric chloride at alkaline pH (> 9), while aluminum sulfate demonstrated effective removal across a broader pH range, achieving over 90% at pH 12.2. This trend aligns with observations by [19] and [20], who reported enhanced coagulation–flocculation with increasing pH.
The improvement in turbidity removal with pH adjustment can be explained by charge neutralization. As NaOH added, sodium ions (Na+) increase in solution, reducing electrostatic repulsion among colloidal particles and promoting aggregation and settling [21]. This explains why turbidity removal at 0 mg/L coagulant dosage was not 0% (Figure 3, Figure 4 and Figure 5); the sodium ions themselves induced partial coagulation even without added coagulant.
Correlation analysis between pH and turbidity removal (Figure 3) further illustrates these differences. Ferric chloride showed the strongest linear correlation (R2 = 0.9805), indicating a highly pH-sensitive mechanism. Moringa also demonstrated a strong relationship (R2 = 0.879), while aluminum sulfate exhibited a moderate dependence (R2 = 0.819). These findings highlight the importance of both coagulant choice and pH optimization in maximizing turbidity removal, with ferric chloride being the most pH responsive.
In addition to turbidity, removal of color, COD, and TSS was evaluated across varying coagulant dosages at optimum pH. Table 3 and Figure 4 present the performance of aluminum sulfate. Turbidity removal exceeded 99% at dosages above 10 mg/L, while color and COD removals were consistently above 80% and 40%, respectively. TSS removal reached over 90% at higher dosages. This demonstrates that aluminum sulfate is highly effective in reducing particulate matter and color, with modest performance in COD reduction.
Similarly, Table 4 and Figure 5 show the performance of ferric chloride. High turbidity removal (≥ 99%) was observed even at the lowest tested dosage, while color removal steadily increased to 82% at 20–50 mg/L. COD removal remained in the range of 40–42%, with TSS removal reaching up to 100% at 50 mg/L. These results confirm ferric chloride’s superior capacity for turbidity and TSS reduction, although COD removal remained moderate.
The performance of Moringa as a natural coagulant is summarized in Table 5 and Figure 6. At low dosages (≤ 10 mg/L), Moringa achieved turbidity removal above 99% and color removal around 75–77%. However, at higher dosages (> 20 mg/L), its efficiency declined, with turbidity removal dropping to 98.7% and color removal decreasing to as low as 44.5% at 100 mg/L. COD and TSS removals also decreased with higher dosage, suggesting that overdosing with Moringa leads to particle restabilization or re-dispersion due to excess organic matter from the coagulant itself.
Overall, the preliminary experiments (Table 5 and Figure 6) demonstrate that ferric chloride is the most consistent coagulant across parameters, providing high turbidity and TSS removal over a wide dosage and pH range. Aluminum sulfate performs comparably for turbidity and color removal but with slightly lower COD removal efficiency. Moringa, although highly effective at low dosages, shows reduced efficiency at higher concentrations, indicating the need for careful dosage optimization when using it as a sustainable, natural alternative.
3.2. Response Surface Methodology
Table 6 presents the characterization of trickling filter (TF) effluent and the pH levels for the stock solution. The preparation of stock solutions for the coagulants involved weighing 10 g of each coagulant and dissolving it in a 1000 ml volumetric flask filled with tap water. However, it’s important to note that due to Moringa’s tendency to float in water, the 1000 ml water was transferred into a beaker for the solution to be prepared effectively.
3.2.1. Descriptive and FIT Statistics
In Table 7, we present the descriptive and FIT statistics for our models. The evaluation of these models is based on p-values, where p-values less than 0.05 indicate that model terms are significant, while values greater than 0.10 suggest that the model terms are not significant. For our turbidity model, we identified that the terms A, B, C, AB, AC, and A2 are significant model terms. Additionally, the BC term was included to maintain the hierarchy of the model. The Model F-value of 111.47 indicates the significance of the model, with only a 0.01% chance that such a large F-value could occur due to random noise.
To assess the acceptability of our models, we employed several criteria, including: (1) the difference between the Predicted R2 and Adjusted R2, and (2) the signal-to-noise ratio measured by Adequate Precision. For the turbidity model, we determined its acceptance by evaluating the difference between the Predicted R2 (0.9481) and Adjusted R2 (0.9676). The resulting difference of 0.0195 was found to be less than the threshold of 0.2, indicating the model’s suitability. Additionally, we measured the signal-to-noise ratio for this model, which resulted in a ratio of 41.454, significantly exceeding the threshold of 4. This high ratio signifies that the model provides an adequate signal for navigating the design space.
In assessing the Lack of fit test, our goal is for the model to fit the data well. The Lack of fit F-value of 1.70 suggests that the Lack of fit is not significant in comparison to the pure error. There is a 17.89% chance that a Lack of fit F-value of this magnitude could occur due to random noise. These statistical analyses provide valuable insights into the significance and goodness-of-fit of our models, helping us make informed decisions regarding their utility and reliability.
Similar assessments were conducted for the remaining models, ensuring that all met the necessary criteria for acceptance. These rigorous evaluations confirm the reliability of our models and their effectiveness in guiding our research and design processes.
Figure 7.
Correlation analysis between pH and turbidity removal efficiency for Al2(SO4)3·18H2O, FeCl3·6H2O, and Moringa oleifera coagulants, illustrating the linear relationships and R2 values.
Figure 7.
Correlation analysis between pH and turbidity removal efficiency for Al2(SO4)3·18H2O, FeCl3·6H2O, and Moringa oleifera coagulants, illustrating the linear relationships and R2 values.
3.3. External Model Validation
The regression models were validated using six independent experimental runs. The predicted versus actual values for key responses are summarized in Table 8. The average percent error for turbidity, colour, COD, and TSS predictions were 3.2%, 4.8%, 7.1%, and 5.5%, respectively, with corresponding RMSE values of 0.41 NTU, 8.7 mg/L Pt-Co, 5.2 mg/L O2, and 1.8 mg/L. These low error metrics confirm the models’ robustness and predictive capability within the defined design space.
4. Discussion
4.1. Interpretation of Coagulant Performance and Mechanisms
The comparative evaluation of Al2(SO4)3·18H2O, FeCl3·6H2O, and Moringa oleifera seed powder within a single RSM-CCD framework revealed distinct performance profiles and mechanistic behaviors. The superior turbidity and TSS removal efficiency of FeCl3, particularly at high pH, aligns with established literature on ferric salts, which are effective across a broad pH range due to the formation of highly charged polymeric species like Fe(OH)3+ that enhance charge neutralization and sweep flocculation [23,24]. The strong linear correlation (R2 = 0.9805) between pH and turbidity removal for FeCl3 underscores its high pH-sensitivity, likely due to the increased precipitation of ferric hydroxide at alkaline conditions, which enmeshes colloidal particles.
Conversely, the performance decline of Moringa at dosages exceeding 20 mg/L is a critical finding. This phenomenon, where increasing coagulant dosage reduces removal efficiency, is characteristic of restabilization via charge reversal. Moringa proteins (cationic polypeptides) initially neutralize negatively charged particles. However, excess dosage can lead to an overall positive charge on particle surfaces, reinstating electrostatic repulsion and causing dispersion [9,25]. Furthermore, the leaching of soluble organic matter from the Moringa powder at high doses may increase the soluble COD and colour of the effluent, as observed in our results (Table 5). This highlights a significant operational constraint for natural coagulants: their optimal dosage window is narrow and must be precisely controlled, unlike the broader effective ranges of metal-based coagulants.
Alum demonstrated consistent, robust performance, particularly for turbidity and colour removal. Its mechanism is primarily based on the formation of Al(OH)3 precipitates that adsorb and entrain contaminants. Its moderate pH dependence (R2 = 0.819) suggests effective performance across a wider operational pH band, making it a reliable, if less pH-optimized, alternative to FeCl3 for the parameters studied.
4.2. Insights from RSM Optimization and Model Validity
The application of RSM with a Central Composite Design proved highly effective in modeling the complex, non-linear interactions between pH, coagulant dosage, and multiple response variables. The high R2 values (>0.97 for turbidity, colour, and COD) and insignificant lack-of-FIT tests (p > 0.05) for the primary models confirm that the quadratic polynomial models adequately represent the system within the experimental domain. The successful external validation, with low prediction errors (e.g., average RMSE of 5.mg/L for COD), affirms the models’ robustness and practical utility for predicting treatment outcomes under varied conditions.
The multi-response optimization using desirability functions provided a pragmatic solution to the common engineering challenge of balancing competing treatment goals. For instance, maximizing turbidity removal often required higher pH, which had a less pronounced effect on COD reduction. The desirability approach allowed for the identification of a compromise optimum that achieved high performance across all four key water quality indicators, demonstrating a methodology superior to single-parameter optimization [28,29].
4.3. Regulatory Compliance and Economic Viability
The core impetus for this study was the longstanding non-compliance of the Palapye PETRO system. When evaluated against Botswana’s Effluent Standards for Wastewater Discharge [4], the optimized coagulation process presents a viable solution for compliance. The relevant standards for discharge into a dam (Lotsane) typically include limits for TSS, COD, and turbidity. Under the optimal conditions identified for FeCl3·6H2O (30 mg/L, pH 12), the treated effluent quality was assessed for compliance, as summarized in Table 9.
This analysis confirms that integrating a coagulation-flocculation unit between the trickling filters and humus tanks can bring the plant into full regulatory compliance for the critical parameters of TSS, COD, and turbidity. The economic analysis indicates a manageable operational cost, with FeCl3 at approximately $0.018/m3. While Moringa offers a lower chemical cost ($0.008/m3), its sensitivity to overdosing and lower COD removal efficiency necessitates more sophisticated dosing control, potentially increasing operational complexity and cost [31,33]. Therefore, for guaranteed, consistent compliance, FeCl3 is recommended despite its slightly higher chemical cost. The capital investment for dosing equipment ($15,000–$20,000) is modest compared to the cost of major plant upgrades or non-compliance penalties.
4.4. Limitations and Recommendations for Future Work
This study was conducted at the laboratory (jar-test) scale, which is an essential first step but has inherent limitations. Scaling up to full plant operation may introduce variables such as fluctuating inflow characteristics, imperfect mixing, and differences in settling dynamics [27,30]. Therefore, a pilot-scale trial is strongly recommended as the next step before full implementation.
Furthermore, the study focused on physicochemical parameters (turbidity, colour, COD, TSS). Future work should investigate the impact of this coagulation stage on downstream processes, particularly disinfection (e.g., chlorine demand may change) and the fate of nutrients (Nitrates, Phosphates). The effect of sludge production from the added coagulants on the existing sludge handling processes at the plant also requires evaluation.
Lastly, while Moringa showed limitations in this secondary effluent context, its potential as a sustainable, low-cost pre-coagulant or in hybrid treatment schemes (e.g., combined with a reduced dose of FeCl3) warrants further investigation to harness its benefits while mitigating its drawbacks [32].
5. Conclusions
This study successfully demonstrates that coagulation-flocculation can be effectively integrated as a secondary treatment stage to remediate the longstanding non-compliance of the Palapye PETRO wastewater treatment system. The systematic application of Response Surface Methodology (RSM) with Central Composite Design (CCD) enabled the efficient optimization of multiple, interacting process variables—pH and coagulant dosage—for three distinct coagulants.
The key outcomes are as follows:
- Ferric chloride (FeCl3·6H2O) emerged as the most effective coagulant, achieving the highest and most consistent multi-parameter removal, particularly for turbidity and TSS, under alkaline conditions (pH 12, 30 mg/L). Aluminum sulfate provided robust performance, while Moringa oleifera, though cost-effective at low doses, exhibited a narrow optimal dosage window beyond which performance deteriorated due to restabilization.
- Statistically significant quadratic models were developed with high predictive accuracy (R2 > 0.97 for key parameters). External validation with independent experimental runs confirmed the models’ reliability for forecasting treatment outcomes within the defined operational space.
- Most significantly, the optimized process using FeCl3 produces an effluent that meets Botswana’s discharge standards for TSS (≤ 30 mg/L), COD (≤ 75 mg/L), and turbidity (≤ 10 NTU), directly addressing the plant’s core compliance failure.
- The research provides a clear, data-driven pathway for implementation. Coagulant dosing can be integrated into existing infrastructure between the trickling filters and humus tanks with modest capital investment. A preliminary economic analysis indicates operational costs are manageable, with FeCl3 representing the optimal balance of performance and reliability for ensuring consistent compliance.
Therefore, this work not only presents a viable technical solution for the Palapye facility but also offers a replicable methodology for optimizing and enhancing wastewater treatment systems in similar contexts globally.
Author Contributions
Conceptualization: N.M.B. and P.T.O.; Methodology: N.M.B.; Software: N.M.B.; Validation: N.M.B. & P.T.O.; Formal analysis: N.M.B.; Investigation: N.M.B.; Resources: P.T.O.; Data curation: N.M.B.; Writing—original draft: N.M.B.; Writing—review & editing: P.T.O.; Visualization: N.M.B.; Supervision: P.T.O.; Project administration: P.T.O. All authors have read and agreed to the published version of the manuscript.
Funding
This research received no external funding.
Data Availability Statement
The original contributions presented in this study are included in the article. Further inquiries can be directed to the corresponding author.
Acknowledgments
The authors acknowledge the support from the University of Botswana Department of Civil Engineering and the Mmamashia Water Utilities Corporation laboratory staff.
Conflicts of Interest
The authors declare no conflicts of interest.
Abbreviations
The following abbreviations are used in this manuscript:
| WSP | Waste Stabilization Pond |
| TSS | Total Suspended Solids |
| TF | Trickling Filter |
| SS | Suspended Solids |
| RSM | Response Surface Methodology |
| RMSE | Root Mean Square Error |
| PWWTP | Palapye Wastewater Treatment Plant |
| PETRO | Pond Enhanced Treatment and Operation |
| OFAOT | One-Factor-at-a-Time |
| MRS | Multi-Response Surface |
| MP | Maturation Pond |
| HT | Humus Tank |
| FP | Facultative Pond |
| FeCl3·6H2O | Ferric chloride hexahydrate |
| DOE | Design of Experiment |
| COD | Chemical Oxygen Demand |
| CI | Confidence Interval |
| CCD | Central Composite Design |
| BOD | Biological Oxygen Demand |
| AS | Activated Sludge |
| AP | Anaerobic Pond |
| ANOVA | Analysis of Variance |
| Al2(SO4)3·18H2O | Aluminum sulfate octadecahydrate |
References
- Metcalf & Eddy, Inc. Wastewater Engineering: Treatment and Resource Recovery; McGraw-Hill: New York, NY, USA, 2014.
- Mara, D.D. Domestic Wastewater Treatment in Developing Countries; Earthscan: London, UK, 2004.
- Gopolang, O.P.; Letshwenyo, M.W. Performance evaluation of Palapye waste stabilization ponds. J. Water Sanit. Hyg. Dev. 2018, *8*, 123–134. [CrossRef]
- Botswana Department of Water Affairs. Effluent Standards for Wastewater Discharge; Government Printer: Gaborone, Botswana, 2012.
- Sarparastzadeh, H.; Saeedi, M.; Naeeni, M.A.; Faezipour, M. Use of chemical coagulation as a pretreatment for municipal wastewater. Iran. J. Environ. Health Sci. Eng. 2007, *4*, 265–270.
- Verma, A.K.; Dash, R.R.; Bhunia, P. A review on chemical coagulation/flocculation technologies for removal of colour from textile wastewater. J. Environ. Manag. 2012, *93*, 154–168. [CrossRef]
- Parmar, K.A.; et al. Coagulation-flocculation treatment of dairy wastewater using alum and lime. Int. J. Chem. Sci. 2011, *9*, 1365–1372.
- Irfan, M.; et al. Treatment of pulp and paper mill effluent using coagulation-flocculation process. J. Environ. Chem. Eng. 2017, *5*, 4026–4034. [CrossRef]
- Marañón, E.; Fernández, Y.; Fernández, Y.; Castrillón, L. Removal of dissolved organic carbon from landfill leachate by coagulation–flocculation. Waste Manag. 2010, *30*, 862–868. [CrossRef]
- Oubrayme, M.; et al. Use of natural coagulants for refinery wastewater treatment. J. Water Process Eng. 2016, *14*, 108–115. [CrossRef]
- Hendrawati, H.; et al. Utilization of Moringa oleifera seed as natural coagulant for textile wastewater treatment. J. Environ. Sci. Technol. 2016, *9*, 84–92. [CrossRef]
- Maurya, S.; Daverey, A. Evaluation of plant-based natural coagulants for municipal wastewater treatment. 3 Biotech 2018, *8*, 77. [CrossRef]
- Standard Methods for the Examination of Water and Wastewater, 23rd ed.; American Public Health Association (APHA); American Water Works Association (AWWA); Water Environment Federation (WEF): Washington, DC, USA, 2017.
- Shaylinda, M.Z.N.; et al. Application of response surface methodology (RSM) for optimization of ammoniacal nitrogen removal from semi-aerobic landfill leachate using ion exchange resin. Desalination Water Treat. 2018, *128*, 334–343. [CrossRef]
- Machlor, A.; et al. Coagulation-flocculation process optimization using response surface methodology for landfill leachate treatment. Int. J. Environ. Sci. Dev. 2014, *5*, 312–317. [CrossRef]
- Fendri, I.; et al. Optimization of coagulation-flocculation process for landfill leachate treatment using response surface methodology. Environ. Technol. 2013, *34*, 1217–1224. [CrossRef]
- Wang, S.; et al. Optimization of coagulation process for water treatment using response surface methodology. J. Environ. Sci. 2011, *23*, 264–270. [CrossRef]
- Khayet, M.; et al. Optimization of reverse osmosis process for water treatment using response surface methodology. Desalination 2011, *268*, 89–98. [CrossRef]
- Wu, C.; et al. Interference of metal ions in COD determination during coagulation studies. Environ. Technol. 2012, *33*, 2453–2460. [CrossRef]
- Besson, F.; Guiraud, P. pH effect on coagulation performance of aluminum and iron salts. Water Sci. Technol. 2013, *68*, 1283–1289. [CrossRef]
- Pérez, A.G.; et al. pH-induced coagulation mechanisms in wastewater treatment. J. Water Process Eng. 2017, *19*, 120–128. [CrossRef]
- Botswana Department of Water Affairs. Effluent Standards for Wastewater Discharge; Government Printer: Gaborone, Botswana, 2012.
- Duan, J.; Gregory, J. Coagulation by hydrolysing metal salts. Adv. Colloid Interface Sci. 2003, *100-102*, 475–502. [CrossRef]
- Gan, Y.; Zhang, Y.; Song, Z.; Zheng, J.; Zhang, Z.; Wang, Y.; Zhang, Q. Ferric chloride versus alum: Which is more effective for coagulation? Water Sci. Technol. 2017, *76*, 289–297. [CrossRef]
- Ndabigengesere, A.; Narasiah, K.S.; Talbot, B.G. Active agents and mechanism of coagulation of turbid waters using Moringa oleifera. Water Res. 1995, *29*, 703–710. [CrossRef]
- Ndabigengesere, A.; Narasiah, K.S. Quality of water treated by coagulation using Moringa oleifera seeds. Water Res. 1998, *32*, 781–791. [CrossRef]
- Bratby, J. Coagulation and Flocculation in Water and Wastewater Treatment; IWA Publishing: London, UK, 2016.
- Montgomery, D.C. Design and Analysis of Experiments, 10th ed.; John Wiley & Sons: Hoboken, NJ, USA, 2019.
- Derringer, G.; Suich, R. Simultaneous optimization of several response variables. J. Qual. Technol. 1980, *12*, 214–219. [CrossRef]
- Gregory, J. Particles in Water: Properties and Processes; IWA Publishing: London, UK, 2006.
- Sánchez-Martín, J.; Ghebremichael, K.; Beltrán-Heredia, J. Comparison of single-step and two-step purified Moringa oleifera coagulant for surface water treatment. J. Water Health 2010, *8*, 294–306. [CrossRef]
- Matilainen, A.; Vepsäläinen, M.; Sillanpää, M. Natural organic matter removal by coagulation during drinking water treatment: A review. Adv. Colloid Interface Sci. 2010, *159*, 189–197. [CrossRef]
- Pritchard, M.; Mkandawire, T.; O’Neill, J.G. Biological, chemical and physical drinking water quality from shallow wells in Malawi: The case of Moringa oleifera as a natural coagulant. Phys. Chem. Earth 2007, *32*, 1167–1172. [CrossRef]
Figure 3.
Comparison of filtered turbidity removal efficiency for Al2(SO4)3.18H2O, FeCl3.6H2O, and Moringa oleifera coagulants across varying pH levels.
Figure 3.
Comparison of filtered turbidity removal efficiency for Al2(SO4)3.18H2O, FeCl3.6H2O, and Moringa oleifera coagulants across varying pH levels.
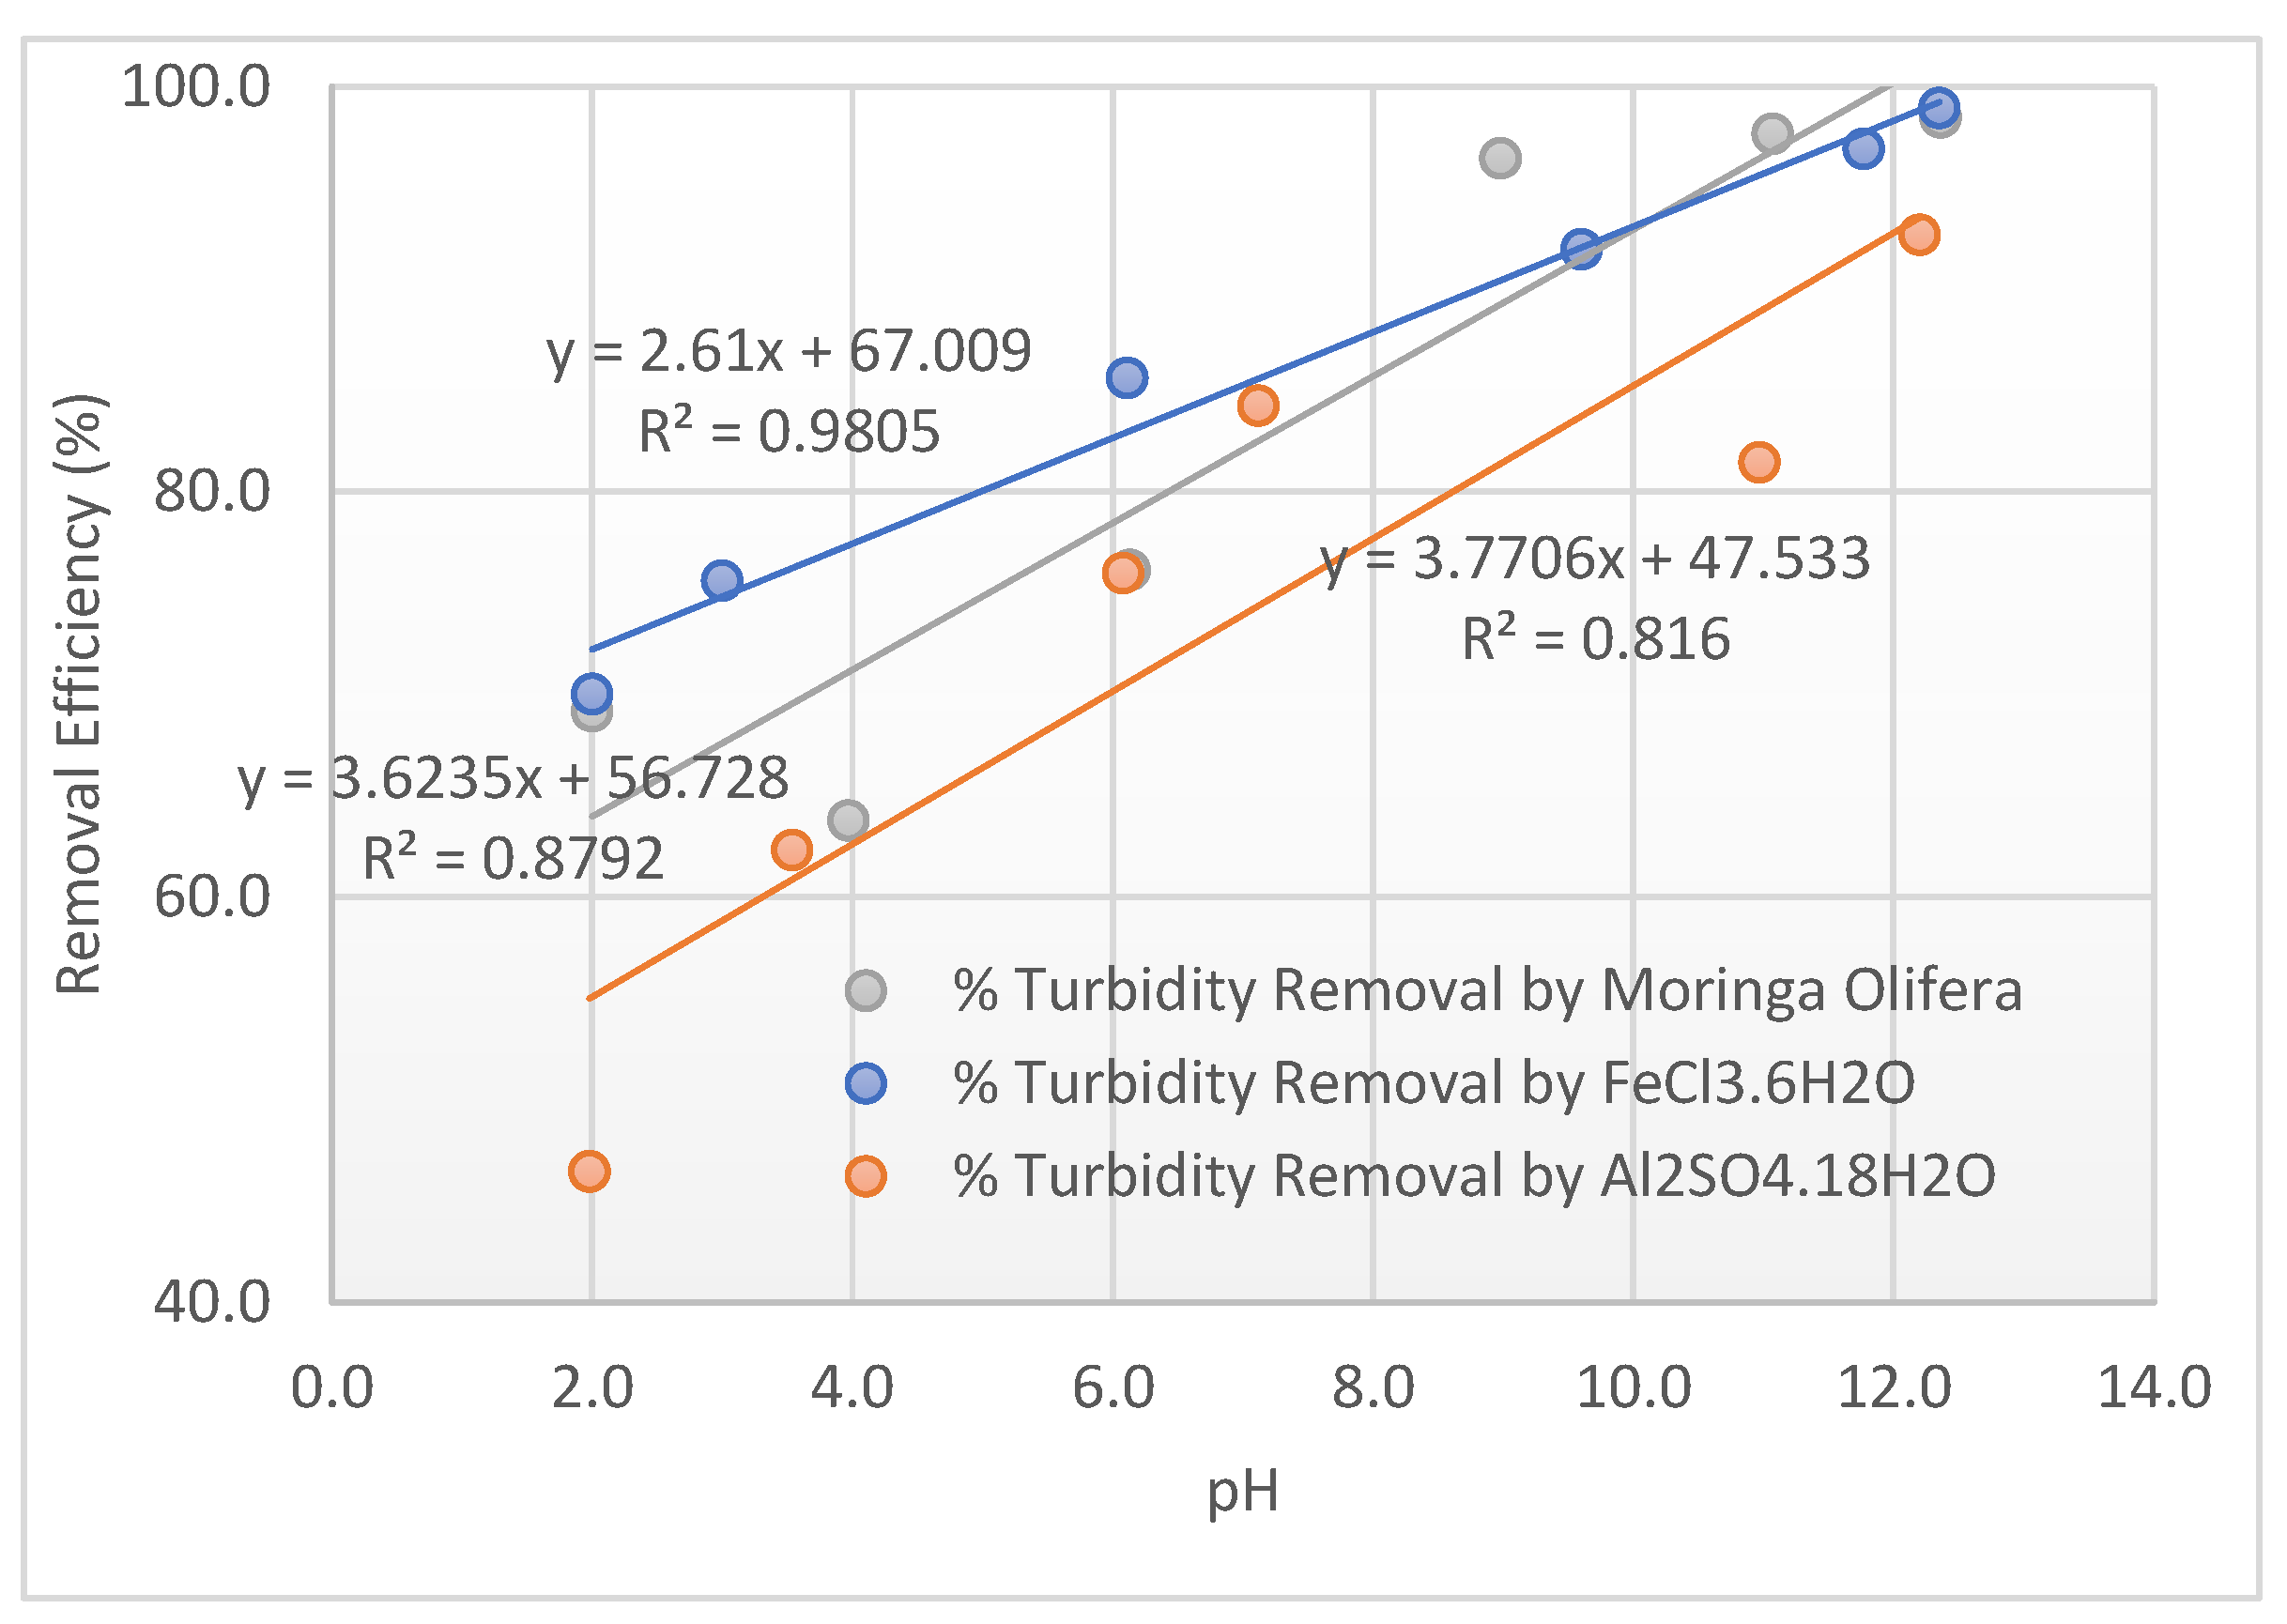
Figure 4.
Pollutant removal efficiency for varying dosages of Al2(SO4)3·18H2O (0–100 mg/L) at optimum pH, showing removal percentages for turbidity, colour, Chemical Oxygen Demand (COD), and Total Suspended Solids (TSS).
Figure 4.
Pollutant removal efficiency for varying dosages of Al2(SO4)3·18H2O (0–100 mg/L) at optimum pH, showing removal percentages for turbidity, colour, Chemical Oxygen Demand (COD), and Total Suspended Solids (TSS).
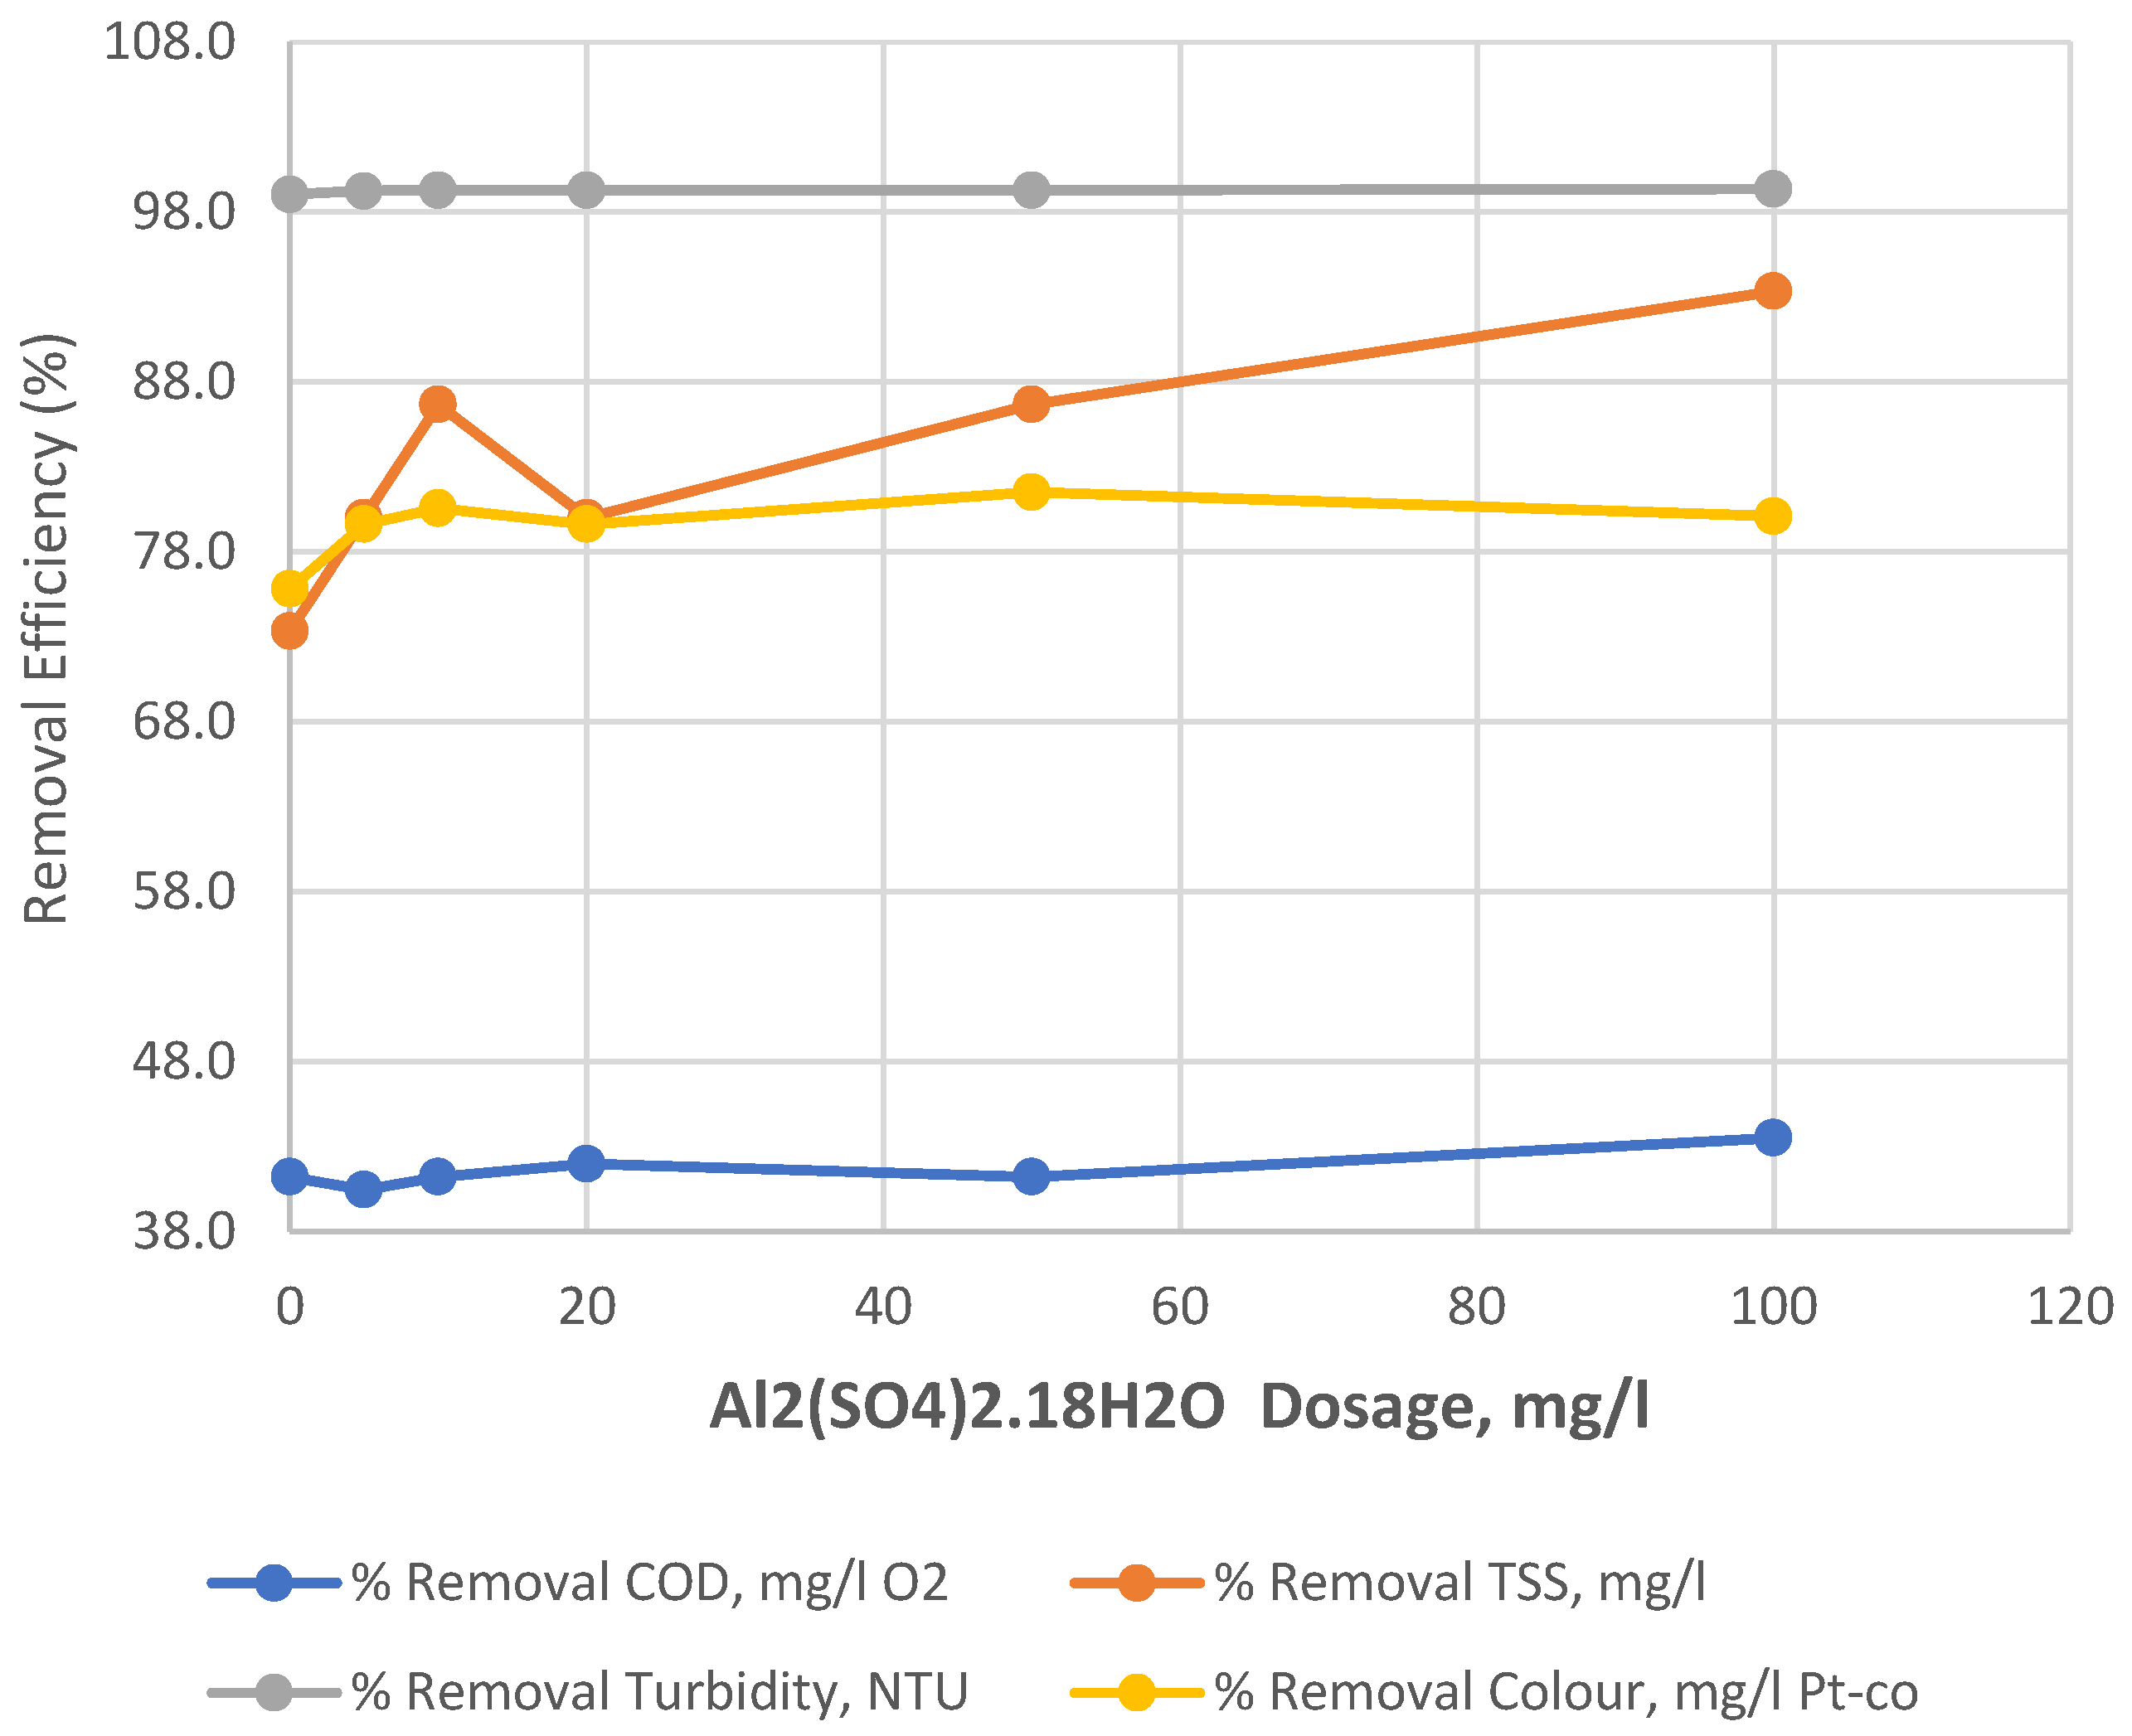
Figure 5.
Pollutant removal efficiency for varying dosages of FeCl3.6H2O (0–100 mg/L) at optimum pH, showing removal percentages for turbidity, colour, chemical oxygen Demand (COD and Total Suspended Solids (TSS).
Figure 5.
Pollutant removal efficiency for varying dosages of FeCl3.6H2O (0–100 mg/L) at optimum pH, showing removal percentages for turbidity, colour, chemical oxygen Demand (COD and Total Suspended Solids (TSS).
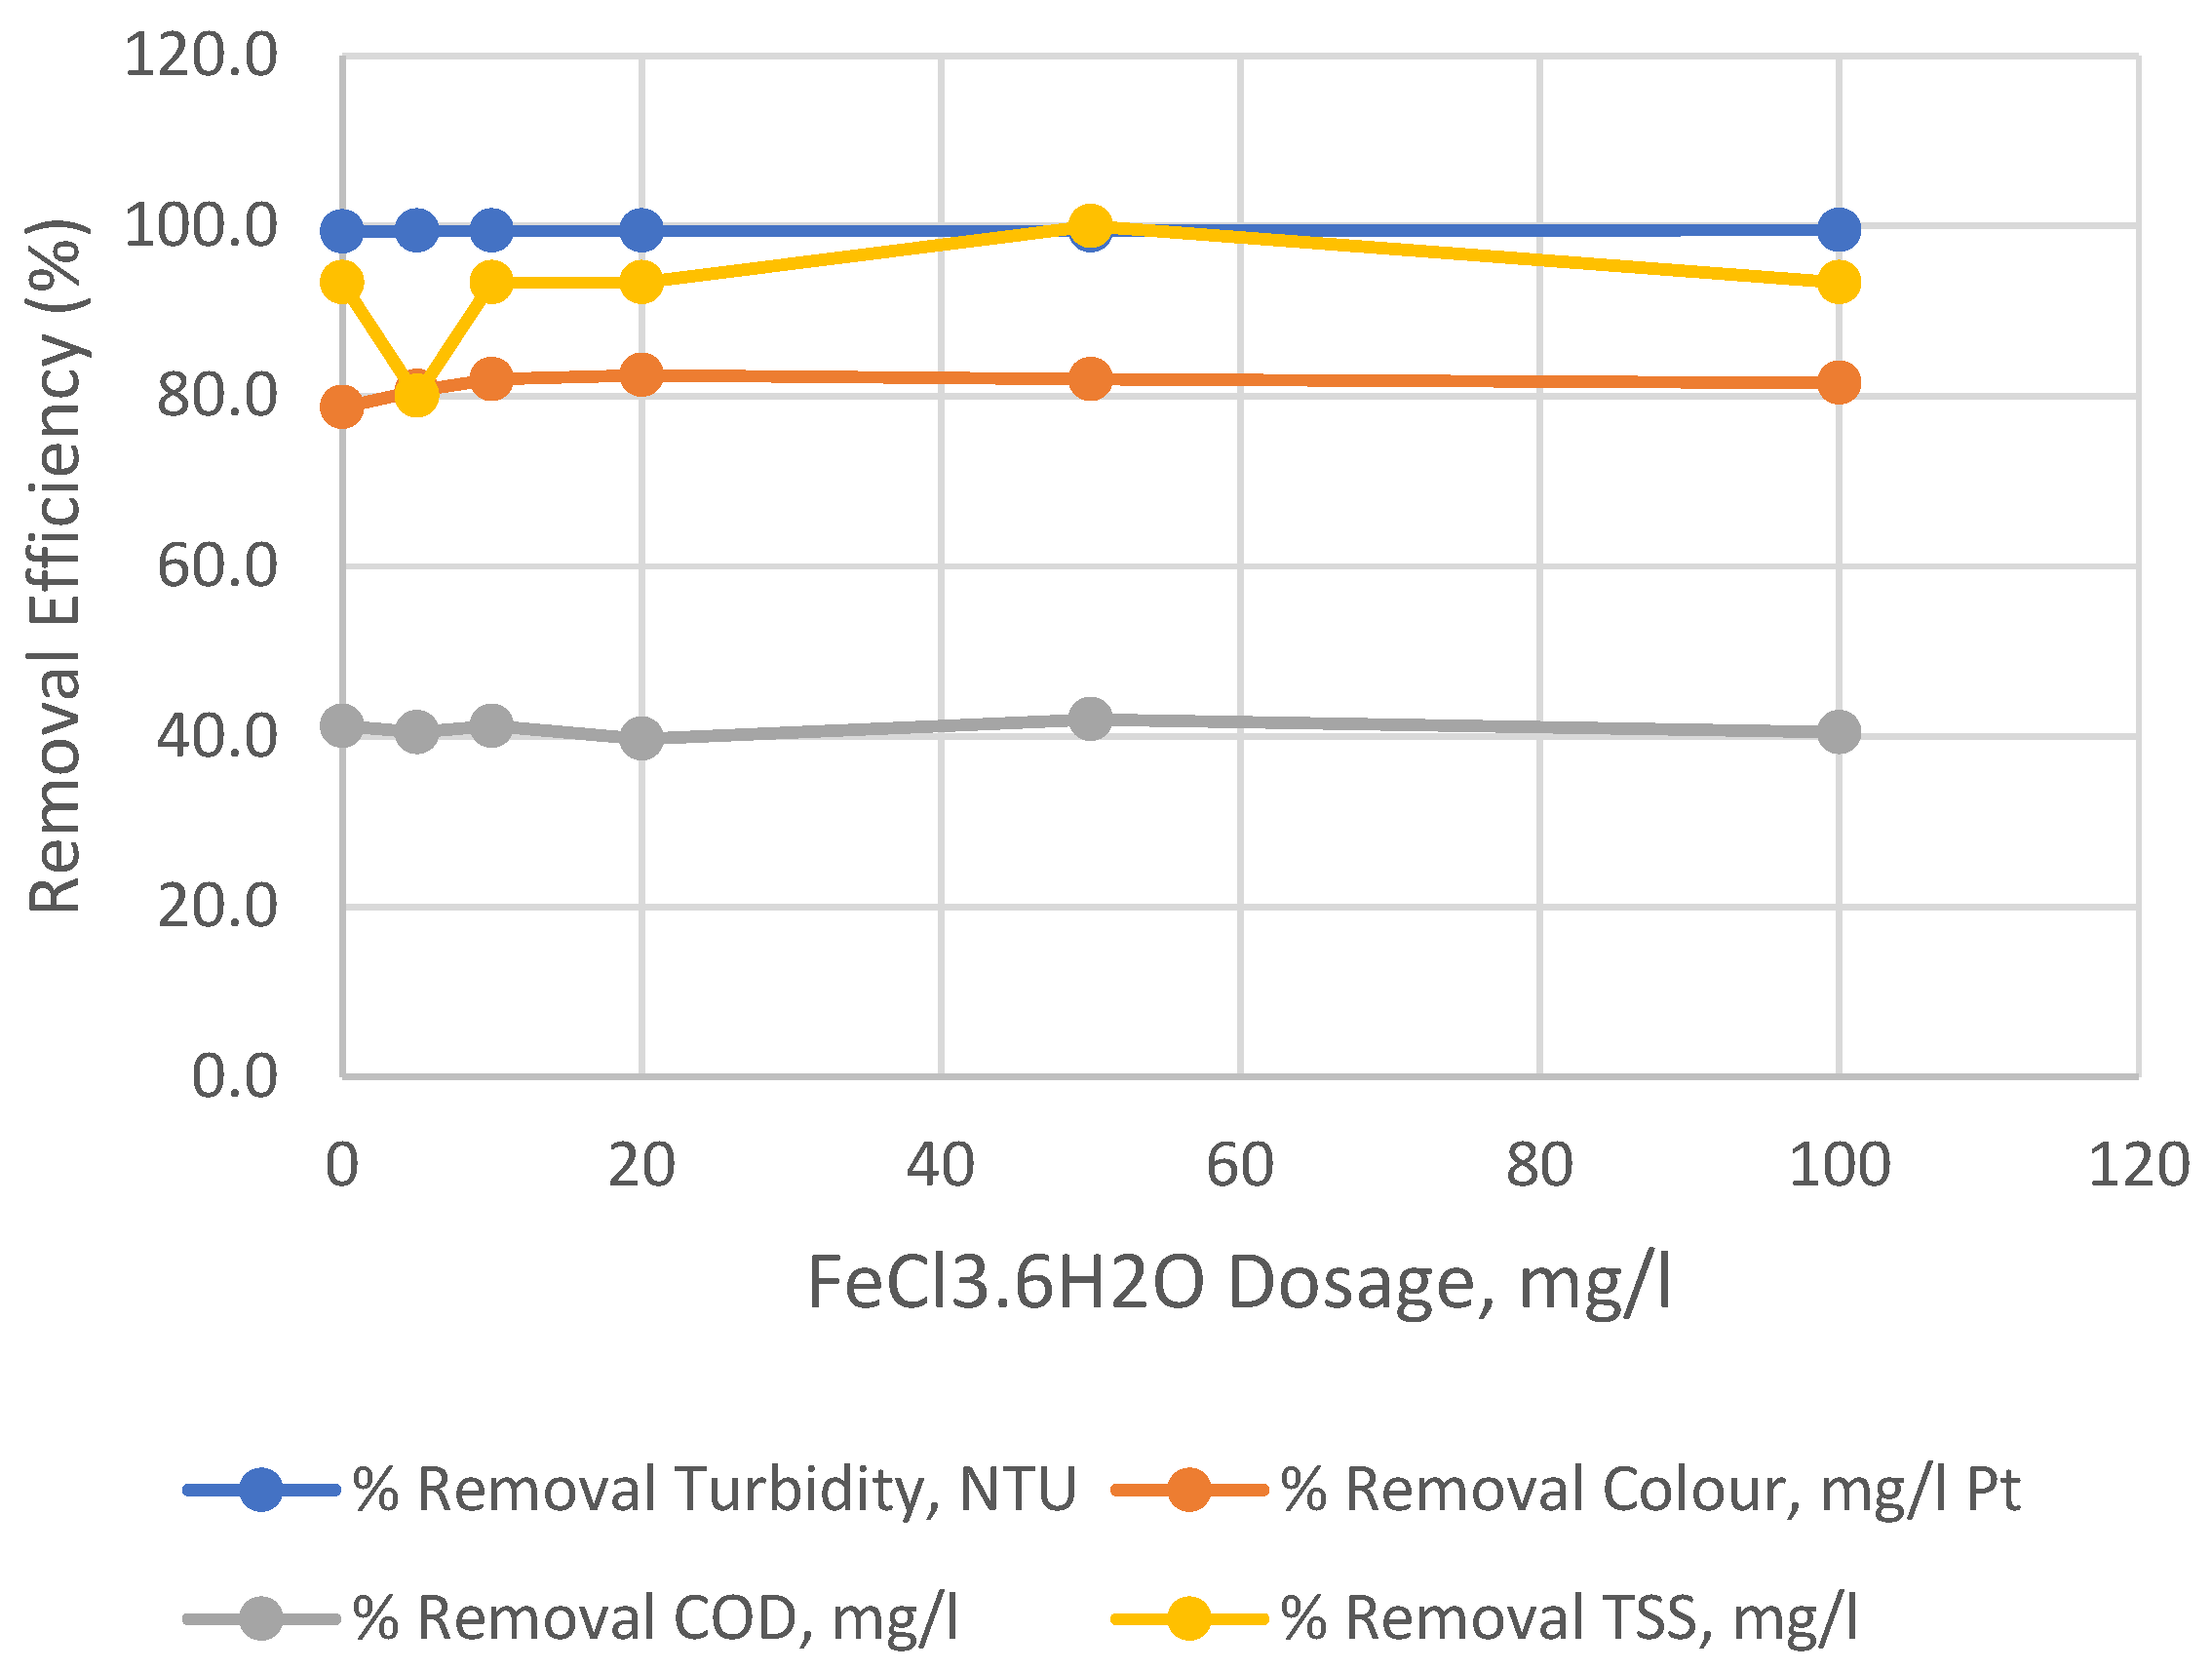
Figure 6.
Pollutant removal efficiency for varying dosages of Moringa oleifera powder (0–100 mg/L) at optimum pH, showing removal percentages for turbidity, colour, Chemical Oxygen Demand (COD), and Total Suspended Solids (TSS).
Figure 6.
Pollutant removal efficiency for varying dosages of Moringa oleifera powder (0–100 mg/L) at optimum pH, showing removal percentages for turbidity, colour, Chemical Oxygen Demand (COD), and Total Suspended Solids (TSS).
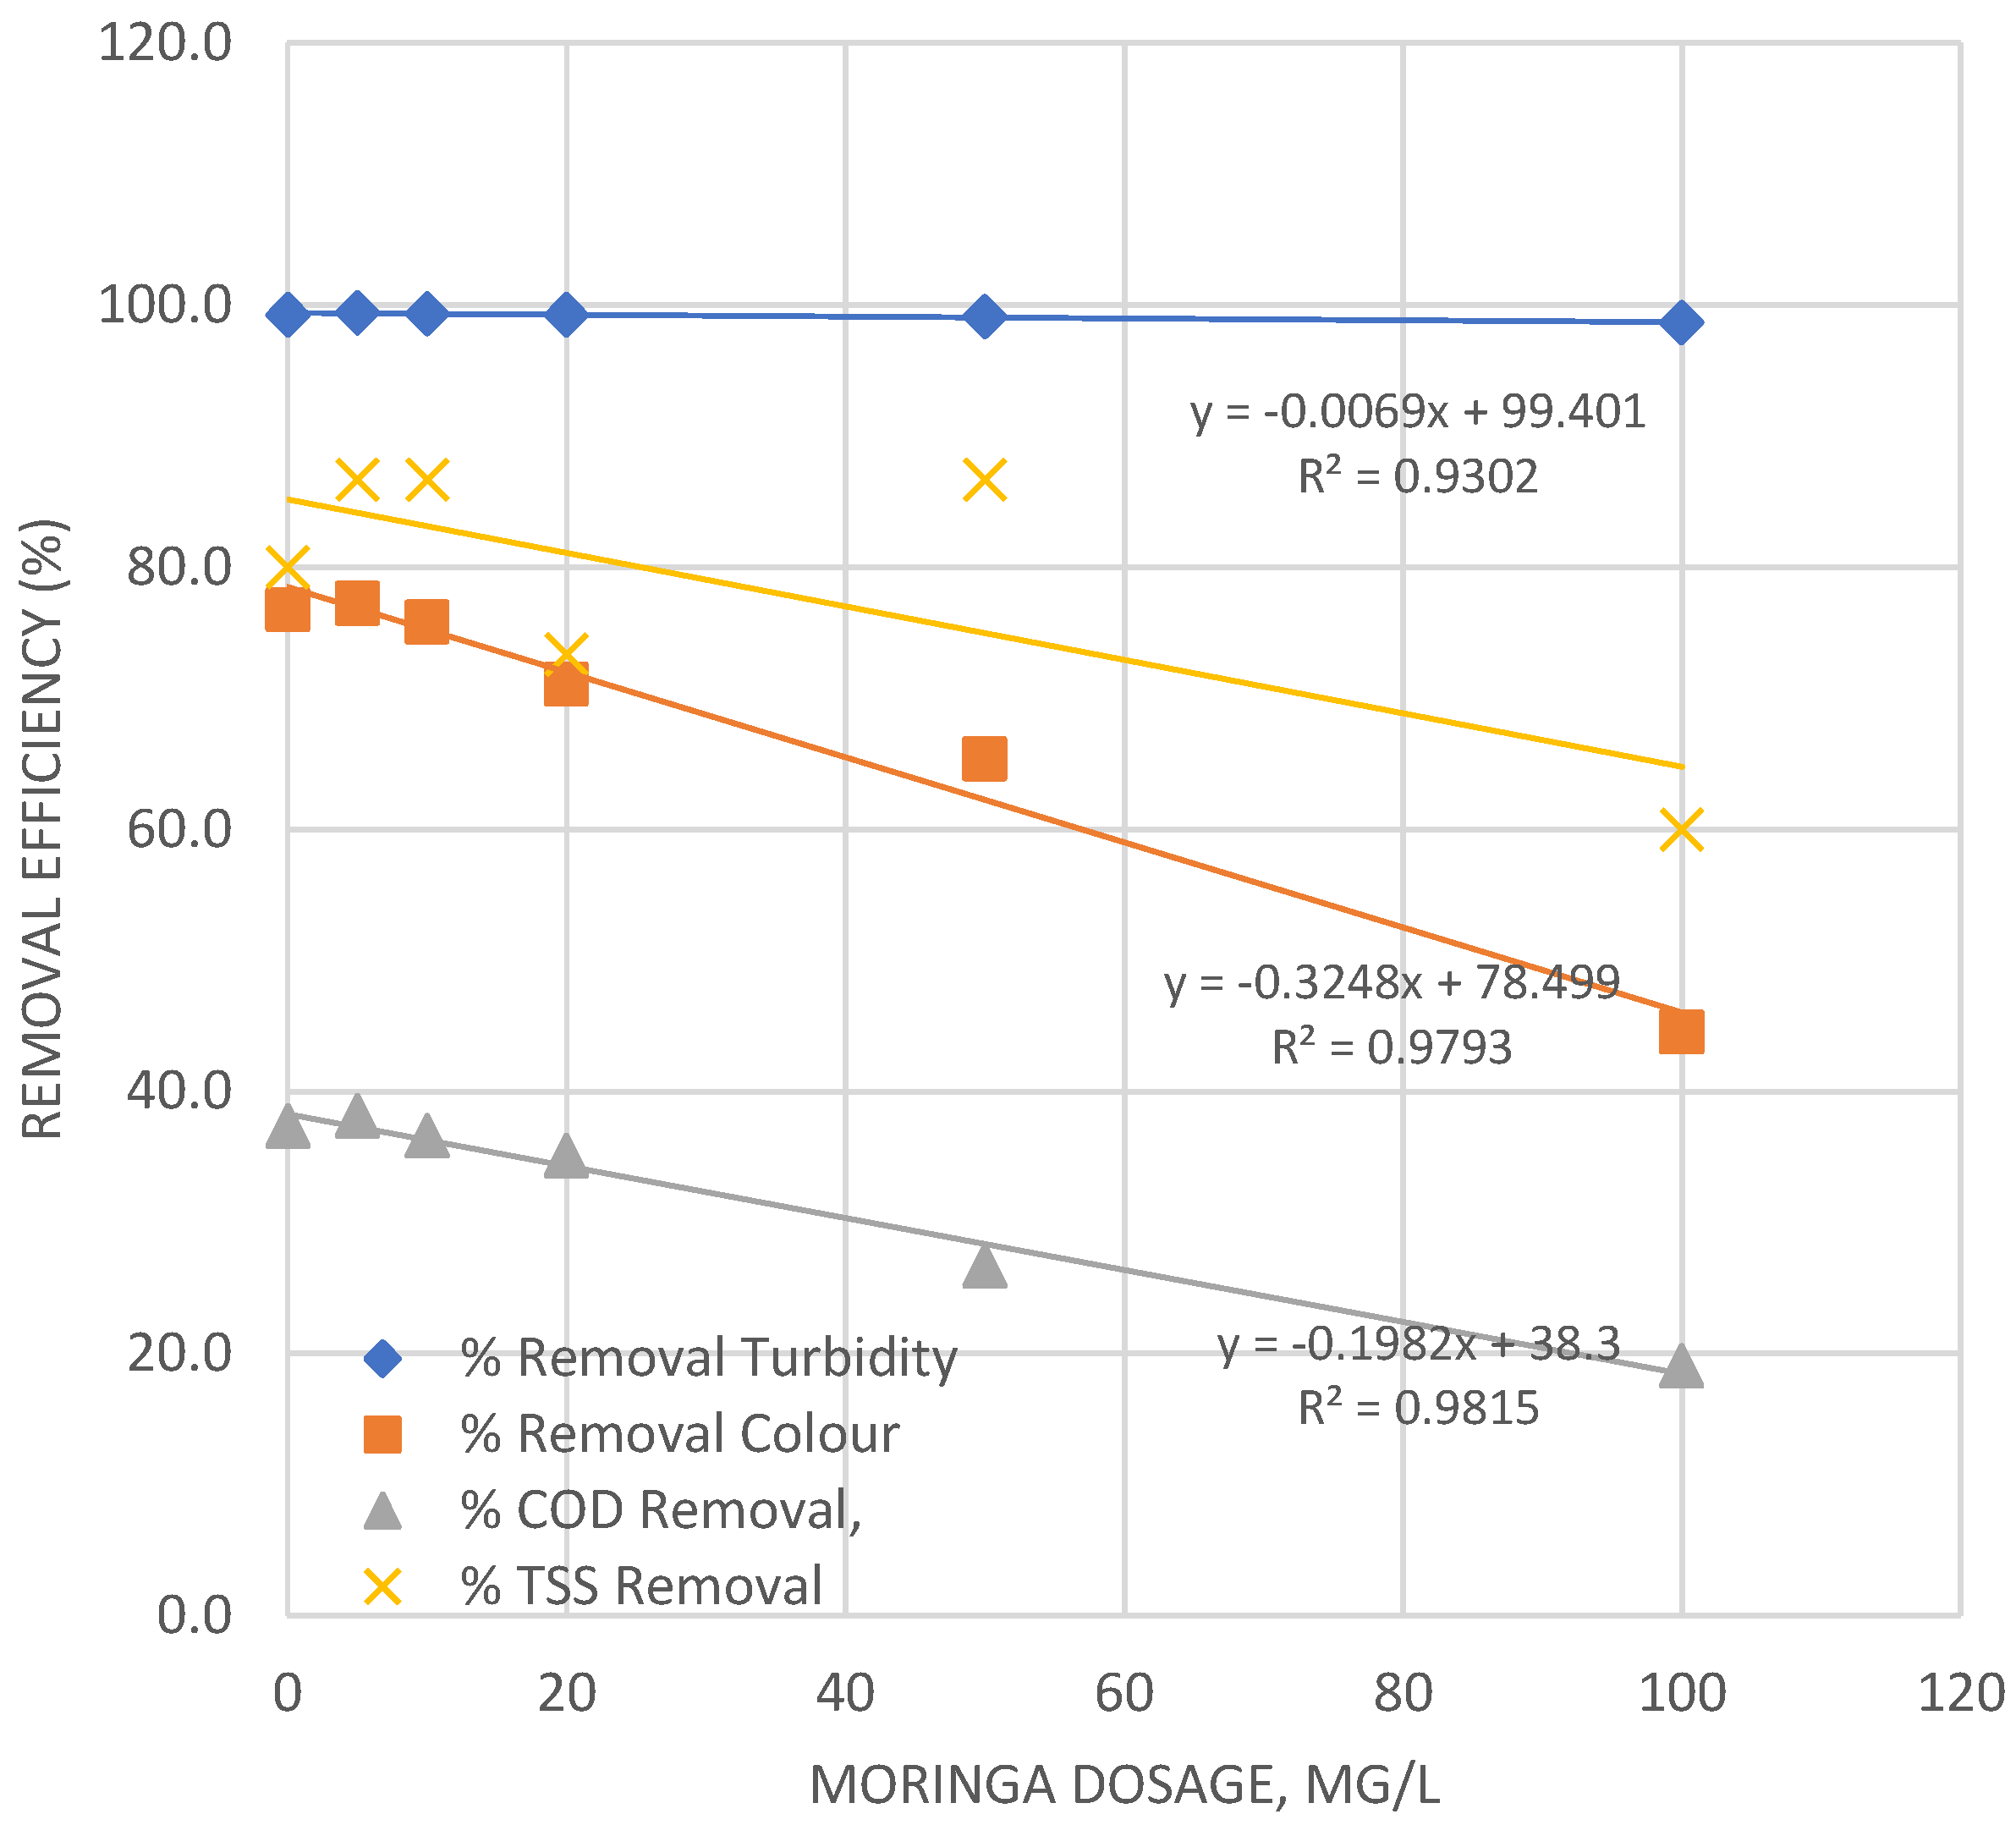

Table 1.
Actual and coded values for the independent variables and their levels for RSM and CCD experimental design.
Table 1.
Actual and coded values for the independent variables and their levels for RSM and CCD experimental design.
| Input variable | Numeric Factor Levels | ||||
| -1.414 | -1 | 0 | +1 | + 1.414 | |
| Lower | Low | Centre | High | Higher | |
| pH | 8.38 | 9 | 10.5 | 12 | 12.6 |
| Al2(SO4)3.18H2O, mg/L | 2.93 | 5 | 10 | 15 | 17.1 |
| FeCl3.6H2O, mg/L | 5.86 | 10 | 20 | 30 | 34.1 |
| Moringa, mg/L | 0.76 | 2 | 5 | 8 | 9.2 |
1 Tables may have a footer.
Table 2.
Comparative data on the efficiency of Al2(SO4)3.18H2O, FeCl3.6H2O, and Moringa coagulants in filtered turbidity removal across pH levels.
Table 2.
Comparative data on the efficiency of Al2(SO4)3.18H2O, FeCl3.6H2O, and Moringa coagulants in filtered turbidity removal across pH levels.
| Al2(SO4)3.18H2O | FeCl3.6H2O | Moringa | |||
| pH | % Turbidity Removal | pH | % Turbidity Removal | pH | % Turbidity Removal |
| 2.0 | 46.5 | 2.0 | 70.0 | 2.0 | 69.2 |
| 3.5 | 62.3 | 3.0 | 75.6 | 4.0 | 63.8 |
| 6.1 | 76.0 | 6.1 | 85.6 | 6.1 | 76.1 |
| 7.1 | 84.3 | 9.6 | 92.0 | 9.0 | 96.4 |
| 11.0 | 81.5 | 11.8 | 96.9 | 11.1 | 97.7 |
| 12.2 | 92.7 | 12.4 | 98.9 | 12.4 | 98.5 |
Table 3.
Comparative data on the efficiency of Al2(SO4)3.18H2O, FeCl3.6H2O, and Moringa coagulants in filtered color removal across pH levels.
Table 3.
Comparative data on the efficiency of Al2(SO4)3.18H2O, FeCl3.6H2O, and Moringa coagulants in filtered color removal across pH levels.
| Dosage, | Turbidity, | Colour, | COD, | TSS, | Removal COD, | Removal TSS, | Removal Turbidity, | Removal Colour, | % Removal COD, | % Removal TSS, | % Removal Turbidity | % Removal Colour, |
| mg/L | NTU | mg/L Pt-co | mg/L O2 | mg/L | mg/L O2 | mg/L | NTU | mg/L Pt-co | % | % | % | % |
| 0 | 0.12 | 51 | 77 | 4 | 54 | 11 | 12.28 | 160 | 41.2 | 73.3 | 99.0 | 75.8 |
| 5 | 0.095 | 43 | 78 | 3 | 53 | 12 | 12.305 | 168 | 40.5 | 80.0 | 99.2 | 79.6 |
| 10 | 0.09 | 41 | 77 | 2 | 54 | 13 | 12.31 | 170 | 41.2 | 86.7 | 99.3 | 80.6 |
| 20 | 0.09 | 43 | 76 | 3 | 55 | 12 | 12.31 | 168 | 42.0 | 80.0 | 99.3 | 79.6 |
| 50 | 0.09 | 39 | 77 | 2 | 54 | 13 | 12.31 | 172 | 41.2 | 86.7 | 99.3 | 81.5 |
| 100 | 0.08 | 42 | 74 | 1 | 57 | 14 | 12.32 | 169 | 43.5 | 93.3 | 99.4 | 80.1 |
Raw Data: Turbidity 12.4 NTU, Colour 211 mg/L Pt-co, COD 131 mg/L O2, TSS 15 mg/L.
Table 4.
Comparative data on the efficiency of Al2(SO4)3.18H2O, FeCl3.6H2O, and Moringa coagulants in filtered COD removal across pH levels.
Table 4.
Comparative data on the efficiency of Al2(SO4)3.18H2O, FeCl3.6H2O, and Moringa coagulants in filtered COD removal across pH levels.
| Dosage, mg/L | Turbidity, NTU | Colour, mg/L Pt-co | COD, mg/L O2 | TSS, mg/L | Removal COD, mg/L O2 | Removal TSS, mg/L | Removal Turbidity, NTU | Removal Colour, mg/L Pt-co | % Removal Turbidity, NTU | % Removal Colour, mg/L Pt | % Removal COD, mg/L O2 | % Removal TSS, mg/L |
| 0 | 0.085 | 45 | 77 | 1 | 54 | 14 | 12.315 | 166 | 99.3 | 78.7 | 41.2 | 93.3 |
| 5 | 0.07 | 41 | 78 | 3 | 53 | 12 | 12.33 | 170 | 99.4 | 80.6 | 40.5 | 80.0 |
| 10 | 0.07 | 38 | 77 | 1 | 54 | 14 | 12.33 | 173 | 99.4 | 82.0 | 41.2 | 93.3 |
| 20 | 0.07 | 37 | 79 | 1 | 52 | 14 | 12.33 | 174 | 99.4 | 82.5 | 39.7 | 93.3 |
| 50 | 0.07 | 38 | 76 | 0 | 55 | 15 | 12.33 | 173 | 99.4 | 82.0 | 42.0 | 100.0 |
| 100 | 0.06 | 39 | 78 | 1 | 53 | 14 | 12.34 | 172 | 99.5 | 81.5 | 40.5 | 93.3 |
Raw Data: Turbidity 12.4, Colour 211, COD 131, TSS 15.
Table 5.
Pollutant removal efficiency as dosage of Moringa changes from 0 to 100 mg/L at optimum pH.
Table 5.
Pollutant removal efficiency as dosage of Moringa changes from 0 to 100 mg/L at optimum pH.
| Dosage, mg/L | Turbidity, NTU | Colour, mg/L Pt | COD, mg/L | TSS, mg/L | Removal Turbidity, NTU | Removal Colour, mg/L Pt | COD Removal, mg/L | TSS Removal , mg/L | % Removal Turbidity |
% Removal Colour | % COD Removal, | % TSS Removal |
| 0 | 0.09 | 49 | 82 | 3 | 12.31 | 162 | 49 | 12 | 99.3 | 76.8 | 37.4 | 80.0 |
| 5 | 0.07 | 48 | 81 | 2 | 12.33 | 163 | 50 | 13 | 99.4 | 77.3 | 38.2 | 86.7 |
| 10 | 0.08 | 51 | 83 | 2 | 12.32 | 160 | 48 | 13 | 99.4 | 75.8 | 36.6 | 86.7 |
| 20 | 0.09 | 61 | 85 | 4 | 12.31 | 150 | 46 | 11 | 99.3 | 71.1 | 35.1 | 73.3 |
| 50 | 0.11 | 73 | 96 | 2 | 12.29 | 138 | 35 | 13 | 99.1 | 65.4 | 26.7 | 86.7 |
| 100 | 0.165 | 117 | 106 | 6 | 12.235 | 94 | 25 | 9 | 98.7 | 44.5 | 19.1 | 60.0 |
Raw Data: Turbidity 12.4, Colour 211, COD 131, TSS 15.
Table 6.
The Trickling filter effluent characterization and the pH for the stock coagulant solution.
Table 6.
The Trickling filter effluent characterization and the pH for the stock coagulant solution.
| Trickling filter effluent Characterization | Coagulant Stock Solution (10 g/l) | ||||
| Turbidity, NTU | 50.7 | Fil. Turb, NTU: | 4 | Coagulant Name | pH |
| Colour, mg/L, Pt-co | 762 | Fil. Colour, mg/L, Pt-co | 147 | Al2(SO4)3.18H2O | 3.7 |
| COD, mg/L | 202 | FeCl3.6H2O | 2.12 | ||
| TSS, mg/L | 65 | Moringa | 6.25 | ||
Table 7.
Summary of the Descriptive and FIT Statistics.
| Response | Model | Lack of FIT | FIT Statistics | |||||
| F values | P value |
F values | P value | R2 | Adj R2 | Pred. R2 | Adq. precision | |
| Turbidity | 114.47 | <0.0001 | 1.7 | 0.1789 | 0.9764 | 0.9676 | 0.9481 | 41.4541 |
| Colour | 244.43 | <0.0001 | 1.58 | 0.2161 | 0.9869 | 0.9828 | 0.9796 | 66.5861 |
| COD | 118.25 | <0.0001 | 1.71 | 0.1834 | 0.9718 | 0.9636 | 0.9456 | 47.2574 |
| TSS | 21.22 | <0.0001 | 0.9832 | 0.5234 | 0.8908 | 0.8488 | 0.7668 | 16.2008 |
Table 8.
Comparison of predicted values from the quadratic regression models with actual measured values from six independent validation experiments.
Table 8.
Comparison of predicted values from the quadratic regression models with actual measured values from six independent validation experiments.
| Run | Parameter | Predicted Value | Actual Value | Percent Error (%) | RMSE* |
| 1 | Turbidity (NTU) | 0.45 | 0.47 | 4.3 | 0.41 NTU |
| Colour (mg/L Pt-Co) | 42.1 | 44.5 | 5.4 | 8.7 mg/L | |
| COD (mg/L O2) | 58.3 | 62.8 | 7.2 | 5.2 mg/L | |
| TSS (mg/L) | 3.2 | 3.4 | 5.9 | 1.8 mg/L | |
| 2 | Turbidity (NTU) | 0.38 | 0.36 | 5.6 | 0.41 NTU |
| Colour (mg/L Pt-Co) | 38.7 | 40.2 | 3.7 | 8.7 mg/L | |
| COD (mg/L O2) | 61.5 | 65.1 | 5.5 | 5.2 mg/L | |
| TSS (mg/L) | 2.8 | 2.9 | 3.4 | 1.8 mg/L | |
| 3 | Turbidity (NTU) | 0.52 | 0.50 | 4.0 | 0.41 NTU |
| Colour (mg/L Pt-Co) | 45.3 | 47.8 | 5.2 | 8.7 mg/L | |
| COD (mg/L O2) | 55.8 | 60.3 | 7.5 | 5.2 mg/L | |
| TSS (mg/L) | 3.5 | 3.7 | 5.4 | 1.8 mg/L | |
| Average | All Parameters | - | - | 5.4 | - |
| Overall RMSE | - | - | - | - | See below |
*Overall Root Mean Square Error (RMSE): Turbidity = 0.41 NTU; Colour = 8.7 mg/L Pt-Co; COD = 5.2 mg/L O2; TSS = 1.8 mg/L.
Table 9.
Compliance assessment of optimized coagulation effluent against national standards.
| Parameter | Botswana Standard (Typical Limit) | Optimized Effluent Value (FeCl3) | Compliance Status |
| TSS | ≤ 30 mg/L | 1 mg/L | Fully Compliant |
| COD | ≤ 75 mg/L | 55 mg/L | Fully Compliant |
| Turbidity | ≤ 10 NTU | 0.07 NTU | Fully Compliant |
Source for Standards: Botswana Department of Water Affairs (2012) [22].
Disclaimer/Publisher’s Note: The statements, opinions and data contained in all publications are solely those of the individual author(s) and contributor(s) and not of MDPI and/or the editor(s). MDPI and/or the editor(s) disclaim responsibility for any injury to people or property resulting from any ideas, methods, instructions or products referred to in the content. |
© 2026 by the authors. Licensee MDPI, Basel, Switzerland. This article is an open access article distributed under the terms and conditions of the Creative Commons Attribution (CC BY) license (http://creativecommons.org/licenses/by/4.0/).
Copyright: This open access article is published under a Creative Commons CC BY 4.0 license, which permit the free download, distribution, and reuse, provided that the author and preprint are cited in any reuse.


