Submitted:
11 February 2026
Posted:
11 February 2026
You are already at the latest version
Abstract
Background/Objectives: Autism spectrum disorder (ASD) is biologically heterogeneous, and immune-linked variation may coincide with differences in tryptophan–kynurenine pathway (KP) metabolism. Here, we report a targeted urinary profile of KP metabolites, NAD (nicotinamide adenine dinucleotide), and neopterin in a Bulgarian pediatric ASD cohort to describe within-cohort patterns and associations. Methods: Second-morning, acid-stabilized spot urine was collected from 73 children with ASD in Bulgaria (3–13 years; 57 males; 16 females). No contemporaneous neurotypical control group was enrolled; therefore, laboratory-provided reference limits are reported only as contextual benchmarks and are not interpreted as ASD-specific abnormalities. Tryptophan (TRP), kynurenine (KYN), kynurenic acid (KYNA), 3-hydroxykynurenine (3-HK), quinolinic acid (QUIN), NAD, and neopterin were quantified and derived indices were computed (KYN/TRP × 1000; QUIN/KYNA). Non-parametric statistics, Benjamini–Hochberg false discovery rate (FDR) correction, and Spearman correlation analyses were applied. Results: Neopterin was strongly associated with QUIN and KYN in creatinine-normalized data (QUIN: ρ = 0.59, q36 = 2.64 × 10⁻⁷; KYN: ρ = 0.54, q36 = 3.69 × 10⁻⁶); these associations persisted when reconstructed as absolute concentrations (e.g., QUIN_abs: ρ = 0.68, q36 = 2.69 × 10⁻¹⁰) and after partial Spearman correlation controlling for spot creatinine (partial ρ = 0.46, q = 2.52 × 10⁻⁴). One NAD value was <LOQ and was imputed as ½LOQ; sensitivity analyses did not materially change inference. Conclusions: In this ASD-only cross-sectional dataset, urinary neopterin levels co-varied with urinary KYN and QUIN and with KP indices. Clinical interpretation and causal inference require controlled and longitudinal studies with richer covariate capture.
Keywords:
autism spectrum disorder
; urine biomarkers
; tryptophan
; kynurenine pathway
; quinolinic acid
; kynurenic acid
; neopterin
; indoleamine 2
; 3-dioxygenase (IDO)
; pediatric metabolomics
1. Introduction
Autism spectrum disorder (ASD) shows substantial biological heterogeneity, and evidence from metabolomics and immunology suggests that a subset of individuals exhibits coordinated immune–metabolic alterations, often alongside gastrointestinal comorbidities [1,2]. Accessible biofluid readouts may therefore help to stratify ASD subgroups and to connect immune signaling to specific metabolic pathways.
Tryptophan (TRP) metabolism is of particular interest because immune-regulated diversion of TRP into the kynurenine pathway (KP) can alter the balance between neuroactive metabolites [3]. Indoleamine 2,3-dioxygenase (IDO1/IDO2) catalyzes the first and rate-limiting step of TRP degradation toward kynurenines and is inducible by cytokines, especially interferon-γ (IFN-γ) [3]. Downstream, kynurenic acid (KYNA) modulates excitatory neurotransmission and is often discussed as relatively protective, whereas quinolinic acid (QUIN) is an N-methyl-D-aspartate receptor (NMDAR) agonist with excitotoxic and pro-oxidant mechanisms [4,5]. Accordingly, higher QUIN relative to KYNA has been linked to neuroinflammatory and neuropsychiatric phenotypes [4,6].
Several metabolomics and targeted studies have reported altered TRP–KP metabolism in ASD, including changes in KYN-related metabolites and ratios reflecting IDO index, although results across cohorts differ [2,7,8,9]. Neopterin, a pteridine produced by activated monocytes/macrophages in response to IFN-γ, is a well-established marker of cellular immune activation and oxidative stress [10,11]. Because IFN-γ can concurrently promote neopterin production and induce IDO-mediated TRP catabolism, joint assessment of urinary neopterin and KP metabolites provides an opportunity to examine whether neopterin co-varies with KP markers within the cohort [3,10].
Evidence on urinary pterins (neopterin/biopterin) in ASD is limited and heterogeneous, with early small studies reporting conflicting directions of change across cohorts [12]. For this reason, we emphasize within-cohort association patterns and robustness checks across data representations, rather than case–control inference. This variability underscores biological heterogeneity and highlights the need for age-matched controls and careful contextualization when reference limits are used.
In this study, we report quantitative urinary data for nine markers (KP metabolites, NAD (nicotinamide adenine dinucleotide), and neopterin, together with derived indices reflecting IDO index (KYN/TRP × 1000) and QUIN/KYNA balance) in 73 Bulgarian children with ASD. Our primary objective is to describe within-cohort distributions and co-variation patterns and to test whether neopterin co-varies with KP markers across multiple data representations. Because no contemporaneous neurotypical control group was enrolled, laboratory-provided reference limits are presented strictly as contextual benchmarks and are not used for case–control inference.
2. Materials and Methods
2.1. Study Design and Participants
This cross-sectional study included 73 children with ASD from Bulgaria (age range 3–13 years; median age and IQR: 5 (4–7); 57 males and 16 females). ASD was diagnosed by a trained child psychiatrist/developmental pediatrician using DSM-IV-TR criteria, based on clinical interview and direct behavioral observation [13]. No contemporaneous neurotypical control group was enrolled; analyses therefore focus on within-cohort patterns and associations.
2.2. Ethics
The study was approved by the Research Ethics Committee of University Hospital “St. Ivan Rilski”, Sofia, Bulgaria (protocol number 3/26.04.2023). Written informed consent was obtained from the parents/guardians of all participants after full explanation of the study purposes and procedures.
2.3. Urine Collection and Pre-Analytical Standardization
Urine specimens were collected at home using an acid-stabilized urine collection kit (T928; biovis Diagnostik MVZ GmbH, Limburg, Germany) used within the provider’s Item 928 second-morning urine workflow and intended for second-morning, midstream sampling. This second-morning, acid-stabilized approach (collection 2–4 h after the first morning void) aligns with protocols previously described in peer-reviewed studies using the same provider-based urine metabolite profiling workflow [14].
Caregivers were instructed to collect the second-morning void approximately 2–4 h after the first-morning urine (minimum 2 h), to avoid excessive fluid intake before sampling, and to refrain from strenuous physical activity on the morning of collection. They were also instructed to avoid caffeine-containing beverages and energy drinks for at least 16 h prior to collection and to report any acute febrile illness at the time of sampling. To minimize acute confounding when feasible, caregivers were asked to avoid non-essential dietary supplements; ongoing clinically indicated prescription treatments and medically required diets were not discontinued for study purposes. Compliance with pre-analytical instructions was based on caregiver report and was not independently verified.
Immediately after voiding into a clean collection container, a midstream aliquot was transferred into the kit tube containing a pre-inserted stabilizer plate to achieve acid stabilization. Acidification was verified using the provided pH strip per kit instructions; samples not meeting the required acidification criterion were recollected on a different day. Stabilized samples were stored at ambient temperature per kit instructions (10–30 °C) and returned to the analytical laboratory in the provided transport container. Shipments were made on working days only (avoiding Friday dispatch, weekends, and public holidays), and samples were not deposited in mailboxes to minimize transit delays and uncontrolled storage conditions.
2.4. Laboratory Analyses
Outsourced laboratory analyses. Targeted urinary analytes were measured as a fee-for-service by an external clinical laboratory, biovis Diagnostik MVZ GmbH (65552 Limburg a. d. Lahn-Eschhofen, Germany), accredited by the DAkkS (German Accreditation Body) in accordance with DIN EN ISO 15189 (Accreditation Certificate D-ML-13188-01-00). Participant recruitment and pre-analytical procedures (second-morning midstream urine collection, acid stabilization using the provider’s collection kit, storage, and shipment logistics) were coordinated via laboratory Genome Center Bulgaria (1612 Sofia, Bulgaria); samples were shipped to the German provider laboratory for analytical measurement and report release. Quantitative determination of TRP, KYN, KYNA, 3-HK, QUIN, NAD, and neopterin was performed by targeted LC–MS/MS under the provider’s validated procedures within its ISO 15189 quality management system. Spot urinary creatinine was measured by a routine enzymatic method (UV/VIS photometric assay) under the same quality system. Testing was ordered under the provider’s Neurotransmitter / NT-Tryptophan service (Item no. 928). As part of ISO 15189-compliant routine operations, the provider performs method validation, calibration, and internal quality control according to its laboratory procedures; detailed instrument settings and kit-level details were not available to the authors. Results were returned as creatinine-normalized concentrations (μmol/g creatinine for TRP, KYN, KYNA, 3-HK, QUIN, and neopterin; nmol/g creatinine for NAD) and as derived ratio indices defined below (computed variables rather than direct measurements of enzyme activity).
For additional transparency, the analytical workflow for the same provider service has been described in an external application: targeted LC–MS/MS quantification in multiple-reaction monitoring (MRM) mode using isotopically labeled internal standards, with chromatographic separation performed on a UHPLC platform (Agilent 1290 Infinity II) using a Restek ARC-18 column [14]. While instrument-specific parameters (e.g., exact MRM transitions/gradients) remain within the provider’s accredited internal documentation, this published description provides context for the platform used for the Item 928 service.
2.5. Reference Values and Data Handling
Reference limits (lower/upper) were taken from the commercial documentation accompanying the analytical service and are defined for the same second-morning, acid-stabilized urine collection and reporting units used here (creatinine-normalized μmol/g creatinine for TRP, KYN, KYNA, 3-HK, QUIN, and neopterin; nmol/g creatinine for NAD). The provider applies these limits across the pediatric age range served by the test. In a published description of the provider’s workflow, reference ranges are derived from percentile distributions in self-reported healthy individuals and are continuously checked/optimized using an expanded internal sample database (>10,000 samples) [14]. In this manuscript, these limits are presented as contextual benchmarks and are not used for inferential comparisons.
Spot urine samples with creatinine below the laboratory-provided lower reference limit (400 mg/L) were treated as potentially dilute; primary analyses were performed on the full dataset, and sensitivity analyses excluded these samples to assess the robustness of creatinine normalization [15,16]. This dilution-screening approach is consistent with published use of the same provider workflow, where creatinine is used to contextualize urine concentration and samples outside the creatinine reference range are excluded from statistical analyses [14].
For NAD, one sample was reported as below the limit of quantification (“<25 nmol/g creatinine”); this left-censored value was imputed as 12.5 nmol/g creatinine (half the limit of quantification), a standard approach when the proportion of censored observations is small.
2.6. Statistical Analysis
Analyses were performed in Python (v3.11) using SciPy and statsmodels. Continuous variables are summarized as median (interquartile range, IQR) due to non-normal distributions. Between-group comparisons (e.g., by sex or by neopterin status) used the Mann–Whitney U test with effect sizes reported as Cliff’s delta (δ). Associations among markers were assessed using Spearman rank correlation (ρ). Multiple testing was controlled using the Benjamini–Hochberg false discovery rate (FDR) procedure [17], applied separately within each pre-specified analysis family. For correlation analyses (Figure 2; Figure S1; Table S3), q36 denotes BH-FDR-adjusted p-values across the 36 unique pairwise correlations of the full 9-variable panel. The q36 family comprised TRP, KYN, KYNA, 3-HK, QUIN, NAD, neopterin, IDO index, and QUIN/KYNA. For neopterin-group comparisons, FDR correction was applied across 8 tests, and for sex-group comparisons across 10 tests. Specifically, the q8 family comprised TRP, KYN, 3-HK, QUIN, KYNA, NAD, IDO index, and QUIN/KYNA, whereas the q10 family comprised TRP, KYN, KYNA, 3-HK, QUIN, NAD, IDO index, QUIN/KYNA, neopterin, and creatinine. Statistical significance was set at q<0.05 (two-sided tests), where q denotes the FDR-adjusted p-value. To probe potential shared-denominator effects from creatinine normalization, absolute concentrations were reconstructed as C_abs = C_norm × creatinine (g/L). Creatinine was converted from mg/L to g/L prior to reconstruction. Key neopterin–KP associations were repeated in reconstructed absolute units and as a rank-based partial Spearman correlation controlling for spot creatinine: variables were rank-transformed, residualized on ranked creatinine using simple linear regression, and Pearson correlation was computed on residuals (df = n−3). The same rank-based partial correlation approach was used for partial correlations controlling for age (Table S5). As an additional covariate-adjusted check, rank-based linear regression models (OLS on z-scored ranks) were fit in reconstructed absolute units to evaluate neopterin_abs associations with QUIN_abs and KYN_abs while adjusting for age and sex; 95% confidence intervals were obtained by bootstrap resampling (1,000 iterations). Analyses explicitly labeled as exploratory (e.g., age-related analyses in Table S5) report nominal p-values and are interpreted cautiously. For correlation heatmaps, stars denote FDR-corrected significance (* q36<0.05; ** q36<0.01; *** q36<0.001).
3. Results
3.1. Cohort Characteristics and Sample Integrity
The cohort comprised 73 children with ASD (57 males and 16 females; age range 3–13 years; median age and IQR: 5 (4–7)). Urinary creatinine concentration was used as a dilution marker for spot samples. Creatinine was below the laboratory-provided lower reference limit (400 mg/L) in 11/73 samples (15.1%). Participant characteristics and analytical notes are summarized in Table 1.
3.2. Urinary Marker Distributions with Laboratory Reference Limits
Distributions of urinary markers are shown in Figure 1, and summary statistics are provided in Table 2. Because the study lacks matched neurotypical controls, laboratory reference limits are presented for context only and are not interpreted as ASD-specific abnormalities. Subsequent analyses therefore focus on within-cohort associations.
3.3. Correlation Structure of KP Markers and Neopterin
Spearman correlation analysis revealed a consistent positive correlation block among TRP, KYN, 3-HK, QUIN and neopterin, alongside expected structure across KP indices (Figure 2). Neopterin showed strong positive associations with QUIN (ρ = 0.59, q36 = 2.64 × 10⁻⁷) and KYN (ρ = 0.54, q36 = 3.69 × 10⁻⁶), and moderate associations with IDO index (ρ = 0.39, q36 = 0.002) and the QUIN/KYNA ratio (ρ = 0.28, q36 = 0.026).
These relationships were preserved in a sensitivity analysis excluding dilute spot samples (creatinine <400 mg/L), where neopterin remained strongly associated with QUIN (ρ = 0.55, nominal p = 4.01 × 10⁻⁶).
To evaluate potential shared-denominator effects from creatinine normalization, we reconstructed absolute concentrations (μmol/L or nmol/L) from creatinine-normalized values and spot creatinine and repeated correlations. Neopterin remained strongly associated with QUIN in absolute units (ρ = 0.68, q36 = 2.69 × 10⁻¹⁰) and after partial adjustment for spot creatinine (partial ρ = 0.46, q36 = 2.52 × 10⁻⁴; Table S3). In an age- and sex-adjusted rank-based linear model using reconstructed absolute units, neopterin_abs remained strongly associated with QUIN_abs (standardized β = 0.68; 95% CI 0.51–0.80; p = 6.13 × 10⁻¹¹) and with KYN_abs (β = 0.60; 95% CI 0.41–0.74; p = 1.69 × 10⁻⁸) (Table S6). A full correlation heatmap with numeric Spearman ρ values in cells is provided in Figure S1.
3.4. Exploratory Stratification by Provider Neopterin Threshold (Dilution-Sensitive)
To explore whether children above the provider’s neopterin cut-off also show a broader shift in creatinine-normalized KP metabolites, we stratified participants by neopterin status. To visualize dilution-sensitive contrasts, participants were stratified by provider neopterin threshold (>2 μmol/g creatinine, n = 40 vs ≤2 μmol/g creatinine, n = 33). This stratification is exploratory; inference relies on continuous associations and on analyses that address urine dilution (reconstructed absolute concentrations and creatinine-adjusted correlations). In creatinine-normalized units, the above-reference neopterin group showed higher TRP, KYN, 3-HK, QUIN, IDO index (KYN/TRP × 1000), and NAD compared with the within-reference group (all q<0.05 after FDR correction), whereas QUIN/KYNA ratio and KYNA were not significant after FDR correction (q≥0.05; Table 3). However, the above-reference group also had lower spot creatinine (median 717.00 (502.75–923.25) vs 925.00 (652.00–1320.00) mg/L; p = 0.022, q = 0.154), and reconstructed absolute concentrations (μmol/L or nmol/L) did not differ significantly between groups after FDR correction (Table S4). Accordingly, subgroup contrasts should be interpreted cautiously in the context of urine dilution and shared-denominator effects, whereas continuous neopterin–KP associations remained consistently positive in absolute and creatinine-adjusted analyses (Table S3). Figure 3 highlights representative associations.
3.5. Sex-Stratified Exploratory Analyses
Exploratory comparisons between males and females did not reveal robust sex differences after BH-FDR correction across the 10-test family (q10). KYNA showed a nominal sex difference (p = 0.012), but this did not survive multiple-testing adjustment (q = 0.115; Table S2).
3.6. Age-Related Exploratory Analyses
Age was inversely associated with neopterin (Spearman ρ = -0.37, p = 1.14 × 10⁻³) and QUIN (ρ = -0.47, p = 3.26 × 10⁻⁵). Partial Spearman correlations controlling for age indicated that the neopterin–QUIN association remained positive and significant after age adjustment (partial ρ = 0.50, p = 5.24 × 10⁻⁶), as did the neopterin–KYN association (partial ρ = 0.53, p = 1.69 × 10⁻⁶). Full results are provided in Table S5.
4. Discussion
In this Bulgarian pediatric ASD cohort, urinary neopterin co-varied consistently with QUIN and KYN across creatinine-normalized values, reconstructed absolute concentrations, and creatinine-adjusted analyses. Because no contemporaneous neurotypical control group was enrolled, laboratory-provided reference limits are reported only as contextual benchmarks and are not interpreted as ASD-specific abnormalities. Accordingly, the primary contribution of this work is the within-cohort correlation structure and neopterin-linked KP patterning, rather than inference about departures from normative pediatric ranges.
Urinary targeted profiling of the tryptophan–kynurenine pathway (KP) in pediatric ASD remains heterogeneous across studies in terms of matrices (urine vs plasma/serum), normalization strategies, and covariate capture [1,2,7,8,9]. In this ASD-only cross-sectional dataset, the main contribution is not case–control inference but the internally consistent co-variation between neopterin and KP markers (KYN and QUIN), which remained evident across creatinine-normalized reporting, reconstructed absolute units, and creatinine-adjusted analyses. These within-cohort patterns can serve as a starting point for formulating hypotheses to be tested in future controlled, longitudinal studies.
Urinary neopterin was interpreted as a marker of cellular immune activation and oxidative stress [10,11]. Within this ASD cohort, neopterin showed strong positive associations with QUIN and KYN, as well as with KP indices (IDO index and QUIN/KYNA). These associations remained strong when expressed as reconstructed absolute concentrations and after adjustment for spot creatinine (Table S3). This hypothesis-generating pattern is compatible with prior work linking interferon-γ–related pathways to neopterin production and to induction of tryptophan catabolism via indoleamine 2,3-dioxygenase, although cytokines were not measured in the present study [3,10].
Pre-analytical standardization is critical for urinary metabolomics. We used an acid-stabilized second-morning midstream protocol with timing and hydration guidance, and creatinine served as a dilution marker. Nonetheless, 11/73 samples (15.1%) were below the commercial creatinine lower limit, which may inflate creatinine-normalized analyte values [15,16]. Sensitivity analyses excluding these potentially dilute samples retained the key KP–neopterin associations (e.g., neopterin–QUIN ρ = 0.55, nominal p = 4.01 × 10⁻⁶), supporting that the observed relationships are not solely artifacts of urine dilution (Note S1).
We also observed age-related trends, with older children showing lower urinary neopterin and QUIN. This suggests that age-specific pediatric reference standards may be important; using broad pediatric cut-offs could overestimate the proportion of “above-reference” results in younger participants. Importantly, the neopterin–QUIN association remained significant after age adjustment, supporting that the within-cohort co-variation is not explained by age alone.
5. Conclusions
In a Bulgarian pediatric ASD cohort profiled with a targeted urinary KP panel, neopterin co-varied consistently with KYN and QUIN and remained evident across creatinine-normalized reporting, reconstructed absolute concentrations, creatinine-adjusted analyses, and age/sex-adjusted models. These internally coherent patterns support the use of urinary neopterin as a contextual covariate when describing KP variation within ASD cohorts, while emphasizing that clinical interpretation and causality require matched controls, longitudinal sampling, and richer phenotyping. Future studies integrating urinary KP profiling with inflammatory markers (e.g., IFN-γ) and standardized dilution assessment may clarify the biological and clinical relevance of neopterin-linked KP variation.
Supplementary Materials
The following supporting information can be downloaded at: Preprints.org, Figure S1: Spearman correlation heatmap (color = ρ; full matrix shown) with numeric Spearman ρ values in cells (n = 73); Table S1: De-identified individual urinary marker values (sequential participant IDs; n = 73); Table S2: Sex-stratified comparisons (Mann–Whitney U; false discovery rate (FDR)). q denotes BH-FDR-adjusted p-values across the variables listed in this table; Table S3: Neopterin–KP associations in creatinine-normalized ratios vs reconstructed absolute concentrations, including partial correlations adjusting for creatinine; Table S4: Neopterin status subgroup comparisons in reconstructed absolute units and spot creatinine; Table S5: Exploratory age–marker associations (Spearman; partial Spearman controlling age); Table S6: Age- and sex-adjusted rank-based linear models in reconstructed absolute units (OLS on z-scored ranks; bootstrap 95% CI, 1,000 resamples); Figure S2: Age associations for urinary neopterin and QUIN (n = 73); Note S1: Sensitivity analyses excluding potentially dilute creatinine samples.
Author: Contributions: Conceptualization, V.S.; methodology, V.S. and T.K.; formal analysis, V.S. and S.C.; investigation/resources, S.C. and T.K.; visualization, V.S. and R.T.; writing—original draft preparation, V.S.; writing—review and editing, L.T. and T.K.; supervision, L.T. and T.K.; project administration, R.T. and T.K.; funding acquisition, R.T. and T.K. All authors have read and agreed to the published version of the manuscript.
Funding
This research received no external funding. Laboratory testing was obtained as a fee-for-service clinical workup commissioned via Genome Center Bulgaria (Bulgaria), which coordinated logistics and billing and paid the analytical fees to the external provider laboratory that performed the measurements and issued the laboratory reports.
Institutional Review Board Statement
The study was conducted in accordance with the Declaration of Helsinki and approved by the Research Ethics Committee of University Hospital “St. Ivan Rilski”, Sofia, Bulgaria (protocol number 3/26.04.2023).
Informed Consent Statement
Informed consent was obtained from the parents/guardians of all subjects involved in the study.
Data Availability Statement
De-identified individual-level data supporting the findings of this study are provided in Table S1. Additional metadata (e.g., exact birthdate, clinical covariates) are not publicly available due to ethical constraints but may be shared upon reasonable request, subject to institutional approvals.
Acknowledgments
The authors thank the external provider laboratory (biovis Diagnostik MVZ GmbH, Germany) for performing the analytical measurements and issuing laboratory reports under its quality management system. The authors also acknowledge Genome Center Bulgaria (Bulgaria) for coordinating recruitment and pre-analytical logistics (collection materials, stabilization, storage, and shipment) and for facilitating access to de-identified laboratory reports for research purposes.
Conflicts of Interest
The authors declare no conflicts of interest.
Abbreviations
The following abbreviations are used in this manuscript:
| 3-HK | 3-hydroxykynurenine |
| ASD | autism spectrum disorder |
| BH-FDR | Benjamini–Hochberg false discovery rate |
| CI | confidence interval |
| DAkkS | German Accreditation Body (Deutsche Akkreditierungsstelle) |
| DIN | German Institute for Standardization (Deutsches Institut für Normung) |
| DSM-IV-TR | Diagnostic and Statistical Manual of Mental Disorders, Fourth Edition, Text Revision |
| EN | European Standard (European Norm) |
| FDR | false discovery rate |
| GMDL | Genetic Medico-Diagnostic Laboratory |
| IDO | indoleamine 2,3-dioxygenase |
| IDO1 | indoleamine 2,3-dioxygenase 1 |
| IDO1/IDO2 | indoleamine 2,3-dioxygenase 1 and 2 |
| IDO2 | indoleamine 2,3-dioxygenase 2 |
| IFN-γ | interferon-gamma |
| IQR | interquartile range |
| ISO 15189 | medical laboratory accreditation standard (ISO 15189) |
| KP | kynurenine pathway |
| KYN | kynurenine |
| KYN/TRP | kynurenine-to-tryptophan ratio |
| KYNA | kynurenic acid |
| LC–MS/MS | liquid chromatography–tandem mass spectrometry |
| LOQ | limit of quantification |
| MRM | multiple reaction monitoring |
| MVZ | medical care center (German: Medizinisches Versorgungszentrum) |
| NAD | nicotinamide adenine dinucleotide |
| NMDAR | N-methyl-D-aspartate receptor |
| OLS | ordinary least squares |
| QUIN | quinolinic acid |
| QUIN/KYNA | quinolinic acid-to-kynurenic acid ratio |
| SD | standard deviation |
| TRP | tryptophan |
| UHPLC | ultra-high-performance liquid chromatography |
| UV/VIS | ultraviolet/visible |
References
- Santana-Coelho, D. Does the Kynurenine Pathway Play a Pathogenic Role in Autism Spectrum Disorder? Brain Behav. Immun. Health 2024, 40, 100839. [Google Scholar] [CrossRef]
- Timperio, A.M.; Gevi, F.; Cucinotta, F.; Ricciardello, A.; Turriziani, L.; Scattoni, M.L.; Persico, A.M. Urinary Untargeted Metabolic Profile Differentiates Children with Autism from Their Unaffected Siblings. Metabolites 2022, 12, 797. [Google Scholar] [CrossRef] [PubMed]
- Moffett, J.R.; Namboodiri, M.A.A. Tryptophan and the Immune Response. Immunol. Cell Biol. 2003, 81, 247–265. [Google Scholar] [CrossRef] [PubMed]
- Schwarcz, R.; Stone, T.W. The Kynurenine Pathway and the Brain: Challenges, Controversies and Promises. Neuropharmacology 2017, 112, 237–247. [Google Scholar] [CrossRef] [PubMed]
- Pérez-De La Cruz, V.; Carrillo-Mora, P.; Santamaría, A. Quinolinic Acid, an Endogenous Molecule Combining Excitotoxicity, Oxidative Stress and Other Toxic Mechanisms. Int. J. Tryptophan Res. 2012, 5, 1–8. [Google Scholar] [CrossRef] [PubMed]
- Dantzer, R.; O’Connor, J.C.; Lawson, M.A.; Kelley, K.W. Inflammation-Associated Depression: From Serotonin to Kynurenine. Psychoneuroendocrinology 2011, 36, 426–436. [Google Scholar] [CrossRef] [PubMed]
- Lim, C.K.; Essa, M.M.; de Paula Martins, R.; Lovejoy, D.B.; Bilgin, A.A.; Waly, M.I.; Al-Farsi, Y.M.; Al-Sharbati, M.; Al-Shaffae, M.A.; Guillemin, G.J. Altered Kynurenine Pathway Metabolism in Autism: Implication for Immune-Induced Glutamatergic Activity. Autism Res. 2016, 9, 621–631. [Google Scholar] [CrossRef] [PubMed]
- Gevi, F.; Zolla, L.; Gabriele, S.; Persico, A.M. Urinary Metabolomics of Young Italian Autistic Children Supports Abnormal Tryptophan and Purine Metabolism. Mol. Autism 2016, 7, 47. [Google Scholar] [CrossRef] [PubMed]
- Diémé, B.; Mavel, S.; Blasco, H.; Tripi, G.; Bonnet-Brilhault, F.; Malvy, J.; Bocca, C.; Andres, C.R.; Nadal-Desbarats, L.; Emond, P. Metabolomics Study of Urine in Autism Spectrum Disorders Using a Multiplatform Analytical Methodology. J. Proteome Res. 2015, 14, 5273–5282. [Google Scholar] [CrossRef] [PubMed]
- Murr, C.; Widner, B.; Wirleitner, B.; Fuchs, D. Neopterin as a Marker for Immune System Activation. Curr. Drug Metab. 2002, 3, 175–187. [Google Scholar] [CrossRef] [PubMed]
- Gieseg, S.P.; Baxter-Parker, G.; Lindsay, A. Neopterin, Inflammation, and Oxidative Stress: What Could We Be Missing? Antioxidants 2018, 7, 80. [Google Scholar] [CrossRef] [PubMed]
- Gładysz, D.; Krzywdzińska, A.; Hozyasz, K.K. Immune Abnormalities in Autism Spectrum Disorder—Could They Hold Promise for Causative Treatment? Mol. Neurobiol. 2018, 55, 6387–6435. [Google Scholar] [CrossRef] [PubMed]
- American Psychiatric Association. Diagnostic and Statistical Manual of Mental Disorders, Text Revision (DSM-IV-TR), 4th ed.; American Psychiatric Association: Washington, DC, USA, 2000. [Google Scholar]
- Taenzer, M.; Löffler-Ragg, J.; Schroll, A.; Monfort-Lanzas, P.; Engl, S.; Weiss, G.; Brigo, N.; Kurz, K. Urine Metabolite Analysis to Identify Pathomechanisms of Long COVID: A Pilot Study. Int. J. Tryptophan Res. 2023, 16, 11786469231220781. [Google Scholar] [CrossRef] [PubMed]
- Tang, K.W.A.; Toh, Q.C.; Teo, B.W. Normalisation of Urinary Biomarkers to Creatinine for Clinical Practice and Research—When and Why. Singapore Med. J. 2015, 56, 7–10. [Google Scholar] [CrossRef] [PubMed]
- Cocker, J.; Mason, H.J.; Warren, N.D.; Cotton, R.J. Creatinine Adjustment of Biological Monitoring Results. Occup. Med. 2011, 61, 349–353. [Google Scholar] [CrossRef] [PubMed]
- Benjamini, Y.; Hochberg, Y. Controlling the False Discovery Rate: A Practical and Powerful Approach to Multiple Testing. J. R. Stat. Soc. Ser. B (Methodol.) 1995, 57, 289–300. [Google Scholar] [CrossRef]
Figure 1.
Distributions of urinary markers shown against laboratory-provided reference intervals and decision limits: (a) QUIN; (b) 3-HK; (c) KYN; (d) IDO index (KYN/TRP × 1000); (e) QUIN/KYNA ratio; (f) Neopterin; (g) KYNA; (h) NAD; (i) TRP. Shaded bands/lines denote reference intervals or one-sided thresholds; where reference information is one-sided, only the corresponding bound is shown. Boxplots depict Q1–Q3 (IQR) with the median as the center line; whiskers extend to the most extreme values within 1.5 × IQR; points denote outliers.
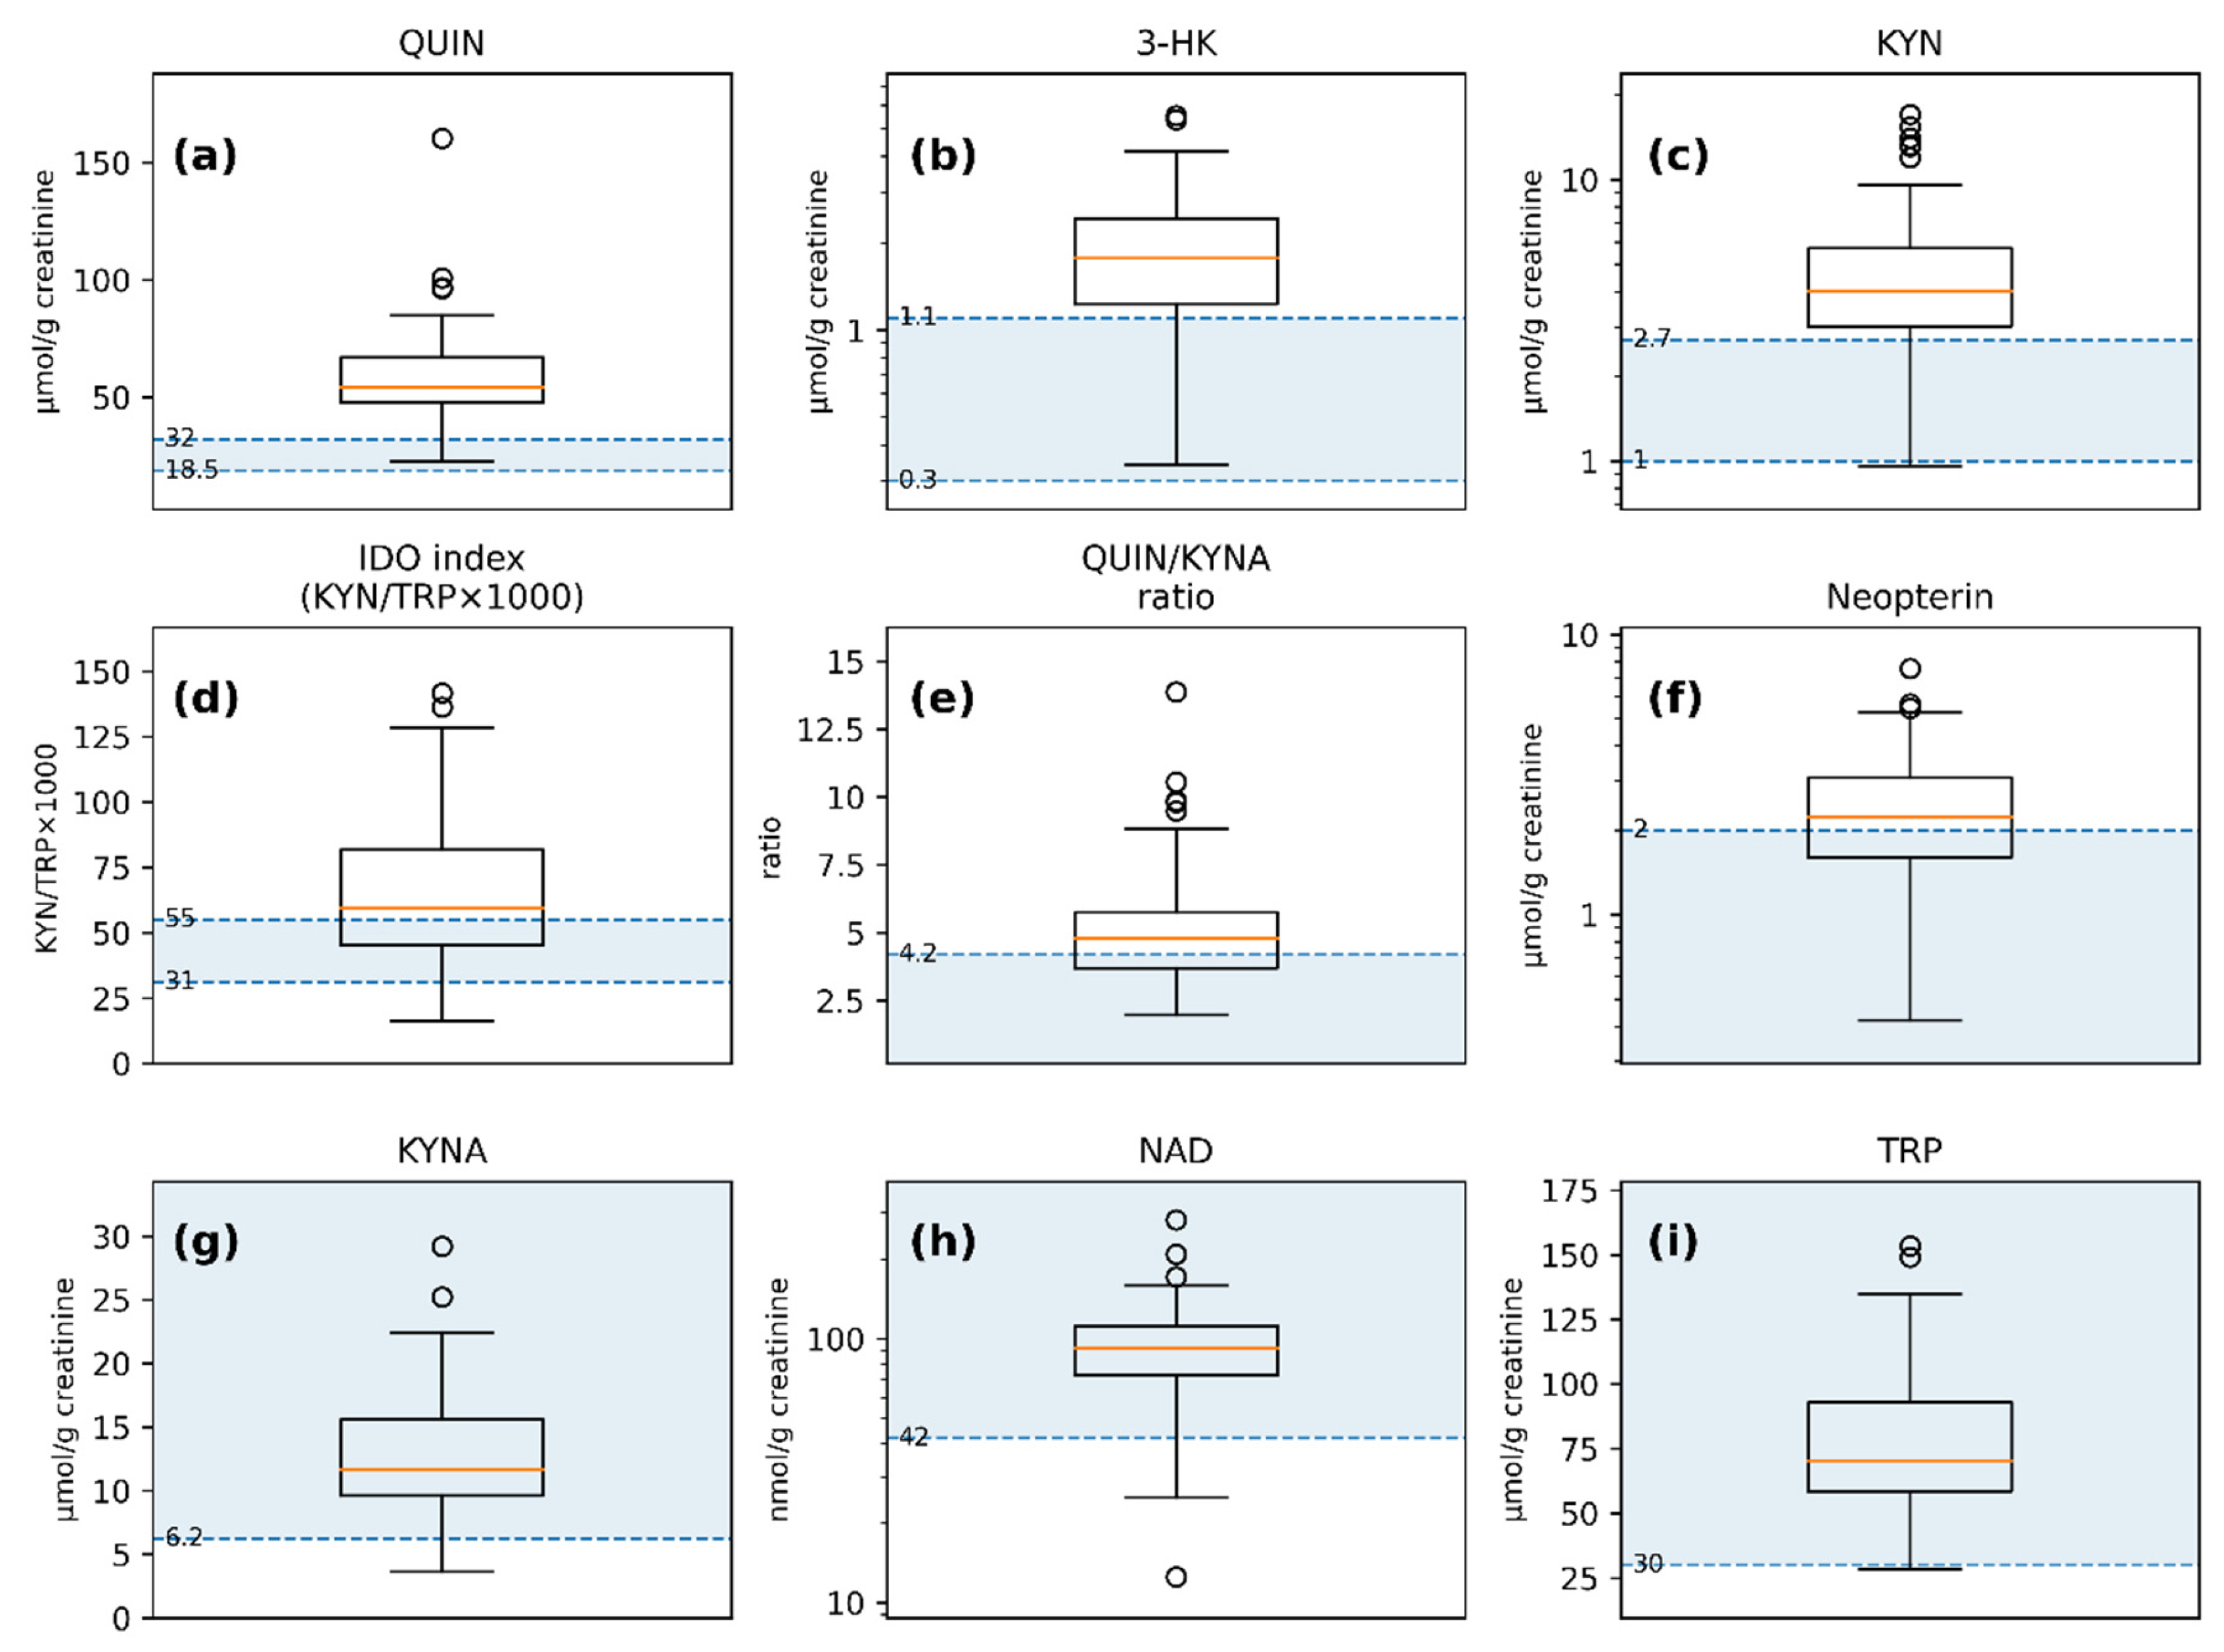
Figure 2.
Spearman correlation heatmap of the 9-variable urinary marker panel (TRP, KYN, KYNA, 3-HK, QUIN, NAD, neopterin, IDO index, and QUIN/KYNA; n = 73) based on creatinine-normalized concentrations (μmol/g or nmol/g creatinine) and derived indices. Cell color represents Spearman’s ρ (full matrix shown). False discovery rate (FDR) significance is indicated by stars (* q36 < 0.05; ** q36 < 0.01; *** q36 < 0.001), where q36 denotes Benjamini–Hochberg–adjusted p-values across the 36 unique pairwise correlations of the 9-variable panel. Cells are labeled with significance stars only (no numeric ρ values); numeric Spearman ρ values are provided in Figure S1. Robustness checks addressing potential shared-denominator effects from creatinine normalization (reconstructed absolute concentrations and partial correlations adjusting for spot creatinine) are reported in Table S3.
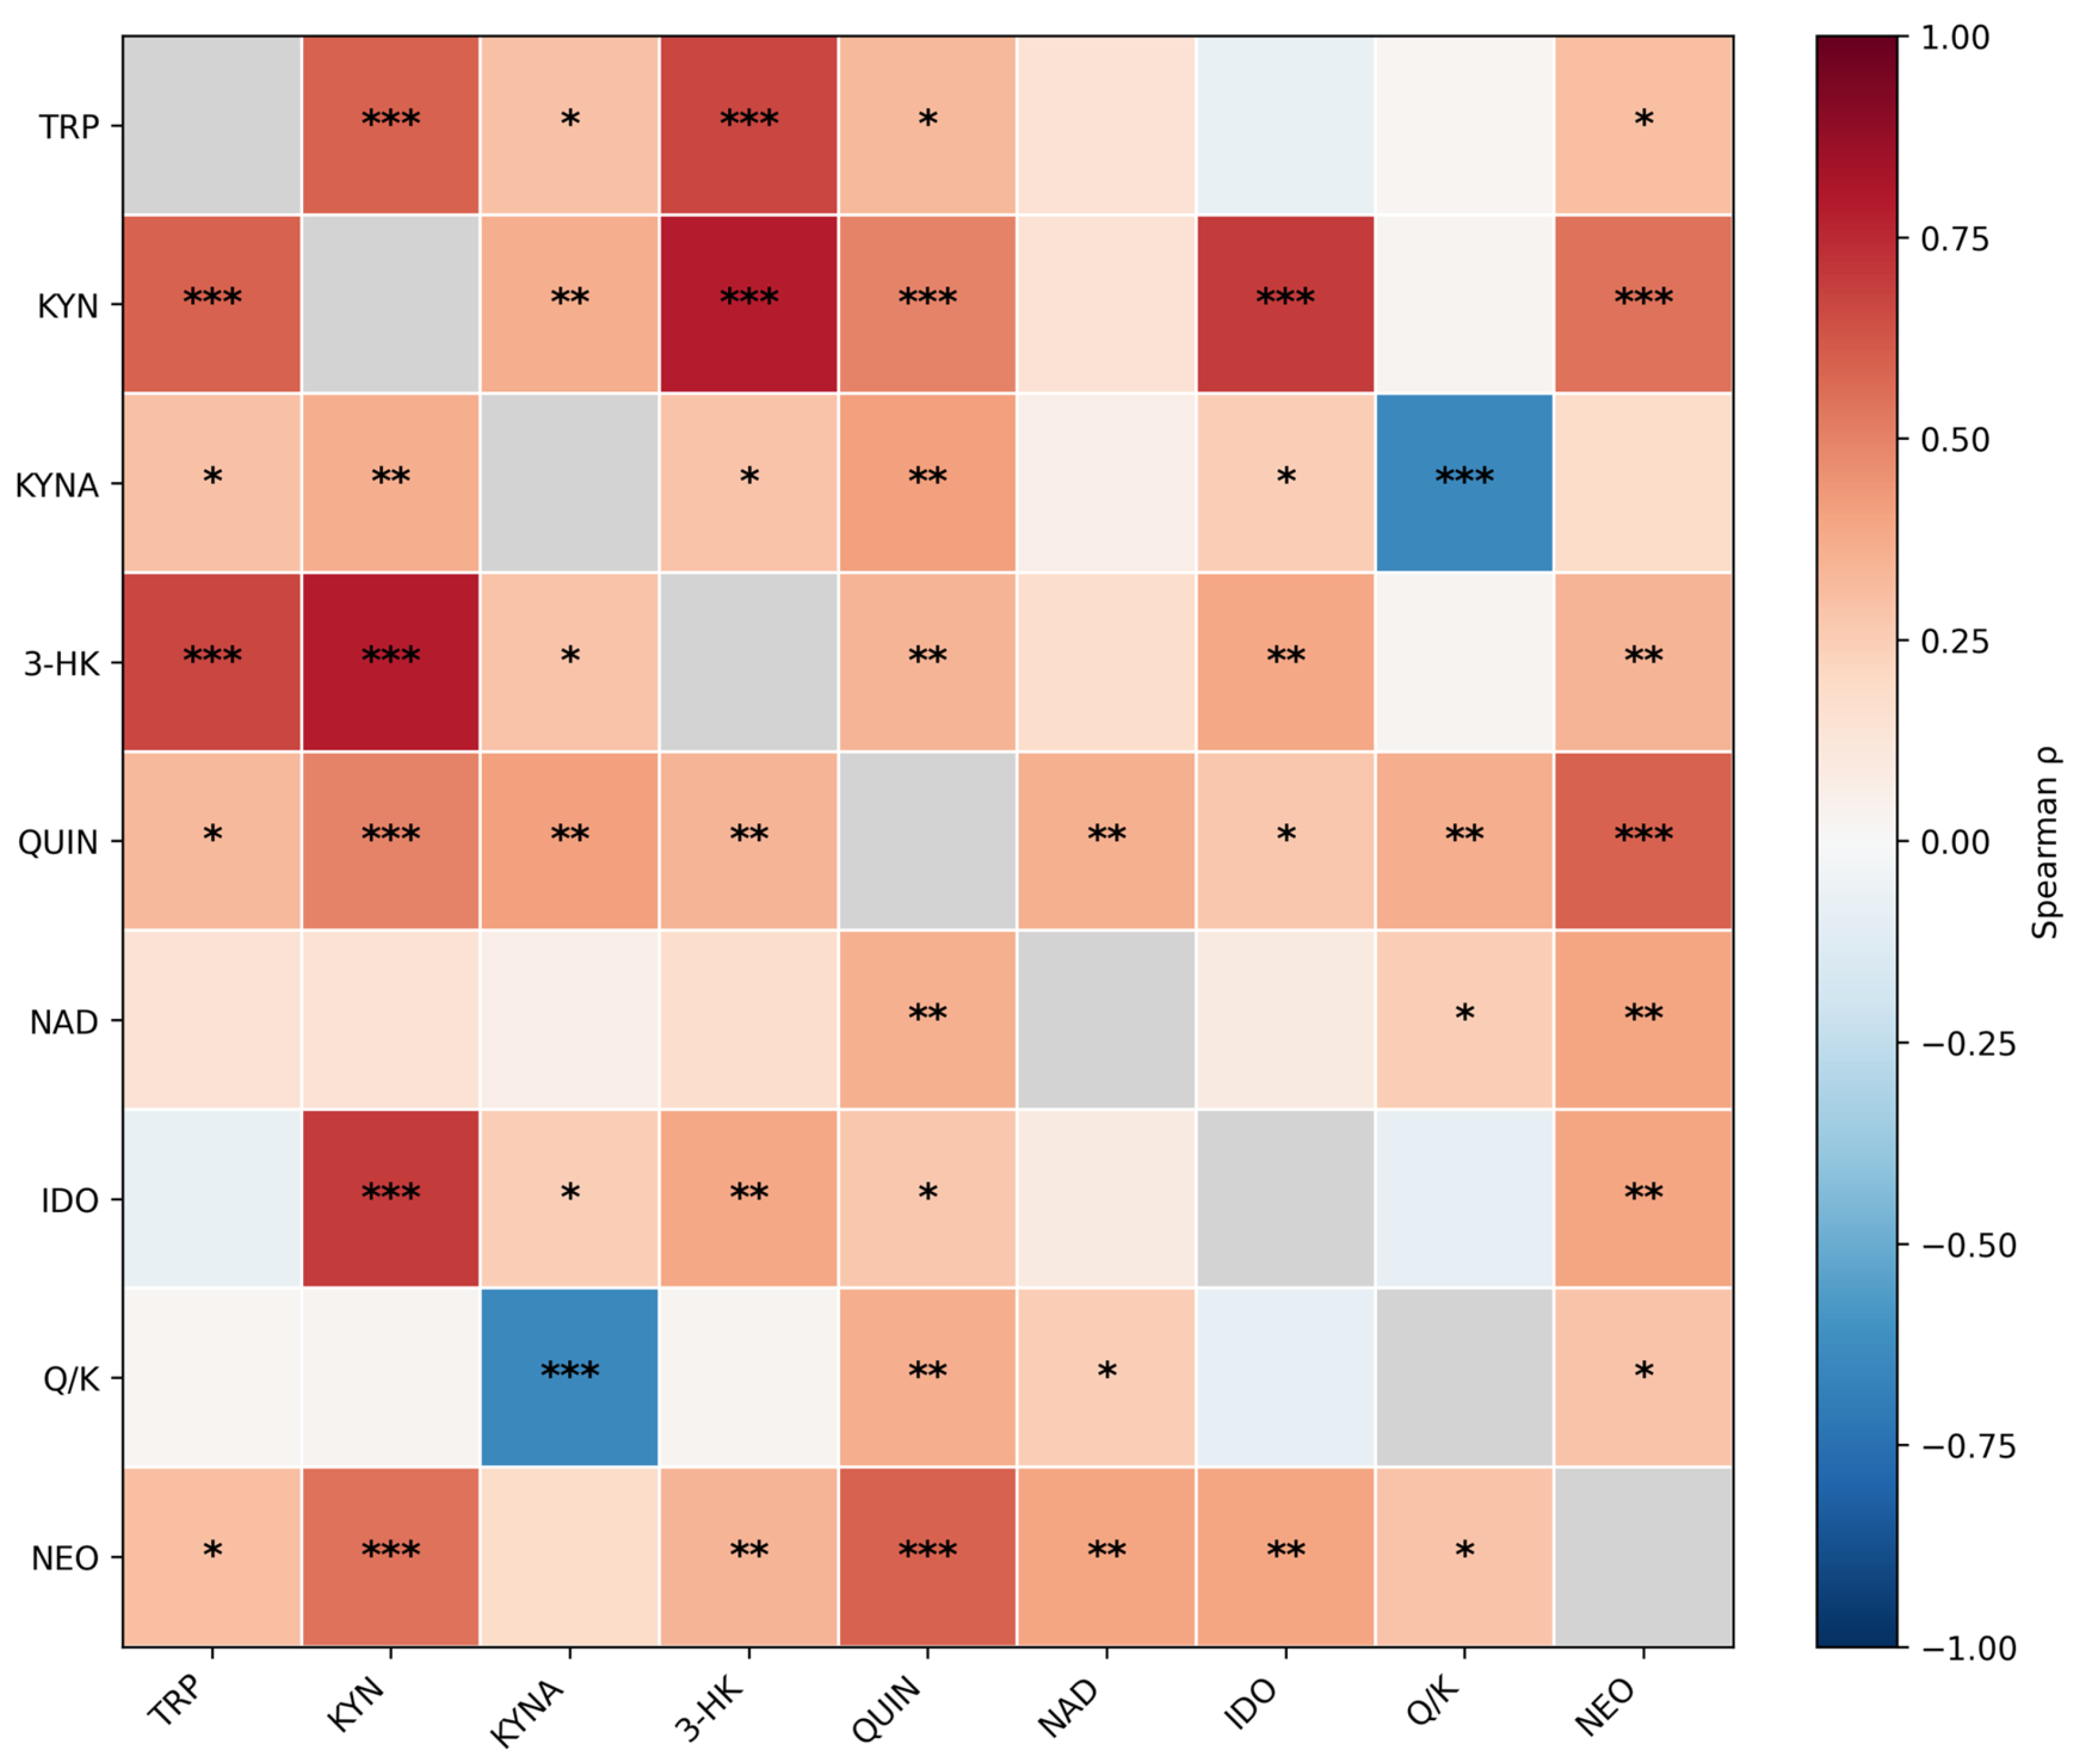
Figure 3.
Scatterplots illustrating associations between urinary neopterin and select kynurenine-pathway markers and indices (n = 73). (a) Neopterin vs. quinolinic acid (QUIN); (b) Neopterin vs. kynurenine (KYN); (c) Neopterin vs. IDO index (KYN/TRP × 1000); (d) Neopterin vs. QUIN/KYNA ratio. Each dot represents one participant; Spearman’s ρ and the corresponding significance metrics displayed in the panels are reported for each association.
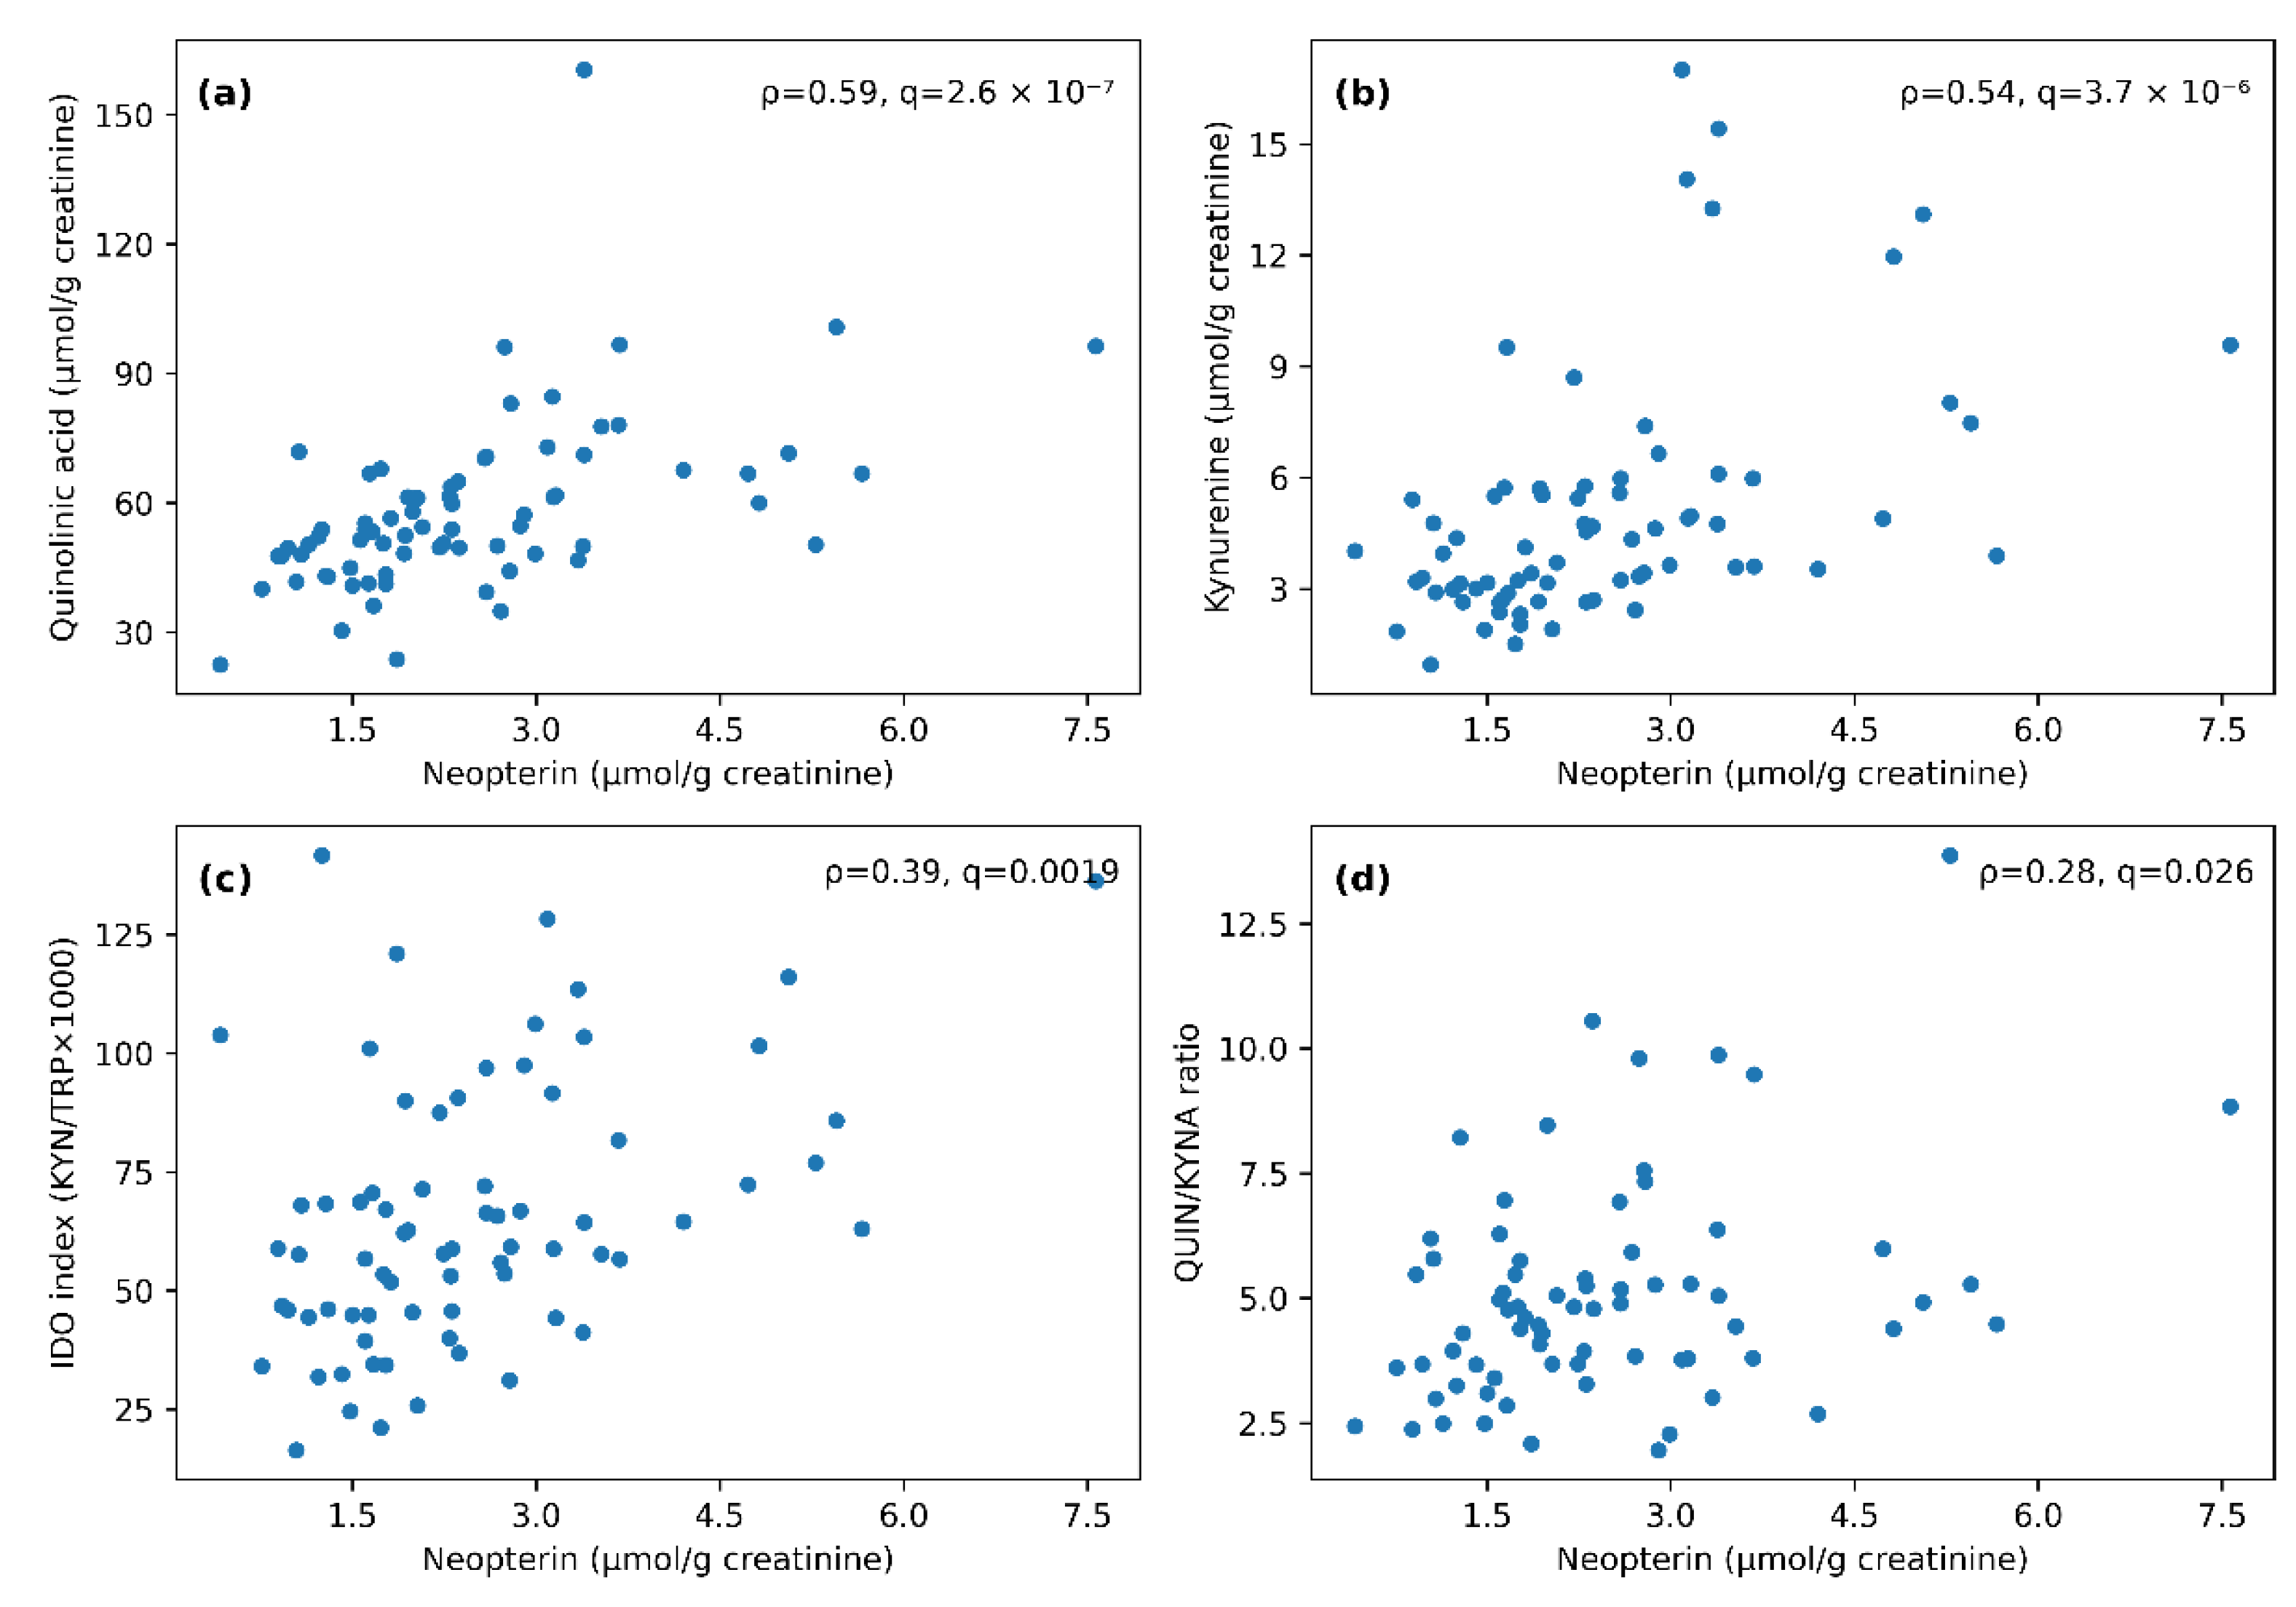

Table 1.
Participant characteristics and analytical notes (age summary statistics: 5 (4–7) years).
| Characteristic | Value |
|---|---|
| Participants, n | 73 |
| Age range, years | 3–13 |
| Age, years, median (IQR) | 5 (4–7) |
| Male, n (%) | 57 (78.1) |
| Female, n (%) | 16 (21.9) |
| Urinary creatinine (mg/L), median (IQR) | 795 (586–976) |
| Creatinine below 400 mg/L, n (%) | 11 (15.1) |
| NAD <25 nmol/g creatinine (below LOQ), n (%) | 1 (1.4) |
Table 2.
Urinary kynurenine-pathway markers, indices and neopterin relative to laboratory-provided reference limits (context only) in the autism spectrum disorder (ASD) cohort (n = 73).
Table 2.
Urinary kynurenine-pathway markers, indices and neopterin relative to laboratory-provided reference limits (context only) in the autism spectrum disorder (ASD) cohort (n = 73).
| Analyte | Unit | Reference limit | Median (IQR) | Below ref n (%) | Above ref n (%) |
|---|---|---|---|---|---|
| Quinolinic acid | μmol/g creatinine | 18.5–32.0 | 53.92 (47.78–66.85) | 0 (0.0) | 70 (95.9) |
| Kynurenine | μmol/g creatinine | 1.0–2.7 | 4.02 (3.01–5.71) | 1 (1.4) | 59 (80.8) |
| 3-OH-Kynurenine | μmol/g creatinine | 0.3–1.1 | 1.77 (1.23–2.43) | 0 (0.0) | 59 (80.8) |
| IDO index (KYN/TRP × 1000) | – | 31–55 | 59.2 (45.4–81.7) | 4 (5.5) | 46 (63.0) |
| QUIN/KYNA ratio | – | <4.2 | 4.77 (3.69–5.75) | 0 (0.0) | 45 (61.6) |
| Neopterin | μmol/g creatinine | <2.0 | 2.24 (1.60–3.09) | 0 (0.0) | 40 (54.8) |
| Kynurenic acid | μmol/g creatinine | >6.2 | 11.69 (9.61–15.59) | 4 (5.5) | 0 (0.0) |
| NAD | nmol/g creatinine | >42 | 91.7 (72.4–111.6) | 4 (5.5) | 0 (0.0) |
| Tryptophan | μmol/g creatinine | >30 | 70.35 (58.47–92.98) | 1 (1.4) | 0 (0.0) |
Note: Reference limits are laboratory-provided and used as contextual benchmarks (no neurotypical control group). For one-sided limits (< or >), only the indicated direction is considered outside reference. Abbreviations: TRP, tryptophan; KYN, kynurenine; KYNA, kynurenic acid; 3-HK, 3-hydroxykynurenine; QUIN, quinolinic acid; NAD, nicotinamide adenine dinucleotide; IDO index = KYN/TRP × 1000. For example, KYNA has a lower threshold (>6.2), so values below 6.2 are counted as below reference; TRP (>30) and NAD (>42) are interpreted analogously.
Table 3.
Creatinine-normalized group comparisons by neopterin status (Mann-Whitney U; Benjamini-Hochberg false discovery rate (FDR)). q denotes FDR-adjusted p-values; Cliff’s δ ranges from −1 to 1, with values farther from 0 indicating greater separation between groups. Units: μmol/g creatinine unless stated; NAD in nmol/g creatinine; ratios are dimensionless. For reconstructed absolute concentrations and spot creatinine comparisons, see Table S4.
| Marker | Median (neopterin high) | Median (neopterin normal) | p | q (FDR) | Cliff’s δ |
|---|---|---|---|---|---|
| Kynurenine | 4.91 | 3.16 | 2.93 × 10⁻⁵ | 1.17 × 10⁻⁴ | 0.57 |
| Quinolinic acid | 61.65 | 48.28 | 1.66 × 10⁻⁵ | 1.17 × 10⁻⁴ | 0.59 |
| 3-OH-Kynurenine | 2.1 | 1.35 | 0.001 | 0.003 | 0.44 |
| Tryptophan | 75.88 | 66.81 | 0.009 | 0.013 | 0.36 |
| IDO index | 66.05 | 51.8 | 0.01 | 0.013 | 0.35 |
| NAD | 95.55 | 74.5 | 0.008 | 0.013 | 0.36 |
| QUIN/KYNA ratio | 4.98 | 4.3 | 0.056 | 0.064 | 0.26 |
| Kynurenic acid | 12.75 | 11.14 | 0.142 | 0.142 | 0.2 |
Disclaimer/Publisher’s Note: The statements, opinions and data contained in all publications are solely those of the individual author(s) and contributor(s) and not of MDPI and/or the editor(s). MDPI and/or the editor(s) disclaim responsibility for any injury to people or property resulting from any ideas, methods, instructions or products referred to in the content. |
© 2026 by the authors. Licensee MDPI, Basel, Switzerland. This article is an open access article distributed under the terms and conditions of the Creative Commons Attribution (CC BY) license.
Copyright: This open access article is published under a Creative Commons CC BY 4.0 license, which permit the free download, distribution, and reuse, provided that the author and preprint are cited in any reuse.


