Preprint
Brief Report

This version is not peer-reviewed.

Summer Peak of SARS-CoV2 Virus in Wastewater from the Largest Bulgarian Cities in the 2024 Season

Submitted:

10 February 2026

Posted:

10 February 2026

You are already at the latest version

Abstract
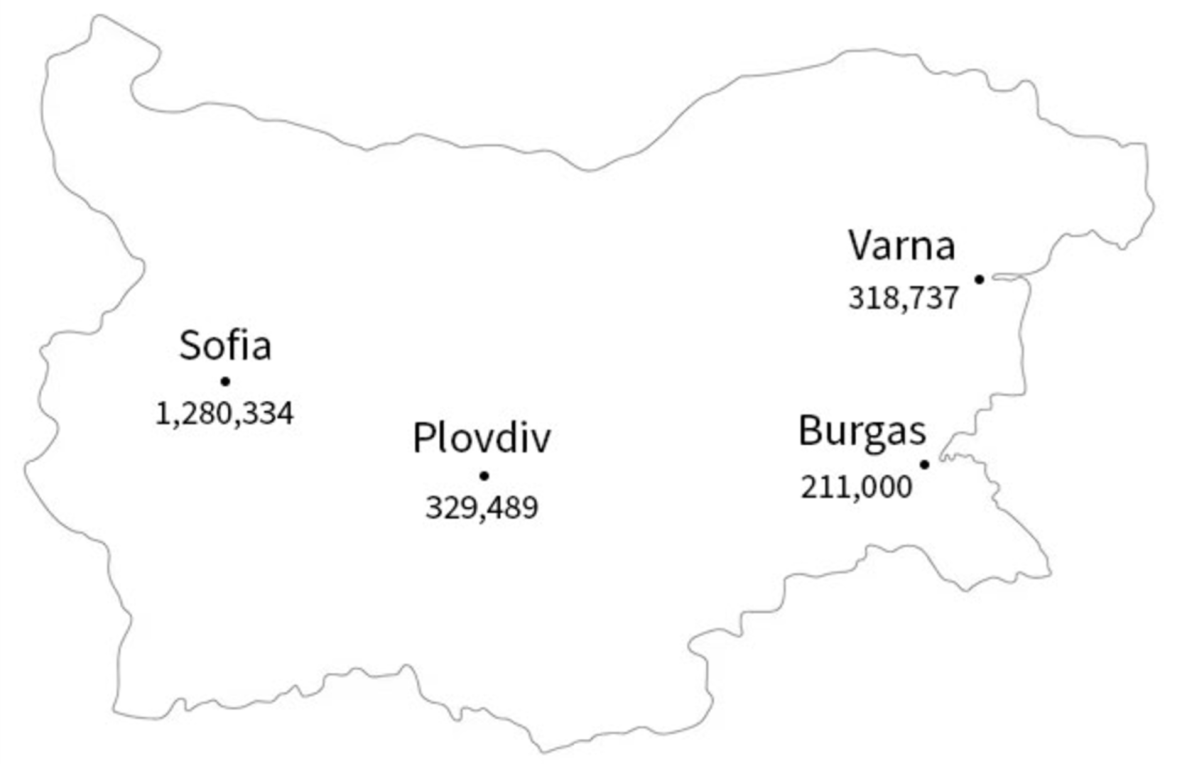
Wastewater-based epidemiology (WBE) was applied to monitor human-pathogenic respiratory viruses, including SARS-CoV-2, in the four largest Bulgarian cities during the summer and autumn of 2024. Starting from 1 liter wastewater samples, concentra-tion of the virus fraction with PEG 8000/NaCl, extraction and purification of DNA/RNA were applied. Detection of SARS-CoV-2, FluA/B, RSV and HCoV229E was performed with TaqMan qPCR. A total of 42 samples were processed over a 7-month period. Two summer peaks of SARS-CoV-2 were detected in the capital Sofia, in July and September 2024. With some differences, a similar result was observed in Plovdiv and Burgas. The concentration of SARS-CoV-2 in wastewater decreased significantly in November and December. Other respiratory viruses started to be detectable only at the beginning of October. The results of this study show an unusual summer peak of SARS-CoV-2 in wastewater from large cities, followed by a significant decrease of vi-rus concentrations in the fall. The established trend correlates with the statistics of COVID-19 incidence in Bulgaria.
Keywords: 
;  ;  ;  ;  ;  

1. Introduction

The COVID-19 pandemic had a major impact on public health, the economy and the general public perception of safety. For the first time since the Spanish flu, an infectious disease claimed millions of lives worldwide. In Bulgaria, the pandemic death toll reached 5,661/1M population, the highest in Europe and second in the world [1]. The main reason was the poor management of health policy, including non-existent infectious disease monitoring programs. Now, after the termination of emergency diagnostics in 2024, health authorities have returned to the pre-pandemic pathogen surveillance regime - i.e. no testing for pathogens outside hospitals, except for private patient-paid analyses. Providung an alternative for monitoring of pathogenic viruses, the current study, part of a EU-funded project, selected Wastewater-based epidemiology (WBE) as the preferred methodology. WBE serves as a complementary surveillance tool for monitoring of community-level infectious diseases caused by viruses and other microorganisms. WBE is a scalable and cost-effective methodology, does not require patients’ consent and it is independent from the usual medical diagnostic pathways and healthcare administration. Recent experience with SARS-CoV-2, influenza virus, etc., proves that changes in the concentration of these viruses in wastewater correlates with the local disease incidence [2]. Moreover, wastewater surveillance can be used to predict disease outbreaks, because usually peaks in virus concentrations are detected before changes in hospital statistics. Additional advantages of WBE are that it takes into account a population that usually avoids routine clinical surveillance, and it has the potential to integrate into monitoring plans for other health risk indicators such as antibiotic and drug consumption, detection of the spread of antibiotic-resistant genes, etc. [3]. The current WBE project was launched in early 2024. Initially, it included only detection of SARS-CoV-2, with influenza, RSV, and other viruses added to the monitoring program from the summer of 2024. Using WBE, we followed the dynamics of the concentration of the studied pathogens in four Bulgarian cities. Already in the first months of monitoring, a summer epidemiological peak in the concentration of SARS-CoV-2 in wastewater was established. This publication presents some unusual results of the monitoring of respiratory viruses in the summer and autumn of 2024.

2. Materials and Methods

The sampling program includes the wastewater treatment plants of the capital Sofia, as well as the next most populous cities – Plovdiv, Varna and Burgas. Together, they represent almost 35% of the population of Bulgaria. Over a period of about 7 months (June - December, 2024), 42 samples were collected, including 18 from Sofia, 10 from Plovdiv, and 7 each from Varna and Burgas. One liter of wastewater was collected from each location, transported immediately to the laboratory in a refrigerator, and processed for up to a maximum of 24 hours. The wastewater samples were first placed on a shaker at room temperature for 45 min. Then they were filtered through 4 layers of gauze and 400 ml of the filtrate were centrifuged at 7000g /45 min to remove bacteria. The supernatant was split in two halves of 200 ml and each half was saturated to 10% PEG 8000 and 0.5M NaCl, incubated for 2 hours at 6ºC and centrifuged 13500g/60 min. The precipitate containing the concentrated viral fraction was stored long-term in liquid nitrogen. Total nucleic acids were isolated with the Quick-DNA/RNA™ Viral Kit after resuspension of the pellet in DNA/RNA Shield™ (Zymo). With this protocol the wastewater samples were concentrated 1600 times. The purified DNA/RNA were stored at -20ºC and used up to 72 hours for analysis of RNA viruses.
Virus detection was performed with TaqMan qPCR using laboratory-developed protocols on a BioRad CFX Opus 96 instrument. One-step Reliance multiplex supermix™ and SsoAdvanced probes™ (BioRad) were used for the enumeration of RNA- and DNA- viruses, respectively. Typically, the reaction mixture were multiplex – between 2 and 4 targets per the reaction. A list of the primers used for virus detection is shown in Table S1. Each qPCR run included a negative, positive and internal controls. Quantitative positive controls were prepared by the synthesis of oligonucleotides corresponding to the target sequences in published viral genomes. The results were processed with BioRad CFX Maestro software. Each value in the figures is the average of at least three measurements ± standard error. The detection of crAssphage as well as samples artificially spiked with bacteriophage BsXeu269p/3 were applied as validation controls for viral nucleic acid extraction procedures from wastewater.

3. Results

The proportion of positive for SARS-CoV-2 samples was 15/18, 9/10 and 5/7, respectively for Sofia, Plovdiv and Burgas/Varna. In the capital Sofia (Figure 1A) in June and early July 2024, the virus was not detected. This was followed by a rapid short-term escalation to 2300 copies /ml at the end of July. A second peak in the concentration of the virus in Sofia wastewater was recorded from the sampling on 25.09, where the value exceeded 6000 copies/ml. This was followed by a gradual decrease, and before Christmas the amount of SARS-CoV-2 was below the detection limit – like in June! In Plovdiv (Figure 1B) the peak in the concentration of the coronavirus began a little later, in August, and continued until October. The peak values for SARS-CoV-2 in Plovdiv were lower compared to Sofia. In Burgas, the dynamics of SARS-CoV-2 was like in Plovdiv, i.e. from August to October. In Varna, the trend was different, with peak in the concentration of the virus was observed only in October. In general, in all four cities, during the months of November and December, the level of SARS-CoV-2 decreased and became undetectable in wastewater. Table 1 presents summarized data for other respiratory viruses. Unlike SARS-CoV-2, they were not detected in wastewater in the summer months. There were single positive samples for influenza in October and November, but this virus was mainly detected in December. RSV followed the opposite trend - it was detected mainly in October. Another coronavirus, HCoV 229E, causing "common cold" appeared in October and was detectable in wastewater throughout the fall. In summary, Flu, RSV and 229E have a „normal“ trend for respiratory pathogens, appearing in the autumn season. The opposite was observed with SARS-CoV-2, it circulates during the warm months, and with the cold in October it decreased and later became undetectable.

4. Discussion

The observed trend correlates with the official health statistics of Bulgaria [4]. In 2024, a peak in the incidence of COVID-19 was reported starting at the end of August, i.e. with a latent period of 2–3 weeks after the increase in SARS-CoV-2 concentrations in wastewater. Similarly, at the end of October, after the established decrease in the virus, a decline in the number of reported cases followed. Summer SARS-CoV-2 activity is unusual. Results from similar wastewater monitoring show typical peaks of SARS-CoV-2 in the second half of autumn, winter, and early spring [5,6,7]. An exception, as reported here, was found in the same summer of 2024 in some cities in Switzerland [8]. In conclusion, questions remain open for discussion and new research. For example, how widespread are such “exceptions”, why does respiratory SARS-CoV-2 prefer summer heats, etc. An interesting additional observation in this study was the specific dynamics of SARS-CoV-2 concentrations in individual cities of a small country like Bulgaria - a reason to think about in future planning of monitoring programs.

Supplementary Materials

The following supporting information can be downloaded at the website of this paper posted on Preprints.org. Table S1: Primers, probes and other oligos used in this study.

Author Contributions

S.I.: conceptualization, formal analysis, writing – original draft preparation, funding acquisition. Zoltan Urshev: methodology, writing – review and editing. Stoyan Shishkov: conceptualization, supervision, resources. Аnton Hinkov: investigation, writing – review and editing. Mihaela Belouhova: investigation. Silvia Mileva: formal analyses. Kalin Atanasov: formal analyses – sampling.

Funding

This study was funded by the European Union-Next Generation EU, through the National Recovery and Resilience Plan of the Republic of Bulgaria, project No BG-RRP-2.004-0008, scientific group 3.2.4.

Institutional Review Board Statement

Not applicable for studies not involving humans or animals.

Informed Consent Statement

Not applicable for studies not involving humans.

Acknowledgments

The authors thank the management teams of Wastewater Treatment Plants in Sofia, Plovdiv, Varna and Burgas for the fruitful collaboration for the benefit of public health.

Conflicts of Interest

The authors declare no conflicts of interest.

References

  1. Coronavirus Tracker, representative until 13.04, 2024, Available online: https://www.worldometers.info/coronavirus/ (accessed on 03.10.2025).
  2. Grassly, N. Shaw, A. Owusu, M. Global wastewater surveillance for pathogens with pandemic potential: opportunities and challenges. The Lancet Microbe 2025, 6(1), 100939. [CrossRef]
  3. Robins, K. Leonard, A.C. Farkas, K. Graham, D.W, Jones, D.L. Kasprzyk-Hordern, B.; et al. Research needs for optimising wastewater-based epidemiology monitoring for public health protection. J Water Health 2022, 20(9), 1284–1313. [CrossRef]
  4. National Center of Infectious and Parasitic Diseases, Epidemiological bulletin, Available online: https://www.ncipd.org/index.php/en/epi-bulletin (accessed on 03.10.2025).
  5. Yuehan, Ai. Davis, A. Jones, D. Lemeshow, S. Tu, H. He, F.; et al. Wastewater SARS-CoV-2 monitoring as a community-level COVID-19 trend tracker and variants in Ohio, United States. Sci Total Environ 2021, 801, 149757. [CrossRef]
  6. Zafeiriadou, A. Kaltsis, L. Kostakis, M. Kapes, V. Thomaidis, N. Markou, A. Wastewater surveillance of the most common circulating respiratory viruses in Athens: The impact of COVID-19 on their seasonality. Sci Total Environ 2023, 900, 166136. [CrossRef]
  7. Robotto, A. Lembo, D. Quaglino, P. Brizio, E. Polato, D. Civra, A.; et al. Wastewater-based SARS-CoV-2 environmental monitoring for Piedmont, Italy. Environ Res 2022, 203, 111901. [CrossRef]
  8. Pitton, M. McLeod, R.E. Caduff, L. Dauletova, A. de Korne-Elenbaas, J. Gan, C. et al. A six-plex digital PCR assay for monitoring respiratory viruses in wastewater. Nat Water 2025. [CrossRef]
  9. Boehm, A. B. Hughes, B. Duong, D. Chan-Herur, V. Buchman, A. Wolfe, M. K. White, B. J. Wastewater surveillance of human influenza, metapneumovirus, parainfluenza, respiratory syncytial virus (RSV), rhinovirus, and seasonal coronaviruses during the COVID-19 pandemic. The Lancet Microbe 2023, 4(5), e340-e348. doi.org/10.1101/2022.09.22.22280218.
  10. Hu, A. Colella, M. Tam, J. S. Rappaport, R. Cheng, S. M. Simultaneous detection, subgrouping, and quantitation of respiratory syncytial virus A and B by real-time PCR. Journal of clinical microbiology 2003, 41(1), 149–154. [CrossRef]
  11. Shopova, E. Brankova, L. Ivanov, S. Urshev, Z. Dimitrova, L. Dimitrova, M. Kizheva, Y. Xanthomonas euvesicatoria-specific bacteriophage BsXeu269p/3 reduces the spread of bacterial spot disease in pepper plants. Plants 2023, 12(19), 3348. [CrossRef]
  12. Stachler, E. Kelty, C. Sivaganesan, M. Li, X. Bibby, K. Shanks, O. C. Quantitative CrAssphage PCR assays for human fecal pollution measurement. Environmental science & technology 2017, 51(16), 9146–9154. [CrossRef]
  13. Van Elden, L. J. R. Nijhuis, M. Schipper, P. Schuurman, R. Van Loon, A. M. Simultaneous detection of influenza viruses A and B using real-time quantitative PCR. Journal of clinical microbiology 2001, 39(1), 196–200. [CrossRef]
  14. Whiley, D. M. Sloots, T. P. A 5′-nuclease real-time reverse transcriptase–polymerase chain reaction assay for the detection of a broad range of influenza A subtypes, including H5N1. Diagnostic microbiology and infectious disease 2005, 53(4), 335–337. [CrossRef]
Figure 1. Monitoring of the SARS-CoV-2 virus in wastewater of the capital Sofia (A), and the cities of Plovdiv/Burgas/Varna (B), for the period from week 26 to week 51 of 2024. The values are presented in сopy number/ml wastewater±standard error. The dotted horizontal line indicates the detection limit for this virus. WWTP, wastewater treatment plant.
Preprints 198404 g001
Table 1. Distribution of positive samples for other respiratory viruses for the last 3 months of 2024. Data points are identified according to the city/week pair. White fields indicate that no measurement was made, and a zero value means that the target virus is below the qPCR detection limit. The gray scale for positive results depends on the concentration of viruses in the wastewater.
Influenza A and B RSV A and B CoV 229E
October November December October November December October November December
40 41 42 44 46 47 48 49 50 51 40 41 42 44 46 47 48 49 50 51 40 41 42 44 46 47 48 49 50 51
Sofia 0 0 0 0 0 0 0 0 0 0 0 0 0
Plovdiv 0 0 0 0 0 0 0 0
Burgas 0 0 0 0 0 0
Varna 0 0 0 0
Disclaimer/Publisher’s Note: The statements, opinions and data contained in all publications are solely those of the individual author(s) and contributor(s) and not of MDPI and/or the editor(s). MDPI and/or the editor(s) disclaim responsibility for any injury to people or property resulting from any ideas, methods, instructions or products referred to in the content.
Copyright: This open access article is published under a Creative Commons CC BY 4.0 license, which permit the free download, distribution, and reuse, provided that the author and preprint are cited in any reuse.
Prerpints.org logo

Preprints.org is a free preprint server supported by MDPI in Basel, Switzerland.

Subscribe

Disclaimer

Terms of Use

Privacy Policy

Privacy Settings

© 2026 MDPI (Basel, Switzerland) unless otherwise stated