
Submitted:
10 August 2024
Posted:
13 August 2024
You are already at the latest version
Preprints on COVID-19 and SARS-CoV-2
Abstract
Wastewater genomic surveillance is an efficient and economic approach to track infectious diseases and can help detect unusual epidemiological events. The current study uses this approach for the first time in Morocco to monitor the epidemiology of SARS-CoV-2 and Influenza A, B and RSV virus infections during the third wave of COVID-19 caused by the Omicron variant. The virome was concentrated from wastewater collected from two sewer sheds of two cities, Agadir and Inezgane, using the PEG/NaCl method. The viral copy number was determined using qRT-PCR. All 26 samples in both cities were tested positive for SARS-CoV-2 at various viral loads. For Influenza A virus, two samples were tested positive in Inezgane. The estimated SARS-CoV-2 viral RNA copy numbers observed were then used to estimate the number of infected individuals using the SEIR model. The number of viral copies of SARS-CoV-2 for Agadir and Inezgane varied from 82932 ± 15479 to 507865 ± 58759 copies/L and 61244 ± 8552 to 497506 ± 18061 copies/L, respectively. The estimated number of cases correlates positively with the number of reported cases. Next Generation Sequencing showed that samples contain the following two variants: BA.1 and BA.2 that have been detected in clinical samples. This study demonstrates the effectiveness and feasibility of wastewater genomic surveillance in monitoring pathogens such as SARS-CoV-2 in Morocco.
Keywords:
Wastewater-based epidemiology
; COVID-19
; SARS-CoV-2
; Influenza A
; Morocco
; Genomic surveillance
1. Introduction
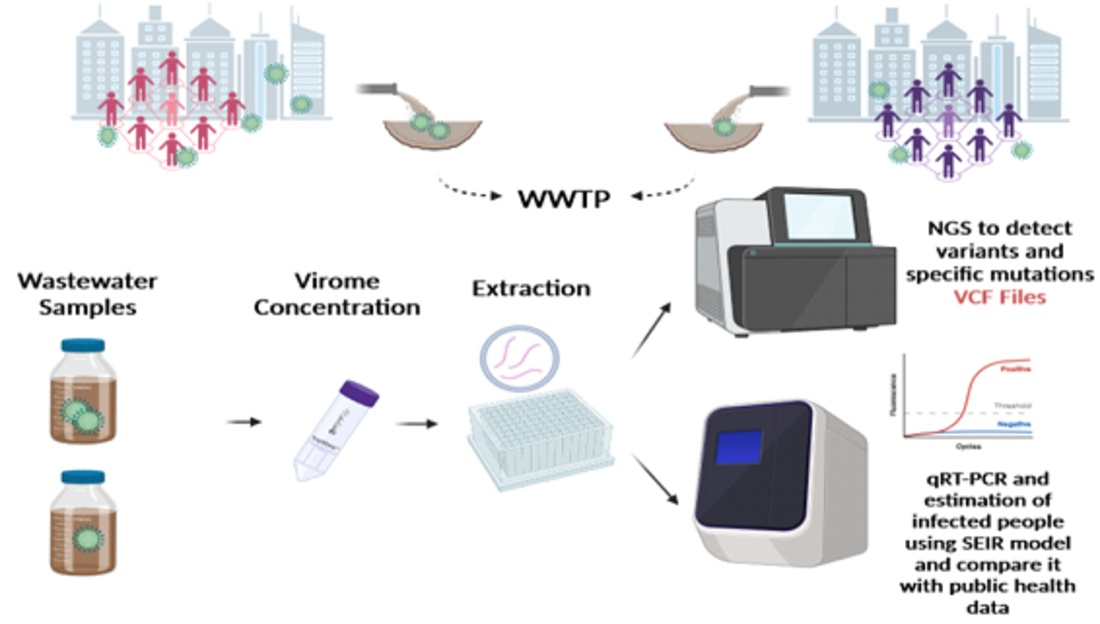
Wastewater-based epidemiology (WBE) is a promising approach for monitoring pathogens that may pose a threat to human and animal health. This method can be applied as an early warning tool and allows for action before the pathogens spread to the general population. It presents an alternative, more comprehensive, and less expensive strategy that can be used in low-income countries instead of diagnostic tests that examine each individual, which require resources that undeveloped countries do not possess [1] The approach allows decision-makers to take essential actions and avoid strain on public health systems [2]. Wastewater monitoring was initially used to estimate the use of illegal substances and subsequently extended to estimating community prevalence of pathogens excreted in urine or feces, such as SARS-CoV-2 [3]. Given the presence of SARS-CoV-2 in feces, it is possible to estimate the number of infected individuals, both symptomatic and asymptomatic, in a given community using wastewater [4]. This strategy enables early detection of infected cases, which allows authorities to take necessary measures to contain the epidemic. Several studies have shown the effectiveness of this method and have demonstrated a significant correlation between the number of reported cases and the number of cases estimated from wastewater [5,6]. The estimation of the number of infected people is based on the use of statistical models, mainly Monte Carlo Simulation [7,8]. These models are based on the use of quantified virus copy numbers in wastewater (copies/L) with other parameters including wastewater flow, fecal load, and RNA shedding in the stool.
Wastewater surveillance can also be used to monitor and search for new genetic variants of pathogens to implement mitigation strategies before they spread. It can offer important and complementary information by providing frequency estimates of all variants circulating in a population by overcoming the sampling limit [9]. Studies have shown the effectiveness of its use and the correlation of the data obtained with clinical trends [10,11]. In this study, we present the first report of the use of wastewater genomic surveillance in determining COVID-19, Influenza A and B, and RSV infections dynamics in Morocco in the cities of Agadir and Inezgane during the third wave of pandemic caused by the Omicron variant from January to February 2022.
2. Materials and Methods
2.1. Wastewater Sampling
26 Raw wastewater samples from two sewersheds that collect water from the two cities (Agadir and Inezgane) were collected throughout a month, from 07/01/2022 until 04/02/2022 (Figure 1). The sewers of Agadir and Inezgane gather wastewater from communities of 682,110 and 628,380 individuals, respectively. Sampling was done every 48 hours. A 24 h composite sample was collected in sterile 2 L jars (Gosselin™ Square HDPE Graduated 2 L Bottles) and transported to a secondary Hospital Hassan II in Agadir at 4 °C. Once in the laboratory, each sample was pasteurized at 60 °C for 90 min to inactivate the pathogens and protect the manipulator. After pasteurization, each sample was transferred to 2 polypropylene centrifuge sterile 50 ml tubes (Thomas Scientific) for centrifugation at 4,000 g for 30 min to remove large debris.
2.2. Virome Concentration and RNA Extraction
Viruses were concentrated using the PEG/NaCl precipitation method with a final concentration of 10% (w/v) and 0.3M respectively [12], and left under agitation overnight at 4°C. The tubes were then centrifuged at 12,000g for 2h at 4°C and the supernatant discarded followed by washing of the pellet using 0.9% NaCl. Automated RNA extraction was done with the Nucleic Acid Extraction and Purification Kit of MagaPure (BIGFISH, Biological Technology) following the manufacturer’s recommended protocol. The kit performs extraction in a high salt state and using magnetic beads-based purification of nucleic acids. For the extraction, an aliquot of 200 μl of the concentrated wastewater sample was spiked with the MS2 prophage, an exogenous non-competitive external positive control for the extraction protocol, followed by reverse transcription and PCR amplification. Elution was done in 60 μL of nuclease-free water and stored at -80°C until the next step. Each sample was extracted in duplicates.
2.3. qRT-PCR of SARS-CoV-2 and Flu Viruses
Detection of the SARS-CoV-2 virus was done using the TaqPath™ COVID-19 CE-IVD RT-PCR Kit (Thermo Fisher Scientific). Quantification of the virus was done using the SARS-CoV-2 N and Orf1ab genes. A standard curve with a concentration ranges from 2*104 to 2*100 copies was derived using a SARS-CoV-2 positive control. Detection of Influenza A, Influenza B, and RSV was performed with the Flu Multiplex PCR KIT (GeneProof). Influenza A detection involves the amplification of specific regions in the M gene and NP gene. Influenza B detection involves the amplification of two specific regions in the HA gene. RSV A/B detection involves the amplification of specific regions in the M gene. The standard curves for the three viruses were made using positive control provided with the kits. All qRT-PCR reactions run in duplicates using the ThermoFisher QuantStudio 5 Applied Biosystem instrument (Thermo Fisher Scientific) following the manufacturer’s instructions.
To standardize the qPCR data between the two cities and throughout the sampling period, a Pepper mild mottle virus (PMMoV) qPCR was performed. PMMoV is a plant pathogen that infects pepper and exists in large quantities in fecal matter. This marker shows stability in wastewater under various environmental conditions, and it has been demonstrated as a robust marker to normalize qPCR data from wastewater [13]. qPCR of PMMoV was carried out using forward primer 5’-GAGTGGTTTGACCTTAACGTTGA-3’, reverse primer 5’-TTGTCGGTTGCAATGCAAGT-3’, and probe 5’-FAM-CCTACCGAAGCAAATG-BHQ1-3’ [14]. The reaction was performed in a final volume of 25 μl containing 6.25 μl TaqPath master Mix, 500 nM of forward and reverse primers, and 250 nM of the probe with 6.75 μl of nuclease-free water and 10 μl of the extracted RNA. Reactions were conducted using ThermoFisher QuantStudio 5 Applied Biosystem with the following thermal profile: UNG incubation at 25°C for 2 min, reverse transcription at 53°C for 10 min; denaturation and polymerase activation at 95 °C for 2 min, followed by a two-step amplification profile of 40 cycles at 95 °C for 3 s and 55 °C for 30 s. Reactions were executed with the inclusion of a negative control in every qPCR run. Standard curves were derived using serial dilutions of RNA extracted from Tabasco sauce (McIlhenny Co) following the [15] procedure.
2.4. Next Generation Sequencing (NGS) and Bioinformatic Analysis
Among the 26 samples, 4 were sequenced. These include the samples collected on 07/01/22 and the samples on 04/02/22. Extracted RNA was converted to cDNA using Ion Torrent™ NGS Reverse Transcription Kit (Thermo Fisher Scientific). Libraries were prepared with ION CHEF (Thermo Fisher Scientific) using the Ion Ampliseq kit for chef DL8 (Thermo Fisher Scientific) and the Ion AmpliSeq™ SARS-CoV-2 Insight Research Panel (A51306, Thermo Fisher Scientific). The panel design includes the addition of new variant-tolerant primers to broaden and improve the coverage for variants of concern and increase the sensitivity of the panel to enable detection from lower viral titer samples. The library was subsequently quantified using the Ion Library TaqMan Quantitation Kit (Thermo Fisher Scientific). The samples were prepared and subsequently loaded onto a 530-chip using the Ion Chef system. After loading, the chip was sequenced using the Ion GeneStudio S5 system (Thermo Fisher Scientific). Bioinformatic analysis was performed with the SARS-CoV-2 plugins that include: generate Consensus, SARS-CoV-2 coverage Analysis, SARS-CoV-2 variant Caller, SARS-CoV-2 annotate SnpEff, and SARS-CoV-2 lineage ID. Tablet software (1.21.02.08) was used for the analysis of the obtained reads and the detected variants [16].
We included also a total of 28 human nasopharyngeal swab samples obtained from the Virology Laboratory of the Regional Hospital Center biobank (Hassan II) in Agadir, Sous-Massa region, Morocco. These samples were subjected to sequencing and subsequent analysis using the previously mentioned protocol. The primary objective of this analysis was to identify and characterize the variants of SARS-CoV-2 present in clinical samples and compare them with the variants detected in wastewater samples.
2.5. Estimated Number of Infected Cases by SEIR Model
The prediction of the number of SARS-CoV-2 infected cases was based on the SEIR model (Susceptible-Exposed-Infectious-Recovered) developed by McMahan et al [8]. This model is based on the mass rate of SARS-CoV-2 RNA in the wastewater and takes into account parameters that may impact the number of estimated cases including fecal production rate, SARS-CoV-2 RNA density in feces, and decay rates during transit in sewer lines. The model takes into consideration also the basic reproduction index, incubation time, duration of infection, time to reach maximum viral load, maximum viral load, average viral load after the maximum has been reached, travel time in the sewage lagoon, and temperature of the wastewater. The estimate of the number of infected individuals was within the 95% confidence limits of the model. This approach provides a robust method for comparing multiple treatment plants at the same time.
The SEIR model was executed using R version 4.2.0 (2022-04-22 ucrt) and the deSolve package. The packages used are available at https://github.com/scwatson812/COVID19WastewaterModel. Modelizations were undertaken using the following setting: SEIR parameter control (T = 30; beta = 0.25/0.95; gamma.e = ⅕; gamma.i = 1/10 ; p = 1e-4; N = 500k/600k), Viral trajectory control (mu.V.max = 7.6; sd.V.max = 0.8; mu.V.20 = 3.5; sd.V.20 = 0.35; T.V.max = 5), Degradation control (Ts = 2; Temp = 20; mu.tau0 = 130; sd.tau0 = 25; mu.Q = 2.5; sd.Q = 0.15).
2.6. Statistical Analysis
Statistical analysis was performed using R-package (R version 4.2.0 (2022-04-22 ucrt) - "Vigorou). The statistical tests employed in this study include the Shapiro-Wilk test (Shapiro.test) to assess normality and the Student's t-test to compare the mean Ct values of MS2 and PMMOV between Agadir and Inezgane cities. Additionally, a comparison of Ct values for the N and ORF1ab target genes was conducted. Graphics were generated using ggplot2, ggpubr, dplyr and tidyverse packages in R.
3. Results
This section may be divided by subheadings. It should provide a concise and precise description of the experimental results, their interpretation, as well as the experimental conclusions that can be drawn.
3.1. SARS-CoV-2 Monitoring
3.1.1. Use of MS2 Prophage Spiking to Estimate RT-qPCR Inhibition Effects
Concentration of viruses also co-concentrates PCR inhibitors such as organic compounds and salts within wastewater, thereby introducing biases when comparing samples collected from different sites and dates. To overcome this issue, we used MS2 prophage spiking in the RNA extraction step. This exogenous non-competitive internal control allows us to appreciate the efficiency of extraction, reverse transcription, and amplification. Like SARS-CoV-2, MS2 is a positive-sense single-stranded RNA virus. The obtained MS2 Ct values are as follows: mean 29.18 (SD 1.40 Ct), mean 29.96 (SD 1.23 Ct) and mean 27.27 (SD 1.27 Ct) for Agadir City, Inezgane City, and Negative control respectively.
The Student test comparison of Ct values showed a significant difference between the sites of Agadir and Inezgane, 0.77 Ct (P = .03), and with the negative control, 1.92 Ct (P < 0.001) for Agadir and 2.69 Ct (P < 0.001) for Inezgane (Figure 2A).
These results indicate the presence of a subsidiary inhibitory effect in both samples from Agadir and Inezgane.
Hence, for the calculation of SARS-CoV-2 copies number, the MS2 mean difference value with negative control was subtracted from Ct values of N and ORF1ab gene.
3.1.2. RT-qPCR Profiles of N and ORF1ab SARS-CoV-2 Target Genes
To estimate the SARS-CoV-2 copies present in a given sample of wastewater, both N and ORF1ab target genes Ct were determined and compared (Figure 2B). The amplification efficiencies for these two genes were 106.76% (N gene) and 98.70% (ORF1ab gene). The correlation coefficients (R2) for N and ORF1ab were 0.9942% and 0.9926%, respectively. Comparison of Ct values for N and ORF1ab target genes gives a correlation coefficient of 0.37; this value suggests a positive correlation. Inspection of Ct values distribution and RT-qPCR curves indicates that there is a tilling point corresponding to ORF1ab Ct value of 28.75. Indeed, ORF1ab Ct values below 28.75 seems to be underestimated by the QuantStudio software and can be considered as outliers. Also, the correlation coefficient rises to 0.81 if considering ORF1ab Ct values greater than 28.75, and the regression linear model gives y=4.99+0.84x (R2 = 0.644; P slope = 2.4e-09). Together with these observations, we decided to use the N Ct values for estimating SARS-CoV-2 copies number.
3.1.3. PMMoV
As an internal reference for quantification of SARS-CoV-2, we amplified a PMMoV through qPCR. Previous studies have shown that PMMoV is the most abundant RNA virus in human feces, and it is shed in large quantities in wastewater. PMMoV is remarkably stable in wastewater, and its concentrations showed little seasonal variation. Moreover, PMMoV is a positive-sense single-stranded RNA virus similar to SARS-CoV-2. Ct values obtained are as follows: mean 26.86 (SD 0.52 Ct) for Agadir and mean 27.09 (SD 0.29 Ct) for Inezgane. No significant difference was found between the two cities (Figure 2C). This indicates that there is no daily variation in the number of citizens during January 2022, which is consistent with the two cities having an equivalent number of inhabitants. Therefore, the normalization step of SARS-CoV-2 with PMMoV is optional.
3.1.4. Estimating SARS-CoV-2 Copies Number and Time Series Evolution
Normalized N gene Ct values (to MS2) were used to calculate the number of SARS-CoV-2 copies abundance in wastewaters.
For Agadir city we obtained a minimal value of 82932 ± 15479 copies/L (February 4, 2022) and a maximal value of 507865 ± 58759 (January 19, 2022). For the Inezgane city, the values range from 61244 ± 8552 (February 2, 2022) to 497506 ± 18061 (January 12, 2022) (Figure 3).
3.1.5. Estimating COVID-19 Active Cases Using the SEIR Modelisation
The number of active cases of COVID-19 was estimated using the SEIR model and compared to the reported cases. Estimated active cases were obtained using the sitting described in the materials and methods. The parameters take into account a basic reproductive number (R0) of 2.5 and a population size of 500000. Changing parameters to R0 of 9.5 reported for the Omicron variant (B.1.1.529) [17] and 600000 inhabitants does not change the slope of the standard curve and does not seem to influence the order of magnitude of the estimated active cases, which is in contrast to the intercept (Figure 5).
Comparison of the profiles between reported COVID-19 cases and estimated active cases over time show a positive correlation (Spearman correlation coefficient =0.45) with a maximum number of infected people recorded in mid-January. Additionally, the results show that the estimated number of infected cases based on the viral load of wastewater is higher than the number of cases reported based on clinical tests, ~ 10x fold (Figure 6).
A lag between the estimated and reported cases was observed in Inezgane city for about 2–3 days which could serve to alert the authorities to take the necessary measures before burdening the hospitals. This lag was not systematically observed, possibly due to sampling and recording active cases.
3.1.6. SARS-CoV-2 Genome Sequencing from Wastewater
Lineage geospatial distributions were assessed through NGS sequencing of four samples corresponding to the beginning and the end of the January SARS-CoV-2 wave (Table 1).
Across samples, coverage depth varies between a minimal value of 222 to a maximal value of 4673. Bases with coverage represented 99.8% and the N50 and N90 were equal to 4056 and 1689, respectively.
Across the SARS-CoV-2 genome, coverage depth drops drastically to less than ten in the region 21800–22080 (280 bp). This region corresponds to the N-terminus of S protein. It seems that there is a failure in Amplicon-Based Detection and Sequencing of SARS-CoV-2; failure in target amplification; Lineage-dependent amplicon failure (Figure 7A).
Genomic monitoring of the variants of SARS-COV-2 in the wastewater showed that the four samples analyzed, which represent the beginning and the end of the wave, contain the two variants BA.1 and BA.2. The variant BA.1was the more abundant (99.7% Reads) than BA.2 (0.3% Reads). BA.1 and BA.2 specific or shared mutations were detected except for those that fall in the zero coverage (Figure 5B). The same variants detected in wastewater were also found in clinical samples that were sequenced.
3.2. Influenza A/B and RSV Monitoring
Specific detection experiments of Influenza viruses (A and B) and Respiratory Syncytial virus from samples of Agadir and Inezgane cities showed negative results except for two samples of Inezgane city (Figure 8).
4. Discussion
This study highlights the first use of the wastewater-based approach for monitoring infectious diseases in Morocco. It has been used to monitor SARS-CoV-2 and Influenza A/B, and RSV viruses in two cities: Agadir and Inezgane. The virome in the wastewater samples was concentrated using the polyethylene glycol (PEG)/NaCl approach. According to a study published by [18], this method showed the highest and most reproducible recovery rates (46.6–56.7%) of SARS-CoV-2 virus compared to other methods based on ultrafiltration or adsorption-extraction. Since wastewater is a matrix rich in PCR inhibitors, and may consequently bias wastewater-based estimates, the MS2 prophage was used as a non-competitive exogenous control to assess the efficiency of extraction, reverse transcription, and amplification. The results of the recorded MS2 Ct showed the presence of inhibitors, especially in the samples taken in Inezgane with a 2–3 Ct difference compared to the negative control. Two genes, N and orf1ab, were tested to detect SARS-CoV-2. The Ct values obtained for N and orf1ab were normalized to the Ct of MS2. Copy number detected by N genes shows consistency compared to that of the orf1ab gene. Most studies are based on quantification of the viral copy number using the N gene [5,8]. A study that tested 19 primer sets demonstrated that primer sets targeting the N gene had the fastest amplification and highest sensitivity for the detection of SARS-CoV-2 [19]. In addition, according to the CDC, primers targeting the N gene: N1 and N2 gene regions have been shown to be sensitive and specific for quantifying SARS-CoV-2 RNA in wastewater [20]. The number of copies of the N gene was then used to estimate the number of infected individuals. To validate the results of wastewater monitoring, it is very important to normalize the number of copies found against fecal indicators such as PMMOV. This allows the use of data found in epidemiological models because it considers the differential fecal load at the level of the samples taken. There was no significant difference between the two cities according to the Cts of the PMMOV recorded at the level of the samples taken in Agadir and Inezgane. Therefore, normalizing the number of copies was optional. We used the mathematical SEIR model for estimating the number of infected persons. This model considers the contact rate parameter, which is the 'beta' parameter. This parameter is equal to R0γ/S(0), where R0 is the baseline reproduction number, γ is divided by the infectious period, and S(0) is the proportion of the susceptible population at the beginning of the study period. This allows the model to adapt to the characteristics of the study population. The epidemiological evolution of the estimated number of cases was consistent with the number of cases reported by authorities in the two cities. The results show that the estimated number of infected cases based on the viral load of wastewater is higher than the number of cases reported based on clinical tests, i.e., ~10-fold. This was also observed in studies conducted in Canada, the USA, Australia, and the UAE [21,22,23]. This could be explained by the fact that people were no longer tested during this wave. In addition, omicron infection in combination with vaccination results in less severe and mild-to-moderate symptoms, and people suffice by self-medication. A high number of infected individuals was recorded in mid-January. This number is moderate because of mass vaccination of the population against SARS-CoV-2.
Upon comparison, this wave is different from the first two waves caused by the Alpha and Delta variants (Figure 9). It is characterized by very high transmissibility and low severity of clinical forms. The initial reproduction number (R0) of the historical variant was approximately 2.5, and the alpha variant had an 80% higher R0 of approximately 4. The Delta variant is even more transmissible, with an R0 of 6–8 [24]. However, the Omicron variant could be up to 100% more transmissible, which means that its R0 would be approximately 12–15 [17].
Therefore, this virus is currently one of the most contagious. The pathways of human-to-human transmission of SARS-CoV2 between individuals involve direct inhalation of soiled droplets released into the air by sneezing or coughing and transmission through the oral, nasal, and ocular mucosa.
At the international level, the Omicron variant rapidly spreads and becomes the dominant variant within a few weeks. At the national level, Omicron-wave, which started in January and ended in February, is characterized by a shift in regions; the epidemics were heterogeneous. The cities of Casablanca and Rabat recorded the most important cases compared to Agadir and Inezgane. During this wave, there was simultaneous circulation of the Delta and Omicron variants, but the latter was dominant in 98% of cases. The wave accelerated owing to an increase in the contagiousness of the virus and decrease in the barriers to slow down its circulation, such as containment. From the first week of February, the wave passed to the descending phase and the number of cases started to decrease progressively. Consequently, the epidemiological situation gradually improved.
It is noteworthy that Morocco has made several efforts to control the pandemic caused by SARS-CoV-2. Several measures and strategies have been introduced that have effectively contributed to reducing the number of COVID-19 cases, hospitalizations, and deaths. The contributions of public institutions, the private sector, and civilians have made it possible to limit the damage and to have certain control over the pandemic.
The NGS of viral RNA from wastewater samples provides information on circulating variants and variant-specific mutations. The dominant variant in the clinical samples was BA.1, which was also detected in the wastewater (99.7% Reads). Thus, wastewater can be used to identify circulating variants of concern within a population. The BA.2 variant detected (0.3% Reads) became dominant in the fourth wave caused by Omicron. Sewage NGS can be considered as an early detection tool for SARS-CoV-2 variants. In addition, NGS of wastewater allowed the detection of mutations specific to these two variants. Thus, this approach is a promising tool for the surveillance of variants at the level of a given population, especially because it overcomes the sampling problem.
It is noted that this wave coincides with autumn when infections intensify, and cold weather causes diseases with symptoms similar to those of COVID-19. This season is known for the resurgence of infections and seasonal diseases and could result in more severe cases.
Influenza and acute respiratory infections are recurring epidemics that occur annually. Like all countries in the world, Morocco is also involved in influenza surveillance. The national surveillance system for influenza and acute respiratory diseases in Morocco is ensured by the sentinel system set up by the Ministry of Health. This system monitors the evolution of seasonal influenza every year and allows the estimation of the burden of morbidity and mortality as well as identifying circulating viruses and monitoring their sensitivity to antivirals. The restrictions imposed to limit the transmission of SARS-CoV-2 have positively impacted the transmission of the influenza virus.
According to the Epidemiological Report on Influenza and Severe Acute Respiratory Infections of the Ministry of Health in Morocco, sentinel surveillance of influenza has shown a return of circulation of the influenza virus type A with a predominance of the subtype A(H3N2) virus in contrast to the 2020/2021 season, which is marked by the absence of circulation of the influenza virus. This was also observed in wastewater samples from Inezgane city. The evolution of this virus in wastewater has not yet been well elucidated and requires further studies to better understand this evolution, observe the stability of the virus, or whether it is easily degradable. However, the analysis of wastewater to detect and track the evolution of influenza remains a promising approach, but several optimizations are required to make the tool more reliable and to validate the use of these data in the prediction of the number of cases infected by this virus.
This virus has also been detected on university campuses in different parts of the United States [25]. Influenza can spread quickly and easily to a large number of people and cause continuous spread over time.
For both viruses, the symptoms are similar because Omicron primarily infects the upper respiratory tract and is easily confused with seasonal influenza. However, people infected with COVID-19 may take longer to develop symptoms because of the long incubation period of the virus compared with the flu. Symptoms of COVID-19 often presented later in patients than those of influenza, with a difference of 2–14 days versus 1–4 days post-infection, respectively. Additionally, these individuals may be contagious for a longer period of time. People who get the flu recover within a few days or less than two weeks, but few develop complications (such as pneumonia), some of which can be life-threatening and result in death.
5. Conclusions
In conclusion, this study demonstrates the feasibility of using wastewater-based epidemiology to track COVID-19 and influenza A, offering a promising tool for public health monitoring in Morocco. By applying mathematical models, this approach can predict the number of infected individuals. WBE enables real-time monitoring of viral evolution and the emergence of new mutations without relying solely on clinical testing, which can be limited and delayed. This method is crucial for guiding vaccine formulation to ensure they effectively protect against the most prevalent strains, especially for rapidly mutating viruses like SARS-CoV-2.
However, it is essential to develop and implement more sensitive and specific sequencing technologies. Standardizing sampling and analysis protocols, as well as integrating wastewater data with clinical and epidemiological data, can further enhance the accuracy and utility of this surveillance method. Investing in theseimprovementswillensurethatwastewater-basedepidemiologyremains a valuable tool in the ongoing effort to control and prevent viral diseases.
Author Contributions
Maryem Wardi: Conceptualization, Methodology, Formal analysis, Writing - original draft, Writing – review & editing. Ahmed Belmouden: Conceptualization, Methodology, Validation, Formal analysis, Writing - original draft, Writing – review & editing. Mohamed Aghrouch: Conceptualization, Methodology, Resources. Abdellah Lotfy: Resources. Youssef Idaghdour: Conceptualization, Methodology, Formal analysis, review & editing. Zohra Lemkhente: Supervision, Conceptualization, Resources, Writing - original draft, Writing – review & editing.
Funding
This work has received funding from the National Center for Scientific and Technical Research (CNRST): GRANT_NUMBER: Cov/2020/33, “Host-Pathogen Interaction in COVID-19 /SARS-CoV-2: Clinical and Genetic Study”. M. WARDI is supported by the Excellence CNRST scholarship (CNRST, 24 UIZ 2020).
Institutional Review Board Statement
The study was conducted in accordance with the Declaration of Helsinki, and approved by the Ethics Committee of Polydisciplinary Faculty of Taroudannt, Ibnou Zohr University (protocol code IRB00012973 Moroccan Association for Research and Ethics IRB #1, approval date: 24/02/2021).
Acknowledgments
The authors thank the National Center for Scientific and Technical Research (CNRST) in Rabat for funding. The authors thank RAMSA for support and sampling. They thank Mafhoud Laboratory, Dr Fatima Zahra Aznag, and Professor Mustapha Faghire for scientific and logistic support. Thanks to the Regional Health Delegation in Souss Massa for displaying epidemiological data..
Conflicts of Interest
The authors declare that they have no financial or commercial ties that could be construed as a potential conflict of interest..
References
- Shrestha, S.; Yoshinaga, E.; Chapagain, S.K.; Mohan, G.; Gasparatos, A.; Fukushi, K. Wastewater-Based Epidemiology for Cost-Effective Mass Surveillance of COVID-19 in Low- and Middle-Income Countries: Challenges and Opportunities. Water 2021, 13, 2897. [Google Scholar] [CrossRef]
- Safford, H.R.; Shapiro, K.; Bischel, H.N. Wastewater Analysis Can Be a Powerful Public Health Tool—If It’s Done Sensibly. Proc Natl Acad Sci U S A 2022, 119, e2119600119. [Google Scholar] [CrossRef] [PubMed]
- O’Keeffe, J. Wastewater-Based Epidemiology: Current Uses and Future Opportunities as a Public Health Surveillance Tool. Environmental Health Review 2021, 64. [Google Scholar] [CrossRef]
- Xiao, A.; Wu, F.; Bushman, M.; Zhang, J.; Imakaev, M.; Chai, P.R.; Duvallet, C.; Endo, N.; Erickson, T.B.; Armas, F.; et al. Metrics to Relate COVID-19 Wastewater Data to Clinical Testing Dynamics. Water Res 2022, 212, 118070. [Google Scholar] [CrossRef] [PubMed]
- Pillay, L.; Amoah, I.D.; Deepnarain, N.; Pillay, K.; Awolusi, O.O.; Kumari, S.; Bux, F. Monitoring Changes in COVID-19 Infection Using Wastewater-Based Epidemiology: A South African Perspective. Science of the Total Environment 2021, 786. [Google Scholar] [CrossRef] [PubMed]
- Saththasivam, J.; El-Malah, S.S.; Gomez, T.A.; Jabbar, K.A.; Remanan, R.; Krishnankutty, A.K.; Ogunbiyi, O.; Rasool, K.; Ashhab, S.; Rashkeev, S.; et al. COVID-19 (SARS-CoV-2) Outbreak Monitoring Using Wastewater-Based Epidemiology in Qatar. Science of the Total Environment 2021, 774. [Google Scholar] [CrossRef] [PubMed]
- Ahmed, W.; Angel, N.; Edson, J.; Bibby, K.; Bivins, A.; O’Brien, J.W.; Choi, P.M.; Kitajima, M.; Simpson, S.L.; Li, J.; et al. First Confirmed Detection of SARS-CoV-2 in Untreated Wastewater in Australia: A Proof of Concept for the Wastewater Surveillance of COVID-19 in the Community. Science of the Total Environment 2020, 728. [Google Scholar] [CrossRef] [PubMed]
- McMahan, C.S.; Self, S.; Rennert, L.; Kalbaugh, C.; Kriebel, D.; Graves, D.; Colby, C.; Deaver, J.A.; Popat, S.C.; Karanfil, T.; et al. COVID-19 Wastewater Epidemiology: A Model to Estimate Infected Populations. Lancet Planet Health 2021, 5. [Google Scholar] [CrossRef]
- Layton, B.A.; Kaya, D.; Kelly, C.; Williamson, K.J.; Alegre, D.; Bachhuber, S.M.; Banwarth, P.G.; Bethel, J.W.; Carter, K.; Dalziel, B.D.; et al. Evaluation of a Wastewater-Based Epidemiological Approach to Estimate the Prevalence of SARS-CoV-2 Infections and the Detection of Viral Variants in Disparate Oregon Communities at City and Neighborhood Scales. Environ Health Perspect 2022, 130. [Google Scholar] [CrossRef]
- Ai, Y.; Davis, A.; Jones, D.; Lemeshow, S.; Tu, H.; He, F.; Ru, P.; Pan, X.; Bohrerova, Z.; Lee, J. Wastewater SARS-CoV-2 Monitoring as a Community-Level COVID-19 Trend Tracker and Variants in Ohio, United States. Science of the Total Environment 2021, 801. [Google Scholar] [CrossRef]
- Carcereny, A.; Martínez-Velázquez, A.; Bosch, A.; Allende, A.; Truchado, P.; Cascales, J.; Romalde, J.L.; Lois, M.; Polo, D.; Sánchez, G.; et al. Monitoring Emergence of the SARS-CoV-2 B.1.1.7 Variant through the Spanish National SARS-CoV-2 Wastewater Surveillance System (VATar COVID-19). Environ Sci Technol 2021, 55. [Google Scholar] [CrossRef] [PubMed]
- Barril, P.A.; Pianciola, L.A.; Mazzeo, M.; Ousset, M.J.; Jaureguiberry, M.V.; Alessandrello, M.; Sánchez, G.; Oteiza, J.M. Evaluation of Viral Concentration Methods for SARS-CoV-2 Recovery from Wastewaters. Science of the Total Environment 2021, 756. [Google Scholar] [CrossRef] [PubMed]
- Kitajima, M.; Sassi, H.P.; Torrey, J.R. Pepper Mild Mottle Virus as a Water Quality Indicator. NPJ Clean Water 2018, 1. [Google Scholar] [CrossRef]
- Zhang, T.; Breitbart, M.; Lee, W.H.; Run, J.Q.; Wei, C.L.; Soh, S.W.L.; Hibberd, M.L.; Liu, E.T.; Rohwer, F.; Ruan, Y. RNA Viral Community in Human Feces: Prevalence of Plant Pathogenic Viruses. PLoS Biol 2006, 4. [Google Scholar] [CrossRef] [PubMed]
- Melvin, R.G.; Hendrickson, E.N.; Chaudhry, N.; Georgewill, O.; Freese, R.; Schacker, T.W.; Simmons, G.E. A Novel Wastewater-Based Epidemiology Indexing Method Predicts SARS-CoV-2 Disease Prevalence across Treatment Facilities in Metropolitan and Regional Populations. Sci Rep 2021, 11. [Google Scholar] [CrossRef]
- Milne, I.; Stephen, G.; Bayer, M.; Cock, P.J.A.; Pritchard, L.; Cardle, L.; Shawand, P.D.; Marshall, D. Using Tablet for Visual Exploration of Second-Generation Sequencing Data. Brief Bioinform 2013, 14. [Google Scholar] [CrossRef]
- Liu, Y.; Rocklöv, J. The Effective Reproductive Number of the Omicron Variant of SARS-CoV-2 Is Several Times Relative to Delta. J Travel Med 2022, 29. [Google Scholar] [CrossRef]
- Sapula, S.A.; Whittall, J.J.; Pandopulos, A.J.; Gerber, C.; Venter, H. An Optimized and Robust PEG Precipitation Method for Detection of SARS-CoV-2 in Wastewater. Science of the Total Environment 2021, 785. [Google Scholar] [CrossRef]
- Dong, Y.; Wu, X.; Li, S.; Lu, R.; Li, Y.; Wan, Z.; Qin, J.; Yu, G.; Jin, X.; Zhang, C. Comparative Evaluation of 19 Reverse Transcription Loop-Mediated Isothermal Amplification Assays for Detection of SARS-CoV-2. Sci Rep 2021, 11. [Google Scholar] [CrossRef]
- Lu, X.; Wang, L.; Sakthivel, S.K.; Whitaker, B.; Murray, J.; Kamili, S.; Lynch, B.; Malapati, L.; Burke, S.A.; Harcourt, J.; et al. US CDC Real-Time Reverse Transcription PCR Panel for Detection of Severe Acute Respiratory Syndrome Coronavirus 2. Emerg Infect Dis 2020, 26. [Google Scholar] [CrossRef]
- D’Aoust, P.M.; Graber, T.E.; Mercier, E.; Montpetit, D.; Alexandrov, I.; Neault, N.; Baig, A.T.; Mayne, J.; Zhang, X.; Alain, T.; et al. Catching a Resurgence: Increase in SARS-CoV-2 Viral RNA Identified in Wastewater 48 h before COVID-19 Clinical Tests and 96 h before Hospitalizations. Science of The Total Environment 2021, 770, 145319. [Google Scholar] [CrossRef]
- Wu, F.; Xiao, A.; Zhang, J.; Moniz, K.; Endo, N.; Armas, F.; Bonneau, R.; Brown, M.A.; Bushman, M.; Chai, P.R.; et al. SARS-CoV-2 RNA Concentrations in Wastewater Foreshadow Dynamics and Clinical Presentation of New COVID-19 Cases. Science of the Total Environment 2022, 805. [Google Scholar] [CrossRef] [PubMed]
- Hasan, S.W.; Ibrahim, Y.; Daou, M.; Kannout, H.; Jan, N.; Lopes, A.; Alsafar, H.; Yousef, A.F. Detection and Quantification of SARS-CoV-2 RNA in Wastewater and Treated Effluents: Surveillance of COVID-19 Epidemic in the United Arab Emirates. Science of the Total Environment 2021, 764. [Google Scholar] [CrossRef] [PubMed]
- Zhang, M.; Xiao, J.; Deng, A.; Zhang, Y.; Zhuang, Y.; Hu, T.; Li, J.; Tu, H.; Li, B.; Zhou, Y.; et al. Transmission Dynamics of an Outbreak of the COVID-19 Delta Variant B.1.617.2 — Guangdong Province, China, May–June 2021. China CDC Wkly 2021, 3. [Google Scholar] [CrossRef]
- Wolfe, M.K.; Duong, D.; Bakker, K.M.; Ammerman, M.; Mortenson, L.; Hughes, B.; Arts, P.; Lauring, A.S.; Fitzsimmons, W.J.; Bendall, E.; et al. Wastewater-Based Detection of Two Influenza Outbreaks. Environ Sci Technol Lett 2022, 9. [Google Scholar] [CrossRef]
Figure 1.
Location of sewersheds of Agadir and Inezgane cities under surveillance.

Figure 2.
Comparison of the means of Ct of MS2(A), N and ORF1ab(B), and PMMOV(C) genes between Agadir, Inezgane Cities.
Figure 2.
Comparison of the means of Ct of MS2(A), N and ORF1ab(B), and PMMOV(C) genes between Agadir, Inezgane Cities.
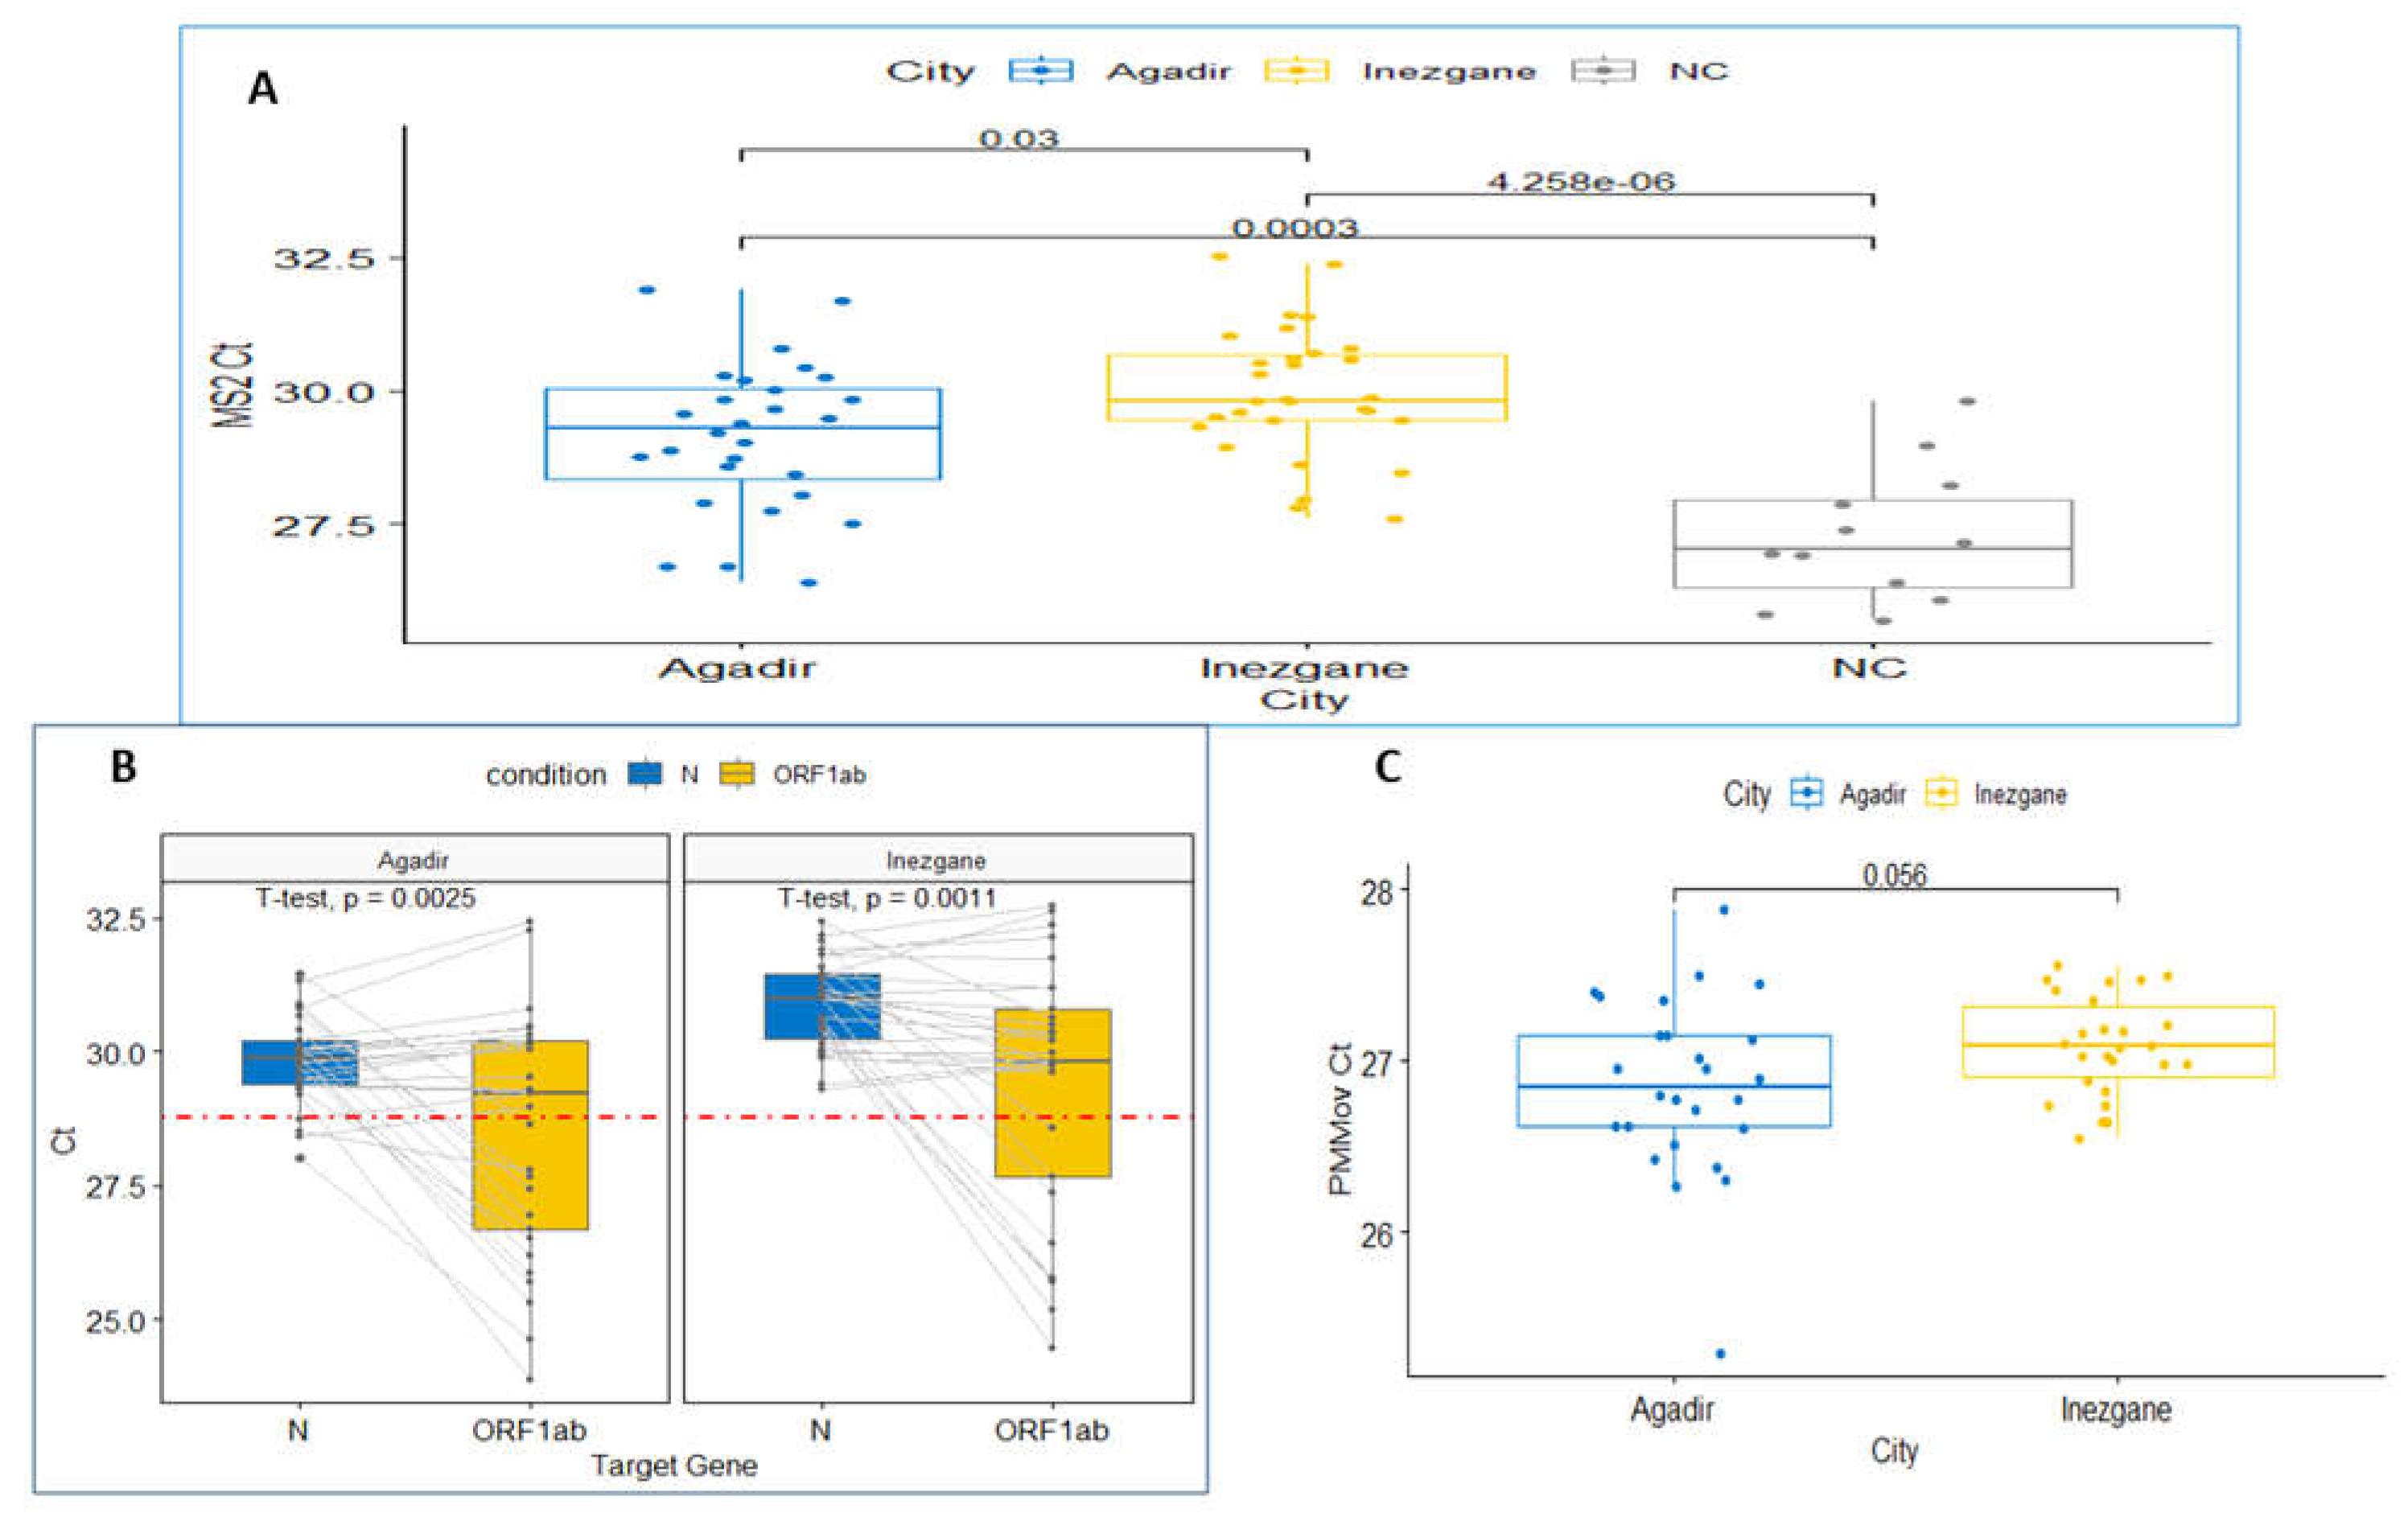
Figure 3.
Daily variation of SARS-CoV-2 RNA abundance in wastewater samples of Agadir and Inezgane cities based on N gene quantification.
Figure 3.
Daily variation of SARS-CoV-2 RNA abundance in wastewater samples of Agadir and Inezgane cities based on N gene quantification.
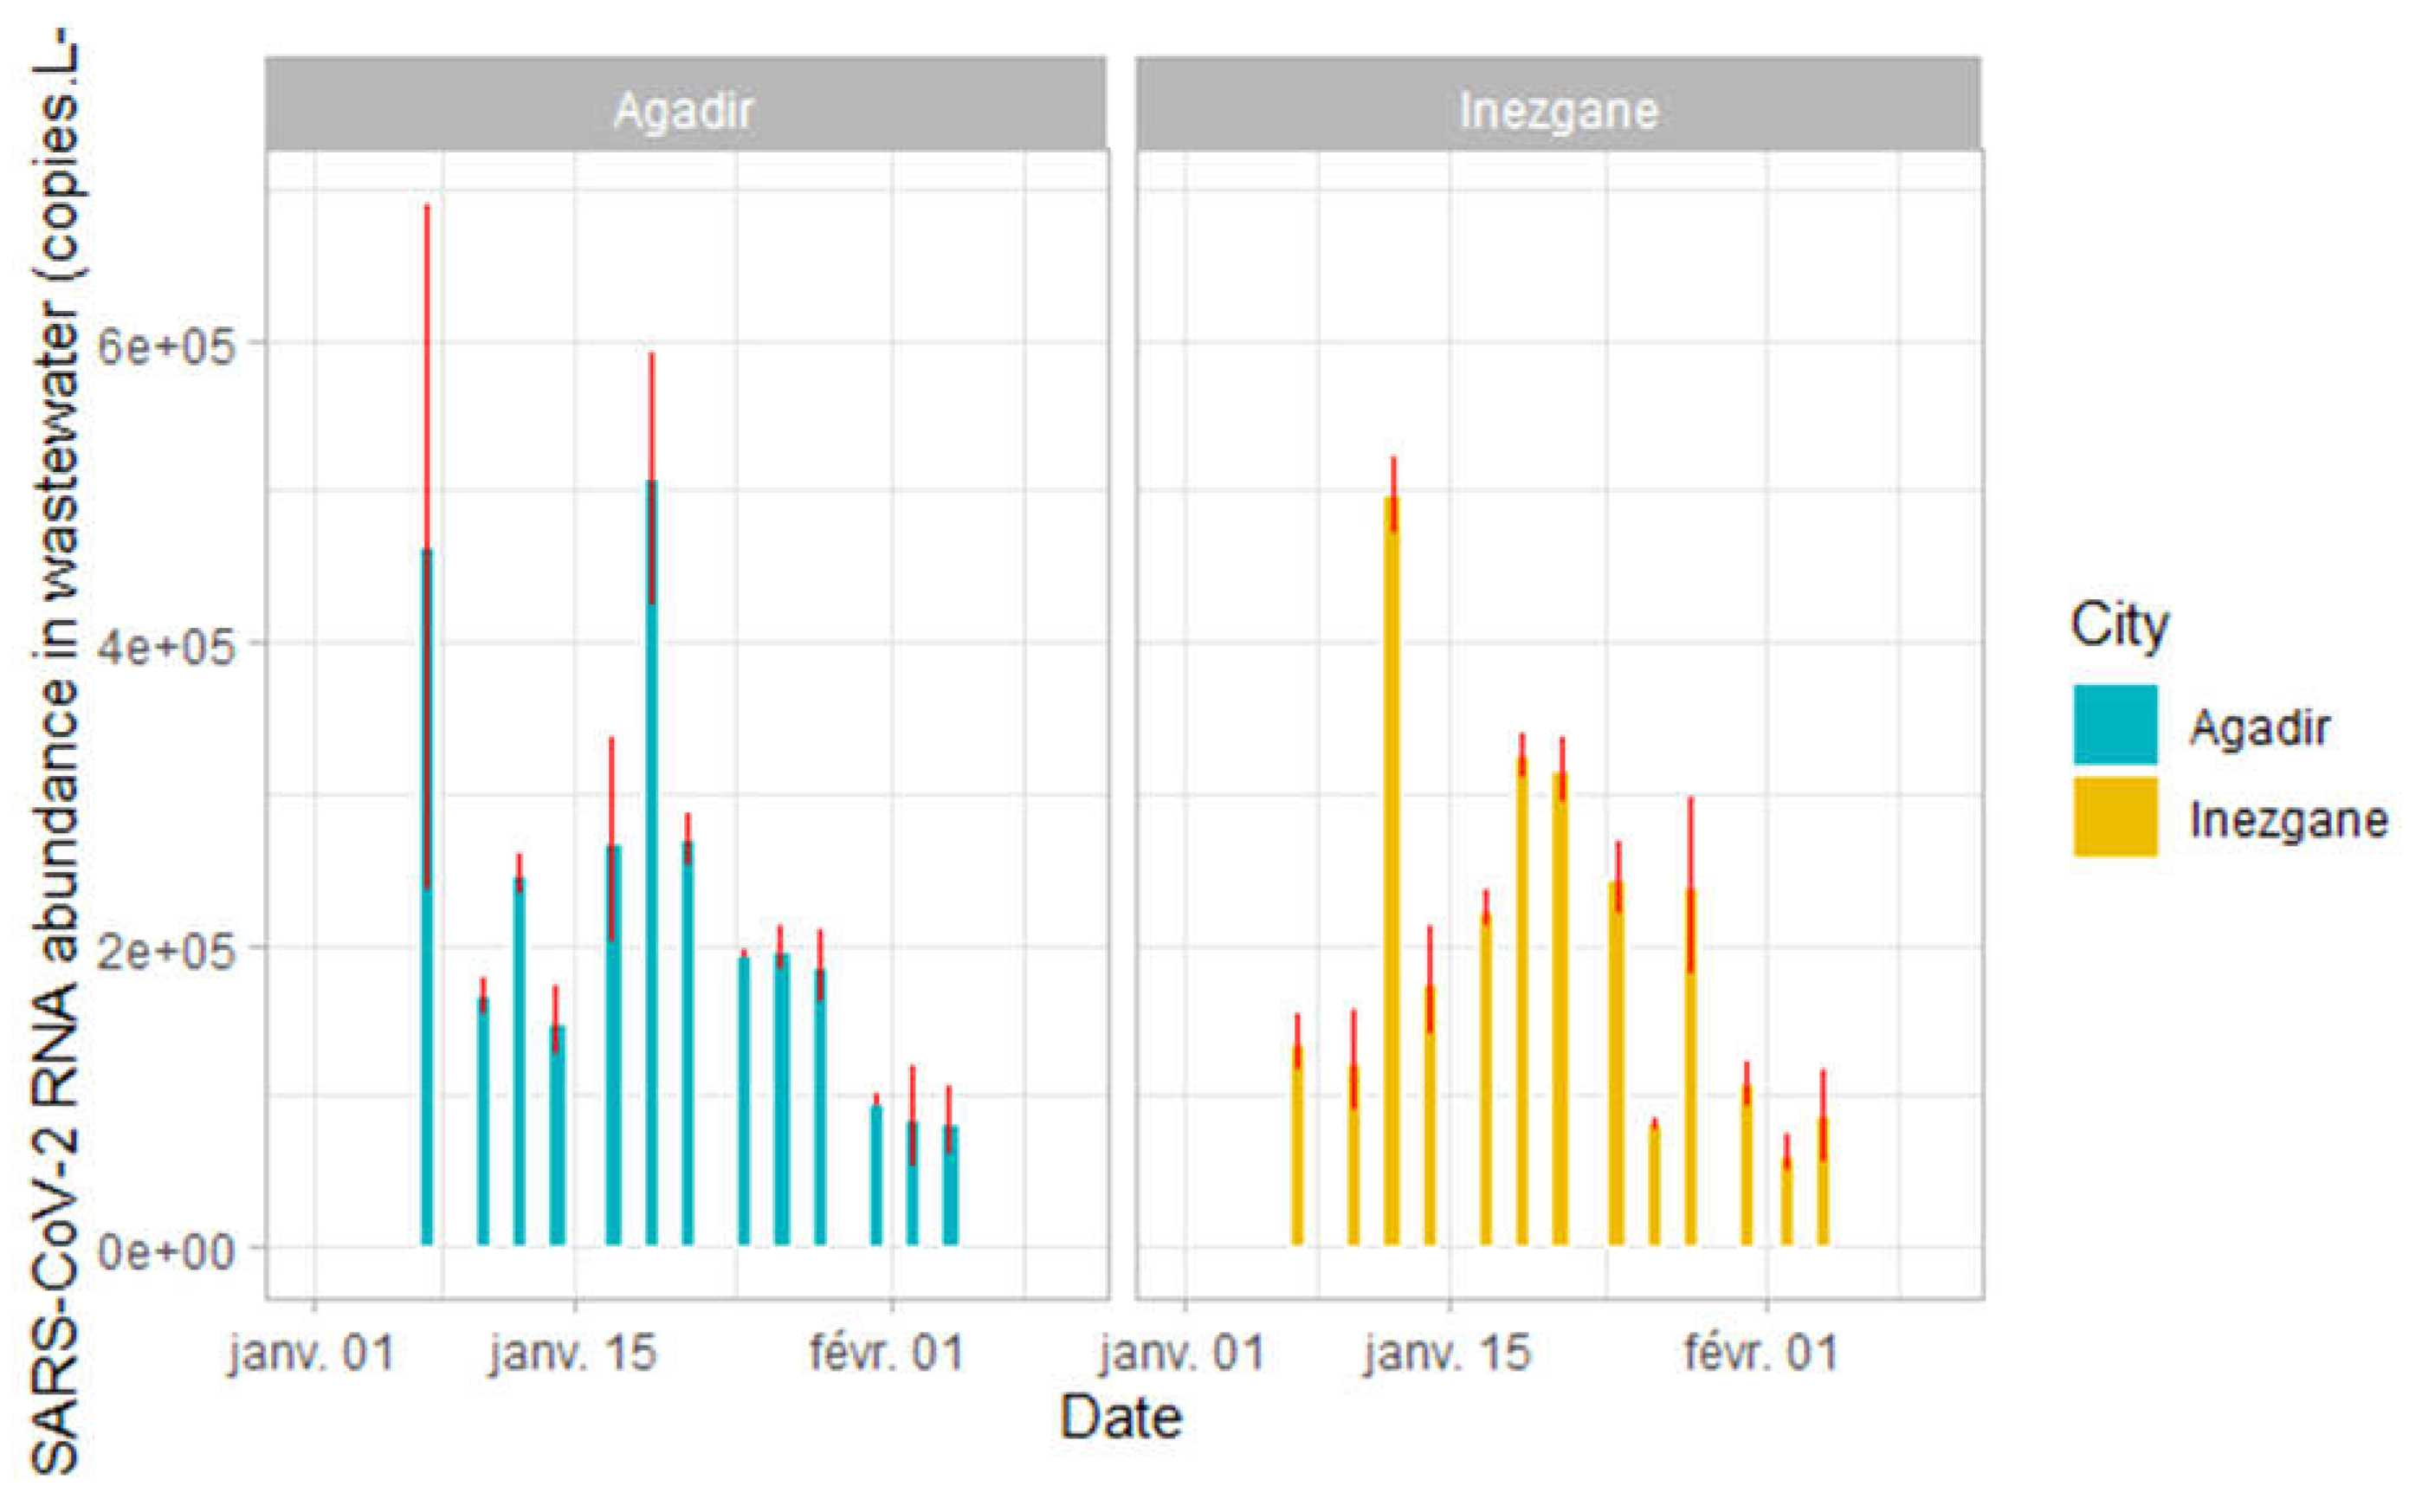
Figure 5.
SEIR model predictions of active COVID-19 cases based on RNA mass rates in wastewater; A: R0 9.5, B: R0 2.5.
Figure 5.
SEIR model predictions of active COVID-19 cases based on RNA mass rates in wastewater; A: R0 9.5, B: R0 2.5.
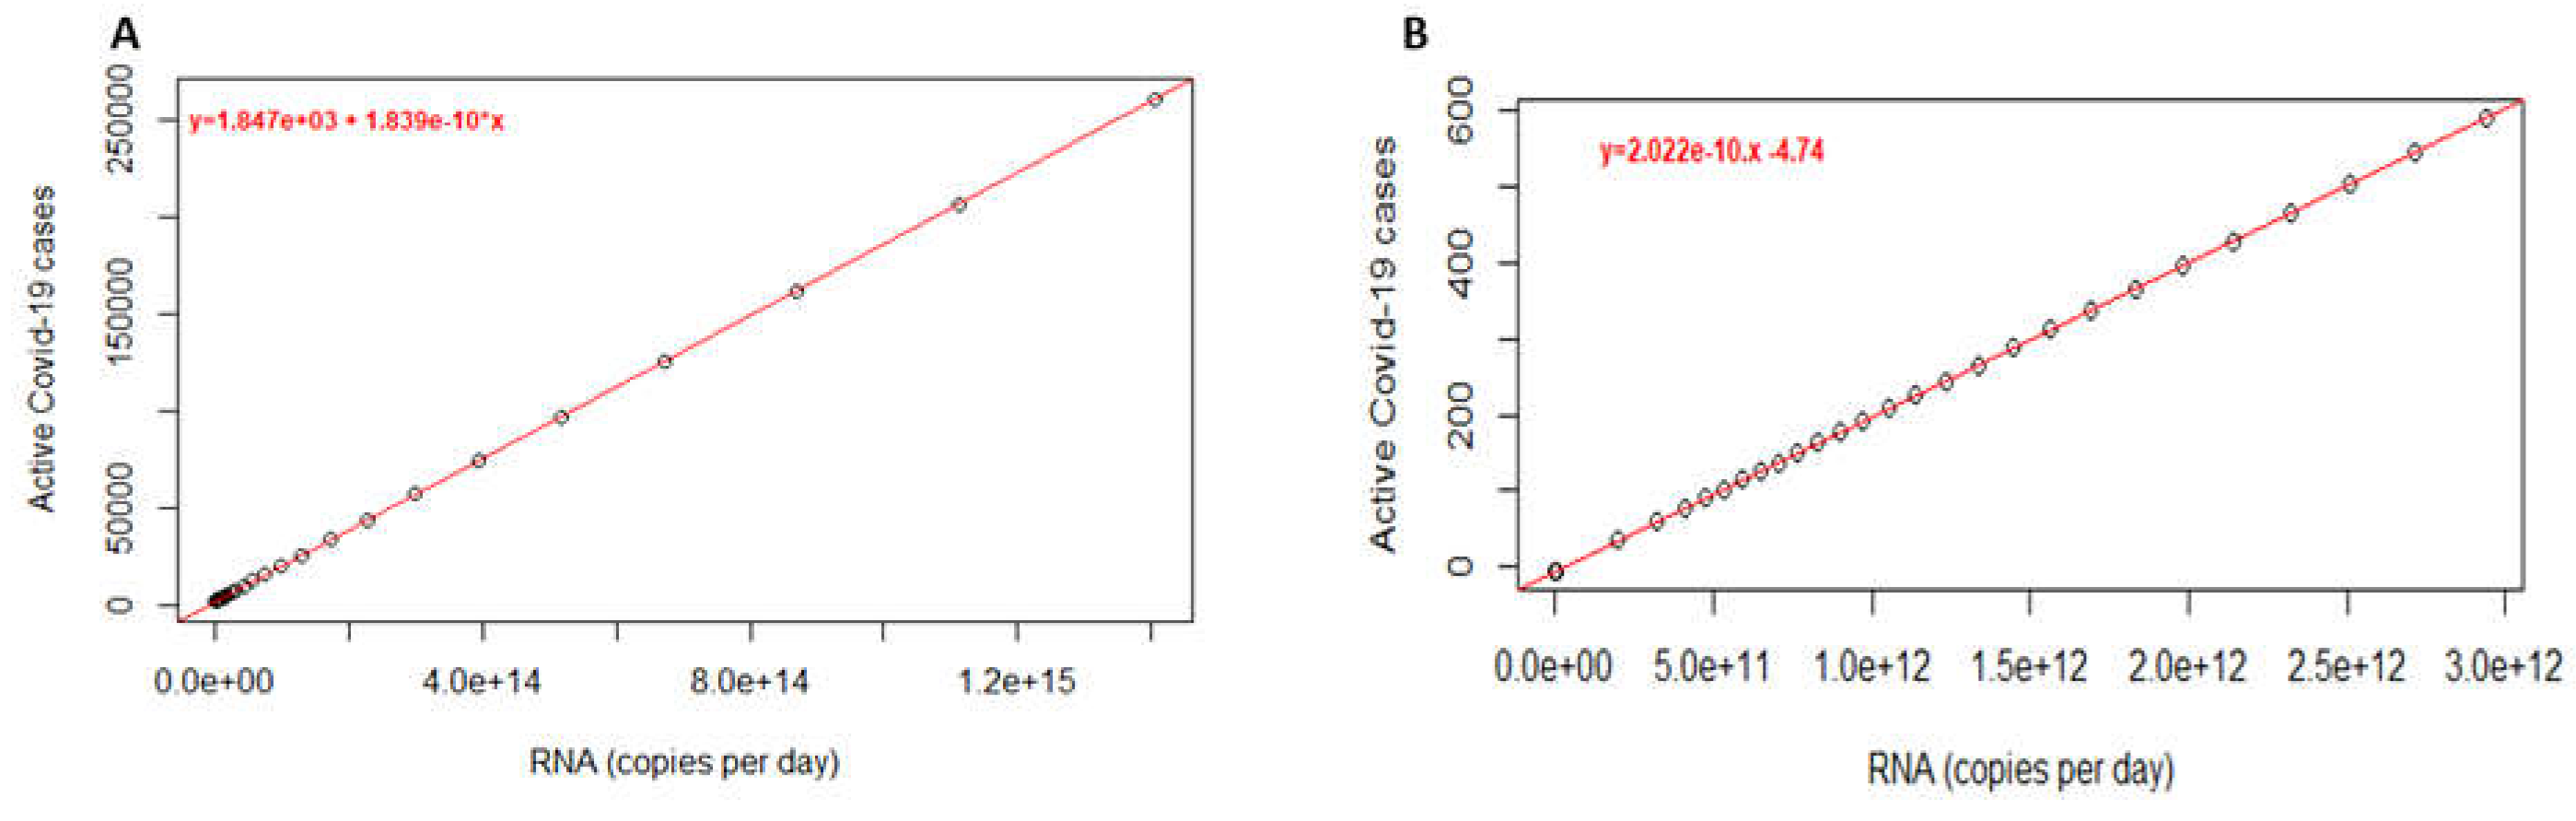
Figure 6.
SEIR model prediction of active COVID-19 cases based on RNA mass rates in wastewater; A: R0 9.5, B: R0 2.5. C: Reported active COVID-19 cases. D: Spearman Correlation between Estimated cases and Reported cases.
Figure 6.
SEIR model prediction of active COVID-19 cases based on RNA mass rates in wastewater; A: R0 9.5, B: R0 2.5. C: Reported active COVID-19 cases. D: Spearman Correlation between Estimated cases and Reported cases.
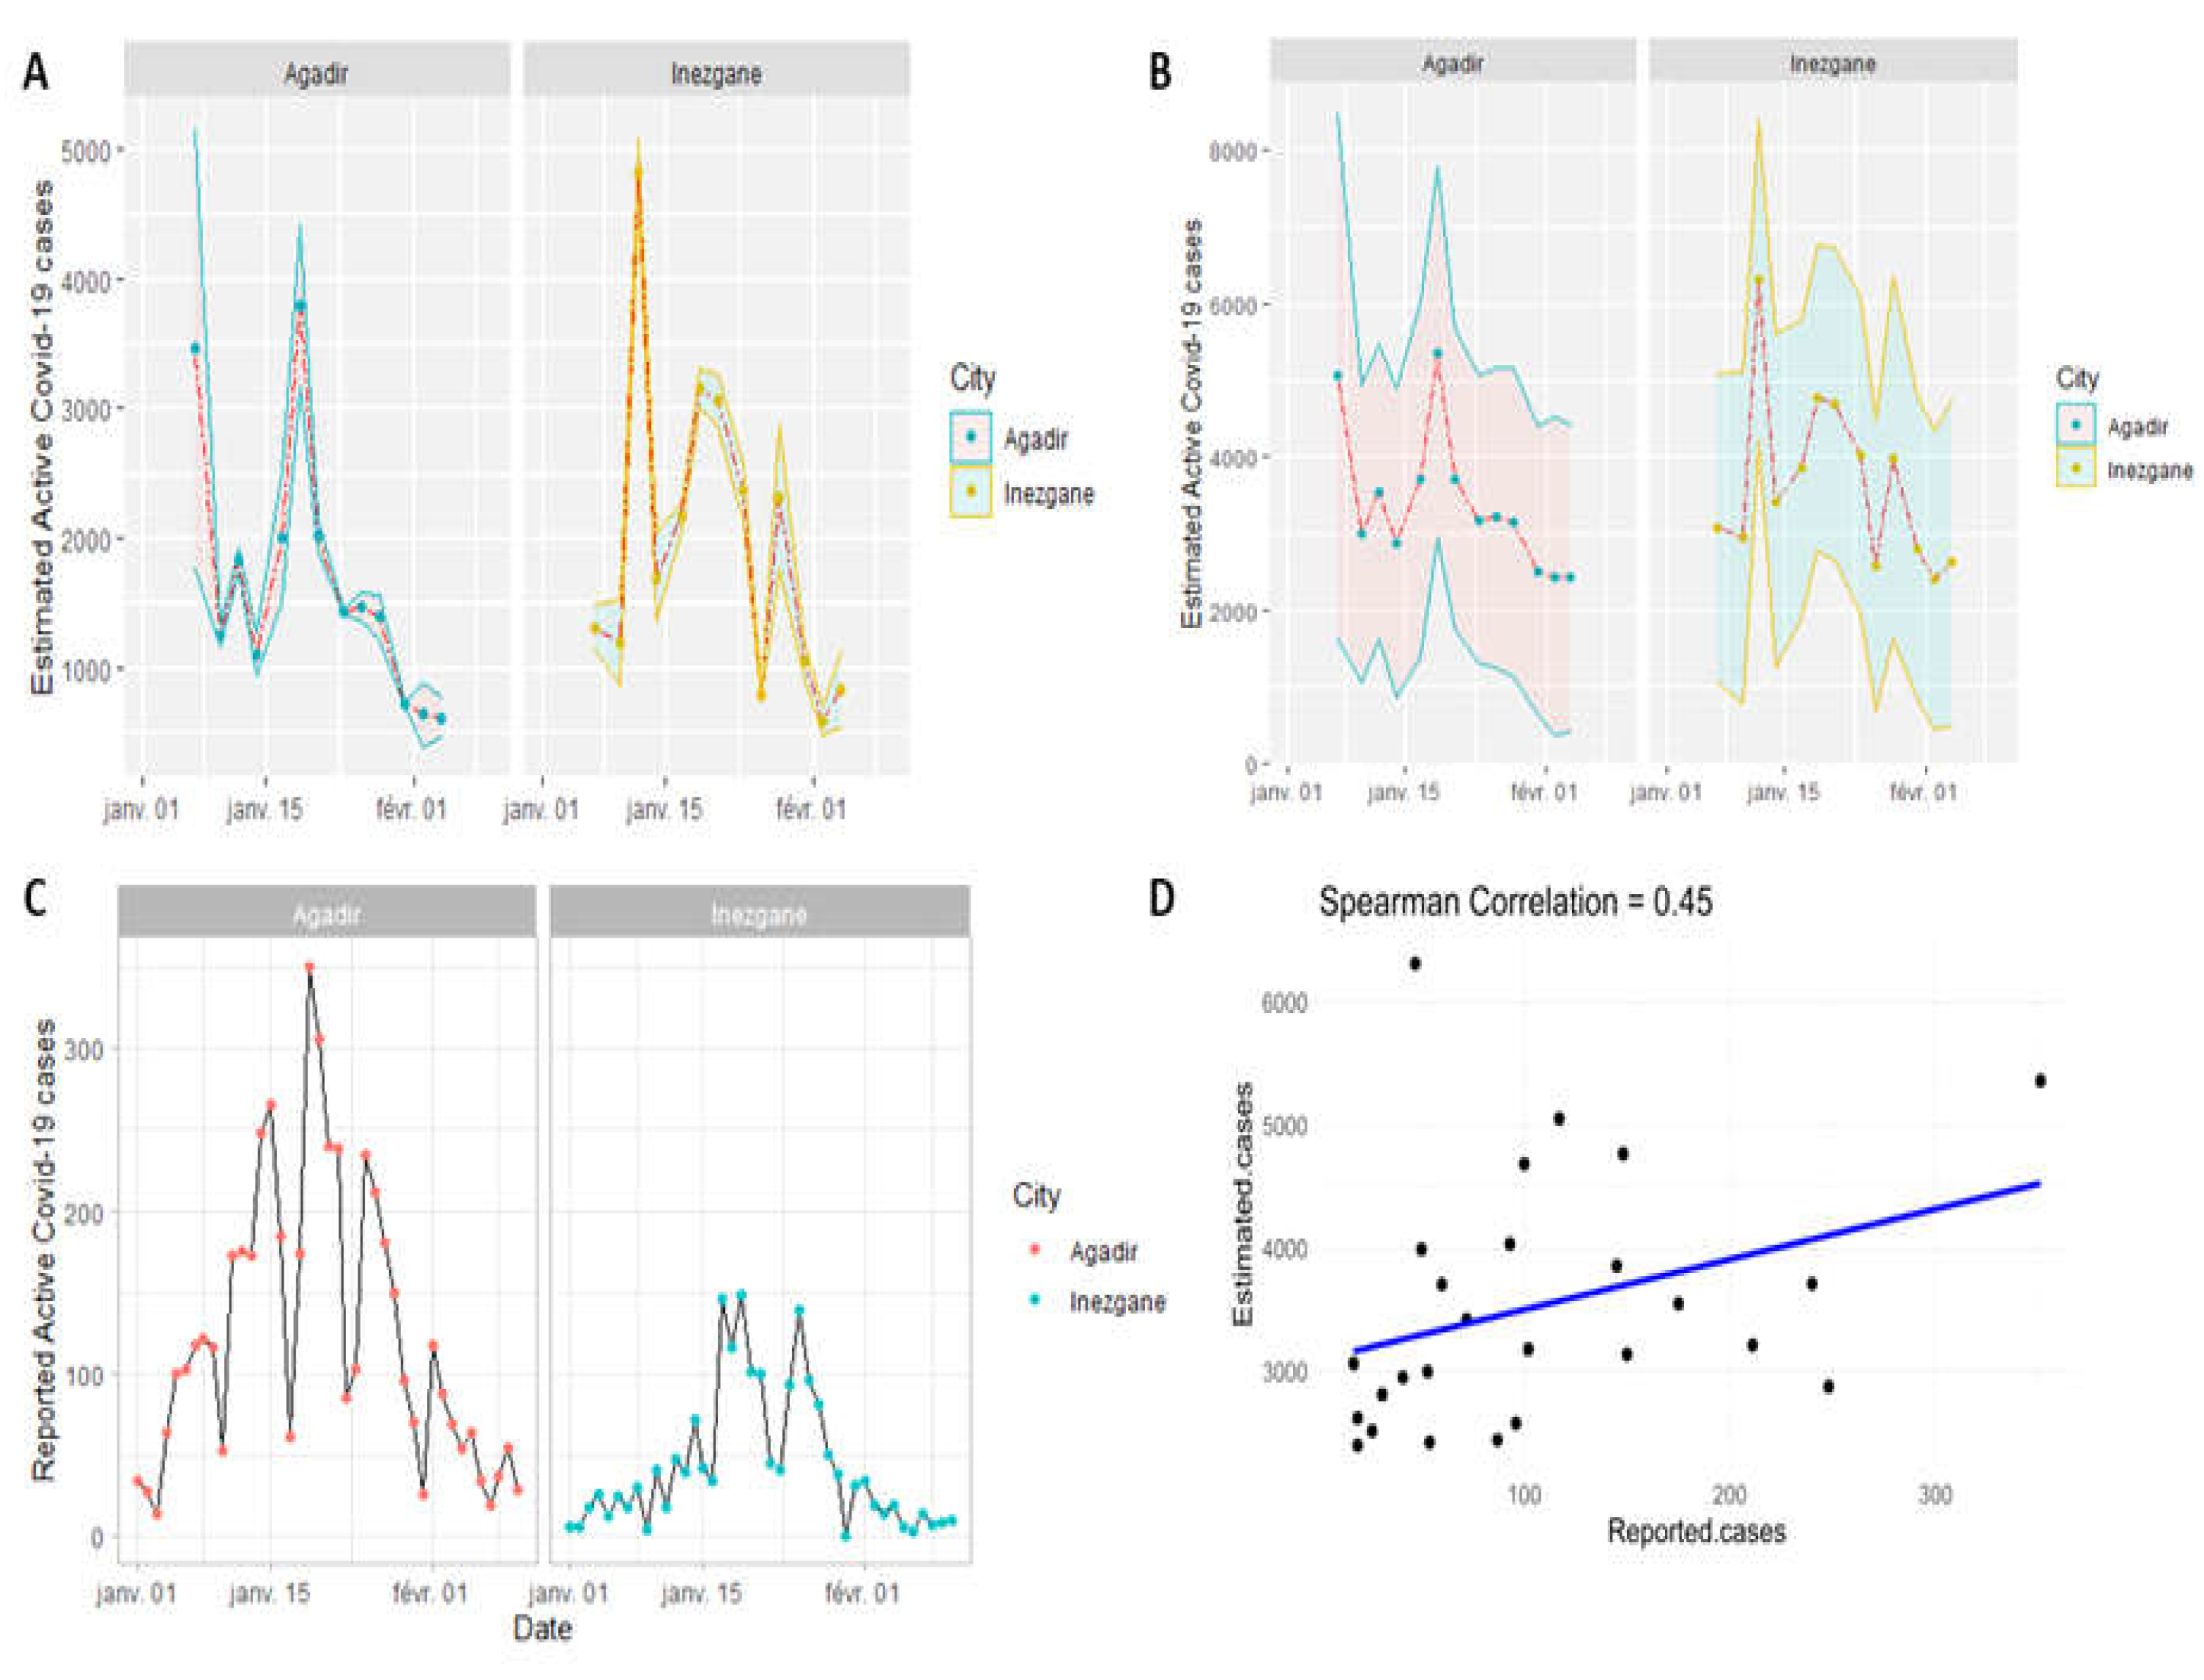
Figure 7.
NGS coverage across SARS-CoV-2 genome, B. Diagram showing omicron specific mutations detected by NGS technique.
Figure 7.
NGS coverage across SARS-CoV-2 genome, B. Diagram showing omicron specific mutations detected by NGS technique.
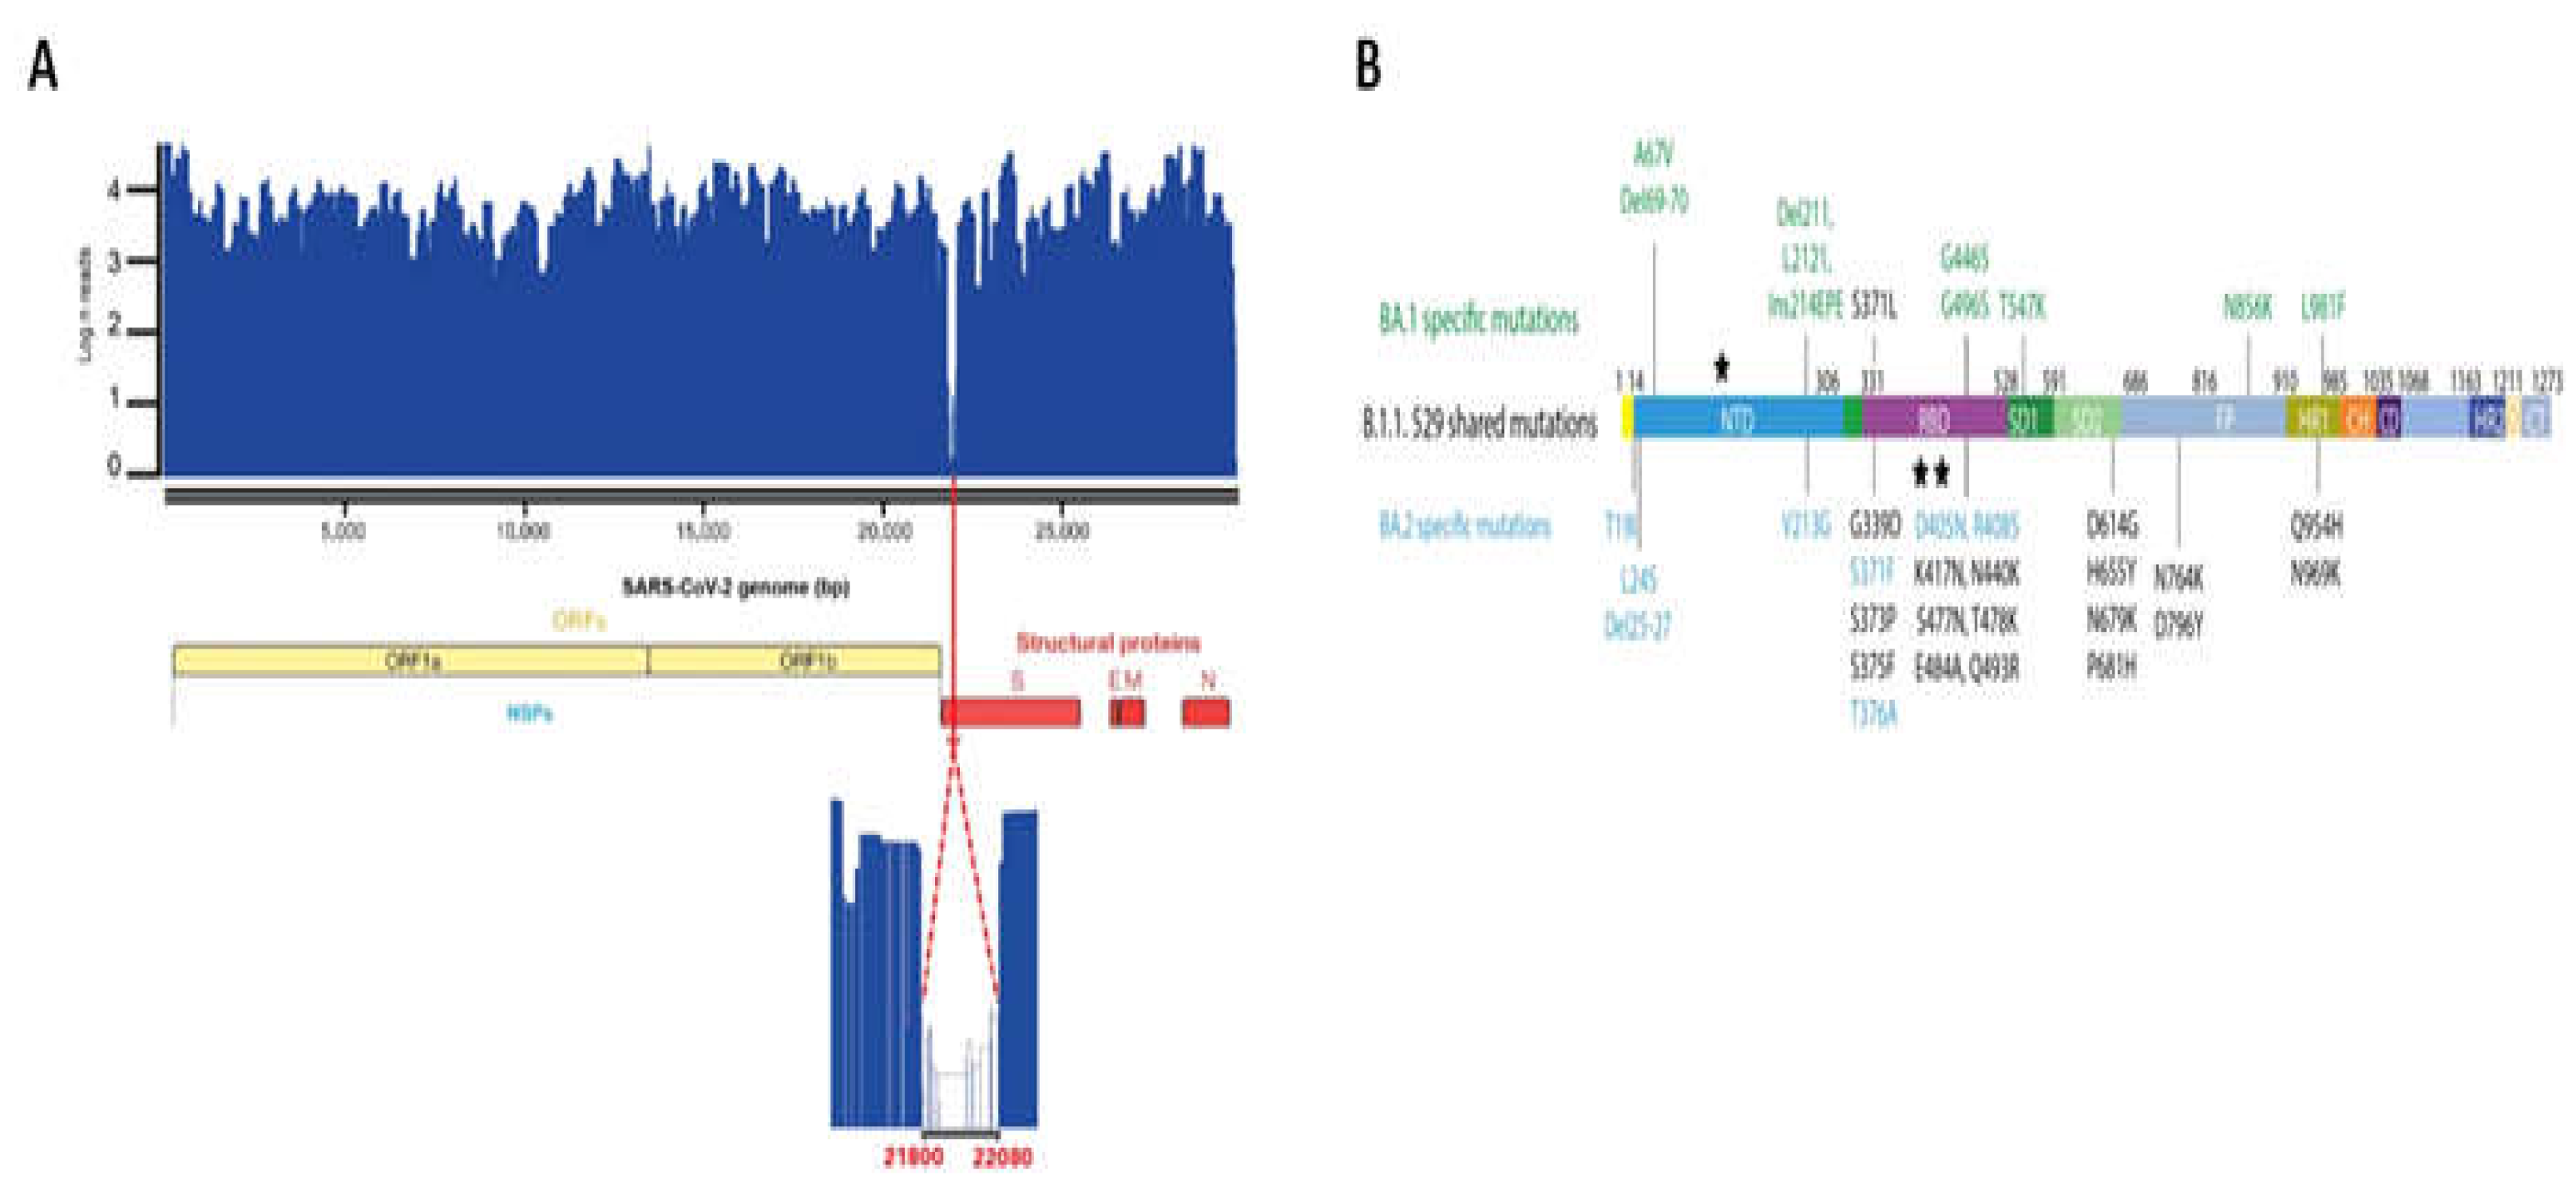
Figure 8.
Influenza A RNA Abundance in wastewater (copies/L) for Agadir and Inezgane Cities.
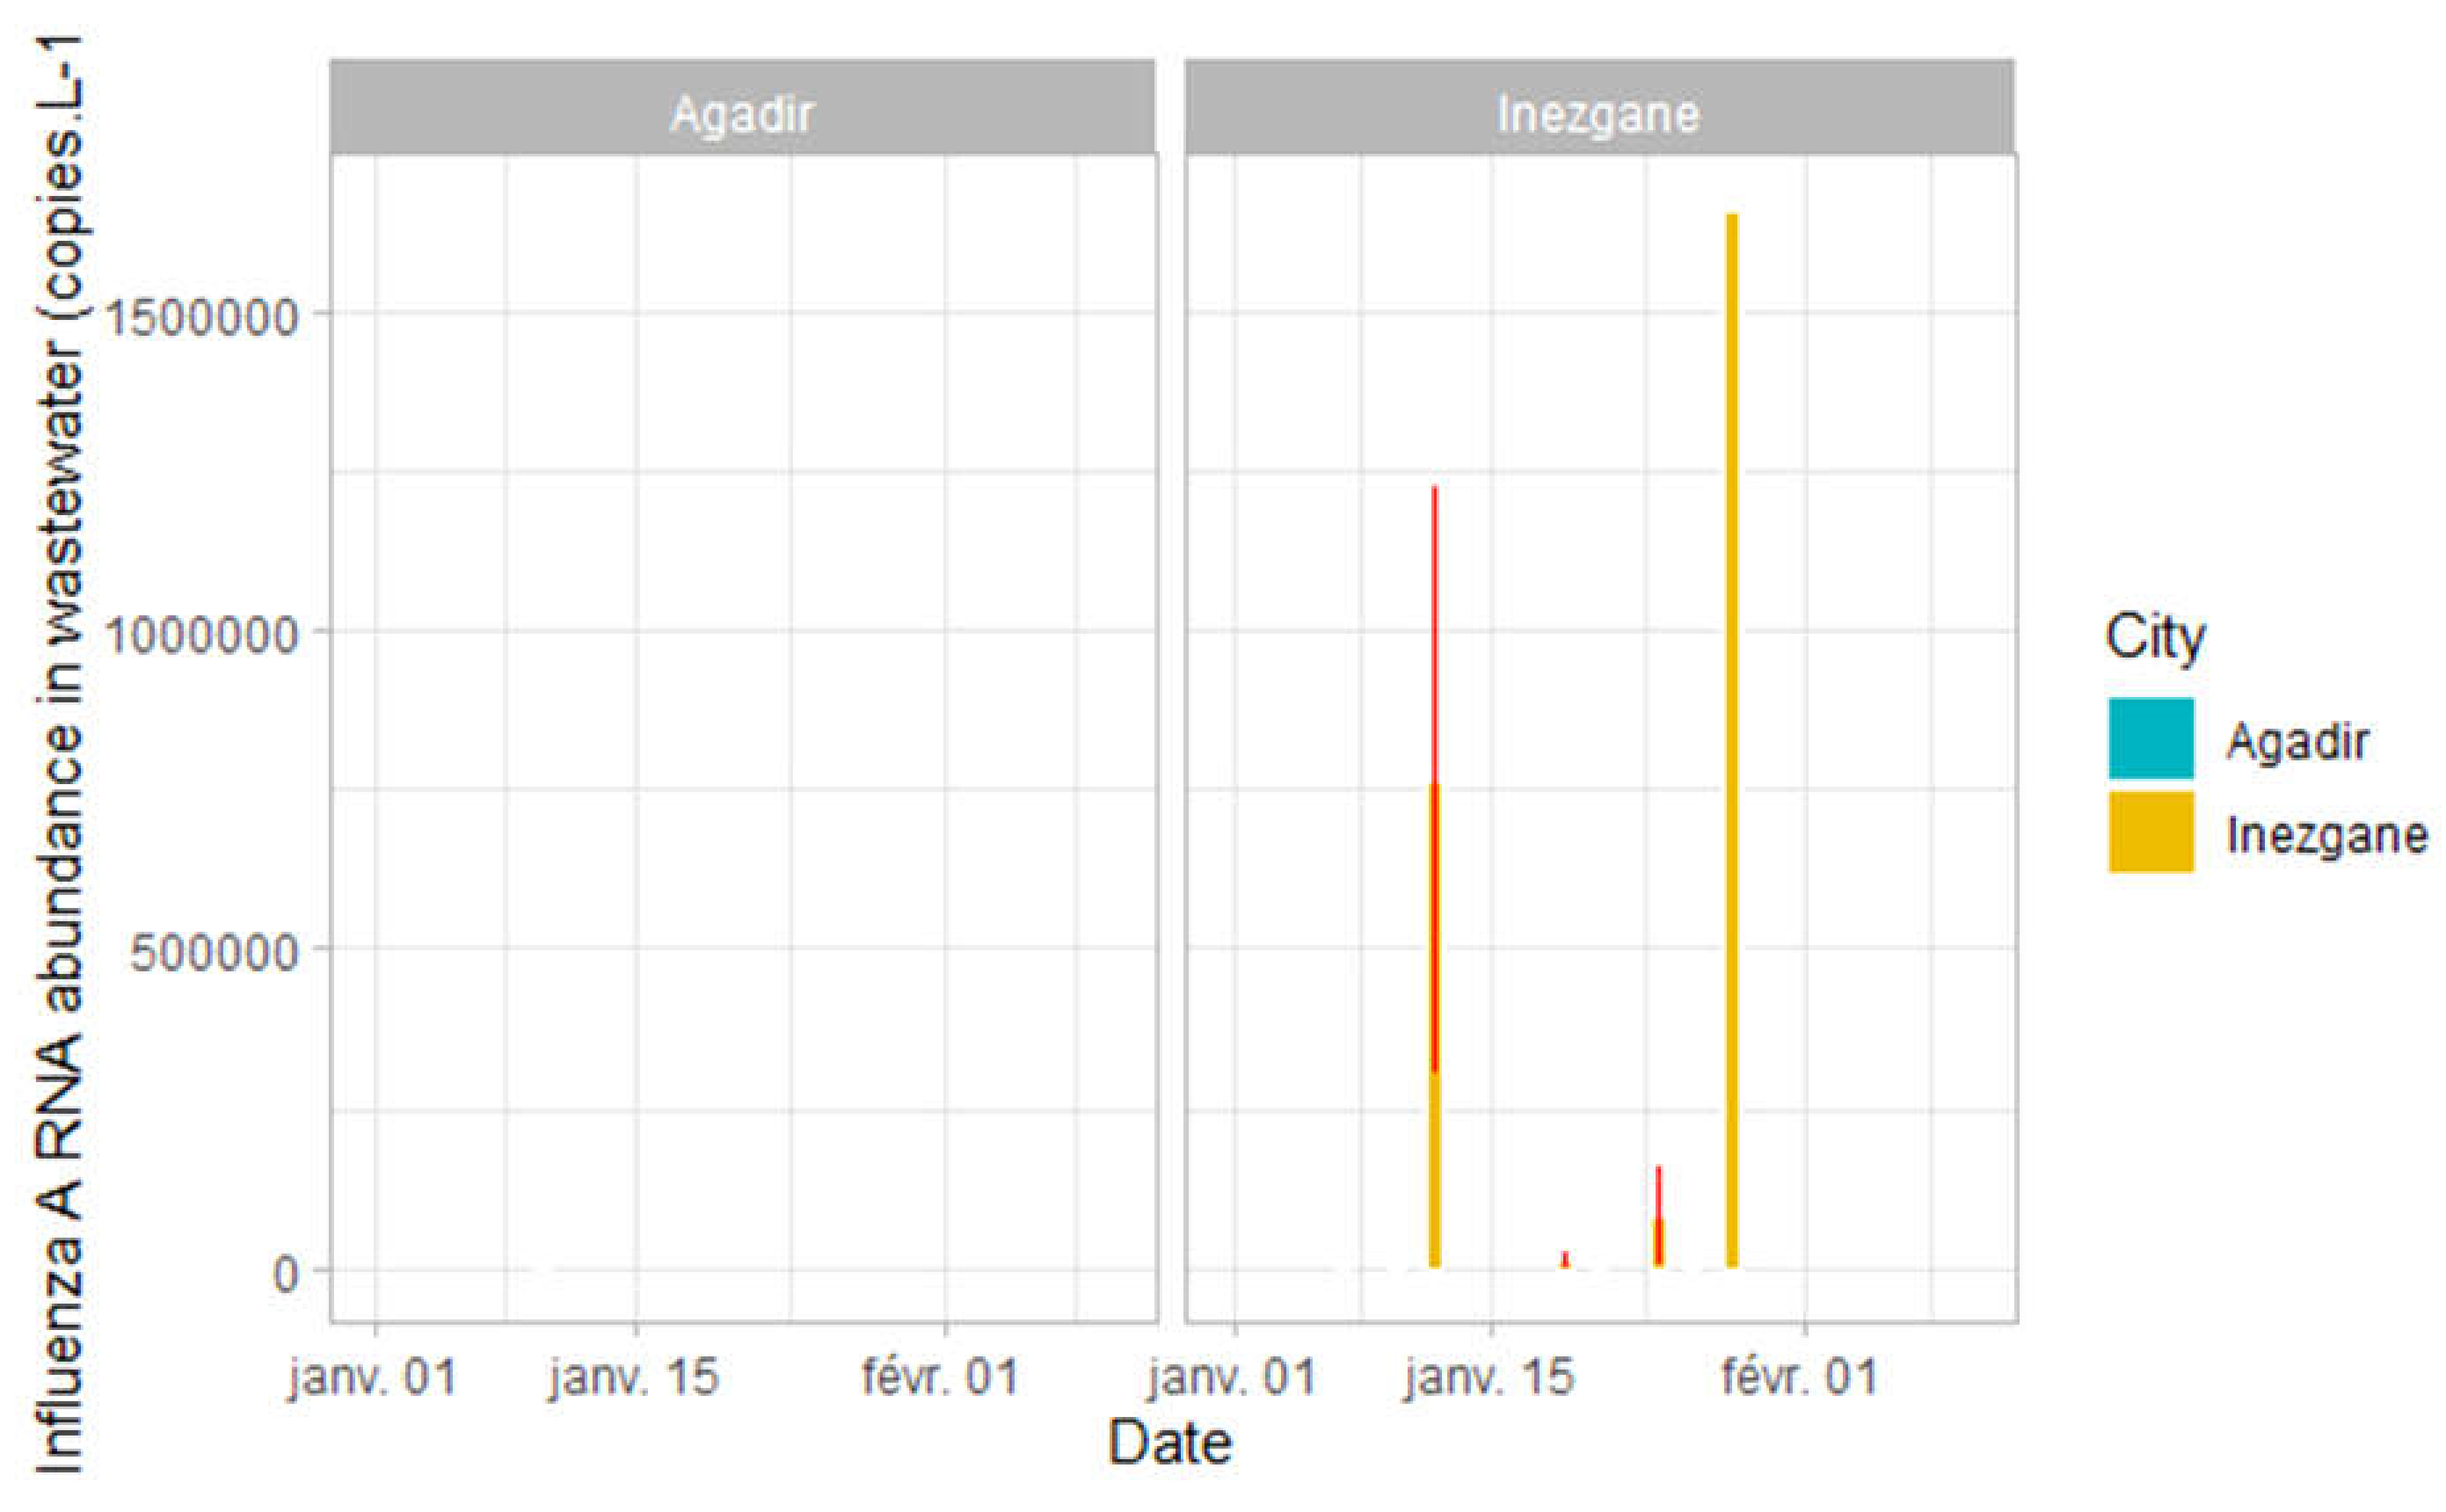
Figure 9.
Supplementary Fig. SF3. Evolution of COVID-19 pandemic in Morocco.
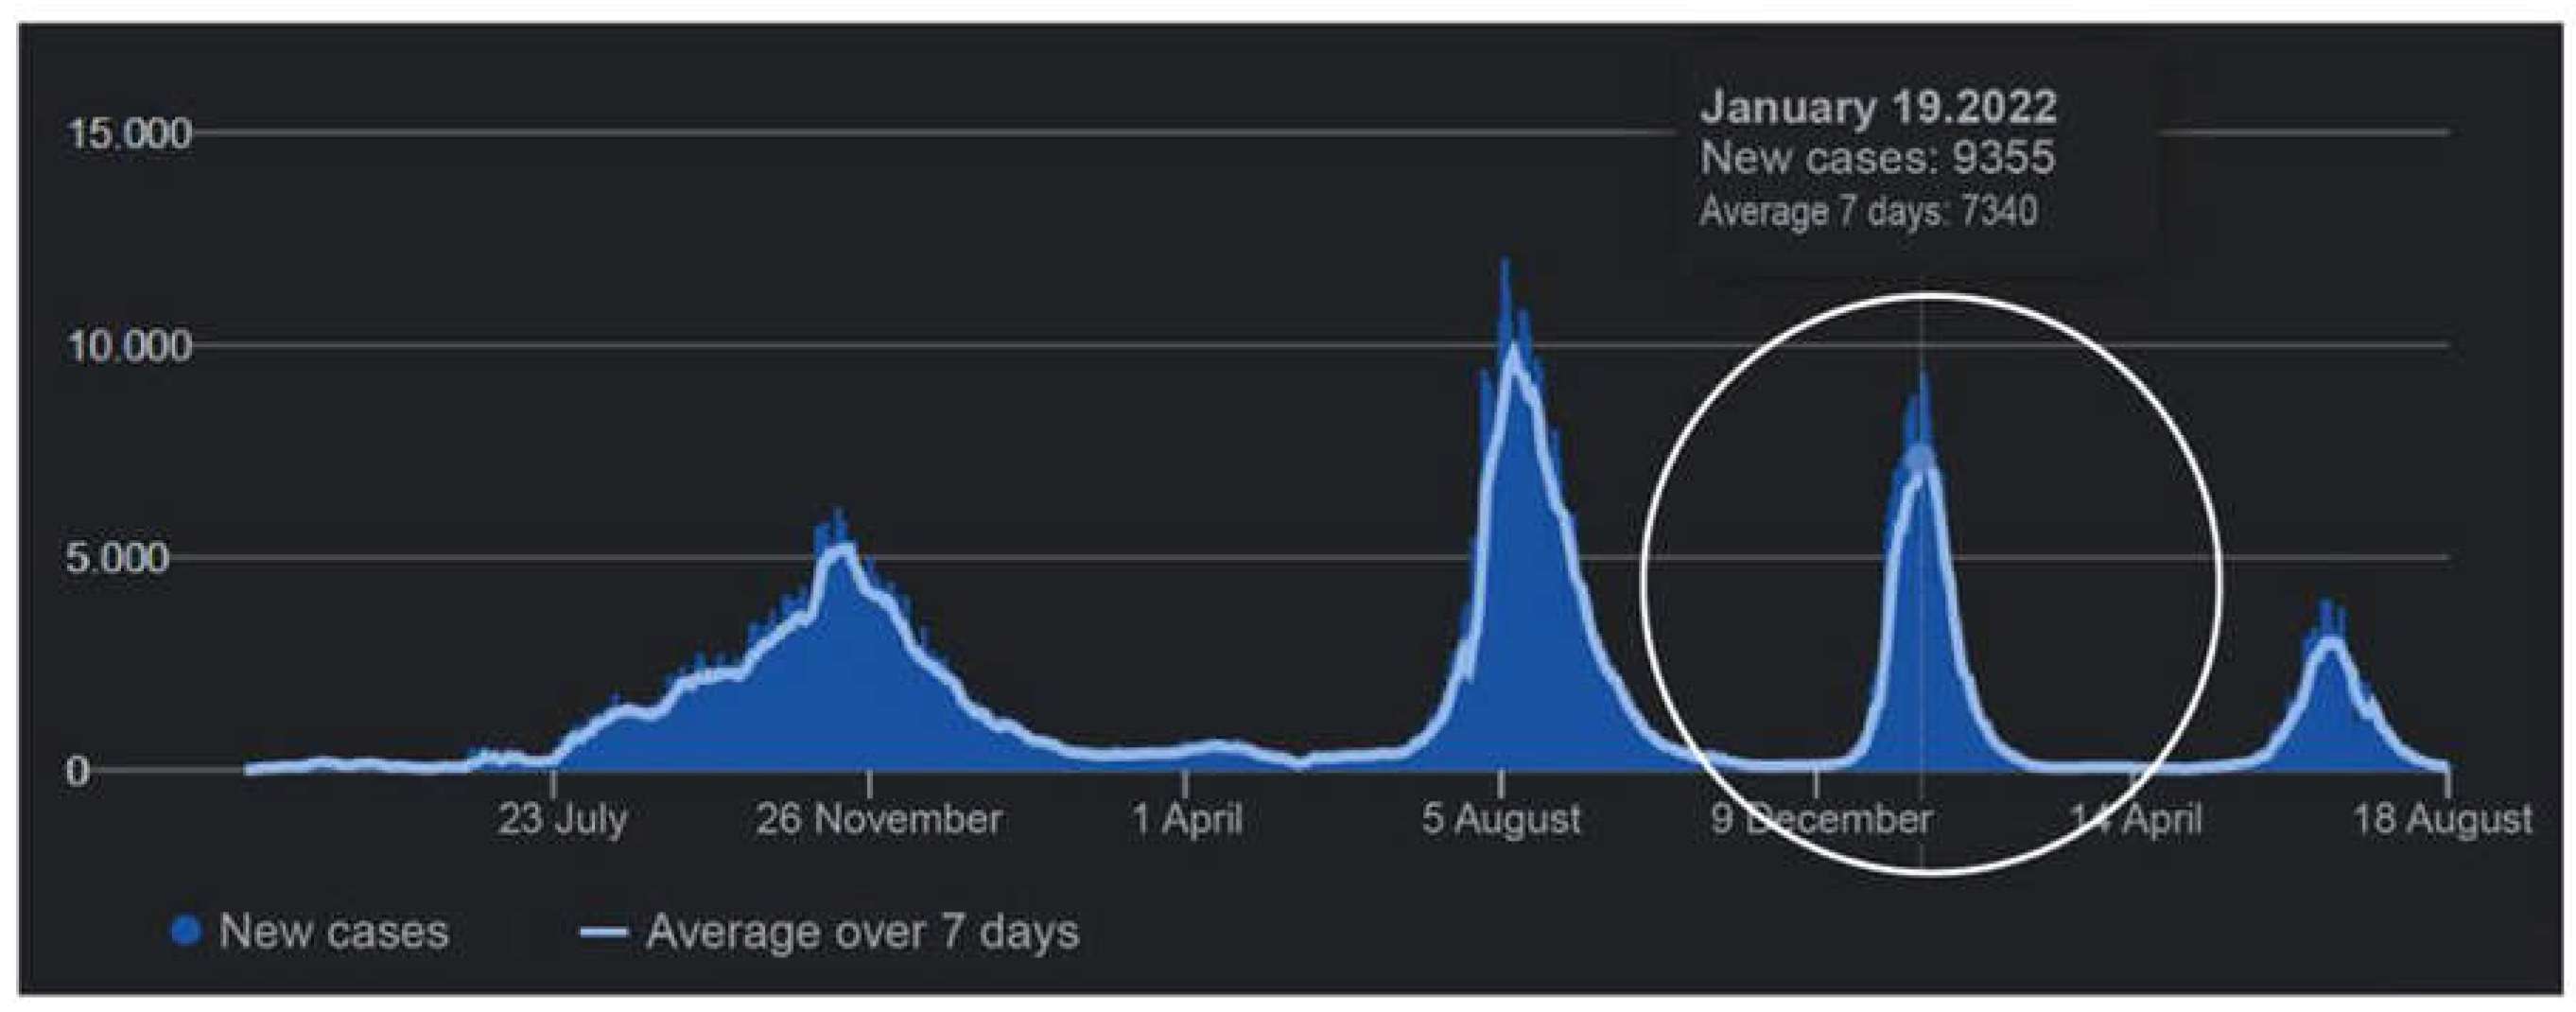

Table 1.
NGS features of SARS-CoV-2 samples.
| Sample | Mapped Reads | Filtered Reads | Target Reads | Mean Depth | Uniformity |
| Agadir 07/01/22 | 37 536 | 0,65% | 98,71% | 221,6 | 74,77% |
| Inezgane 07/01/22 | 351 436 | 0,19% | 99,54% | 2318 | 87,30% |
| Agadir 04/02/22 | 270 741 | 2,46% | 96,97% | 1511 | 73,31% |
| Inezgane 04/02/22 | 734 351 | 0,63% | 99,40% | 4673 | 85,16% |
| Pooled reads | 1 394 064 | - | - | 8407 | - |
Disclaimer/Publisher’s Note: The statements, opinions and data contained in all publications are solely those of the individual author(s) and contributor(s) and not of MDPI and/or the editor(s). MDPI and/or the editor(s) disclaim responsibility for any injury to people or property resulting from any ideas, methods, instructions or products referred to in the content. |
© 2024 by the authors. Licensee MDPI, Basel, Switzerland. This article is an open access article distributed under the terms and conditions of the Creative Commons Attribution (CC BY) license (http://creativecommons.org/licenses/by/4.0/).
Copyright: This open access article is published under a Creative Commons CC BY 4.0 license, which permit the free download, distribution, and reuse, provided that the author and preprint are cited in any reuse.


