
Submitted:
07 February 2024
Posted:
08 February 2024
You are already at the latest version
Preprints on COVID-19 and SARS-CoV-2
Abstract
Wastewater-Based Epidemiology (WBE) is currently used to monitor not only the spread of the pandemic virus SARS-CoV-2 but also for other viruses in endemic conditions, particularly in the absence of syndromic surveillance. Continuous monitoring of sewage requires high costs and significant time investment, highlighting the need for standardized methods and structured monitoring strategies. In this context, we conducted weekly wastewater monitoring in northwestern Italy, targeting Human Adenovirus (HAdV), Norovirus Genogroup II (NoVggII), Enterovirus (EV), and SARS-CoV-2. Samples collected at the entrance of treatment plants were concentrated using PEG/NaCl precipitation and viral nucleic acids were extracted and detected by real-time (RT-)qPCR. NoVggII resulted the most identified target (84.4%), followed by HAdV, SARS-CoV-2, and EV. Only HAdV and EV exhibited seasonal peaks in spring and summer. SARS-CoV-2 results compared with data previously collected in the same study area (February 2021 to September 2021) revealed a shift from an epidemic to a pandemic status, likely due to the evolution of variants. In conclusion, WBE, using standardized methods and an efficient monitoring strategy, proves valuable for virus surveillance in pandemic and epidemic scenarios, enabling the identification of temporal-local distribution patterns that are useful for making informed public health decision.
Keywords:
Wastewater-Based Epidemiology
; wastewater surveillance
; Human Adenovirus
; Enterovirus
; Norovirus
; SARS-CoV-2
; endemic environmental monitoring
1. Introduction
The COVID-19 epidemic has re-proposed a long-lasting method of infections surveillance in a population through the Wastewater-Based Epidemiology (WBE). Firstly, suggested in the middle of the last century, thanks to the research of Joseph Melnick it was focused on the research of Poliovirus, the etiologic agent of poliomyelitis, in the wastewaters of the cities of Chicago and New York, to evaluate the relationship between the environmental detection of the virus and the cases of acute flaccid paralysis [1]. Environmental monitoring of poliovirus is still applied to evaluate the effectiveness of World Health Organization (WHO) strategies adopted for the global disease eradication program [2,3], and to evidence its possible resurgences, monitoring the efficacy of prevention measures and pointing out their failures. Sewage surveillance in 2022 highlighted the circulation of vaccine-derived poliovirus (VDPV) in some countries, including Great Britain [4], Israel [5] and United States of America where genetic analysis revealed the association of detected strain with a paralytic case in New York [6]. These information allowed the adoption of public health measures to prevent the spread of the virus in the most affected age groups, e.g., the UK government recommended a booster dose of inactivated polio vaccine in August 2022 for all children in London under 9 years of age [4]. In the COVID-19 pandemic, the WBE surveillance has been worldwide applied to improve an early warning and tracking variants system, in parallel with the epidemiological clinical surveillance. WBE produced useful results in this context, therefore there was an increasing interest in improving the detection methods as well as in extending environmental surveillance to other viruses, especially endemic ones (e.g., Enterovirus, Norovirus, Hepatitis A Virus, Hepatitis E Virus, Rotavirus, and Adenovirus [7,8,9]). In fact, endemic viruses often lack clinical surveillance, and WBE could provide useful information about their circulation. In Italy, an example of combined analysis of clinical and environmental data for endemic viruses dates back to 2006, when Carducci et al. [10] investigated the relations between some enteric viruses detected in feces specimens and their occurrence in environmental matrices, revealing the continuous environmental circulation of such viruses despite clinical data did not demonstrate any epidemic peak and the concordance of the adenovirus and rotavirus strains between clinical and water samples. Also in the United States, enterovirus monitoring in feces and sewages revealed similarities with the clinical serotypes, thus allowing the forecasting of the clinical viral strains based on those found in the environment [11]. Then, after the COVID-19 pandemic, the application of WBE to enteric viruses (e.g., norovirus, enterovirus) arose new interest for the early detection of outbreaks and for estimating the prevalence of the infections in endemic scenarios [12,13,14,15,16]. Nevertheless, the routine monitoring of sewages is expensive and time consuming, then its relevance for public health depends on the monitoring strategy (e.g., time, number, and area of sampling) and on the reliability of the analytical methods, as widely described during last year’s COVID-19 pandemic, e.g., [17,18]. In fact, the review of Kallem et al. [17] underlines that WBE applied to SARS-CoV-2 detection needs a daily sampling, rapid analysis and reporting; moreover, to compare the sewage viral data over the time and among different communities, it is worth to correct such data according to wastewater flow and to population size of the study area. On the other hand, the wide use of rapid molecular methods for viral RNA detection requests high efficiency and sensitivity, that is strictly associated to wastewater chemical composition, inhibitors presence, and low concentration of target. Also, Cianella et al. [18] demonstrated the wide range of sample concentration methods carried out in different studies, thus highlighting the importance of adopting standardized protocol for the worldwide application of WBE. Such aspects need to be carefully considered also in relation to the epidemiological situation of the selected viral targets, both in endemic and in epidemic scenario. This paper was aimed at collecting information on viral circulation in an endemic scenario, through a one-year sewage monitoring of Human Adenovirus (HAdV), Norovirus Genogroup II (NoVggII), Enterovirus (EV), and SARS-CoV-2.
2. Materials and Methods
2.1. Environmental Sampling Strategy
From October 2021 to September 2022, 197 weekly 24-hours composite samples of raw wastewater were collected at the inlet of four urban wastewater treatment plants (WWTPs) in North-west Tuscany and stored at 4°C before analysis (within 48 h). The WWTPs chosen in this study were those involved in the surveillance network of the national project “Environmental Surveillance of SARS-CoV-2 by urban sewages in Italy” (SARI) according to an EU Recommendation [19], as previously described [20,21]. Briefly, the studied WWTPs served a population between 42,931 (WWTP1) and 110,871 (WWTP3) with some differences in the sewer network structures and population composition: WWTP1 had a separate sewerage system, with a small portion originating from a large hospital; WWTP2 served a small city with a large surrounding area, mostly through combined sewerages (89%); WWTP3 served a moderately sized industrial city with a separate sewerage network characterized by a high portion of rainwater infiltration; and WWTP4 was situated in a highly touristic area, where the population drastically increased during the summer season [21].
2.2. Samples Concentration
The raw sewage samples were pre-treated at 56°C for 30 min for inactivation of the infectious viral particles, prior to being processed. Sample concentration was carried out using the analytical protocol recommended by the SARI project based on polyethylene glycol (PEG) and NaCl precipitation [22]. Briefly, after a first centrifugation at 4500 x g for 30 min, supernatant was mixed with PEG 8000 and NaCl. The sample, after shaking, was centrifuged at 12000 x g for 2 h at 4 °C, then the pellet was resuspended directly in nucleic acid extraction lysis buffer (2 ml) of NucliSense EasyMag kit (BioMérieux, France).
2.3. Viral Nucleic Acids Extraction and Purification
The extraction of viral nucleic acids was performed using the commercial kit cited above, that allows the simultaneous extraction of DNA and RNA using magnetic silica beads, following the manufacturer’s instructions [20]. Briefly, 2 ml of lysis buffer based on guanidine thiocyanate were added to the pellet obtained after the concentration process. The solution was left to react at room temperature for 20 minutes, aiding in the degradation of protein components of both cells and viral particles. Subsequently, 50 µL of magnetic silica beads were added to enable the binding with free nucleic acids. After that, three washing phases were performed, with the tubes placed on a magnetic support. Finally, nucleic acids were detached from the beads in an elution phase (100 μl). The final elution volume was purified using OneStep PCR Inhibitor Removal Kits (Zymo Research, USA) to remove PCR inhibitors; then, the extracts were stored at -80 °C until the quantitative determination of viral genomes as specified in Sect. 2.4.
2.4. Viral Nucleic Acids Detection
The detections and quantifications of the viral targets were performed according to previously published primer/probe set (Table 1) and protocols, as described below. Real time qPCR for HAdV was performed using Taq Man Universal Master Mix (Applied Biosystems), in a total volume of 25 μl with 10 μl of DNA extract, and primers and probe concentration of 900 nM and 225 nM, respectively. The thermal protocol included the following conditions: Uracil-DNA glycosylase activation at 50°C for 2 min, AmpliTaq Gold DNA Polymerase activation at 95°C for 10 min, and then 45 cycles of amplification at 95°C for 15 sec and 60°C for 1 min. The RNA virus genome of EV, NoVggII, and SARS-CoV-2 was searched through a one-step RT-qPCR using AgPath-ID™ One-Step RT-PCR Reagents (Life Technologies), in a total volume of 25 μl with 5 μl of RNA extract. Primers and probe concentrations were 600 nM (primers) and 250 nM (probe) for EV, 1000 nM (primers) and 100 nM (probe) for NoVggII, 500 nM (forward primer), 900 nM (reverse primer), and 250 nM (probe) for SARS-CoV-2. The amplification conditions for both EV and NoVggII were reverse transcription for 30 min at 48 °C, reverse transcriptase (RT) inactivation for 10 min at 95 °C and 45 cycles of amplification with 15 s at 95 °C and 1 min at 60 °C. For SARS-CoV-2, thermal conditions were 30 min at 50°C, 5 min at 95 °C, then 45 cycles with 15 sec at 95 °C and 30 sec at 60°C, respectively. All reactions were performed in duplicate in 96-well optical plates using an ABI 7300 sequence detector system (Applied Biosystems, Foster City, California). For each target, viral titer (genomic copies - GC) was estimated using standard curves, that were obtained by serial dilution of synthetic specific dsDNA (from 1.0 × 101 GC/µl to 1.0 × 10⁵ GC/µl). Negative samples for presence of viral genome were considered equal to the half of the limit of detection (LOD) that was obtained for each target virus by testing serial dilutions of standard dsDNA and by calculating the lowest genome concentration at which all the replicates were positive [21]: 3 GCs/reaction for SARS-CoV-2, 2 GCs/reaction for HAdV, and 1 GCs/reaction for EV and NoVggII.
2.5. Data Adjustment and Normalization
The concentrations of each target virus were normalized considering the daily WWTP flow and the population served by the sewage system [21]. Therefore, the wastewater data were normalized using equation:
where:
- -
- Normalized Viral Load (hereafter viral load) is expressed as GC/day/100,000 inhabitants and x is the identification number of each WWTP (namely: 1, 2, 3, 4);
- -
- Conc.virus is the concentration of virus detected (GC/L);
- -
- Fd is the daily wastewater flow rate of WWTPs (L/day);
- -
- 105 is a constant used to refer the viral load to 100,000 inhabitants;
- -
- P is the number of inhabitants served by each WWTP.
2.6. Historical Data on SARS-CoV-2
Data on SARS-CoV-2 referring to the same four WWTPs were extracted from a previous study [20] in order to cover three seasons in 2021 period, namely winter (20 data), spring (52 data), and summer (52 data). These data have been compared with monitoring data of the present study.
2.7. Statistical Analysis
For each virus, the chi-square statistic was used to understand if viral presence (variable with two categories: presence or absence) was influenced by sampling period, i.e., the season (variable with four categories: autumn, winter, spring, summer). For the present analysis, the seasons have been divided as follows: autumn from 1 October to 31 December 2021, winter from 1 January to 31 March 2022, spring from 1 April to 30 June 2022, and summer from 1 July to 30 September 2022. The chi-square statistic was also applied to test the association between viral presence and sampling site, i.e., the type of WWTP (variable with four categories: WWTP1, WWTP2, WWTP3, WWTP4), separately for each virus. Regarding viral loads, they were Log10-transformed prior statistical analysis and, similarly as previously described for viral frequencies, two-way ANOVA test was performed on viral load to evaluate the influence of the sampling period (season) and of the sampling site (type of WWTP). The results were considered significant when p-value was < 0.05, very significant when p-value < 0.01, and extremely significant when p-value < 0.001. All statistical analyses were performed using GraphPad Prism software (GraphPad, USA, version 5.03, December 10, 2009).
3. Results
3.1. Descriptive Analysis of Viruses’ Data
The occurrence of the target viruses and their viral load, separately for each WWTP, are reported in Table 2 as pooled data and in Tables S1–S4 divided according to season.
Overall, the wastewater positivity for at least one of the target viruses was 98.5% (194/197); NoVggII was the most represented (166/197, 84.3%), followed by HAdV (158/197, 80.2%), SARS-CoV-2 (100/197, 50.8%), and EV (87/197, 44.2%). For HAdV, the frequency of positives samples was statistically different either among seasons (chi-squared, p-value < 0.001) or among WWTPs (chi-squared, p-value < 0.01). In particular, HAdV presence was higher during spring and summer, with positive samples close to 100% across all WWTPs (Table S1). Nevertheless, HAdV occurrence was lower for WWTP3 and WWTP4 during autumn and winter, that represent low tourist seasons for these areas. Similarly, EV-positive samples showed significant differences among seasons (chi-squared, p-value < 0.001) and among WWTPs (chi-squared, p-value < 0.001). Highest number of positive samples were observed during warmer periods (Table S2), namely 59.6% (31/52) in spring and 67.3% (35/52) in summer. Regarding sampling location, WWTP2 showed very little occurrence of EV, with no detection in autumn and winter and 15.4% (2/13) in both spring and summer, probably due to the structure of the sewer network (the combined sewage could be responsible for wastewater dilution; Sect. 2.1). For NoVggII (Table S3), viral presence was significantly influenced by sampling location (chi-squared, p-value < 0.01) and, as reported for EV, WWTP2 was the less contaminated, with occurrence ranging from 61.5% (8/13) in summer and 80% (8/10) in winter. Finally, no statistically significant differences emerged for SARS-CoV-2 either among seasons (chi-squared, p-value = 0.22) or among WWTPs (chi-squared, p-value = 0.17) (Table S4).
Regarding viral load, HAdV showed the highest concentration with 9.4 ± 2.6 Log10 GC/inh/day, followed by NoVggII (8.5 ± 2.0 Log10 GC/inh/day), SARS-CoV-2 (6.5 ± 2.1 Log10 GC/inh/day), and EV (5.9 ± 2.2 Log10 GC/inh/day) (Table 2 and Tables S1–S4). As for viral occurrence, also viral load was influenced by sampling time (seasons) and sampling location (WWTPs), with different pattern depending on the type of virus (Figure 1). Regarding HAdV, the viral load was significantly higher during warm seasons, namely spring (9.5 ± 2.7 Log10 GC/inh/day) and summer (10.8 ± 1.2 Log10 GC/inh/day) (two-way ANOVA, p-value < 0.01), also showing differences among WWTPs, with WWTP3 and WWTP4 less contaminated (two-way ANOVA, p-value < 0.05). Similarly, EV load exhibited statistically significant differences according to season, with higher viral load in spring (6.7 ± 2.3 Log10 GC/inh/day) and summer (6.8 ± 2.1 Log10 GC/inh/day) (two-way ANOVA, p-value < 0.01) and to WWTP (two-way ANOVA, p-value < 0.01), with lower contamination in the WWTP2 as observed for EV occurrence. Regarding NoVggII, statistically significant differences were observed only according to WWTP (two-way ANOVA, p-value < 0.01), where WWTP2 was less contaminated, as reported for EV load; instead, no seasonal pattern was revealed. Regarding SARS-CoV-2, no significant differences were observed among seasons and WWTPs.
3.2. SARS-CoV-2 Annual Trend from 2021 to 2022
The availability of historical data for SARS-CoV-2 that refers to the previous year (February 2021 – September 2021; Sect. 2.6) allowed a comparison with 2022 monitoring period. This comparison revealed seasonal variability of SARS-CoV-2 load between 2021 and 2022. In 2021, SARS-CoV-2 load gradually decreased from winter (6.4 ± 2.3 Log10 GC/inh/day) to spring (5.7 ± 2.1 Log10 GC/inh/day) and summer (5.3 ± 0.9 Log10 GC/inh/day). Interestingly, in the subsequent 2022 period, such a seasonal pattern was not observed, with consistent viral loads of 6.8 ± 2.2 Log10 GC/inh/day, 6.7 ± 2.1 Log10 GC/inh/day, 6.0 ± 2.1 Log10 GC/inh/day, during winter, spring, and summer, respectively.
4. Discussion
Viruses transmitted through the fecal-oral route, such as enteric viruses, offer a unique opportunity for tracking emerging pathogens and investigating the epidemiology of infectious diseases within the community by studying viral shedding in wastewater. This could be employed to investigate a wide spectrum of viral pathogens released through the fecal-oral route, not limited to enteric viruses alone. Applying such a method for epidemiological monitoring would enhance our understanding of virus circulation in different scenarios [26]. In our work, HAdV was detected during all 12 months: a statistically significant variation among seasons has been demonstrated either using qualitative analysis based on the frequencies of positive samples or using quantitative one based on the viral load, with peaks for these two parameters occurring in spring and summer. This finding aligns with other work examining enteric viruses in stool samples [27], and suggests a higher level of HAdV DNA in summer, indicating a possible seasonal pattern. However, literature also presents conflicting evidence, such as insignificant seasonal distribution [28] or even a greater presence of HAdV in the winter months [29,30]. Our study was conducted in a part of Tuscany heavily affected by summer tourism. This may have increased viral circulation due to a higher flow of people, considering that approximately 90% of the human population is positive for at least one serotype of adenovirus [31]. The wastewater-based epidemiology of HAdV is crucial, because despite the virus being the second most significant viral pathogen causing infantile gastroenteritis and being linked to outbreaks in various settings [31], there is a lack of consistent syndromic surveillance. Furthermore, in wastewater it has been observed not only the predominant presence of species associated to gastrointestinal symptoms (HAdV-F) but also Adenovirus C that are responsible of respiratory infections [32]. As reported in an epidemiological investigation of wastewater treatment plants located in various Italian regions, the analysis of 141 raw sewage samples showed a viral positivity of 60% and the use of Next Generation Sequencing permitted to identify up to 19 HAdV types, not only 40 and 41 (species F), but also viruses belonging to species A, B, C, D and E, confirming the wide presence of HAdV in raw sewage and, therefore, its circulation in population with or without respiratory and gastrointestinal symptoms [33]. Similar results were obtained in Venezuela, in 2021-2022, by Zamora-Figueroa et al. [34], who performed a one-year monitoring study of 91 wastewater samples from urban areas of Caracas, revealing a positivity rate for HAdV of 52.7% with the presence of F and no-F species, equally distributed. In Egypt, the isolation and genotyping of HAdV in sewage and clinical samples, from 2016 to 2020, revealed that no enteric species represented 5% - 6% of positive samples, thus suggesting their involvement not only in respiratory infections, but also in diarrheal diseases [35]. In China, Lee et al. [36] deep investigated sewage samples collected from 2021 to March 2022, showing the presence of 14 HAdV species C, further confirming the role of sewages in the environmental spreading of no enteric HAdV, with possible occurrence of recombination events and new variants in such matrices. Also in our study, the sequencing analysis of the positive samples revealed the presence of enteric and no enteric viral species; moreover, we found a prevalence of respiratory types in winter, subsequently replaced by gastrointestinal types in summer [37]. This underlined the importance of prevalence HAdV investigation in aquatic environments to effectively monitor and prevent their transmission.
EV also exhibited a statistically significant difference in distribution across seasons and WWTPs, with the highest number of positive samples and a greater concentration of viral RNA detected in the warm months (spring and summer) and in 3 out 4 WWTPs. These results agree with previous studies indicating a peak of EV in summer [38] or during summer and early fall [39]. The number of infections in temperate climate regions reaches the highest level in summer and early autumn months, as EV is a resilient organism able to resist also at significant temperature fluctuations [40]. However, EV is also not consistently monitored through clinical surveillance, making it challenging to determine the exact infections number at any given time. Exploring the presence of EV in wastewater and implementing the study with sequencing techniques could significantly improve the understanding of enterovirus infections.
NoVggII and SARS-CoV-2 showed no statistically significant differences among months, neither in the frequency of positive samples nor in the viral load. Regarding NoVggII, our results are discordant with some literature, showing peaks in February and March [41], while SARS-CoV-2 is still under study. However, in the case of SARS-CoV-2, current evidence suggests increased mortality and infectivity at low temperatures, indicating a prevalence during the colder months. As a result, SARS-CoV-2 circulation is influenced by seasonal cycle, as reported also for other respiratory viruses [42]. In fact, sunlight and high environmental temperature are responsible for viral inactivation, e.g., Sharun and collaborators [43] reported that solar radiation could have a significant impact on the rate of decay and viral inactivation. This aspect is supported by our data from the 2021 period, where a slight but consistent decrease in the viral titer has been observed in wastewater from winter to summer. However, the seasonal trend tends to disappear in 2022, thus suggesting the emergence of new variants potentially more resistant to environmental conditions (e.g., high temperatures, UV rays). Such observation is supported by Gibson and colleagues’ work [44], who observe that a 17% higher UV254 dose is necessary for the disinfection of Delta and Omicron variants compared to the ancestral strain of SARS-CoV-2. This shift could indicate a potentially transition of SARS-CoV-2 from an epidemic to an endemic trend. Furthermore, the endemic trend could also be facilitated by the increased transmissibility of the new variants. For example, the Omicron variant has been identified as less virulent but more transmissible than the previous ones, thereby promoting a higher viral circulation and, consequently, a greater number of infections. This is easily understandable from an evolutionary standpoint, as the virus’s ultimate goal is to replicate and circulate, rather than to disappear, as observed with other pathogens [45].
Our study has some limitations, exemplified by the lack of clinical data for HAdV, EV, and NoVggII, that hampers to establish a connection with confirmed infected individuals. In fact, active clinical surveillance of such viral infections is not established in Italy. Nevertheless, recent research papers highlight the importance of monitoring of clinical infections for some viruses [46,47,48]. Additionally, the surveillance was conducted in a specific area of Tuscany, and the results obtained may not be generalizable to other regions. To overcome this limitation, expanding monitoring to a larger geographic area is recommended. Furthermore, in the present paper, viral presence and quantity have been detected using PCR as the only molecular method, but the analysis could be further improved employing other molecular approach, that are less sensitive to environmental PCR inhibitors, such as biosensors or digital PCR [49].
5. Conclusions
The continuous monitoring of sewage is expensive and time-consuming; therefore, it is crucial to employ sensitive and standardized techniques, coupled with a well-organized monitoring plan over time. In our study, which includes weekly monitoring and the use of sensitive techniques, we have identified a seasonal trend for Human Adenovirus and Enterovirus, with peaks in spring and summer. However, no significant temporal differences were observed for Norovirus and SARS-CoV-2. For SARS-CoV-2, using the same methodologies, we have also highlighted a potential transition from an epidemic to an endemic status, possibly linked to the development of new variants. These findings could be of great importance from a public health perspective, enabling the monitoring and prevention of potential peaks. In conclusion, WBE can be considered an important tool to evaluate spatial-temporal evolution of endemic-epidemic infection in the absence of clinical monitoring.
Supplementary Materials
The following supporting information can be downloaded at the website of this paper posted on Preprints.org., Table S1. Occurrence and viral load of HAdV organised according to WWTPs and seasons; Table S2. Occurrence and viral load of enterovirus (EV) organised according to WWTPs and seasons; Table S3. Occurrence and viral load of norovirus genogroup II (NoVggII) organised according to WWTPs and seasons; Table S4. Occurrence and viral load of SARS-CoV-2 organised according to WWTPs and seasons.
Author Contributions
Conceptualization, M.V, A.P., I.F., and A.C.; methodology, M.V, A.P., I.F., G.L., V.R., and A.C.; formal analysis, M.V, A.P., I.F. and G.L.; investigation, M.V., A.P., I.F., G.L., V.R. and L.V.; data curation, M.V. and A.P.; writing—original draft preparation, M.V, A.P. and I.F.; writing—review and editing, M.V., A.P., I.F., N.T.A., G.L., and A.C.; supervision, M.V., I.F., and A.C.; project administration, M.V. and A.C.; funding acquisition, A.C. All authors have read and agreed to the published version of the manuscript.
Funding
This work was funded by Tuscany Region with the project “Monitoring and modeling of SARS-CoV-2 in sewer networks for COVID 19 pandemic spreading early warning system”(Regional Council resolution 8 March 2021, n. 174); by the Italian Ministry of Health, “CCM 2020 program” with the project “Wastewater based epidemiology: implementation of a surveillance system for the early detection of pathogens, and specifically SARS-CoV-2”; by the Italian Government, Decree of the Ministry of Health 30.10.2021 11 December 2021, n.294 and by the EU Commission, Grant Agreement 060701/2021/864481/SUB/ENV.C2. This work was also supported by the Ministry of University and Research (MUR) as part of the FSE REACT-EU - PON 2014-2020 “Research and Innovation” resources – Green/Innovation Action – DM MUR 1062/2021 - Title of the Research: “Risk analysis for the human health derived from sewage management: perspectives for the reuse”.
Institutional Review Board Statement
Not applicable.
Informed Consent Statement
Not applicable
Data Availability Statement
Public SARS-CoV-2 wastewater dataset: https://www.iss.it/cov19-acque-reflue (accessed on 04/01/2024).
Acknowledgments
We wish to thank the personnel of the integrated water service for providing samples and information on wastewater networks: Acque Spa (Roberto Salvadori, Simone Lippi, Sara Bacci, Paolo Peruzzi, Elettra Vichi, Silvia Parrini) and Gaia Spa (Daniele Franceschini, Claudia Valentini, Francesco Di Martino, Giada Croce). We also thank Ingegnerie Toscane for the logistic sample transport support (Damasco Morelli, Fabrizio Mancuso), prof. Claudio Lubello and dr. Tommaso Lotti (University of Florence) for providing sewerage network data.
Conflicts of Interest
The authors declare no conflicts of interest. The funders had no role in the design of the study; in the collection, analyses, or interpretation of data; in the writing of the manuscript; or in the decision to publish the results.
References
- Melnick, J.L. Poliomyelitis virus in urban sewage in epidemic and in nonepidemic times. Am J Hyg., Mar. 1947, Vol. 45, no. 2, pp: 240-253. [CrossRef]
- Hovi, T; Shulman, L.M; Van Der Avoort, H.; Deshpande, J.; Roivainen, M; De Gourville, E.M. Role of environmental poliovirus surveillance in global polio eradication and beyond. Epidemiology and Infection, Jan. 2012, Vol. 140, no. 1, pp. 1–13. [CrossRef]
- Zoni, R; Mezzetta, S; Affanni, P; Colucci M.E.; Fiore, S.; Fontana, S.; Bracchi, M.; Capobianco, E.; Veronesi, L. Poliovirus and non-polio-enterovirus environmental surveillance in Parma within the “Global Polio Eradication Program” (GPEI)’, Acta Biomedica, 2019, Vol. 90, no. 9 S, pp. 95–97. [CrossRef]
- Klapsa, D.; Wilton, T.; Zealand, A.; Bujaki, E.; Saxentoff, E.; Troman, C.; Shaw, A.G.; Tedcastle, A.; Majumdar, M.; Mate, R.; Akello, J.O.; Huseynov, S.; Zeb, A.; Zambon, M.; Bell, A.; Hagan, J.; Wade, M.J.; Ramsay, M.; Grassly, N.C.; Saliba, V.; Martin, J. Sustained detection of type 2 poliovirus in London sewage between February and July, 2022, by enhanced environmental surveillance, The Lancet, Oct. 2022, Vol. 400, no. 10362, pp. 1531–1538. [CrossRef]
- Zuckerman N.S.; Bar-Or, I.; Sofer, D.; Bucris, E.; Morad, H.; Shulman, L.M.; Levi, N.; Weiss, L.; Aguvaev, I.; Cohen, Z.; Kestin, K.; Vasserman, R.; Elul, M.; Fratty, I.S.; Geva, M.; Wax, M.; Erster, O.; Yishai, R.; Hecht-Sagie, L.; Alroy-Preis, S.; Mendelson, E.; Weil, M. Emergence of genetically linked vaccine-originated poliovirus type 2 in the absence of oral polio vaccine, Jerusalem, April to July 2022, Eurosurveillance, Sep. 2022, Vol. 27, no. 37. [CrossRef]
- Ryerson, A.B.; Lang, D.; Alazawi, M.A.; Neyra, M.; Hill, D.R.; St. George, K.; Fuschino, M.; Lutterloh, E.; Backenson, B.; Rulli, S.; Schnabel Ruppert, P.; Lawler, J.; McGraw, N.; Knecht, A.; Gelman, I.; Zucker, J.R.; Omoregie, E.; Kidd, S.; Sugerman, D.E.; Jorba, J.; Gerloff, N.; Fei Fan Ng, T.; Lopez, A.; Masters, N.B.; Leung, J.; Burns, C.C.; Routh, J.; Bialek, S.R.; Oberste, M.S.; Rosenberg, E.S. Wastewater Testing and Detection of Poliovirus Type 2 Genetically Linked to Virus Isolated from a Paralytic Polio Case — New York, March 9–October 11, 2022. Available online: https://polioeradication.org/wp-content/uploads/2016/09/ (accessed on 4 January 2024).
- World Health Organization. Guidelines for drinking-water quality: fourth edition incorporating the first and second addenda, 4th ed; Geneva, 2022; ISBN 978-92-4-004506-4. [Google Scholar]
- Dzinamarira, T.; Pierre, G.; Iradukunda P.G.; Tungwarara, N.; Mukwenha, S.; Mpabuka, E.; Kidson Mataruka, K.; Chitungo, I.; Musukaf, G.; Murewanhema, G. Epidemiological surveillance of enteric viral diseases using wastewater in Africa – A rapid review, Journal of Infection and Public Health, Jun. 01, 2022, Vol. 15, no. 6. Elsevier Ltd., pp. 703–707. [CrossRef]
- Hellmér, M.; Paxéus, N.; Magnius, L.; Enache, L.; Arnholm, N.; Johansson, A.; Bergström, T.; Norder, H. Detection of pathogenic viruses in sewage provided early warnings of hepatitis A virus and norovirus outbreaks, Appl Environ Microbiol, 2014, Vol. 80, no. 21, pp. 6771–6781. [CrossRef]
- Carducci, A.; Verani, M.; Battistini, R.; Pizzi, F.; Rovini, E.; Andreoli, E.; Casini B. Epidemiological surveillance of human enteric viruses by monitoring of different environmental matrices, Water Science and Technology, 2006, Vol. 54, no. 3, pp. 239–244. [CrossRef]
- Sedmak, G.; Bina, D.; MacDonald, J. Assessment of an Enterovirus Sewage Surveillance System by Comparison of Clinical Isolates with Sewage Isolates from Milwaukee, Wisconsin, Collected August 1994 to December 2002, Appl Environ Microbiol, Dec. 2003, Vol. 69, no. 12, pp. 7181–7187. [CrossRef]
- Chacón, L.; Morales, E.; Valiente, C.; Reyes, L.; Barrantes, K. Wastewater-based epidemiology of enteric viruses and surveillance of acute gastrointestinal illness outbreaks in a resource-limited region, American Journal of Tropical Medicine and Hygiene, Oct. 2021, Vol. 105, no. 4, pp. 1004–1012. [CrossRef]
- Wang, H.; Neyvaldt, J.; Enache, L.; Sikora, P.; Mattsson, A.; Johansson, A.; Lindh, M.; Bergstedt, O.; Norder, H. Variations among Viruses in Influent Water and Effluent Water at a Wastewater Plant over One Year as Assessed by Quantitative PCR and Metagenomics, Appl Environ Microbiol, Nov. 2020, Vol. 86, no. 24. [CrossRef]
- Gonçalves, J.; Torres-Franco, A.; Rodriguéz, E.; Diaz, I.; Koritnik, T.; Gomes da Silva, P.; Mesquita, J.R.; Trkov, M.; Paragi, M.; Muñoz, R.; García-Encina P.A. Centralized and decentralized wastewater-based epidemiology to infer COVID-19 transmission – A brief review, One Health, Dec. 01, 2022, Vol. 15. Elsevier B.V. [CrossRef]
- Brinkman, N.E.; Fout, G.S.; Keely, S.P. Retrospective Surveillance of Wastewater To Examine Seasonal Dynamics of Enterovirus Infections, mSphere, Jun. 2017, Vol. 2, no. 3. [CrossRef]
- Guo, Y.; Li, J.; O’Brien, J.; Sivakumar, M.; Jiang, G. Back-estimation of norovirus infections through wastewater-based epidemiology: A systematic review and parameter sensitivity, Water Research, Jul 01, 2022, Vol. 219. Elsevier Ltd. [CrossRef]
- Kallem, P.; Hegab, H.; Alsafar, H.; Hasan, S.W.; Banat, F. SARS-CoV-2 detection and inactivation in water and wastewater: review on analytical methods, limitations and future research recommendations, Emerging Microbes and Infections, 2023, Vol. 12, no. 2. Taylor and Francis Ltd. [CrossRef]
- Ciannella, S.; González-Fernández, C.; Gomez-Pastora, J. Recent progress on wastewater-based epidemiology for COVID-19 surveillance: A systematic review of analytical procedures and epidemiological modeling, Science of the Total Environment, Jun. 20, 2023, Vol. 878. Elsevier B.V. [CrossRef]
- European Commission (EU) Commission Recommendation (EU) n° 2021/472 of 17 March 2021 on a Common Approach to Establish a Systematic Surveillance of SARS-CoV-2 and its Variants in Wastewaters in the EU-Publications Office of the EU. Retrieved July 6, 2023. Available online: https:// op. europa. eu/ en/ publi cation- detai l/-/ publication/ 05b46 cb0- 8855- 11eb- ac4c- 01aa7 5ed71 a1/ langu age- en/format- PDF.
- Verani M.; Federigi, I.; Muzio, S.; Lauretani, G.; Calà, P.; Mancuso, F.; Salvadori, R.; Valentini, C.; La Rosa, G.; Suffredini, E.; Carducci, A. Calibration of Methods for SARS-CoV-2 Environmental Surveillance: A Case Study from Northwest Tuscany, Int J Environ Res Public Health, Dec. 2022, Vol. 19, no. 24. [CrossRef]
- Carducci, A.; Federigi, I.; Lauretani, G.; Muzio, S.; Pagani, A.; Atomsa, N.T, Verani, M. Critical Needs for Integrated Surveillance: Wastewater-Based and Clinical Epidemiology in Evolving Scenarios with Lessons Learned from SARS-CoV-2, Food Environ Virol, Jan. 2024. [CrossRef]
- La Rosa, G; Bonadonna L.; Suffredini, E. Protocollo della Sorveglianza di SARS-CoV-2 in reflui urbani (SARI) - rev. 3. Zenodo, Jul 25, 2021. [CrossRef]
- Hernroth, B.E.; Conden-Hansson, A.C.; Rehnstam-Holm, A.S.; Girones, R.; Allard, A.K. Environmental factors influencing human viral pathogens and their potential indicator organisms in the blue mussel, Mytilus edulis: The first Scandinavian report, Appl Environ Microbiol, Sep. 2002, Vol. 68, no. 9, pp. 4523–4533. [CrossRef]
- Donaldson K.A.; Griffin D.W.; Paul J.H. Detection, quantitation and identification of enteroviruses from surface waters and sponge tissue from the Florida Keys using real-time RT-PCR. Water Res, 2002, Vol 36, no. 10, pp. 2505-2514. [CrossRef]
- Skraber, S.; Ogorzaly, L.; Helmi, K.; Maul, A.; Hoffmann, L.; Cauchie, H.M.; Gantzer, C. Occurrence and persistence of enteroviruses, noroviruses and F-specific RNA phages in natural wastewater biofilms. Water Res, 2009, Vol 43, no. 19, pp. 4780–4789. [CrossRef]
- Bisseux, M.; Colombet, J.; Mirand, A.; Archimbaud, C.; Peigue-Lafeuille, H.; Roque-Afonso, A.M.; Abravanel, F.; Izopet, J.; Debroas, D.; Bailly, J.L.; Henquell, C. Monitoring human enteric viruses in wastewater and relevance to infections encountered in the clinical setting: a one-year experiment in central France, Euro Surveill., 2018, Vol. 23, no. 7, 17-00237. [CrossRef]
- Vetter, M.R.; Staggemeier, R.; Vecchia, A.D.; Henzel, A.; Rigotto, C.; Spilki, F.R. Seasonal variation on the presence of adenoviruses in stools from non-diarrheic patients, Brazilian Journal of Microbiology, Jul. 2015, Vol. 46, no. 3, pp. 749–752. [CrossRef]
- Maniah, K.; Nour, I.; Hanif, A.; Yassin, M.T.; Alkathiri, A.; Al-Ashkar, I.; Eifan, S. Molecular Identification of Human Adenovirus Isolated from Different Wastewater Treatment Plants in Riyadh, Saudi Arabia: Surveillance and Meteorological Impacts. Water (Switzerland), Apr. 2023, Vol 15, no. 7. [CrossRef]
- Elmahdy, E.M.; Ahmed, N.I.; Shaheen, M.N.F.; Mohamed, E.C.B.; Loutfy, S.A. Molecular detection of human adenovirus in urban wastewater in Egypt and among children suffering from acute gastroenteritis, J Water Health, Apr. 2019, Vol. 17, no. 2, pp. 287–294. [CrossRef]
- Price, R.H.M.; Graham, C.; Ramalingam, S. Association between viral seasonality and meteorological factors, Sci Rep, Dec 2019, Vol. 9, no. 1. [CrossRef]
- Fong, T.T.; Phanikumar, M.S.; Xagoraraki, I.; Rose, J.B. Quantitative detection of human adenoviruses in wastewater and combined sewer overflows influencing a Michigan river, Appl Environ Microbiol, Feb. 2010, Vol. 76, no. 3, pp. 715–723. [CrossRef]
- Takuissu G.R.; Kenmoe S.; Ebogo-Belobo J.T.; Kengne-Ndé C.; Mbaga D.S.; Bowo-Ngandji A.; Ondigui Ndzie J.L.; Kenfack-Momo R.; Tchatchouang S.; Kenfack-Zanguim J.; Lontuo Fogang R.; Zeuko’o Menkem E.; Kame-Ngasse G.I.; Magoudjou-Pekam J.N.; Suffredini E.; Veneri C.; Mancini P.; Bonanno Ferraro G.; Iaconelli M.; Verani M.; Federigi I.; Carducci A.; La Rosa G. Exploring adenovirus in water environments: a systematic review and meta-analysis, International Journal of Environmental Health Research, 2023. [CrossRef]
- Iaconelli, M.; Valdazo-González, B.; Equestre, M.; Ciccaglione, A. R.; Marcantonio, C.; Della Libera, S.; La Rosa, G. Molecular characterization of human adenoviruses in urban wastewaters using next generation and Sanger sequencing, Water Res., Sep. 15, 2017, Vol. 121, pp. 240-247. [CrossRef]
- Zamora-Figueroa, A.; Rosales, R. E.; Fernández, R.; Ramírez, V.; Bastardo, M.; Farías, A., Vizzi, E. Detection and diversity of gastrointestinal viruses in wastewater from Caracas, Venezuela, 2021-2022. Virology, 2024, Vol. 589, 109913. [CrossRef]
- Allayeh, A. K.; Al-Daim, S. A.; Ahmed, N.; El-Gayar, M.; Mostafa, A. Isolation and Genotyping of Adenoviruses from Wastewater and Diarrheal Samples in Egypt from 2016 to 2020. Viruses, 2022, Vol. 14, 10 2192. [CrossRef]
- Lei, Y.; Zhuang, Z.; Liu, Y.; Tan, Z.; Gao, X.; Li, X.; Yang, D. Whole Genomic Sequence Analysis of Human Adenovirus Species C Shows Frequent Recombination in Tianjin, China. Viruses, 2023, Vol. 15, 4, 1004. [CrossRef]
- Carducci, A.; Viviani, L.; Pagani, A.; Atomsa, N. T.; Lauretani, G.; Federigi, I; Verani, M. Wastewater Based Surveillance of Respiratory Viruses for public health purposes: opportunities and challenges. In IWA World Water Congress & Exhibition, Toronto, Canada, 11-15 August 2024; submitted.
- Pons-Salort, M.; Oberste, M.S.; Pallansch, M.A.; Abedi, G.R.; Takahashi, S.; Grenfell, B.T.; Grassly, N.C. The seasonality of nonpolio enteroviruses in the United States: Patterns and drivers, Proc Natl Acad Sci U S A, Mar. 2018, Vol. 115, no. 12, pp. 3078–3083. [CrossRef]
- Baek, K.; Yeo, S.; Lee, B.; Park. K.; Song, J.; Yu, J.; Rheem, I.; Kim, J.; Hwang, S.; Choi, Y.; Cheon, D.; Park, J. Epidemics of enterovirus infection in Chungnam Korea, 2008 and 2009, Virol J, 2011, Vol. 8. [CrossRef]
- Rajtar, B.; Majek, M.; Polański, Ł.; Polz-Dacewicz, M. Enteroviruses in water environment-a potential threat to public health, Ann Agric Environ Med, 2008, Vol. 15, no. 2, pp. 199–203.
- Rohayem, J. Norovirus seasonality and the potential impact of climate change, Clinical Microbiology and Infection, 2009, Vol. 15, no. 6. Blackwell Publishing Ltd., pp. 524–527. [CrossRef]
- Liu X.; Huang J.; Li C.; Zhao Y.; Wang D.; Huang Z.; Yang K. The role of seasonality in the spread of COVID-19 pandemic, Environ Res, Apr. 2021, Vol. 195. [CrossRef]
- Sharun, K.; Tiwari, R.; Dhama, K. COVID-19 and sunlight: Impact on SARS-CoV-2 transmissibility, morbidity, and mortality, Annals of Medicine and Surgery, Jun. 01, 2021, Vol. 66. Elsevier Ltd. [CrossRef]
- Gibson, J.; Poon, B.P.; Lam, J.; Sultana, A.; Christie-Holmes, N.; Mubareka, S.; Gray-Owen, S.D.; Farnood, R. Exploring the Differences in the Response of SARS-CoV-2 Delta and Omicron to Ultraviolet Radiation, ACS ES and T Engineering, Aug. 2023. [CrossRef]
- Lorente-González, M.; Suarez-Ortiz, M.; Landete, P. Evolution and Clinical Trend of SARS-CoV-2 Variants, Open Respiratory Archives, Apr. 01, 2022, Vol. 4, no. 2. Elsevier Espana S.L.U. [CrossRef]
- Bisseux, M.; Colombet, J.; Mirand, A.; Roque-Afonso, A.M.; Abravanel, F; Izopet, J; Archimbaud, C; Peigue-Lafeuille, H; Debroas, D; Bailly, J.L.; Henquell, C. Monitoring human enteric viruses in wastewater and relevance to infections encountered in the clinical setting: a one-year experiment in central France, 2014 to 2015. Euro Surveill. Feb 2018, Vol. 23, no, pp. 17-00237. [CrossRef]
- Fantilli, A; Cola, G.D.; Castro, G.; Sicilia, P.; Cachi, A.M.; de Los Ángeles Marinzalda, M.; Ibarra, G.; López, L.; Valduvino, C.; Barbás, G.; Nates, S.; Masachessi, G.; Pisano, M.B.; Ré, V. Hepatitis A virus monitoring in wastewater: A complementary tool to clinical surveillance. Water Res. Aug 1, 2023, Vol. 241, 120102. [CrossRef]
- Casares-Jimenez, M; Garcia-Garcia, T; Suárez-Cárdenas, J.M.; Perez-Jimenez, A.B.; Martín, M.A.; Caballero-Gómez, J.; Michán, C.; Corona-Mata, D.; Risalde, M.A.; Perez-Valero, I.; Guerra, R.; Garcia-Bocanegra, I.; Rivero, A.; Rivero-Juarez, A; Garrido, J.J. Correlation of hepatitis E and rat hepatitis E viruses urban wastewater monitoring and clinical cases. Sci Total Environ Jan 15, 2024, Vol. 908, 168203. [CrossRef]
- Rački, N; Dreo, T; Gutierrez-Aguirre, I; Blejec, A; Ravnikar, M. Reverse transcriptase droplet digital PCR shows high resilience to PCR inhibitors from plant, soil and water samples. Plant Methods. 2014, Vol. 10(1), 42. [CrossRef]
Figure 1.
Viral load (Log10 GC/inh/day) observed in the WWTPs (WWTP1, WWTP2, WWTP3, WWTP4) divided according to season (autumn, spring, winter, summer) for each viral target: (a) HAdV, (b) EV, (c) NoVggII, and (d) SARS-CoV-2. Asterisk represents the statistical significance of the two-way ANOVA (* = p-value < 0.05, ** = p-value < 0.01).
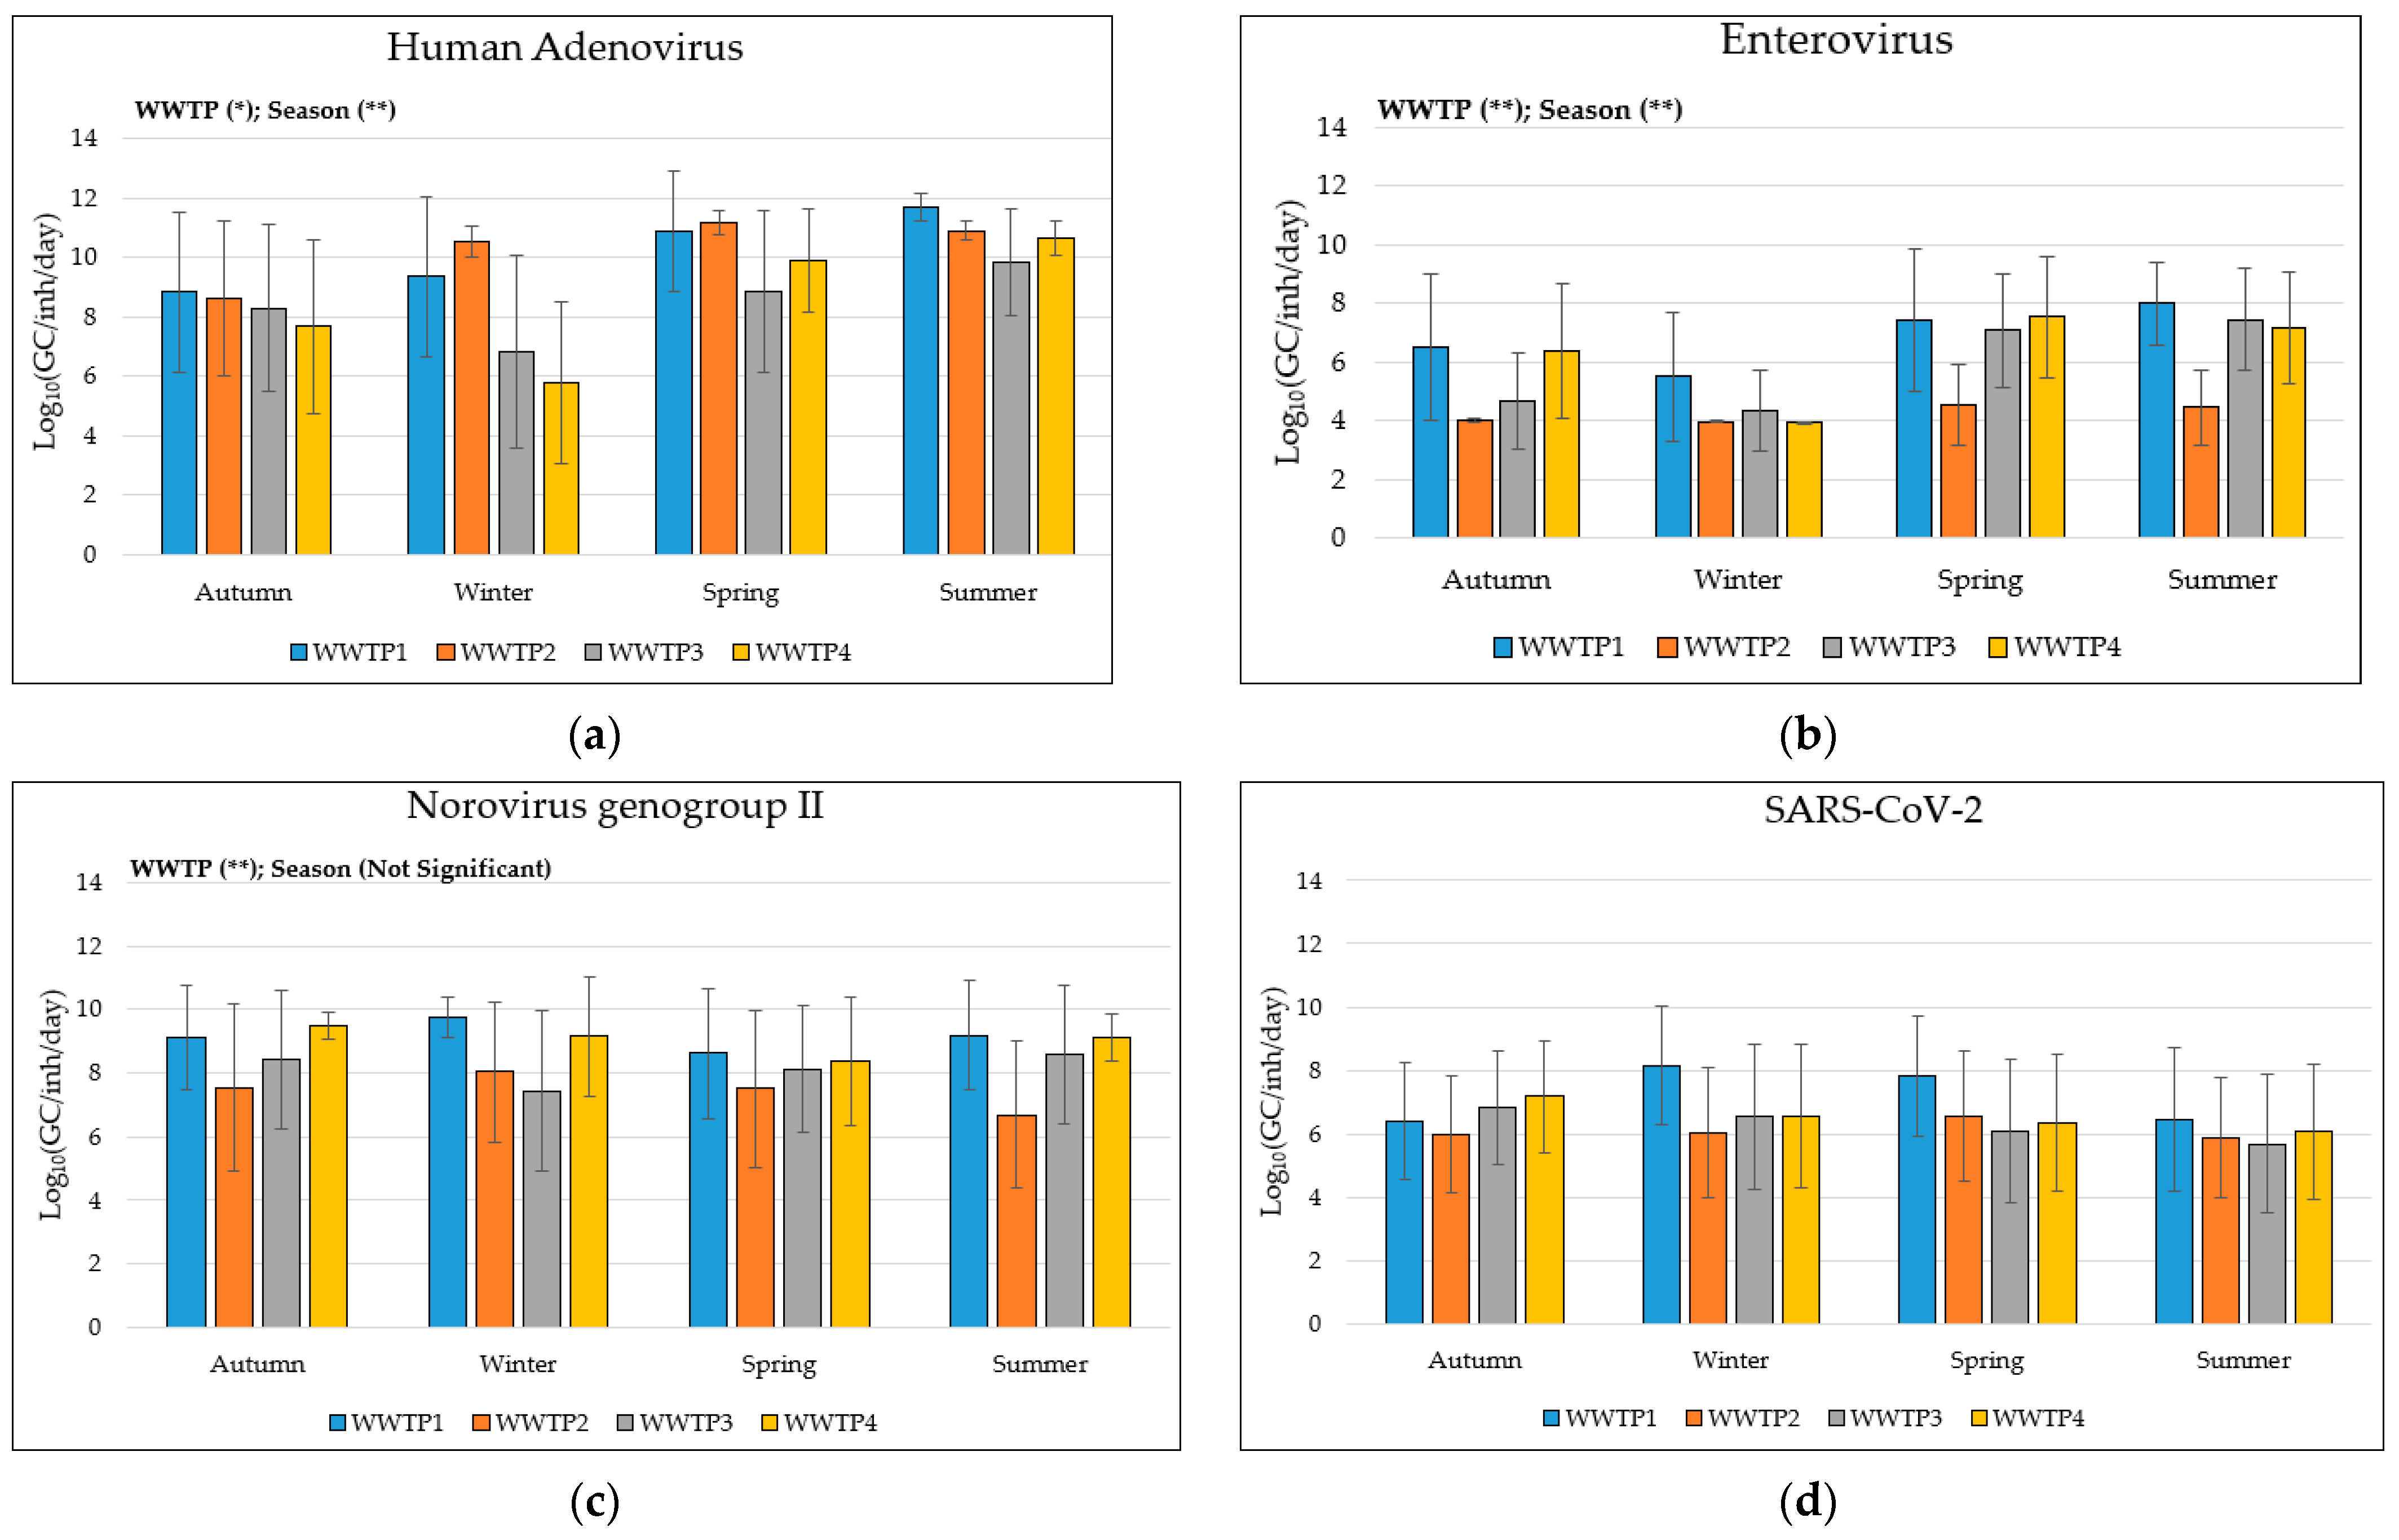
Figure 2.
SARS-CoV-2 load during the 2021 (February 2021 – September 2021) and 2022 (October 2021 – September 2022) monitoring periods. Data are represented as Log10(GC/inh/day) mean ± standard deviation.
Figure 2.
SARS-CoV-2 load during the 2021 (February 2021 – September 2021) and 2022 (October 2021 – September 2022) monitoring periods. Data are represented as Log10(GC/inh/day) mean ± standard deviation.
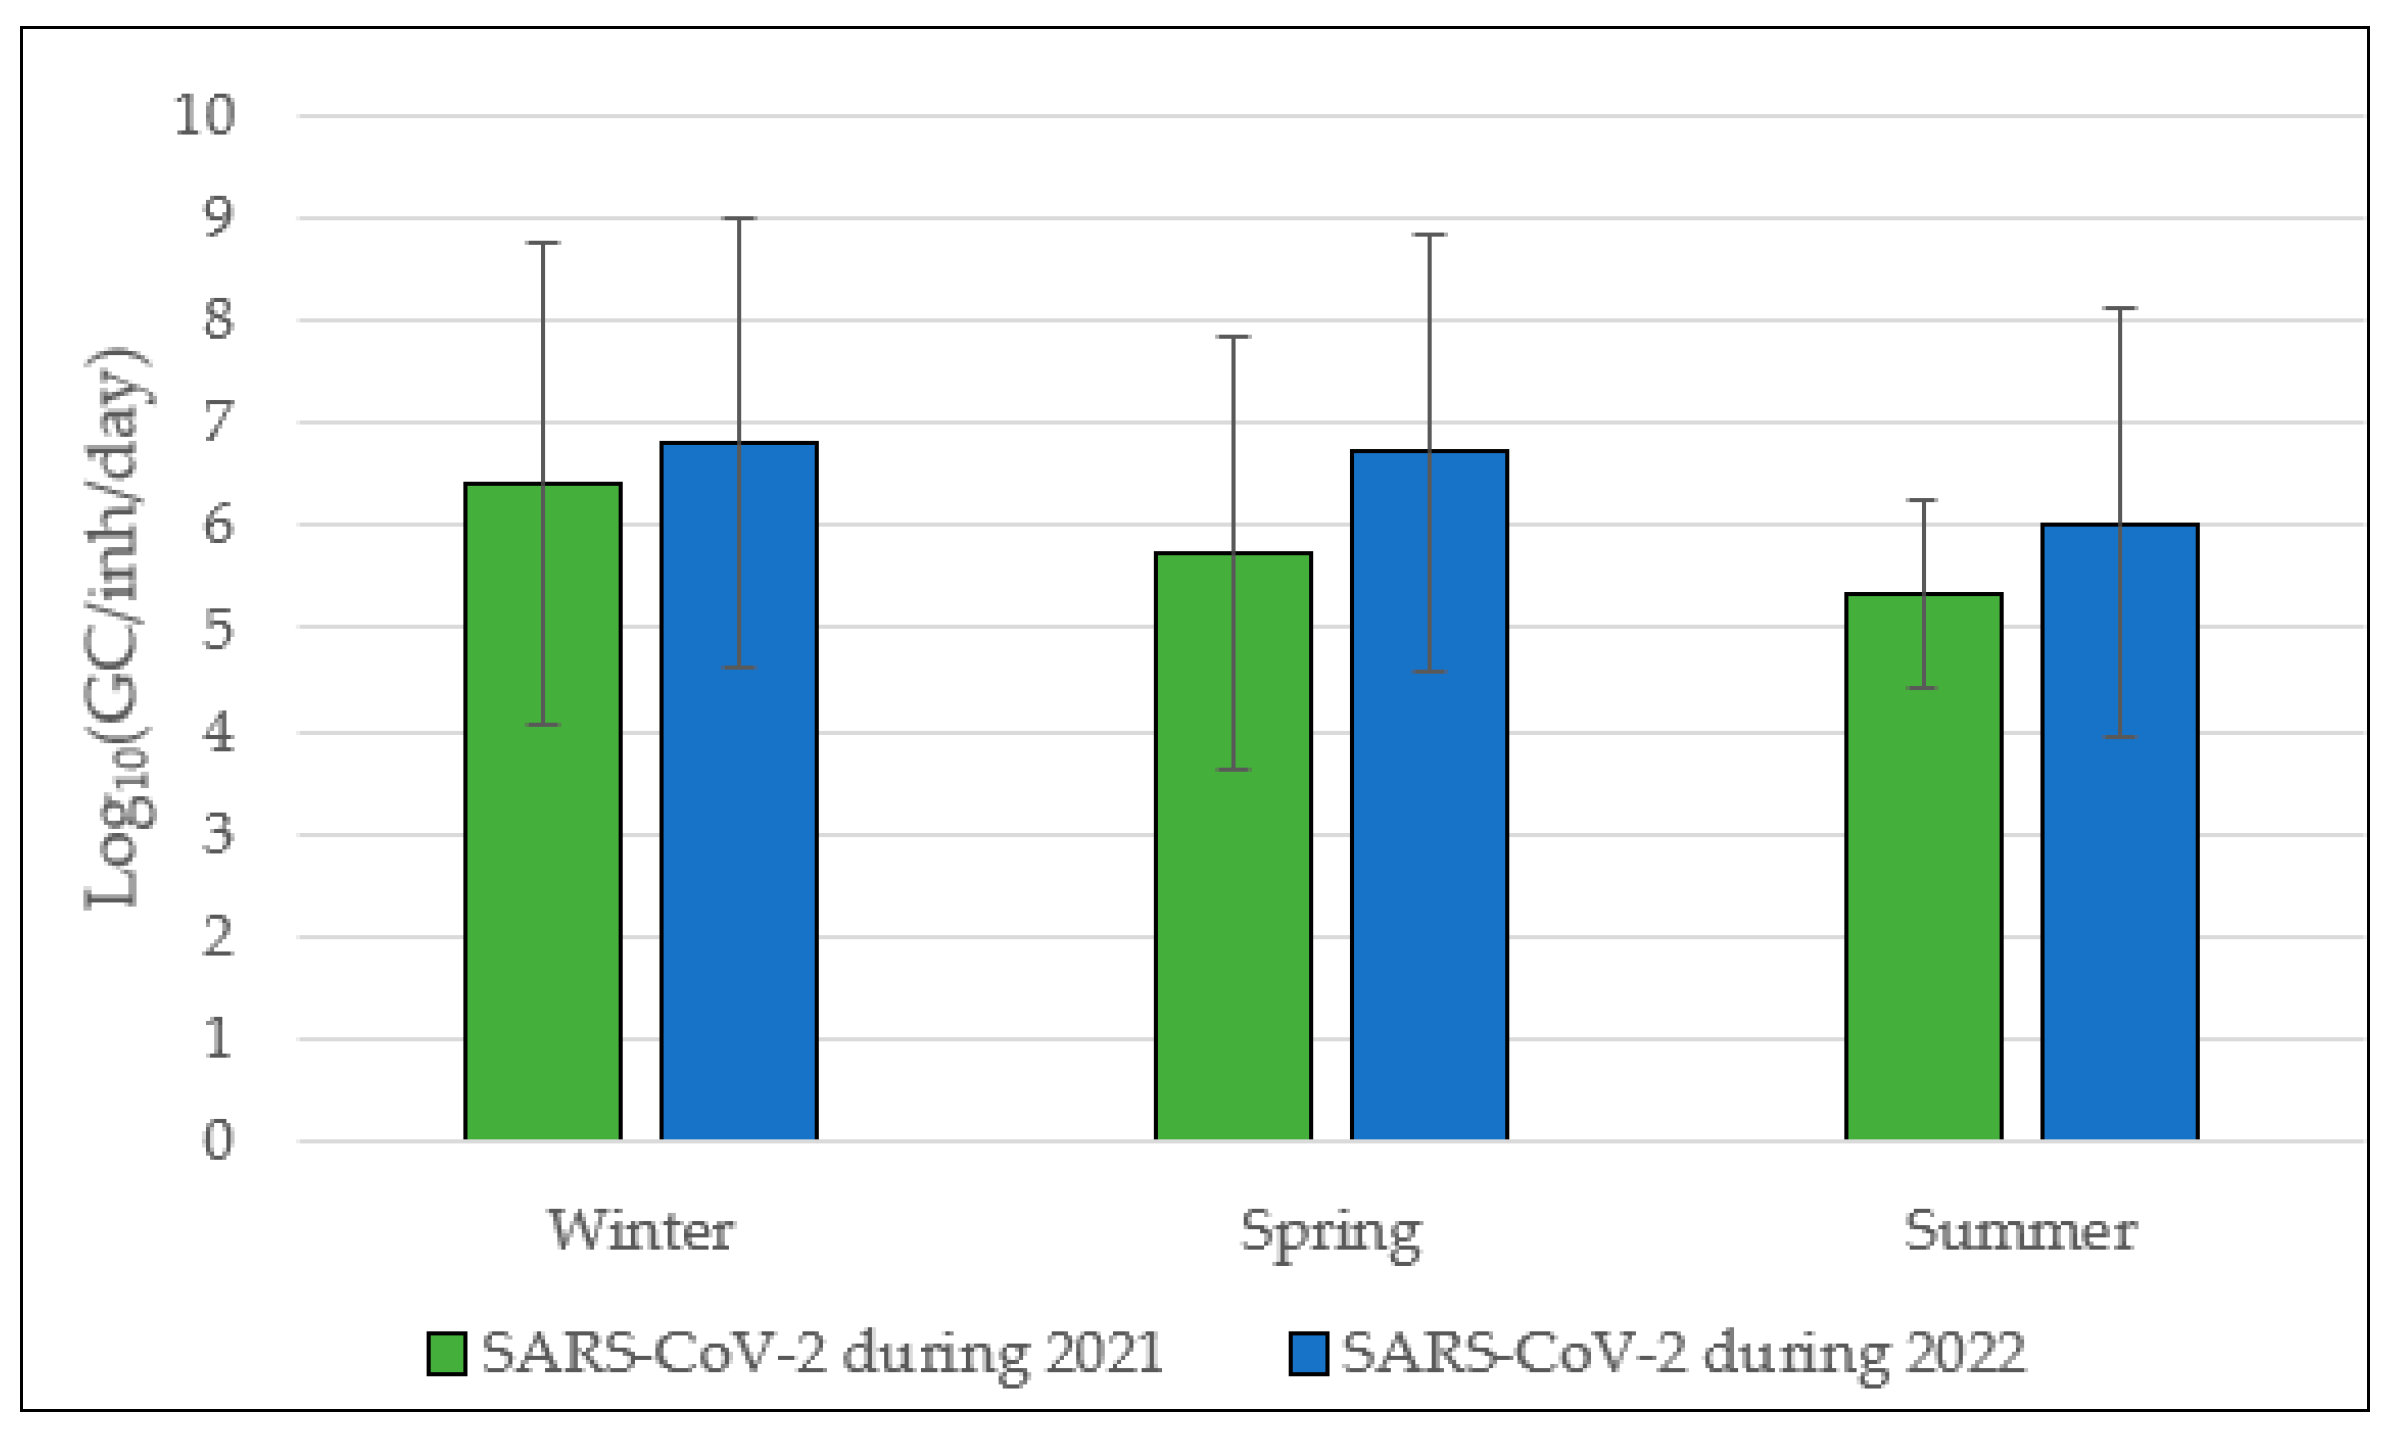

Table 1.
PCR protocols for detection of SARS-CoV-2, EV, NoVggII, and HAdV.
| Virus | Target region | Primers and Probes | Sequences (5′-3′) | Reference |
|---|---|---|---|---|
| Human Adenovirus | Ad hexon gene | AdF | CWTACATGCACATCKCSGG | [23] |
| AdR | CRCGGGCRAAYTGCACCAG | |||
| AdP1 | FAM-CCGGGCTCAGGTACTCCGAGGCGTCCT-TAMRA | |||
| Enterovirus | 5′UTR region | EVF | GGCCCCTGAATGCGGCTAAT | [24] |
| EVR | CACCGGATGGCCAATCCAA | |||
| EV | FAM-CGGACACCCAAAGTAGTCGGTTCCG-TAMRA | |||
| Norovirus ggII | ORF1-ORF2 region: RNA dependent RNA polymerase (RdRp) | JJV2F | CAAGAGTCAATGTTTAGGTGGATGAG | [25] |
| COG2R | TCGACGCCATCTTCATTCACA | |||
| RING2-TP | FAM-TGGGAGGGCGATCGCAATCT -BHQ | |||
| SARS-CoV-2 | ORF1ab region: nsp14; 3′-to-5′ exonuclease |
2297 CoV-2-F | ACATGGCTTTGAGTTGACATCT | [20,21] |
| 2298 CoV-2-R | AGCAGTGGAAAAGCATGTGG | |||
| 2299 CoV-2-P | FAM-CATAGACAACAGGTGCGCTC-MGBEQ |
Table 2.
Target viruses in the study area divided by WWTP. The viral load is reported as Log10(GC/inh/day) mean ± standard deviation. GC/inh/day = genomic copies per 100,000 inhabitants in a day.
Table 2.
Target viruses in the study area divided by WWTP. The viral load is reported as Log10(GC/inh/day) mean ± standard deviation. GC/inh/day = genomic copies per 100,000 inhabitants in a day.
| Virus | WWTP1 | WWTP2 | WWTP3 | WWTP4 | Total | |
|---|---|---|---|---|---|---|
| Human Adenovirus | Positive samples (n°, %) |
42/48, 87.5% | 45/48, 93.7% | 36/51, 78.6% | 35/50, 70% | 158/197, 80.2% |
| Viral load Log10(GC/inh/day) |
10.3 ± 2.3 | 10.3 ± 1.6 | 8.5± 2.8 | 8.6 ± 2.9 | 9.4 ± 2.6 | |
| Enterovirus | Positive samples (n°, %) |
30/48, 62.5% | 4/48, 8.3% | 24/51, 47% | 29/50, 58.0% | 87/197, 44.2% |
| Viral load Log10(GC/inh/day) |
7.0 ± 2.3 | 4.3 ± 1 | 5.9 ± 2.1 | 6.6 ± 2.2 | 5.9 ± 2.2 | |
| Norovirus genogroup II | Positive samples (n°, %) |
44/48, 91.7% | 33/48, 68.7% | 42/51, 82.3% | 47/50, 94% | 166/197, 84.3% |
| Viral load Log10(GC/inh/day) |
9.1 ± 1.6 | 7.4 ± 2.4 | 8.2 ± 2.1 | 9.1 ± 1.4 | 8.5 ± 2.0 | |
| SARS-CoV-2 | Positive samples (n°, %) |
30/48, 62.5% | 21/48, 43.7% | 22/51, 43.1% | 27/50, 54% | 100/197, 50.8% |
| Viral load Log10(GC/inh/day) |
7.2 ± 2.1 | 6.1 ± 1.9 | 6.2 ± 2.1 | 6.6 ± 2.1 | 6.5 ± 2.1 | |
Disclaimer/Publisher’s Note: The statements, opinions and data contained in all publications are solely those of the individual author(s) and contributor(s) and not of MDPI and/or the editor(s). MDPI and/or the editor(s) disclaim responsibility for any injury to people or property resulting from any ideas, methods, instructions or products referred to in the content. |
© 2024 by the authors. Licensee MDPI, Basel, Switzerland. This article is an open access article distributed under the terms and conditions of the Creative Commons Attribution (CC BY) license (http://creativecommons.org/licenses/by/4.0/).
Copyright: This open access article is published under a Creative Commons CC BY 4.0 license, which permit the free download, distribution, and reuse, provided that the author and preprint are cited in any reuse.


