Submitted:
09 February 2026
Posted:
10 February 2026
You are already at the latest version
Abstract
Climate variability and change pose major challenges to agriculture worldwide amid an increasing world population and growing food demand. This study assessed the effects of climate variability on rice production in Liberia. Rice yields and production data (1990-2023) were attained from the Food and Agriculture Organization Statistics (FAOSTAT), while temperature and precipitation were sourced from ERA5 Agrometeorological Indicators and the Climate Hazards Group InfraRed Precipitation with Station (CHIRPS). Trends and relationships were analyzed using Mann-Kendall, Sen’s slope, and Spearman’s rank correlation. Multiple Linear Regression assessed climate variables’ impact on rice productivity. Mean, minimum, and maximum temperatures increased by 0.57 °C, 0.55 °C, and 0.55 °C, respectively, with precipitation variability at 180.31 mm. Climate variables showed diverse correlations with rice production; a significant negative impact of minimum temperature (p- value = 0.015) on production and a positive effect of precipitation on yields (p- value = 0.036). Farmers acknowledged climate impacts and adopted adaptation strategies, but resilience is hindered by limited credit access, low technology adoption, reliance on traditional practices, and inadequate extension services. Overall, the findings highlight the sensitivity of rice production in Liberia to climate variability and underscore the need for guided adaptation and institutional support to augment farmer resilience.
Keywords:
rainfall variability
; food insecurity
; agriculture
; adaptation strategies
; rice productivity
; climate change
; Mann-Kendall test
; trends
; temperature
1. Introduction
Climate variability and change, including alterations in climate variables, such as rainfall and temperature, have significant implications, particularly on climate-sensitive sectors such as agriculture [1,2,3,4]. This paper looks at the agriculture sector with focus on the impacts of climate variability on rice production and productivity in Liberia. Among crops, rice is of primary importance. It is a staple food in many regions across the globe; is impacted by climate change, as it is heavily dependent on climatic factors such as temperature and precipitation for growth and development [5,6]. Past studies [7,8,9] have revealed that temperature increases during the reproductive stage of rice, especially during panicle initiation, flowering, and fertilization, may severely reduce yield and grain quality. Ref. [9] found that an increase of 1 °C of temperature above the optimum threshold reduced the yield by 8%. On the other hand, studies found that for every 100 mm increase in precipitation above the optimal thresholds, resulted in rice yield decreased by 6.4 kg in India [10]. Similarly, Ref. [11] employed the Decision Support System for Agrotechnology Transfer (DSSAT) Model to examine rainfall impacts on rice yield, and they found that an increase in daily mean rainfall of +1mm to +2mm above threshold, had a decreased yield by -4.0% to -51.5% in Malaysia.
Research on rice should be considered a must. Rice is the primary cereal food for over 60% of the global population; it is produced in many countries, with Asia accounting for more than 90% of its production and consumption worldwide [12]. In Africa, rice is one of the major sources of calories [6,13] and is gradually becoming a staple food and income source in many Sub-Saharan African (SSA) countries [6]. In SSA, the annual rice consumption between 2009 and 2019 was 27.4 million metric tons while average production was estimated at 15.4 million metric tons [14]. The demand for rice is continuously rising in the region, due to population increase and urbanization, but production remains low to meet the demands of the consumers [15,16].
In Liberia, rice is produced by approximately 69% of all farmers and accounts for about 50% of adult caloric intake; the annual per capita consumption is estimated at around 133 kg [13]. This makes rice one of the most important crops for food security and economic livelihood in the country; however, domestic rice production is inadequate to satisfy its national demands [17]. For instance, referring from past years, production reduced by 20.55% (from 257,995 metric tons in 2018 to 170,000 metric tons in 2021), which led to substantial imports (560,000 metric tons in 2021). These imports cost over USD 100 million and accounted for approximately 65% of the total consumption [17], an enormous amount for least developed countries such as Liberia. These reductions may be attributed to several factors [18,19].
Over the past three decades, Liberia has experienced shifts in climate patterns, including rising temperatures, irregular rainfall, and increased frequency of extreme weather events such as floods and droughts [20,21]. Given that Liberia depends solely on rainfed agriculture, these changes, as mentioned previously, have direct and indirect impacts on crop productivity, particularly rice, which has specific climatic requirements for optimal growth. This situation is compounded by the fact that about 70% of the Liberian population depends on agriculture and forestry for their livelihoods and the overall significant contribution of agriculture to the country’s economy [19,22]. It is within this context that the present study looks at the interplay of climate variability and rice production and productivity in Liberia. Hence, it is essential to assess how climate variability affects rice production to understand the issue and suggest strategies to improve resilience and food security in the country. For instance, Ref. [23] conducted a study on assessment of the impacts of climate variability and change on rice production in Bong County and [24] worked on accessing the Perception of climate change and barriers to strategic adaptation for smallholder farming in Todee District in Liberia. Similarly, recent studies carried out by Ref. [25] who worked on assessment of climate risks in central and northern Liberia. The studies mentioned above examined smaller geographic areas within the country, but there has been no comprehensive study on the relationship between climate variability and rice yield in the entire country. Another authors, [19] conducted a systematic review but their focus was on assessing the impact of climate change on Liberia’s agricultural sector and strategic adaptation approaches. Given the limited research on this topic, the connections between climate variability and rice production across the entire country have not been extensively explored. Most studies have concentrated on specific regions. Therefore, this study aims to evaluate the effects of climate variability on rice production in Liberia from 1990 to 2023.
Specifically, this study aims to determine trends in rice production and yield in Liberia from 1990 to 2023, examine patterns and changes in key climate variables (precipitation and temperature) and assess the association and statistical relationship between climate variables and rice productivity. The goal of this study is to provide valuable insights to formulating appropriate agricultural policies and practices that enhance adaptive capacity, inform agricultural extension services, support climate-resilient agricultural development, and guiding policy frameworks addressing climate hazards.
2. Materials and Methods
2.1. Description of the Study Area
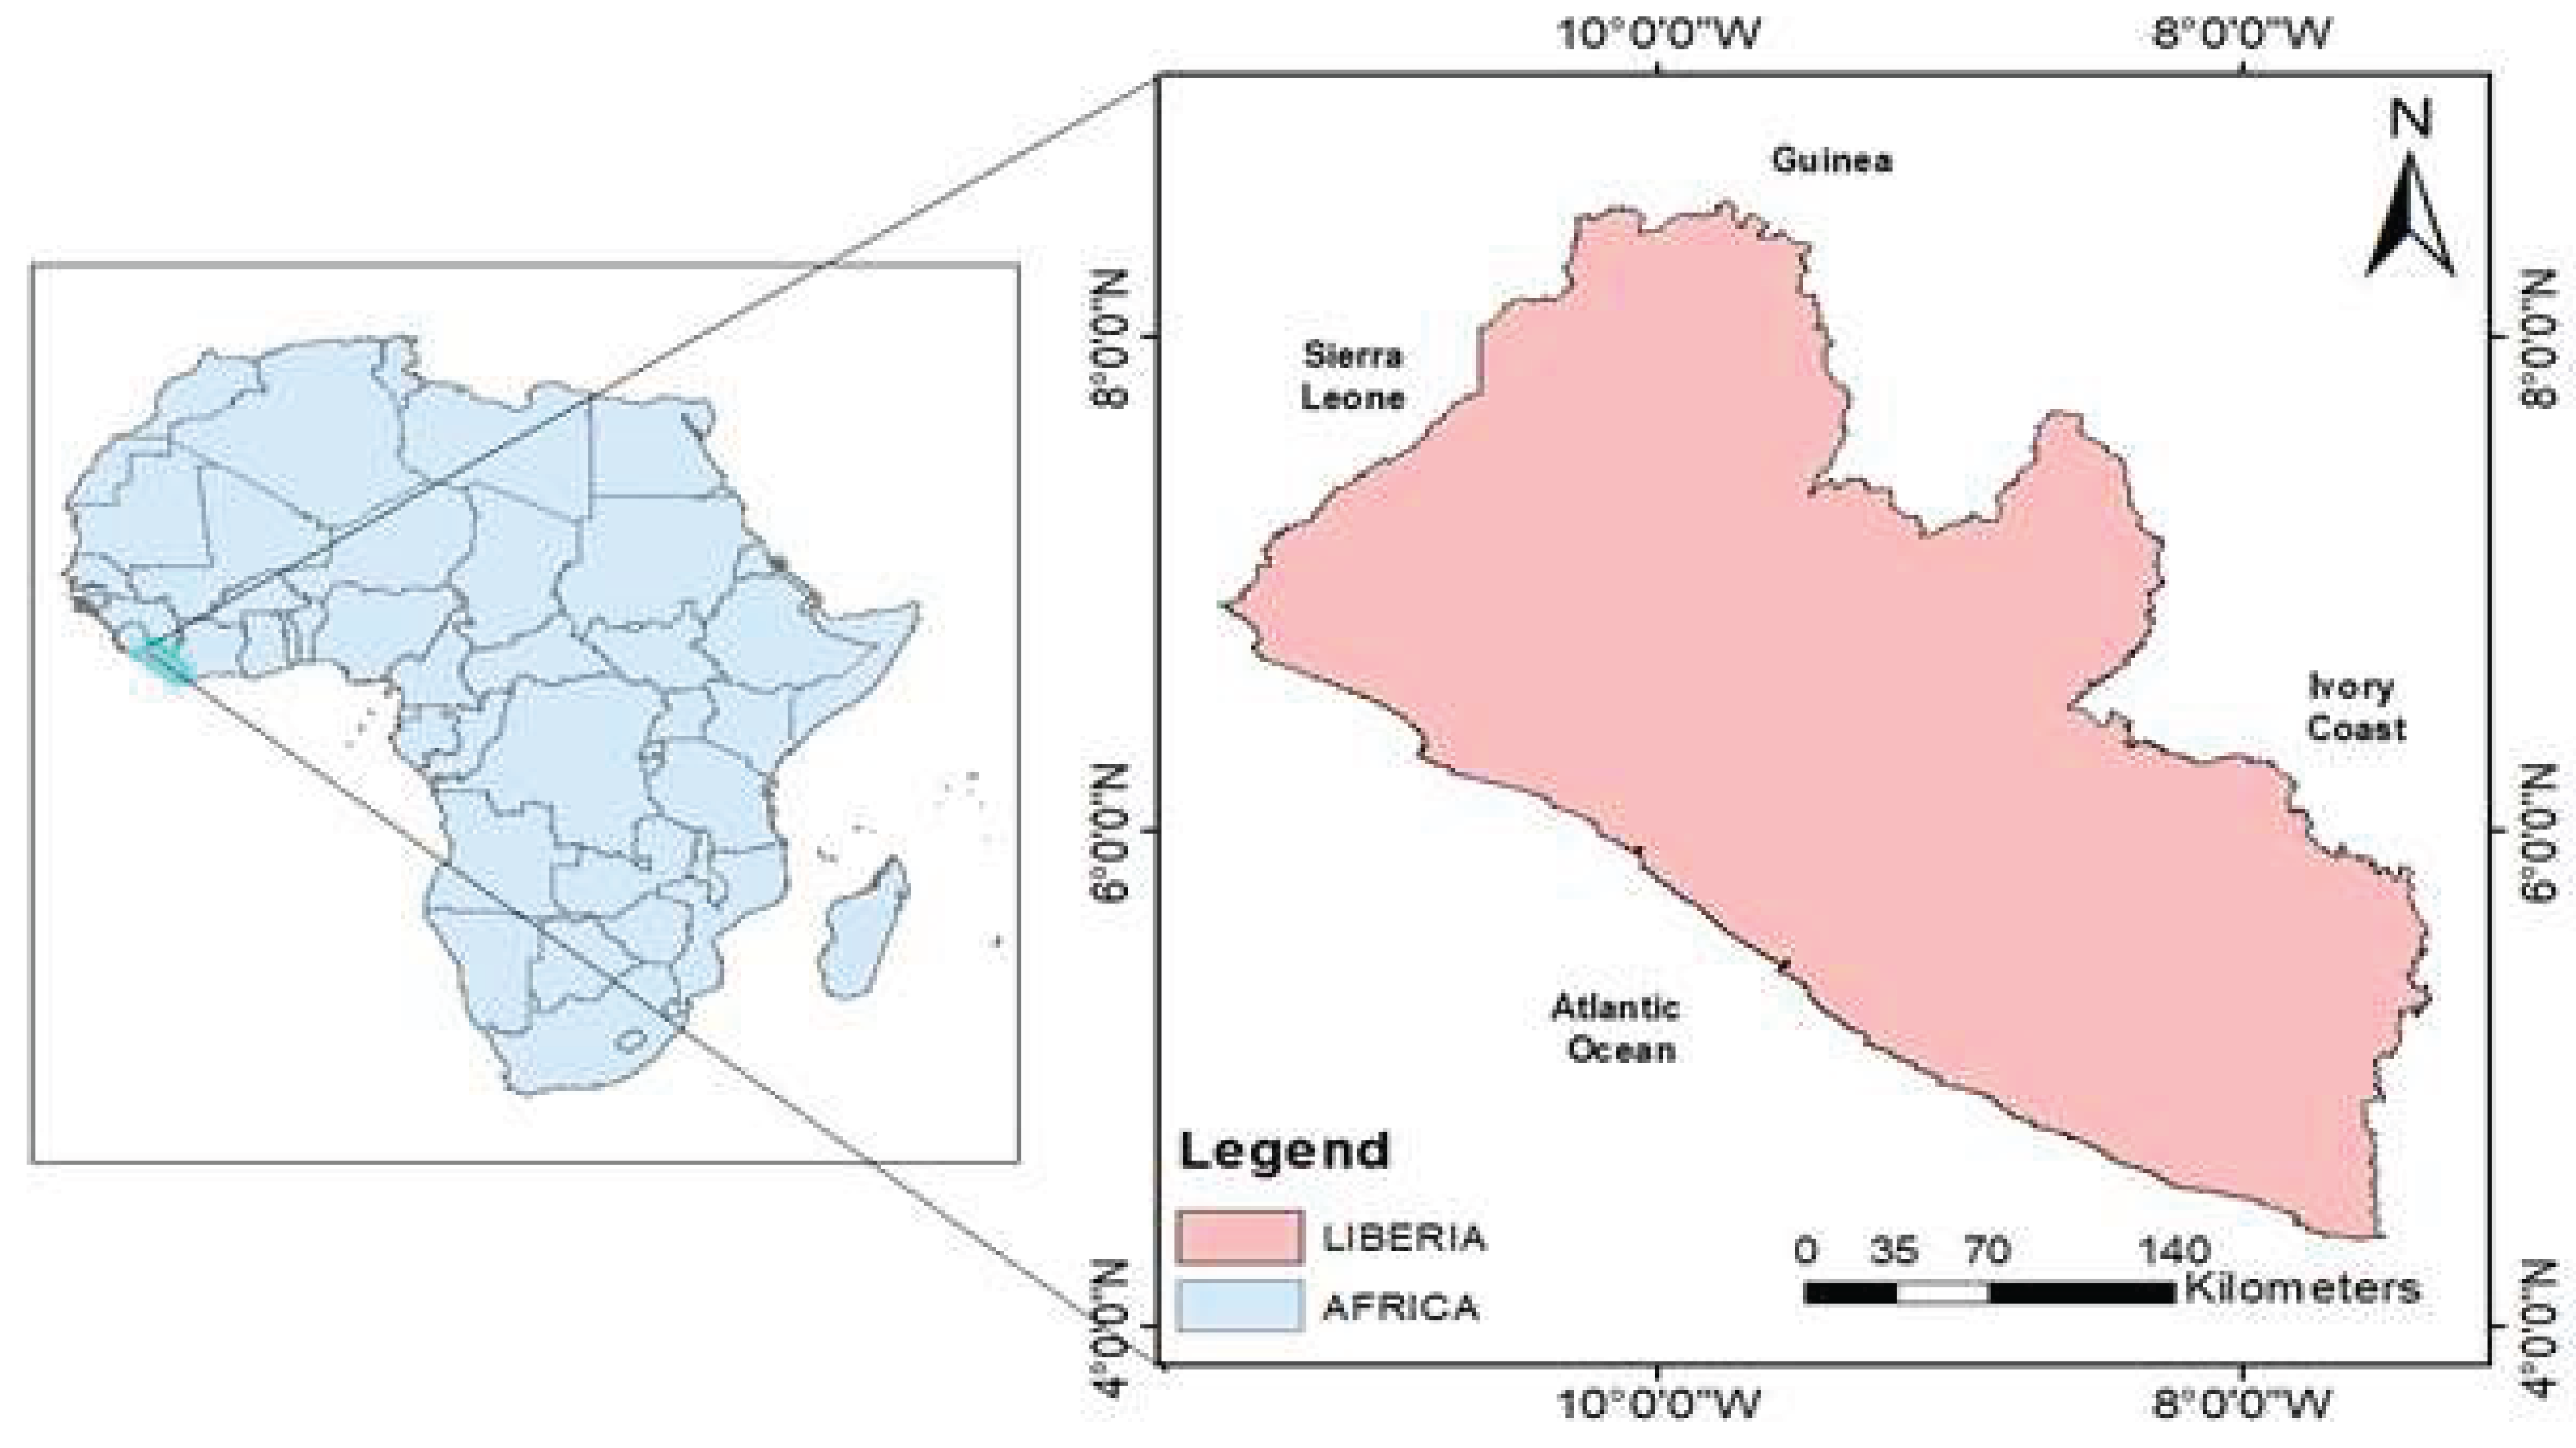
The study uses data referring to Liberia. Liberia is bordered by Sierra Leone on the west, Guinea to the north, Côte d’Ivoire (Ivory Coast) to the east, and the Atlantic Ocean to the South. It covers a total area of 111,350 km² and has a total population of 5.3 million inhabitants [26]. Liberia lies at latitudes 4° 20’ to 8° 30’ North and longitudes 7° 18’ to 11° 30’ West [27]. The study area has a tropical climate, characterized by a rainy season that runs from May to November and a dry season from December to April. The average annual precipitation ranges from 2,500 mm to 5,000 mm per year [27], while temperatures fall between 23 °C and 33 °C [28]. Relative humidity reaches 90%-100% during the rainy season and 60%-90% during the dry season [29]. Agriculture is the major source livelihood to the country’s population and remains a major contributor to Liberia’s economic development. However, rice is one of the most cultivated crops and its production in the study area is predominantly practiced by subsistence farmers under rainfed conditions.
Figure 1.
Location of the study area.
2.2. Study Design and Data Collection
The study uses a secondary data approach. It is based on datasets sourced from three major websites, namely the Food and Agriculture Organization Statistics (FAOSTAT) database, the ERA5 Agrometeorological Indicators covering a period from 1990 to 2023, and the Climate Hazards Group InfraRed Precipitation with Station data (CHIRPS) database referring to the same period. Details on data follow below.
2.2.1. Rice Production Data
Data for rice productivity (paddy) (kilogram/hectare –kg/ha), and production (in Metric ton –MT) from 1990- 2023 (34 years) was collected from FAOSTAT open data (https://www.fao.org/faostat/en/#data/QCL). This data was sorted and prepared on an Excel sheet, and then analyzed against climate datasets.
2.2.2. Climate Variables (Temperature and Precipitation)
Temperature data (oC) from 1990 to 2023 was obtained from ERA5 Agrometeorological Indicators, (available online at https://cds.climate.copernicus.eu/datasets/reanalysis-era5-single-levels). Its horizontal resolution is 0.1° X 0.1°. Precipitation data (mm) covering the period of 1990-2023 was sourced from the CHIRPS store (https://data.chc.ucsb.edu/products/CHIRPS-2.0/). CHIRPS integrates the Climate Hazards Precipitation climatology (CHPclim) and in-situ station data to create gridded rainfall time series with 0.05° resolution, for trend analysis and seasonal drought monitoring [32,33]. Projection data on temperature and precipitation were sourced from the CORDEX (Coordinated Regional Climate Downscaling Experiment), available at: https://esg-dn1.nsc.liu.se/search/cordex/. The dataset contains a spatial resolution of 0.22° X 0.22° (~25 km). Both projection datasets (temperature and precipitation) were based on two different time periods (RCP8.5, 2031-2060, and RCP8.5, 2071 to 2100), were accessed in NetCDF format and then processed in ArcGIS 10.8 environment. All climate data sets, including temperature and precipitation were considered based on six (6) months seasonal timescale (April to September), the key considerable period for rice production stage in the study area.
2.3. Data Analysis
Data analysis followed a stepwise approach. Firstly, we pre-processed the raster dataset of the climate factors (temperature and precipitation) from ERA5 and CHIPS in ArcGIS 10.8 environment to generate spatial outputs (numerical values), which were then inputted in Excel spreadsheet. These data were used to plot the trends in variables (production and yield, and precipitation and temperatures), compute various analysis such as trends, correlation, and regression analysis. Climate projection data was processed to produce a spatial map to depict the change in each variable under the considerable time periods.
2.3.1. Detection of Trends
The non-parametric Mann-Kendall (Mk) and Sen’s Slope tests were applied to identify the trend in various parameters including production, yield, and precipitation and temperature [34]. The Mann-Kendall test is more favored for identifying monotonic trends in variables as it remains unaffected by outliers [34,35]. Apart from being robust to outlier, the MK test, its non-parametric nature also means that it does not depend on regularly distributed data [36]. It compares all pairs of observations in the dataset, assesses the direction of the trend (increase or decrease), and then tests its statistical significance.
In order to test whether or not to reject to reject the null hypothesis, the MK test was used, where we apply Equation (1) and (2):
H0.
This considers no monotonic trend present in the series.
Ha.
This suggests the present of monotonic trend in the series.
At a 5% significance level, a p -value of less than 0.05 results to the acceptance of the alternative hypothesis, indicating a trend exists in the data. Conversely, if the p -value is greater than 0.05, the null hypothesis (H0) is accepted, suggesting non-existing of trend in the data [37]. The test statistic, S, was subsequently computed as sum of the integers:
where n indicates the number of years, xj and xi are the annual values in the years j and k, respectively. The function sgn(xj – xi) provides an indicator function that takes the value 1, 0, or −1 according to the sign of the difference (xj – xi); where j > i:
A positive value of shows an upward (increasing) trend in the time series, while a negative value indicates a downward (decreasing) trend.
However, Sen’s slope was computed, a non-parametric technique for estimating the overall slope or trend of a dataset over time. It is mostly suitable when analyzing time series data [38]. It is a method that is more robust in trend estimation and it is especially advantageous for data that do not assume normality or contain outliers [35,38]. The slope estimator or N pairs is computed as follows:
where xj and xk denote the annual values throughout the years j and k, respectively. The Sen’s slope estimator of slope is calculated as the median pairwise slope values (Q). The median of the N slope estimates was obtained in by simple averaging. N values of Qi were ranked from smallest to largest and the Sen’s estimator was computed as follows:
In this study, we considered the trend is statistically significant when the p-value is less than 0.05. Time series analysis was employed to evaluate the trend in rice production, yield, mean seasonal rainfall and temperatures (mean, minimum, and maximum temperatures), for the period 1990 to 2023. Several time-series plots were generated using Microsoft Excel based on the following variables: rice production, yield, precipitation, mean temperature, minimum temperature, and maximum temperatures, respectively.
2.3.2. Correlation Test
The Spearman’s rank correlation test was applied for estimating the monotonic relationship between production statistics (production and yield) and climate parameters, which in this case are mean temperature, minimum temperature, maximum temperature, and precipitation, respectively. During the correlation analysis process, at first, we computed a general correlation test to find the relationship of rice production and yield with climatic variables from 1990 to 2023, followed by a particular time interval correlation test to identify the association of production and yield statistics to climatic variables during the period where rice production and yield trends displayed significant reduction in the time series. The formula used in determining the Spearman’s correlation is shown below:
where i represents the differences in paired ranks, that is, i = Rxi – Ryi and n was the total number of observations, which is 34 observations for the study area. The value of ρ lies between −1 and 1 and direct associations were indicated by positive values, whereas inverse associations were indicated by negative values.
2.3.3. Regression Analysis
Following the correlation analysis, multiple linear regression (MLR) was utilized to evaluate the combined relationship or impact of climate parameters and rice productivity [39]. The MLR model is defined by equation 6. Main temperature was excluded from the regression analysis based on its correlation with minimum temperature and maximum temperature.
where:
Yt: Dependent variable (rice production in t/ha, or yield in kg/ha)
Prec: Average precipitation (mm)
Tmin: Average mini temperature (°C)
Tmax Maximum temperature (°C)
β0: Intercept baseline (rice yield when all predictors are 0)
β1, β2, β3: Regression coefficients (effect of each predictor on rice production and yield)
ε: Error term (unexplained variability).
The R Software (Version 4.3.1) was used to perform the statistical and regression analysis, and the results were considered significant at a 0.05 probability level.
3. Results
3.1. Rice Production Trend
Rice production in Liberia has shown significant increase over the past 34 years (1990-2023). The Mann Kendall test shows that this upward trend is statistically significant (p-value < 0.001) (Table 1). Total production increased from 180,000 tons in 1990 to 256,200 tons in 2023 representing a gain of 76,200 tons over the period. The Mann–Kendal Coefficient (τ = 0.510) showed a moderate to strong positive trend of rice production over time (Table 1, Figure 2). This is further supported by the MK-statistics (Z = 4.212), indicating the existing of a monotonic increasing trend. Sen’s slope estimates of 6515 also confirms a substantial annual rate of increase in rice production across the study period. Despite the general positive trend, rice production exhibited notable inter-annual fluctuations during some periods (Figure 2). For instance, between 1990 and 1995, production declined noticeably, followed by an increase from 1995 to 1998. A decreasing phase occurred between 1998 and 2003, after which production recovered sharply from 2006 to 2008. From 2008 to 2012 production remained relatively stable, showing only minor fluctuations. A consistent growth phase was observed from 2014 to 2016, followed by a short-term decrease between 2016 and 2017; while 2017 to 2023 remained relatively stable (Figure 2).
3.2. Rice Yield Trend
Overall, between 1990 and 2023, rice yields have remained relatively stable, showing no statistically significant increased over time. The Mann-Kendall Tau coefficient (τ = - 0.0036) depicts extremely negative weak decrease (Table 1). However, the corresponding p-value (p-value =0.9882) confirms that this correlation is not statistically significant. Similarly, the MK-statistics (Z = - 0.0148) supports the absence of a monotonic trend in rice yields. Sen’s slope estimates of 0 further supports the lack of any significant change in yield during the study period (Table 1).
Despite the overall stability, rice yields exhibited fluctuations across different sub-periods (Figure 3). Between 1990 and 1991, yield slightly decreased from approximately 1030 kg/ha to 900 kg/ha. From 1992 to 2000, yields moderately increased from 900 kg/ha to 1,250 kg/ha. This was followed by a sharp decline between 2000 and 2003, when yields dropped to approximately 800 kg/ha. A strong recovery occurred from 2003 to 2008 with yields rising to 1550 kg/ha. However, a sudden drop to 1200 kg/ha was observed in 2009. From 2012 to 2017, yields experienced a gradual decline, decreasing from 1280 kg/ha to 1050 kg/ha while from 2017 to 2023, rice yield remain relatively stable (Figure 3).
3.3. Patterns of Climatic Variables
3.3.1. Precipitation Trend
Between 1990 and 2023, annual precipitation exhibited a slight but statistically non-significant increasing trend (p-value = 0.464). Over the study period, total annual rainfall increased from 3160.66 to 3340.97 (with a slight increase of 180.31 mm, p-value = 0.464). Despite this modest upward tendency, the data reveal substantial inter–annual variability. In particular, during the following years, the periods between 1994 to 1996, 2005 to 2006, and 2009 to 2010, were characterized by pronounced fluctuations, including years with both exceptionally high and low rainfall anomalies (Table 2, Figure 4). During the period of 2003 to 2005, 2011 to 2012, and 2019 to 2022, there exhibited a slight decrease in precipitation and with a prominent decreased from 2008 and 2009 (Figure 4). Overall, the Mann–Kendall Tau coefficient (τ = 0.102) indicates a very weak positive association between annual precipitation and time, values fluctuate randomly. This observation is supported by MK statistic (Z = 0.830) and the Sen’s slope estimate of 5.144, which suggest a slight upward trend. The non-significant p-value (p-value = 0.464) confirms that no major long – term trend in precipitation occurred between 1990 and 2023.
The supplementary materials labeled Figure S1, depicts projected precipitation for mid-century (2031-2060) with that of the end-century (2071-2100). These projection results of precipitation for instance, RCP8.5 2031-2060 revealed a variability with lower value of 937.51 mm and highest of 4072.29 mm (see Figure S1a, supplementary materials), while RCP8.5 2071-2100 demonstrated a variation from 843.98 mm and highest of 3801.95 mm, respectively as shown in the supplementary materials (Figure S1b). The long-term average variability in seasonal precipitation from mid-century to the end of the century is expected range from -93.56mm to -240.34 mm as depicted in supplementary materials (Figure S1a, b).
3.3.2. Temperature Trends
From 1990 to 2023, mean, minimum, and maximum seasonal temperatures all showed an overall increasing trend. The mean temperature rose from 25.73 °C to 26.30 °C, representing an increase of 0.57 °C (p-value < 0.001) (Figure 5a). Similarly, the minimum temperature increased from 24.76 °C to 25.31 °C (an increase of 0.55 °C, p-value is < 0.001) (Figure 5b) while the maximum temperature rose from 29.19 °C to 29.76 °C (an increase of 0.55 °C, p-value = 0.023) (Figure 5c). The Mann-Kendall Tau coefficients for mean, minimum, and maximum temperatures were 0.511, 0.509, and 0.277, respectively, indicating weak to strong increasing trends over the study period. These findings suggest that the upwards trend was more pronounced in the mean and minimum temperatures, followed by maximum temperatures. Although the increases were relatively small in absolute terms, the Sen’s slope estimates of these variables are as follow: mean temperature (0.119), minimum temperature (0.0125), and maximum temperature of 0.0075, further confirm the presence of gradual warming across all temperatures indicators during the study period (Figure 5a-c).
Figure S12 within the supplementary materials shows projection result of temperature for mid-century (2031-2060) and end-century (2071-2100). Results of the RCP8.5 for temperature of 2031-2060 revealed a significant increasing changes ranging from 24.20 °C to 27.25 °C at the middle-century, with an estimated increase of 3.03 °C (Figure S2a of the supplementary materials), and Figure S2b of the supplementary materials demonstrates the 2071–2100 RCP8.5 interpolation demonstrated a change from 25.95 °C to 28.74 °C in temperature, indicating an absolute increase of 2.7 °C during the time period. This means that the combined projected change in temperature from 2031 to 2100 is expected to reach at 4.54 °C (S2a, b).
3.4. Temperature and Precipitation Impact on Rice Productivity
3.4.1. Correlation
Correlation analysis suggest that the current state of climate variables in Liberia (precipitation, and mean, minimum, and maximum temperatures), do not significantly affect rice production over the study period, as p-values were 0.956, 0.082, 0.531, and 0.908, respectively. Precipitation shows a non-statistically significant negative relationship with production and positive association with yields (Table 3).
Similarly, rice yield (tons/hectare) also shows no statistically significant associations with climatic factors (p-value > 0.05). Although there is an observed weak positive correlation with precipitation (r = 0.259), this may signify that higher rainfall tends to slightly favor rice yield, even though not strongly enough to be statistically significant. Rice yield also shows a negative correlation with mean and minimum temperatures (Table 3), suggesting that higher temperature may negatively effects yield in the study region even though the association is not statically significant, as p-value greater than 0.05.
Considering the correlation results across different timescales for both rice production and yield revealed that most climate parameters exhibited statistically non-significant relationship with rice productivity over the various periods analyzed. An exception was observed for the minimum and maximum temperatures during the 1998-2003 period, which showed a highly significant correlation with production (p-value < 0.001) (Table 4). For rice yield, significant associations were identified for mean and minimum temperatures during 2000-2003, and for precipitation during 2003-2005 with p-value less than 5%. Additionally, during the period 2012 to 2023, mean temperature (p-value = 0.004), minimum temperature (p-value = 0.036), and maximum temperature (p-value = 0.002) exhibited significant correlations with rice yield (Table 4).
3.4.2. Regression
The regression model relating rice production and climate variables indicated that climate variables influence rice production in Liberia, explaining 26.16% of the total variation (R² = 0.2616, p-value = 0.026). Among the climatic variables analyzed, minimum temperature was the only factor that showed a statistically significant negative effect on rice production (β = 2.676; p-value = 0.015), indicating that higher minimum temperatures are associated with reduction rice production in Liberia (Table 5).
On the other hand, the regression results of rice yield against climate parameters revealed a positive relationship between the observed and predicted values (R2 = 0.231) (Table 6). Approximately 15.4% of the variation in rice yield was explained by the independent variables, as indicated by the adjusted R2 of 0.154 and a model p-value of 0.046, which is less than 0.05, thus confirming the statistically significance of the model. Considering the various climatic variables evaluated, the analysis revealed that only precipitation displayed a statistically significant positive effect on rice yield (p-value = 0.036) as shown in Table 6, suggesting that higher rainfall contributes to increased rice productivity in Liberia.
4. Discussion
4.1. Rice Production Trend
The Mann-Kendall and Sen’s slope test results demonstrate that rice production has had a significant increasing trend over the study period (1990-2023) despite the variation in production across different time intervals. This noticeable increase in production in the study area aligns with regional agricultural reports and studies that have documented a gradual increased in rice output in West Africa due to expansion of cultivation and government programs promoting rice self-sufficiency [40,41]. Refs. [14,42] also indicated that increase in production in the SSA region is typically due to the expansion of rice harvested area and, not referring to as yield. For instance, between 2000 and 2020, the harvested area rose from 6.9 million ha to 16.6 million ha, while the increase in rice yield was relatively low, increasing from 1.7 to 2.1 t ha−1 [16], supporting the fact that the increase in rice productivity is dissimilarity to the increased actual yield.
4.2. Rice Yield Trend
Despite increases in total rice production in Liberia, rice yields have remained stagnant, indicating no significant trend. This implies that the observed rise in total rice production is predominantly driven by land expansion rather than improvements in productivity per unit area [16]. Recent studies noted that Liberia’s average national rice yield has remained low in recent decades, at around 1.2 metric tons per hectare, which is considerably lower than in other West African countries, 3.0 t/ha in Côte d’Ivoire, 2.7 t/ha in Ghana, 3.4 t/ha in Mali, and 4 t/ha in Benin, respectively [31,43]. Several underlying factors account for this stagnation in yield. These include traditional farming systems (with a reliance on rainfed production), the use of low-yield varieties, limited use of modern inputs such as improved seed, fertilizers, mechanization, limited access to farm credit, and climate change [13,19,31]. Reports from Ref. [44] and the World Food Programme, [45] indicate that yield improvements in Liberia and other West African countries have been constrained by limited access to improved rice varieties, irrigation technologies, inadequate used of fertilizers, and limited extension services. Farmers often rely on traditional practices and local seed varieties, which are less responsive to modern yield-enhancing technologies, thus limiting productivity growth per hectare [16,46].
4.3. Trends in Climatic Variables
4.3.1. Precipitation Trend
The results of the Mann-Kendall test showed a non-significant upward trend in precipitation during the study period, reflecting high variability in rainfall patterns. Although rainfall during the growing season showed a slight increase, this change was not statistically significant. However, the absence of a statistically significant trend in seasonal rainfall totals does not necessarily imply stability or reliability in rainfall distribution. For example, intra-seasonal variability including delayed onset of rains, mid-season dry spells, and early cessation, remains a critical constraint on planting dates decisions and ensuring stable crop development [47]. Such irregularities are often masked by long-term trend analysis but exert significant influence on productivity outcomes [48]. This finding aligns with rural agricultural communities’ increasing understanding of changes in local climate conditions, particularly regarding rainfall onset, duration, and distribution, as well as changes in temperatures patterns, which directly affect rice planting and harvesting dates [23,28]. Studies across West Africa [47] have shown that intra-seasonal rainfall variability has greater implications for yield stability than annual rainfall totals. Moreover, interpolated projection of precipitation under different scenarios of RCP8.5 2031-2060 and RCP8.5 2060-2100 revealed a strong variability in precipitation, indicating an average projected decrease in precipitation by -93.56mm to -240.34 mm as shown in the supplementary materials (Figure S1 a, b). These variabilities would hinder farmers production practices, including change in planting calendar, crop type, and management practices, which may result to low productivity [49]. Thus, while current rainfall levels in Liberia remain relatively stable; their temporal distribution may be posing significant risks for food production. This study therefore underscores the temporal variability of key climatic variables, including precipitation and temperature.
4.3.2. Temperature Trends
Results from the Mann-Kendall test revealed an overall statistically significant increase trend in temperature, which may hold critical implications for rice production. Kendall’s tau coefficient suggests a general tendency for temperature to increase over time and is highly steady. This findings concord with the Liberia National Adaptation Plan document [50], which highlighted that Liberia’s mean air temperature will increase by 0.4 °C to 1.3 °C from 2010–2050, based on Regional Climate Models (RCMs). Similarly, the Sixth Assessment Report (AR6) of the United Nations Intergovernmental Panel on Climate Change (IPCC) documented that the global surface temperature have increased by 1.1 °C during the past decades (2011–2020) compared to 1850–1900, with further increases of 1.5 °C expected by 2021–2040 [51]. Additionally, projected result for temperature under two different scenarios have also demonstrated an increasing change in both period (RCP8.5 2031-2060 and RCP8.5 2071-2100). These projected changes in temperature varied based on the time series including the period 2031 to 2060 and 2071 to 2100. The projected changes from 2031 to 2060 expected to reach at 3.03 °C as highlighted in the supplementary materials (Figure S2 a), and 2.7 °C during the period 2071 to 2100 (see Figure S2b in the supplementary materials), whereas the overall increase from 2031 to 2100 are expected to reach at 4.54 °C, respectively (Figure S2 a, b). These findings support the broader evidence that temperatures are rising globally and regionally, which holds critical implications on Libera’s rice production system in the future. However, this increase trend has been perceived by farmers across the study area and further employed various adaptive strategies including the use of short-duration varieties, adjusting planting schedules, diversifying crops, and basic soil-water management [25]. Furthermore, this finding aligns with similar studies underlining the conspicuous increasing trends in temperatures across various regions worldwide. For instance, [47,52] found that temperature exhibited noticeable increasing trend over the study period, negatively affecting crop production. Similarly, studies have indicated that rising mean temperatures would likely affect rice productivity by accelerating rice phenology, shorten the grain-filling period, and increase evapotranspiration, thereby heightening the vulnerability of Liberia’s largely rainfed rice systems [7,53]. Moreover, the increase in minimum and maximum temperatures beyond the normal threshold may pose a risk to crop performance. For example, high temperatures are particularly harmful, as they increase plant respiration, limit carbohydrate availability for grain filling, and reduce spikelet fertility, ultimately lowering yield potential [54]. Ref. [55] demonstrated that temperatures above 35 oC at flowering stage have been shown to cause spikelet sterility and severe yield reduction in rice. However, countries are already facing considerable economic impacts, which are likely to worsen as global warming increases the frequency of extreme events. [49]. Given Liberia’s dependence on rainfed production systems, such exposure may increase the likelihood of crop failure. Overall, the findings indicate that rising temperatures, particularly night-time warming, may pose substantial threats to rice production in Liberia. Therefore, it is essential to implement various adaptation measures such as adjusting planting date, use of short-duration local rice varieties, crop diversification, soil and water conservation, and adopting heat-tolerant varieties in order to boost productivity [53,56,57,58]. Such strategies align with adaptation behaviors observed in other West African countries, notably Nigeria, Ghana, and Sierra Leone, where smallholder farmers modify agricultural practices to cope with rainfall variability and temperature extremes [52,59,60].
4.4. Temperature and Precipitation Impact on Rice Productivity
4.4.1. Correlation
The study findings indicate that, over the 34-year period, no statistically significant relationships were identified between rice production and the accessed climate variables. Nonetheless, production exhibited moderate negative correlations with precipitation, as well as with the mean and minimum temperatures. By contrast, rice yield displayed moderate and more consistent associations with temperatures-related variables. These patterns suggest that overall production and productivity are likely influenced more strongly by non-climatic factors such as land expansion, soil quality, access to quality seed, agronomic practices, and policy interventions, than by climate conditions alone. Supporting this interpretation, Ref. [14,42] reported that low yields in rainfed environments constitute a major constraint such as sub-optimal natural resource and crop management practices commonly adopted by smallholder farmers. These include inadequate water management and limited use of fertilizers, herbicides, and machineries to rice production, noting that rainfed production systems account for approximately 70% of the global harvested rice area. Ref. [61] demonstrated that non-climatic factors such as area under rice cultivation, fertilizer use, labor force, and water resources affect rice production and have substantial impact on yield. Furthermore, a study conducted by Ref. [62] identified key barriers such as low adoption of improved varieties and irrigation technologies, limited access to climate information, low access to extension services, inadequate access to finance and inputs, and overreliance on traditional knowledge that hinder farmer’s adaptation and can result to low productivity levels.
Analysis across multiple time scales revealed fluctuating relationships between climate variables (temperatures and precipitation) and rice yields. Rice yield displayed strong and negative correlation with precipitation during specific periods, for instance, from 1998-2003 for production, and from 2003 to 2005 for yield, suggesting that excessive rainfall and flooding likely constrained rice growth and productivity during these intervals. This patterns aligns with findings reported for other regions of West Africa [16]. The statistically significant negative relationship between precipitation with yield during 2003-2005 further indicates that excessive and insufficient rainfall can contribute to yield reduction [10,63]. However, significant negative correlations were observed for minimum and maximum temperatures during 1998 to 2003 for production, and for mean, minimum, and maximum temperatures during 2000-2003 and 2012-2023 for yield. These results underscore the adverse effects of temperature extremes during these periods, which is consistent with evidence presented in AR6 Synthesis Report [1]. The report highlights that climate variables, particularly temperature and precipitation have varying and significant associations with agricultural production and productivity globally and across regions. Previous studies have similarly demonstrated that climate variables, particularly temperature and precipitation, exert major influences on crop productivity, including rice [6,39,55]. In this study, we found that temperature and precipitation had a significantly different association with rice production and yield over the modest time scales compared to the entire study period (1990-2023), during which no significant relationship was observed. To mitigate this constraints, it is crucial to effectively deploy a diverse set of technologies such as water preservation technologies in rainfed and irrigated lowland rice, site-specific nutrient management practices, tools to support decision (crop growth simulation models), and labor-saving technologies developed in recent decades [16,64].
4.4.2. Regression
Based on the regression results for production, minimum temperature emerged as the only climate variable that significantly influenced rice production in Liberia during the study period. Minimum temperature exhibited a significant negative effect, indicating that a 1 °C increase in minimum temperature is associated with a 2.676 MT decrease in rice production. This suggest that elevated minimum temperature (night-time temperatures) may impair crop performance, possibly due to increased respiration rates that lead to energy loss, disruption of physiological recovery processes and heightened stress during sensitive growth stages such as flowering and grain filling [65,66]. This finding is particularly critical in the context of climate change, as minimum temperatures are increasing at a faster rate than maximum temperatures [58,67]. This result is consistent with Ref. [65] who demonstrated that elevated temperatures pose serious risks to crop production and productivity. Similarly, Ref. [66] and [68] noted that increased temperatures adversely impact the growth and development of rice plants, particularly during processes such as germination, tillering, flowering, and grain filling stages. Overall, the findings suggest that temperature- related stresses, especially those associated with minimum temperature, play a more critical role in determining rice production outcomes than precipitation [63,69]. This highlights the crop’s sensitivity during flowering and grain-filling stages [70]. Similar patterns have been reported across west and southern Africa regions, where temporal fluctuations in temperature account for a substantial proportion of yield variability [71,72]. The regression analysis further revealed that, although climate variables collectively exert a moderately significant influence on rice yield in Liberia, the R2 value of 15.4% indicates that majority of yield variation is likely driven by non-climatic factors. These may include soil fertility, production systems and management practices, pest pressure, technological adoption, and broader socio-economic conditions. The analysis also identified precipitation as the dominant climatic factor influencing rice yield during the study period. This finding aligns with [23] and [25], who in their studies, emphasized the direct and indirect implication of rainfall on Liberia’s rice production system. The positive association underscores the central role of rainfall in Liberia’s predominantly rainfed rice production systems [25,73]. Similarly, research across West Africa and other tropical regions are closely linked to the variability and distribution of seasonal rainfall [74].
These findings provide valuable insights for formulating appropriate agricultural policies and practices that enhance adaptive capacity, inform extension services, support climate-resilient agricultural development, and guide policy frameworks addressing climate hazards to enhance food security.
4.4.3. Limitations of the Study and Future Directions
The limitation of this study suggests potentials for the conduct of future research in the field. This study was constrained by various limitations. Firstly, the absence of field-based or ground truce dataset, that it is limited to correlation. Thus, in the absence of causation, conclusions are based on assumptions. This justifies the need for future research on the physiological and morphological reactions of rice crop to precipitation and temperature. Secondly, although the study analyzes production and climate at a national level, it does not take into consideration the socio-demographics and geographical differences between the country’s regions. Hence, future research should consider the inclusion of field-based date to investigate the physical impact of temperature and precipitation on productivity, as well as incorporating socio-demographics factors and the geographical extend or sub-divisions.
5. Conclusions and Policy Recommendations
In this study, we examined the effect of climate variability on rice production and farmer’s resilience in Liberia over the period 1990 to 2023. The analysis reveals a clear increasing trend in all temperature variables including mean, minimum and maximum temperatures, respectively, and pronounced rainfall variability that are perceived by farmers as delayed onset and irregular distribution of rains. These climatic variations have contributed to fluctuations in rice output, yet statistical modelling shows that climate variables explain only a modest portion of the observed variation (26.16% for total rice production and 15.4% for yield). Minimum temperature exerts a negative significant influence on production, while precipitation is the only climate factor that significantly enhances yield. Spatial maps from Liberia climate projections for mean seasonal temperature of RCP8.5 2031-2060 and RCP8.5 2071-2100 also confirm the continued increase in temperature and a strong variability in precipitation observed from the mean sessional precipitation of the mid-century (2031-2060) and the projection for the end-century (2071-2100) spatial maps, respectively. These changes are likely to have potential implication on future rice production and yields in the country.
Although there was an overall increase in total rice production over the study period, yields remained essentially stagnant, demonstrating that factors beyond climate, such as inadequate access to improved seeds, irrigation systems, and fertilizers; limited access to credit; and inadequate extension services–may be constraining productivity in the study area. Hence, climate change alone does not fully explain Liberia’s low rice yields; a combination of climatic, agronomic, and socioeconomic drivers underpins the persistent productivity gap and the country’s reliance on imports. In response to the consistent variation in climate factors, farmers in Liberia adapt practices such as adjusting planting dates, using short-duration varieties, diversifying crops, and implementing basic soil-water conservation are mostly employed to mitigate some climate risks but are hampered by institutional and financial constraints. These different strategies used by farmers in the study area are said to be implemented based on their local knowledge, personal experience, and based on the advice of other farmers in the area.
In this study, it was found that farmers in Liberia remain particularly vulnerable to climate variability as the strategies employed by farmers in Liberia are still rudimentary. It is therefore essential that the strategies already adopted by farmers to cope with climate variability to be well strengthened by specialized agronomically through State or National Governmental Organization (NGO) support to improve them and then decentralize them in various parts of the country. There is also a need for the establishment of localized climate information systems capable of delivering timely forecasts on rainfall and temperature and enhancing the capacity of the Liberia Meteorological Service to disseminate user-friendly climate data to farming communities. Support research and provision of short-duration, drought- and flood-tolerant rice varieties to adapt to Liberia’s diverse agroecological zones. Most importantly, to develop or upgrade microfinance initiatives and cooperative schemes that facilitate farmers’ access to agricultural inputs such as improved seed varieties, fertilizers, and basic farm tools. Additionally, the introduction of targeted subsidies or support programs to improve the availability of climate-resilient agricultural inputs should be prioritized. The study further suggests that future research should investigate the socioeconomic dimensions of farmer resilience, including gender, education, and market access, to guide inclusive and sustainable adaptation strategies. By considering and employing these approaches will help Liberia move beyond reactive coping strategies toward a practical, climate-resilient rice sector capable of sustaining domestic food security and reducing dependence on imports.
6. Patents
Not applicable. This study is sorely based on secondary data sets that are publicly available as referenced in the data availability section and did not involve direct experimentation with animals or humans.
Supplementary Materials
The following supporting information can be downloaded at the website of this paper posted on Preprints.org. All information and materials supporting the findings of this study are provided within the text of the article.
Authors contributions: Conceptualization, B.T.S. and C.M.M.,; methodology, B.T.S., C.M.M., and J.L.M.U.; software, B.T.S. and J.L.M.U.; validation, J.L.M.U.; formal analysis, B.T.S.; investigation, C.M.M., J.L.M.U. and B.T.S.; resources, B.T.S.; data curation, B.T.S. and J.L.M.U.; writing – original draft, B.T.S.; Writing – review & editing, C.M.M., J.L.M.U., A.D.N. and L.A.; visualization, C.M.M., J.L.M.U. and B.T.S.; supervision, C.M.M.; project administration, B.T.S.; funding acquisition, B.T.S. All authors have read and agreed to the published version of the manuscript.
Funding
This research and Article Processing Charge (APC) were funded by the Centre of Excellence in Agri-Food Systems and Nutrition (CE-AFSN), Eduardo Mondlane University, Praça 25 de Junho Edificio da Reitoria 5° Andar, Maputo 1102, Mozambique, tel. 849551721, Maputo, Mozambique. Email: ceasfsn@uem.mz, VAT: 500003545, Grant info: World Bank: E089-MZ.
Data availability statement
All data sets and materials supporting the findings of this study are provided within the article and are publicly available online: [https://www.fao.org/faostat/en/#data/QCL](https://cds.climate.copernicus.eu/datasets/reanalysis-era5-singlelevels)[https://data.chc.ucsb.edu/products/CHIRPS-2.0/](https://esgdn1.nsc.liu.se/search/cordex/).
Acknowledgments
The authors would like to fully acknowledge the financial support received through the Centre of Excellence in Agri-Food Systems and Nutrition (CE-AFSN), Eduardo Mondlane University, Mozambique, for the achievement of this study.
Conflicts of interest
The authors declare no competing interests.
Abbreviations
| CHIRPS | Climate Hazards Group InfraRed Precipitation with Station |
| CORDEX | Coordinated Regional climate Downscaling Experiment |
| DSSAT | Decision Support System for Agrotechnology Transfer |
| EPA | Environmental Protection Agencies |
| FAO | Food and Agriculture organization |
| FAOSTAT | Food and Agriculture Organization Statistics |
| GDP | Gross Domestic Product |
| IPCC | Intergovernmental Panel on Climate Change |
| Mk | Mann-Kendall |
| NAP | National Adaptation Plan |
| MLR | Multiple Linear Regression |
| RCMs | Regional Climate Models |
| SSA | Sub-Saharan Africa |
| WFP | World Food Programme |
References
- IPCC, 2023: Summary for Policymakers. In Climate Change 2023: Synthesis Report. Contribution of Working Groups I, II and III to the Sixth Assessment Report of the Intergovernmental Panel on Climate Change [Core Writing Team;IPCC; Lee, H., Romero, J., Eds.; Geneva, Switzerland; pp. 1–34. [CrossRef]
- Yuan, X.; Li, S.; Chen, J.; Yu, H.; Yang, T.; Wang, C.; Huang, S.; Chen, H.; Ao, X. Impacts of Global Climate Change on Agricultural Production: A Comprehensive Review. Agronomy 2024, 14. [Google Scholar] [CrossRef]
- Mulungu, K.; Kangogo, D. Striving to Be Resilient: The Role of Crop-Poultry Integrated System as a Climate Change Adaptation Strategy in Semiarid Eastern Kenya. Heliyon 2022, 8, e11579. [Google Scholar] [CrossRef]
- Reyes, F.; Gosme, M.; Wolz, K.J.; Lecomte, I.; Dupraz, C. Alley Cropping Mitigates the Impacts of Climate Change on a Wheat Crop in a Mediterranean Environment: A Biophysical Model-Based Assessment. Agric. 2021, 11. [Google Scholar] [CrossRef]
- Ayanlade, A.; Radeny, M.; Morton, J.F.; Muchaba, T. Rainfall Variability and Drought Characteristics in Two Agro-Climatic Zones: An Assessment of Climate Change Challenges in Africa. Sci. Total Environ. 2018, 630, 728–737. [Google Scholar] [CrossRef] [PubMed]
- Adjah, K.L.; Asante, M.D.; Toure, A.; Aziadekey, M.; Amoako-Andoh, F.O.; Frei, M.; Diallo, Y.; Agboka, K. Improvement of Rice Production under Drought Conditions in West Africa: Application of QTLs in Breeding for Drought Resistance. Rice Sci. 2022, 29, 512–521. [Google Scholar] [CrossRef]
- Wassmann and Dobermann Climate Change Adaptation through Rice Production in Regions with High Poverty Levels Reiner. An open access J. Publ. by SESSO Period. 2012, 1, 2–24.
- Jagadish, S.V.K.; Murty, M.V.R.; Quick, W.P. Rice Responses to Rising Temperatures - Challenges, Perspectives and Future Directions. Plant Cell Environ. 2015, 38, 1686–1698. [Google Scholar] [CrossRef]
- Song, Y.; Wang, C.; Linderholm, H.W.; Fu, Y.; Cai, W.; Xu, J.; Zhuang, L.; Wu, M.; Shi, Y.; Wang, G.; et al. The Negative Impact of Increasing Temperatures on Rice Yields in Southern China. Sci. Total Environ. 2022, 820, 153262. [Google Scholar] [CrossRef]
- Maiti, A.; Hasan, M.K.; Sannigrahi, S.; Bar, S.; Chakraborti, S.; Mahto, S.S.; Chatterjee, S.; Pramanik, S.; Pilla, F.; Auerbach, J.; et al. Optimal Rainfall Threshold for Monsoon Rice Production in India Varies across Space and Time. Commun. Earth Environ. 2024, 5, 1–8. [Google Scholar] [CrossRef]
- Gumel, et al. Assessing Paddy Rice Yield Sensitivity to Temperature and Rainfall Variability in Peninsular Malaysia Using DSSAT Model. Int. J. Appl. Environ. Sci. 2017, 12, 1521–1545. [Google Scholar]
- Robertson, N.; Oinam, B. Rice Suitability Mapping Using the Analytic Hierarchy Process Approach in a River Catchment. 2023, 9, 141–156. [Google Scholar] [CrossRef]
- Pope, E. M.; Opile, W.; Ngode, L.; Emmy, C. Assessment of Upland Rice Production Constraints and Farmers’ Preferred Varieties in Liberia. Int. J. Res. Innov. Soc. Sci. 2023, VII, 1175–1189. [Google Scholar] [CrossRef]
- Ibrahim, A.; Saito, K.; Kokou, A.; Johnson, J.M.; Diagne, M.; Fagnombo, D.J.; Felix, F.; Sylvia, B.O.; Martial, H. Seizing Opportunity towards Sustainable Rice Cultivation in Sub-Saharan Africa. Environ. Sustain. Indic. 2022, 15, 100189. [Google Scholar] [CrossRef]
- Daszkiewicz, T. Food Production in the Context of Global Developmental Challenges. Agric. 2022, 12. [Google Scholar] [CrossRef]
- Saito, K.; Senthilkumar, K.; Dossou-Yovo, E.R.; Ali, I.; Johnson, J.M.; Mujawamariya, G.; Rodenburg, J. Status Quo and Challenges of Rice Production in Sub-Saharan Africa. Plant Prod. Sci. 2023, 26, 320–333. [Google Scholar] [CrossRef]
- Pluato, E. E.; Mutondo, J.; Kolleh, J. B. Impact of Post-Harvest Losses on the Profitability of Rice Production Amongst Smallholder Farmers in Liberia. Agric. Res. Technol. Open Access J. 2024, 28. [Google Scholar] [CrossRef]
- Tarway-twalla, A.K. Agricultural Productivity, Climate Change and Smallholder Farmer ’ s Entrepreneurship: A Case Study of the Central and Western Regions of Liberia By Monrovia, Liberia; 2013. [Google Scholar]
- Jr, A.D.A.; Diallo, K. Agricultural Dynamics in Liberia: Current Issues and Solutions. Int. J. Res. Innov. Soc. Sci. 2025, IX, 7430–7437. [Google Scholar] [CrossRef]
- Funk, C.; Peterson, P.; Landsfeld, M.; Pedreros, D.; Verdin, J.; Shukla, S.; Husak, G.; Rowland, J.; Harrison, L.; Hoell, A.; et al. The Climate Hazards Infrared Precipitation with Stations - A New Environmental Record for Monitoring Extremes. Sci. Data 2015, 2, 1–21. [Google Scholar] [CrossRef]
- Climate Change Knowledge Portal (CCKP) Liberia Country Profile-WEB. 2021. Vol. 3. Available online: https://climateknowledgeportal.worldbank.org/sites/default/files/2021-07/15917-WB_Liberia%20Country%20Profile-WEB.pdf (accessed on 18 July 2024).
- CBL Central Bank of Liberia Annual Report 2022. 2023. Available online: https://www.cbl.org.lr/sites/default/files/documents/2023ANNUALREPORT.pdf (accessed on 18 October 2024).
- Dorbor-soko, L.M. Assessment of the Impacts of Climate Variability and Change on Rice Production in Bong County, Liberia. Master Thesis, University of Nairobi, 2024. Available online: https://erepository.uonbi.ac.ke/bitstream/handle/11295/167192/Soko%20L_Assessment%20of%20the%20Impacts%20of%20Climate%20Variability%20and%20Change%20on%20Rice%20Production%20in%20Bong%20County%2c%20Liberia.pdf?sequence=1 (accessed on 15 September 2025).
- Wuokolo Dorbor, J. Perception of Climate Change and Barriers to Strategic Adaptation for Smallholder Farming in Todee District, Liberia. Master Thesis, Chulalongkorn University, 2023. Available online: https://www.researchgate.net/publication/367392196_Perception_of_Climate_Change_and_Barriers_to_Strategic_Adaptation_for_Smallholder_Farming_in_Todee_District_Liberia (accessed on 18 September 2025).
- Sarnoh Assessment of Climate Risks in Central and Northern Liberia Yusuff Mohammed Sarnoh, University of Glasgow, 2024. Available online: https://theses.gla.ac.uk/84580/ (accessed on 22 October 2025).
- LISGIS Thematic Report on Population Size, Distribution and Structure 2022 Liberia Population and Housing Census. 2022. Available online: https://lisgis.gov.lr/censusreport/thematic/ThematicReportonPopulationSizeDistributionandStructure.pdf (accessed on 3 April 2024).
- EPA Republic of Liberia Liberia ’ s First Adaptation Communication to the United Nations Framework Convention on Climate Change (UNFCCC). 2021. Available online: https://epa.gov.lr/wp-content/uploads/2024/10/First_Adaptation_Communication_AdCom_Liberia.pdf (accessed on 18 July 2025).
- EPA Liberia’s Revised Nationally Determined Contribution (NDC). In Minerva. Int. Verzeichnis Wissenschaftlicher Institutionen; 2021; pp. 307–307. Available online: https://epa.gov.lr/wp-content/uploads/2024/10/Liberias-Updated-NDC_RL_FINAL-002.pdf (accessed on 28 July 2024).
- World Bank Liberia Country Climate Development Report. 2024. Available online: https://documents1.worldbank.org/curated/en/099032024143525952/pdf/P1798481a4fb560431a86a1bb83f1117b00.pdf (accessed on 18 November 2024).
- CARD Data Collection Survey on Rice Related Programs / Projects in the CARD Member Countries ( with Competitiveness Analysis of Local Rice to Imported Rice. 2021. Available online: https://riceforafrica.net/wp-content/uploads/2023/12/Mozambique_competitiveness-analysis_20210808.pdf (accessed on 22 December 2024).
- Sumo, et al. Determinants of Smallholder Rice Farmers’ Willingness-to-Pay for Private Extension Services in Liberia: The Case of Gibi District. Sustain. 2023, 15. [Google Scholar] [CrossRef]
- Ayehu and Besufekad Land Suitability Analysis for Rice Production: A GIS Based Multi-Criteria Decision Approach. Am. J. Geogr. Inf. Syst. 2015, 4, 95–104.
- Harrison, L.; Landsfeld, M.; Husak, G.; Davenport, F.; Shukla, S.; Turner, W.; Peterson, P.; Funk, C. Advancing Early Warning Capabilities with CHIRPS-Compatible NCEP GEFS Precipitation Forecasts. Sci. Data 2022, 9, 1–13. [Google Scholar] [CrossRef]
- Jiqin, et al. Application of MK Trend and Test of Sen’s Slope Estimator to Measure Impact of Climate Change on the Adoption of Conservation Agriculture in Ethiopia. J. Water Clim. Chang. 2023, 14, 977–988. [Google Scholar] [CrossRef]
- Chang, K.L.; Schultz, M.G.; Lan, X.; McClure-Begley, A.; Petropavlovskikh, I.; Xu, X.; Ziemke, J.R. Trend Detection of Atmospheric Time Series: Incorporating Appropriate Uncertainty Estimates and Handling Extreme Events. Elementa 2021, 9, 1–28. [Google Scholar] [CrossRef]
- Ondiek, R.A.; Saber, M. Spatial – Temporal Analysis of Impacts of Climate Variability on Maize Yield in Kenya. Agric. 2024, 1–20. [Google Scholar] [CrossRef]
- Dawood, M.; Rahman, A. ur; Rahman, G.; Nadeem, B.; Miandad, M. Geo-Statistical Analysis of Climatic Variability and Trend Detection in the Hindu Kush Region, North Pakistan. Environ. Monit. Assess. 2024, 196. [Google Scholar] [CrossRef]
- da Silva, R.M.; Santos, C.A.G.; Moreira, M.; Corte-Real, J.; Silva, V.C.L.; Medeiros, I.C. Rainfall and River Flow Trends Using Mann–Kendall and Sen’s Slope Estimator Statistical Tests in the Cobres River Basin. Nat. Hazards 2015, 77, 1205–1221. [Google Scholar] [CrossRef]
- Oluwatimilehin. Ayanlade Climate Change Impacts on Staple CropAs: Assessment of Smallholder Farmers’ Adaptation Methods and Barriers. Clim. Risk Manag. 2023, 41, 100542. [Google Scholar] [CrossRef]
- FAO Rice Production Report. 2018, Vol. XXI. Available online: https://dn790003.ca.archive.org/0/items/assguilhermeferri_gmail_RICE/RICE.pdf (accessed on 4 September 2025).
- Soullier, G.; Demont, M.; Arouna, A.; Lançon, F.; Mendez del Villar, P. The State of Rice Value Chain Upgrading in West Africa. Glob. Food Sec. 2020, 25, 100365. [Google Scholar] [CrossRef]
- Saito, K.; Senthilkumar, K.; Ali, I.; Johnson, J.; Rodenburg, J.; Senthilkumar, K.; Ali, I.; Johnson, J. Status Quo and Challenges of Rice Production in Sub-Saharan Africa. Plant Prod. Sci. 2023, 26, 320–333. [Google Scholar] [CrossRef]
- Saysay, J.L.; Gabagambi, D.M.; Mlay, G.I.; Mined, I.J. Technical Efficiency in Rice Production Among Smallholder Farmers in Central Liberia: A Stochastic Production Frontier Analysis. J. Econ. Sustain. Dev. 2018, 9, 47–53. [Google Scholar]
- World Bank Liberia Smallholder Agriculture Transformation and Agribusiness Revitalization Project. 2013. Available online: https://documents1.worldbank.org/curated/en/539361545925964964/pdf/project-appraisal-document-pad-smallholder-agriculture-transformation-and-agribusiness-revitalization-project-star-p-p160945-12192018-63681026525344785.pdf (accessed on 14 October 2025).
- World Food Programme (WFP-Liberia). Resilient Food Systems in Western Africa: WFP Contribution to Food Systems Transformation in Western Africa. 2023. Available online: https://docs.wfp.org/api/documents/WFP-0000153294/download/ (accessed on 12 November 2025).
- USAID-BEST Usaid Office of Food for Peace Liberia: The Role of Markets in Food Security, Pre-Ebola Crisis. 2014. (accessed on 14 October 2025).
- Sultan, B.; Gaetani, M. Agriculture in West Africa in the Twenty-First Century: Climate Change and Impacts Scenarios, and Potential for Adaptation. Front. Plant Sci. 2016, 7, 1–20. [Google Scholar] [CrossRef] [PubMed]
- Habte, A.; Worku, W.; Mamo, G.; Ayalew, D.; Gayler, S. Rainfall Variability and Its Seasonal Events with Associated Risks for Rainfed Crop Production in Southwest Ethiopia. Cogent Food Agric. 2023, 9. [Google Scholar] [CrossRef]
- Timité, N.; Kouakou, A.T.M.; Bamba, I.; Barima, Y.S.S.; Bogaert, J. Climate Variability in the Sudanian Zone of Côte d’Ivoire: Weather Observations, Perceptions, and Adaptation Strategies of Farmers. Sustain. 2022, 14. [Google Scholar] [CrossRef]
- NAP Liberia National Adaptation Plan 2020 - 2030. 2022. Available online: https://unfccc.int/sites/default/files/resource/LIBERIA_%20NAP_%20FINAL_%20DOCUMENT.pdf (accessed on 22 July 2024).
- IPCC IPCC, 2023: Climate Change 2023: Synthesis Report. Contribution of Working Groups I, II and III to the Sixth Assessment Report of the Intergovernmental Panel on Climate Change [Core Writing Team, H. Lee and J. Romero (Eds.)]. IPCC, Geneva, Switzerland. 2023; doi: 10.59327/IPCC/AR6-9789291691647. Available online: https://www.ipcc.ch/report/ar6/syr/ (accessed on 8 June 2024).
- Yila, K.M.; Gboku, M.L.S.; Lebbie, M.S.; Kamara, L.I. Changes in Rainfall and Temperature and Its Impact on Crop Production in Moyamba District, Southern Sierra Leone. Atmos. Clim. Sci. 2023, 13, 19–43. [Google Scholar] [CrossRef]
- Lobell, et al. Historical Effects of Temperature and Precipitation on California Crop Yields. Clim. Change 2007, 81, 187–203. [Google Scholar] [CrossRef]
- Jasmine, K. Liberia Country Food and Agriculture Delivery Compact. Penambahan Natrium Benzoat Dan Kalium Sorbat Dan Kecepatan Pengadukan Sebagai Upaya Penghambatan Reaksi Inversi Pada Nira Tebu 2014. [Google Scholar]
- Jagadish, et al. Rice Responses to Rising Temperatures - Challenges, Perspectives and Future Directions. Plant Cell Environ. 2015, 38, 1686–1698. [Google Scholar] [CrossRef]
- Altieri, M.A.; Nicholls, C.I.; Henao, A.; Lana, M.A. Agroecology and the Design of Climate Change-Resilient Farming Systems. Agron. Sustain. Dev. 2015, 35, 869–890. [Google Scholar] [CrossRef]
- Gautam, Y.; Andersen, P. Rural Livelihood Diversification and Household Well-Being: Insights from Humla, Nepal. J. Rural Stud. 2016, 44, 239–249. [Google Scholar] [CrossRef]
- IPPC Secretariat. Scientific review of the impact of climate change on plant pests – A global challenge to prevent and mitigate plant pest risks in agriculture, forestry and ecosystems; FAO on behalf of the IPPC Secretariat: Rome, 2021; (accessed on 10 June 2024). [Google Scholar] [CrossRef]
- Tambo, J.A.; Abdoulaye, T. Smallholder Farmers’ Perceptions of and Adaptations to Climate Change in the Nigerian Savanna. Reg. Environ. Chang. 2013, 13, 375–388. [Google Scholar] [CrossRef]
- Ndamani, F.; Watanabe, T. Farmers’ Perceptions about Adaptation Practices to Climate Change and Barriers to Adaptation: A Micro-Level Study in Ghana. Water (Switzerland) 2015, 7, 4593–4604. [Google Scholar] [CrossRef]
- Onuşluel Gül, G.; Gül, A.; Najar, M. Historical Evidence of Climate Change Impact on Drought Outlook in River Basins: Analysis of Annual Maximum Drought Severities through Daily SPI Definitions. Nat. Hazards 2022, 110, 1389–1404. [Google Scholar] [CrossRef]
- Coulibaly, J.Y.; Gbetibouo, G.A.; Kundhlande, G.; Sileshi, G.W.; Beedy, T.L. Responding to Crop Failure: Understanding Farmers’ Coping Strategies in Southern Malawi. Sustain. 2015, 7, 1620–1636. [Google Scholar] [CrossRef]
- Birkmann, J.; Liwenga, E.; Pandey, R.; Boyd, E.; Djalante, R.; Gemenne, F. W. Leal Filho, P.F. Pinho, L. Stringer, and D. Wrathall, 2022: Poverty, Livelihoods and Sustainable Development. In Climate Change 2022: Impacts, Adaptation and Vulnerability. Contribution of Working Group II to the Sixth Assessment Report of the Intergovernmental Panel on Climate Change; Pörtner, H.-O., Roberts, D.C., Tignor, M., Poloczanska, E.S., Mintenbeck, K., Alegría, A., Craig, M., Langsdorf, S., Löschke, S., Möller, V., Okem, A., Rama, B., Eds.; Cambridge University Press: Cambridge, UK and New York, NY, USA; pp. 1171–1274. Available online: https://www.cambridge.org/core/books/climate-change-2022-impacts-adaptation-and-vulnerability/poverty-livelihoods-and-sustainable (accessed on 14 August 2024).
- Tripathi, R.; Kumar, A.; Guru, P.; Debnath, M.; Mohapatra, S.D.; Mohanty, S.; Shahid, M.; Nayak, A.K. Precision Farming Technologies for Water and Nutrient Management in Rice: Challenges and Opportunities Precision. Oryza 2021, 58, 126–142. [Google Scholar] [CrossRef]
- Hat, J.L.; Prueger, J.H. Temperature Extremes: Effect on Plant Growth and Development. Weather Clim. Extrem. J. 2015, 10, 4–10. [Google Scholar] [CrossRef]
- Su, Q.; Rohila, J.S.; Ranganathan, S.; Karthikeyan, R. Rice Yield and Quality in Response to Daytime and Nighttime Temperature Increase – A Meta-Analysis Perspective. Sci. Total Environ. 2023, 898, 165256. [Google Scholar] [CrossRef] [PubMed]
- Rahman, M.A.; Kang, S.C.; Nagabhatla, N.; Macnee, R. Impacts of Temperature and Rainfall Variation on Rice Productivity in Major Ecosystems of Bangladesh. Agric. Food Secur. 2017, 6, 1–11. [Google Scholar] [CrossRef]
- Yu, J.; Du, T.; Zhang, P.; Ma, Z.; Chen, X.; Cao, J.; Li, H. Impacts of High Temperatures on the Growth and Development of Rice and Measures for Heat Tolerance Regulation: A Review. 2024, 1–24. [Google Scholar] [CrossRef]
- Zhao, C.; Liu, B.; Piao, S.; Wang, X.; Lobell, D.B.; Huang, Y.; Huang, M. Temperature Increase Reduces Global Yields of Major Crops in Four Independent Estimates. PNAS 2017, 1–6. [Google Scholar] [CrossRef]
- Baruah, U.; Das, S.; Kalita, P.; Saikia, M.; Bhougal, S.; Pal, S.; Das, R. High-Night Temperature-Induced Changes in Chlorophyll Fluorescence, Gas Exchange, and Leaf Anatomy Determine Grain Yield in Rice Varieties. J. Plant Growth Regul. 2023, 42, 5538–5557. [Google Scholar] [CrossRef]
- Jalloh, A.; Nelson, G. C.; Thomas, T. S.; Roy-Macauley, H. West African Agriculture and Climate Change: A Comprehensive Analysis. In International Food Policy Research Institute Washington, DC; 2013; ISBN 9780896292048. [Google Scholar]
- Nhamo, L.; Matchya, G.; Mabhaudhi, T.; Nhlengethwa, S.; Nhemachena, C.; Mpandeli, S. Cereal Production Trends under Climate Change: Impacts and Adaptation Strategies in Southern Africa. Agric. 2019, 1–16. [Google Scholar] [CrossRef]
- MOA Liberia Agriculture Pilot Survey Final Report Ministry of Agriculture. 2019. Available online: https://www.moa.gov.lr/sites/default/files/documents/Liberia%20Agriculture%20Pilot%20Survey%20%20Report%202019_MOA.pdf (accessed on 3 August 2024).
- Sultan, B.; Defrance, D.; Iizumi, T. Evidence of Crop Production Losses in West Africa Due to Historical Global Warming in Two Crop Models. Sci. Rep. 2019, 9, 1–15. [Google Scholar] [CrossRef] [PubMed]
Figure 2.
Annual variability of total rice production in Liberia from 1990-2023.
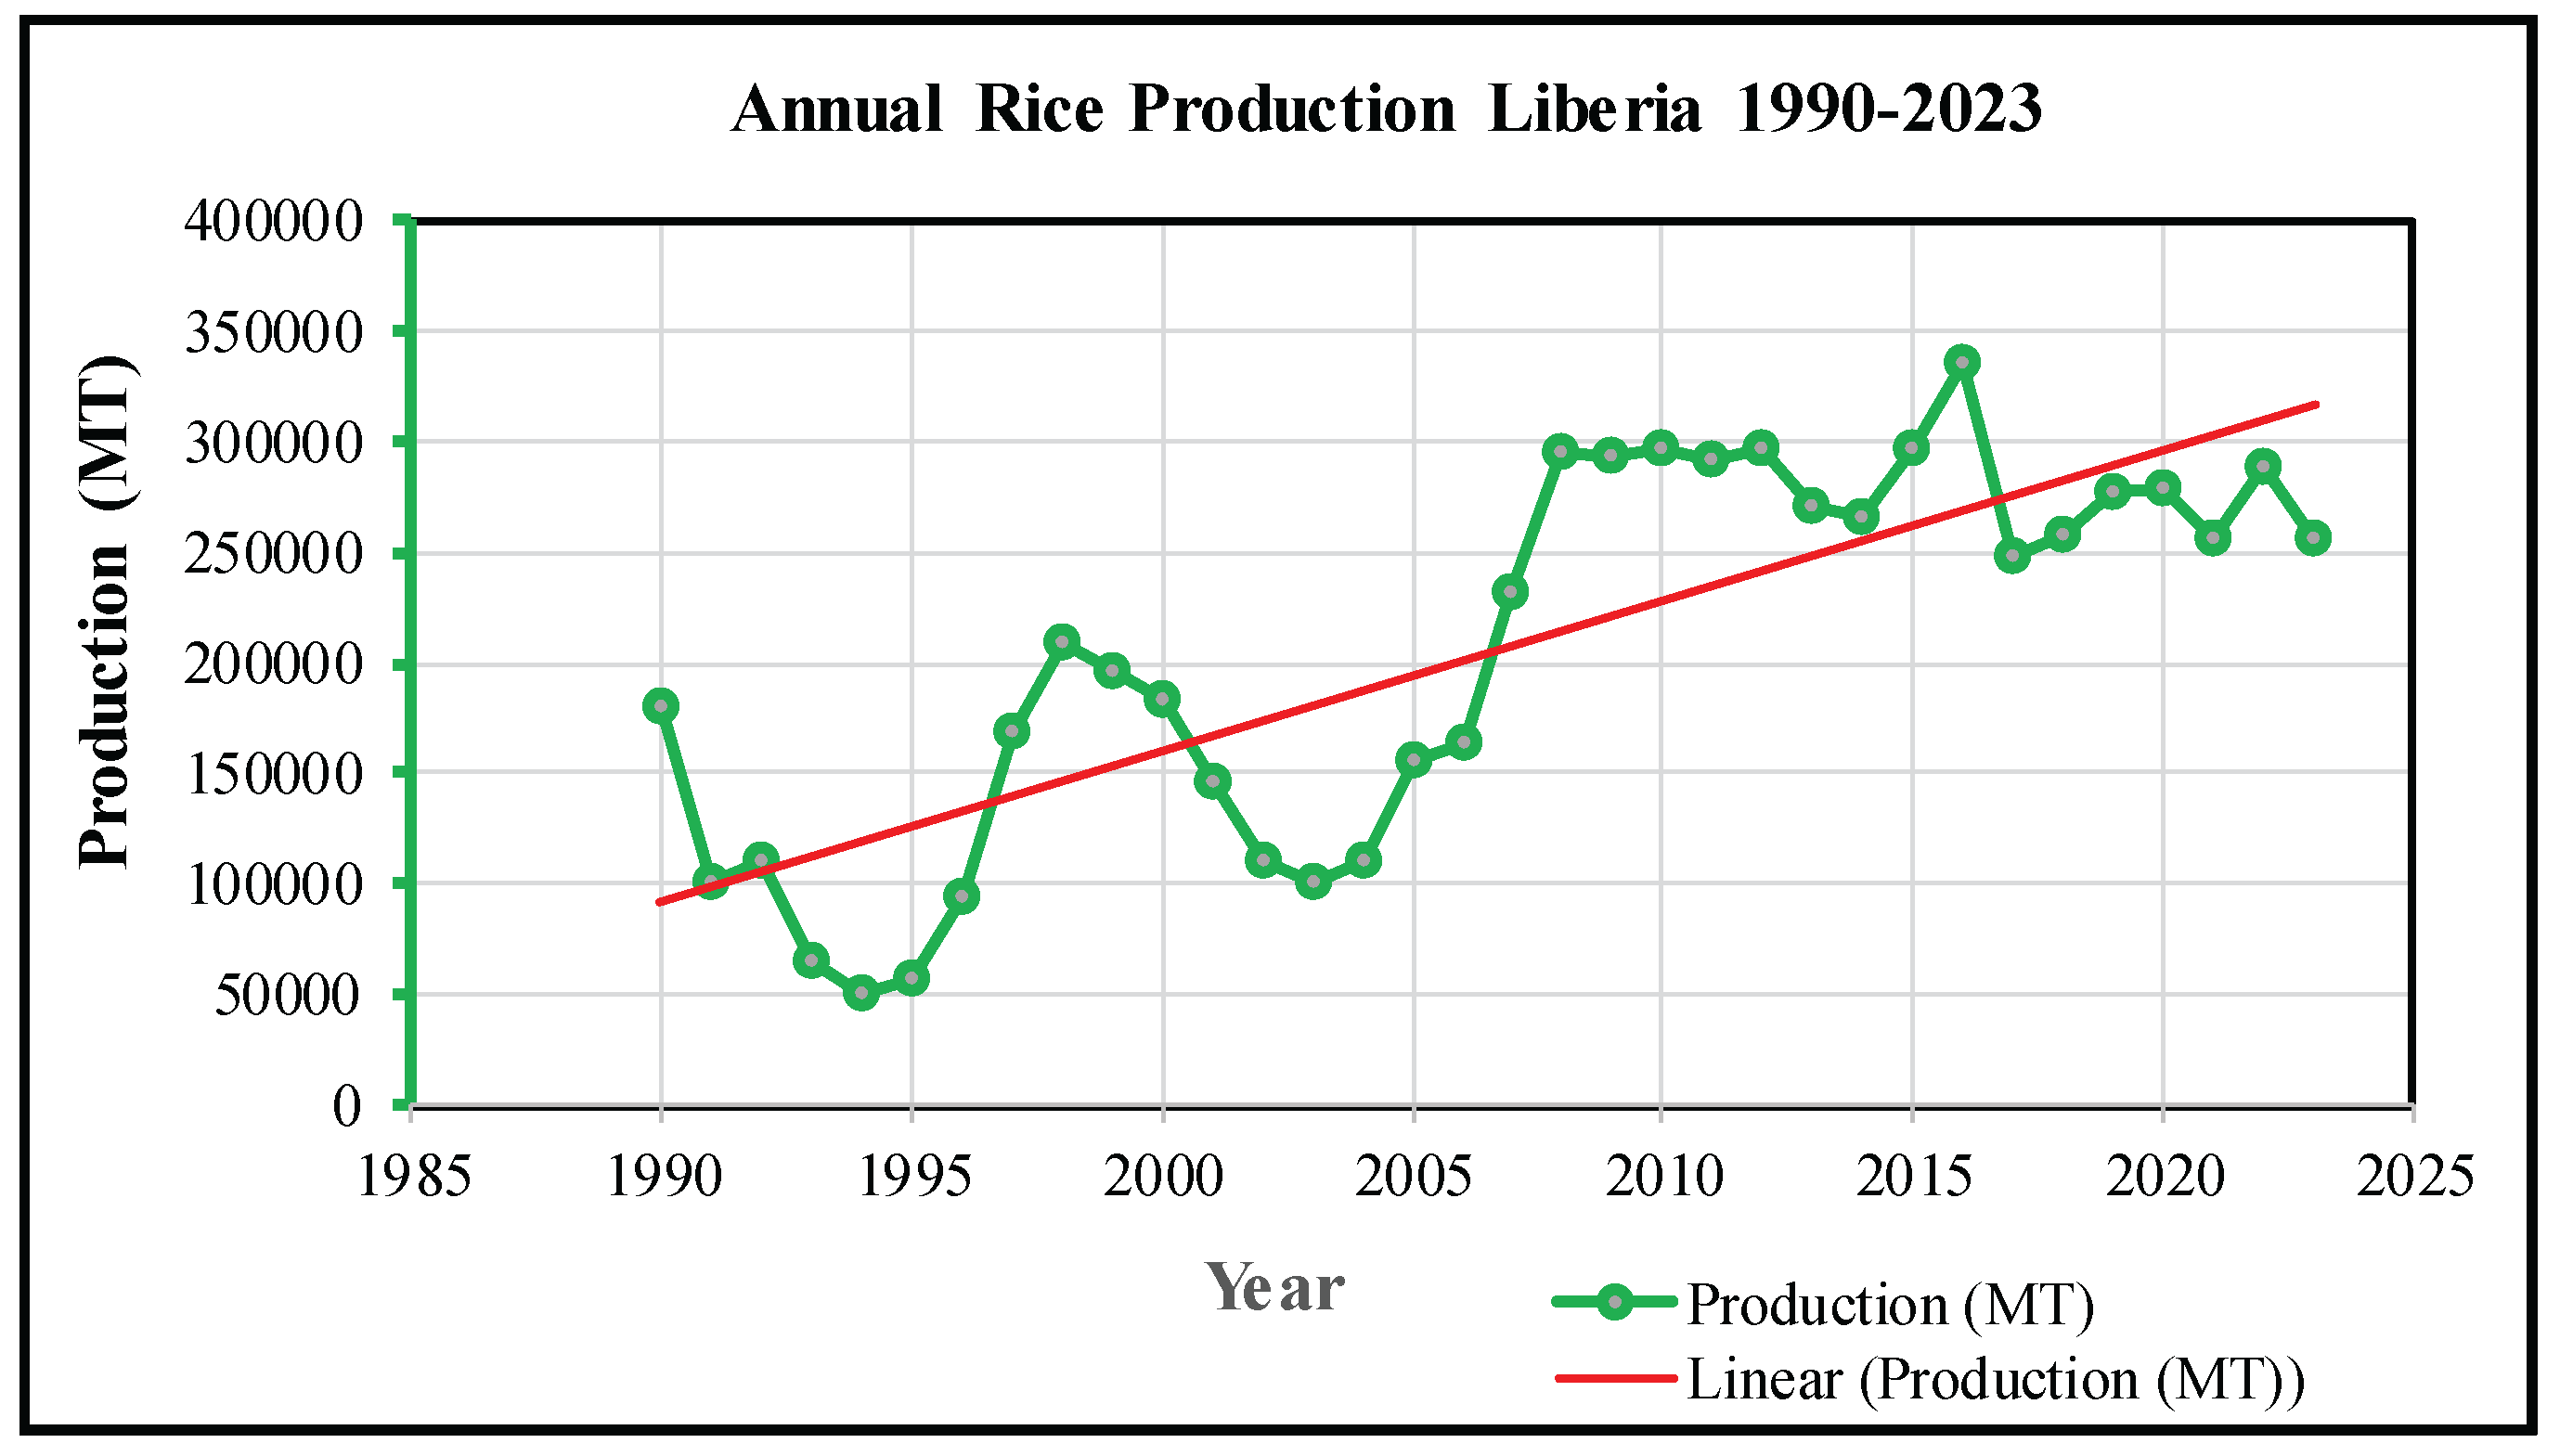
Figure 3.
Annual variability of total rice production in Liberia from 1990-2023.
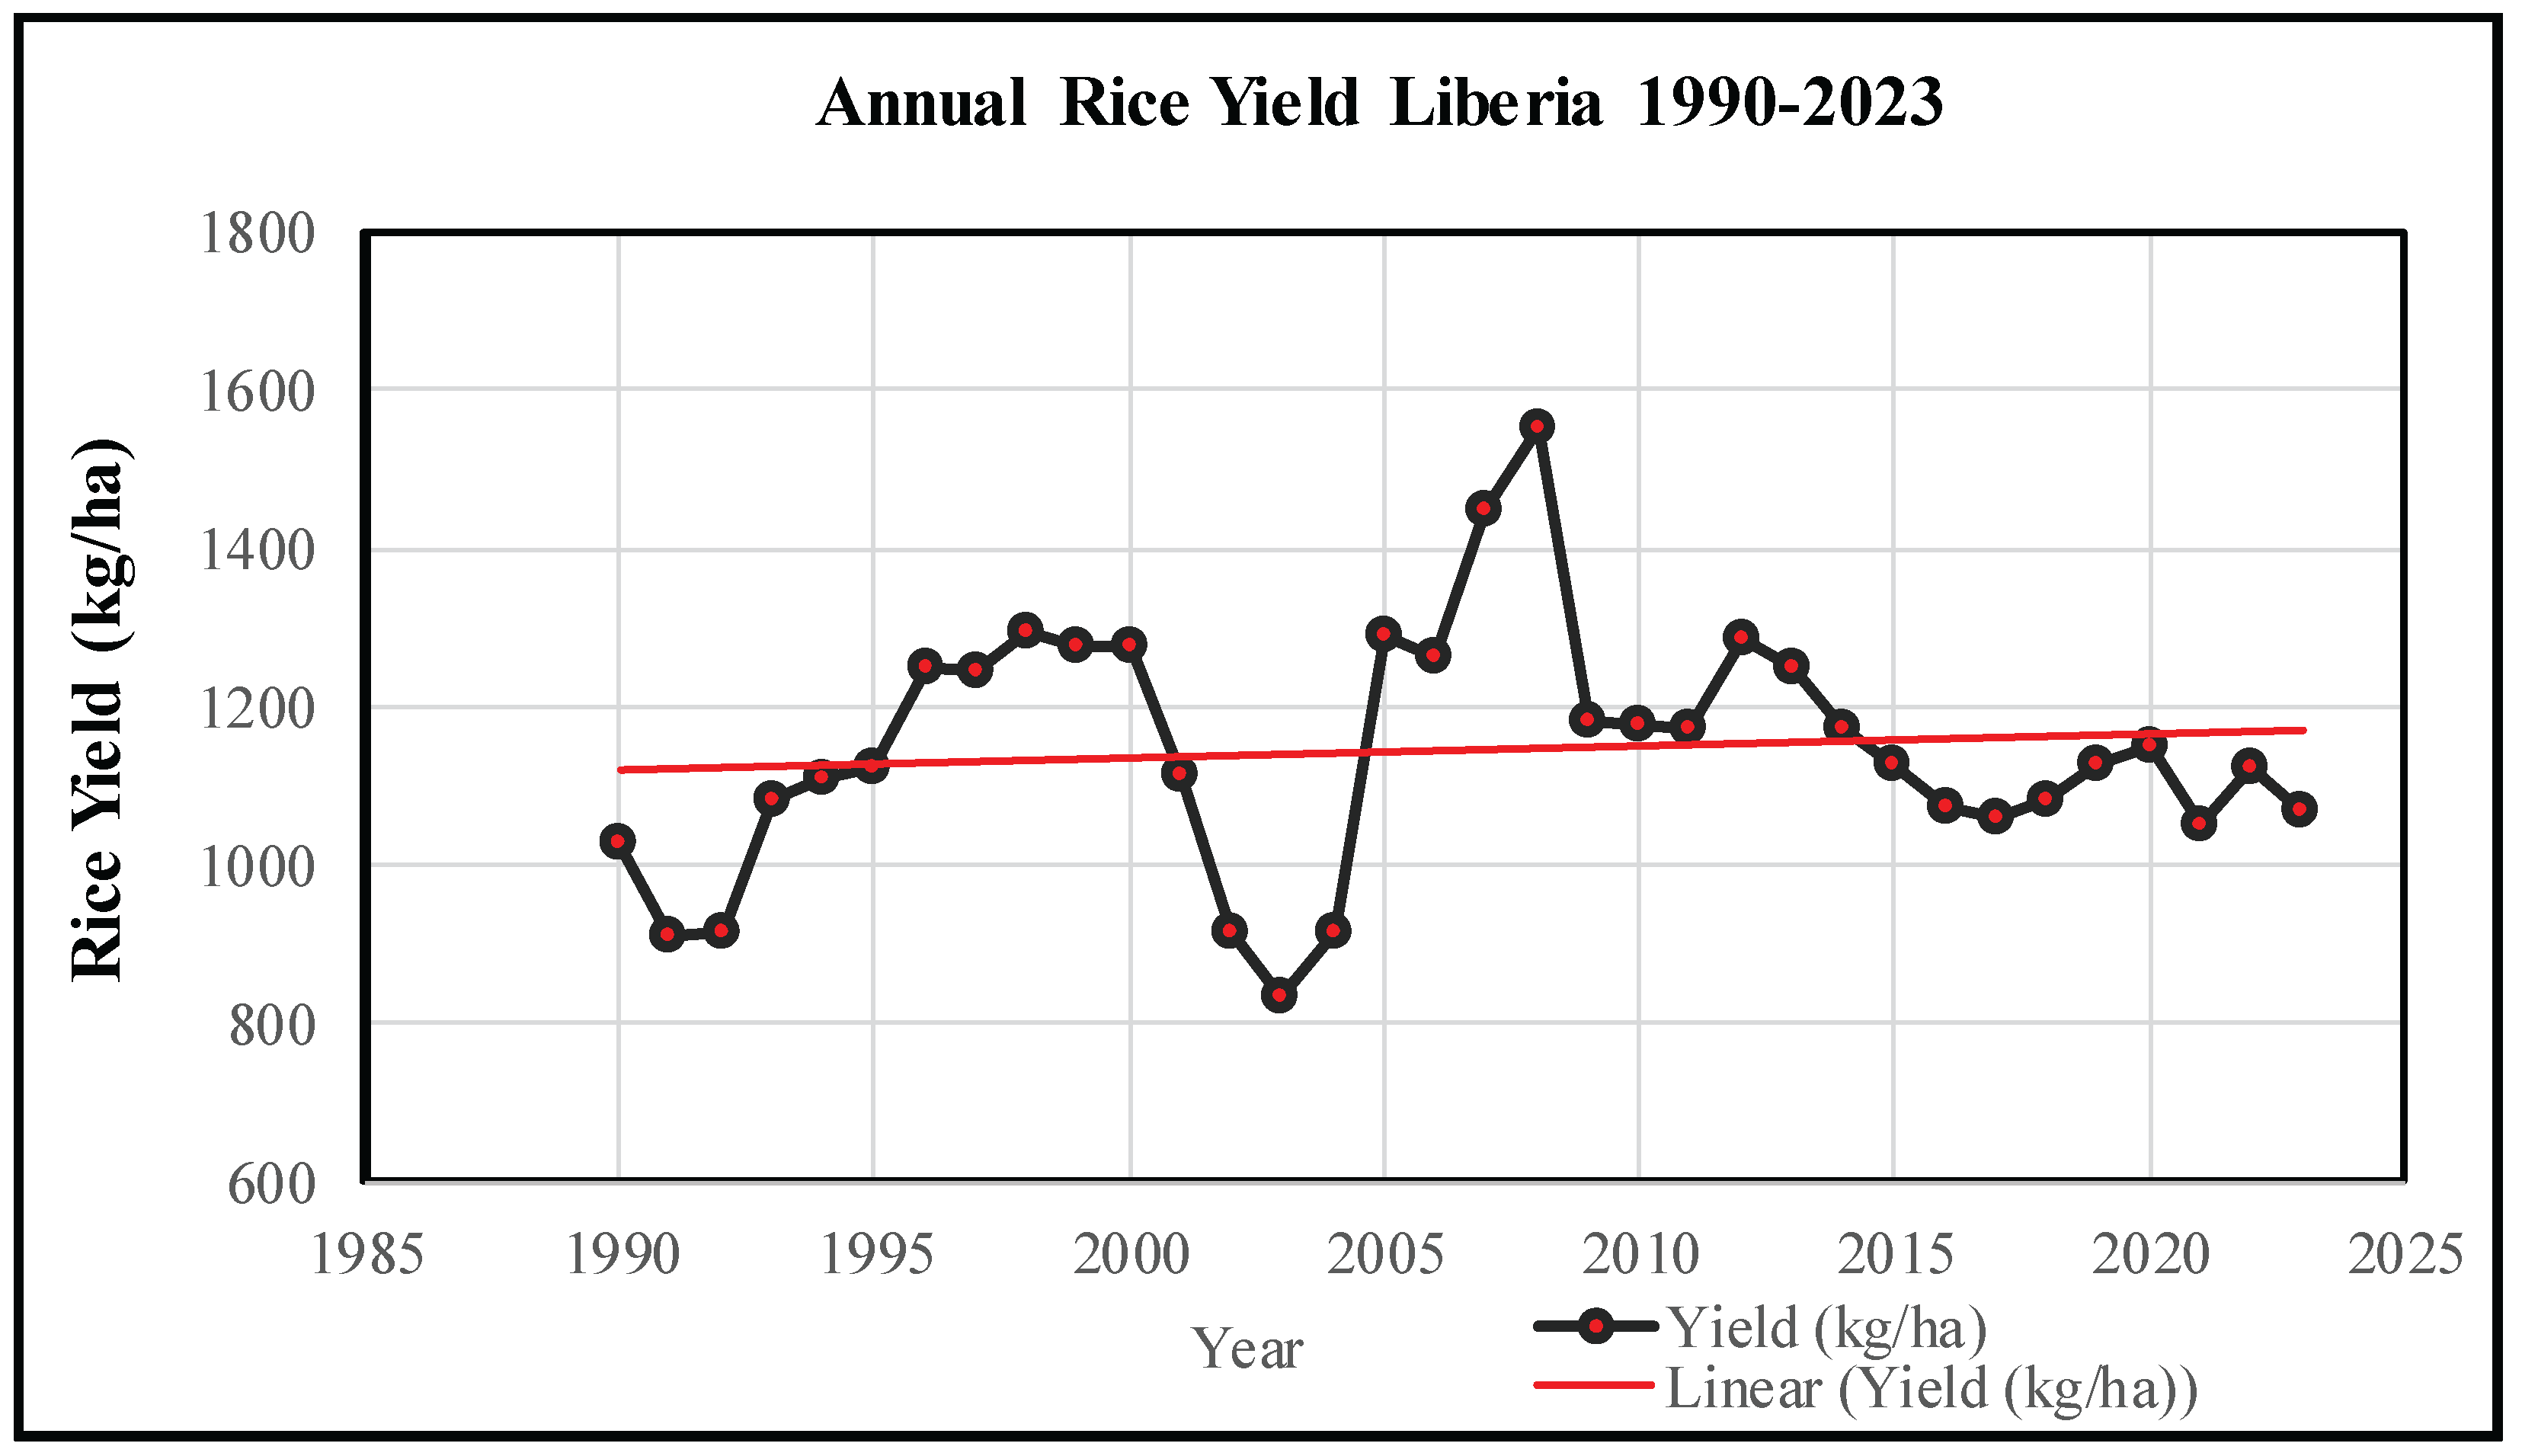
Figure 4.
Seasonal mean precipitation in Liberia from 1990-2023.
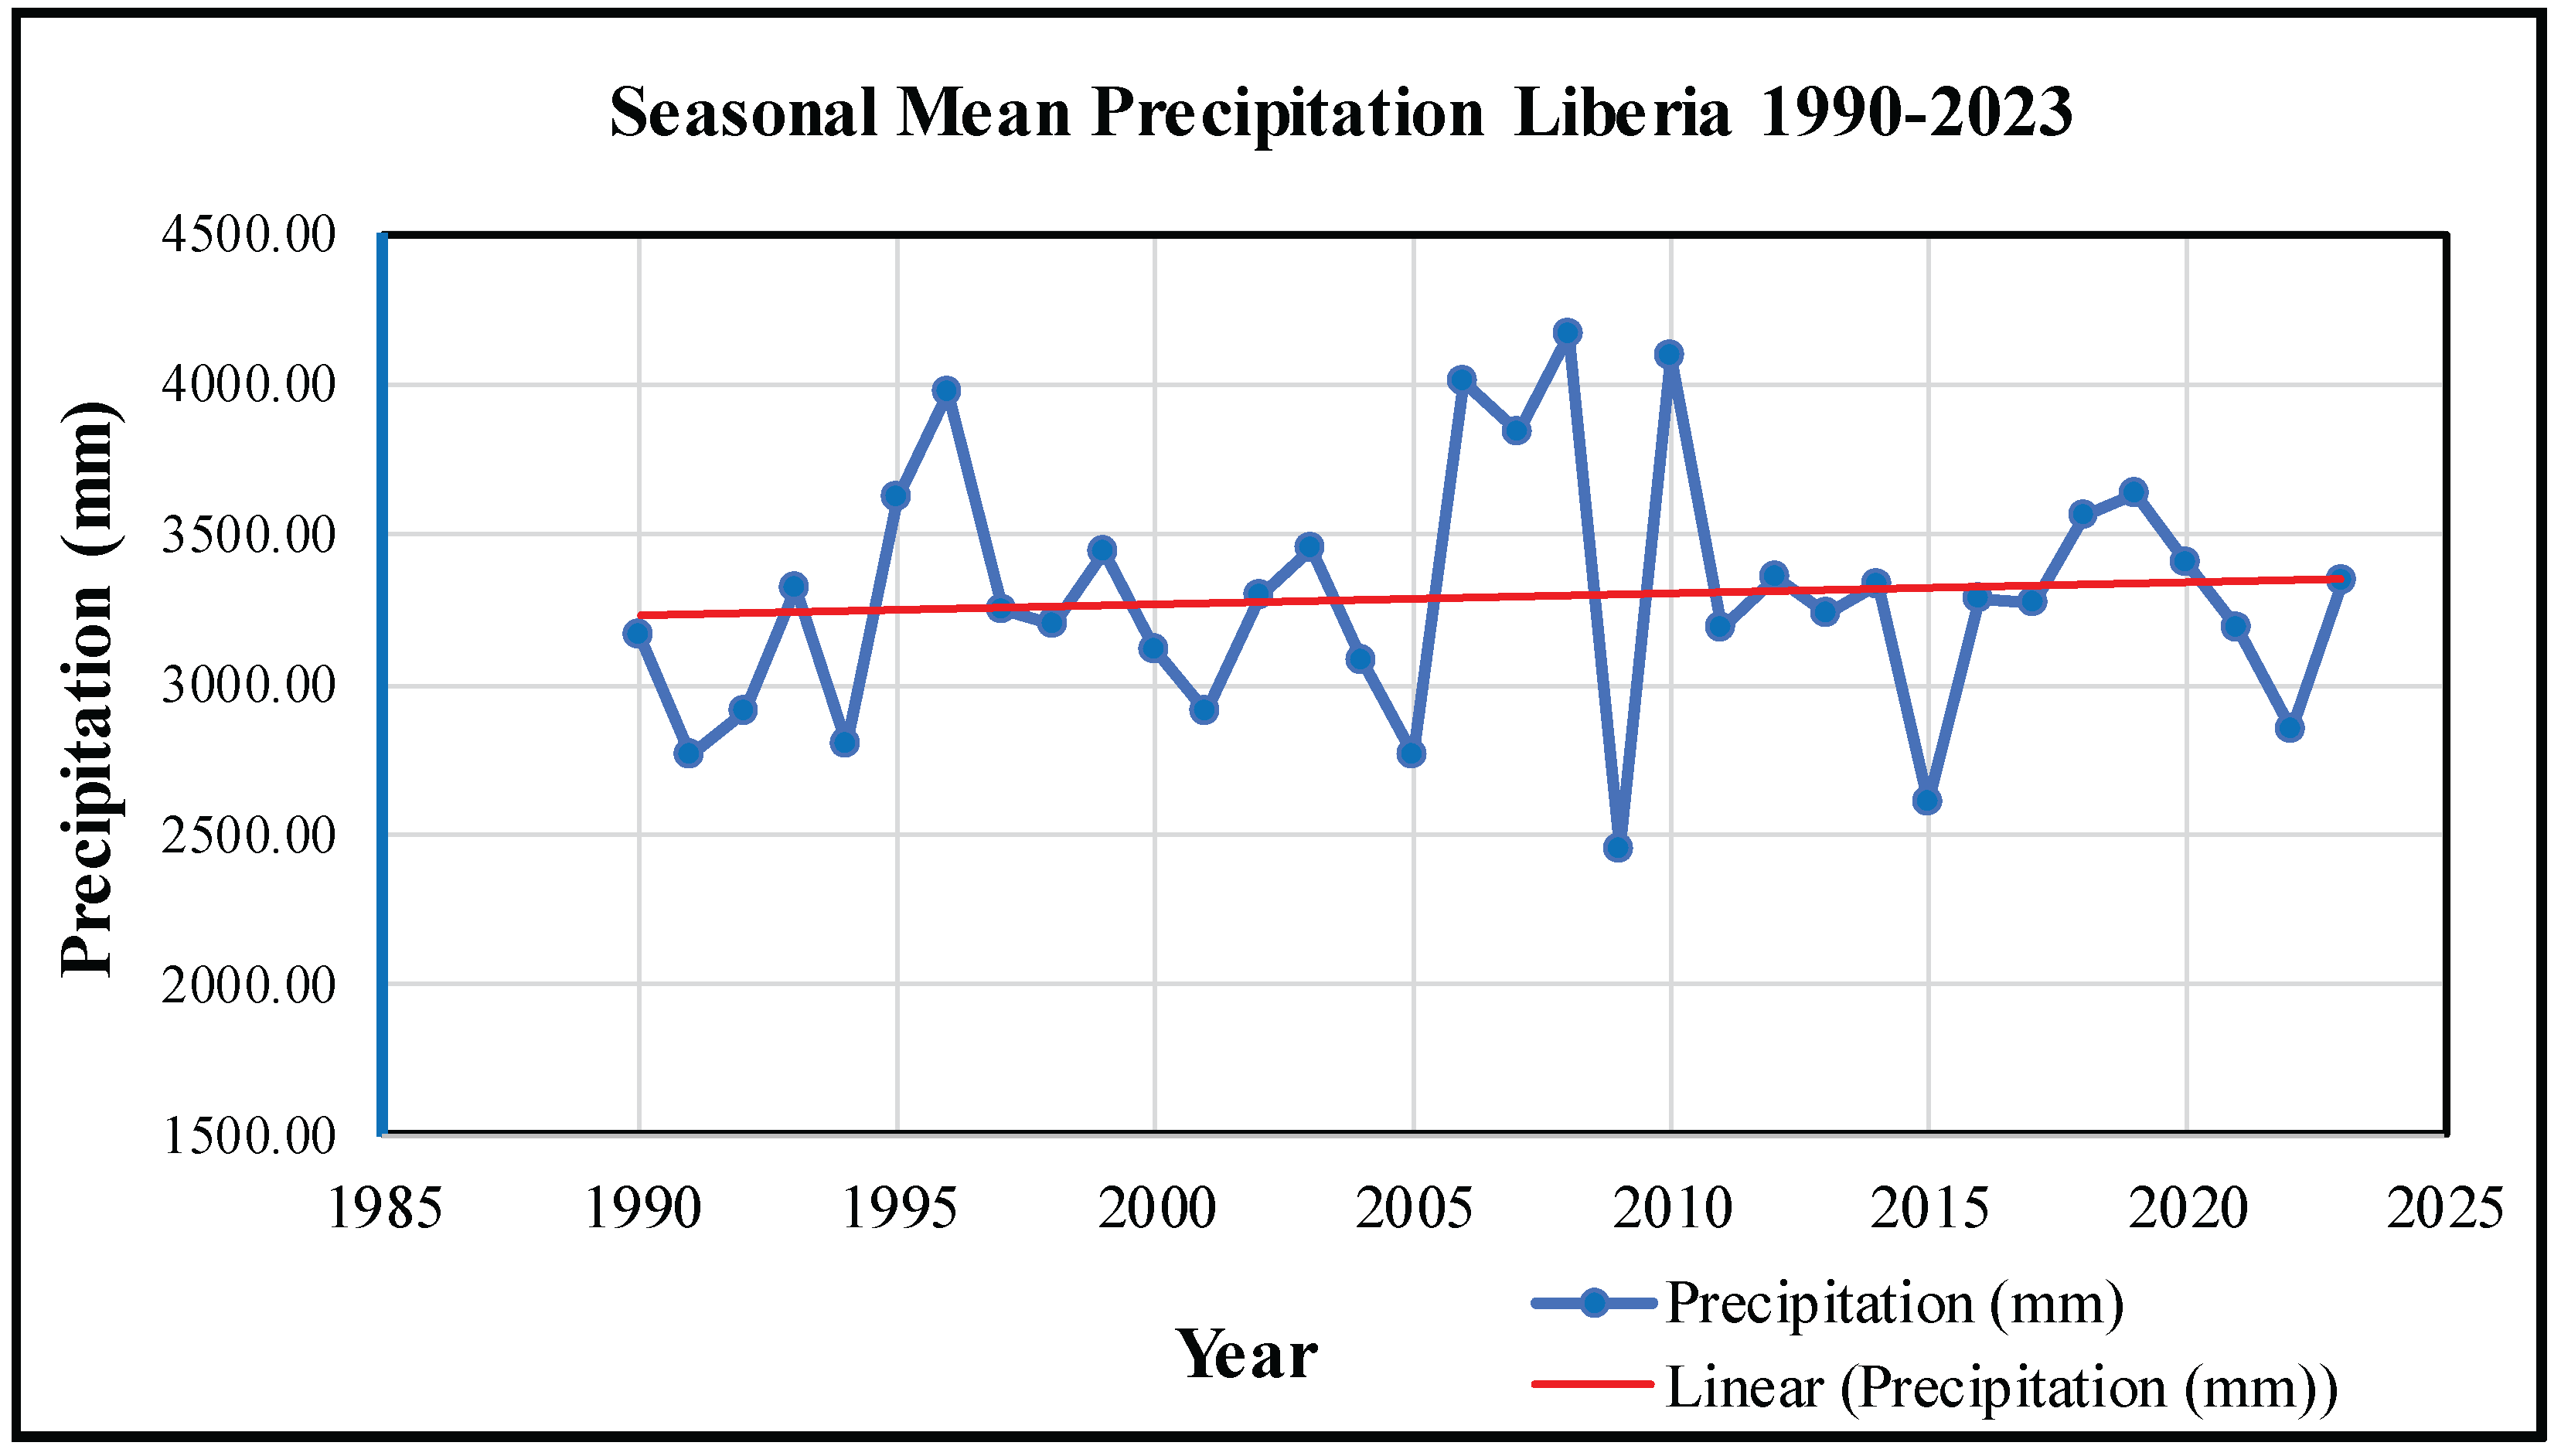
Figure 5.
Seasonal Mean temperature: (a) mean TMEAN, (b) mean TMIN, and (c) mean TMAX in Liberia from 1990-2023.
Figure 5.
Seasonal Mean temperature: (a) mean TMEAN, (b) mean TMIN, and (c) mean TMAX in Liberia from 1990-2023.
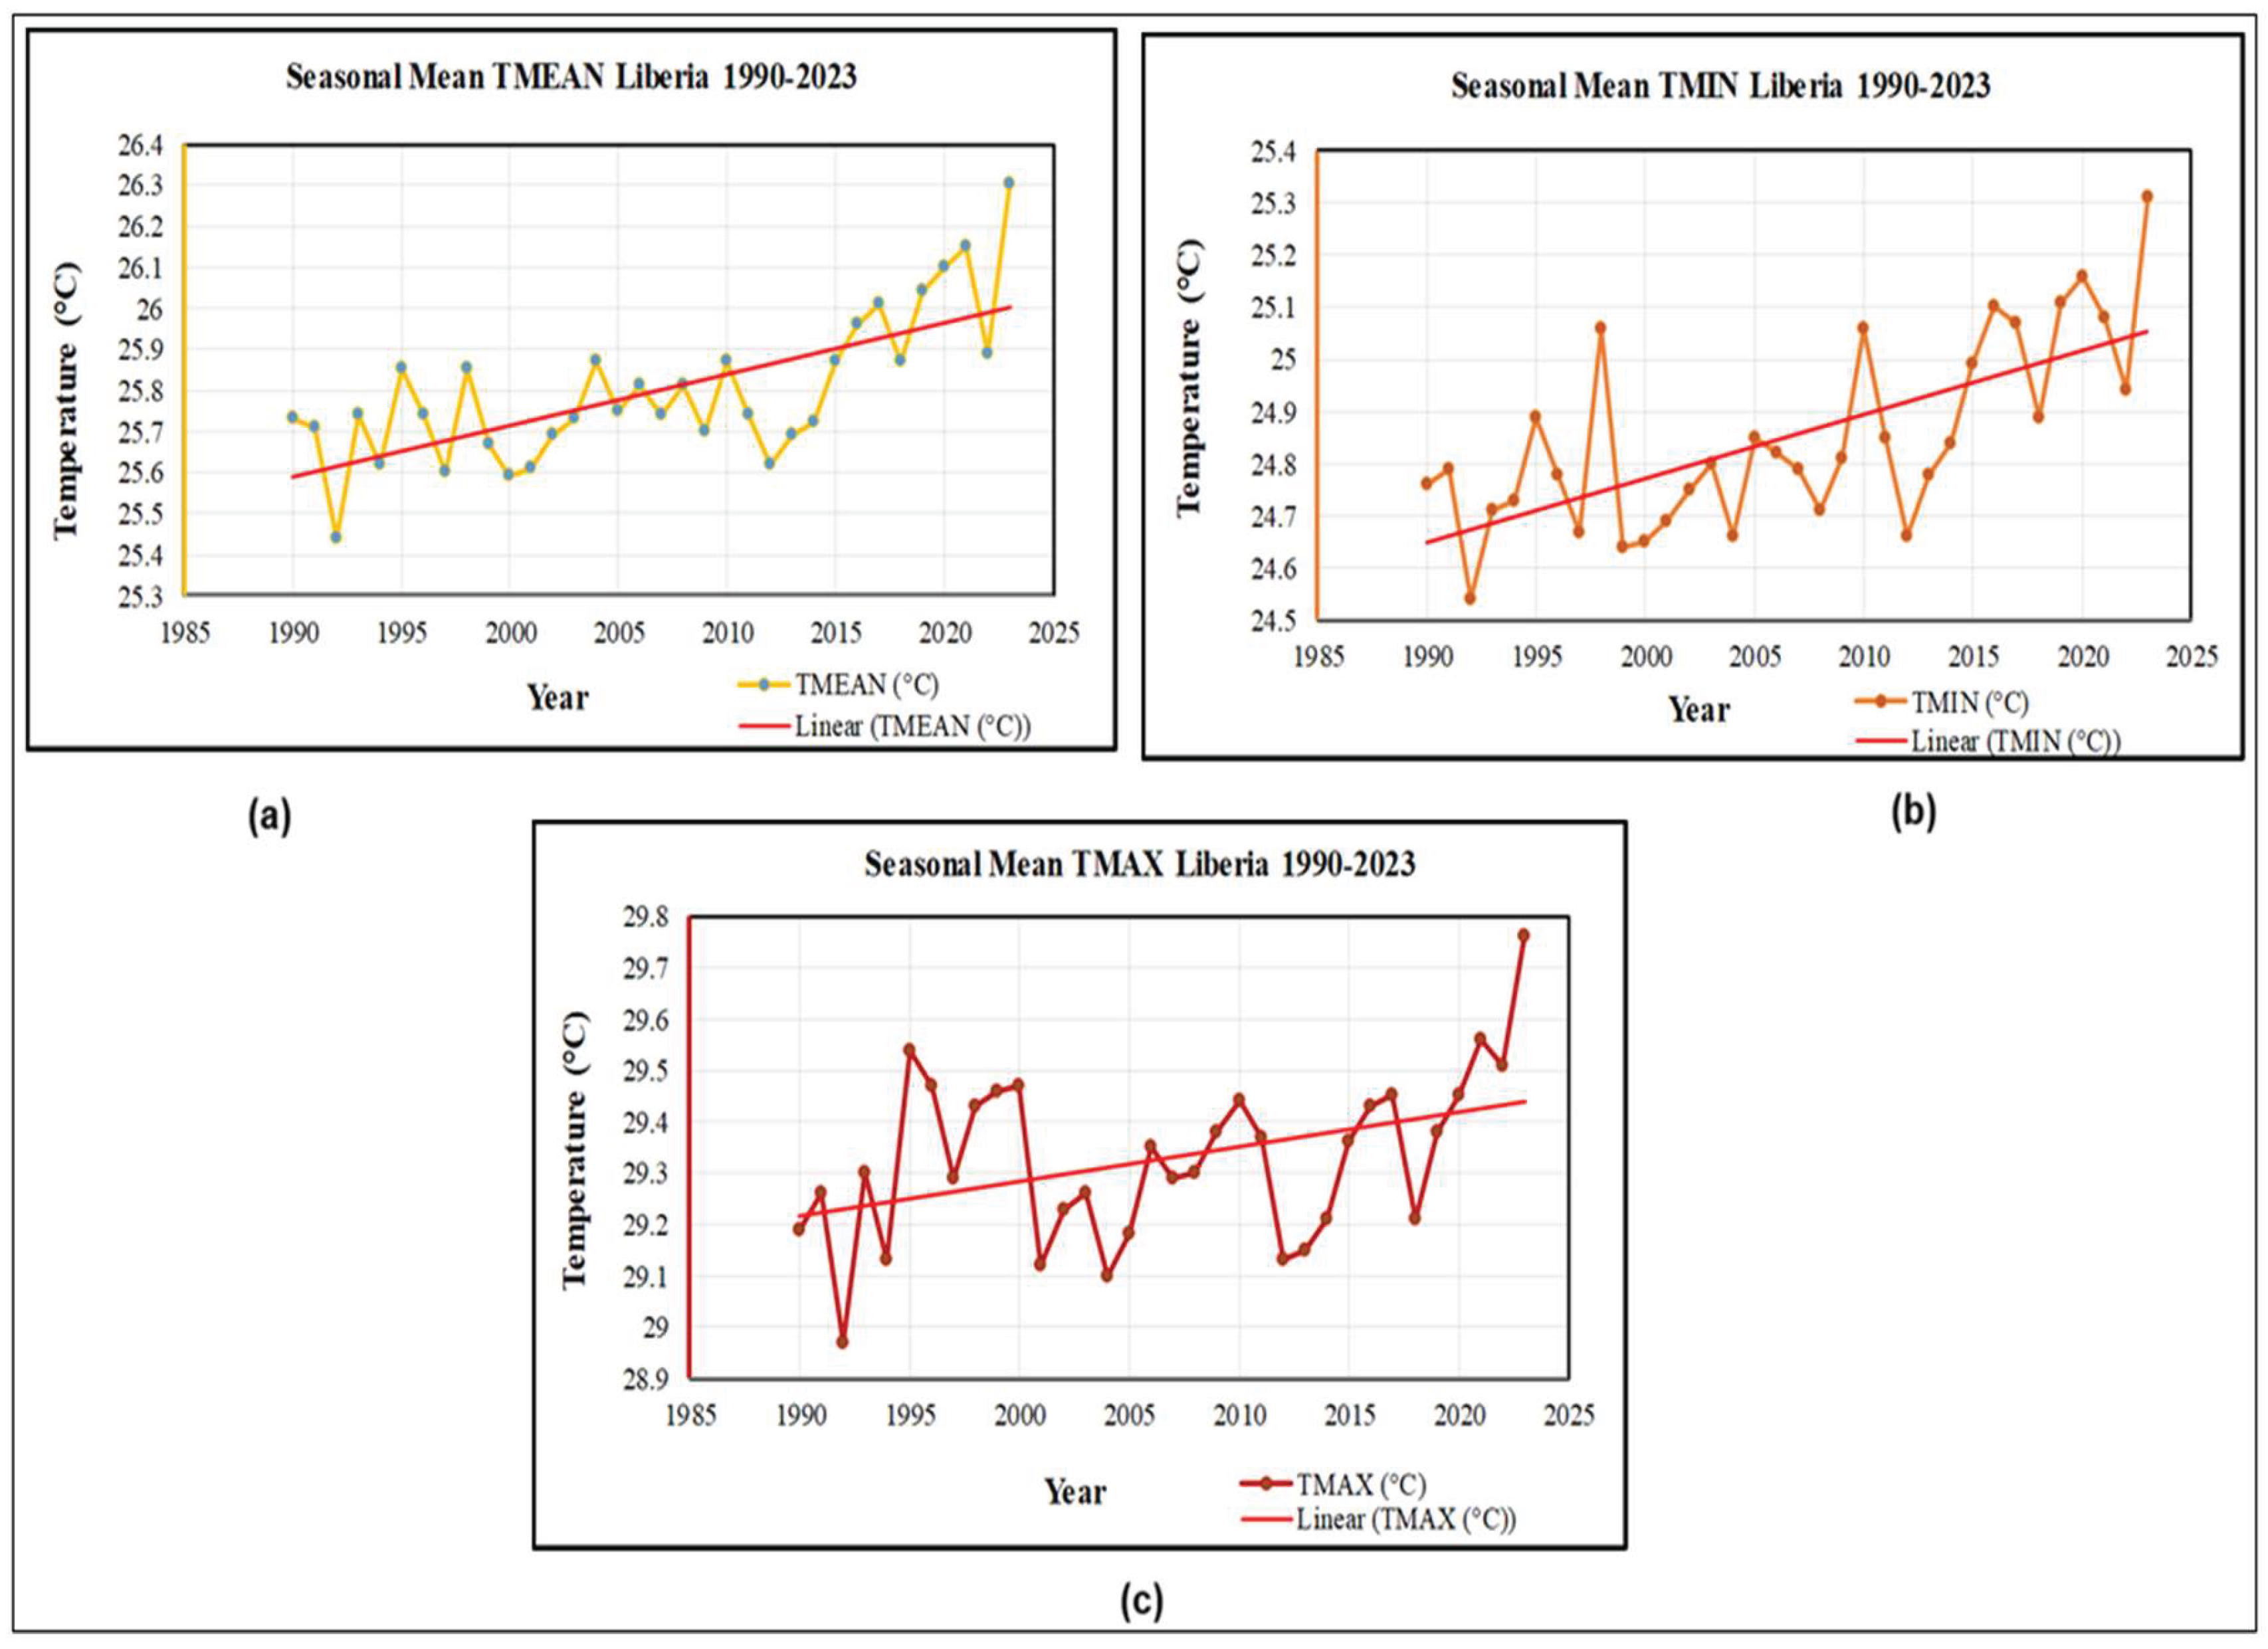

Table 1.
Mann-Kendall and Sens’s slope test results for rice production and yield.
| Factors | Kendall Tau | MK-Stat (S) | P-Value | Trend | Sen’s Slope |
|---|---|---|---|---|---|
| Production | 0.510 | 4.212 | P-value < 0.001 | Yes | 6515 |
| Yield | -0.0036 | -0.0148 | 0.9882 | No | 0 |
Table 2.
Mann-Kendall and Sen’s slope test for precipitation and temperature.
| Factors | Kendall Tau (τ) | MK-Stat (Z) | P-Value | Sig. | Sen’s Slope |
|---|---|---|---|---|---|
| Precipitation | 0.102 | 0.8301 | 0.464 | No | 5.144 |
| Mean Temperature | 0.511 | 4.1759 | < 0.001 | Yes | 0.119 |
| Minimum Temperature | 0.509 | 4.1985 | < 0.001 | Yes | 0.0125 |
| Maximum Temperature | 0.277 | 2.2704 | 0.023 | Yes | 0.0075 |
Table 3.
Correlation (r) between rice production (MT), yield (ton/ha) and climate variables precipitation (mm), mean, minimum, maximum temperatures (oC) (p < 0.05, n=34) during the period of 1990-2023.
Table 3.
Correlation (r) between rice production (MT), yield (ton/ha) and climate variables precipitation (mm), mean, minimum, maximum temperatures (oC) (p < 0.05, n=34) during the period of 1990-2023.
| Rice | Precipitation | Temperature | ||||||
|---|---|---|---|---|---|---|---|---|
| mean | minimum | maximum | ||||||
| Correlation | P-Value | Correlation | P-Value | Correlation | P-Value | Correlation | P-Value | |
| Production | -0.010 | 0.956 | -0.303 | 0.082 | -0.111 | 0.531 | 0.021 | 0.908 |
| Yield | 0.259 | 0.139 | -0.284 | 0.104 | -0.205 | 0.246 | 0.112 | 0.527 |
Table 4.
Correlation (r) between rice production (MT), yield (ton/ha) and climate variables precipitation (mm), mean, minimum, maximum temperatures (o C) (p < 0.001) under different time interval.
Table 4.
Correlation (r) between rice production (MT), yield (ton/ha) and climate variables precipitation (mm), mean, minimum, maximum temperatures (o C) (p < 0.001) under different time interval.
| Precipitation | Temperature | |||||||
|---|---|---|---|---|---|---|---|---|
| mean | Minimum | maximum | ||||||
| Factors Per Time Interval | Correlation | P-Value | Correlation | P-Value | Correlation | P-Value | Correlation | P-Value |
| TI-I. Production | ||||||||
| 1990-1995 | -0.314 | 0.544 | -0.429 | 0.397 | -0.371 | 0.469 | -0.543 | 0.266 |
| 1995-1998 | -0.8 | 0.2 | -0.105 | 0.895 | 0.2 | 0.8 | -0.8 | 0.2 |
| 1998-2003 | -0.314 | 0.544 | 0.2 | 0.704 | 1 | < 0.001*** | 1 | < 0.001*** |
| 2003-2008 | 0.383 | 0.309 | -0.100 | 0.797 | -0.233 | 0.546 | 0.533 | 0.139 |
| TI-II. Yield | ||||||||
| 2000-2003 | -0.80 | 0.20 | -10 | < 0.001*** | -10 | < 0.001*** | 0.20 | 0.80 |
| 2003-2005 | -10 | < 0.001*** | 0.50 | 0.667 | 0.50 | 0.667 | -0.5 | 0.633 |
| 2012-2023 | 0.154 | 0.633 | -0.760 | 0.004** | -0.608 | 0.036* | -0.796 | 0.002** |
TI-I, production, and TI-II, yield, under different time interval; significant levels– p-value < 0.001 (***), p-value < 0.01 (**), p-value < 0.05 (*).
Table 5.
Regression results of climate variables precipitation (mm), minimum, maximum temperatures (oC) and rice production (MT), (p-value < 0.05, n=34).
Table 5.
Regression results of climate variables precipitation (mm), minimum, maximum temperatures (oC) and rice production (MT), (p-value < 0.05, n=34).
| Predictor | Coefficient | Std. Error | t-stat | P-Value |
|---|---|---|---|---|
| Intercept | -5.077 | 2.462 | -2.062 | 0.048* |
| Precipitation | 9.335 | 33.31 | 0.280 | 0.781 |
| TMini | -2.676 | 1.031 | 2.593 | 0.015* |
| TMax | -4.767 | 1.164 | -0.410 | 0.685 |
* P-value < 0.05, R² = 0.2616.
Table 6.
Regression results of climate variables precipitation (mm), mean, minimum, maximum temperatures (oC) and rice yield (ton/ha) (p < 0.05, n=34).
Table 6.
Regression results of climate variables precipitation (mm), mean, minimum, maximum temperatures (oC) and rice yield (ton/ha) (p < 0.05, n=34).
| Predictor | Coefficient | Std. Error | t-stat | P-Value |
|---|---|---|---|---|
| Intercept | -37.482 | 4485.479 | -0.084 | 0.934 |
| Precipitation | 0.134 | 0.061 | 2.201 | 0.036* |
| TMini | -327.594 | 189.915 | -1.743 | 0.092 |
| TMax | 275.450 | 211.997 | 1.299 | 0.204 |
* P-value < 0.05, R² = 0.231.
Disclaimer/Publisher’s Note: The statements, opinions and data contained in all publications are solely those of the individual author(s) and contributor(s) and not of MDPI and/or the editor(s). MDPI and/or the editor(s) disclaim responsibility for any injury to people or property resulting from any ideas, methods, instructions or products referred to in the content. |
© 2026 by the authors. Licensee MDPI, Basel, Switzerland. This article is an open access article distributed under the terms and conditions of the Creative Commons Attribution (CC BY) license (http://creativecommons.org/licenses/by/4.0/).
Copyright: This open access article is published under a Creative Commons CC BY 4.0 license, which permit the free download, distribution, and reuse, provided that the author and preprint are cited in any reuse.


