Submitted:
09 February 2026
Posted:
10 February 2026
You are already at the latest version
Abstract
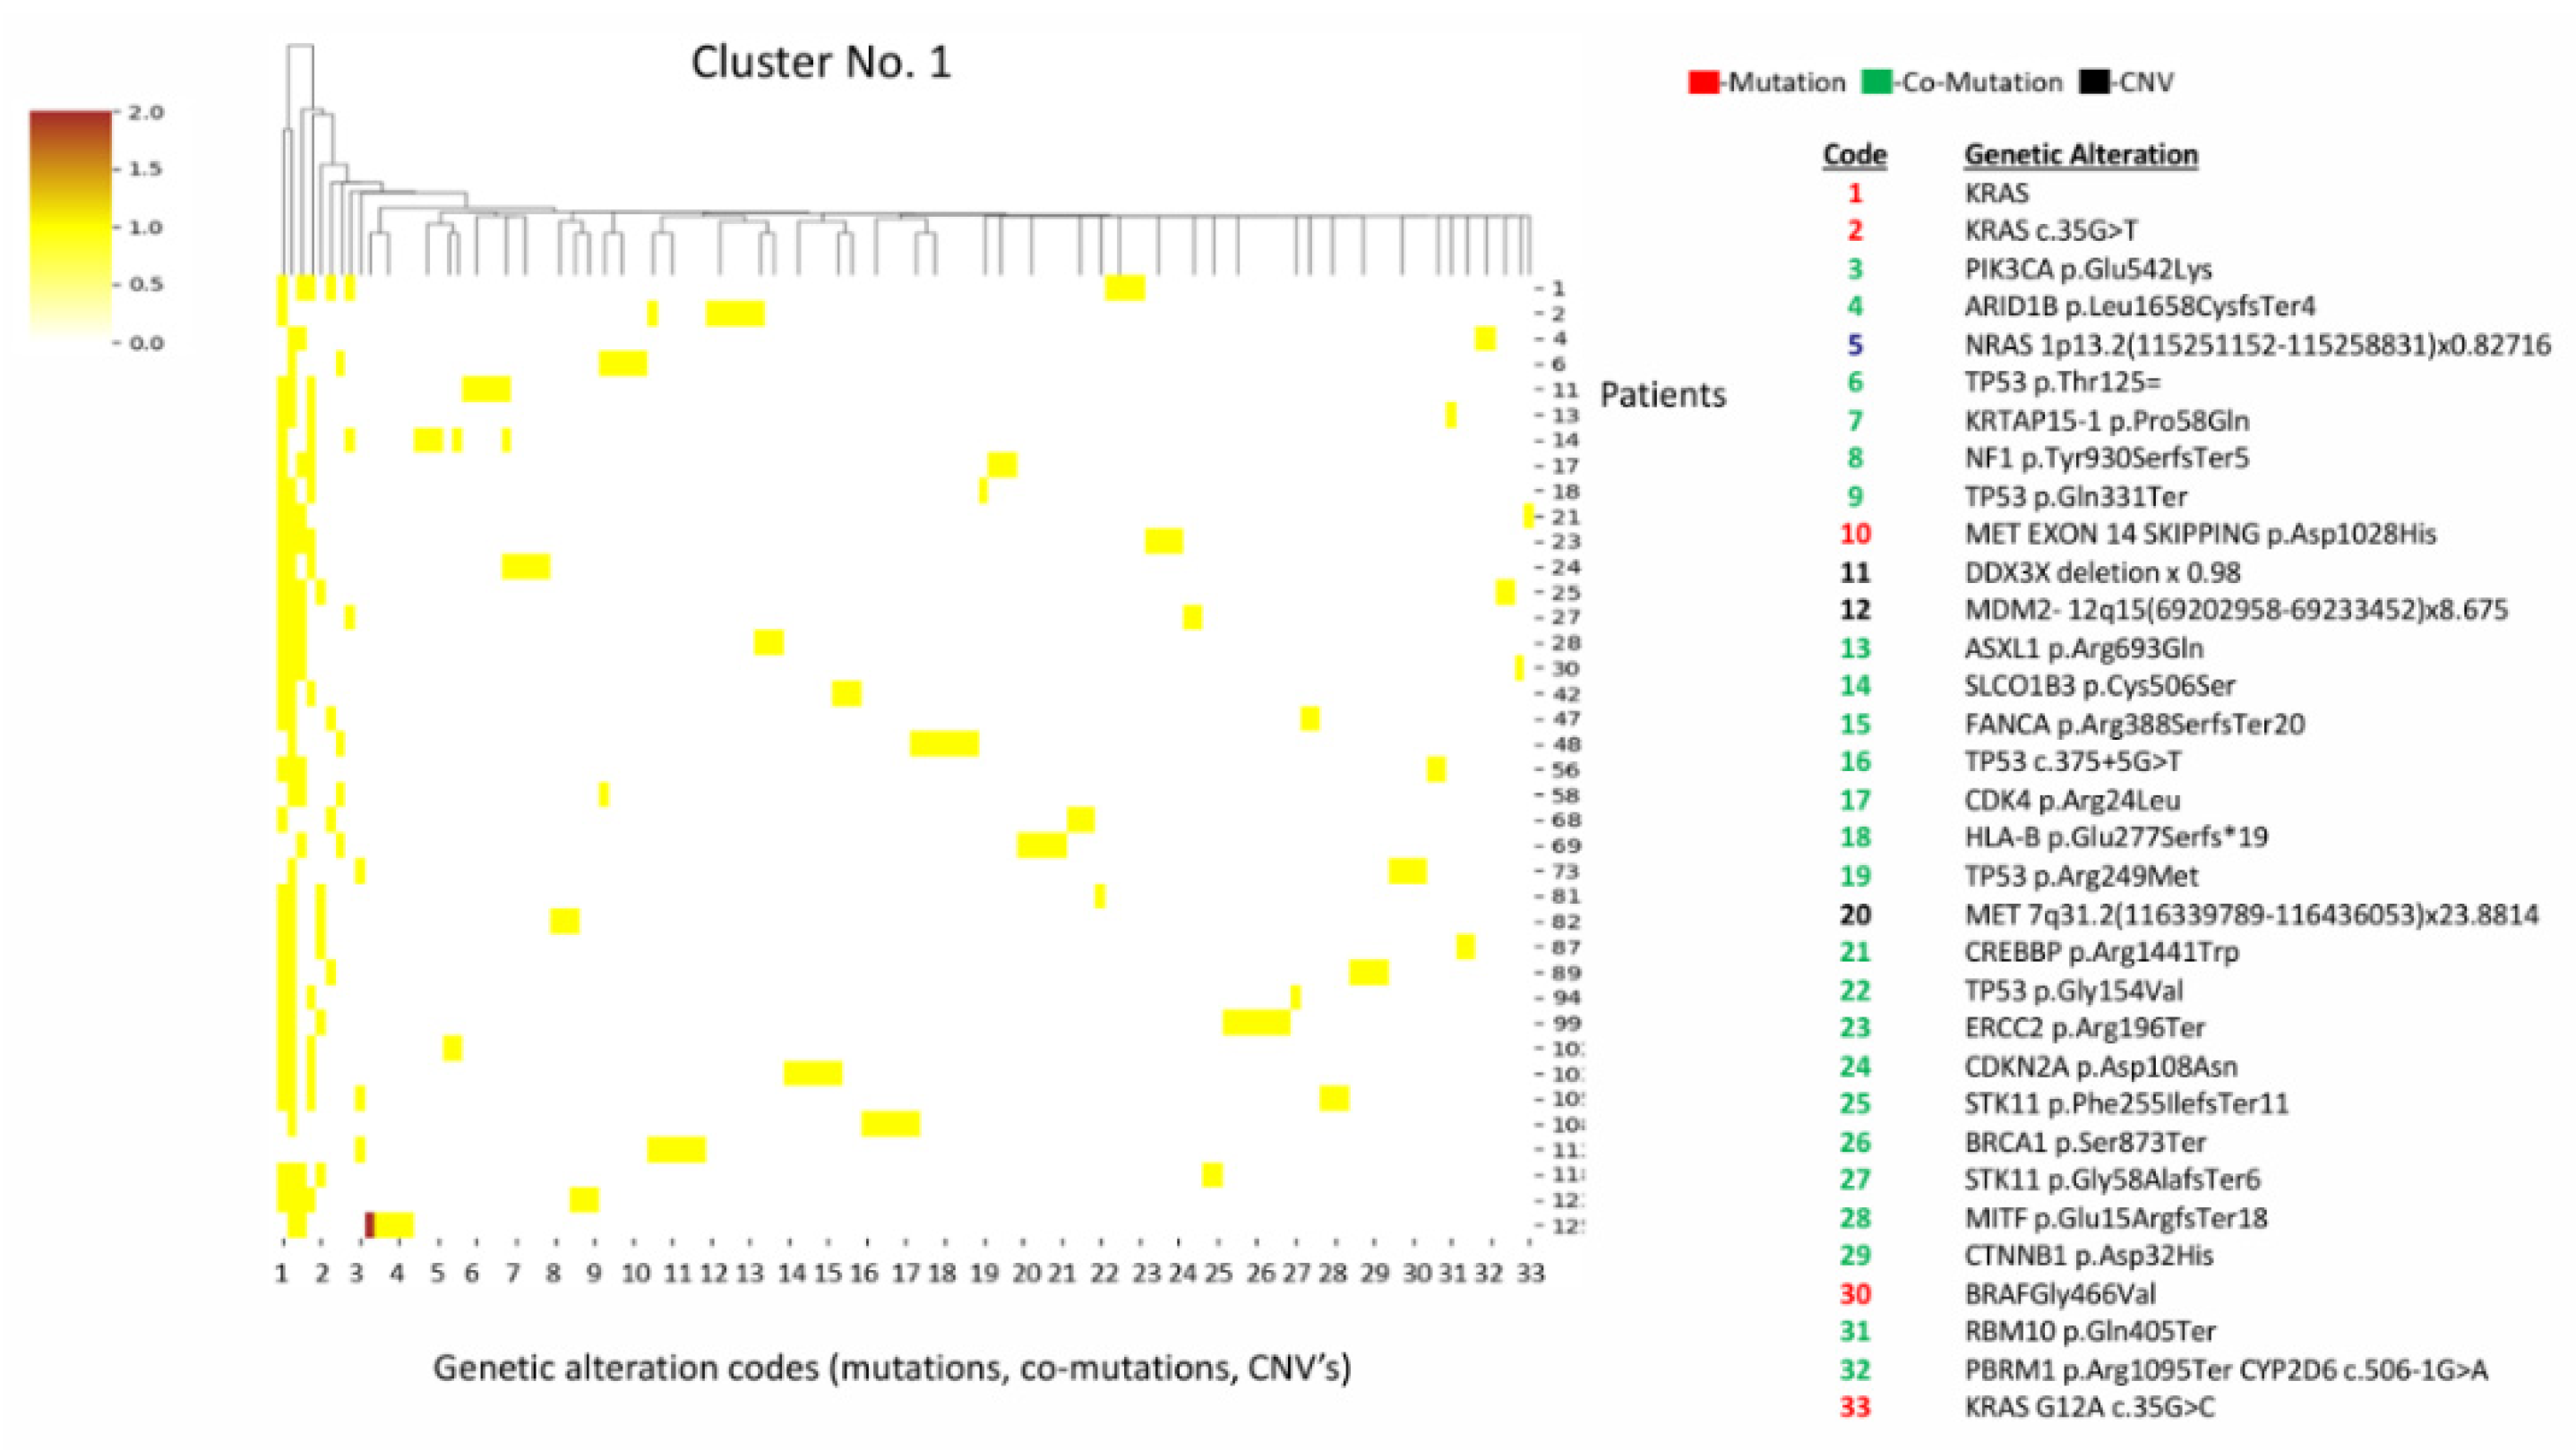
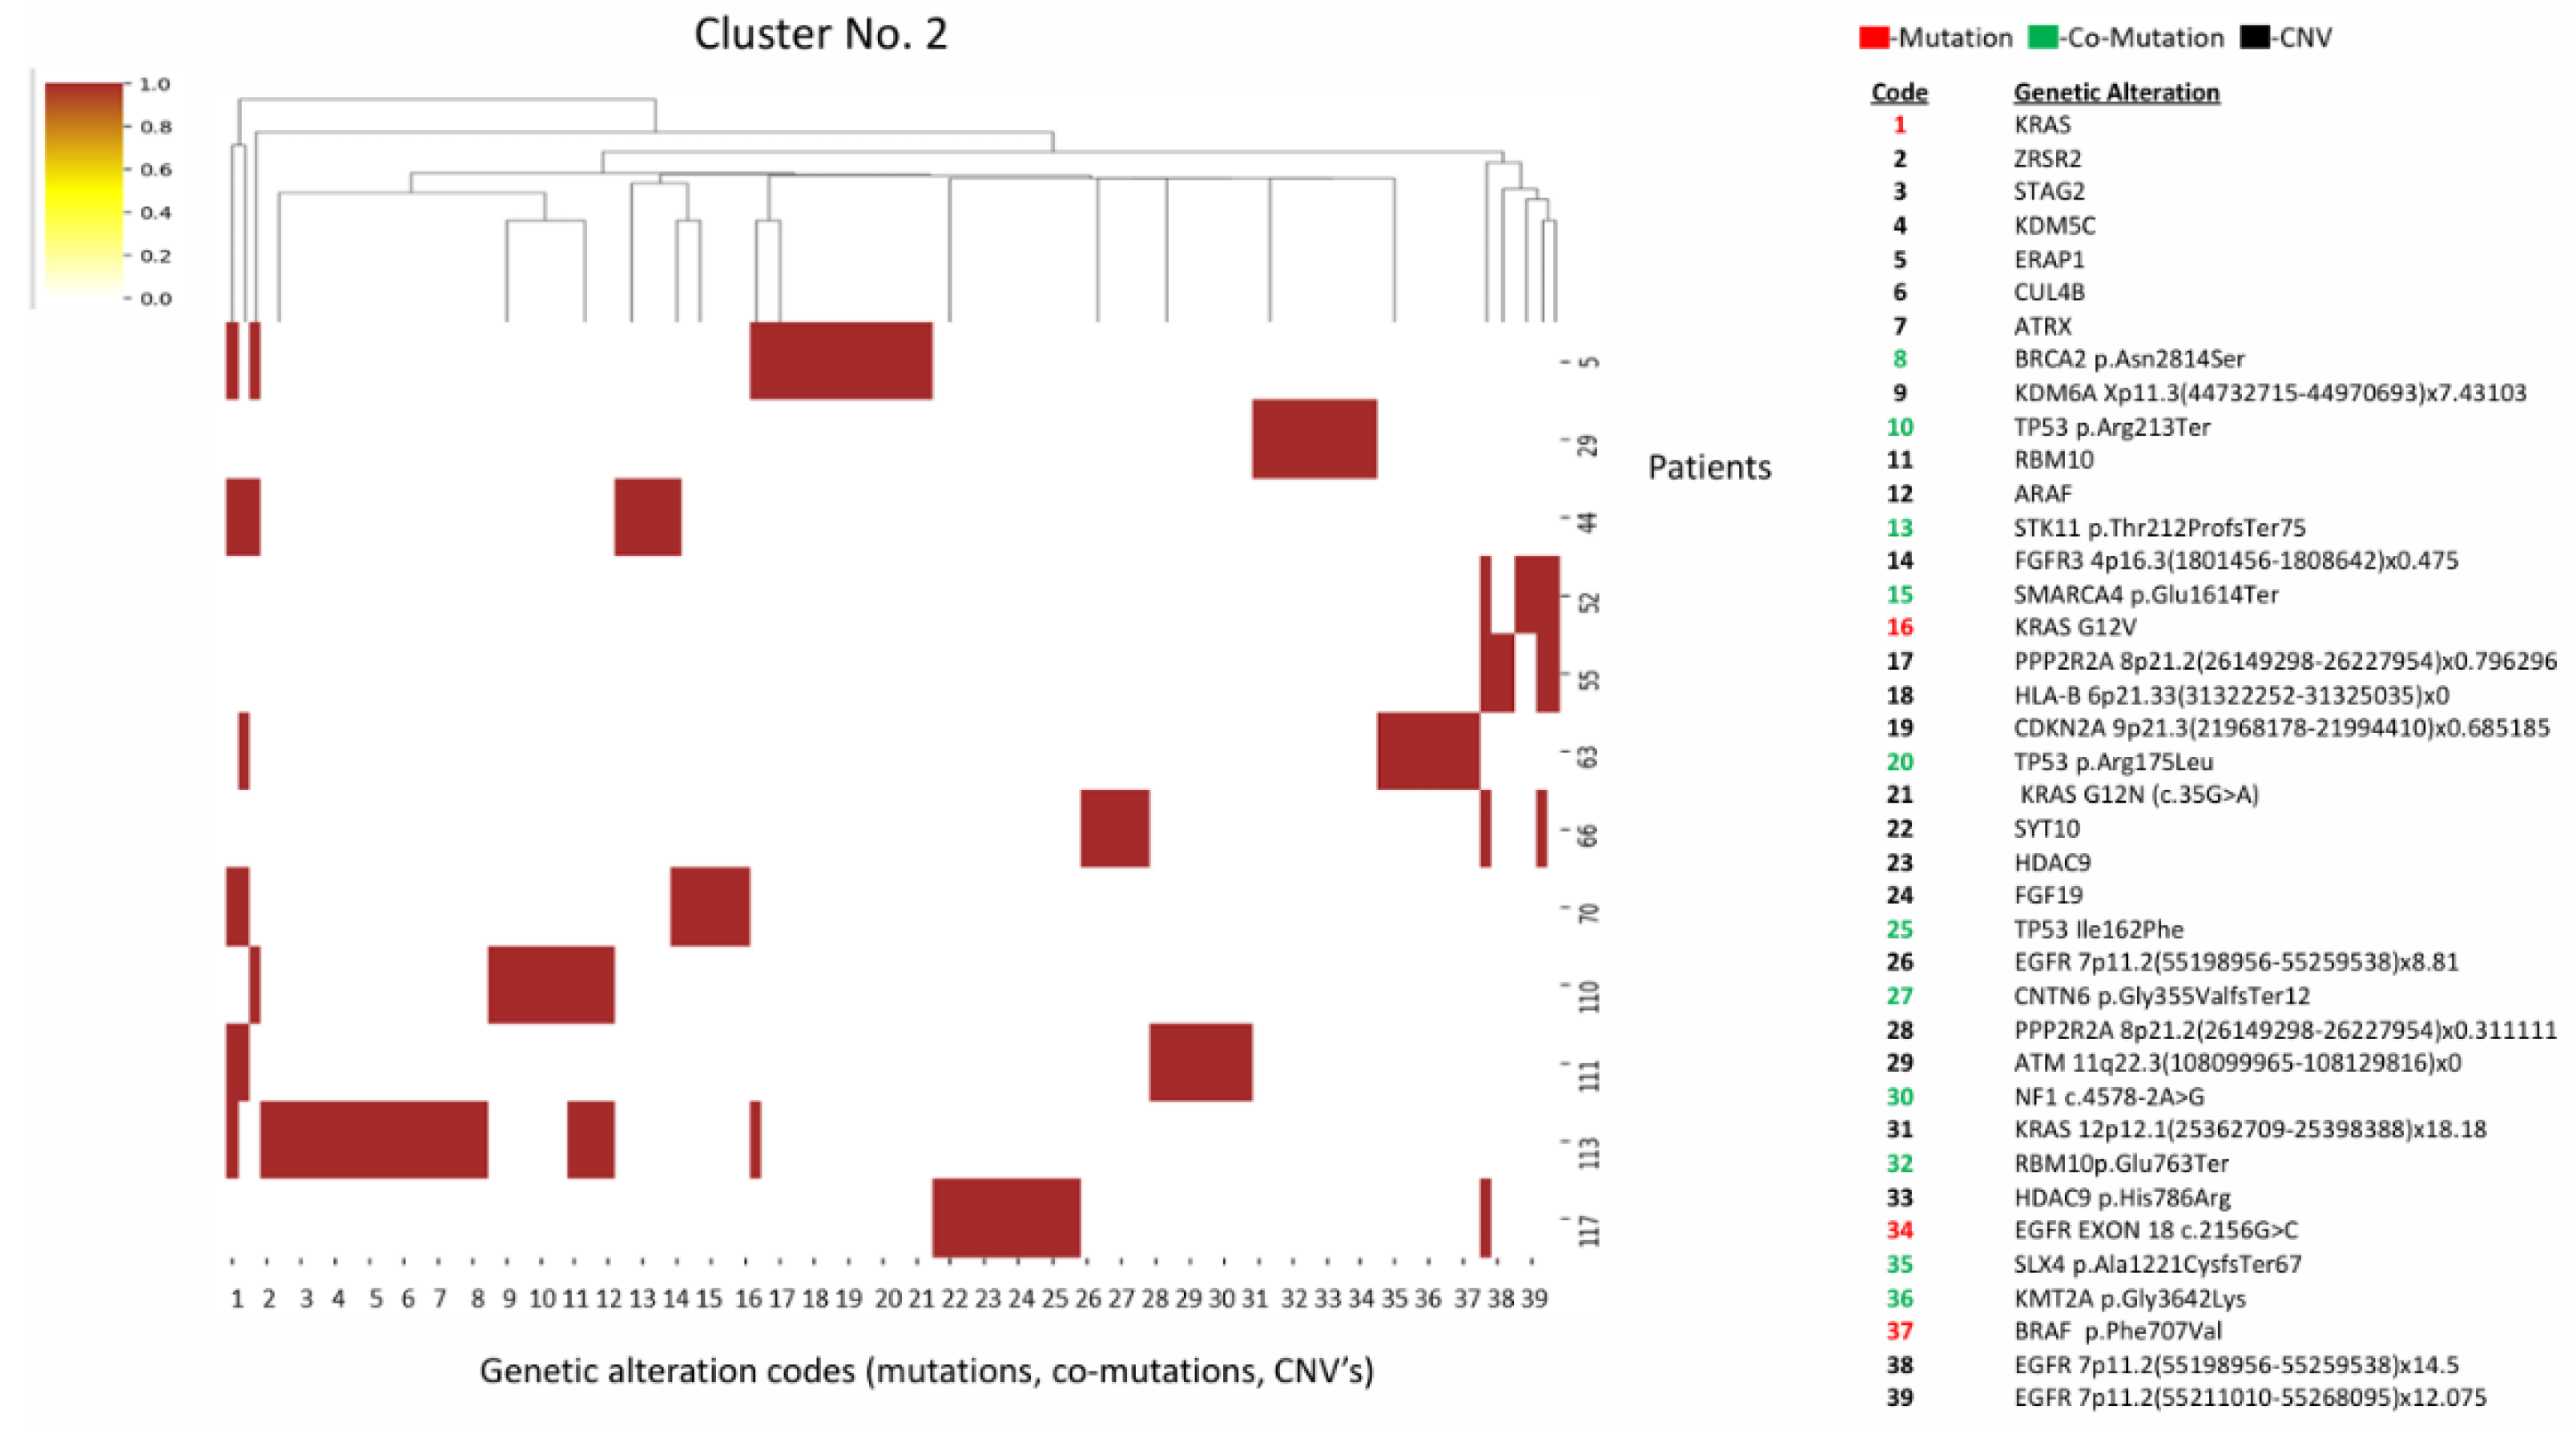
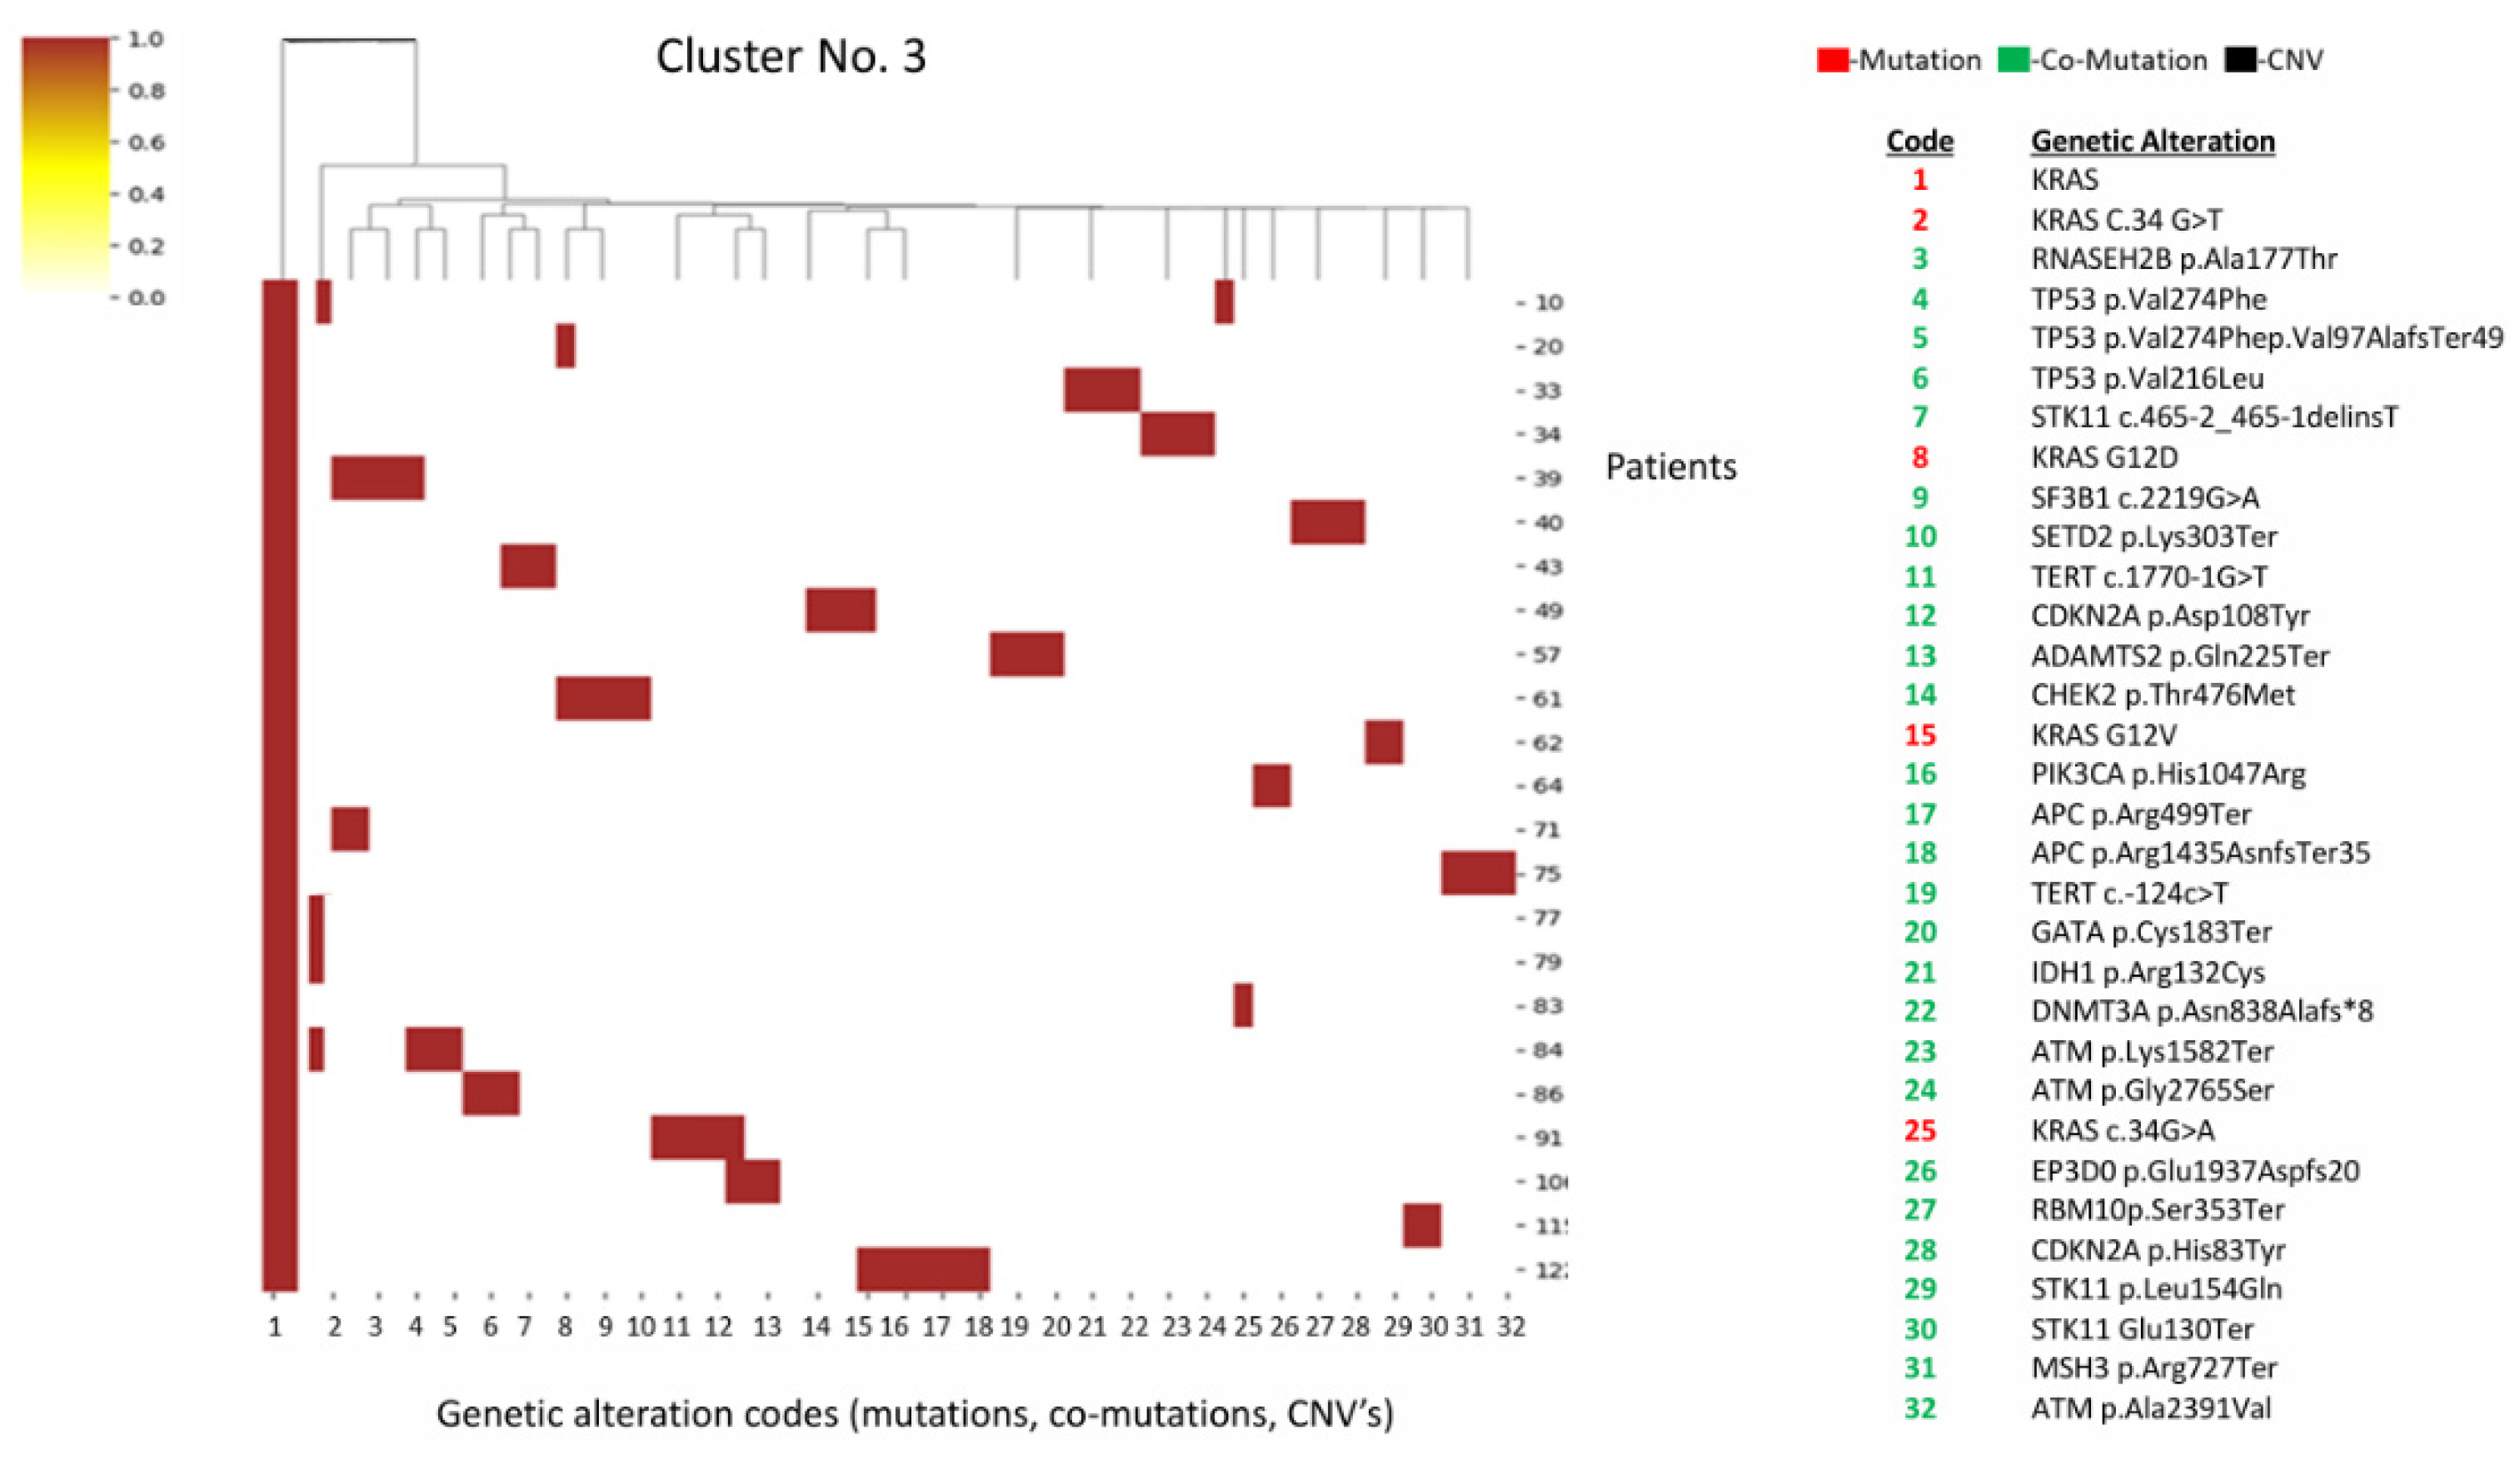
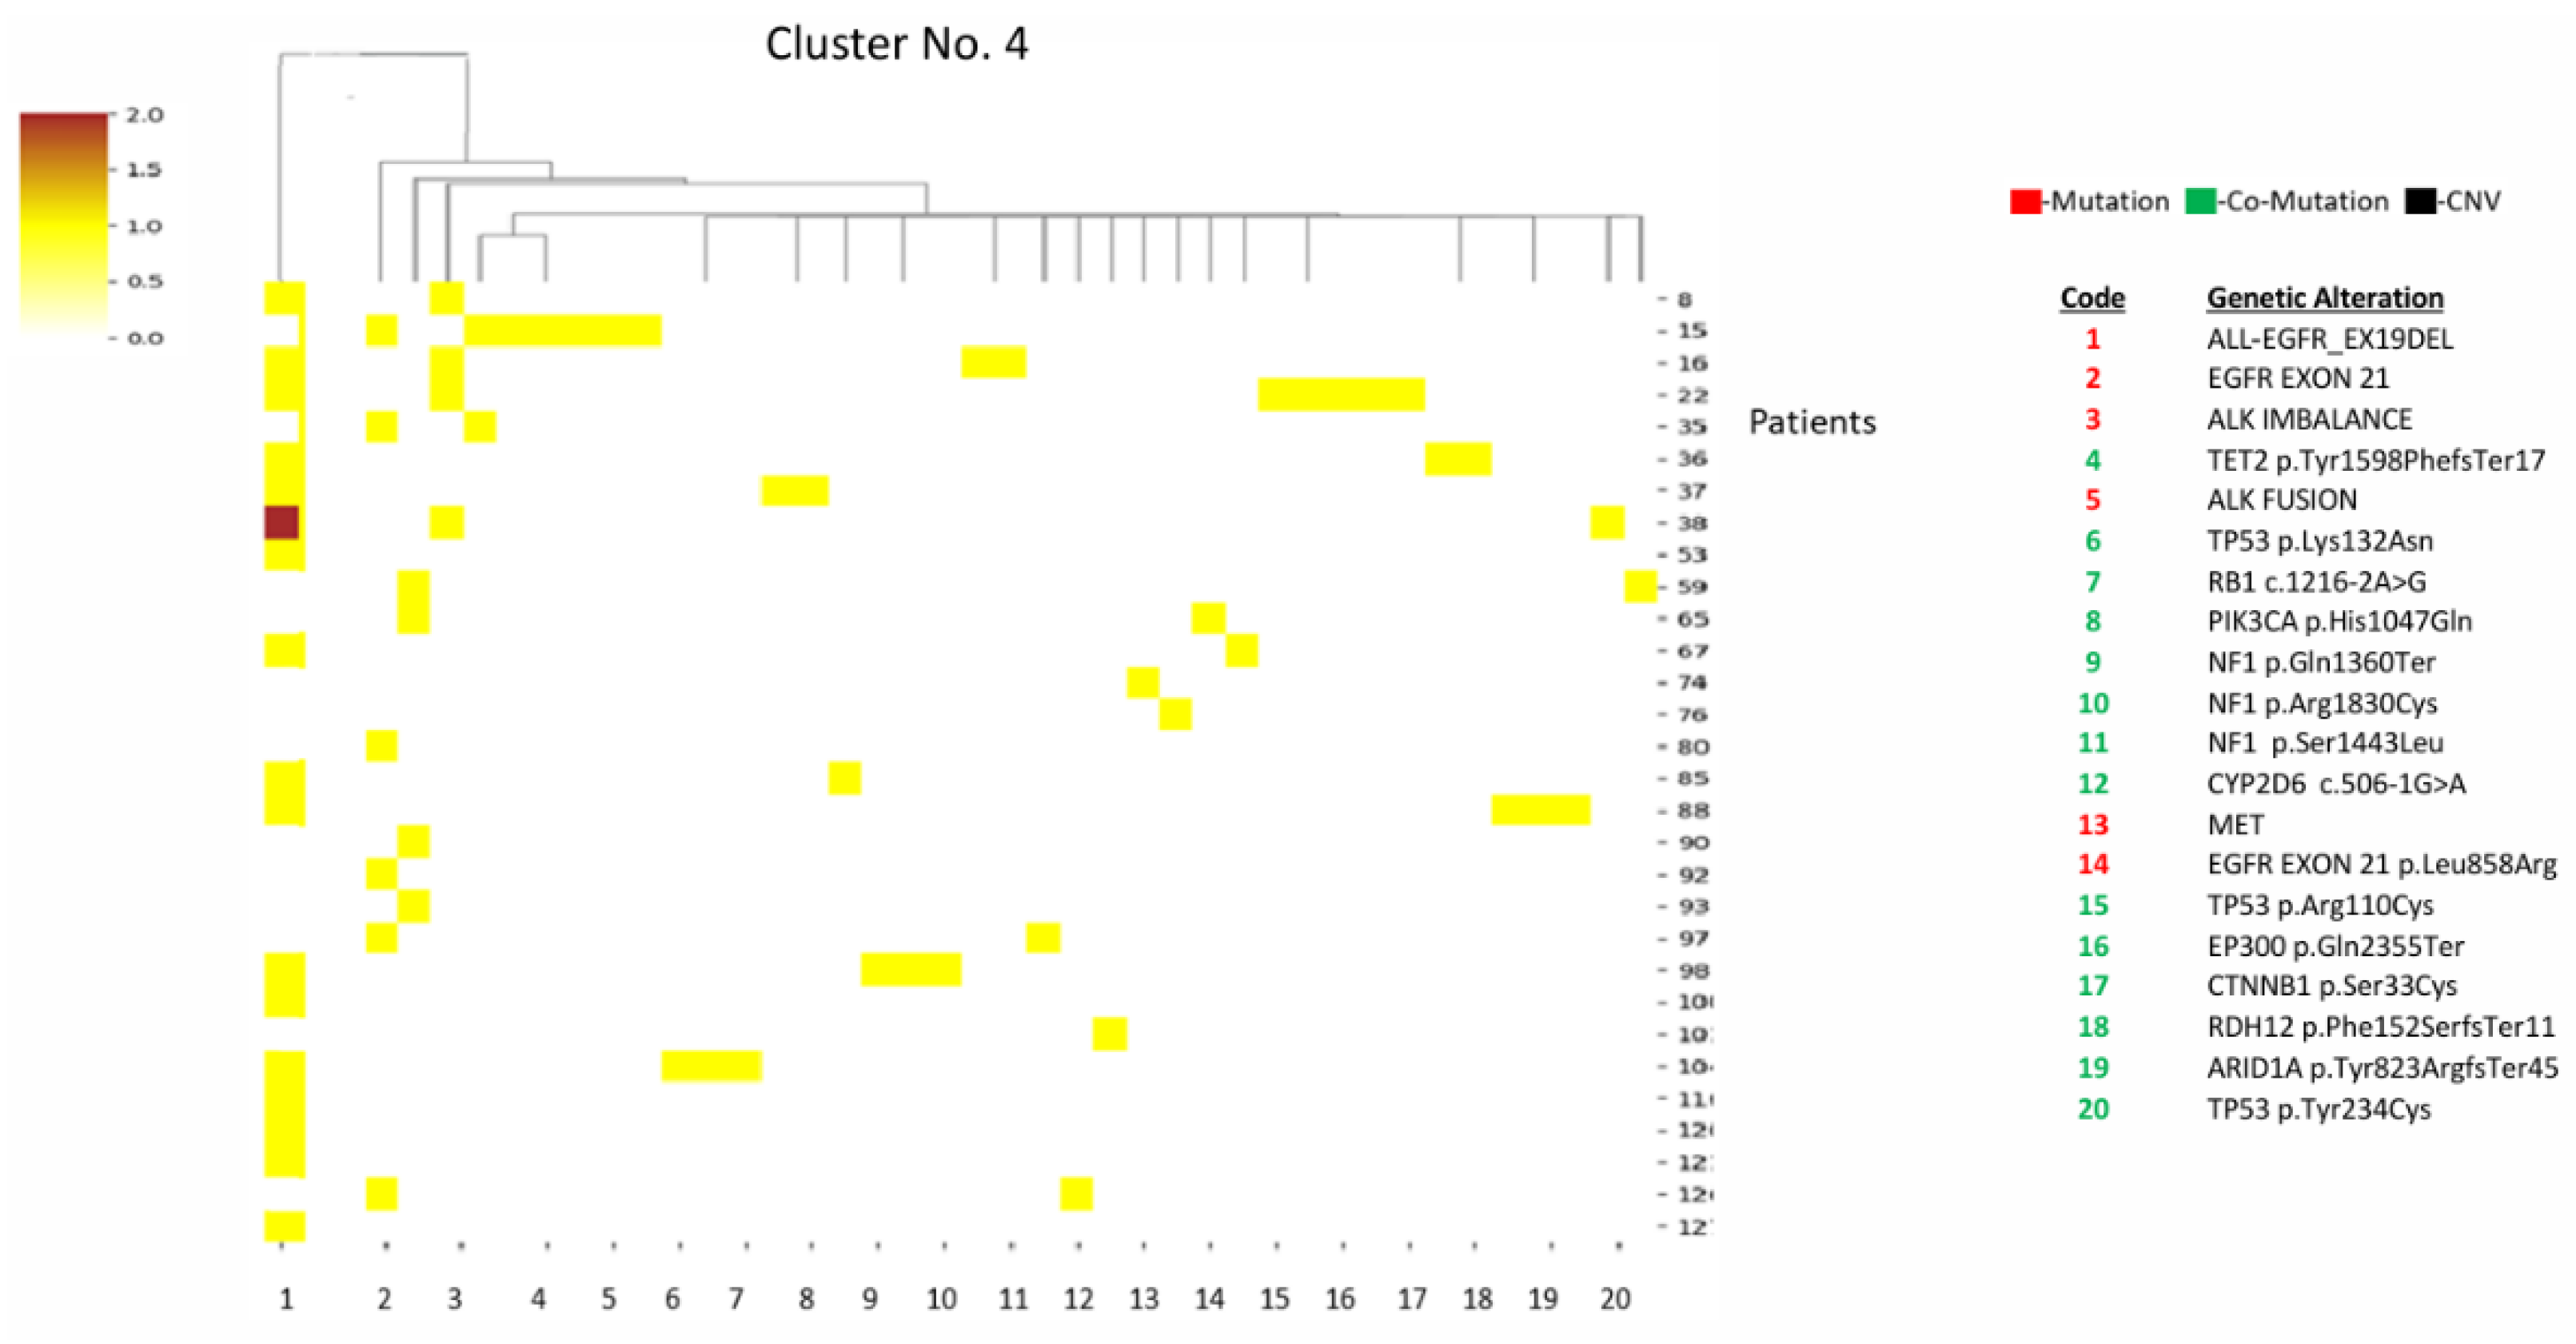
Background/Objectives: Lung cancer remains the leading cause of cancer-related mortality globally. Approximately 45% of these tumors harbor oncogenic mutations that drive carcinogenesis and are amenable to targeted therapies. Other predictive biomarkers— e.g., PD-L1, TMB, and MSI—play a crucial role in patients’ management. This study aims to investigate the existence of mutation clusters (co-mutations) and evaluate the correlation of these clusters with various clinical and laboratory parameters. Methods: A retrospective study was conducted utilizing pathological samples from lung cancer patients harboring mutations in EGFR, KRAS, ALK, BRAF, MET, HER2, ROS1, NTRK, and NRG1. Data were collected from the Institute of Pathology at Carmel Medical Center between the years 2022 and 2024. Patients were stratified using a Two-Step Cluster Analysis algorithm based on actionable mutations and co-mutations. Heatmaps and dendrograms were generated to assess the correlation between these genomic clusters, clinical metrics, and predictive biomarkers. Results: The study cohort included 129 patients with actionable mutations. Five distinct clusters were identified: Clusters 1,2, and 3 exhibited a high expression of STK11 and TP53 co-mutations alongside KRAS drivers (n=38, n=12 and n=23 respectively). Clusters 4 and 5 demonstrated high expression of ALK alterations and tumor suppressor gene mutations (n=31, n=25 respectively). Multivariate analysis demonstrated statistically significant differences between clusters regarding age, gender, PD-L1 expression, and Tumor Mutational Burden. No significant associations were found regarding ethnicity or Microsatellite Instability status. Conclusions: By constructing clusters based on the aggregate of genomic alterations in patients with actionable mutations, it is possible to predict associations with distinct demographic and clinical characteristics. Future research should apply this analytical approach to larger cohorts to further characterize these subgroups and investigate potential correlations with therapeutic efficacy.
Keywords:
1. Introduction
2. Materials and Methods
2.1. Study Design and Population
2.2. Data Collection
2.3. Ethics
2.4. Statistical Analysis
2.4.1. Pre-Clustering
2.4.2. Hierarchical Clustering
2.4.3. Dendrograms
2.4.4. Comparative Statistics
3. Results
3.1. Clustering of Actionable Mutations and Co-Mutations Cluster Patterns
3.1.1. Cluster 1 (n=38)
3.1.2. Cluster 2 (n=12)
3.1.3. Cluster 3 (n=23)
3.1.4. Cluster 4 (n=31)
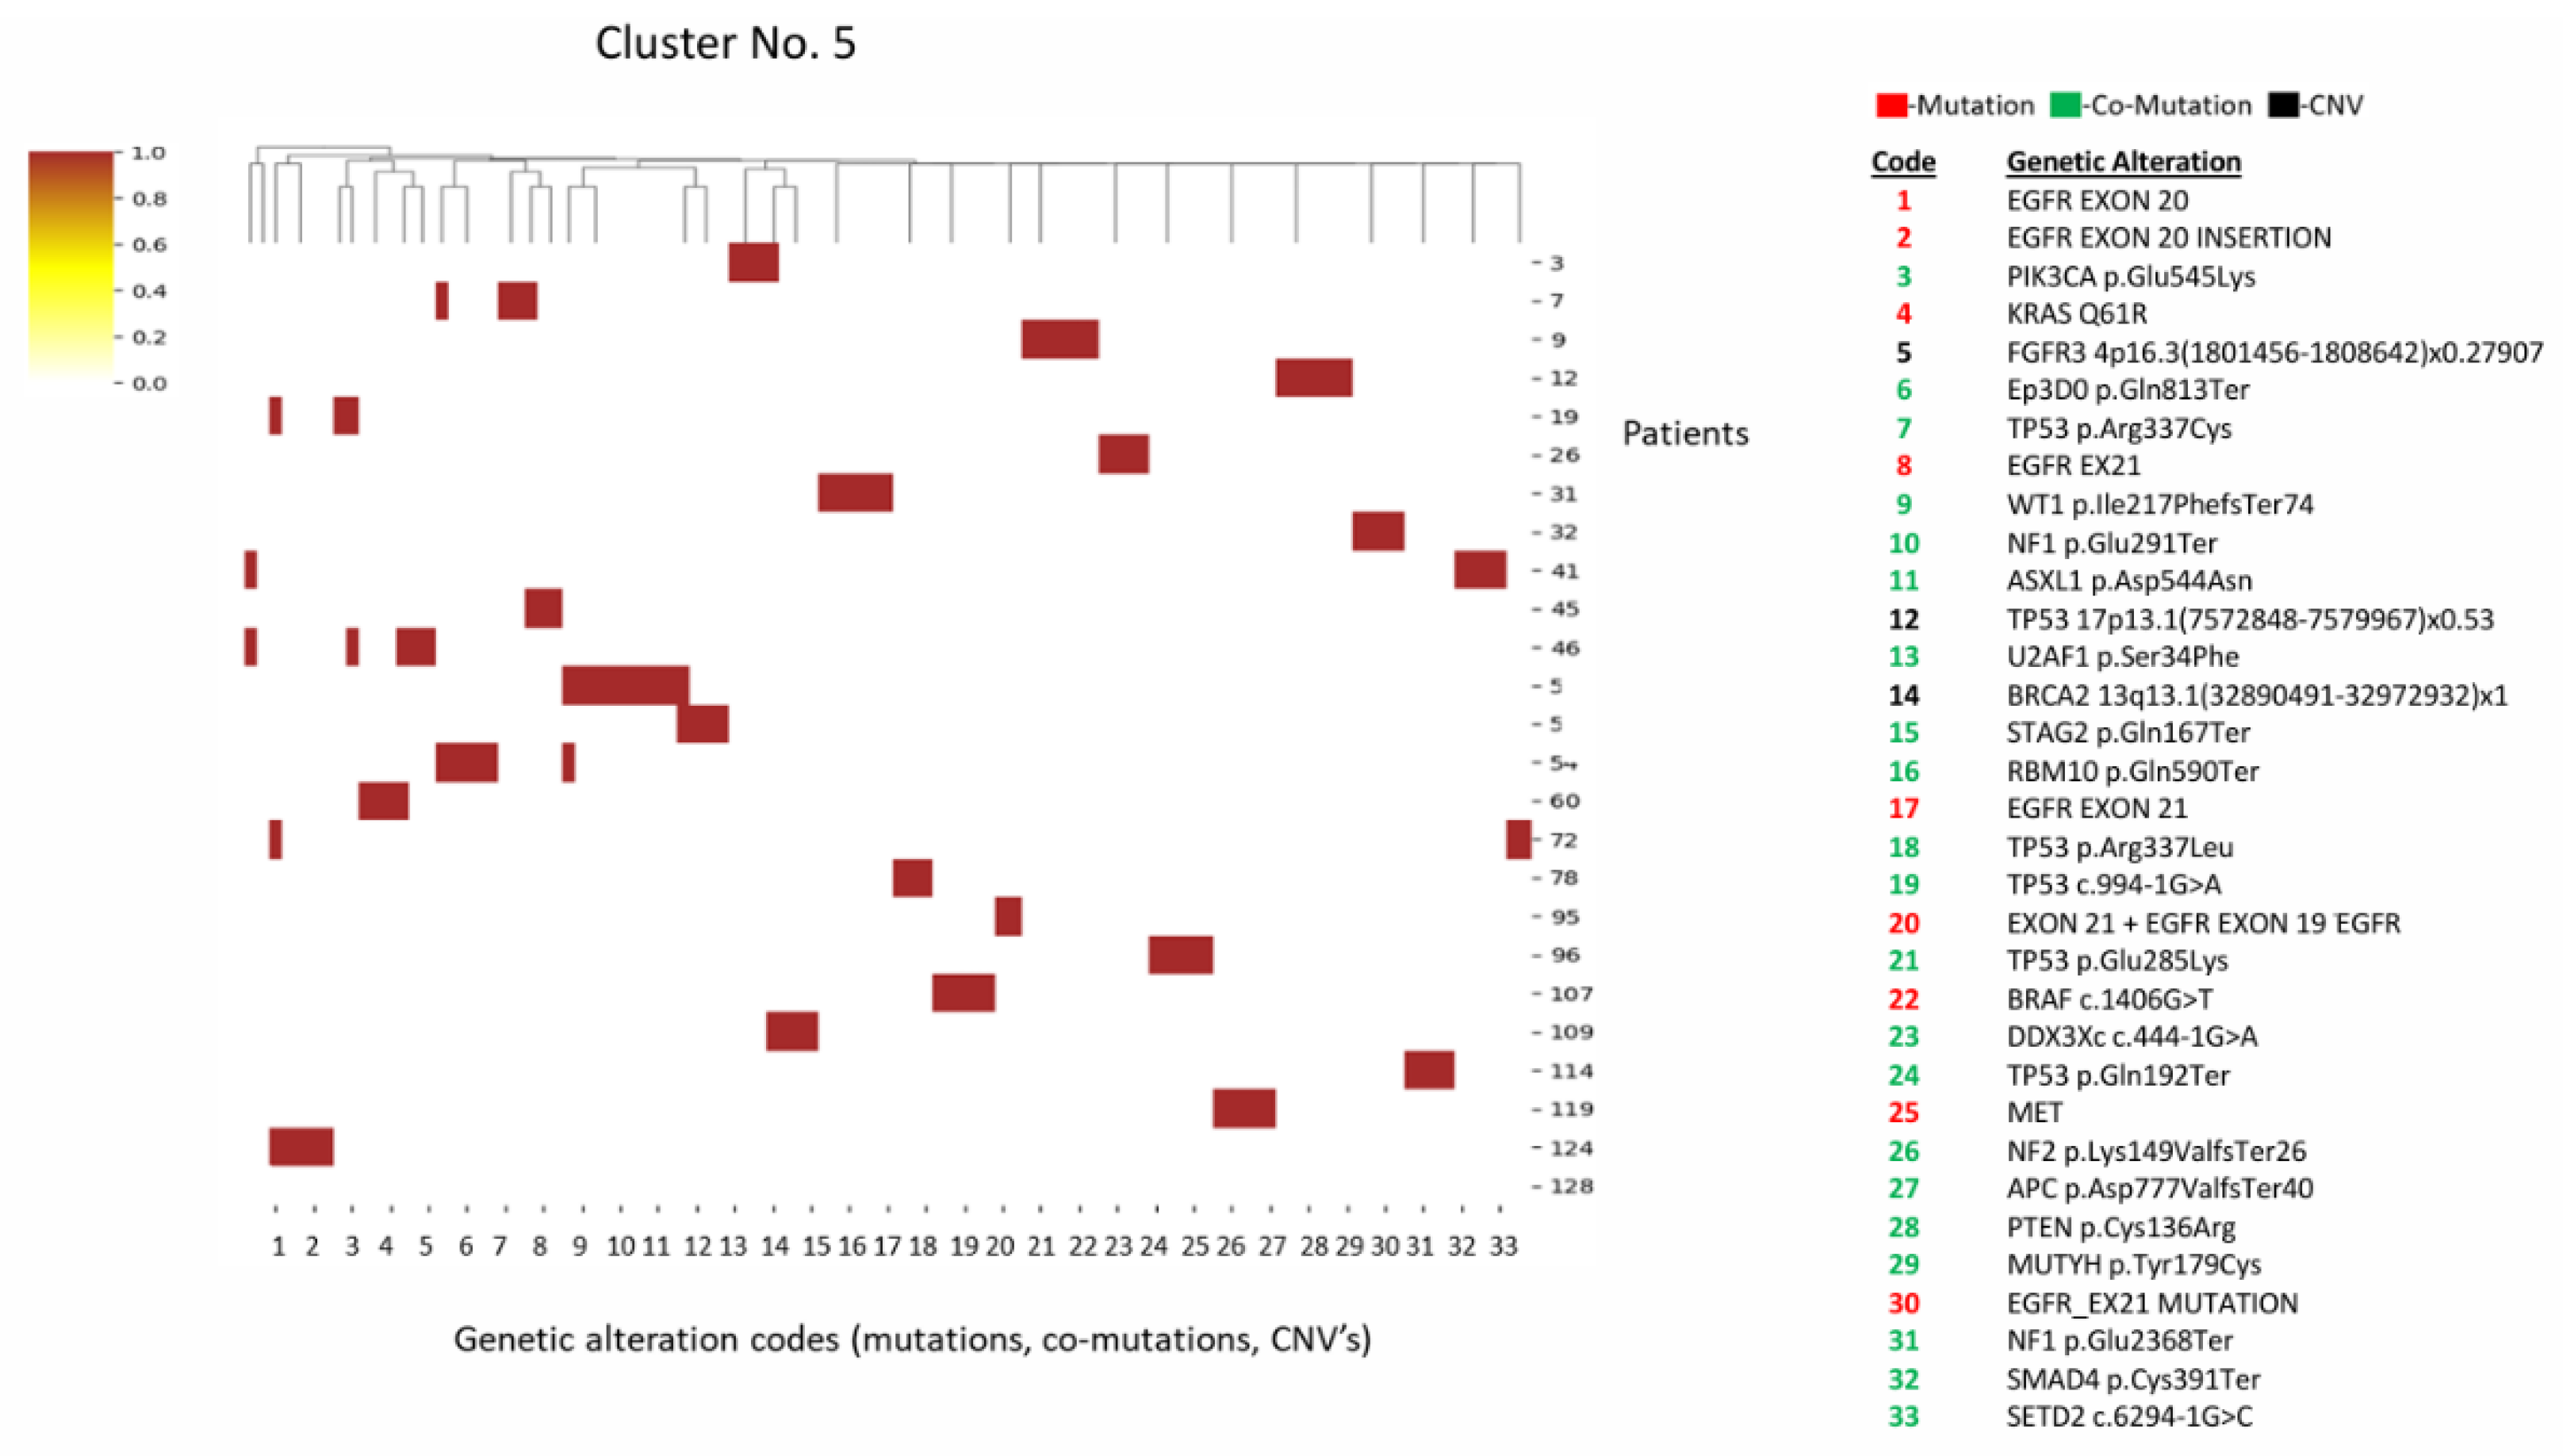
3.1.5. Cluster 5 (n=25)
3.2. Immunotherapeutic Biomarker Analysis
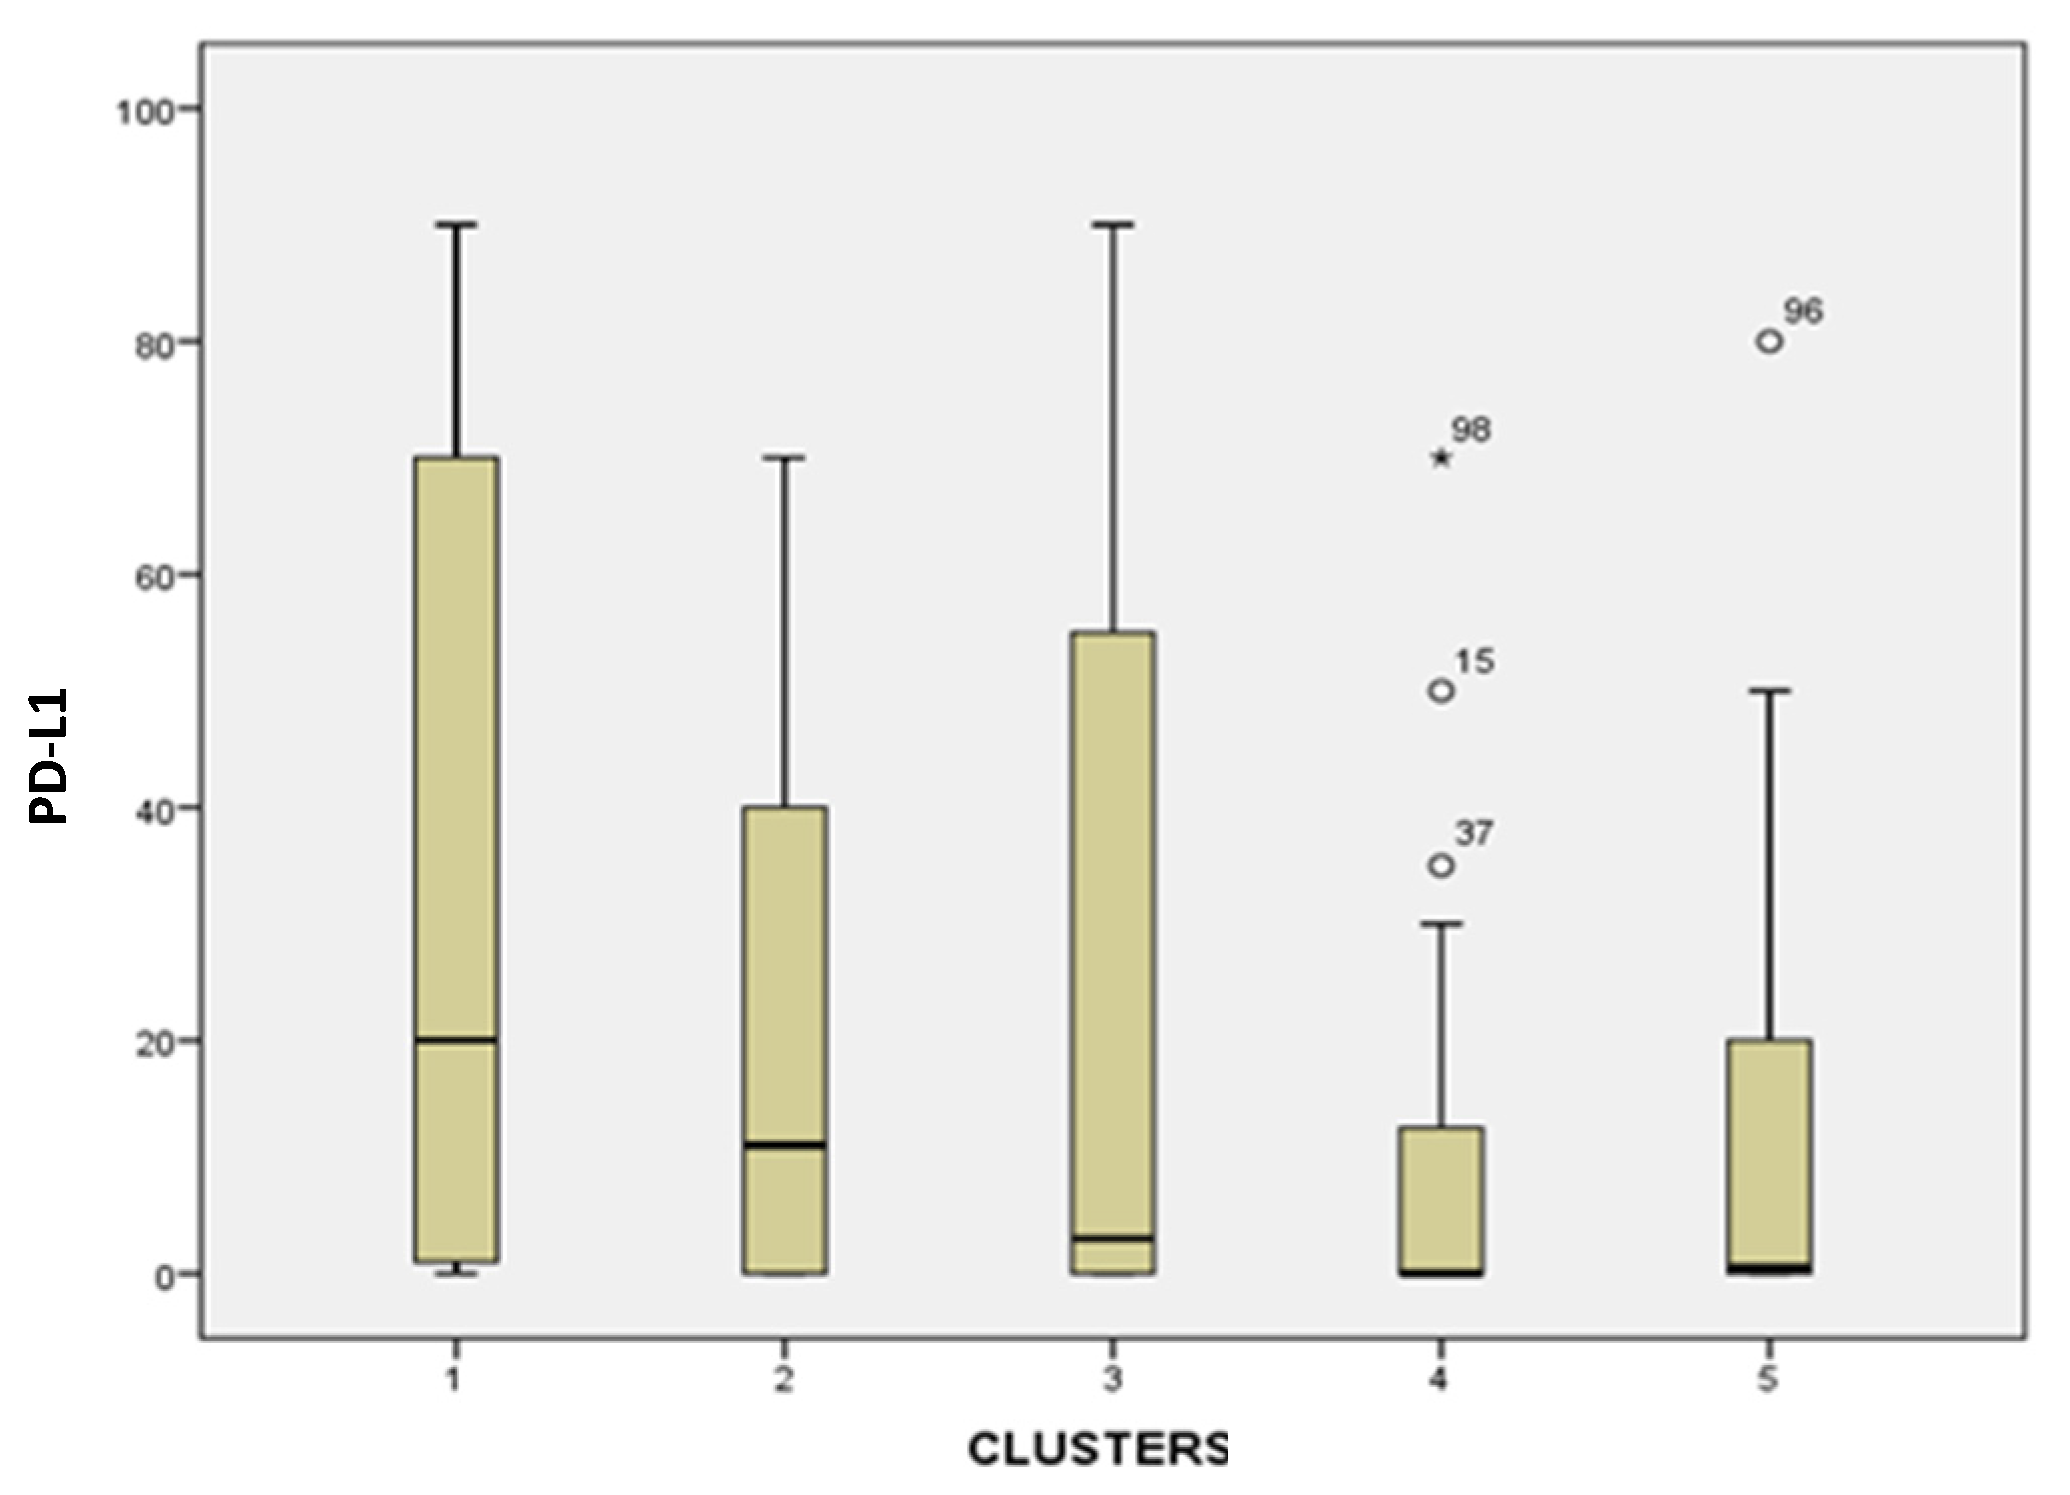
3.2.1. PD-L1 Expression
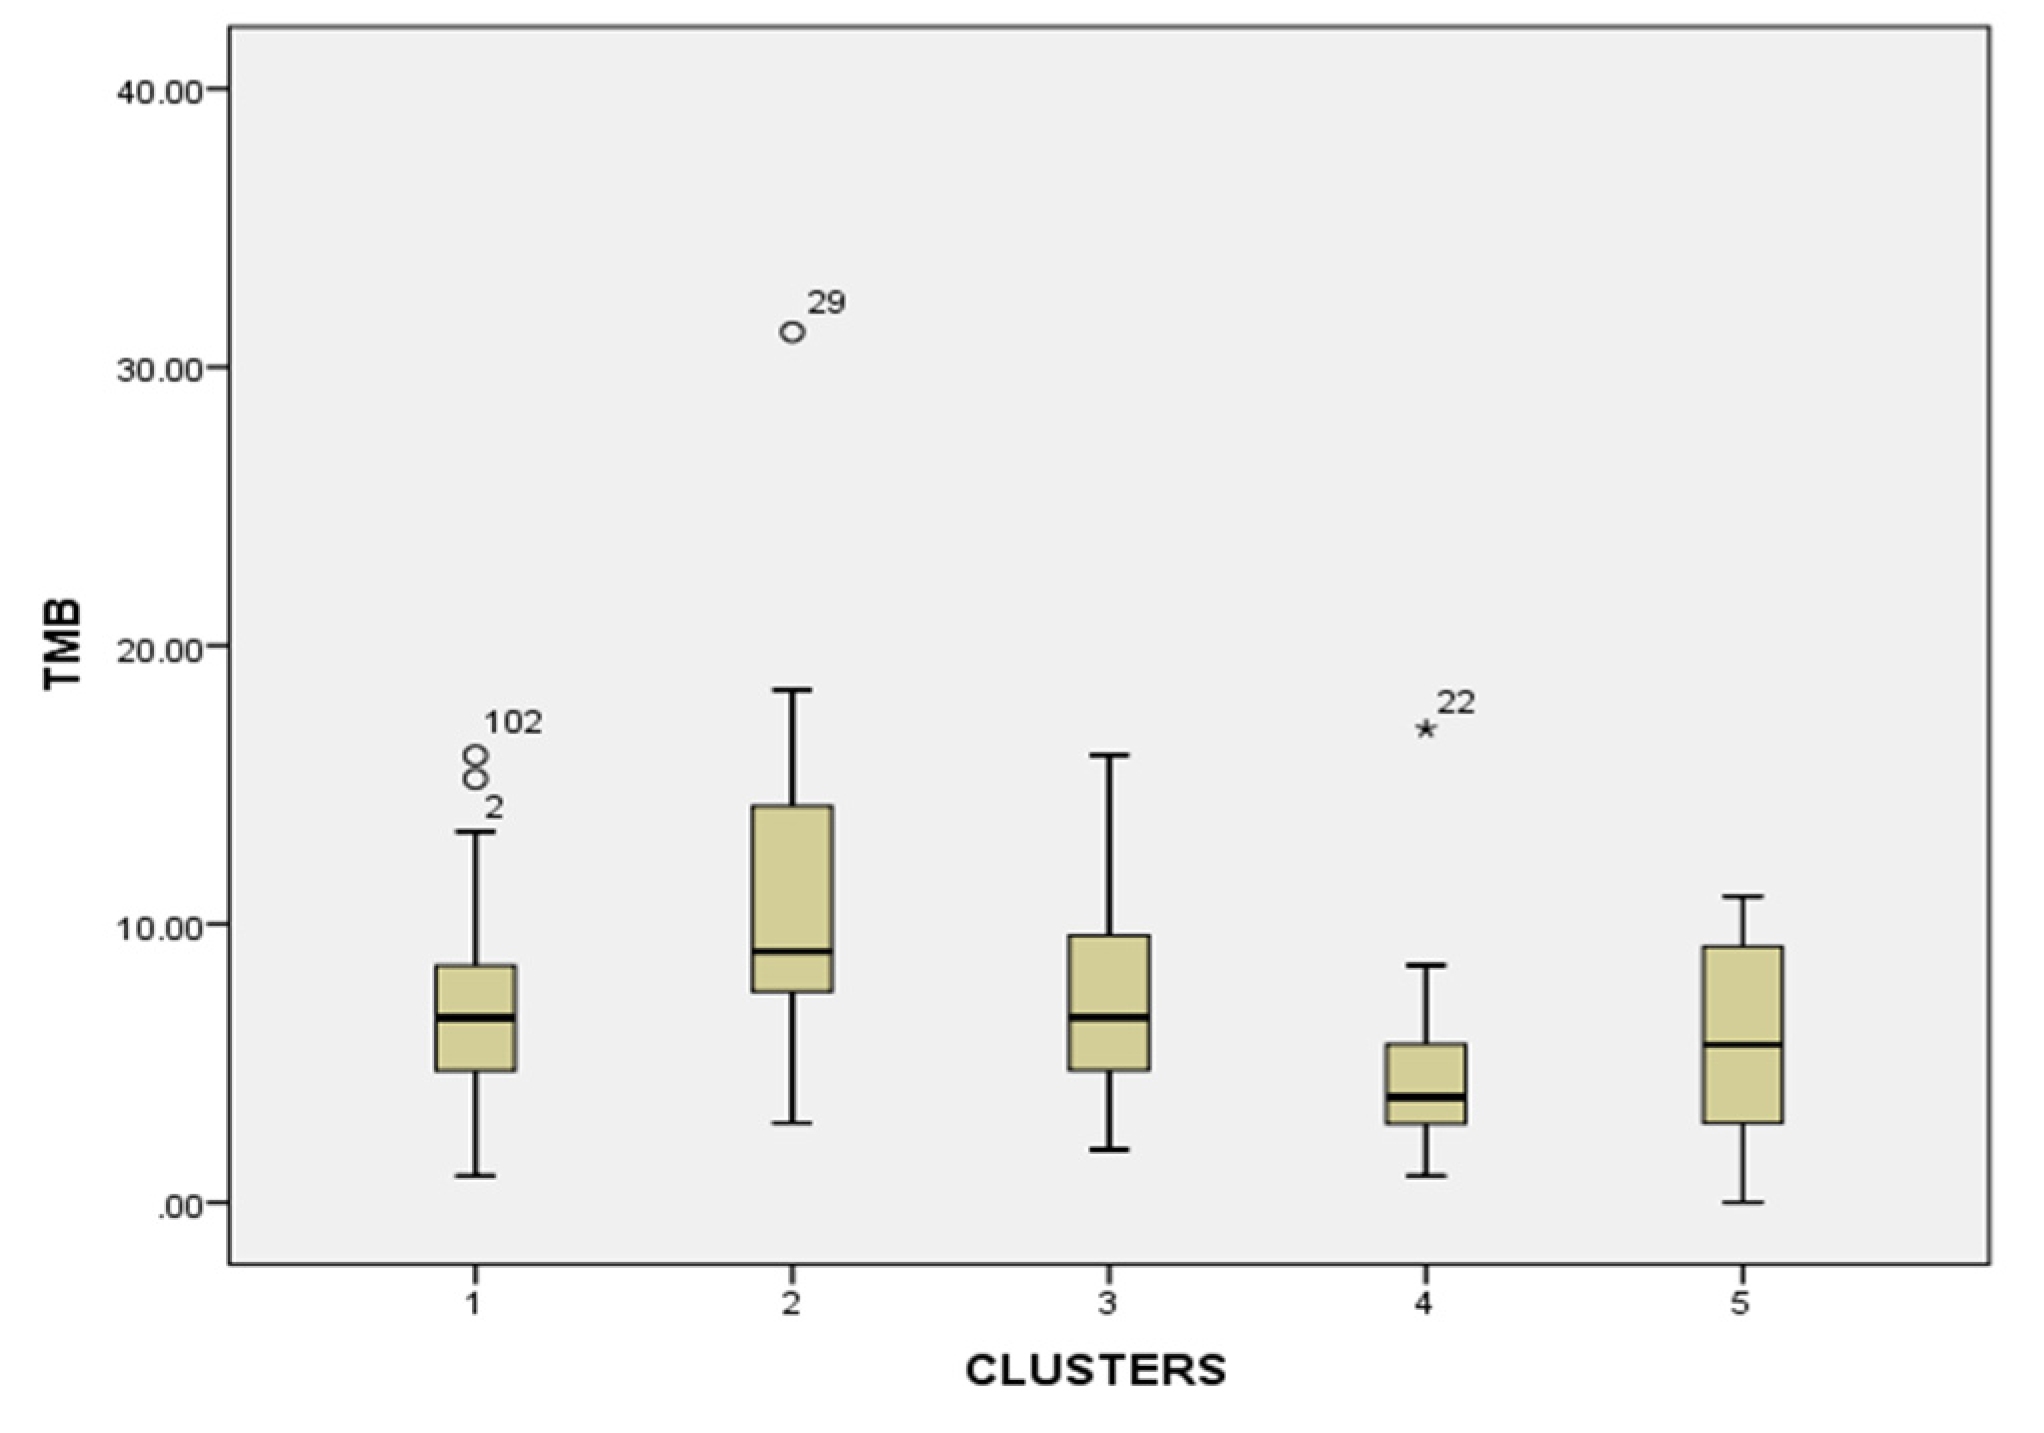
3.2.2. Tumor Mutational Burden (TMB)
3.2.3. MSI/MSS
3.3. Demographic Analysis
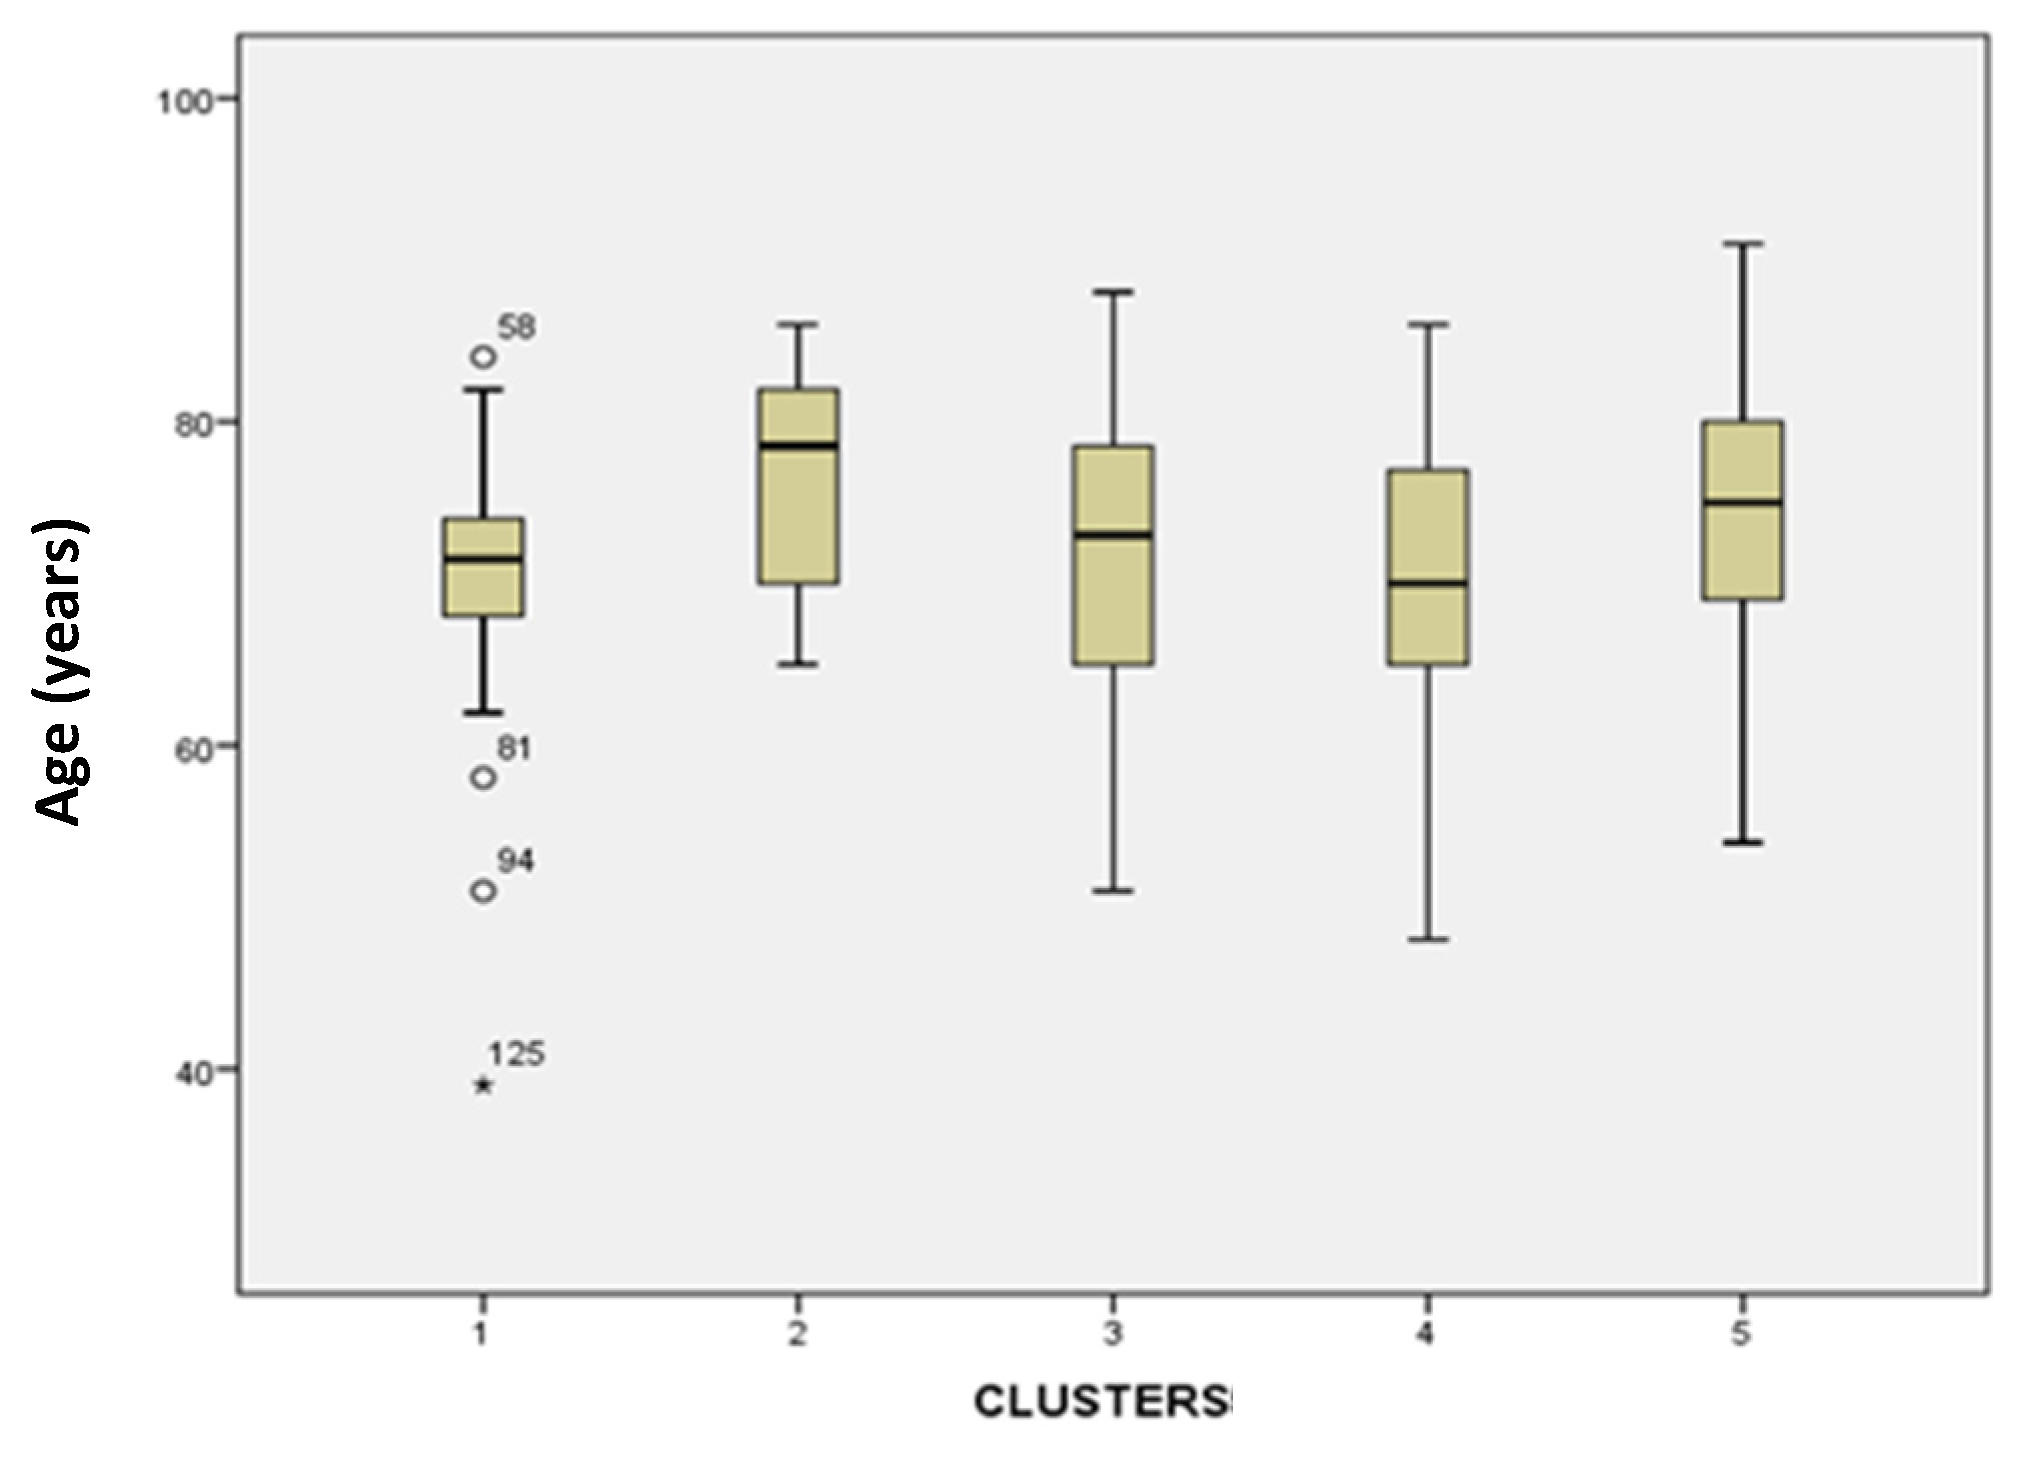
3.3.1. Age
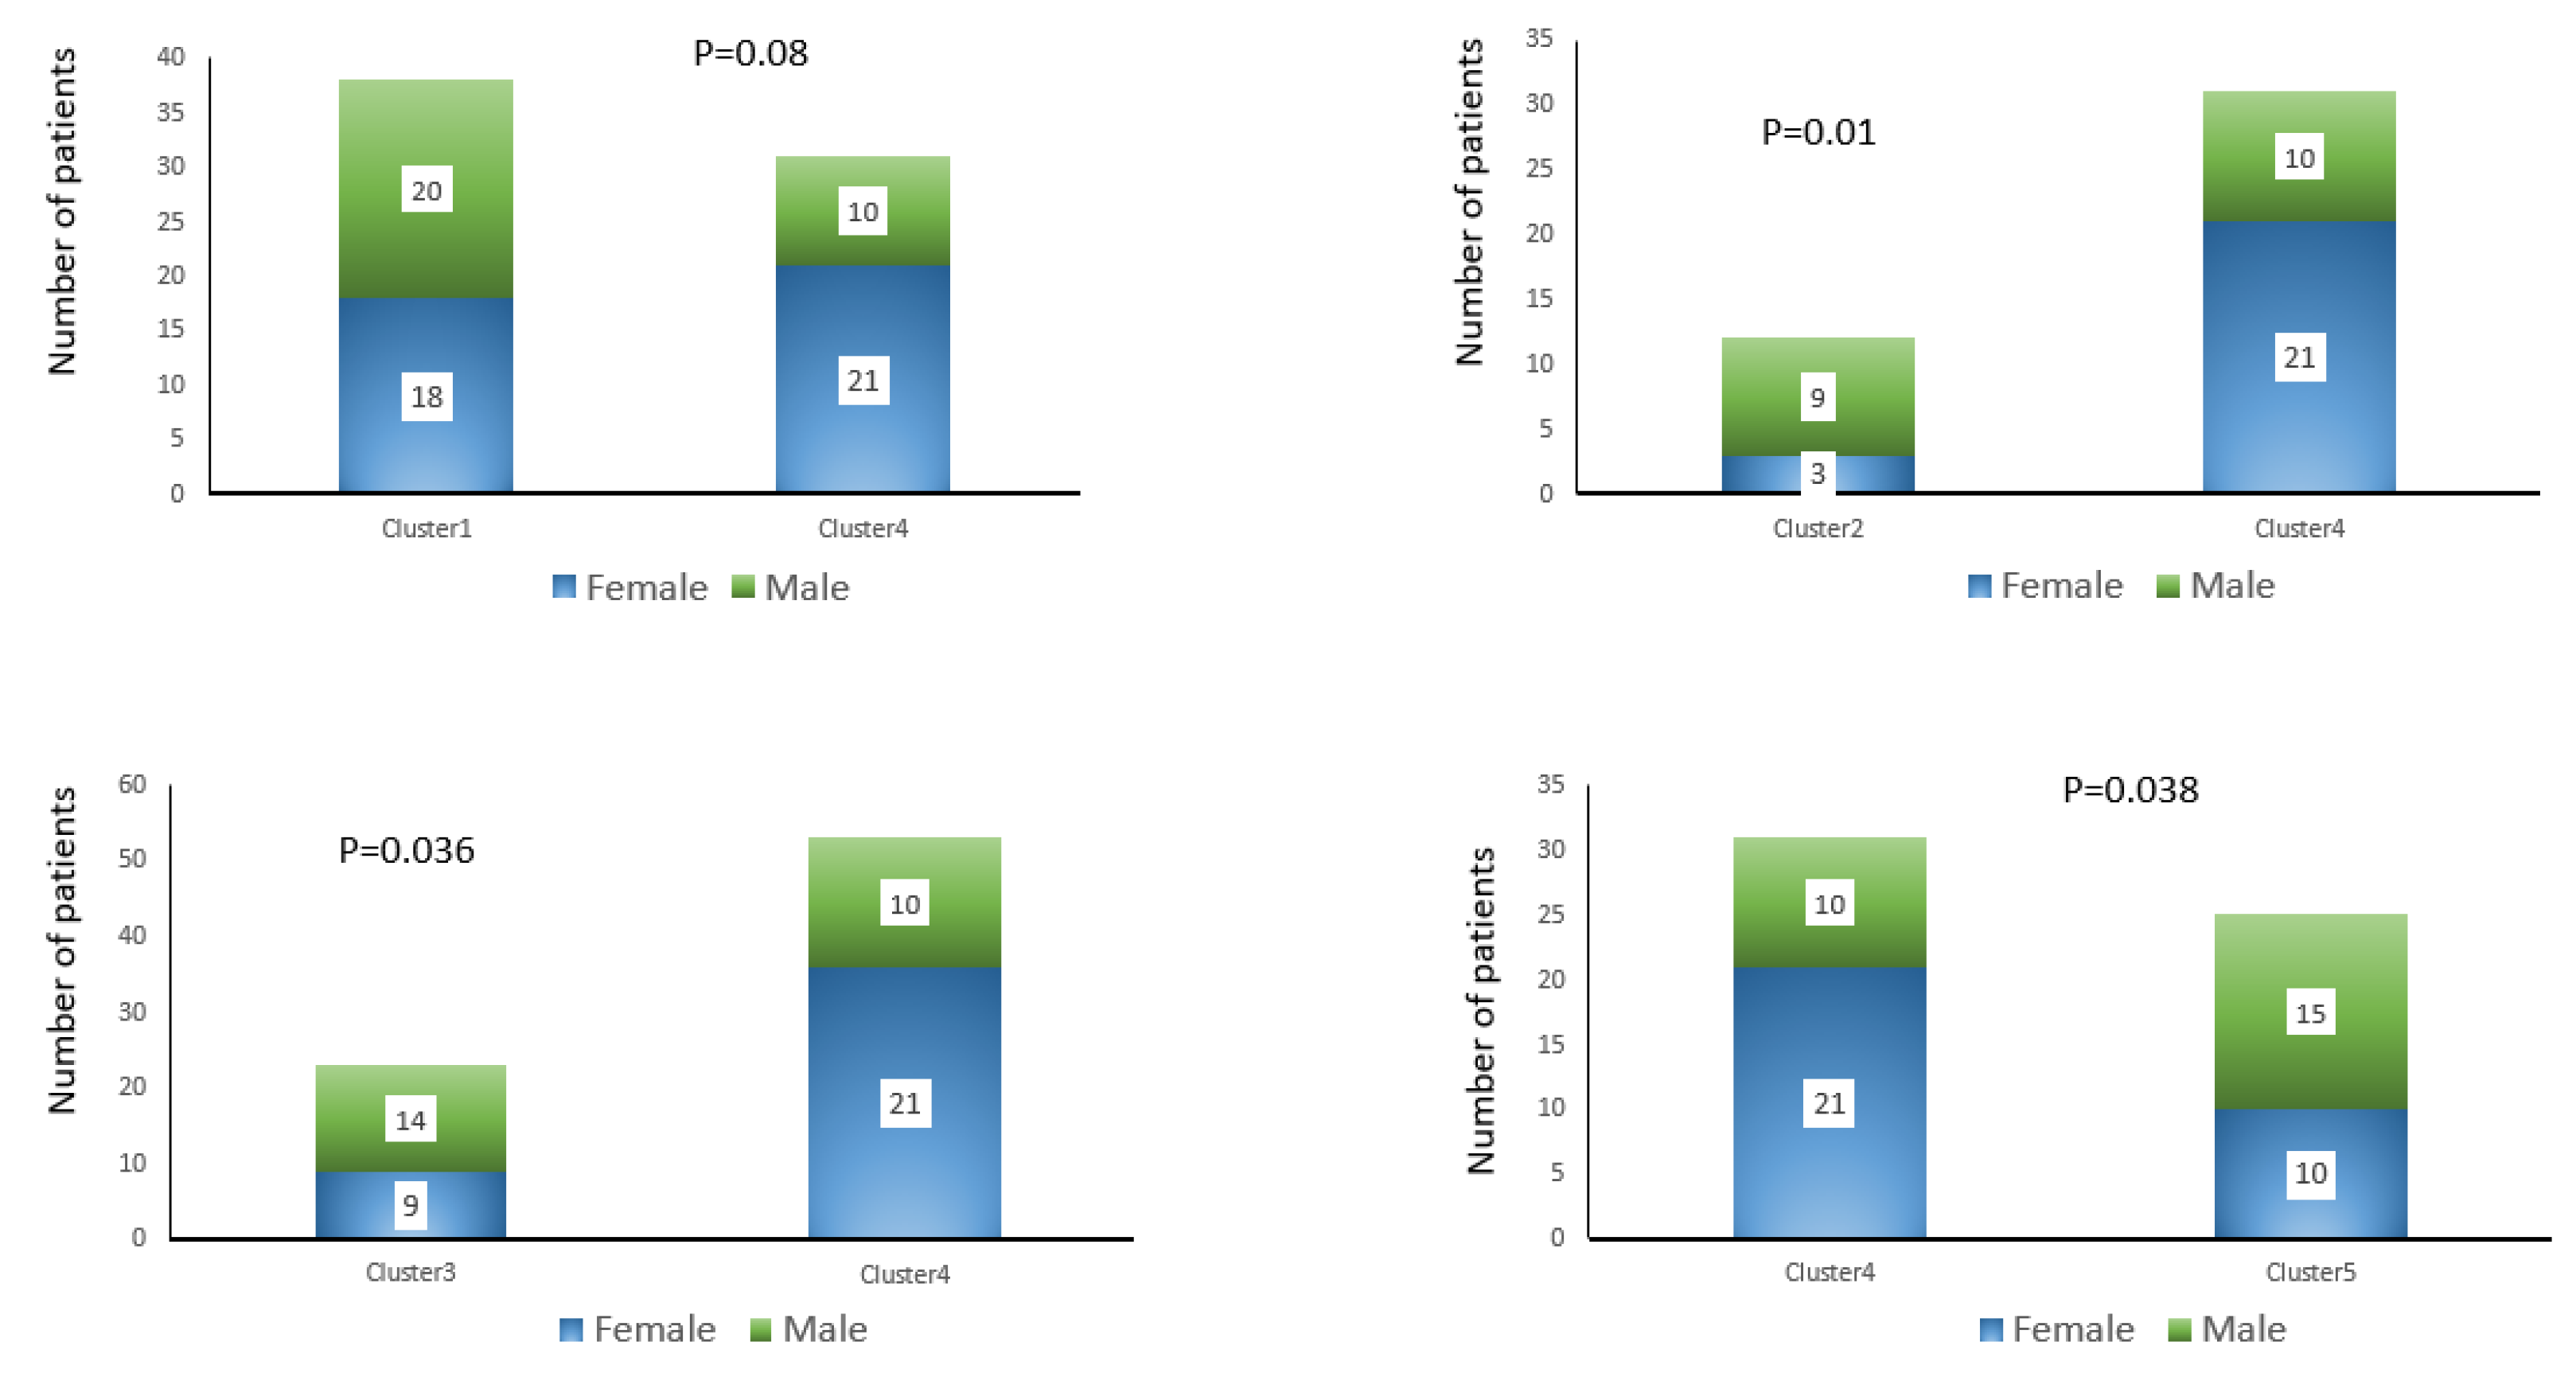
3.3.2. Gender
3.3.3. Ethnic
4. Discussion
5. Conclusions
Author Contributions
Funding
Institutional Review Board Statement
Informed Consent Statement
Data Availability Statement
Acknowledgments
Conflicts of Interest
Abbreviations
| MSI | Microsatellite Instability |
| PD-L1 | Programmed Death-Ligand 1 |
| TMB | Tumor Mutational Burden |
| COPD | Chronic obstruction pulmonary disease |
| NSCLC | Non-Small Cell Lung Carcinoma |
| SCLC | Small Cell Ling Carcinoma |
| ADC | Adenocarcinoma |
| SCC | Squamous Cell Carcinoma |
| NGS | Next-Generation Sequencing |
| LCC | Large Cell Carcinoma |
| EGFR | Epidermal Growth Factor Receptor |
| TKI | Tyrosine Kinase Inhibitors |
| ALK | Anaplastic Lymphoma Kinase |
| ICI | Immune Checkpoint Inhibitors |
| CNV | Copy number variation |
| KRAS | Kirsten rat sarcoma virus |
| STK11 | Serine threonine kinase 11 |
| TP53 | Tumor protein 53 |
References
- World Health Organization. Lung Cancer. Available online: https://www.who.int/news-room/fact-sheets/detail/lung-cancer (accessed on 10 January 2026).
- Sung, H.; Ferlay, J.; Siegel, R.L.; Laversanne, M.; Soerjomataram, I.; Jemal, A.; Bray, F. Global Cancer Statistics 2020: GLOBOCAN Estimates of Incidence and Mortality Worldwide for 36 Cancers in 185 Countries. CA Cancer J. Clin. 2021, 71(3), 209-249. [CrossRef]
- Bray F, Laversanne M, Sung H, Ferlay J, Siegel RL, Soerjomataram I, Jemal A. Global cancer statistics 2022: GLOBOCAN estimates of incidence and mortality worldwide for 36 cancers in 185 countries. CA Cancer J. Clin. 2024, 74(3), 229-263. [CrossRef]
- Milovanovic, I.S.; Stjepanovic, M.; Mitrovic, D. Distribution patterns of the metastases of the lung carcinoma in relation to histological type of the primary tumor: An autopsy study. Ann. Thorac. Med. 2017, 12(3), 191-198. [CrossRef]
- Kitamura, H.; Yazawa, T.; Okudela, K.; Shimoyamada, H.; Sato, H. Molecular and Genetic Pathogenesis of Lung Cancer: Differences Between Small-Cell and Non-Small-Cell Carcinomas. The Open Pathology Journal, 2008, 2(1), 106–114. [CrossRef]
- Liu, S.; Xu, T.; Cao, X.; Li, H.; Jin, R. Histological transformation in lung cancer: Mechanisms, clinical characteristics, and therapeutic approaches. Biochimica et Biophysica Acta (BBA) – Reviews on cancer. 2025, 1880(5). [CrossRef]
- Satam, H.; Joshi, K.; Mangrolia, U.; et al. Next-Generation Sequencing Technology: Current Trends and Advancements. Biology (Basel). 2023,12(7),997. [CrossRef]
- Raphael, A.; Dudnik, E.; Hershkovitz, D.; et al. FGFR Fusions as an Acquired Resistance Mechanism Following Treatment with Epidermal Growth Factor Receptor Tyrosine Kinase Inhibitors (EGFR TKIs) and a Suggested Novel Target in Advanced Non-Small Cell Lung Cancer (aNSCLC). J Clin Med. 2022, 11(9), 2475. [CrossRef]
- Raphael A, Onn A, Holtzman L, et al. The Impact of Comprehensive Genomic Profiling (CGP) on the Decision-Making Process in the Treatment of ALK-Rearranged Advanced Non-Small Cell Lung Cancer (aNSCLC) After Failure of 2nd/3rd-Generation ALK Tyrosine Kinase Inhibitors (TKIs). Front Oncol. 2022, 12, 874712. [CrossRef]
- Mountzios, G.; Planchard, D.; Metro, G.; et al. Molecular Epidemiology and Treatment Patterns of Patients With EGFR Exon 20-Mutant NSCLC in the Precision Oncology Era: The European EXOTIC Registry. JTO Clin Res Rep. 2022, 4(1), 100433. [CrossRef]
- Le, X.; Elamin, Y.Y.; Zhang, J. New Actions on Actionable Mutations in Lung Cancers. Cancers (Basel). 2023, 15(11), 2917. [CrossRef]
- Vijayalakshmi, R.; Krishnamurthy, A. Targetable “driver” mutations in non small cell lung cancer. Indian J. Surg. Oncol. 2011, 2(3), 178-188. [CrossRef]
- El Osta, B. KRAS G12C mutation: from undruggable target to potentially agnostic biomarker. Transl. Lung Cancer Res. 2023, 12(6), 1147-1151. [CrossRef]
- Wu, J.; Lin, Z. Non-Small Cell Lung Cancer Targeted Therapy: Drugs and Mechanisms of Drug Resistance. Int. J. Mol. Sci. 2022, 23(23), 15056. [CrossRef]
- Yoneda, K.; Imanishi, N.; Ichiki, Y.; Tanaka, F. Treatment of Non-small Cell Lung Cancer with EGFR-mutations. J UOEH. 2019, 41(2), 153-163. [CrossRef]
- Liao, B.C.; Lin, C.C.; Shih, J.Y.; Yang, J.C. Treating patients with ALK-positive non-small cell lung cancer: latest evidence and management strategy. Ther. Adv. Med. Oncol. 2015, 7(5), 274-290. [CrossRef]
- Olmedo, M.E.; Cervera, R.; Cabezon-Gutierrez, L.; et al. New horizons for uncommon mutations in non-small cell lung cancer: BRAF, KRAS, RET, MET, NTRK, HER2. World J Clin Oncol. 2022, 13(4), 276-286. [CrossRef]
- Lin, X., Kang, K., Chen, P. et al. Regulatory mechanisms of PD-1/PD-L1 in cancers. Mol. Cancer 2024, 23, 108. [CrossRef]
- Strickler, J. H.; Hanks, B. A; Khasraw, M. Tumor Mutational Burden as a Predictor of Immunotherapy Response: Is More Always Better? Clinical Cancer Research, 2021, 27(5), 1236–1241. [CrossRef]
- Li, K., Luo, H., Huang, L. et al. Microsatellite instability: a review of what the oncologist should know. Cancer Cell Int. 2020, 20, 16. [CrossRef]
- Sisca, L.; Cascetta, P.; Aijaz, A.; et al. KRAS and STK11 co-mutations in resectable non-small cell lung cancer: enduring prognostic value and impaired immunotherapy response. Transl Lung Cancer Res. 2025, 14(7), 2374-2382. [CrossRef]
- Rosner, S.; Connor, S.; Sanber, K.; et al. Divergent Clinical and Immunologic Outcomes Based on STK11 Co-mutation Status in Resectable KRAS-Mutant Lung Cancers Following Neoadjuvant Immune Checkpoint Blockade. Clin Cancer Res. 2025, 31(2), 339-351. [CrossRef]
- Manolakos, P.; Ward, L.D. A Critical Review of the Prognostic and Predictive Implications of KRAS and STK11 Mutations and Co-Mutations in Metastatic Non-Small Lung Cancer. J. Pers. Med. 2023, 13, 1010. [CrossRef]
- Schabath, M.B.; Welsh, E.A.; Fulp, W.J.; et al. Differential association of STK11 and TP53 with KRAS mutation-associated gene expression, proliferation and immune surveillance in lung adenocarcinoma. Oncogene. 2016, 35(24), 3209-3216. [CrossRef]
- Skoulidis, F.; Goldberg, M.E.; Greenawalt, D.M.; et al. STK11/LKB1 Mutations and PD-1 Inhibitor Resistance in KRAS-Mutant Lung Adenocarcinoma. Cancer Discov. 2018, 8(7), 822-835. [CrossRef]
- Suzawa, K.; Offin M, Lu D, et al. Activation of KRAS Mediates Resistance to Targeted Therapy in MET Exon 14-mutant Non-small Cell Lung Cancer. Clin Cancer Res. 2019, 25(4), 1248-1260. [CrossRef]
- Kemper, M.; Elges, S.; Kies, P.; et al. What do we know about the role of neoadjuvant targeted therapy in early-stage EGFR-mutant and ALK-fused non-small cell lung cancer?-a narrative review of the current literature. Transl Lung Cancer Res. 2024, 13(10), 2813-2827. [CrossRef]
- Gainor, J.F.; Shaw, A.T.; Sequist, L.V.; et al. EGFR Mutations and ALK Rearrangements Are Associated with Low Response Rates to PD-1 Pathway Blockade in Non-Small Cell Lung Cancer: A Retrospective Analysis. Clin Cancer Res. 2016, 22(18), 4585-4593. [CrossRef]
- Garzón-Ibáñez, M., Reyes, R., Molina-Vila, M.Á. et al. Landscape and clinical implications of EGFR exon 20 insertions in non-small cell lung cancer patients. Clin Transl Oncol 27, 3559–3569 (2025). [CrossRef]
- Seo, D.; Lim, J.H. Targeted Therapies for EGFR Exon 20 Insertion Mutation in Non-Small-Cell Lung Cancer. Int J Mol Sci. 2024, 25(11), 5917. [CrossRef]
- Canale, M.; Andrikou, K.; Priano, I.; et al. The Role of TP53 Mutations in EGFR-Mutated Non-Small-Cell Lung Cancer: Clinical Significance and Implications for Therapy. Cancers (Basel). 2022, 14(5, 1143. [CrossRef]
- Christopoulus, P.; Kluck, K.; Kichner, M.; et al. the impact of TP53 co-mutations and immunologic microenvironment on outcome of lung cancer with EGFR exon 20 insertions. Eur J Cancer. 2022, 170, 106-118. [CrossRef]
- Dong, Y.; Khan, L.; Yao, Y. Immunological features of EGFR-mutant non-small cell lung cancer and clinical practice: a narrative review. J Natl. Cancer Cent. 2024, 4(4), 289-298. [CrossRef]
- Zhang, F., Wang, J., Xu, Y. et al. Co-occurring genomic alterations and immunotherapy efficacy in NSCLC. npj Precis. Onc. 2022, 6, 4. [CrossRef]
- Abraham, S.; et al. Relations between mutant KRAS and TP53 subtypes and other co-mutations in pancreatic cancer. J. Clin Oncol. 2023, 41, e16294. [CrossRef]
- Frille, A.; Boeschen, M.; Wirtz, H.; Stiller, M.; Blaker, H.; von Laffert, M. TP53 co-mutations n advanced lung adenocarcinoma: comparative bioinformatic analyses suggest ambivalent character on overall survival alongside KRAS, STK11 and KEAP1 mutations. Front. Oncol. 2024, 14. [CrossRef]
- Bell, D.W.; Brannigan, B.W.; Matsuo, K.; et al. Increased prevalence of EGFR-mutant lung cancer in women and in East Asian populations: analysis of estrogen-related polymorphisms. Clin Cancer Res. 2008, 14(13), 4079-4084. [CrossRef]
Disclaimer/Publisher’s Note: The statements, opinions and data contained in all publications are solely those of the individual author(s) and contributor(s) and not of MDPI and/or the editor(s). MDPI and/or the editor(s) disclaim responsibility for any injury to people or property resulting from any ideas, methods, instructions or products referred to in the content. |
© 2026 by the authors. Licensee MDPI, Basel, Switzerland. This article is an open access article distributed under the terms and conditions of the Creative Commons Attribution (CC BY) license (http://creativecommons.org/licenses/by/4.0/).


