
Submitted:
06 February 2026
Posted:
10 February 2026
You are already at the latest version
Abstract
This article examines how smart cities can act as catalysts for enterprise development by integrating technological, infrastructural, governance and human-capital dimensions into a coherent urban innovation ecosystem. Drawing on an extensive literature review, the study first conceptualizes smart cities as adaptive systems that combine physical infrastructure, digital data layers and institutional frameworks, creating conditions for knowledge spillovers, entrepreneurial opportunities and business model innovation. Empirically, the research is based on an expert survey conducted among 54 specialists from academia, business and public administration, who assessed the importance of technological, infrastructural, governance, innovation-ecosystem and human-capital factors for enterprise development in the context of smart cities. The results indicate that advanced digital technologies, smart infrastructure, open data, R&D support, startup programmes and talent development are perceived as key, mutually complementary drivers of firms’ innovation, efficiency, sustainable growth and competitiveness, with notable differences between expert groups. On this basis, the study proposes a synthetic model of relationships and impact pathways linking smart city components with enterprise outcomes. The paper concludes with a discussion of the study’s limitations, related to the expert-based, country-specific and perceptional character of the data, and outlines directions for further quantitative and qualitative research on the firm-level effects of smart city development.
Keywords:
smart city
; enterprise development
; innovation ecosystem
; digital and innovative infrastructure
1. Introduction
Urban centers today constitute one of the fundamental pillars of how society and the economy function. Demographic growth and intensive urbanization, reinforced by globalization processes and an unprecedented flow of people, capital and information, confront cities with completely new challenges and require them to adopt new concepts of functioning, technologies, technical solutions, innovation implementation and development strategies. Consequently, the contemporary city is becoming an intelligent socio-economic hub.
Therefore, the strategic role of cities in the further development of civilization and humanity is gaining particular importance – it is precisely cities that concentrate key resources, innovation processes, economic activity and social life, while at the same time most directly experiencing the effects of climate change, geopolitical tensions, social crises and rapid technological progress. From this perspective, the need to move from a traditional model of city management to an approach based on the integration of physical infrastructure, digital solutions, human capital and new forms of co-governance involving multiple stakeholders is becoming increasingly evident.
A smart city can use advanced infrastructure to support local enterprises, the natural environment, transport and mobility, healthcare, lifestyle and governance. The adoption of smart city solutions is driven by the global trend of urbanization and the pursuit of a higher quality of life. The key premise of the smart city concept is to generate economic growth and improve quality of life by supporting the development of local areas and using technologies that lead to smart outcomes.
This article contributes to the scientific debate on the impact of the smart city on the enterprise sector, business creation, opportunities for firm growth, and the shaping of a supportive environment for the entrepreneurial ecosystem. The literature increasingly emphasizes that smart cities are not merely a collection of advanced technologies but complex innovation ecosystems in which enterprises act both as beneficiaries and co-creators of solutions. In this context, it becomes particularly important to understand how digital technologies, infrastructure, public policies and human capital translate into concrete development opportunities for firms of different sizes, activity profiles and business models.
The aim of the study was to analyse and assess the potential impact of smart city centers on enterprise development. The authors argue that the smart city can act as a stimulus that increases the developmental dynamics of business entities. The research conducted for this article, based in particular on an expert survey and the analysis of changes in parameters related to enterprise functioning, made it possible to achieve this research objective. At the same time, the findings indicate that the key conditions for leveraging the potential of the smart city are: access to advanced technologies and infrastructure, effective governance and innovation-support mechanisms, and enterprises’ ability to absorb the knowledge, data and competences present in the urban ecosystem.
The article consists of six parts: the introduction; the literature review; materials and methods, which include a description of the objectives, research questions, methods and procedure; the analysis of results; the discussion of findings, including comparisons and references to other authors’ studies; and the conclusion, which presents the main findings, limitations and proposals for further research.
2. Literature Review
2.1. The Specificity and Concept of Smart Cities
Efforts aimed at ensuring coherence between social, economic, and environmental phenomena are becoming increasingly important. Constant improvement of processes and the growth of mobility through the sharing economy are priority issues in an age of universally increasing urbanization. Cities of the future must adapt to changing environmental conditions to respond rapidly to climate change, population size, growing globalization of the economy, demographic changes, technological development, threats and geopolitical transformations, human mobility (including migration), population aging, conflicts, and social inequalities [1,2,3,4,5,6,7,8]. To care for urbanized centers and their users, both local and central authorities increasingly implement the smart city concept. This concept is gradually becoming a strategic plan for numerous agglomerations—in Poland, in Europe, and worldwide.
The concept of the smart city is relatively new and emerged as the result of an evolutionary process . It should be noted that the term has appeared over time from various perspectives, as a way to describe technological changes in cities. The first mentions of this kind appeared in 1997 as the “virtual city,” referring to local ICT network initiatives that enabled the development of local cyber (virtual) communities . Virtual cities were based on the World Wide Web (WWW) and served as electronic counterparts of real, physical urban centers . Later, the term “digital city” was used to describe cities possessing infrastructure that enables the creation of virtual communities .
In 2000, the concept of the smart city was defined as a city that monitors and integrates the conditions of all its critical infrastructure—including roads, bridges, tunnels, railways, metro systems, airports, seaports, communication networks, sanitation systems, energy supply, and even buildings—in order to optimize resources, plan preventive maintenance, and monitor safety, while maximizing the quality of services for residents . A decade later, it was described as a city combining physical infrastructure, IT infrastructure, social infrastructure, and business infrastructure to harness the collective intelligence of the city . Equally important is the understanding of the smart city as a set of initiatives aimed at improving the efficiency of urban centers through the use of data, information, and information technologies (IT) to deliver better services to citizens, support monitoring and optimization, increase cooperation between economic actors, and encourage the implementation of innovative business models in both the private and public sectors .
Thus, one can trace the evolution from the virtual city (where ICT networks were first created), cited in literature at the end of the 1990s , through ICT implementation at the level of entire metrologies for intelligent energy, transport, and building management . Subsequently, the idea of a “city’s intelligent footprint” was introduced—measured using capability indicators (related to society, economy, mobility, governance)—and then large-scale innovation testing, i.e., the city as a living laboratory . The newest approaches emphasize improving the quality of residents’ everyday life, sustainability, environment, mobility, and green spaces . According to the Massachusetts Institute of Technology, a smart city is “a new intelligence that lies in an increasingly efficient combination of digital telecommunication networks (nerves), ubiquitously embedded intelligence (brain), sensors and tags (sense organs), and software (knowledge and cognitive competence)” .
The lack of a unified or widely accepted definition is evident . Publications on the subject present a variety of related terms, such as digital city , wired city , information city [25,26,27], ubiquitous city , and sentient city . When defining a smart city, most researchers emphasize the role of advanced technologies, where key elements of urban infrastructure and services become intelligent, better integrated, and more efficient .
According to A. Caragliu , a city becomes smart when it invests in human and social capital while traditional and modern ICT support sustainable economic growth and high quality of life. S. Mohanty , in turn, sees a smart city as a place where traditional networks and services become more flexible, efficient, and sustainable. They rely on the use of information, digital, and telecommunication technologies to improve functionality for the benefit of residents, making cities greener, safer, faster, and more livable . N. Komninos defines a smart city as an area (municipality, district, cluster, or city) consisting of four main components:
- A creative population engaged in intensive, knowledge-based activities or clusters of such activities.
- Efficiently operating institutions with their own procedures for knowledge creation, acquisition, adaptation, and further development.
- Well-developed broadband infrastructure, digital spaces, e-services, and online knowledge management tools.
- A documented ability to innovate, manage, and solve unprecedented problems, as innovation and management under uncertainty are key to assessing intelligence.
A broader definition was proposed in the report Mapping Smart Cities in the EU , which views a smart city as one that addresses public challenges through ICT-based solutions and multi-stakeholder partnerships of a self-governing nature. ICT technologies connect various urban systems and stimulate innovations that facilitate the implementation of urban policy goals.
Implementing such solutions, while safeguarding social aspects such as well-being, cultural offerings, and life expectancy, requires a new, holistic model of city management where bottom-up governance cooperates with top-down management, enabling participation from many stakeholders (city users such as residents, businesses, NGOs). The idea behind the smart city is to create and leverage connections between human and social capital and ICT to generate sustainable urban growth and improve residents’ quality of life [36,37,38].
It is assumed that a smart city is characterized by the following elements :
- Smart economy: A competitive, highly efficient, and technologically advanced economy utilizing ICT; creating new products, services, and business models; fostering local and global connections and international exchange of goods, services, and knowledge.
- Smart mobility: Integrated transport and logistics systems primarily using clean energy.
- Smart environment: Sustainable use of resources; prudent management of natural resources; increased use of renewable energy; real-time monitoring of pollution and infrastructure; building modernization to reduce energy demand.
- Smart people: High-quality social capital formed in a diverse, tolerant, creative, and engaged society.
- Smart living: High quality of life expressed through safety, health, cultural richness, and widespread access to ICT infrastructure that enables lifestyle change.
- Smart governance: Public participation in decision-making, transparency, quality, and accessibility of public services; intelligent public management integrating all other components of a smart city.
A smart city is thus creative and sustainable, where the quality of life improves and economic growth prospects are strengthened . Its distinguishing feature is intelligence, understood as the sum of various improvements to the functioning of urban infrastructure, resources, and social services [41,42,43,44].
According to the World Health Organization, by 2050 the global population will double, and 70% of it will live in cities. Urban areas are growing by 60 million people annually. Cities account for about 80% of global GDP, bringing increased demand for utilities (energy, water, gas), transportation, housing services, and limiting public space . Consequently, cities require efficient solutions that foster sustainable growth and social welfare, improving the quality of life of residents. Moreover, in the face of global warming and economic instability, cities have become arenas for various social experiments addressing contemporary challenges . The smart city is one such example.
It is thus evident that modern technology is not the only element defining the term “smart” within urban functioning. Other factors, such as creativity, innovation, and democracy, also play vital roles. The modernist vision of an ideal city focused mainly on individualism is gradually being replaced by more integrated and collective models.
Additionally, business plays a fundamental role in the development of future cities—enterprises introducing smart solutions into public space, homes, and daily life. These may include organizations using technology, creativity, and open data while addressing human needs—creating software that enhances quality of life, increases efficiency, and bridges the gap between the city and traditional business in the creation of social innovation. Other enterprises manufacture hardware and software that improve energy efficiency, based on smart algorithms (e.g., smart homes), complementing smart energy grids designed to minimize energy losses .
The smart city concept thus represents a transformative paradigm for modern urban management, where the economic sphere serves as a fundamental catalyst for systemic change. In this context, enterprises are key actors in the smart city ecosystem, fulfilling multiple functions—from implementing innovative technologies and breakthrough innovations to creating socially oriented solutions. Companies specializing in software, energy-saving devices, smart algorithms, and data management systems are the driving force behind practical smart city implementation. At the same time, traditional enterprises integrating into the digital urban ecosystem gain strategic access to data, intellectual potential, and collaboration opportunities, leading to innovative business models and increased profitability. The dynamic growth of technology firms, start-ups, and consulting companies directly contributes to generating high-quality jobs, attracting talent, and building the region’s long-term competitive advantage.
An economy based on the smart city concept is highly innovative and technologically advanced, thanks to intensive ICT use, which enables value creation and the formation of strategic local and global connections. International exchange of goods, services, and knowledge forms the foundation for building cities’ competitive positions in the globalized economy.
Ultimately, the smart city is not merely about technological implementation of digital solutions but a comprehensive, holistic model of a new kind of economic growth that synergistically integrates economic, social, and environmental capital. Cities that successfully combine technological capabilities with entrepreneurship and strategic management gain a unique ability to generate long-term prosperity for residents, attract foreign direct investment, and build a strong competitive position in the global knowledge-based economy. In this sense, the smart city is not only a vision of the future but also a fundamental instrument of regional and economic development in the digital economy of the 21st century, where economic efficiency, business innovation, and quality of life form an integrated whole determining the success of modern urban agglomerations.
2.2. The Impact of Smart Cities on Stimulating Enterprise Development
A smart city is defined as a comprehensive spatial system in which the city’s physical infrastructure—transport networks, energy resources, water supply systems, buildings—is integrated with a digital information layer through sensor networks (IoT), data analytics platforms, artificial intelligence systems, and communication interfaces. A fundamental feature of a smart city is its ability to collect, process, and use data in real time in order to optimize the functioning of the urban system and improve the efficiency of public services [47,48].
From the perspective of systems theory, a smart city constitutes an adaptive system—that is, one that can modify its operational parameters on the basis of feedback from its environment. In this view, smart cities are characterized by three fundamental properties [49,50]:
- Sensory awareness – the ability to measure and monitor the state of the system via a distributed network of IoT devices;
- Analytical capability – the ability to process large datasets (big data) in order to identify patterns, anomalies, and forecasts;
- Responsiveness – the ability to rapidly implement changes and adjustments on the basis of analyses.
The literature typically distinguishes five dimensions of a smart city: the economic dimension (smart economy), mobility (smart mobility), the environment (smart environment), people (smart people), and governance (smart governance). The economic dimension, which is the subject of analysis in this study, refers specifically to the city’s capacity to support entrepreneurship, innovativeness, and productivity growth among local enterprises [51].
In this context, the impact of a smart city is multidimensional and relates to the creation of an innovation ecosystem, effects on enterprise performance, heterogeneity of impacts, competitiveness, sustainable development of organizations, geographic context, and the role of public policy.
2.2.1. Smart City as an Innovation Ecosystem
The theoretical framework for understanding the impact of smart city on enterprises is the concept of the innovation ecosystem. In this approach, a smart city is not perceived as a collection of technologies, but as a broad system of relationships and interactions between multiple actors: public administration, technology companies, startups, research institutions, non-governmental organizations, and citizens [49,52].
The innovation ecosystem is characterized by a dynamic flow of knowledge, resources, and information between actors. In the context of smart cities, these flows are enhanced through access to open data, APIs (Application Programming Interfaces), collaboration platforms, and shared infrastructures for testing new solutions. This dense network of connections creates conditions for the emergence of so-called Knowledge Spillovers – the unintended spread of knowledge and skills between organizations, which leads to the acceleration of innovation and efficiency of the entire system [53,54].
Within the smart city innovation ecosystem, several key functions can be distinguished: opportunity generation – cities provide data and infrastructure that reveal new problems to solve; resource linking – the ecosystem facilitates access to funding, talent, and business partners; uncertainty reduction – enterprises can test solutions in real urban conditions, reducing implementation risk; scaling – cities serve as testbeds for solutions that can then be replicated in other cities [49,52].
Significant for ecosystem theory is the concept of complementarity – the degree to which different elements of the system mutually support and reinforce each other. In smart cities, complementarity manifests itself in the synergy between technical infrastructure (hardware), software, human resources (wetware), and institutions (orgware). Cities that can build high complementarity between these dimensions generate greater economic value and attract more enterprises [50].
2.2.2. Mechanisms of Smart City Impact on Enterprise Performance
One of the fundamental mechanisms is the reduction of transaction costs. In institutional economics, transaction costs are defined as the costs of searching for information, negotiating contracts, monitoring their execution, and enforcing agreements. In traditional cities, enterprises had to incur significant expenses to obtain information about available suppliers, customers, market conditions, and regulatory requirements [49].
Smart cities, through a digital information layer, dramatically lower these costs. Urban data platforms provide enterprises with information about traffic conditions, demand for services, market prices, resource availability, and infrastructure challenges in real time. Access to such information enables firms to make more effective and efficient business decisions, respond faster to changing market conditions, and allocate resources more efficiently [47,52].
The reduction of transaction costs translates directly into lower operating costs for enterprises, which under conditions of perfect competition should lead to lower prices for consumers and higher margins for firms with a greater ability to efficiently use data. In the literature, the impact on firms’ financial performance is particularly evident in capital-intensive industries, where process optimization yields significant savings (transport, logistics, energy production, natural resource management) [55].
The second important mechanism is improved access to capital and business resources. Information asymmetry constitutes one of the main barriers to the development of small and medium-sized enterprises (SMEs) – financial institutions have a more limited range of information about SMEs’ ability to repay loans, which results in higher interest rates and lower credit availability for these entities. Smart cities can reduce this asymmetry by providing financial institutions with data on firms (e.g., regularity of tax payments, foot traffic in premises, the number of served customers based on mobility data) [50,54].
Moreover, smart cities create institutional conditions for the emergence of new forms of financing – equity crowdfunding platforms, green bonds, venture capital funds specializing in smart city solutions. The concentration of technology companies in smart cities attracts investors, which lowers the cost of capital for startups and SMEs. In conventional cities it is difficult for a startup to find venture capitalists or angel investors; in a smart city, such resources are within easy reach [53].
Access to shared infrastructure – incubators, laboratories, office spaces with flexible rental conditions, 5G networks, and data centers – also reduces entry barriers for new firms and lowers operating costs for existing ones. This expands the pool of enterprises able to survive on the market and the time they can afford before reaching profitability. Smart cities are natural centers for technology transfer from research centers to business practice. Universities located in smart cities can immediately test research results in real-life urban conditions – whether in terms of traffic optimization, energy management, or resource management systems. Enterprises, in turn, can gain direct access to the latest technological discoveries, instead of waiting for their commercialization by specialized firms [56].
This transfer is particularly important for sectors with high innovation density – biotechnology, advanced materials, artificial intelligence, robotics. When a university in a smart city achieves a scientific breakthrough, the local entrepreneurial ecosystem can quickly mobilize resources for its commercialization. In a traditional city, an innovation might remain within academia for many years before someone decides to commercialize it. Technology transfer is also strengthened through the possibility of observation and imitation – entrepreneurs can observe how other firms in the ecosystem use new technologies, which lowers the perceived uncertainty associated with adoption. This “social proof” effect is particularly important for startups, which institutionally lack the capacity to design entirely new solutions [54].
Smart cities also stimulate innovation at the level of business and organizational models. Access to real-time data enables enterprises to shift from a product-based business model to a model based on services and data. For example, a car manufacturer can become a mobility services provider; an energy producer can become an operator of a peer-to-peer energy exchange system; a water producer can become an operator managing water resource-saving systems. These model innovations can have profound implications for margins and revenue growth. The service model allows for variable billing tied to actual usage, thus enabling better alignment of revenues with the value delivered to the customer. The data-based model allows for personalization and segmentation of the offer, making it possible to raise prices for customer segments willing to pay more . In addition, access to the innovation ecosystem favors the adoption of modern organizational practices – agile management, design thinking, lean startup – which are promoted in smart city environments and among collaboratively working teams [50,52].
Smart cities attract highly qualified workers thanks to better quality of public services (transport, education, healthcare), greater density of employment opportunities, a dynamic cultural scene, and the perceived status of being modern and aspirational places. For enterprises, this means access to a talent pool – employees with specialized knowledge in digital technologies, data analysis, design, and engineering. Competition for talent in smart cities also favors higher wages and better working conditions, which, although they increase firms’ operating costs, at the same time improve productivity and reduce employee turnover. In the new knowledge-based economy, access to talent is often a more restrictive barrier than access to capital [58].
2.2.3. Heterogeneity of Effects and Determinants
The impact of smart city on enterprise development is not uniform for all types of firms and sectors. Small and medium-sized enterprises (SMEs) generally derive greater relative benefits from smart city infrastructure and data than large corporations. This follows from the fact that large enterprises possess internal resources (own research centers, IT departments, data analytics units), whereas SMEs cannot afford to maintain such structures. For SMEs, access to open data, analytical platforms, or smart city test laboratories represents only a fraction of the cost of maintaining internal structures [47,59].
Moreover, small firms are more organizationally flexible and can adapt more quickly to change. In SME structures, decisions can be made faster, and implementing changes is simpler. Consequently, SMEs can draw benefits from data and opportunities revealed by smart city infrastructure more quickly [47].
Capital-intensive sectors (energy, water, transport, logistics) achieve particularly large gains from process optimization made possible by smart city data. In service sectors – especially those where decisions are heavily knowledge-intensive (fintech, healthtech, edtech) – access to data and the innovation ecosystem also constitutes a key competitive advantage . In contrast, traditional sectors that are weakly instrumented and low-value-added may derive smaller benefits from smart city infrastructure unless they undergo substantial business transformation [52,54].
A crucial role is played by the firm’s absorptive capacity – i.e., the ability to recognize the value of new knowledge, assimilate it, and apply it in business practice. Enterprises with higher absorptive capacity (more employees with higher education, larger R&D budgets, more experienced management) can make better use of smart city opportunities. Firms with lower absorptive capacity may waste many benefits, as they will not be able to translate access to technology and data into concrete business actions [50,51,52,53,54].
2.2.4. Impact on Innovation and Competitiveness
Smart city influences the innovativeness and competitiveness of enterprises through a multidimensional mechanism. First, access to data opens new spaces for product innovation – when real problems and user needs are known (identified through smart city data), firms can design solutions more accurately. Second, access to the innovation ecosystem and shared infrastructure reduces R&D costs for startups and the small and medium-sized enterprise sector. Third, competition within the smart city ecosystem fosters innovativeness – every firm knows that others are improving their solutions, which compels it to engage in a continuous improvement process. Fourth, the possibility of rapidly testing solutions in real-world conditions (living labs) reduces time to market and the number of costly errors [52,53,55].
In the context of inter-city and international competitiveness, cities that effectively build innovation ecosystems attract enterprises, talent, and investments – local economies of innovation hubs with global reach are created. Firms located in such cities gain a competitive advantage both through access to technology and through their perceived status [47,52].
2.2.5. Smart City and Sustainable Enterprise Development
The impact of smart city on the sustainable development of business activity manifests itself at multiple levels. At the environmental level, real-time data on energy consumption, water usage, and gas emissions allow for monitoring and reducing the ecological footprint of enterprises. Many firms operating in traditional cities simply did not have access to such information – now they can identify areas of resource waste. At the social level, smart cities can support enterprises in making decisions that better account for social impact (data on unemployment, public health, and education in the vicinity of the firm's location). At the governance level, data transparency supports compliance and business transparency, which builds greater trust in economic entities. Research indicates that firms operating in smart cities and effectively using available data to manage their environmental and social impact achieve better ESG (environmental, social, governance) scores, which translates into access to cheaper financing and the loyalty of long-term investors [59,60].
2.2.6. Geographic Context: Differences Between Countries and Regions
The impact of smart city on enterprises differs significantly depending on the geographical context, level of economic development, the nature of institutions, and the cities' ability to mobilize resources.
In highly developed countries, smart city develops under conditions of already existing high informatization of the economy, well-functioning public institutions, and a high level of education. Under these conditions, smart city represents an incremental improvement of the system – enhancing efficiency where it already functions. In rapidly growing countries, smart city is more often implemented as a transformative solution – a complete change in the way the city operates. In these contexts, the impact on enterprises can be dramatically greater, as firms transition from a low to a high level of digitalization. In Central and Eastern European countries, in turn, smart city develops under intermediate conditions – building upon an already established level of informatization, but still having significant reserves in public administration efficiency and business readiness for transformation [61,62].
2.2.7. The Role of Public Policy
The impact of smart city on enterprises is largely conditioned by the role of public policy. Cities that adopt a strategy of opening public data, supporting innovation through public procurement, and creating regulatory frameworks conducive to experimentation – achieve a significantly greater effect on the business ecosystem than cities that invest solely in technical infrastructure. Public-private partnerships (PPPs) constitute a key mechanism for mobilizing the resources and competencies of both sectors. The public sector contributes access to data, regulations, and funding; the private sector – technologies, efficiency orientation, and the ability to scale solutions. Cities that can effectively structure such partnerships can accelerate the impact of smart city on enterprises [63,64,65].
In summary, the smart city concept today represents one of the most important directions of urban development worldwide. In the context of enterprises, smart cities create new business opportunities, mechanisms supporting innovativeness, and digital infrastructure that fundamentally changes the way firms operate in the urban environment, as well as the entities responsible for developing and implementing smart solutions in urban areas.
3. Materials and Methods
The main objective of the study is to assess the potential impact of smart city on enterprise development.
With regard to the potential stimulation of enterprise development, aspects of the design, implementation, and management of infrastructure and software within smart city solutions will be analyzed, along with a range of technological, infrastructural, innovation-related, human capital, and administrative factors (included in the expert survey). The study employed various methods depending on the phase (preparation, implementation, and results analysis). Below is a description along with an indication of their application at individual stages of the study.
Research preparation phase
The authors formulated the following research problems:
- Q1: What are the market trends in the creation and implementation of smart city solutions?
- Q2: How can smart city solutions influence enterprise development?
- Q3: Which technological, infrastructural, administrative, innovation-related, legal, human capital, and sectoral factors can most strongly influence enterprise development (in the opinion of experts)?
Desk research is a research method involving the analysis of already existing sources of information. This process encompasses their systematic collection, critical verification, and appropriate elaboration, which allows for the formulation of reliable conclusions regarding the subject under investigation [66,67]. This method was used in developing the study assumptions and preparing the expert questionnaire.
Research implementation phase
The expert survey involves collecting research material using a developed questionnaire form by obtaining responses from study participants selected based on defined criteria. The expert survey constitutes a special type of research method, as it draws on the knowledge and ingenuity of individuals who are experts in a given field. The questions contained in the expert survey are not limited solely to facts or attitudes toward them, but also include attempts to explain and predict them. It is assumed that professionally qualified respondents possessing expert knowledge can propose interesting analytical conclusions. Thanks to their professional knowledge and "reality-based imagination," they can also create valuable (realistic) forecasts regarding the development of situations in a specific area of economic and social reality [68,69,70].
The survey was conducted from October 7 to December 12, 2025. Experts for the survey were selected based on purposive sampling, ensuring high quality and reliability of the study. The group consisted of academics, business representatives, and public administration officials, with a minimum of 7–10 years of professional experience in fields directly related to smart city, digital transformation, and business innovation. Business experts held managerial positions in enterprises, with proven experience in implementing smart city technologies. Administration representatives were employees of cities and government institutions responsible for smart city strategy, digital transformation, and innovation policy. A total of 54 experts participated in the study.
The expert questionnaire, based on the conducted literature review, contained the following factors subject to assessment (each factor was evaluated using a Likert scale from 1 to 5):
-
Technological innovations:
- ○
- Internet of Things (IoT);
- ○
- Artificial Intelligence (AI) and Machine Learning (ML);
- ○
- 5G Network;
- ○
- Big Data;
- ○
- Business process automation;
- ○
- Digital platforms and cloud services;
- ○
- Other, specify;
-
Infrastructure:
- ○
- Intelligent transport systems;
- ○
- Technological infrastructure (broadband and charging stations for electric vehicles);
- ○
- Smart energy management systems;
- ○
- Circular economy (as a systemic solution for infrastructure);
- ○
- Digital twins;
- ○
- Other, specify;
-
Smart governance:
- ○
- Open Data platforms;
- ○
- E-government services;
- ○
- Digital participation tools;
- ○
- Other, specify;
-
Innovation ecosystem and regulatory/policy support:
- ○
- Programs supporting the development of startups and innovative enterprises;
- ○
- Technology clusters;
- ○
- Investments in scientific research and technological development;
- ○
- Business networking;
- ○
- Participation in projects implementing smart city solutions and technologies;
- ○
- Tax incentives and grants (financial incentives for companies applying sustainable solutions);
- ○
- Public-Private Partnerships (PPP) (in the implementation of smart city projects)
- ○
- Regulatory sandbox
- ○
- Availability of venture capital and innovation funds
- ○
- Urban crowdfunding platforms
- ○
- Other, specify
-
Human capital:
- ○
- Programs for attracting and retaining talent;
- ○
- STEM education and digital literacy programs;
- ○
- Professional reskilling/upskilling programs;
- ○
- Collaboration with higher education institutions;
- ○
- Other, specify.
Market analysis constitutes the totality of activities that allow for the interpretation of the situation in a given sector. The study reveals the value, potential related to the scale of demand growth, and fundamental trends. It is a systematic process of collecting, processing, and interpreting data about the business environment [71]. In the present study, market analysis referred to smart city solutions, technologies, and infrastructure.
Results analysis phase
The analysis of research results was conducted using elements of descriptive statistics and statistical methods [72,73]:
- Arithmetic mean – the sum of variable values for all units of the population divided by the number of observations (N).
- Median – the second quartile, the middle point of a data set arranged in ascending or descending order. It is the value that divides the data set into two equal parts.
- Standard deviation – a measure of dispersion of results around the arithmetic mean, showing how much values in a data set differ from the arithmetic mean of those data. The larger the standard deviation, the greater the dispersion of data around the mean, which indicates greater variability in the data set. Conversely, a smaller standard deviation indicates greater concentration around the mean, which means less variability.
- Kruskal-Wallis nonparametric analysis of variance – this test is the equivalent of one-way ANOVA for ordinal data and allows for the comparison of more than two groups without the need to meet assumptions of normal distribution and homogeneity of variance. In cases where statistically significant differences were found, multiple comparison tests were performed, which enabled identification of which pairs of groups exhibited significant differences.
- Spearman's rank correlation coefficient – applied to analyze relationships between variables. It is a measure designed to examine the strength and direction of relationships between ordinal variables or those that do not meet the assumptions of parametric methods. The choice of this method was justified by the nature of the measurement scale and the lack of necessity to meet assumptions of linearity and normal distribution of variables.
All statistical analyses were conducted using the Statistica 13.1 software package. In all tests, a statistical significance level of α=0.05 was adopted. Due to the nature of the collected data, nonparametric methods were applied. Expert assessments were made on a five-point Likert scale, which is ordinal rather than quantitative in nature. This means that intervals between successive scale values cannot be treated as equal, which precludes the use of classical parametric methods based on means and the assumption of normal distribution. Additionally, the sizes of individual expert groups were unequal, and the smallest group was relatively small, which also argued for the application of nonparametric methods robust to violations of assumptions about data distribution.
The research is conducted from the perspective of Polish experts, but with a general perspective on the functioning of smart cities in the context of their potential to influence business development.
The scheme of the research process is illustrated in Figure 1.
4. Results
4.1. The Potential of Smart Cities to Stimulate Business Development
The smart city market is experiencing dynamic growth driven by increasing urbanization, government initiatives, and technological advancement. Based on several industry reports, the value of the smart city market in 2024 ranges from USD 615.70 billion (Markets and Markets) to USD 2,431.35 billion (Industry ARC), with an average of USD 1,379.43 billion. By 2030, forecasts indicate growth to levels ranging from USD 1,445.60 billion to USD 9,409.24 billion, with an average of USD 5,168.43 billion (Figure 2).
The discrepancies in forecasts result from differences in the definition of the smart city market and the scope of analyzed components. Allied Market Research adopts a broader definition, encompassing smart infrastructure, governance, energy, mobility, and healthcare, which results in a baseline value of USD 648.36 billion in 2020 and a forecast of USD 6,061 billion in 2030 at a CAGR of 25.2%. Grand View Research focuses more on application segments, estimating the market in 2024 at USD 877.6 billion with the highest CAGR of 29.4% through 2030.
The smart city market is at a stage of transformative growth, driven by the convergence of urbanization, political ambitions regarding digital transformation, and technological maturity of key enablers such as IoT, AI, 5G, and edge computing. For enterprises, this dynamic market creates unprecedented opportunities but also requires fundamental business transformation. This analysis examines how the development of the smart city ecosystem affects business models, new product and service categories, competency transformation, the building of partner ecosystems, and high-growth segments.
Business Model Transformation
Traditional business models based on the sale of stand-alone products or services are becoming insufficient in the context of comprehensive smart city projects. Cities expect long-term partnerships in which suppliers assume responsibility for achieving measurable business results, which forces enterprises to fundamentally change their approach to monetization and value delivery. The following can be particularly highlighted:
- Outcome-based contracts – limited municipal budgets drive phased implementations and outcome-based contracts. Enterprises are shifting from selling technology to delivering measurable business results, assuming part of the operational risk.
- Managed services – cities prefer outsourcing smart city system management rather than building internal competencies. This model allows for generating predictable, long-term revenues from monitoring and optimizing urban systems.
- Subscription platforms (SaaS) – enable cities to access advanced analytical tools without high capital costs. Enterprises offering platforms for managing urban operations or data analytics can scale solutions generating economies of scale.
- Public-Private Partnerships (PPP) – particularly important for financing projects in developing regions. Enterprises share investment risk and benefits from infrastructure development, which requires advanced competencies in financing structuring.
New Product and Service Categories
Smart city market dynamics generate demand for entirely new categories of solutions that previously did not exist in the offerings of major technology providers. Anticipating and responding to these emerging market needs is crucial for enterprises seeking to maintain a competitive position. Key elements include:
- Integration platforms – cities are seeking comprehensive platforms connecting transport, energy, security, and governance into a single ecosystem. Enterprises specializing in integrating heterogeneous IT and OT systems create significant value.
- Edge computing – the ability to process data in real time is becoming crucial for applications requiring immediate response. 5G technology with ultra-low latency is fundamental for smart city systems.
- City digital twins – platforms for creating virtual representations of infrastructure enable scenario simulation and predictive maintenance. Integration of BIM (Building Information Modeling) technology is transforming infrastructure planning and management.
- Environmental monitoring – growing focus on climate goals creates demand for air quality, water quality, and waste management monitoring systems. Enterprises offering environmental sensors find a growing market among administrations subject to climate regulations.
- Electric vehicle infrastructure – the smart transportation segment shows the highest CAGR of 33% in 2025–2030. EV development creates opportunities for enterprises in charging stations, energy management systems, and platforms optimizing infrastructure.
Competency Transformation
Implementing advanced smart city technologies requires re-evaluation of employee competencies and building entirely new expert teams. Enterprises operating in traditional sectors must rapidly adapt their human resources to the requirements of urban digital transformation, through, among others:
- Data science and predictive analytics – the ability to process and analyze vast amounts of urban data in real time constitutes the foundation of smart city solution value. Enterprises must build teams of specialists capable of extracting practical insights from heterogeneous data sources.
- AI and machine learning – growing application of AI in smart city systems requires teams capable of designing and implementing models in production environments. Enterprises must also understand the ethical implications of algorithmic decision-making.
- Cybersecurity – smart city infrastructure constitutes an attractive target for cyberattacks. Enterprises must develop expertise in security-by-design and incident response. Cities demand "privacy-by-design," transparency, and open standards.
- Systems integration – the ability to integrate systems from different suppliers using different protocols is crucial. This requires expertise in APIs, middleware, and IoT communication protocols.
- Interdisciplinary understanding of urban context – success requires going beyond technology and understanding urban planning, public policies, and public administration management. This perspective is crucial for designing solutions that are practically useful and socially acceptable.
Building Partner Ecosystems
The complexity of smart city projects exceeds the capabilities of individual organizations, forcing a fundamental change in the approach to competition. Enterprises must shift from competing on products to co-creating ecosystems in which each partner contributes specialized knowledge and capabilities:
- Value chain integration – effective solutions require integration from the sensor layer, through network connectivity, to end applications. Enterprises must balance control over key technologies with the benefits of specialization.
- Collaboration with telecommunications operators – 5G development is a key market driver. Enterprises must closely cooperate with operators to ensure appropriate connectivity and network slicing for critical applications.
- Research partnerships – many innovations arise in collaboration with universities. Enterprises gain access to the latest knowledge and testing opportunities before commercialization.
- International consortia – differences in regulations between regions hinder independent expansion. Consortia combining local knowledge with global capabilities allow for more effective penetration of foreign markets.
High-Growth Segments
The smart city market is not developing uniformly – individual segments and applications exhibit significantly different growth dynamics. Identifying segments with the highest growth potential is crucial for enterprises planning resource allocation and investments in new competencies. The following sectors can be mentioned in particular:
- Smart transportation – intelligent transport systems dominate due to road congestion. Enterprises offering adaptive signaling, MaaS platforms, or infrastructure for autonomous vehicles achieve growth significantly exceeding the average.
- Parking management – this segment shows the highest CAGR in smart transportation due to demand for efficient space management. The growing number of vehicles forces a focus on reducing congestion and pollution.
- Smart healthcare – the systems and software segment is growing fastest due to demand for EHR integration, remote diagnostics, and AI systems. Enterprises offering telemedicine and IoT for healthcare benefit from an aging population.
The ultimate impact of smart city market development on enterprises consists in a fundamental redefinition of their role in the value chain. Enterprises are undergoing transformation from technology suppliers to architects of comprehensive urban transformation, requiring integration of advanced technical competencies with deep understanding of urban dynamics.
Furthermore, it is worth noting that development can be multi-track and result from different capabilities: technological excellence (IoT, AI, edge computing, cybersecurity), business flexibility (adaptation of monetization models and structures), and social intelligence (designing useful and inclusive solutions). Enterprises capable of this multidimensional transformation can not only participate in the dynamic market growth but also build an entirely new quality of smart urbanism for the future.
4.2. Analiza Wyników Ankiety Eksperckiej
The expert survey was conducted from October 7 to December 12, 2025. A total of 54 experts participated in the study, constituting the following groups:
- A: researchers, academics (N=28, share in structure: 53.85%);
- B1: business representatives from the smart city solutions industry (technology and systems providers) (N=17, share in structure: 32.69%);
- B2: business representatives implementing solutions (infrastructure operators, developers, design firms) (N=7, share in structure: 13.46%);
- C2: administration representatives (N=2; however, this group was excluded from further analyses due to its low size).
The analysis of responses was divided into the following blocks: technological innovations, infrastructure, smart governance, innovation ecosystem and support, and human capital. Individual factors were coded (Appendix A).
Technological Innovations
The analysis of expert responses regarding factors from the technological innovations category is presented in Table 1.
In the Infrastructure block, very strong and statistically significant differences in assessments between expert groups were found for all analyzed variables. In all cases, the Kruskal-Wallis test indicated clear differentiation of opinions between academics, business representatives from the smart city solutions industry (technology and systems providers), and business representatives implementing solutions (infrastructure operators, developers, design firms).
For the variable Intelligent transport systems, the Kruskal-Wallis test revealed very strong differences H(2,N=52)=33.23, p<0.00001. The highest ratings were given by business representatives implementing solutions (infrastructure operators, developers, design firms) M=5.00, Me=5.00, Q1=5.00, Q3=5.00. Lower ratings were given by academics M=3.89, Me=4.00, Q1=4.00, Q3=4.00, while decidedly the lowest were given by business representatives from the smart city solutions industry (technology and systems providers) M=2.94, Me=3.00, Q1=2.00, Q3=3.00. Multiple comparison tests revealed significant differences between academics and business representatives from the smart city solutions industry p=0.0028, between academics and business representatives implementing solutions p=0.0067, and between both business groups p=0.0000, which means that all three groups differed significantly in their assessment of this variable.
For the variable Technological infrastructure, the Kruskal-Wallis test revealed the strongest differences H(2,N=52)=45.56, p<0.00001. The lowest ratings were given by academics M=2.93, Me=3.00, Q1=3.00, Q3=3.00, while significantly higher and similar ratings were given by business representatives from the smart city solutions industry M=4.35, Me=4.00, Q1=4.00, Q3=5.00 and business representatives implementing solutions M=4.14, Me=4.00, Q1=4.00, Q3=4.00. Multiple comparison tests revealed significant differences between academics and business representatives from the smart city solutions industry p=0.0000 and between academics and business representatives implementing solutions p=0.0005, with no significant differences between both business groups p=1.0000. This means that academics rate the importance of technological infrastructure significantly lower than both business groups.
For the variable Smart energy management, differences were very pronounced H(2,N=52)=44.16, p<0.00001. The highest ratings were given by business representatives implementing solutions M=4.71, Me=5.00, Q1=4.00, Q3=5.00, slightly lower by academics M=4.00, Me=4.00, Q1=4.00, Q3=4.00, while decidedly the lowest by business representatives from the smart city solutions industry M=2.71, Me=3.00, Q1=2.00, Q3=3.00. Multiple comparison tests revealed significant differences between academics and business representatives from the smart city solutions industry p=0.000006 and between both business groups p=0.000001, with no significant difference between academics and business representatives implementing solutions p=0.134039. This means that business representatives from the smart city solutions industry rate the importance of smart energy management significantly lower than the other groups.
For the variable Circular economy, very strong differences were also noted H(2,N=52)=40.55, p<0.00001. The highest ratings were given by business representatives implementing solutions M=4.29, Me=4.00, Q1=4.00, Q3=5.00, slightly lower by academics M=3.75, Me=4.00, Q1=3.50, Q3=4.00, while decidedly the lowest by business representatives from the smart city solutions industry M=1.94, Me=2.00, Q1=2.00, Q3=2.00. Multiple comparison tests revealed significant differences between academics and business representatives from the smart city solutions industry p=0.000001 and between both business groups p=0.000006, with no significant difference between academics and business representatives implementing solutions p=0.592980. This means that business representatives from the smart city solutions industry rate the importance of the circular economy significantly lower than the other groups.
For the variable Digital twins, the Kruskal-Wallis test revealed significant differences H(2,N=52)=20.52, p<0.00001. The highest ratings were given by academics M=4.46, Me=4.00, Q1=4.00, Q3=5.00, lower by business representatives implementing solutions M=4.00, Me=4.00, Q1=4.00, Q3=4.00, while the lowest by business representatives from the smart city solutions industry M=3.53, Me=3.00, Q1=3.00, Q3=4.00. Multiple comparison tests revealed a significant difference between academics and business representatives from the smart city solutions industry p=0.0002, with no significant differences between academics and business representatives implementing solutions p=0.3572 or between both business groups p=0.5889. This means that business representatives from the smart city solutions industry rate the importance of digital twins significantly lower than academics.
Infrastructure
The analysis of expert responses regarding factors from the infrastructure category is presented in Table 2.
In the Infrastructure block, very strong and statistically significant differences in assessments between expert groups were found for all analyzed variables. In all cases, the Kruskal-Wallis test indicated clear differentiation of opinions between academics, business representatives from the smart city solutions industry (technology and systems providers), and business representatives implementing solutions (infrastructure operators, developers, design firms).
For the variable Intelligent transport systems, the Kruskal-Wallis test showed very strong differences H(2,N=52)=33.23, p<0.00001. The highest ratings were given by business representatives implementing solutions (infrastructure operators, developers, design firms) M=5.00, Me=5.00, Q1=5.00, Q3=5.00. Lower ratings were given by academics M=3.89, Me=4.00, Q1=4.00, Q3=4.00, while decidedly the lowest ratings were given by business representatives from the smart city solutions industry (technology and systems providers) M=2.94, Me=3.00, Q1=2.00, Q3=3.00. Multiple comparison tests showed significant differences between academics and business representatives from the smart city solutions industry p=0.0028, between academics and business representatives implementing solutions p=0.0067, and between the two business groups p=0.0000, which means that all three groups differed significantly in their assessment of this variable.
For the variable Technological infrastructure, the Kruskal-Wallis test showed the strongest differences H(2,N=52)=45.56, p<0.00001. The lowest ratings were given by academics M=2.93, Me=3.00, Q1=3.00, Q3=3.00, while significantly higher and similar ratings were given by business representatives from the smart city solutions industry M=4.35, Me=4.00, Q1=4.00, Q3=5.00 and business representatives implementing solutions M=4.14, Me=4.00, Q1=4.00, Q3=4.00. Multiple comparison tests showed significant differences between academics and business representatives from the smart city solutions industry p=0.0000 and between academics and business representatives implementing solutions p=0.0005, with no significant differences between the two business groups p=1.0000. This means that academics rate the importance of technological infrastructure significantly lower than both business groups.
For the variable Smart energy management, the differences were very pronounced H(2,N=52)=44.16, p<0.00001. The highest ratings were given by business representatives implementing solutions M=4.71, Me=5.00, Q1=4.00, Q3=5.00, slightly lower by academics M=4.00, Me=4.00, Q1=4.00, Q3=4.00, while decidedly the lowest ratings were given by business representatives from the smart city solutions industry M=2.71, Me=3.00, Q1=2.00, Q3=3.00. Multiple comparison tests showed significant differences between academics and business representatives from the smart city solutions industry p=0.000006 and between the two business groups p=0.000001, with no significant difference between academics and business representatives implementing solutions p=0.134039. This means that business representatives from the smart city solutions industry rate the importance of smart energy management significantly lower than the other groups.
For the variable Circular economy, very strong differences were also recorded H(2,N=52)=40.55, p<0.00001. The highest ratings were given by business representatives implementing solutions M=4.29, Me=4.00, Q1=4.00, Q3=5.00, slightly lower by academics M=3.75, Me=4.00, Q1=3.50, Q3=4.00, while decidedly the lowest ratings were given by business representatives from the smart city solutions industry M=1.94, Me=2.00, Q1=2.00, Q3=2.00. Multiple comparison tests showed significant differences between academics and business representatives from the smart city solutions industry p=0.000001 and between the two business groups p=0.000006, with no significant difference between academics and business representatives implementing solutions p=0.592980. This means that business representatives from the smart city solutions industry rate the importance of the circular economy significantly lower than the other groups.
For the variable Digital twins, the Kruskal-Wallis test showed significant differences H(2,N=52)=20.52, p<0.00001. The highest ratings were given by academics M=4.46, Me=4.00, Q1=4.00, Q3=5.00, lower ratings by business representatives implementing solutions M=4.00, Me=4.00, Q1=4.00, Q3=4.00, and the lowest ratings by business representatives from the smart city solutions industry M=3.53, Me=3.00, Q1=3.00, Q3=4.00. Multiple comparison tests showed a significant difference between academics and business representatives from the smart city solutions industry p=0.0002, with no significant differences between academics and business representatives implementing solutions p=0.3572 and between the two business groups p=0.5889. This means that business representatives from the smart city solutions industry rate the importance of digital twins significantly lower than academics.
Smart governance
The analysis of expert responses regarding factors from the smart governance category is presented in Table 3.
In the Smart governance block, very strong and statistically significant differences in assessments between expert groups were found for all analyzed variables. In every case, the Kruskal-Wallis test indicated clear differentiation of opinions between academics, business representatives from the smart city solutions industry (technology and systems providers), and business representatives implementing solutions (infrastructure operators, developers, design firms).
For the variable Open data, the Kruskal-Wallis test showed significant differences H(2, N=52)=40.34, p<0.00001. The highest ratings were given by academics M=4.71, Me=5.00, Q1=4.00, Q3=5.00, slightly lower by business representatives implementing solutions (infrastructure operators, developers, design firms) M=4.14, Me=4.00, Q1=4.00, Q3=4.00, and decidedly the lowest ratings by business representatives from the smart city solutions industry (technology and systems providers) M=2.18, Me=2.00, Q1=2.00, Q3=2.00. Multiple comparison tests showed significant differences between academics and business representatives from the smart city solutions industry p<0.0001, and between business representatives from the smart city solutions industry and business representatives implementing solutions p=0.025, with no significant difference between academics and business representatives implementing solutions p=0.355. This means that business representatives from the smart city solutions industry rate the importance of open data significantly lower than the other groups.
For the variable E-government services, very strong differences were also found H(2, N=52)=41.85, p<0.00001. The highest ratings were given by academics M=4.68, Me=5.00, Q1=4.00, Q3=5.00, lower by business representatives implementing solutions (infrastructure operators, developers, design firms) M=3.86, Me=4.00, Q1=4.00, Q3=4.00, and decidedly the lowest ratings by business representatives from the smart city solutions industry (technology and systems providers) M=1.94, Me=2.00, Q1=2.00, Q3=2.00. Multiple comparison tests showed a significant difference between academics and business representatives from the smart city solutions industry p<0.0001, with no significant differences between academics and business representatives implementing solutions p=0.143 or between the two business groups p=0.059. This means that business representatives from the smart city solutions industry rate the importance of e-government services significantly lower than academics.
For the variable Digital participation tools, the differences were equally strong H(2, N=52)=42.40, p<0.00001. The highest ratings were given by academics M=4.32, Me=4.00, Q1=4.00, Q3=5.00, lower by business representatives implementing solutions (infrastructure operators, developers, design firms) M=3.29, Me=3.00, Q1=3.00, Q3=4.00, and the lowest ratings by business representatives from the smart city solutions industry (technology and systems providers) M=1.82, Me=2.00, Q1=2.00, Q3=2.00. Multiple comparison tests showed a significant difference between academics and business representatives from the smart city solutions industry p<0.0001, with no significant differences between academics and business representatives implementing solutions p=0.083 or between the two business groups p=0.092. This means that business representatives from the smart city solutions industry rate the importance of digital participation tools significantly lower than academics.
Innovation ecosystem and support
The analysis of expert responses regarding factors from the innovation ecosystem and support category is presented in Table 4.
In the Innovation ecosystem and support block, in most cases very strong and statistically significant differences in assessments between expert groups were found. Only for the variable Business networking were no significant differences between groups observed. For the variable Startup support programmes, the Kruskal-Wallis test showed significant differences H(2, N=52)=39.58, p<0.00001. The highest ratings were given by academics M=4.68, Me=5.00, Q1=4.00, Q3=5.00 and by business representatives implementing solutions (infrastructure operators, developers, design firms) M=4.29, Me=4.00, Q1=4.00, Q3=5.00, while significantly lower ratings were given by business representatives from the smart city solutions industry (technology and systems providers) M=3.00, Me=3.00, Q1=3.00, Q3=3.00. Multiple comparison tests showed significant differences between academics and business representatives from the smart city solutions industry p<0.0001 and between business representatives from the smart city solutions industry and business representatives implementing solutions p=0.008, with no significant difference between academics and business representatives implementing solutions p=0.849.
For the variable Technology clusters, significant differences were also found H(2, N=52)=36.67, p<0.00001. The highest ratings were given by academics M=4.68, Me=5.00, Q1=4.00, Q3=5.00, lower by business representatives implementing solutions M=4.14, Me=4.00, Q1=4.00, Q3=5.00, and significantly lower by business representatives from the smart city solutions industry M=3.06, Me=3.00, Q1=3.00, Q3=3.00. Multiple comparison tests showed significant differences between academics and business representatives from the smart city solutions industry p<0.0001 and between business representatives from the smart city solutions industry and business representatives implementing solutions p=0.032.
For the variable R&D investments, significant differences were recorded H(2, N=52)=41.27, p<0.00001. The highest ratings were given by academics M=4.71, Me=5.00, Q1=4.00, Q3=5.00, lower by business representatives implementing solutions M=4.00, Me=4.00, Q1=4.00, Q3=4.00, and decidedly the lowest by business representatives from the smart city solutions industry M=2.65, Me=3.00, Q1=2.00, Q3=3.00. Multiple comparison tests showed a significant difference between academics and business representatives from the smart city solutions industry p<0.0001.
For the variable Business networking, no significant differences between groups were found H(2, N=52)=4.90, p=0.086. The ratings of all groups were similar, which indicates a comparable perception of the importance of this variable across all expert categories.
For the variable Participation in smart city projects, significant differences were found H(2, N=52)=14.46, p=0.0007. The highest ratings were given by business representatives from the smart city solutions industry M=4.24, Me=4.00, Q1=4.00, Q3=4.00, lower by academics M=3.71, Me=4.00, Q1=3.00, Q3=4.00, and the lowest by business representatives implementing solutions M=3.43, Me=3.00, Q1=3.00, Q3=4.00. Multiple comparison tests showed significant differences between academics and business representatives from the smart city solutions industry p=0.039 and between the two business groups p=0.020.
For the variable Tax reliefs and grants, very strong differences were recorded H(2, N=52)=35.78, p<0.00001. The highest ratings were given by academics M=3.57, Me=4.00, Q1=3.00, Q3=4.00 and by business representatives implementing solutions M=3.43, Me=3.00, Q1=3.00, Q3=4.00, while decidedly the lowest ratings were given by business representatives from the smart city solutions industry M=1.35, Me=1.00, Q1=1.00, Q3=2.00. Multiple comparison tests showed significant differences between academics and business representatives from the smart city solutions industry p<0.0001 and between the two business groups p=0.0019, with no significant difference between academics and business representatives implementing solutions p=1.0000.
For the variable Public-Private Partnerships, very strong differences were also found H(2, N=52)=41.05, p<0.00001. The highest ratings were given by business representatives implementing solutions M=4.14, Me=4.00, Q1=4.00, Q3=4.00, slightly lower by academics M=3.71, Me=4.00, Q1=3.00, Q3=4.00, and decidedly the lowest by business representatives from the smart city solutions industry M=1.88, Me=2.00, Q1=2.00, Q3=2.00. Multiple comparison tests showed significant differences between academics and business representatives from the smart city solutions industry p<0.0001 and between the two business groups p<0.0001, with no significant difference between academics and business representatives implementing solutions p=0.867984.
For the variable Regulatory sandbox, significant differences were recorded H(2, N=52)=43.61, p<0.00001. The highest ratings were given by academics M=4.00, Me=4.00, Q1=4.00, Q3=4.00, lower by business representatives from the smart city solutions industry M=3.12, Me=3.00, Q1=3.00, Q3=3.00, and the lowest by business representatives implementing solutions M=2.71, Me=3.00, Q1=2.00, Q3=3.00. Multiple comparison tests showed significant differences between academics and business representatives from the smart city solutions industry p<0.0001 and between academics and business representatives implementing solutions p<0.0001, with no significant difference between the two business groups p=1.000000.
For the variable VC and innovation funds, significant differences were found H(2, N=52)=25.03, p<0.00001. The highest ratings were given by business representatives from the smart city solutions industry M=4.12, Me=4.00, Q1=4.00, Q3=4.00, lower by academics M=3.68, Me=4.00, Q1=3.00, Q3=4.00, and the lowest by business representatives implementing solutions M=2.71, Me=3.00, Q1=2.00, Q3=3.00. Multiple comparison tests showed significant differences between academics and business representatives implementing solutions p=0.011 and between the two business groups p<0.0001.
For the variable Urban crowdfunding platforms, significant differences were also recorded H(2, N=52)=34.27, p<0.00001. The highest ratings were given by academics M=2.68, Me=3.00, Q1=2.00, Q3=3.00 and by business representatives implementing solutions M=2.57, Me=3.00, Q1=2.00, Q3=3.00, while decidedly the lowest ratings were given by business representatives from the smart city solutions industry M=1.18, Me=1.00, Q1=1.00, Q3=1.00. Multiple comparison tests showed significant differences between academics and business representatives from the smart city solutions industry p<0.0001 and between the two business groups p=0.0024, with no significant difference between academics and business representatives implementing solutions p=1.0000.
Human capital
The analysis of expert responses regarding factors from the human capital category is presented in Table 5.
In the Human capital block, very strong and statistically significant differences in assessments between expert groups were found for all analyzed variables. In every case, the Kruskal-Wallis test indicated clear differentiation of opinions between academics, business representatives from the smart city solutions industry (technology and systems providers), and business representatives implementing solutions (infrastructure operators, developers, design firms).
For the variable Talent attraction and retention programmes, the Kruskal-Wallis test showed significant differences H(2, N=52)=40.62, p<0.00001. The highest ratings were given by academics M=4.68, Me=5.00, Q1=4.00, Q3=5.00, slightly lower by business representatives implementing solutions (infrastructure operators, developers, design firms) M=4.00, Me=4.00, Q1=4.00, Q3=4.00, and decidedly the lowest by business representatives from the smart city solutions industry (technology and systems providers) M=2.47, Me=2.00, Q1=2.00, Q3=3.00. Multiple comparison tests showed significant differences between academics and business representatives from the smart city solutions industry p<0.0001 and between business representatives from the smart city solutions industry and business representatives implementing solutions p=0.046, with no significant difference between academics and business representatives implementing solutions p=0.191.
For the variable STEM education and digital literacy, significant differences were also found H(2, N=52)=41.80, p<0.00001. The highest ratings were given by academics M=4.75, Me=5.00, Q1=4.50, Q3=5.00, lower by business representatives implementing solutions M=4.00, Me=4.00, Q1=4.00, Q3=4.00, and decidedly the lowest by business representatives from the smart city solutions industry M=2.47, Me=2.00, Q1=2.00, Q3=3.00. Multiple comparison tests showed a significant difference between academics and business representatives from the smart city solutions industry p<0.0001.
For the variable Reskilling/upskilling programmes, the differences were equally strong H(2, N=52)=41.85, p<0.00001. The highest ratings were given by academics M=4.61, Me=5.00, Q1=4.00, Q3=5.00, lower by business representatives implementing solutions M=3.57, Me=4.00, Q1=3.00, Q3=4.00, and the lowest by business representatives from the smart city solutions industry M=1.94, Me=2.00, Q1=2.00, Q3=2.00. Multiple comparison tests showed a significant difference between academics and business representatives from the smart city solutions industry p<0.0001.
For the variable Cooperation with universities, significant differences were also recorded H(2, N=52)=40.23, p<0.00001. The highest ratings were given by academics M=4.68, Me=5.00, Q1=4.00, Q3=5.00, slightly lower by business representatives implementing solutions M=4.14, Me=4.00, Q1=4.00, Q3=4.00, and decidedly the lowest by business representatives from the smart city solutions industry M=2.06, Me=2.00, Q1=2.00, Q3=2.00. Multiple comparison tests showed significant differences between academics and business representatives from the smart city solutions industry p<0.0001 and between business representatives from the smart city solutions industry and business representatives implementing solutions p=0.020, with no significant difference between academics and business representatives implementing solutions p=0.430.
In the Spearman rank correlation analysis (summary provided in Appendix B), only the strongest relationships were included, namely those for which the coefficient ρ≥0.80 or ρ≤−0.80. These relationships form clear groups of links between variables and indicate the existence of coherent thematic areas in the experts’ assessments. A very strong positive relationship occurs between AI and Machine Learning and Digital platforms and cloud services ρ=0.85, which means that as the assessed importance of AI and Machine Learning increases, the assessed importance of cloud services also increases. In the area of infrastructure and environment, a particularly strong relationship is observed between Smart energy management and Circular economy ρ=0.87, which means that higher ratings of the importance of smart energy management are accompanied by higher ratings of the importance of the circular economy. An equally strong relationship exists between Intelligent transport systems and Smart energy management ρ=0.80, indicating that higher ratings of intelligent transport systems are associated with higher ratings of the importance of energy management.
A very distinct cluster of strong positive correlations concerns the area of smart governance, the support ecosystem, and human capital. Open data correlate very strongly with E-government services ρ=0.96 and with Digital participation tools ρ=0.89, which means that as the assessed importance of open data increases, the assessed importance of e-government and digital participation also rises. E-government services are also very strongly linked with Digital participation tools ρ=0.90. Open data show very strong positive relationships with Startup support programmes ρ=0.93, R&D investments ρ=0.97, Talent attraction and retention programmes ρ=0.96, STEM education and digital literacy ρ=0.96, and Cooperation with universities ρ=0.98. This means that higher ratings of the importance of open data are associated with higher ratings of all these elements of the innovation ecosystem and human capital.
There are also very strong positive relationships between Startup support programmes and Technology clusters ρ=0.98, which means that as the assessed importance of startup programmes increases, the assessed importance of technology clusters also increases. Startup support programmes are also very strongly linked with Tax reliefs and grants ρ=0.95 and Public-Private Partnerships ρ=0.92. R&D investments correlate very strongly with Talent attraction and retention programmes ρ=0.98, STEM education and digital literacy ρ=0.98, and Cooperation with universities ρ=0.96, indicating that higher ratings of the importance of R&D investments are accompanied by higher ratings of the importance of human capital development and cooperation with universities.
In the area of financing and support, very strong relationships occur between Tax reliefs and grants and Circular economy ρ=0.89, and also between Tax reliefs and grants and Urban crowdfunding platforms ρ=0.89. Public-Private Partnerships correlate very strongly with Circular economy ρ=0.93 and with Tax reliefs and grants ρ=0.91.
There are also very strong negative relationships. Technological infrastructure correlates very strongly and negatively with Digital participation tools ρ=−0.82, with R&D investments ρ=−0.80, and with STEM education and digital literacy ρ=−0.81. This means that as the assessed importance of technological infrastructure increases, the assessed importance of these elements of smart governance, the innovation ecosystem, and human capital decreases. A similarly strong negative relationship exists between Technological infrastructure and Regulatory sandbox ρ=−0.81, indicating that higher ratings of the importance of infrastructure are associated with lower ratings of the importance of the regulatory sandbox.
5. Discussion
The obtained results confirm that the smart city acts as a complex innovation ecosystem in which technologies, infrastructure, governance and human capital jointly shape the conditions for enterprise development. This is consistent with ecosystem-based approaches in which a smart city is defined as an environment integrating physical infrastructure, a digital layer and a capital of knowledge and relationships, constituting a natural context for entrepreneurship and innovation [78,79,80].
First, the high ratings of IoT, AI/ML, big data and cloud computing by all experts, combined with differences in the perception of the role of infrastructure and governance, fit well with the findings of Jiang et al. [81] and Chen et al. [82], which show that the development of digital infrastructure reduces transaction costs, improves capital allocation and increases productivity (TFP), particularly in the case of SMEs and private firms. The strong positive correlations identified in our study between technologies (AI/ML, cloud platforms) and ecosystem elements (R&D, startup programmes, cooperation with universities) reflect the mechanisms strengthening firms’ innovative capabilities, described, among others, by Sun et al. [83] in the context of firms’ embeddedness in smart city networks.
Second, the very clear differences between expert groups in their assessment of infrastructure (intelligent transport systems, smart energy management, circular economy, digital twins) confirm that infrastructure is perceived as a direct “carrier” of business opportunities – especially by operators and implementation companies. This is consistent with the view of the smart city as a “living laboratory” in which infrastructure becomes a platform for testing new service and product models [84,85]. At the same time, the lower ratings of some infrastructural and environmental solutions by technology providers suggest a gap between the perspective of entities selling solutions and those bearing the risk of their practical application – which corresponds to the observations of Abbate et al. [86] regarding the differentiated roles of actors in platform-based smart city models.
Third, the results for the smart governance and support ecosystem blocks (open data, e-government, digital participation tools, startup programmes, clusters, R&D, PPPs, tax incentives, regulatory sandboxes, VC, crowdfunding) strongly resonate with the literature emphasising the importance of public policies and institutional instruments for unlocking the potential of smart cities [87,88]. The very high ratings of open data, R&D and support instruments by academics and operators, and at the same time consistently low ratings of these elements by technology providers, indicate that part of the market still perceives the smart city mainly through the lens of technology, while the literature highlights the key role of data, regulation and public demand mechanisms in generating entrepreneurial opportunities [80,89].
Fourth, the very strong positive correlations between open data, R&D, startup programmes, clusters and variables related to human capital confirm the findings of studies in which the smart city is interpreted as an environment of intense knowledge spillovers and intergrowth (knowledge spillover theory of entrepreneurship) [83,89]. Our results indicate that experts see these elements as highly complementary: where the importance of open data and R&D increases, the importance of talent programmes, STEM education and cooperation with universities increases in parallel. This is consistent with the findings of Lv and Gao [90], who show that smart city development leads to higher employment in more productive sectors and increases demand for advanced skills.
Fifth, the results support the thesis about the role of smart cities in the sustainable development of enterprises. High ratings of smart energy management, the circular economy and the links between these variables and financial instruments (tax incentives, grants, PPPs, crowdfunding) fit well with the findings of Tang et al. [91], who demonstrated a positive impact of pilot smart city programmes on firms’ ESG performance through green innovation and strengthened internal control systems. Our study suggests that experts – especially from academia and the implementation sector – see these elements not only as a regulatory dimension but also as a real source of competitive advantage and opportunities for cost- and environmentally-oriented optimisation of business operations.
An important observation is also the heterogeneity of assessments between expert groups, which reflects the differentiated distribution of benefits from smart city development described in the literature. Jiang et al. [81] and Tang et al. [91] show that SMEs and private firms benefit the most; in our study, it is precisely business representatives “close to infrastructure” (operators, developers, design firms) who assign the highest importance to many key factors, while technology providers are significantly more sceptical about the importance of governance instruments, human capital and sustainability. This can be interpreted as a difference between firms that benefit from long-term urban transformation and entities focused on short-term solution sales.
Finally, the results must be interpreted in light of certain limitations: the expert nature of the sample, the dominance of the Polish perspective and the lack of direct financial data on enterprises mean that the analysis is primarily perception-based. At the same time, it allows the findings to be situated within the broader body of empirical research 81, 83, 89, 90, 91] and points to specific areas in which further studies – based on firm-level panel data, inter-city comparisons and sectoral analyses – can deepen our understanding of the mechanisms through which smart cities actually become catalysts for enterprise development.
6. Conclusions
The conducted research confirms that the smart city can act as a catalyst for enterprise development, provided that technology, infrastructure, smart governance, the innovation ecosystem and human capital develop simultaneously. From a systemic perspective, the smart city creates a multidimensional ecosystem in which the digital data layer, advanced technologies (IoT, AI/ML, big data, cloud), spatial infrastructure, public policy instruments and human competences jointly create an environment conducive to the emergence, growth and transformation of enterprises.
Based on the results, it is possible to propose a synthetic model of the relationships and interactions between the smart city and enterprise development. Its foundation is the technology block (IoT, AI/ML, big data, automation, cloud), which provides the city with a basic capacity to collect, process and use data in real time. The second block is infrastructure (intelligent transport systems, technological infrastructure, smart energy management, circular economy, digital twins), which is a direct carrier of business opportunities and an environment for testing new service and product models. The third block is smart governance and the support ecosystem (open data, e-public services, digital participation tools, startup programmes, clusters, R&D investments, PPPs, tax incentives, regulatory sandboxes, VC funds, crowdfunding), which activate public demand mechanisms, reduce uncertainty and lower transaction costs for firms. The fourth block is human capital (talent attraction programmes, STEM education and digital competences, reskilling/upskilling, cooperation with universities), which conditions enterprises’ ability to absorb knowledge and technology and to use the infrastructure and data made available.
In the proposed model, the impacts unfold along at least four main pathways. First, the innovation pathway: the combination of technologies, open data, R&D, startup programmes and cooperation with universities leads to accelerated product, process and business model innovation in enterprises. Second, the efficiency pathway: infrastructure, data and automation enable the reduction of transaction and operating costs and the improvement of resource allocation in firms. Third, the human capital development pathway: the smart city, through quality of life, educational programmes and talent attraction, strengthens the competences available to enterprises, which increases their productivity and adaptability. Fourth, the sustainable development pathway: environmental solutions (smart energy, circular economy), combined with financial and regulatory instruments, support improvements in enterprises’ ESG performance and the development of green business models.
This model is dynamic and conditional in nature. Strong positive correlations between open data, R&D, startup programmes, clusters and human capital variables indicate that the greatest development potential emerges where these elements co-occur and mutually reinforce one another. At the same time, the observed differentiation of assessments between expert groups (academics, technology providers, operators and implementation companies) shows that the benefits of smart city development are distributed unevenly and that perceptions of the importance of particular factors are strongly dependent on the actor’s role in the ecosystem.
Figure 3.
A conceptual model of the impact of smart cities on the development of enterprises. Source: Own study.
Figure 3.
A conceptual model of the impact of smart cities on the development of enterprises. Source: Own study.
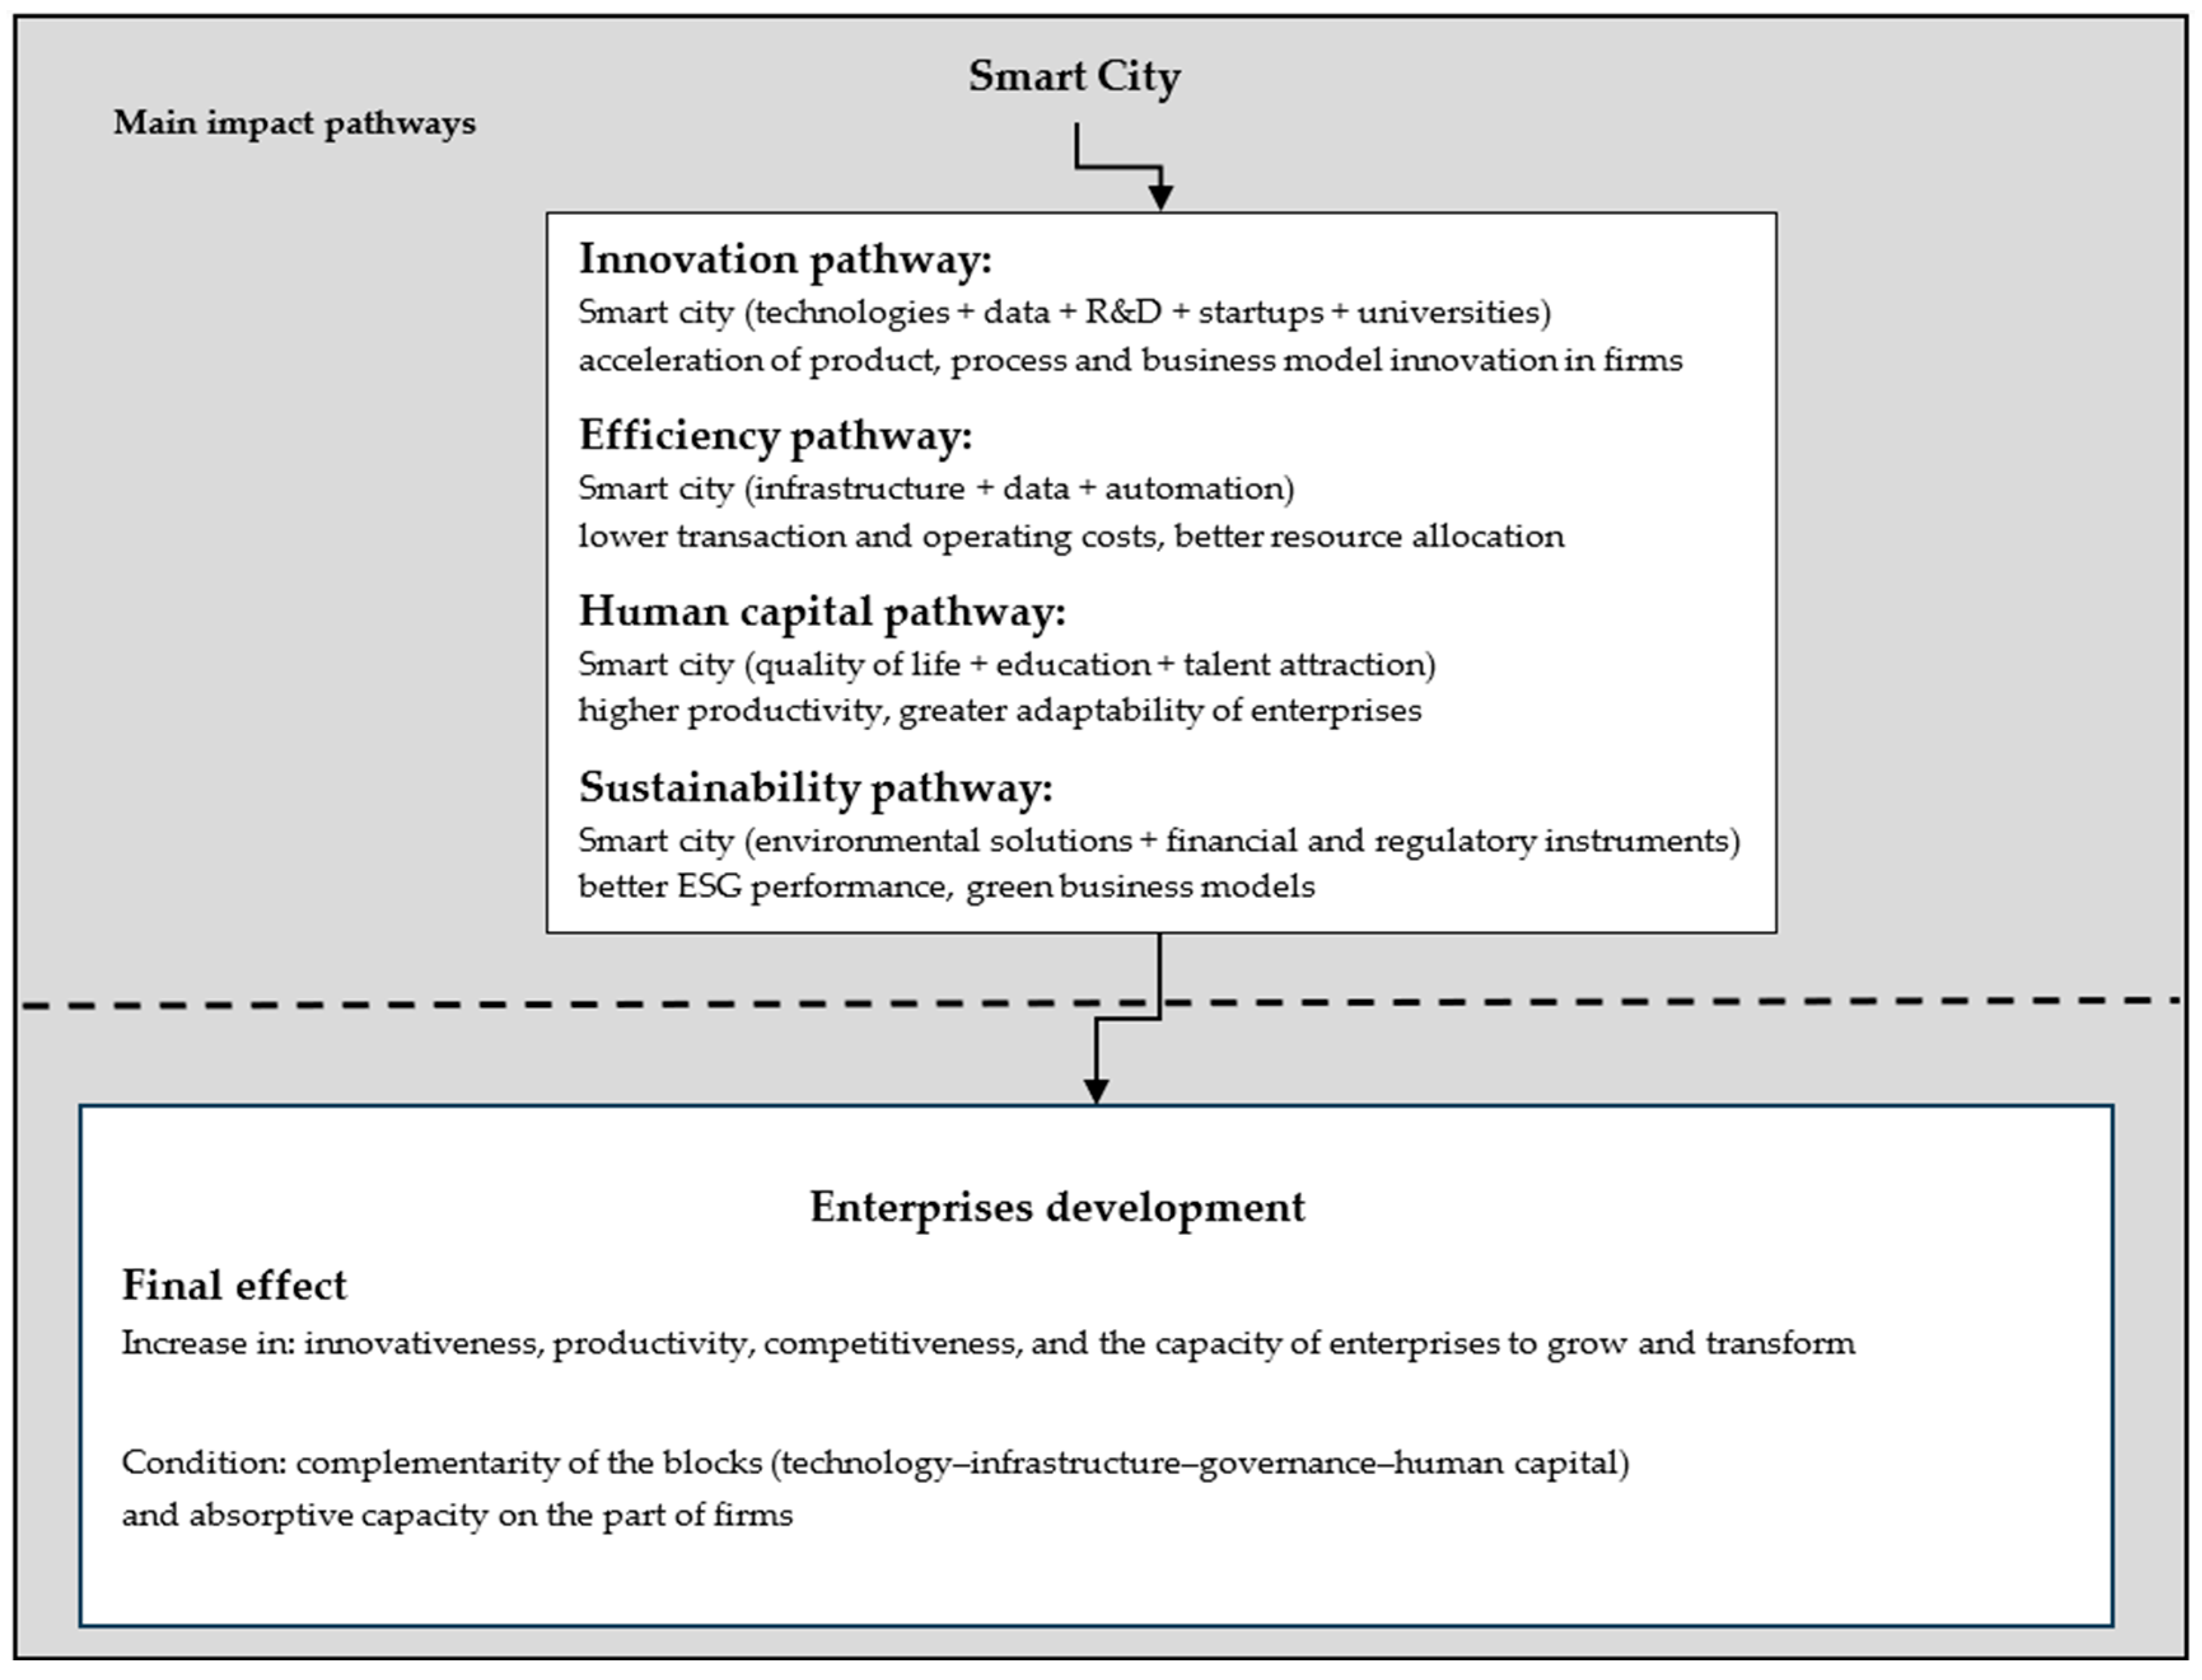
However, the study has important limitations that must be taken into account when interpreting the results. First, the use of the expert survey method means that the conclusions reflect the perceptions and experience of a selected, purposively chosen group of specialists rather than a representative population of enterprises. Second, the dominance of the Polish perspective limits the possibility of directly transferring the results to other institutional and economic contexts, especially cities in countries with different levels of development, economic structures or governance models. Third, the lack of direct quantitative data on enterprises’ economic and financial performance (e.g. revenues, profitability, TFP, ESG indicators) prevents causal verification of the identified relationships and restricts the analysis to the level of perceived importance of factors and correlations between them. Fourth, the sample structure (including the small size of some subgroups, such as public administration representatives) limits the possibilities for more advanced comparative and segmentation analyses.
In view of the above, at least three directions for further research are justified. First, quantitative studies based on enterprise-level panel data, enabling the linkage of the level of smart city development (at city or regional level) with objective indicators of firm performance (TFP, revenue dynamics, innovation intensity, ESG performance), using advanced econometric methods. Second, comparative studies between cities and countries that take into account different smart city models, public policy strategies and levels of digitalisation, which would make it possible to identify configurations of factors particularly conducive to the development of different types of enterprises (SMEs, startups, corporations, private and state-owned firms). Third, in-depth qualitative research (case studies, interviews, process analyses) focusing on cooperation mechanisms within smart city ecosystems, barriers to technology and data absorption by enterprises, and the long-term effects of transformation towards sustainable, knowledge-based development.
Author Contributions
Conceptualization, Ł.B. and M.K.W.; methodology, Ł.B. and M.K.W.; software, Ł.B.; validation, Ł.B. and M.K.W.; formal analysis, Ł.B. and M.K.W.; investigation, Ł.B.; resources, Ł.B.; data curation, Ł.B.; writing—original draft preparation, Ł.B. and M.K.W.; writing—review and editing, M.K.W.; visualization, Ł.B. and M.K.W.; supervision, M.K.W.; project administration, Ł.B. and M.K.W. All authors have read and agreed to the published version of the manuscript.” Please turn to the CRediT taxonomy for the term explanation. Authorship must be limited to those who have contributed substantially to the work reported.
Funding
This research received no external funding.
Institutional Review Board Statement
Not applicable.
Informed Consent Statement
Not applicable.
Data Availability Statement
The research results are the property of the authors and may be made available in special cases.
Conflicts of Interest
The authors declare no conflicts of interest.
Appendix A
Summary of factor codes in the expert survey.
| Block 1: Technology innovation |
| IoT – Internet of Things AI_ML – AI and Machine Learning G5 – 5G network BIGDATA – Big Data AUTOM – Business process automation CLOUD – Digital platforms and cloud services TECH_OTHER – Other (verbal description + optionally a 1–5 rating) |
| Block 2: Infrastructure |
| ITS – Intelligent transport systems INFRA_TECH – Technological infrastructure (broadband, EV charging stations) ENERGY_SMART – Smart energy management CIRC_ECON – Circular economy DIGITAL_TWIN – Digital twins INFRA_OTHER – Other (verbal description + optionally a 1–5 rating) |
| Block 3: Smart governance |
| OPEN_DATA – Open data EGOV – E-government services E_PARTICIP – Digital participation tools GOV_OTHER – Other (verbal description + optionally a 1–5 rating) |
| Block 4: Ekosystem innowacji i wsparcie |
| STARTUP_PROG – Startup support programmes TECH_CLUSTER – Technology clusters RND_INV – R&D investments BUS_NETWORK – Business networking SC_PROJECTS – Participation in smart city projects TAX_SUBSIDY – Tax incentives and subsidies PPP – Public–Private Partnerships SANDBOX – Regulatory sandbox VC_FUNDS – VC and innovation funds CROWDFUND – Urban crowdfunding platforms ECO_OTHER – Other (verbal description + optionally a 1–5 rating) |
| Block 5: Human capital |
| TALENT_PROG – Talent attraction and retention programmes STEM_DIGLIT – STEM education and digital literacy RESKILL – Reskilling and upskilling programmes UNIV_COOP – Cooperation with universities HC_OTHER – Other (verbal description + optionally a 1–5 rating) |
Appendix B
Spearman's rank order correlation removed in pairs Marked correlation coefficients are significant with p < .05000


References
- Makieła, Z.J.; Stuss, M.M.; Mucha-Ku´s, K.; Kinelski, G.; Budzi´ nski, M.; Michałek, J. Smart City 4.0: Sustainable Urban Development in the Metropolis GZM. Sustainability 2022, 14, 3516.
- Caragliu, A. Smart Cities: Past achievements and future challenges. Sci. Reg. Ital. J. Reg. Sci. 2016, 1, 7–14.
- Caragliu, A.; Del Bo, C.; Nijkamp, A. Smart Cities in Europe; University Amsterdam, Faculty of Economics, Business Administration and Econometrics: Amsterdam, the Netherlands, 2006.
- Caragliu, A.; Del Bo, C.; Nijkamp, P. Smart Cities in Europe. J. Urban Technol. 2011, 18, 65–82. [CrossRef]
- Katz, B.; Bradley, J. The Metropolitan Revolution: How Cities and Metros Are Fixing Our Broken Politics and Fragile Economy; Brooking Institution Press: Washington, DC, USA, 2013.
- Toppeta, D. The Smart City Vision: How Innovation and ICT Can Build Smart, “Livable”, Sustainable Cities; THINK! The Innovation Knowledge Foundation: Milano, Italy, 2010.
- Lee, J.H.; Hancock, M.G.; Hu, M.-C. Towards an effective framework for building smart cities: Lessons from Seoul and San Francisco. Technol. Forecast. Soc. Chang. 2014, 89, 80–99. [CrossRef]
- Popescu, A.I. Long-Term City Innovation Trajectories and Quality of Urban Life. Sustainability 2020, 12, 10587. [CrossRef]
- Bachanek, K.H. Gospodarka współdzielenia w koncepcji smar city. Probl. Transp. Logistyki 2019, 3, 7–13.
- Anthopoulos, L.G. Understanding Smart Cities: A Tool for Smart Government or an Industrial Trick? Springer International Publishing AG: Cham, Switzerland, 2017. [CrossRef]
- Graham, S.; Aurigi, A. Urbanising cyberspace?. City 1997, 2, 18–39. [CrossRef]
- van Bastelaer, B. Digital cities and transferability of results. In Proceedings of the 4th EDC Conference on Digital Cities, Salzburg, Austria, 29–30 October 1998.
- Hall, R.E.; Bowerman, B.; Braverman, J.; Taylor, J.; Todosow, H.; VonWimmersperg, U. The Vision of a Smart City; Brookhaven National Laboratory: Upton, MA, USA, 2010.
- Harrison, C.; Eckman, B.; Hamilton, R.; Hartswick, P.; Kalagnanam, J.; Paraszczak, J.; Williams, P. Foundations for Smarter Cities. IBM J. Res. Dev. 2010, 54, 1–16. [CrossRef]
- Marsal-Llacuna, M.-L.; Colomer-Llinàs, J.; Meléndez-Frigola, J. Lessons in urban monitoring taken from sustainable and livable cities to better address the Smart Cities initiative. Technol. Forecast. Soc. Chang. 2015, 90, 611–622. [CrossRef]
- Anthopoulos, L.; Fitsilis, P. Smart Cities and their Roles in City Competition: A Classification. Int. J. Electron. Gov. Res. 2014, 10, 67–81.
- Chourabi, H.; Nam, T.; Walker, S.; Gil-Garcia, J.R.; Mellouli, S.; Nahon, K.; Pardo, T.A.; Scholl, H.J. Understanding smart cities: An integrative framework. In Proceedings of the2012 45th Hawaii International Conference on System Science, Maui, HI, USA, 4–7 January 2012; pp. 2289–2297.
- Anthopoulos, L. Understanding the smart city Domain: A Literature Review. In Transforming City Governments for Successful Smart Cities; Public Administration and Information Technology Series; Bolivar, M.P., Ed.; Springer Science Business Media: New York, NY, USA, 2015; Volume 3.
- Mitchell, W. Intelligent cities. E-J. Knowl. Soc. 2007, 5, 3–8.
- Schaffers, H.; Komninos, N.; Pallot, M.; Trousse, B.; Nilsson, M.; Oliveira, A. Smart Cities and the Future Internet: Towards Cooperation Frameworks for Open Innovation. In The Future Internet Assembly; Springer: Berlin/Heidelberg, Germany, 2011; pp. 431–446. [CrossRef]
- Chong, M.; Habib, A.; Evangelopoulos, N.; Park, H.W. Dynamic capabilities of a smart city: An innovative approach to discovering urban problems and solutions. Gov. Inf. Q. 2018, 35, 682–692. [CrossRef]
- Tan, M. Creating the Digital Economy: Strategies and Perspectives from Singapore. Int. J. Electron. Commer. 1999, 3, 105–122. [CrossRef]
- Targowski, A.S. Strategies and architecture of the electronic global village. Inf. Soc. 1990, 7, 187–202. [CrossRef]
- Sproull, L.; Patterson, J.F. Making information cities livable. Commun. ACM 2004, 47, 33–37. [CrossRef]
- Fietkiewicz, K.J.; Mainka, A.; Stock, W.G. eGovernment in cities of the knowledge society. An empirical investigation of Smart Cities' governmental websites. Gov. Inf. Q. 2017, 34, 75–83. [CrossRef]
- Stolfi, F.; Sussman, G. Telecommunications and transnationalism: The polarization of social space. Inf. Soc. 2001, 17, 56.
- Shin, D.-H. Ubiquitous city: Urban technologies, urban infrastructure and urban informatics. J. Inf. Sci. 2009, 35, 515–526. [CrossRef]
- Mone, G. The new smart cities. Commun. ACM 2015, 58, 20–21. [CrossRef]
- Schaffers, H.; Ratti, C.; Komninos, N. Special Issue on Smart Applications for Smart Cities - New Approaches to Innovation: Guest Editors' Introduction. J. Theor. Appl. Electron. Commer. Res. 2012, 7, 9–10. [CrossRef]
- Peng, G.C.A.; Nunes, M.B.; Zheng, L. Impacts of low citizen awareness and usage in smart city services: the case of London’s smart parking system. Inf. Syst. e-Business Manag. 2016, 15, 845–876. [CrossRef]
- Mohanty, S.P.; Choppali, U.; Kougianos, E. Everything you wanted to know about smart cities: The Internet of things is the backbone. IEEE Consum. Electron. Mag. 2016, 5, 60–70. [CrossRef]
- Caragliu, A. Smart Cities: Past achievements and future challenges. Sci. Reg. Ital. J. Reg. Sci. 2016, 1, 7–14.
- Komninos, N. The Age of Intelligent Cities. Smart Environments and Innovation-for-All Strategies; Routledge Taylor & Francis Group: New York, NY, USA, 2015.
- Manville, C.; Cochrane, G.; Cave, J.; Millard, J.; Pederson, J.K.; Thaarup, R.K.; Liebe, A.;Wissner, M.; Massink, R.; Kotterink, B. Maping Smart Cities in the EU, Study; Directorate General for Internal Policies, Policy Department A: Economic and Scientific Policy, European Parliament: Belgium, Brussels, 2014.
- Albino, V.; Berardi, U.; Dangelico, R.M. Smart Cities: Definitions, Dimensions, Performance, and Initiatives. J. Urban Technol. 2015, 22, 3–21. [CrossRef]
- Kumar, H.; Singh, M.K.; Gupta, M.; Madaan, J. Moving towards smart cities: Solutions that lead to the Smart City Transformation Framework. Technol. Forecast. Soc. Chang. 2020, 153, 119281. [CrossRef]
- Janik, A.; Ryszko, A.; Szafraniec, M. Scientific Landscape of Smart and Sustainable Cities Literature: A Bibliometric Analysis. Sustainability 2020, 12, 779. [CrossRef]
- Sepasgozar, S.M.E.; Hawken, S.; Sargolzaei, S.; Foroozanfa, M. Implementing citizen centric technology in developing smart cities: A model for predicting the acceptance of urban technologies. Technol. Forecast. Soc. Chang. 2019, 142, 105–116. [CrossRef]
- Allwinkle, S.; Cruickshank, P. Creating Smart-er Cities: An Overview. J. Urban Technol. 2011, 18, 1–16. [CrossRef]
- Angelidou, M. Smart city policies: A spatial approach. Cities 2014, 41, S3–S11. [CrossRef]
- Yigitcanlar, T.; Kamruzzaman, M.; Foth, M.; Sabatini-Marques, J.; Da-Costa, E.; Ioppolo, G. Can cities become smart without being sustainable? A systematic review of the literature. Sustain. Cities Soc. 2019, 45, 348–365. [CrossRef]
- Glasmeier, A.; Christopherson, S. Thinking about smart cities. Camb. J. Reg. Econ. Soc. 2015, 8, 3–12. [CrossRef]
- Hajduk, S. Bibliometric Analysis of the Concept of the Smart City in International Scientific Literature; Internal Trade No. 3(368); Instytut Badań Rynku, Konsumocji i Koniunktury: Warszawa, Polska, 2017; pp. 301–312.
- Gotlibowska, K. Propozycja modelu miasta inteligentnego (Smart City) opartego na zastosowaniu technologii informacyjno-komunikacyjnych w jego rozwoju. Rozw. Reg. Polityka Reg. 2018, 67–80. [CrossRef]
- Ryba, M. Czym jest koncepcja smart city, a zatem dlaczego powinniśmy je nazywać miastem sprytnym / What is a ‘smart city’ concept and how we should call it in Polish. Res. Pap. Wrocław Univ. Econ. 2017. [CrossRef]
- Glaeser, E.L. Triumph of the City: How Our Greatest Invention Makes Us Richer, Smarter, Greener, Healthier, and Happier; Macmillan: London, UK, 2011.
- Jiang, X.; Han, X.; Xue, L.; Yu, Z.; Wei, S.; Xu, H. How smart city building improved corporate performance: empirical evidence of China’s a-share listed companies. Humanit. Soc. Sci. Commun. 2023, 10, 1–8. [CrossRef]
- Jiang, X.; Han, X.; Xue, L.; Yu, Z.; Wei, S.; Xu, H. How smart city building improved corporate performance: empirical evidence of China’s a-share listed companies. Humanit. Soc. Sci. Commun. 2023, 10, 1–8. [CrossRef]
- Oomens, Ivette M. F.; Sadowski, Bert M. (2017) : The importance of value creation in smart city initiatives: An ecosystem approach, 28th European Regional Conference of the International Telecommunications Society (ITS): "Competition and Regulation in the Information Age", Passau, Germany, 30th July - 2nd August, 2017, International Telecommunications Society (ITS), Calgary.
- Abdalla, W.; Suresh, S.; Renukappa, S. Managing knowledge in the context of smart cities: An organizational cultural perspective. J. Entrep. Manag. Innov. 2020, 16, 47–85. [CrossRef]
- Qu, K.; Zhang, Y.; Fan, X. RETRACTED ARTICLE: From Smart Cities to Smarter Economies: The Dynamics of Urban Technology and Enterprise Total Factor Productivity. J. Knowl. Econ. 2024, 16, 4747–4781. [CrossRef]
- Singh, P.; Kreutzer, K.; Kummitha, R.K.R. Exploring the Role of Smart City Strategies in Fostering Entrepreneurship in Small and Medium Sized Cities of India: A Case Study of Indore and Satna. Regions 2022. [CrossRef]
- Barba-Sánchez, V.; Arias-Antúnez, E.; Orozco-Barbosa, L. Smart cities as a source for entrepreneurial opportunities: Evidence for Spain. Technol. Forecast. Soc. Chang. 2019, 148. [CrossRef]
- Sun, C. The impact of smart city Internet firms network embeddedness on product innovation: a moderated mediating model. Soft Comput. 2023, 1–18. [CrossRef]
- Tang, Y. Economic Analysis of Smart Cities: How does Technological Progress Drive Urban Productivity and Economic Growth. International Conference on Modern Management and Education Technology. China; pp. 1183–1192.
- Smart City Poznan: An Innovation Hub In The Greater Poland Region. Available online: https://www.poznan.pl/mim/wortals/en/en/news,9560/smart-city-poznan-an-innovation-hub-in-the-greater-poland-region,166160.html (accessed on 28 January 2026).
- Abbate, T.; Cesaroni, F.; Cinici, M.C.; Villari, M. Business models for developing smart cities. A fuzzy set qualitative comparative analysis of an IoT platform. Technol. Forecast. Soc. Chang. 2019, 142, 183–193. [CrossRef]
- Lv, R.; Gao, H. Effects of smart city construction on employment: mechanism and evidence from China. Empir. Econ. 2023, 65, 2393–2425. [CrossRef]
- Tang, H.; Wang, J.-B.; Ou, C.-Y. How do smart city pilots affect the ESG performance of manufacturing firms? evidence from China. Front. Environ. Sci. 2024, 11, 1305539. [CrossRef]
- Abbate, T.; Cesaroni, F.; Cinici, M.C.; Villari, M. Business models for developing smart cities. A fuzzy set qualitative comparative analysis of an IoT platform. Technol. Forecast. Soc. Chang. 2019, 142, 183–193. [CrossRef]
- Masik, G.; Sagan, I.; Scott, J.W. Smart City strategies and new urban development policies in the Polish context. Cities 2021, 108. [CrossRef]
- Lam, P.T.I., Yang, W., A Study of the Costs and Benefits of Smart City Projects Including the Scenario of Public-Private Partnerships, World Academy of Science, Engineering and Technology International Journal of Urban and Civil Engineering Vol:11, No:5, 2017.
- Quan, X.; Solheim, M.C. Public-private partnerships in smart cities: A critical survey and research agenda. City, Cult. Soc. 2022, 32. [CrossRef]
- Primer for Smart City Public-Private Collaborations, World Economic Forum, G20 Global Smart Cities Alliance. Available online: https://www3.weforum.org/docs/WEF_A_Primer_of_Public_Private_Collaborations_for_Smart_Cities_2023.pdf (accessed on 28 January 2026).
- The local leverage of public procurement: innovating for sustainable cities. Available online: https://eurocities.eu/latest/the-local-leverage-of-public-procurement-innovating-for-sustainable-cities/ (accessed on 28 January 2026).
- Makowska, M. Analiza Danych Zastanych. Przewodnik dla Studentów; Wydawnictwo Naukowe Scholar: Warszawa, Polska, 2013.
- Bednarowska, Z. Desk research—Wykorzystanie potencjału danych zastanych w prowadzeniu bada´n marketingowych i społecznych. Mark. Rynek 2015, 7, 18–26.
- Magruk, A. Foresight—Nowa metoda prognozowania heurystycznego. In Technologie i Prognozowanie w Zarza˛dzaniu. Wybrane Zagadnienia; Kiełtyka, L., Nazarko, J., Eds.;Wydawnictwo Politechniki Białostockiej: Białystok, Polska, 2005.
- Babbie, E. Badania Społeczne w Praktyce; Wydawnictwo Naukowe PWN: Warszawa, Polska, 2004.
- Churchill, G.A. Badania Marketingowe. Podstawy Metodologiczne; Wydawnictwo Naukowe PWN: Waszawa, Polska, 2002.
- Balicki A. (2002), Analiza rynku, Wydawnictwo Wyższej Szkoły Zarządzania w Gdańsku, Gdańsk.
- Ręklewski, M. Statystyka Opisowa; Pa´nstwowa Uczelnia Zawodowa we Włocławku: Włocławek, Poland, 2020.
- Koronacki J., Mielniczuk J., Statystyka, Wydawnictwo Naukowo-Techniczne, Warszawa 2004.
- Smart Cities Market Size, Share, Competitive Landscape and Trend Analysis Report, by Component (Hardware, Software, and Service) and Functional Area (Smart Infrastructure, Smart Governance and Smart Education, Smart Energy, Smart Mobility, Smart Healthcare, Smart Buildings, and Others): Global Opportunity Analysis and Industry Forecast, 2021-2030, Allied Market Research. Available online: https://www.alliedmarketresearch.com/request-sample/383 (accessed on 31 January 2026).
- Smart Cities Market (2025 - 2030), Grand View Research. Available online: https://www.grandviewresearch.com/industry-analysis/smart-cities-market (accessed on 31 January 2026).
- Smart Cities Market- By Technologies, By Planning & Management, By Solutions, By Services, By Support, By Infrastructure, By Applications, By Functional Area, By Geography - Global Opportunity Analysis & Industry Forecast, 2024 – 2030, Industry ARC. Available online: https://www.industryarc.com/Report/1289/smart-cities-market-analysis.html (accessed on 31 January 2026).
- Smart Cities Market by Focus Area, Smart Transportation, Smart Buildings, Smart Utilities, Smart Citizen Services (Public Safety, Smart Healthcare, Smart Education, Smart Lighting, and E-Governance) - Global Forecast to 2030, Markets and Markets. Available online: https://www.marketsandmarkets.com/Market-Reports/smart-cities-market-542.html?gad_source=1&gad_campaignid=257503036&gclid=Cj0KCQiA-YvMBhDtARIsAHZuUzKJWY5I3yg15nvguid8vt_oQLMan_Z6LEaLeuCDCPhIg6mMJuBQtDMaAoDiEALw_wcB (accessed on 31 January 2026).
- Oomens, I. M. F., & Sadowski, B. M. (2017). The importance of value creation in smart city initiatives: An ecosystem approach. W referacie przedstawionym na 28th European Regional Conference of the International Telecommunications Society (ITS).
- Abdalla, W.; Suresh, S.; Renukappa, S. Managing knowledge in the context of smart cities: An organizational cultural perspective. J. Entrep. Manag. Innov. 2020, 16, 47–85. [CrossRef]
- Kummitha, R.K.R. Smart cities and entrepreneurship: An agenda for future research. Technol. Forecast. Soc. Chang. 2019, 149. [CrossRef]
- Jiang, X.; Han, X.; Xue, L.; Yu, Z.; Wei, S.; Xu, H. How smart city building improved corporate performance: empirical evidence of China’s a-share listed companies. Humanit. Soc. Sci. Commun. 2023, 10, 1–8. [CrossRef]
- Chen, X., Lin, B., Lv, X., & Zhang, Y. (2022). Smart city construction and firm total factor productivity. Journal of the Knowledge Economy, 16(1), 1–25.
- Sun, C. The impact of smart city Internet firms network embeddedness on product innovation: a moderated mediating model. Soft Comput. 2023, 1–18. [CrossRef]
- Appio, F.P.; Lima, M.; Paroutis, S. Understanding Smart Cities: Innovation ecosystems, technological advancements, and societal challenges. Technol. Forecast. Soc. Chang. 2019, 142, 1–14. [CrossRef]
- Carvalho, L. (2023). Smart city strategies and entrepreneurship enablers in Indian cities. Regions, eZine.
- Abbate, T., Cesaroni, F., Cinici, M. C., & Villari, M. (rok). Business models for developing smart cities: A fuzzy set qualitative, Technological Forecasting and Social Change, 142, 183-193.
- European Commission. (2023). Value creation and capture in smart city business models. Publications Office of the European Union.
- World Economic Forum. (2024). Cities, public procurement and innovation: Leveraging demand to scale smart city solutions. World Economic Forum.
- Barba-Sánchez, V.; Arias-Antúnez, E.; Orozco-Barbosa, L. Smart cities as a source for entrepreneurial opportunities: Evidence for Spain. Technol. Forecast. Soc. Chang. 2019, 148. [CrossRef]
- Lv, R.; Gao, H. Effects of smart city construction on employment: mechanism and evidence from China. Empir. Econ. 2023, 65, 2393–2425. [CrossRef]
- Tang, Y., et al. (2024). Smart city pilots and corporate ESG performance: Evidence from manufacturing firms. Frontiers in Environmental Science, 11, 1305539.
Figure 1.
The scheme of the author’s research. Source: own study.
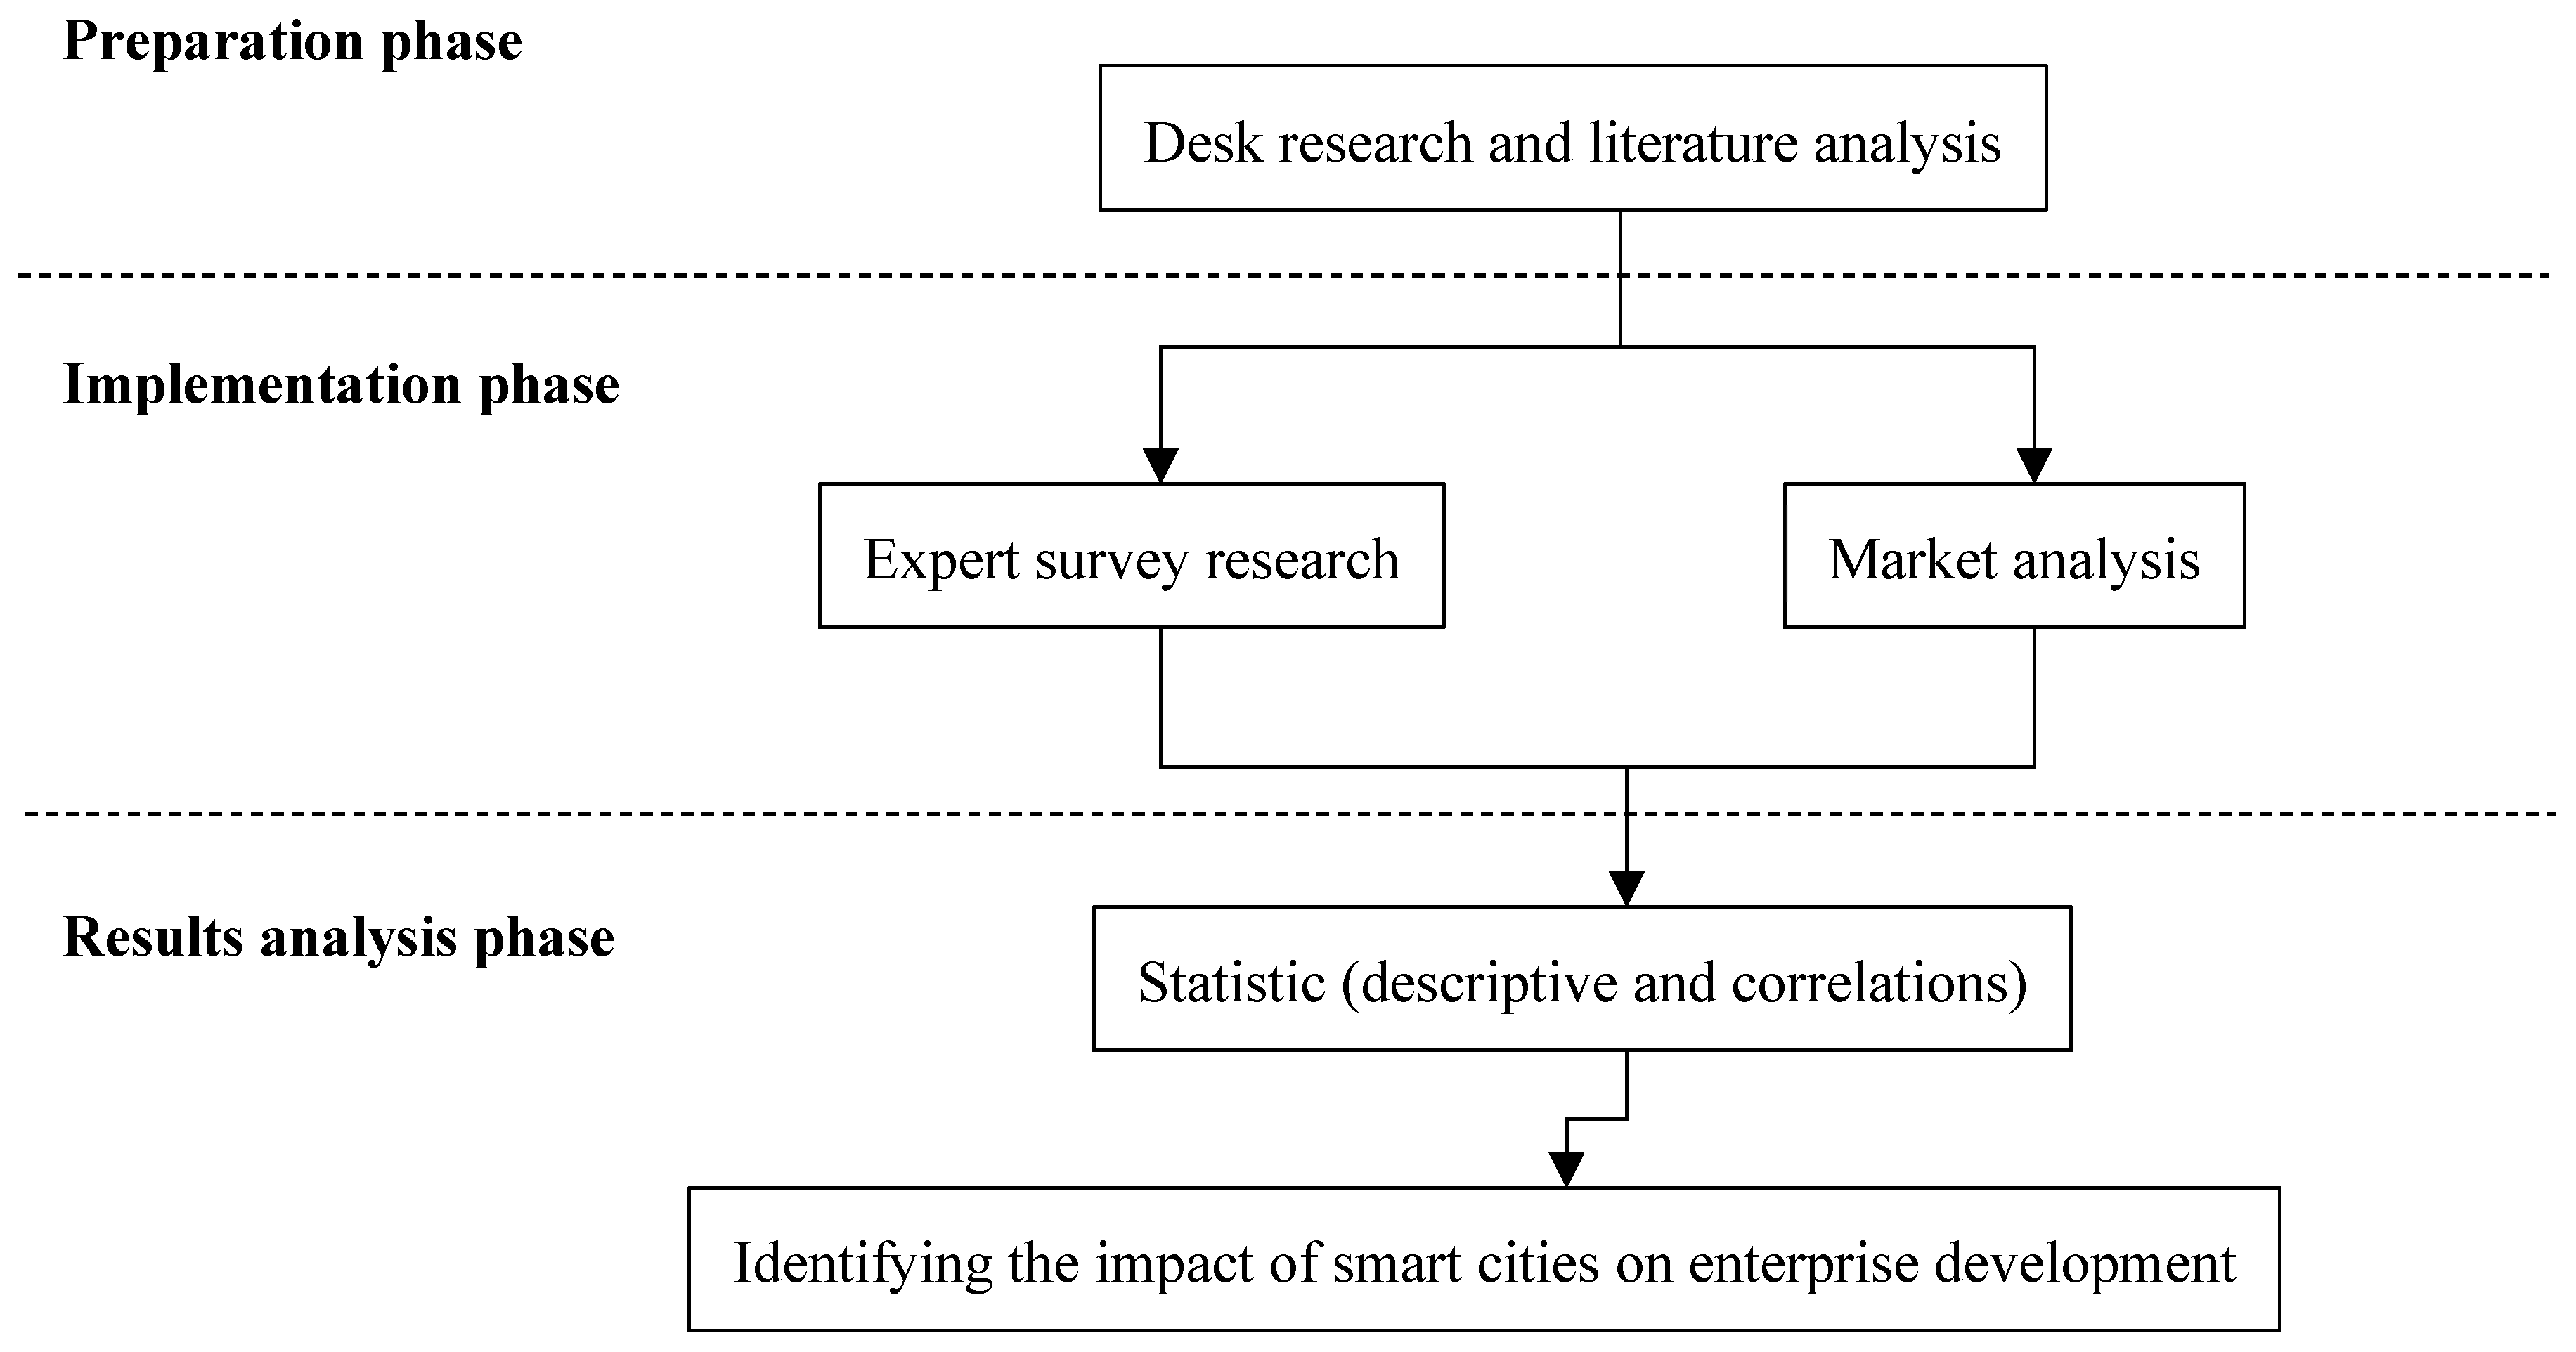
Figure 2.
Analysis of the smart city market value in 2024-2030 [USD billion]. Source: Own study based on [74,75,76,77].
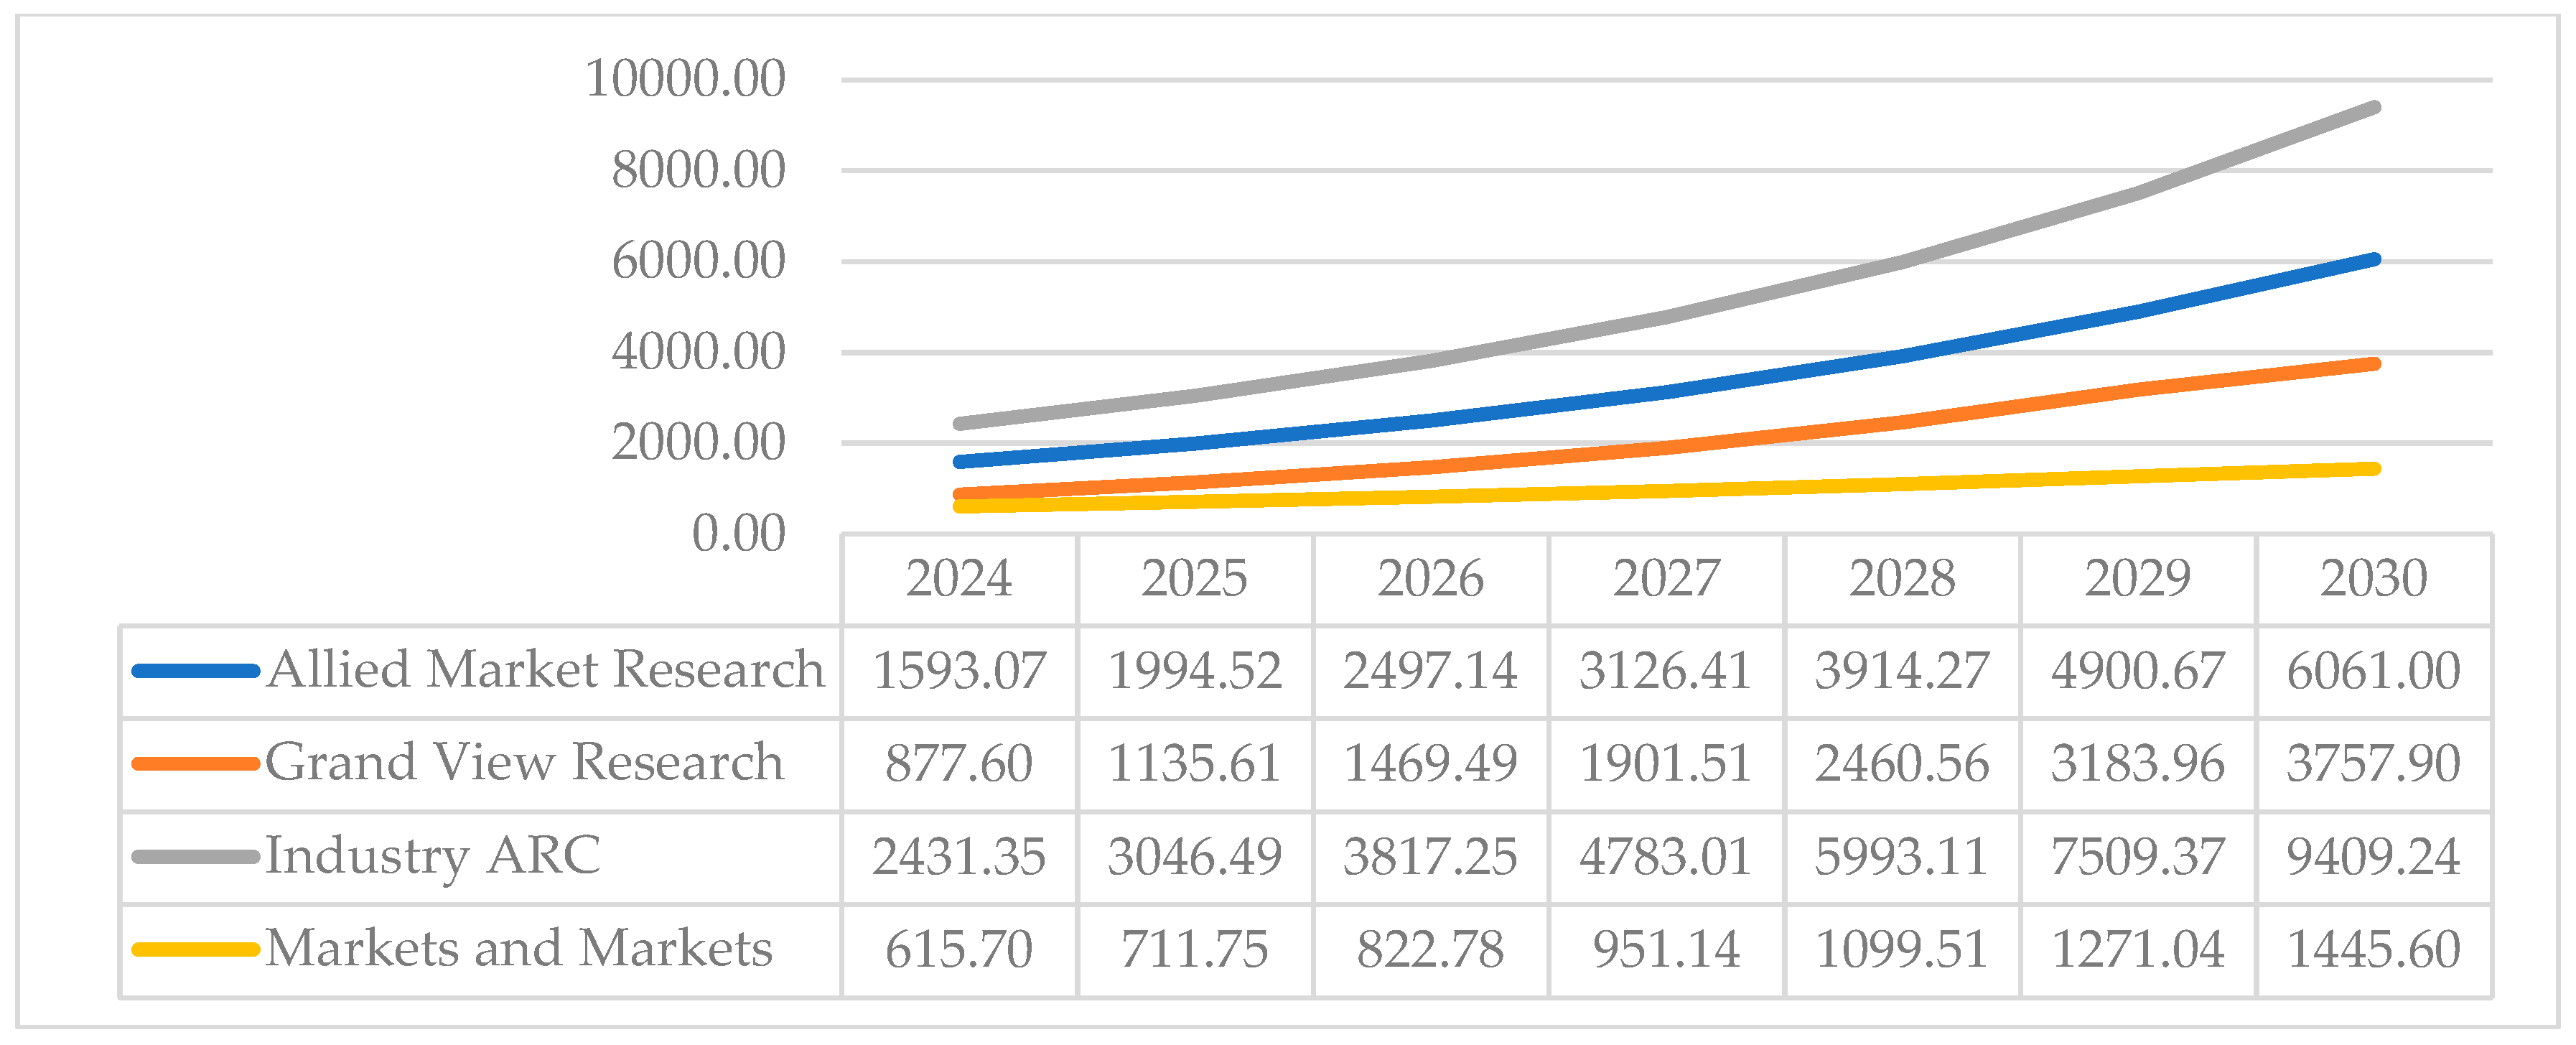

Table 1.
Block 1: Technological innovations (scale 1-5). Source: Own elaboration.
| Variables | Group | M | SD | Me | Min | Max | Q1 | Q3 | Kruskal-Wallis Test |
|---|---|---|---|---|---|---|---|---|---|
| IoT | A | 4,71 | 0,46 | 5,00 | 4,00 | 5,00 | 4,00 | 5,00 | H ( 2, N= 52) =8,71 p =0,013 |
| B1 | 4,53 | 0,51 | 5,00 | 4,00 | 5,00 | 4,00 | 5,00 | ||
| B2 | 4,00 | 0,58 | 4,00 | 3,00 | 5,00 | 4,00 | 4,00 | ||
| AI_ML | A | 4,64 | 0,49 | 5,00 | 4,00 | 5,00 | 4,00 | 5,00 | H ( 2, N= 52) =12,48 p =0,0019 |
| B1 | 4,59 | 0,51 | 5,00 | 4,00 | 5,00 | 4,00 | 5,00 | ||
| B2 | 3,71 | 0,49 | 4,00 | 3,00 | 4,00 | 3,00 | 4,00 | ||
| G5 | A | 3,82 | 0,48 | 4,00 | 3,00 | 5,00 | 4,00 | 4,00 | H ( 2, N= 52) =15,65 p =0,0004 |
| B1 | 4,47 | 0,51 | 4,00 | 4,00 | 5,00 | 4,00 | 5,00 | ||
| B2 | 4,00 | 0,00 | 4,00 | 4,00 | 4,00 | 4,00 | 4,00 | ||
| BIGDATA | A | 4,61 | 0,50 | 5,00 | 4,00 | 5,00 | 4,00 | 5,00 | H ( 2, N= 52) =12,16 p =0,0023 |
| B1 | 4,35 | 0,49 | 4,00 | 4,00 | 5,00 | 4,00 | 5,00 | ||
| B2 | 3,71 | 0,49 | 4,00 | 3,00 | 4,00 | 3,00 | 4,00 | ||
| AUTOM | A | 3,93 | 0,38 | 4,00 | 3,00 | 5,00 | 4,00 | 4,00 | H ( 2, N= 52) =23,76 p<0,00001 |
| B1 | 4,35 | 0,49 | 4,00 | 4,00 | 5,00 | 4,00 | 5,00 | ||
| B2 | 3,14 | 0,38 | 3,00 | 3,00 | 4,00 | 3,00 | 3,00 | ||
| CLOUD | A | 4,68 | 0,48 | 5,00 | 4,00 | 5,00 | 4,00 | 5,00 | H ( 2, N= 52) =13,02 p =0,0015 |
| B1 | 4,76 | 0,44 | 5,00 | 4,00 | 5,00 | 5,00 | 5,00 | ||
| B2 | 4,00 | 0,00 | 4,00 | 4,00 | 4,00 | 4,00 | 4,00 |
Group: A – academics; B1 – business representatives from the smart city solutions industry (technology and systems providers); B2 – business representatives implementing solutions (infrastructure operators, developers, design firms). M – arithmetic mean, SD – standard deviation, Me – median, Q1 – first quartile; Q3 – third quartile.
Table 2.
Block 2: Infrastructure (scale 1-5). Source: Own elaboration.
| Variables | Group | M | SD | Me | Min | Max | Q1 | Q3 | Kruskala-Wallisa Test |
|---|---|---|---|---|---|---|---|---|---|
| ITS | A | 3,89 | 0,31 | 4,00 | 3,00 | 4,00 | 4,00 | 4,00 | H ( 2, N= 52) =33,23 p<0,00001 |
| B1 | 2,94 | 0,83 | 3,00 | 2,00 | 5,00 | 2,00 | 3,00 | ||
| B2 | 5,00 | 0,00 | 5,00 | 5,00 | 5,00 | 5,00 | 5,00 | ||
| INFRA_TECH | A | 2,93 | 0,26 | 3,00 | 2,00 | 3,00 | 3,00 | 3,00 | H ( 2, N= 52) =45,56 p<0,00001 |
| B1 | 4,35 | 0,49 | 4,00 | 4,00 | 5,00 | 4,00 | 5,00 | ||
| B2 | 4,14 | 0,38 | 4,00 | 4,00 | 5,00 | 4,00 | 4,00 | ||
| ENERGY_SMART | A | 4,00 | 0,00 | 4,00 | 4,00 | 4,00 | 4,00 | 4,00 | H ( 2, N= 52) =44,16 p<0,00001 |
| B1 | 2,71 | 0,59 | 3,00 | 2,00 | 4,00 | 2,00 | 3,00 | ||
| B2 | 4,71 | 0,49 | 5,00 | 4,00 | 5,00 | 4,00 | 5,00 | ||
| CIRC_ECON | A | 3,75 | 0,44 | 4,00 | 3,00 | 4,00 | 3,50 | 4,00 | H ( 2, N= 52) =40,55 p<0,00001 |
| B1 | 1,94 | 0,43 | 2,00 | 1,00 | 3,00 | 2,00 | 2,00 | ||
| B2 | 4,29 | 0,49 | 4,00 | 4,00 | 5,00 | 4,00 | 5,00 | ||
| DIGITAL_TWIN | A | 4,46 | 0,51 | 4,00 | 4,00 | 5,00 | 4,00 | 5,00 | H ( 2, N= 52) =20,52 p<0,00001 |
| B1 | 3,53 | 0,62 | 3,00 | 3,00 | 5,00 | 3,00 | 4,00 | ||
| B2 | 4,00 | 0,00 | 4,00 | 4,00 | 4,00 | 4,00 | 4,00 |
Group: A – academics; B1 – business representatives from the smart city solutions industry (technology and systems providers); B2 – business representatives implementing solutions (infrastructure operators, developers, design firms). M – arithmetic mean, SD – standard deviation, Me – median, Q1 – first quartile; Q3 – third quartile.
Table 3.
Block 3: Smart governance (scale 1-5). Source: Own elaboration.
| Variables | Group | M | SD | Me | Min | Max | Q1 | Q3 | Kruskala-Wallisa Test |
|---|---|---|---|---|---|---|---|---|---|
| OPEN_DATA | A | 4,71 | 0,46 | 5,00 | 4,00 | 5,00 | 4,00 | 5,00 | H ( 2, N= 52) =40,34 p<0,00001 |
| B1 | 2,18 | 0,39 | 2,00 | 2,00 | 3,00 | 2,00 | 2,00 | ||
| B2 | 4,14 | 0,38 | 4,00 | 4,00 | 5,00 | 4,00 | 4,00 | ||
| EGOV | A | 4,68 | 0,48 | 5,00 | 4,00 | 5,00 | 4,00 | 5,00 | H ( 2, N= 52) =41,85 p<0,00001 |
| B1 | 1,94 | 0,24 | 2,00 | 1,00 | 2,00 | 2,00 | 2,00 | ||
| B2 | 3,86 | 0,38 | 4,00 | 3,00 | 4,00 | 4,00 | 4,00 | ||
| E_PARTICIP | A | 4,32 | 0,48 | 4,00 | 4,00 | 5,00 | 4,00 | 5,00 | H ( 2, N= 52) =42,40 p<0,00001 |
| B1 | 1,82 | 0,39 | 2,00 | 1,00 | 2,00 | 2,00 | 2,00 | ||
| B2 | 3,29 | 0,49 | 3,00 | 3,00 | 4,00 | 3,00 | 4,00 |
Group: A – academics; B1 – business representatives from the smart city solutions industry (technology and systems providers); B2 – business representatives implementing solutions (infrastructure operators, developers, design firms). M – arithmetic mean, SD – standard deviation, Me – median, Q1 – first quartile; Q3 – third quartile.
Table 4.
Block 4: Innovation ecosystem and support (scale 1-5). Source: Own elaboration.
| Variables | Group | M | SD | Me | Min | Max | Q1 | Q3 | Kruskala-Wallisa Test |
|---|---|---|---|---|---|---|---|---|---|
| STARTUP_PROG | A | 4,68 | 0,48 | 5,00 | 4,00 | 5,00 | 4,00 | 5,00 | H ( 2, N= 52) =39,58 p<0,00001 |
| B1 | 3,00 | 0,00 | 3,00 | 3,00 | 3,00 | 3,00 | 3,00 | ||
| B2 | 4,29 | 0,49 | 4,00 | 4,00 | 5,00 | 4,00 | 5,00 | ||
| TECH_CLUSTER | A | 4,68 | 0,48 | 5,00 | 4,00 | 5,00 | 4,00 | 5,00 | H ( 2, N= 52) =36,67 p<0,00001 |
| B1 | 3,06 | 0,24 | 3,00 | 3,00 | 4,00 | 3,00 | 3,00 | ||
| B2 | 4,14 | 0,69 | 4,00 | 3,00 | 5,00 | 4,00 | 5,00 | ||
| RND_INV | A | 4,71 | 0,46 | 5,00 | 4,00 | 5,00 | 4,00 | 5,00 | H ( 2, N= 52) =41,27 p<0,00001 |
| B1 | 2,65 | 0,49 | 3,00 | 2,00 | 3,00 | 2,00 | 3,00 | ||
| B2 | 4,00 | 0,00 | 4,00 | 4,00 | 4,00 | 4,00 | 4,00 | ||
| BUS_NETWORK | A | 3,68 | 0,48 | 4,00 | 3,00 | 4,00 | 3,00 | 4,00 | H ( 2, N= 52) =4,90 p =0,086 |
| B1 | 3,53 | 0,51 | 4,00 | 3,00 | 4,00 | 3,00 | 4,00 | ||
| B2 | 4,00 | 0,00 | 4,00 | 4,00 | 4,00 | 4,00 | 4,00 | ||
| SC_PROJECTS | A | 3,71 | 0,46 | 4,00 | 3,00 | 4,00 | 3,00 | 4,00 | H ( 2, N= 52) =14,46 p =0,0007 |
| B1 | 4,24 | 0,44 | 4,00 | 4,00 | 5,00 | 4,00 | 4,00 | ||
| B2 | 3,43 | 0,53 | 3,00 | 3,00 | 4,00 | 3,00 | 4,00 | ||
| TAX_SUBSIDY | A | 3,57 | 0,63 | 4,00 | 2,00 | 4,00 | 3,00 | 4,00 | H ( 2, N= 52) =35,78 p<0,00001 |
| B1 | 1,35 | 0,49 | 1,00 | 1,00 | 2,00 | 1,00 | 2,00 | ||
| B2 | 3,43 | 0,53 | 3,00 | 3,00 | 4,00 | 3,00 | 4,00 | ||
| PPP | A | 3,71 | 0,46 | 4,00 | 3,00 | 4,00 | 3,00 | 4,00 | H ( 2, N= 52) =41,05 p<0,00001 |
| B1 | 1,88 | 0,33 | 2,00 | 1,00 | 2,00 | 2,00 | 2,00 | ||
| B2 | 4,14 | 0,38 | 4,00 | 4,00 | 5,00 | 4,00 | 4,00 | ||
| SANDBOX | A | 4,00 | 0,00 | 4,00 | 4,00 | 4,00 | 4,00 | 4,00 | H ( 2, N= 52) =43,61 p<0,00001 |
| B1 | 3,12 | 0,33 | 3,00 | 3,00 | 4,00 | 3,00 | 3,00 | ||
| B2 | 2,71 | 0,49 | 3,00 | 2,00 | 3,00 | 2,00 | 3,00 | ||
| VC_FUNDS | A | 3,68 | 0,48 | 4,00 | 3,00 | 4,00 | 3,00 | 4,00 | H ( 2, N= 52) =25,034 p<0,00001 |
| B1 | 4,12 | 0,33 | 4,00 | 4,00 | 5,00 | 4,00 | 4,00 | ||
| B2 | 2,71 | 0,49 | 3,00 | 2,00 | 3,00 | 2,00 | 3,00 | ||
| CROWDFUND | A | 2,68 | 0,48 | 3,00 | 2,00 | 3,00 | 2,00 | 3,00 | H ( 2, N= 52) =34,27 p<0,00001 |
| B1 | 1,18 | 0,39 | 1,00 | 1,00 | 2,00 | 1,00 | 1,00 | ||
| B2 | 2,57 | 0,53 | 3,00 | 2,00 | 3,00 | 2,00 | 3,00 |
Group: A – academics; B1 – business representatives from the smart city solutions industry (technology and systems providers); B2 – business representatives implementing solutions (infrastructure operators, developers, design firms). M – arithmetic mean, SD – standard deviation, Me – median, Q1 – first quartile; Q3 – third quartile.
Table 5.
Block 5: Human capital (scale 1-5). Source: Own elaboration.
| Variables | Group | M | SD | Me | Min | Max | Q1 | Q3 | Kruskala-Wallisa Test |
|---|---|---|---|---|---|---|---|---|---|
| TALENT_PROG | A | 4,68 | 0,48 | 5,00 | 4,00 | 5,00 | 4,00 | 5,00 | H ( 2, N= 52) =40,62 p<0,00001 |
| B1 | 2,47 | 0,51 | 2,00 | 2,00 | 3,00 | 2,00 | 3,00 | ||
| B2 | 4,00 | 0,00 | 4,00 | 4,00 | 4,00 | 4,00 | 4,00 | ||
| STEM_DIGLIT | A | 4,75 | 0,44 | 5,00 | 4,00 | 5,00 | 4,50 | 5,00 | H ( 2, N= 52) =41,80 p<0,00001 |
| B1 | 2,47 | 0,51 | 2,00 | 2,00 | 3,00 | 2,00 | 3,00 | ||
| B2 | 4,00 | 0,00 | 4,00 | 4,00 | 4,00 | 4,00 | 4,00 | ||
| RESKILL | A | 4,61 | 0,50 | 5,00 | 4,00 | 5,00 | 4,00 | 5,00 | H ( 2, N= 52) =41,85 p<0,00001 |
| B1 | 1,94 | 0,24 | 2,00 | 1,00 | 2,00 | 2,00 | 2,00 | ||
| B2 | 3,57 | 0,53 | 4,00 | 3,00 | 4,00 | 3,00 | 4,00 | ||
| UNIV_COOP | A | 4,68 | 0,48 | 5,00 | 4,00 | 5,00 | 4,00 | 5,00 | H ( 2, N= 52) =40,23 p<0,00001 |
| B1 | 2,06 | 0,24 | 2,00 | 2,00 | 3,00 | 2,00 | 2,00 | ||
| B2 | 4,14 | 0,38 | 4,00 | 4,00 | 5,00 | 4,00 | 4,00 |
Group: A – academics; B1 – business representatives from the smart city solutions industry (technology and systems providers); B2 – business representatives implementing solutions (infrastructure operators, developers, design firms). M – arithmetic mean, SD – standard deviation, Me – median, Q1 – first quartile; Q3 – third quartile.
Disclaimer/Publisher’s Note: The statements, opinions and data contained in all publications are solely those of the individual author(s) and contributor(s) and not of MDPI and/or the editor(s). MDPI and/or the editor(s) disclaim responsibility for any injury to people or property resulting from any ideas, methods, instructions or products referred to in the content. |
© 2026 by the authors. Licensee MDPI, Basel, Switzerland. This article is an open access article distributed under the terms and conditions of the Creative Commons Attribution (CC BY) license.
Copyright: This open access article is published under a Creative Commons CC BY 4.0 license, which permit the free download, distribution, and reuse, provided that the author and preprint are cited in any reuse.


