Submitted:
06 February 2026
Posted:
09 February 2026
You are already at the latest version
Abstract
The catalytically supported upgrading of green ethanol and green methanol mixtures can produce higher alcohols, such as iso-butanol, in a sustainable manner. Iso-butanol can be used as a feedstock to defossilize the chemical and transportation sectors. MgO-Al₂O₃ hydrotalcite-based catalysts are a promising option for this purpose. In this study, samples were synthesized using co-precipitation and urea methods with different Mg/Al molar ratios, with Ni acting as the active catalytic component. ICP-OES analysis revealed that Ni impregnation onto the hydrotalcite structure had been successful. However, in the case of the urea method, the pH value for the precipitation of Mg(OH)₂ was too low, resulting in insufficient Mg being incorporated into the hydrotalcite structure. XRD analysis revealed the presence of NiO, MgO and the spinels Al₂NiO₄ and Al₂MgO₄ in both synthesis variants, as well as elemental Ni in one sample from the urea synthesis. CO₂-TPD and NH₃-TPD experiments showed the dominance of strong basic and strong acidic catalyst centers in both synthesis pathways. The catalysts synthesized using the urea method exhibited the greatest activity, producing iso-butanol concentrations of up to 170 mmol l-1 at 185 °C, with a maximum space-time yield of 8.2 mmol g-1 h-1.
Keywords:
mixed alcohols
; catalytic upgrading
; iso-butanol
; Ni/MgO-Al2O3 hydrotalcite-derived catalysts
; Guerbet reaction
1. Introduction
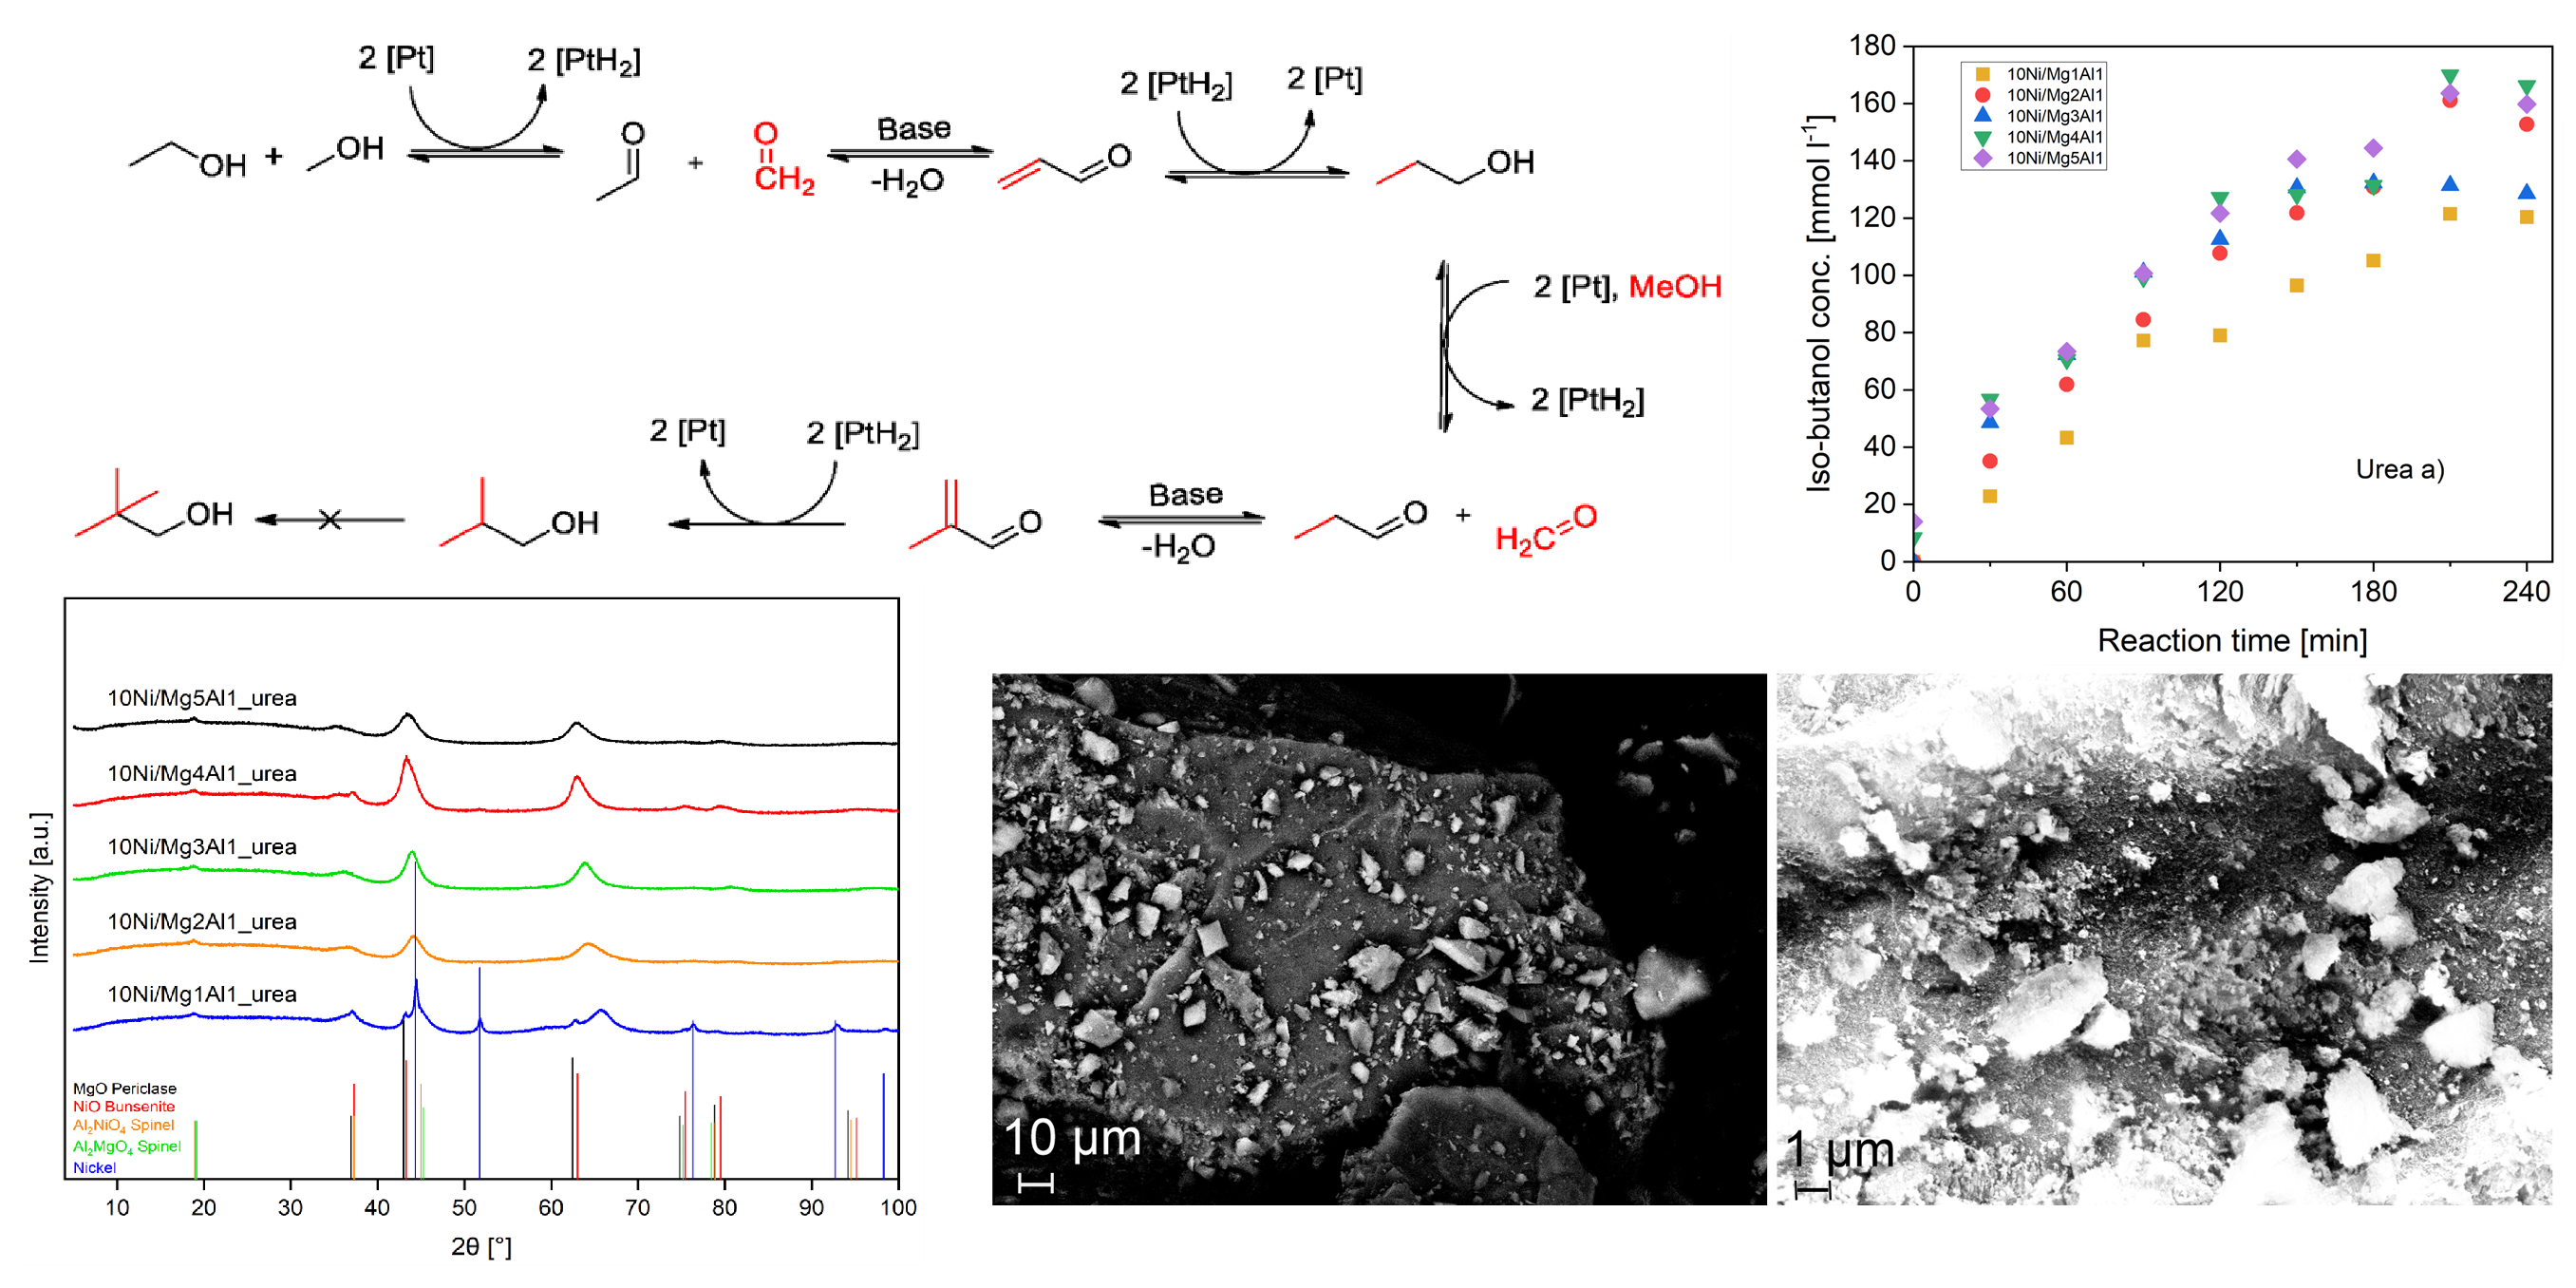
Using the diagram shown in Figure 1 for the so-called Guerbet reaction, iso-butanol can be produced from ethanol and methanol in a reaction mechanism that involves two successive methylation steps. In the first step, ethanol and methanol are first dehydrogenated to acetaldehyde and formaldehyde, which then react on a basic catalyst to acrolein in an aldol condensation step. Then, acrolein is hydrogenated to 1-propanol. In the second methylation step, 1-propanol reacts in very similar sequences to form iso-butanol. If ethanol and methanol were obtained from green H2 and CO2 separated from industrial waste gases or ambient air, the iso-butanol molecule synthesized can also be described as sustainable. Sustainable iso-butanol can contribute to the defossilisation of some CO2-intensive areas: as a drop-in component to conventional fuels (gasoline, aviation and marine fuels), as a chemical precursor (butenes, butadiene, isobutyl acetate, pharmaceuticals and fragrances) and as an industrial solvent (paints, coatings, inks, adhesives) [1,2,3,4,5,6].
Among the catalysts suitable for this reaction scheme, hydrotalcite-derived mixed oxides play a special role.
Hydrotalcites are minerals that belong to the class of layered materials. Their layers alternate between cationic sheet layers and anionic interlayers. Compared to regular clays hydrotalcites have positively charged layers. The anionic interlayers compensate the charge. The wide range of ions, which are applicable to each layers, enables a variety of possible compositions [8]. The applications of hydrotalcites range widely, from catalysts over gas adsorbents to drug carriers [9]. In this work, the focus will be on their properties as a catalyst support. For this purpose, they need to be converted into a mixed oxide by means of calcination. The water stored in the interlayers leaves between 150 °C and 200 °C. In the range of 300 °C to 600 °C, the interlayer anions decompose and leave as gases. At the same time, the octahedral brucite-like structure collapses, and the mixed oxides form. These structural changes result in new properties. The mixed oxides derived from hydrotalcites possess a remarkable stability towards high temperatures. Furthermore, the specific surface area for the deposition of additional active catalytic sites increases significantly due to the removal of interlayer anions [10].
Li et al. [11] examined a series of Cu/NiAlOx catalysts based on a NiAl hydrotalcite precursor for the synthesis of iso-butanol from ethanol. At 250 °C, they observed a 35% conversion of ethanol with a selectivity for iso-butanol of 45%. Zhu et al. [12], on the other hand, investigated a Cu supported on MgAl layered hydrotalcite catalyst for the reaction of ethanol to butanol, which was not further calcined to the mixed oxides. The authors emphasise the importance of the interaction between Cu and LDH for catalytic activity. Bravo-Suárez et al. [13] synthesised Cu/MgAlOx mixed metal oxides for the coupling of ethanol and methanol. The highest activity for the C-C coupling reaction was found with a loading of 21 at% Cu. Using in-situ FTIR, the authors identified formate and acetate as important intermediates. Wu et al. [14] investigated Ni/MgAlOx catalysts for the synthesis of biofuels from acetone/butanol/ethanol mixtures. Higher Mg/Al molar ratios led to strong basic sites on the catalyst surface and promoted the formation of long-chain hydrocarbons. Hydrotalcite-based MgAlOx and CuMgAlOx catalysts for the Guerbet reaction of methanol with methanol were investigated by Cheng et al. [15,16]. They found moderate basic sites and Cu0 species to be particularly important, as together they promoted the condensation reaction between acetaldehyde and formaldehyde. Carlini et al. investigated the reaction between methanol and n-propanol at 200 °C on a catalyst consisting of two components: Cu-chromite and MgAl mixed oxides with different Mg/Al molar ratios. The mixed oxides were based on corresponding hydrotalcite precursors. The catalysts proved to be tolerant to the H₂O produced and showed no deactivation at selectivities close to 100% for iso-butanol. Lower Mg/Al molar ratios improved the catalytic activity, which the authors explain by a gain in medium-strength and strong basic centres on the catalyst surface [17]. In a subsequent paper, Carlini et al. doped the Mg-Al mixed oxides with Cu, which allowed lower temperatures to be set with comparable catalytic activity [18]. Larina et al. [19] went one step further with their MgAl mixed oxides and investigated the Guerbet condensation between ethanol and 1-butanol to 2-ethyl-1-hexanol. They identified acid-base Lewis pairs at the interface between MgO and Al2O3 as crucial. At a Mg/Al molar ratio of 2, a maximum yield of 10.8% 2-ethyl-1-hexanol was found.
This brief literature review has clearly illustrated the importance of basic catalyst centers for the success of the aldol condensation between the aldehydes shown in Figure 1. Many other research groups have also emphasised the importance of Ni as an active component in dehydrogenation reactions, which are also of central importance in the conversion of methanol, ethanol and propanol to the corresponding aldehydes shown in Figure 1 [14,20,21,22,23,24,25,26,27]. The catalyst system investigated in this study considers that both basicity and dehydrogenation activity are required to complete the reaction scheme shown in Figure 1. It therefore combines hydrotalcite-derived MgAl mixed oxides as a basic catalyst support having a high specific surface area with Ni as the active dehydrogenation component.
The overall approach of this paper is:
- -
- to apply two different routes to the synthesis of Ni/Mg-Al mixed oxides catalysts. Many ways to synthesize hydrotalcites were already proposed in the past [28,29]. The methods chosen for this work are co-precipitation and urea hydrolysis precipitation due to their simplicity. The approach utilizing urea hydrolysis is intended to result in homogeneous distribution of the precipitation agent. This homogeneity should result in a narrower particle size distribution and enhanced crystallinity.
- -
- to investigate the influences of these syntheses’ routes on the structural properties and the catalytic activity of the synthesized catalysts for the above-presented Guerbet reaction, yielding iso-butanol.
Regardless of the synthesis route, the mass fraction of Ni was always 10%, while the molar ratio of Mg/Al varied between 1:1 and 5:1 for both synthesis routes. For the sake of simplicity, a catalyst with 10 wt% Ni and, for example, a molar ratio of Mg/Al of 3:1 is abbreviated as 10Ni/Mg3Al1_coprec in the following text, while a sample prepared using the urea method with 10 wt% Ni and a molar ratio of Mg/Al of 3:1 is referred to as 10Ni/Mg3Al1_urea.
2. Results and Discussion
2.1. Ni-Mg/Al Mixed Oxides Synthesized Via The Co-Precipitation Method
In this subchapter, the experimental results from catalyst characterization (temperature-programmed reduction, temperature-programmed desorption, X-ray diffraction, inductively coupled plasma with optical emission spectroscopy, scanning electron microscopy, and N2 sorption) with the five catalysts synthesized through the co-precipitation method are described and explained. In addition, the results of the catalytic tests are presented.
2.1.1. Temperature-Programmed Reduction (TPR)
To determine the temperature that must be set in the tube furnace to completely reduce the NiO phase formed after calcination (see sections 3.1.1 – 3.1.3), the profiles of the temperature-programmed reduction in the temperature range between 30 °C and 550 °C shown in Figure 2 were recorded for the catalysts 10Ni/Mg1Al1_coprec (left) and 10Ni/Mg1Al1_urea (right). The two figures show a pronounced peak in the temperature range between 200 °C and 300 °C for the reduction of NiO to elemental Ni for the two calcined but unreduced catalysts 10Ni/Mg1Al1_coprec (left) and 10Ni/Mg1Al1_urea (right). Based on these results, a reduction temperature of 550 °C was set for both synthesis routes.
2.1.2. Temperature-Programmed Desorption (TPD) of CO2 and NH3
Temperature-programmed adsorption and desorption of specific gases, such as CO₂ and NH₃, enables the nature of the catalytic sites (basic or acidic, with different strengths) on the surface of a catalyst to be examined. The temperature range at which desorption occurs determines the strength of the respective catalytic sites. Just as CO₂ is used to identify basic sites on a surface, NH₃ can reveal information about its acidic centers.
Figure 3 shows the TPD profiles of the five catalysts prepared via the co-precipitation method. The CO₂ desorption profiles are shown on the left and the NH₃ desorption profiles on the right. Choudhary and Rane investigated the relationship between desorption temperature and strength of the catalytic site and concluded that the desorption occurs in multiple steps [30]. The first desorption step takes place between 50 and 150 °C, indicating weak basic sites. Subsequently, the temperature range from 150 °C to 300 °C corresponds to basic sites with medium strength. The strong and very strong basic sites are observed in the temperature ranges from 300 °C to 500 °C and 500 °C to 900 °C, respectively [30].
In Figure 3, it becomes obvious that the CO2-TPD profiles of the five catalysts from the co-precipitation method were similar. They showed a broad peak between approximately 200 °C and 650 °C with a shoulder in the temperature range between approximately 450 °C and 620 °C. This shoulder was particularly pronounced in the case of the catalyst with a Mg/Al molar ratio of 2:1. The profiles show that strong and very strong basic centers dominated on these catalysts. This property may have a positive impact on the activity for the synthesis of iso-butanol, as this reaction proceeds via an aldol condensation pathway as explained in Figure 1, which involves the abstraction of an H-atom from the β-carbon atom in acetaldehyde, for which strong basicity is required. In the first two columns, Table 1 shows the percentages of strong and very strong basic sites on the five catalysts from the co-precipitation method calculated from these profiles. The strong basic centers predominated over the very strong basic sites for each of these samples. No clear correlation with the Mg/Al molar ratios could be established.
The strengths of the acidic sites are divided into weak, medium and strong ones [31]. Weak sites are observed up to a temperature of 250 °C, while medium sites appear from 250 °C to 400 °C. Desorption temperatures higher than those are associated with strong acidic sites. On the right side of Figure 3 - as was observed in the case of CO2-TPD - also the NH3-TPD profiles of the five catalysts from the co-precipitation method were similar. They all showed a peak in the temperature range between approximately 50 °C and 200 °C as well as broad signals between 300 °C and 650 °C. In addition, Table 1 shows the percentages of weak, medium and strong acidic sites on these five catalysts in columns three to five. The strongly acidic catalyst centers dominated in all cases. The values were between approximately 53% and 70%, with no clear dependence on the molar Mg/Al molar ratio being found. The percentages of weak acidic centers were between 27% and 33%. Here, too, no clear dependence on the molar Mg/Al molar ratio could be determined.
2.1.3. X-Ray Diffraction Analysis (XRD)
To gain insight into the morphologies of the five catalysts from the co-precipitation route in terms of composition, crystallinity, and crystal size, their XRD patterns were recorded with Cu Kα-radiation (λ = 1.54060 Å) and are presented in Figure 4. It becomes evident from this figure that the most dominant peaks for all spectra could be observed at approximately 43.0° and 62.5°, respectively. These peaks were attributed to MgO in a periclase phase and NiO in a bunsenite phase, respectively. There were further smaller reflections at approximately 37.0°, 74.9°, 79.9°, and 94.7°, whose intensities were at least partly due to MgO and NiO. In addition, a weak signal at approximately 18.8° was observed for all spectra, which could be solely attributed to the Al2NiO4 and Al2MgO4 spinel phases. When the XRD patterns of the five catalysts are compared with each other, it is noticeable that the intensities of the dominant peaks at 43.0° and 62.5°, respectively, increased significantly with increasing molar ratio of Mg/Al. Since the amount of Ni on the support surface was constantly set to 10 wt% the described increase in the intensities could be attributed to an increase in the crystallinity and/or the crystallite size of MgO. The intensities of the reflection solely belonging to the spinel phases Al2NiO4 and Al2MgO4 at 18.8° did not significantly change with increasing molar ratio of Mg/Al. That would mean that the crystallinity and/or the crystallite size of the two spinel phases did not change, when the Mg/Al molar ratio increased. Figure 5 illustrates the crystallite size for the dominant MgO phase and the spinel phase calculated via the Scherrer equation.
In both cases, the crystallites grew with increasing molar ratio of Mg/Al. In the case of the spinel phases, a strong increase of approximately from 80 Å to 145 Å was observed, while the crystallite size of the MgO phase increased much less strongly from 39 Å to 67 Å. The findings from Figure 5 contradict the conclusion from Figure 4 that the spinel phases remained unchanged as the molar fraction of MgO increased. Their crystallite size even increased by a greater amount than those of MgO. Clearly, the intensities of the reflections for the spinel phases in Figure 4 were too low to allow a clearly visible increase to be detected. Therefore, the XRD result is that a higher Mg/Al molar ratio led to higher crystallinity and larger crystallites in the MgO and spinel phases. All experimental data for Figure 5 are summarized in Table S1 in the Supplementary Information.
2.1.4. Inductively Coupled Plasma with Optical Emission Spectroscopy (ICP-OES)
Table 2 compares the Ni mass fractions and the Mg/Al molar ratios of the five catalysts from the co-precipitation method, as determined via ICP–OES measurements and calculated based on experimental quantities, respectively. As presented in the table, the actual quantities of Ni after impregnation only differed slightly from the calculated values. The greatest deviation occurred at the 2:1 ratio, while the measured value at the 5:1 ratio was closest to the calculated value. This analysis demonstrates that impregnation via rotary evaporation was effective. However, greater deviations were observed with respect to the Mg/Al molar ratio. The calculated values closely matched the desired ratios from 1:1 to 5:1, whereas the ICP-OES values differed significantly from the calculated/desired numbers for ratios greater than 3:1. Therefore, it can be concluded that, as the molar Mg/Al molar ratio increased, less Mg precipitated alongside Al to form the hydrotalcite structure.
2.1.5. Scanning Electron Microscopy (SEM)
Figure 6 shows SEM images of the catalyst Mg1Al1_coprec at magnifications of 1000 (left) and 10,000 (right). A large structure measuring a few hundred micrometers with smaller particles distributed across its surface was observed on the left. The particles seemed to be distributed evenly across the surface of the larger structure and ranged in size from around 1 µm to 20 µm. They varied in shape, ranging from cubes to shards and asymmetric structures. The image on the right provides a closer look at the surface of the larger structure, as well as a detailed close-up of the smaller particles. This image reveals that the surface was more uneven than suggested by the first image. The smaller particles consisted of layered clusters ranging in size from nanometers to micrometers.
The large structure was most likely a hydrotalcite agglomerate formed during the precipitation process. As not all Mg ions were incorporated into the hydrotalcite structure during synthesis, the remaining ions precipitated as Mg(OH)2, which was then converted into MgO during calcination. It can be assumed that this MgO represented the small particles on top of the larger hydrotalcite-derived structure. A detailed size analysis reveals that almost all particles on the surface had an area smaller than 20 µm2, while only a few particles were larger. Most particles showed an area of up to 1 µm2. The hydrotalcite structure and the MgO particles both had an uneven scaffolding that exhibited a porous surface.
2.1.6. N2 Sorption
Table 3 displays the results of the N2 sorption measurements with the five catalysts synthesized via the co-precipitation method. The catalyst with a Mg/Al molar ratio of 1:1 had the highest values for the surface area, the pore volume and the average pore size. Beyond this, there were no clear trends. Only in the case of the average pore size there was a tendency for its values to decrease with increasing Mg/Al molar ratio.
2.1.7. Catalytic Activity
Figure 7 shows the results of the catalytic tests with respect to the synthesis of iso-butanol at a reaction temperature of 185 °C with the five catalysts prepared via the co-precipitation method. The figure on the top left regarding the concentration of iso-butanol as a function of reaction time illustrates a clear dependence of the concentration of iso-butanol on the Mg/Al molar ratio of the respective catalysts. The higher the Mg/Al molar ratio, the higher the iso-butanol concentrations. With samples 10Ni/Mg4Al1 and 10Ni/Mg5Al1, values for the concentration of iso-butanol between 135 mmol l-1 and 140 mmol l-1 were achieved in the reaction time range between 180 min and 240 min. From the finding that the trends shown flattened slightly with increasing reaction time, it can be concluded that the catalysts began to deactivate in this time range. A similar picture can be seen in this figure on the top right when discussing the conversion of ethanol as a function of reaction time at different Mg/Al molar ratios. Again, samples 10Ni/Mg4Al1 and 10Ni/Mg5Al1 were the most active and reached conversions of almost 12% after a reaction time of 240 min.
- a)
- Concentration of iso-butanol
- b)
- Ethanol conversion
- c)
- Selectivities towards iso-butanol and other main by-products (left), space-time yield at 240 min reaction time
In the lower section of Figure 7, the selectivities of the individual catalysts towards the products iso-butanol, 2-methylbutane-1-ol and 2,3-dimethylpentane-1-ol are plotted on the left Y-axis. The reaction time was 240 min. The figure shows that the selectivity to iso-butanol was between 88% and 93% for all catalysts. A dependence on the Mg/Al molar ratio could not be found. Selectivity towards 2,3-dimethylpentane-1-ol was in the range of 6–7%, while that towards 2-methylbutane-1-ol was between 0%–4%. The space-time yield for the formation of iso-butanol of the catalysts, which is calculated according to equation (1) from the molar quantity of iso-butanol formed, the catalyst mass and the reaction time, is shown in this figure on the right Y-axis. It was highest for the two samples 10Ni/Mg4Al1 and 10Ni/Mg5Al1 with values of 6.5 mmol g-1 h-1 and 6.7 mmol h-1 g-1, respectively. All experimental data for Figure 7 are summarized in Tables S2 and S3 in the Supplementary Information.
2.2. Ni-Mg/Al Mixed Oxides Synthesized Via the Urea Method
In this subchapter, the experimental results from catalyst characterization with the five catalysts synthesized via the urea method are described and explained. In addition, the results of the catalytic tests are presented.
2.2.1. Temperature-Programmed Desorption (TPD) of CO2 and NH3
Figure 8 shows the TPD profiles of the five catalysts prepared via the urea method. The CO₂ desorption profiles are shown on the left and the NH₃ desorption profiles on the right. All five samples in the left-hand figure showed a broad desorption peak for CO2 in the temperature range between 300 °C and 500 °C, which suggests that strong basic centers dominated on the surfaces of these samples. Apart from sample 10Ni/Mg4Al1_urea, the slopes of the right flanks of the peaks were very low, which indicates a second peak. However, this peak was only clearly visible and quantitatively evaluable in the case of catalyst 10Ni/Mg1Al1_urea and can be attributed to very strong basic centers. This result is like that found with the samples produced by co-precipitation. There, too, the strong basic sites dominated. Strong or very strong basicity is a prerequisite for high catalytic activity in the Guerbet reaction. Table 4 reflects these peak shapes and, except for sample 10Ni/Mg1Al1_urea, shows values of 100% for strong basic centers. For the 10Ni/Mg1Al1_urea catalyst, a proportion of 23.4% was calculated for very strong basic sites. The NH₃ desorption profiles of the five urea method samples on the right in Figure 8 were very similar to each other, except for the Mg/Al molar ratio of 4:1. Peaks were evident in the temperature range between approximately 50 °C and 200 °C, as well as broad signals between 300 °C and 650 °C. Table 4 shows the percentages of weak, medium, and strong acidic sites on these four catalysts in columns three to five, which were calculated based on the measured profiles in Figure 8. With increasing Mg/Al molar ratio, a small increase in the fraction of weak and medium acidic sites was observed, while the fraction of strong acidic sites decreased. An increase in the Mg/Al molar ratio reduced the quantity of strong acidic sites in favour of an increase in weak and medium centers. By contrast, the profile of the 10Ni/Mg4Al1_urea catalyst differed significantly. Only one sharp signal, with a peak at 410 °C, was observed. Rather than possessing all three types of acid strength, sample 10Ni/Mg4Al1_urea almost exclusively exhibited medium acidic sites (see Table 4). This drastic difference in the outer appearance of the profile of this catalyst leads to the conclusion that fundamentally different structures with different active centers were formed during the synthesis of this catalyst.
2.2.2. XRD Analysis
To analyze the five urea-route catalysts concerning composition, crystallinity, and crystal size, their XRD patterns were recorded using Cu Kα-radiation (λ = 1.54060 Å) and are presented in Figure 9. All five Mg/Al molar ratios exhibited characteristic peaks at around 43.0° and 62.4°, indicative of the reflections of MgO in the periclase phase and NiO in the bunsenite phase. Additionally, the small peaks at around 18.8° corresponded to the spinel phases Al₂NiO₄ and Al₂MgO₄. The group of peaks at 37.0° belonged to reflections of different phases, such as Al₂NiO₄, MgO and NiO. Notably, the pure Ni phase was visible in the sharp peaks at 44.4° and 51.6°, as well as in the group of peaks at approximately 76.2° and 92.8° for the 1:1 Mg/Al molar ratio, whereas no other ratio showed peaks belonging to pure Ni. The Ni component of this catalyst did not fully re-oxidize following reduction. For all other ratios, the Ni phase was well dispersed, amorphous, or had already been re-oxidized. For the first four Mg/Al molar ratios (1:1 to 4:1), the reflections for the phases at 43.0° and 62.4° increased in peak height and area as the Mg/Al molar ratio increased. This indicates an increase in the amount of MgO, since the quantity of Ni was kept constant during synthesis. However, this trend did not continue for the 5:1 Mg/Al molar ratio. At the same time, the peak for the spinel phases at 18.8° remained constant in terms of height and area. As can be seen in Figure 10, the crystallite size of the MgO phases did not change significantly across the five ratios. The lack of value for the MgO phase at a Mg/Al molar ratio of 1:1 is due to the shape of the peak at 43.0°. The position of the elemental Ni reflex at 44.4° interferes with the MgO phase, meaning that no distinct peak could be isolated. Therefore, calculation of the crystallite size was not possible. The size of the spinel crystallites at 18.8° changed irregularly, ranging from a minimum of 85.5 Å to a maximum of 153.8 Å for the Mg/Al molar ratio of 5:1. These changes can be attributed to the small peak sizes and low signal-to-noise ratios, resulting in inaccurate crystallite size calculations. All experimental data for figure 10 are summarized in Table S4 in the Supplementary Information.
2.2.3. Inductively Coupled Plasma with Optical Emission Spectroscopy (ICP-OES)
ICP-OES analyses were performed to verify whether the selected synthesis routes had resulted in the desired compositions of the individual catalysts. Table 5 summarises the results. Regarding the Ni mass fractions, the table shows reasonable agreement between the measured values from the ICP-OES and the calculated values for the catalyst syntheses. Once again, the value for the 10Ni/Mg4Al1_urea catalyst was striking, as it is the only one that exceeds the calculated value of 10.96 wt% with 14.48 wt%. The smallest deviation between the measured and calculated values for the Ni mass fractions was found in the 10Ni/Mg5Al1_urea catalyst. In addition, a comparison of the measured and calculated values for the Mg/Al molar ratios revealed significant differences. For example, the measured Mg/Al molar ratio in the case of the 10Ni/Mg5Al1_urea catalyst was only approximately 1:1, although it should be around 5:1. This indicates that urea hydrolysis with the parameters described in Section 3.1.2 was insufficient to precipitate Mg(OH)₂ together with Al(OH)₃. This was because the highest pH value achieved during the 7.5-hour reaction time was 8.5. However, the solubility product of Mg(OH)₂ indicates that a pH value of between 9 and 10 is required for sufficient precipitation, whereas Al(OH)₃ precipitates at a pH value of between 6 and 8. Therefore, Mg(OH)₂ could not completely precipitate in the urea hydrolysis, resulting in the low Mg/Al molar ratios in this table.
2.2.4. Scanning Electron Microscopy (SEM)
Figure 11 illustrates SEM images of the catalyst Mg1Al1_urea at magnifications of 2500 (left) and 10,000 (right). It presents the surface of a larger structure on which some smaller particles were positioned. Thereby, even though their size differed, the small particles were evenly distributed. Furthermore, the image reveals irregularities on the surface of the larger structure. This trend became even more distinct in the SEM image on the right with a magnification of 10,000. It shows the surface of the larger structure in close detail and therefore highlights its porosity even further. The image reveals that the surface as well as the small particles were made of a layered framework, including pores and irregularities. It can be assumed that the larger structure was made of hydrotalcite-derived mixed oxides. This conclusion is supported by the fact that the structures were porous and exhibited a layered framework, which is common for hydrotalcite-derived materials. The anionic interlayer was removed during the calcination step, leaving the structure with pores in between the layers. As already concluded in section 2.1.5 for the sample from the precipitation route, the small particles sticking to the surface of the mixed oxide, were probably consisting of an excess of MgO. A detailed size analysis reveals that the average size of the small particles was in the range of 1 µm2 with a few particles exceeding 20 µm2.
2.2.5. N2 Sorption
Table 6 shows the results of the N₂ sorption measurements for the five catalysts synthesized using the urea method. Surface area values ranged from 167.9 m2 g-1 for the 2:1 Mg/Al molar ratio to 288.2 m2 g-1 for the 4:1 ratio, the latter being nearly twice as high. This means that there was no clear correlation between the specific surface area of the catalysts and their Mg/Al molar ratio. The same applied to the pore volumes: the 5:1 Mg/Al molar ratio had the smallest volume (0.24 cm³ g-1), whereas the 1:1 ratio showed the largest (0.42 cm³ g-1). Furthermore, the pore volumes were not linked to the specific surface areas, as the largest specific surface area belonged to the second lowest pore volume at the 4:1 Mg/Al molar ratio. A trend could be identified in the average pore size, where it decreased with increasing Mg/Al molar ratio, except for the 5:1 ratio, which had a larger average pore size than the 4:1 ratio. As no consistent trend emerged between the three properties derived from the N2 sorption measurements and the Mg/Al molar ratios, it appears that the Mg/Al molar ratio did not crucially influence the surface or pores of the catalysts.
2.3.6. Catalytic Activity
Figure 12 depicts the results of the catalytic tests at a reaction temperature of 185 °C with the five catalysts prepared via the urea method. The figure on the top left regarding the concentration of iso-butanol as a function of reaction time illustrates that with all catalysts the concentrations of iso-butanol rose continuously up to a reaction time of 210 minutes. However, there was no clear dependence on the Mg/Al molar ratio of the respective catalysts. While sample 10Ni/Mg3Al1 showed an iso-butanol concentration of 131 mmol l-1 at a reaction time of 210 min, the values of catalysts 10Ni/Mg2Al1, 10Ni/Mg5Al1, and 10Ni/Mg4Al1 were significantly higher and amounted to 161 mmol l-1, 164 mmol l-1, and 170 mmol l-1, respectively, at this reaction time. These quantities are plainly higher than those of catalysts synthesised using the co-precipitation route with maximum values in the range of 140 mmol l-1 (see Figure 7). In comparison, Pasel et al. and Häusler et al. found significantly lower values for iso-butanol concentration in the range of 70 mmol l-1 to 80 mmol l-1 with their Pd/C, Pt/C, Ru/C, Ir/C, Rh/C, Cu/C and NiPt/C catalysts. The trends for all five catalysts in the figure below showed a slight decline after a reaction time of 240 minutes, suggesting the onset of deactivation. Since the selectivities towards iso-butanol of all five catalysts were similar, ranging between 85% and 90% (see part c of this figure), the dependencies described for the concentrations of iso-butanol can also be found in the conversion of ethanol. The maximum conversions were approximately 15%. In the lower section of Figure 12, the selectivities of the individual catalysts towards the products iso-butanol, 2-methylbutane-1-ol and 2,3-dimethylpentane-1-ol are plotted on the left Y-axis. The reaction time was 240 min. Selectivities towards 2,3-dimethylpentane-1-ol were in the range of 6–8%, while those towards 2-methylbutane-1-ol amounted to 4%–8%. The space-time yield for the formation of iso-butanol of the catalysts is shown in this figure on the right Y-axis at a reaction time of 240 min. It is highest for sample 10Ni/Mg4Al1 with a value of 8.0 mmol g-1 h-1. The corresponding number at a reaction time of 210 min was 8.2 mmol g-1 h-1 (not shown in this figure). Like the case of iso-butanol concentrations shown above, the figures for space-time yield were higher for the urea method than for the co-precipitation route. All experimental data for Figure 12 are summarized in Tables S5 and S6 in the Supplementary Information.
- a)
- Concentration of iso-butanol
- b)
- Ethanol conversion
- c)
- Selectivities towards iso-butanol and other main by-products (left), space-time yield at 240 min reaction time
3. Materials and Methods
3.1. Synthesis of Hydrotalcite-Derived Mixed Oxide Supports
3.1.1. Synthesis Via Co-Precipitation
The precipitation agent for the co-precipitation synthesis method was a solution containing 1 mol l-1 NaOH and 1 mol l-1 Na2CO3. To prepare the solution, 40 g of NaOH and 106 g of Na2CO3 were weighed in and dissolved in one liter of distilled water. The solution was stirred until all solids were dissolved in the distilled water.
To synthesize the different MgO-Al2O3 hydrotalcite supports, first the respective calculated quantities of Mg(NO3)2 ∙ 6 H2O and Al(NO3)3 ∙ 9 H2O were weighed in. These quantities were fully dissolved in 200 ml of distilled water. The precipitation was conducted using an automatic titration unit (Metrohm 888 Titrando). With a speed of 2 ml min-1, the precipitation agent was added to the nitrate precursor solution at room temperature, while the pH-value was measured the entire time. Once the pH-value had reached ten, the addition of the precipitation agent was stopped, and the suspension was stirred for 24 hours at room temperature. The precipitate formed was then separated by removing the liquid phase in a Büchner funnel. To wash the separated precipitation, it was transferred into a beaker with 400 ml distilled water. The suspension was then stirred for 30 min, before the liquid phase was separated again in a Büchner funnel. This procedure was repeated until the pH-value of the liquid phase, measured with a pH-electrode (Metrohm 914 pH/Conductometer, laboratory version), reached seven. In the next step the washed precipitation was dried at 100 °C for 2 hours in a drying oven. Afterwards it was calcined at 500 °C for 4 hours in a chamber furnace (Carbolite CWF 12/13) to produce the oxidic forms and to remove the anion-water interlayer.
3.1.2. Synthesis Via Urea Hydrolysis
To synthesize the different MgO-Al2O3 hydrotalcite supports via the urea hydrolysis method again the calculated quantities of Mg(NO3)2 ∙ 6 H2O and Al(NO3)3 ∙ 9 H2O were weighed in. These amounts were dissolved in 200 ml of distilled water, together with a calculated amount of urea. The quantity of urea was calculated to be 3.3 times the amount of the nitrates. This solution was then stirred until no solids were visible any more, before transferring it quantitatively to a 500 ml three neck round bottom flask. To start the precipitation the temperature of an oil bath was set to 110 °C while a magnet stirrer ensured the homogeneity of the solution. Once the solution temperature reached 90 °C, the precipitation time started. In between, the pH-value was monitored using pH indication paper and a pH-electrode. The reaction was stopped after 7.5 hours by removing the oil bath. Separating, washing and drying the precipitation as well as the calcination procedure were conducted the same way as in Section 3.1.1.
3.1.3. Wet Impregnation with Ni
Before the different MgO-Al2O3 hydrotalcite supports can be evaluated with respect to their catalytic acitvities, the active metallic Ni needs to be doped onto their surfaces. Therefore, Ni(NO3)2 ∙ 6 H2O to achieve a Ni loading of 10 wt% on each of the respective supports was weighed in and dissolved in 50 ml of distilled water. To this Ni-ion containing solution, 1.35 g of the synthesized supports from Section 3.1.1 and Section 3.1.2, respectively, was added. Utilizing a rotary evaporator (IKA RV 8) and a heating bath (IKA HB 10) the suspension was dried. The evaporation of water was conducted with 60 rotations per minute (RPM) at a temperature of 60 °C and a pressure of 60 mbar. The dry catalyst was then calcined under the same conditions as described in Section 3.1.1. To prepare for reduction, the precipitation was grounded with a pistil and a mortar. Afterwards, the powder was reduced in a tube furnace (Heraeaus ROK A 4/60) at 550 °C for 5 hours with a flow of 2 vol% H2 in N2.
3.2. Catalytic Experiments
3.2.1. Test of Catalytic Behavior
The tests of catalytic behavior of the respective catalysts from the two synthesis routes were carried out in a batch reactor from the company Parr (Parr instruments, model 4598, Inconell 600-alloy). The solutions for the reactions were prepared in a 100 ml volumetric flask. In each case, it contained 1.6 mol l-1 ethanol, 0.45 mol l-1 NaOH and 0.015 mol l-1 n-decane (as internal standard) in methanol as a solvent/reactant. First, 5 wt% catalyst, relative to the quantity of ethanol were weighed in and transferred to the reaction vessel. The atmosphere inside the reaction vessel was switched by repeated passing in of N2 up to a pressure of 6.0 bar. After the atmosphere in the vessel was replaced for the third time, 70 ml of the solution was filled into the vessel by injection through a membrane. Once the solution was inside the reaction vessel, the atmosphere was replaced by N2 once more. Afterwards, the temperature insde the reactor was set to 185 °C and the stirring speed to 1000 rotations per minute (rpm). Samples for gas-chromatographic analysis were taken from the reactor vessel every half an hour, except for sample numbers 0, 1, 2 and 11. Sample 0 is a fraction of the remaining reaction solution not being filled into the vessel, while 1 is the first sample from the reaction vessel at room temperature before the reaction period starts. The second sample is taken once the solution reached 185 °C and the eleventh sample is collected, when the vessel was cooled down to room temperature again after the reaction period. The reaction lasted for 4 hours and the reaction time started after the second sample once the solution had reached 185 °C. For the gas-chromatographic measurements, 1 ml of solution is taken from the reaction vessel through a capillary after having flushed the capillary with 1 ml of the same solution.
3.2.2. Analysis Via Gas-Chromatography And Mass Spectrometry (GC-MS)
For each GC-MS analysis, 3 µl of the respective collected sample were transferred to a 21 ml headspace vial using a 10 µl variable Eppendorf pipette. The separation of the compounds took place in a GC (Agilent 8990 GC system) while the identification was conducted in an MS (Agilent 5977B GC/MS). The method used to analyze the samples was a full evaporation method to protect the column from undissolved NaOH or catalyst particles. For the full evaporation, the samples were preheated to a temperature of 105 °C for 5 min. An autosampler (Chromtec PAL HTS-xt) was responsible for transporting and injecting the sample. After the evaporation, a gastight syringe (Hamilton, V = 2.5 ml, syringe temperature = 100 °C, filling speed = 100 µl s-1, flush time = 10 s, pull-up delay = 100 ms, injection speed = 500 µl s-1, N2 as flushing gas) took the samples and injected them into the back inlet of the GC. There, the samples were diluted with a 75:1 split with 99.9999% purity He as carrier gas. Afterwards, the sampled reached the column. It is a 30 m long DB-wax column with a diameter of 0.25 mm and a film thickness of 0.25 µm. The separation was conducted using the following temperature program for the column oven. For the first 4 min, the temperature stayed at 35 °C. Then, the temperature rose with a rate of 20 K min-1 until it reached 220 °C. This temperature was kept for 1 min, before the analysis ended. The separated sample then flowed to the MS for structural identification. Due to electron impact ionization, the molecules in the samples break down into smaller fragments. These fragments are separated in a quadrupole because of their different mass–to–charge ratios (m/z). The electron multiplier with a high-energy dynode detects the fragments and allows the qualification of the compounds. To quantitate the reaction products, a calibration made from the pure substances is being applied, while n-decane is used as an internal standard.
3.3. Temperature-Programmed Methods
3.3.1 Temperature-Programmed Reduction (TPR)
For each measurement, approximately 100 mg of catalyst were weighed in. This quantity was placed into a U-shaped glass between two layers of quartz wool. Then the U-tube was connected to the analytic device (Micromeretics Autochem III-2930). Afterwards the furnace was closed around the U-tube with the sample. At the start of the analysis, the baseline needed to stabilize. Once it did, the measurement started and the gas mixture of 2% H2 in Ar flowed through the system with a flowrate of 50 ml min-1. When the recording started, the oven heated the sample with a rate of 10 K min-1 up to 750 °C. The thermal conductivity detector (TCD) measured the resulting changes in the gas composition.
3.3.2. Temperature-Programmed Desorption of CO2 (CO2-TPD)
The procedure for sample preparation and installation in the Autochem apparatus was the same as described in Section 3.3.1 for TPR. Before CO2 adsorption and subsequent desorption conducted, the samples were pretreated. This means that all remaining adsorbed gases were eliminated by heating the samples with a rate of 50 k min-1 up to a temperature of 350 °C under a He flow of 50 ml min-1. After cooling down back to room temperature, the adsorption of CO2 started. Therefore, a flow of 50 ml min-1 CO2 was fed through the sample for 1 h. Afterwards, 10 ml min-1 CO2 flowed through the U-shaped glass with the samples for additional 10 min. Once the adsorption steps were done, the desorption was carried out. For that, the samples were heated with 3 k min-1 up to 700 °C. The TCD registered any change in the gas flow composition and thereby measured the amount of desorbing CO2.
3.3.3. Temperature.Programmed Desorption of NH3 (NH3-TPD)
The procedure for sample preparation and their installation in the Autochem apparatus were the same as described in Section 3.3.1 for TPR. The conditions of the experiments for NH3-TPD were identical to those for CO2-TPD with the exception that in this case NH3 was used instead of CO2.
3.4. Structural Analysis
3.4.1. X-Ray Diffraction (XRD)
For the XRD measurement, a Bruker D8 DISCOVERY apparatus with a LYNXEYE XE-T detector was used. The X-ray generator ran with 40.0 kV and 40.0 mA. About 50 mg of sample material was needed for the characterization. It was irradiated with Cu-Kα-radiation with a wavelength of λ = 1.54060 Å. The 2θ angle was measured from 5° to 99.995° with a step length of 0.020°. Every step took 0.6 s. A Soller slit with an opening angle of 2.500° was applied for the primary ray path. For the analysis of the XRD spectra, the software DIFFRAC.EVA version 7.3 was used. With this software, the Scherer equation was applied to calculate the crystallite size for local peaks.
3.4.2. Inductively Couple Plasma with Optical Emission Spectroscopy (ICP-OES)
3.4.3. Scanning Electron Microscopy (SEM)
The SEM images were recorded with a Zeiss Gemini Ultra Plus (Acceleration voltage = 20.00 kV; magnification from 250 to 10,000). The electrons were detected with an Oxford max 100 detector with a distance of 8.5 mm.
3.4.4. N2 Sorption
4. Conclusions
The uniqueness and innovation of the hydrotalcite-derived Ni/MgO-Al₂O₃ mixed oxides synthesised for this study are demonstrated by the experimental findings that high concentrations of iso-butanol of up to 170 mmol l-1 with selectivities towards iso-butanol of 85%-90% were achieved at a low reaction temperature of 185 °C using a precious metal-free catalyst system. The key results of this study are summarised below.
The temperature-programmed reduction experiments yielded a reduction temperature of 550 °C for the conversion of NiO to Ni, which was independent of the preparation method used. The CO₂-TPD profiles of the five samples from the co-precipitation method showed among themselves a very similar structure with predominantly strong to very strong basic centers, without any discernible correlation to the Mg/Al molar ratio. The NH3-TPD profiles were also like each other, with strong acidic centers dominating over weak acidic sites and likewise showing no dependence on the Mg/Al molar ratio. In the case of the urea method, the CO₂-TPD measurements showed almost exclusively strong basic centers on all five catalysts. As with the samples from the co-precipitation synthesis, strong acidic centers dominated. However, as the Mg/Al molar ratio increased, the proportion of weak and medium acidic centers increased, while the proportion of strong acidic centers decreased accordingly. The catalyst with a molar Mg/Al molar ratio of 4:1 showed only a single sharp peak, which is typical for medium acidic centers. In the X-ray diffraction patterns of the co-precipitated samples, reflections from NiO, MgO and the spinels Al₂NiO₄ and Al₂MgO₄ were detected. The experiments also showed that as the molar Mg/Al molar ratio increased, both the crystallinity and the crystallite sizes of MgO and the spinels increased. For the urea catalysts, the XRD showed characteristic reflections for NiO, MgO and the spinel phases Al₂NiO₄ and Al₂MgO₄, like catalysts previously produced by co-precipitation. At a molar ratio of Mg/Al = 1:1, an additional reflection for metallic Ni occurred, indicating incomplete reoxidation of the sample. The crystallite sizes of MgO remained almost constant across the Mg/Al molar ratios investigated for the urea samples, while no systematic dependence of the crystallite size was apparent for the spinel phases. While the Ni mass fractions of the samples from the co-precipitation route measured using ICP-OES deviated only slightly from the values calculated for the synthesis, thus indicating effective impregnation of the support, the measured molar Mg/Al molar ratios showed clear differences from the calculations at values above three. This indicates reduced precipitation of Mg(OH)2 in the presence of Al(OH)3. In the case of the urea samples a significantly different picture emerged. The ICP-OES revealed significant deviations between the measured molar Mg/Al molar ratios and those calculated for the synthesis. This discrepancy can plausibly be attributed to the fact that the pH value set during synthesis was too low to precipitate Mg(OH)2 quantitatively, so that Mg was only incompletely incorporated into the hydrotalcite structure. Using SEM, MgO particles that were incompletely incorporated into the hydrotalcite structure were identified on the 10Ni/Mg1Al1_co-prec catalyst as small particles. They measured less than 20 µm² on the surface of the larger hydrotalcite structures. The SEM images of the 10Ni/Mg1Al1_urea catalyst showed a larger porous, layered structure characteristic of hydrotalcite mixed oxides, with small particles—likely excess MgO—uniformly distributed across its surface. At higher magnification, the porosity and structural irregularities become more apparent. The small particles of the urea sample generally have sizes around 1 µm², with a few reaching over 20 µm². For the co-precipitated catalysts, higher molar Mg/Al molar ratios led to higher iso-butanol concentrations of around 140 mmol l⁻¹ and correspondingly increased ethanol conversions, with the first signs of deactivation occurring after around 210 min on stream at 185 °C, while the selectivity towards iso-butanol ranged from 88% to 93% for all five catalysts. All catalysts from the urea route showed steadily increasing iso-butanol concentrations up to 210 min at 185 °C, with no clear dependence on the molar Mg/Al molar ratio. The most active catalysts reached higher iso-butanol concentrations between 160 mol l-1 and 170 mmol l⁻¹ than the catalysts synthesized by co-precipitation (~140 mmol l⁻¹). After 240 min, all catalysts began to deactivate slightly. Selectivities to iso-butanol were similar compared with those of the co-precipitation samples (85%–90%). The space-time yields at 210 min was highest for 10Ni/Mg4Al1 (8.2 mmol g⁻¹ h⁻¹), again outperforming the co-precipitated samples.
Supplementary Materials
The following supporting information can be downloaded at the website of this paper posted on Preprints.org.
Author Contributions
Conceptualization, Quoc Khanh Tran; Funding acquisition, Ralf Peters; Investigation, Justus Hüging; Methodology, Quoc Khanh Tran; Supervision, Quoc Khanh Tran and Joachim Pasel; Writing – original draft, Joachim Pasel; Writing – review & editing, Joachim Pasel, Quoc Khanh Tran, Justus Hüging, and Ralf Peters. All authors have read and agreed to the published version of the manuscript.
Funding
This study was funded by the Deutsche Forschungsgemeinschaft (DFG, German Research Foundation) – 491111487.
Data Availability Statement
The data supporting this article have been included as part of the Supplementary Information.
Acknowledgments
Special thanks are due to the fuel synthesis team at Jülich and all project and cooperation partners.
Conflicts of Interest
The authors declare no conflicts of interest. The funders had no role in the design of the study; in the collection, analyses, or interpretation of data; in the writing of the manuscript; or in the decision to publish the results.
References
- Liu, Q.; Xu, G.; Wang, X.; Mu, X. Selective upgrading of ethanol with methanol in water for the production of improved biofuel—isobutanol. Green Chemistry 2016, 18, 2811–2818. [Google Scholar] [CrossRef]
- Gabriëls, D.; Hernández, W.Y.; Sels, B.; Van Der Voort, P.; Verberckmoes, A. Review of catalytic systems and thermodynamics for the Guerbet condensation reaction and challenges for biomass valorization. Catalysis Science & Technology 2015, 5, 3876–3902. [Google Scholar]
- Li, X.; Li, X. Continuous upgrading of methanol and ethanol to isobutanol by heterogeneous catalysis over Cu-CeO2/AC catalyst and the combination. Molecular Catalysis 2024, 569, 114641. [Google Scholar] [CrossRef]
- Peters, M.; Menne, A.; Gielisch, H. Synthesis of Sustainable Fuels and Intermediates from Ethanol and Methanol. Chemie Ingenieur Technik 2022, 94, 1501–1508. [Google Scholar] [CrossRef]
- Wingad, R.L.; Bergström, E.J.E.; Everett, M.; Pellow, K.J.; Wass, D.F. Catalytic conversion of methanol/ethanol to isobutanol – a highly selective route to an advanced biofuel. Chemical Communications 2016, 52, 5202–5204. [Google Scholar] [CrossRef] [PubMed]
- Yusoff, M.N.A.M.; Zulkifli, N.W.M.; Masjuki, H.H.; Harith, M.H.; Syahir, A.Z.; Khuong, L.S.; Zaharin, M.S.M.; Alabdulkarem, A. Comparative assessment of ethanol and isobutanol addition in gasoline on engine performance and exhaust emissions. Journal of Cleaner Production 2018, 190, 483–495. [Google Scholar] [CrossRef]
- Pasel, J.; Häusler, J.; Schmitt, D.; Valencia, H.; Meledina, M.; Mayer, J.; Peters, R. Ethanol Dehydrogenation: A Reaction Path Study by Means of Temporal Analysis of Products. Catalysts 2020, 10, 1151. [Google Scholar] [CrossRef]
- Pizzoferrato, R.; Richetta, M. Layered Double Hydroxides (LDHs); Crystals, 2020. [Google Scholar]
- Trujillano, R.; Labajos, F.M.; Rives, V. Hydrotalcites, a rapid survey on the very recent synthesis and applications procedures. 2023, 238, 106927. [Google Scholar] [CrossRef]
- Bellotto, M.; Rebours, B.; Clause, O.; Lynch, J.; Bazin, D.; Elkaïm, E. Hydrotalcite Decomposition Mechanism: A Clue to the Structure and Reactivity of Spinel-like Mixed Oxides. The Journal of Physical Chemistry 1996, 100, 8535–8542. [Google Scholar] [CrossRef]
- Li, J.; Lin, L.; Tan, Y.; Wang, S.; Yang, W.; Chen, X.; Luo, W.; Ding, Y.-J. High Performing and Stable Cu/NiAlOx Catalysts for the Continuous Catalytic Conversion of Ethanol into Butanol. 2022, 14, e202200539. [Google Scholar] [CrossRef]
- Zhu, M.; Wang, Y.; Du, M.; Zhang, X.; Liu, H.; Qiao, Z.; Yang, J.; Peng, B.; Nie, L.; Li, Z. Cu-incorporated MgAl LDH Catalyst for Enhanced Bio-ethanol Upgrading to Butanol, n/a e01437. [CrossRef]
- Bravo-Suárez, J.J.; Subramaniam, B.; Chaudhari, R.V. Vapor-phase methanol and ethanol coupling reactions on CuMgAl mixed metal oxides. Applied Catalysis A: General 2013, 455, 234–246. [Google Scholar] [CrossRef]
- Wu, Z.; Wang, P.; Wang, J.; Tan, T. Guerbet Reactions for Biofuel Production from ABE Fermentation Using Bifunctional Ni-MgO-Al2O3 Catalysts. Catalysts 2021, 414. [Google Scholar] [CrossRef]
- Cheng, F.-L.; Guo, H.-Q.; Cui, J.-L.; Hou, B.; Li, D.-B. Guerbet reaction of methanol and ethanol catalyzed by CuMgAlOx mixed oxides: Effect of M2+/Al3+ ratio. Journal of Fuel Chemistry and Technology 2018, 46, 1472–1481. [Google Scholar] [CrossRef]
- Cheng, F.-L.; Guo, H.; Cui, J.; Hou, B.; Xi, H.; Jia, L.; Li, D. Coupling of methanol and ethanol over CuMgAlOx catalysts: the roles of copper species and alkalinity. Reaction Kinetics, Mechanisms and Catalysis 2019, 126, 119–136. [Google Scholar] [CrossRef]
- Carlini, C.; Flego, C.; Marchionna, M.; Noviello, M.; Galletti, A.M.R.; Sbrana, G.; Basile, F.; Vaccari, A. Guerbet condensation of methanol with n-propanol to isobutyl alcohol over heterogeneous copper chromite/Mg–Al mixed oxides catalysts. Journal of Molecular Catalysis A: Chemical 2004, 220, 215–220. [Google Scholar] [CrossRef]
- Carlini, C.; Marchionna, M.; Noviello, M.; Galletti, A.M.R.; Sbrana, G.; Basile, F.; Vaccari, A. Guerbet condensation of methanol with n-propanol to isobutyl alcohol over heterogeneous bifunctional catalysts based on Mg–Al mixed oxides partially substituted by different metal components. Journal of Molecular Catalysis A: Chemical 2005, 232, 13–20. [Google Scholar] [CrossRef]
- Larina, O.V.; Valihura, K.V.; Kyriienko, P.I.; Vlasenko, N.V.; Balakin, D.Y.; Khalakhan, I.; Čendak, T.; Soloviev, S.O.; Orlyk, S.M. Successive vapour phase Guerbet condensation of ethanol and 1-butanol over Mg-Al oxide catalysts in a flow reactor. Applied Catalysis A: General 2019, 588, 117265. [Google Scholar] [CrossRef]
- Tang, X.; Song, C.; Li, H.; Liu, W.; Hu, X.; Chen, Q.; Lu, H.; Yao, S.; Li, X.-N.; Lin, L. Thermally stable Ni foam-supported inverse CeAlOx/Ni ensemble as an active structured catalyst for CO2 hydrogenation to methane. Nature Communications 2024, 15, 3115. [Google Scholar] [CrossRef]
- Chen, X.; Zhang, Y.; Sun, C.; Wang, Y.; Song, G.; Li, C.; Lim, K.H.; Ye, R.; Peng, Y.; Arandiyan, H.; Lu, Z.-H.; Feng, G.; Zhang, R.; Kawi, S. Lanthanum-mediated enhancement of nickel nanoparticles for efficient CO2 methanation. Fuel 2024, 371, 131998. [Google Scholar] [CrossRef]
- Häusler, J.; Pasel, J.; Wöllhaf, C.; Peters, R.; Stolten, D. Dilute Alloy Catalysts for the Synthesis of Isobutanol via the Guerbet Route: A Comprehensive Study. Catalysts 2024, 14, 215. [Google Scholar] [CrossRef]
- Häusler, J.; Pasel, J.; Woltmann, F.; Everwand, A.; Meledina, M.; Valencia, H.; Lipińska-Chwałek, M.; Mayer, J.; Peters, R. Elucidating the Influence of the d-Band Center on the Synthesis of Isobutanol. Catalysts 2021, 11. [Google Scholar] [CrossRef]
- Pasel, J.; Häusler, J.; Peters, R.; Stolten, D. Catalytic activity and stability of NiPt/C catalysts for the synthesis of iso-butanol from methanol/ethanol mixtures. Catalysis Science & Technology 2024. [Google Scholar]
- Pasel, J.; Häusler, J.; Peters, R.; Stolten, D. NiPt catalysts for the synthesis of iso-butanol: the influence of molar ratio and total metal loading on activity and stability. Catalysis Science & Technology 2025, 15, 2248–2260. [Google Scholar]
- Pasel, J.; Häusler, J.; Schmitt, D.; Valencia, H.; Mayer, J.; Peters, R. Aldol condensation of acetaldehyde for butanol synthesis: A temporal analysis of products study. Applied Catalysis B: Environmental 2023, 324, 122286. [Google Scholar] [CrossRef]
- Pasel, J.; Woltmann, F.; Häusler, J.; Peters, R. Surface Redox Reaction for the Synthesis of NiPt Catalysts for the Upgrading of Renewable Ethanol/Methanol Mixtures. Catalysts 2024, 14, 77. [Google Scholar] [CrossRef]
- Othman, M.; Helwani, Z.; Martunus; Fernando, W. Synthetic hydrotalcites from different routes and their application as catalysts and gas adsorbents: A review. Applied Organometallic Chemistry 2009, 23, 335–346. [Google Scholar] [CrossRef]
- Costantino, U.; Marmottini, F.; Nocchetti, M.; Vivani, R. New Synthetic Routes to Hydrotalcite-Like Compounds − Characterisation and Properties of the Obtained Materials. European Journal of Inorganic Chemistry 1998, 1998, 1439–1446. [Google Scholar] [CrossRef]
- Choudhary, V.R.; Rane, V.H. Acidity/basicity of rare-earth oxides and their catalytic activity in oxidative coupling of methane to C2-hydrocarbons. Journal of Catalysis 1991, 130, 411–422. [Google Scholar] [CrossRef]
- Bartholomew, C.H.; Farrauto, R.J. Catalyst Characterization and Selection. Fundamentals of Industrial Catalytic Processes 2005, 118–196. [Google Scholar]
- Brunauer, S.; Emmett, P.H.; Teller, E. Adsorption of Gases in Multimolecular Layers. Journal of the American Chemical Society 1938, 60, 309–319. [Google Scholar] [CrossRef]
Figure 1.
Reaction pathway for the synthesis of iso-butanol from ethanol and methanol [7].
Figure 1.
Reaction pathway for the synthesis of iso-butanol from ethanol and methanol [7].
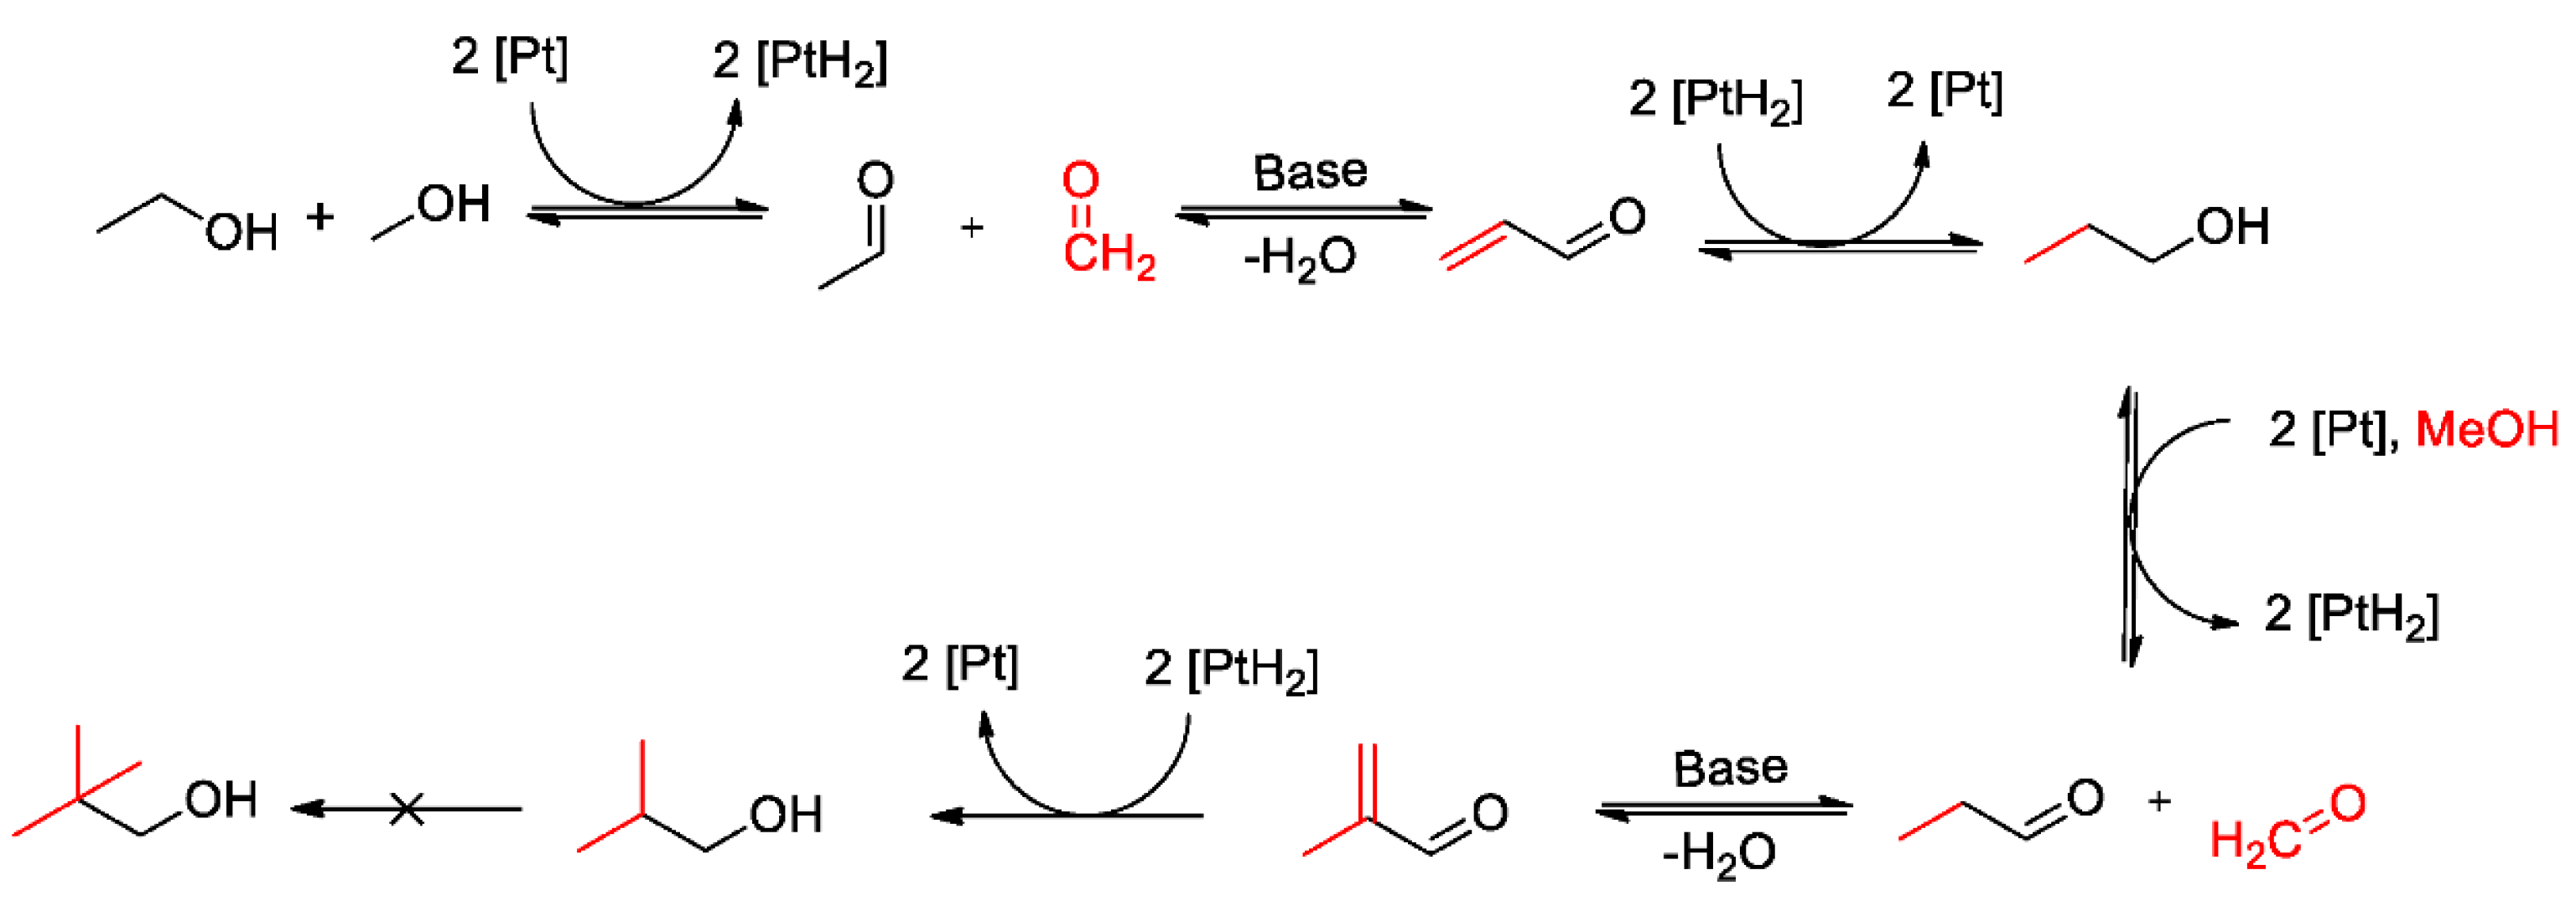
Figure 2.
TPR profiles of the calcined but unreduced catalysts 10Ni/Mg1Al1_coprec (left) and 10Ni/Mg1Al1_urea (right), samples were calcined at 500 °C for 4 h in N2, temperature range from 30 °C to 550 °C.
Figure 2.
TPR profiles of the calcined but unreduced catalysts 10Ni/Mg1Al1_coprec (left) and 10Ni/Mg1Al1_urea (right), samples were calcined at 500 °C for 4 h in N2, temperature range from 30 °C to 550 °C.
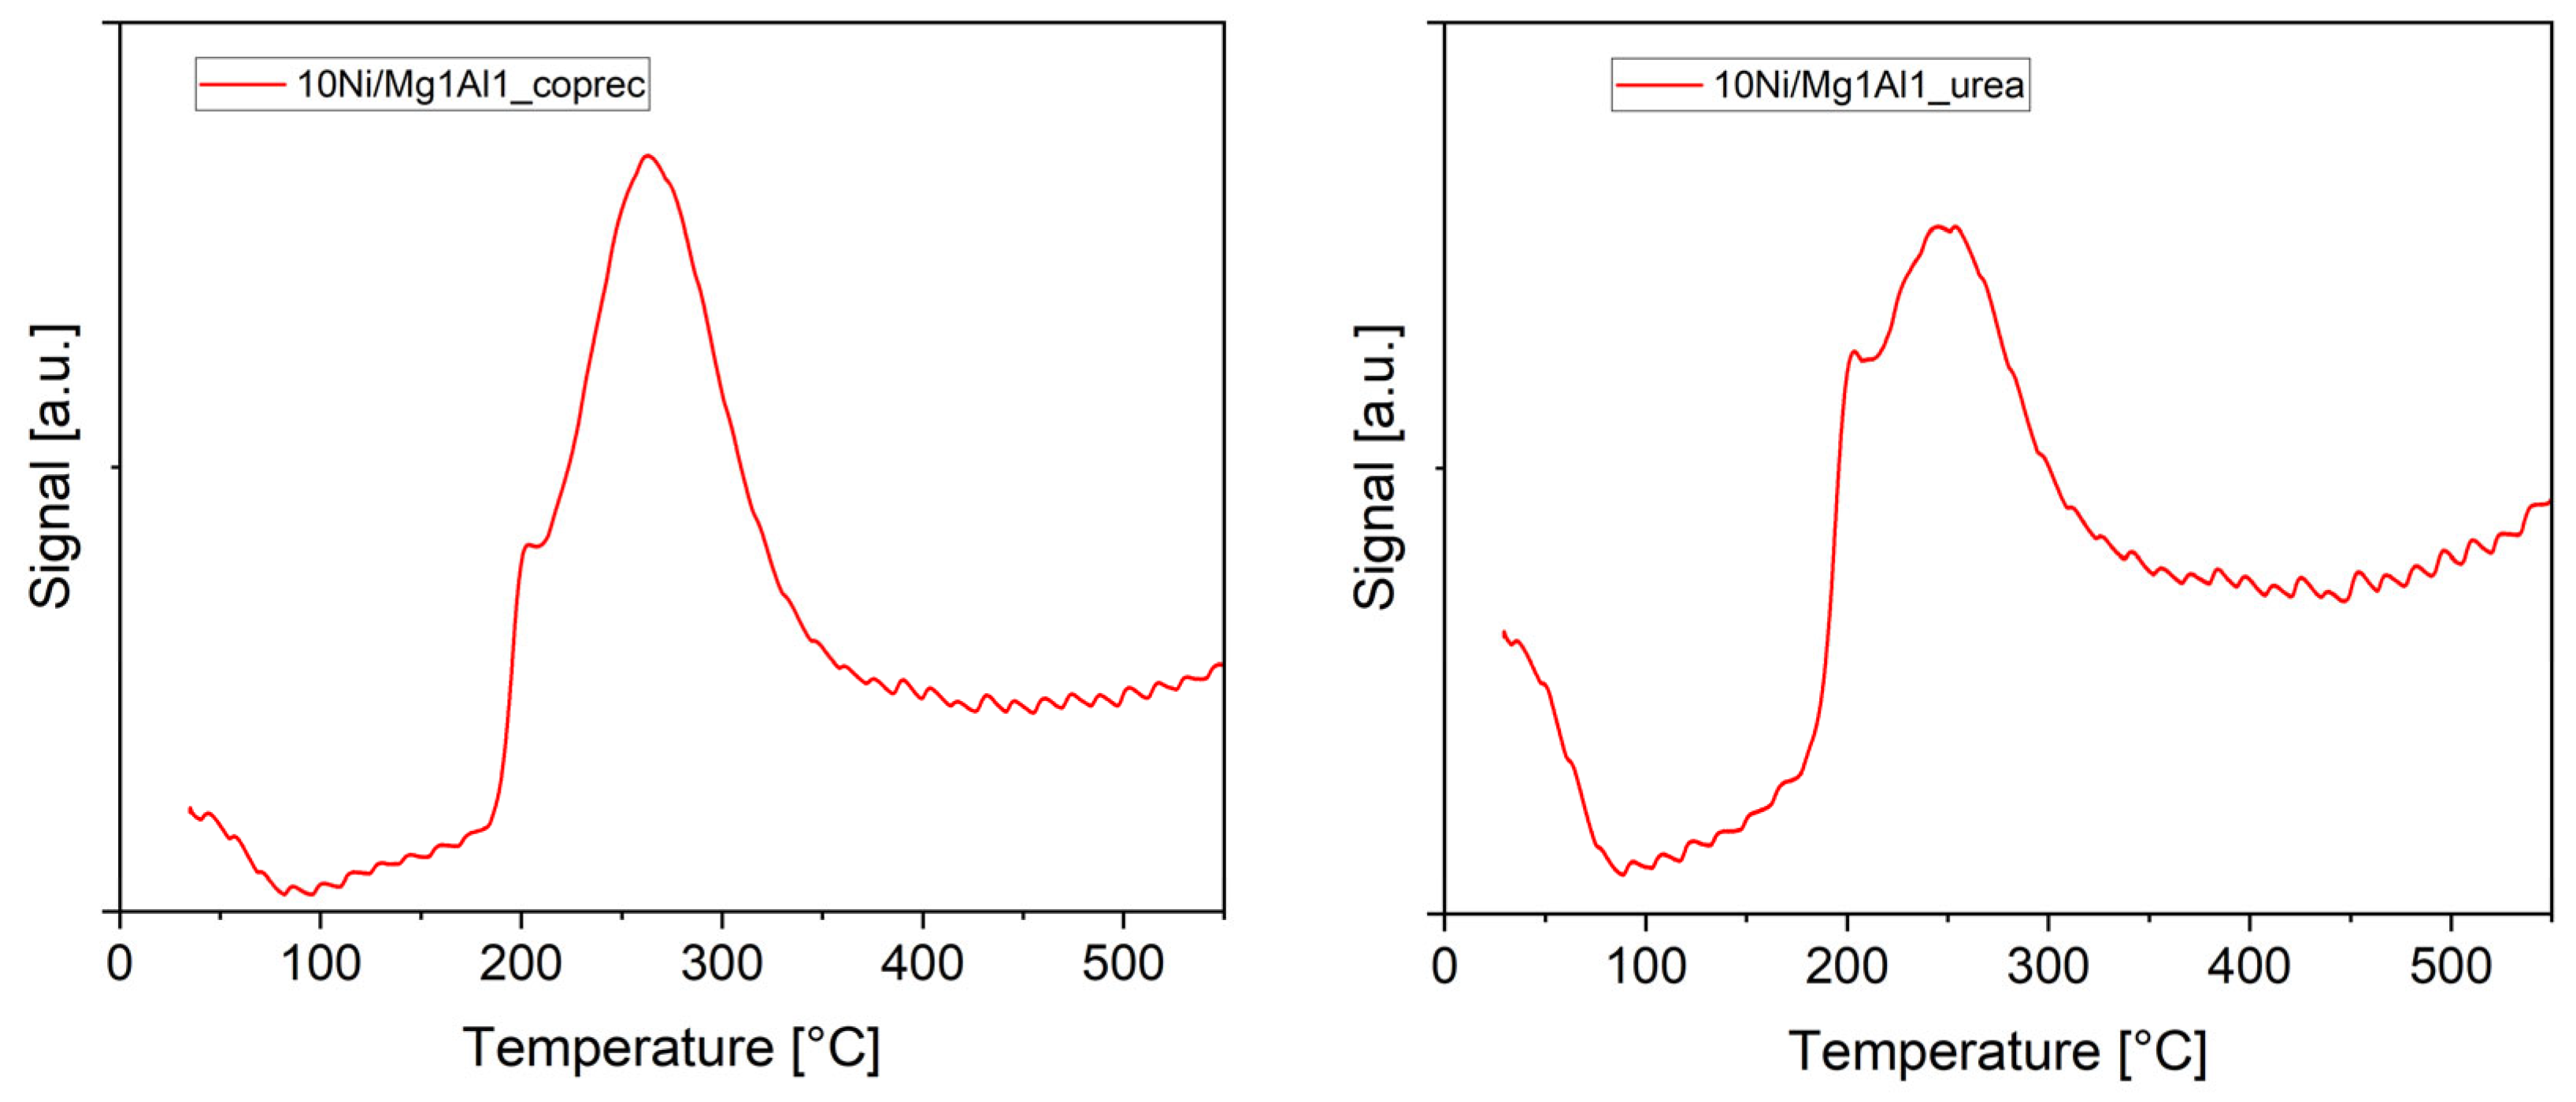
Figure 3.
TPD profiles (left CO2, right NH3) of the five catalysts prepared via the co-precipitation method, samples were calcined at 500 °C for four hours in N2 and reduced at 550 °C for 5 h in 2 vol% H2 in N2, temperature range from 30 °C to 700 °C
Figure 3.
TPD profiles (left CO2, right NH3) of the five catalysts prepared via the co-precipitation method, samples were calcined at 500 °C for four hours in N2 and reduced at 550 °C for 5 h in 2 vol% H2 in N2, temperature range from 30 °C to 700 °C
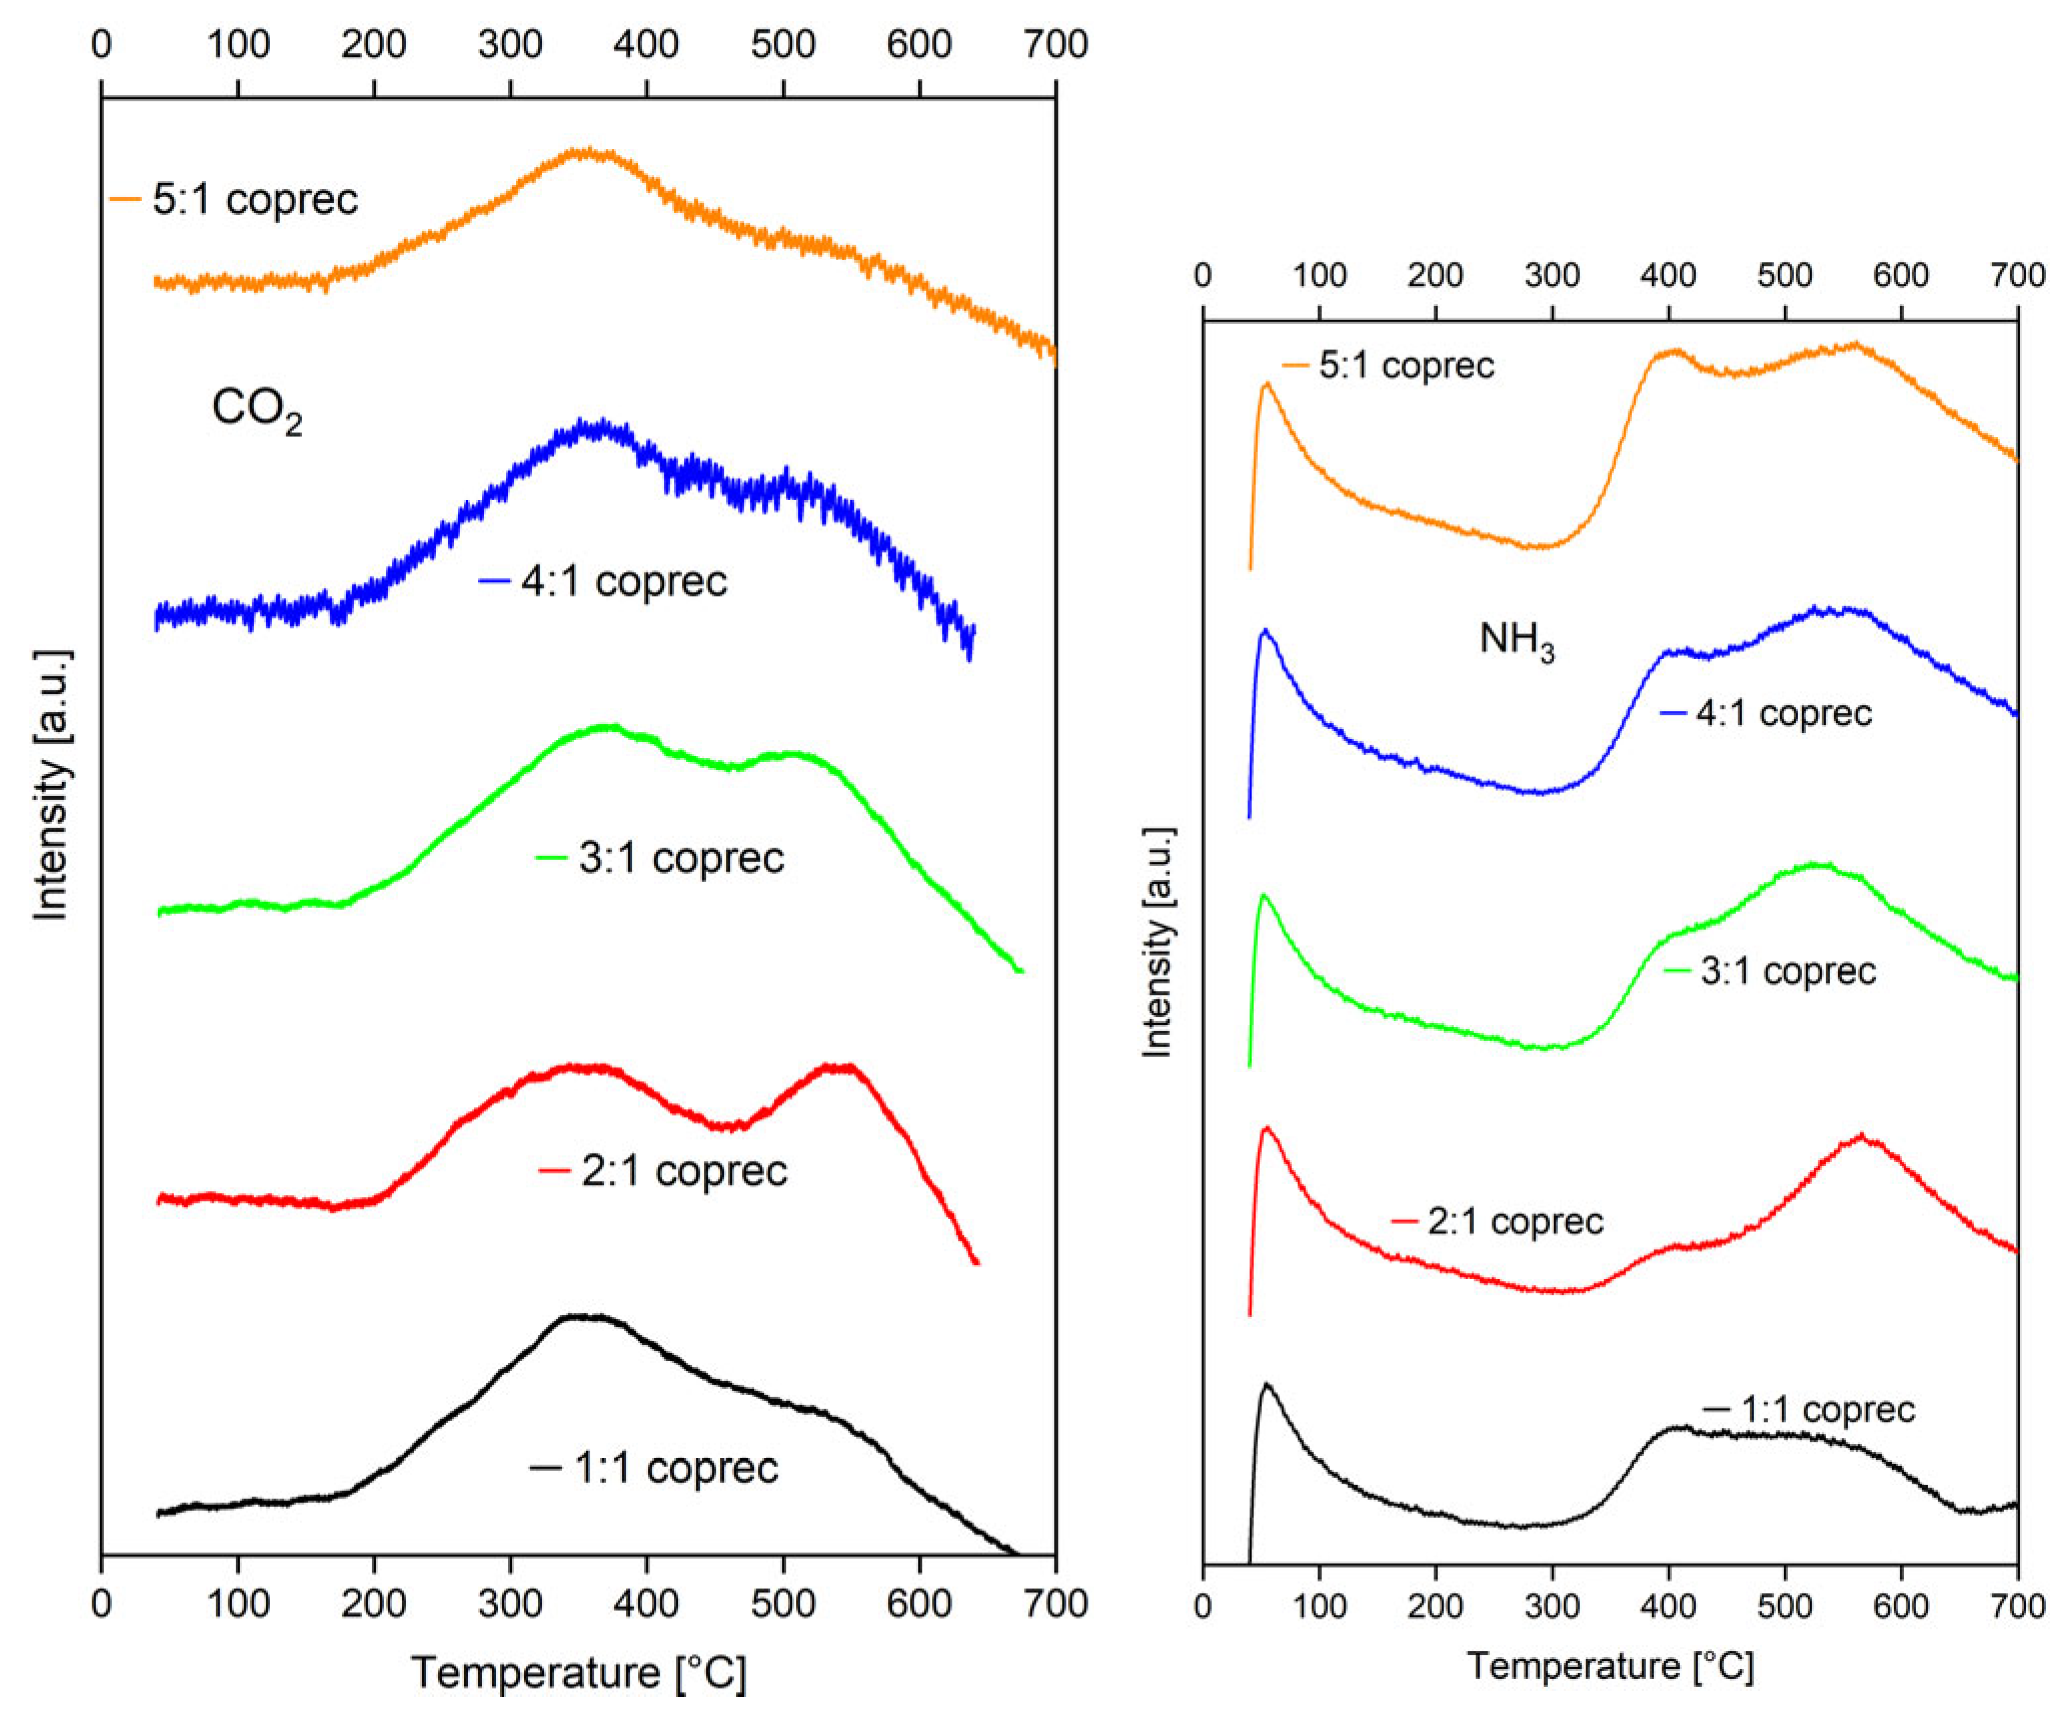
Figure 4.
XRD patterns of the five catalysts prepared via the co-precipitation method, samples were calcined at 500 °C for four hours in N2 and reduced at 550 °C for five hours in 2 vol% H2 in N2, with the following measuring conditions: 2Ө = 5° to 99.995°, and Cu Kα-radiation (λ = 1.54060 Å)
Figure 4.
XRD patterns of the five catalysts prepared via the co-precipitation method, samples were calcined at 500 °C for four hours in N2 and reduced at 550 °C for five hours in 2 vol% H2 in N2, with the following measuring conditions: 2Ө = 5° to 99.995°, and Cu Kα-radiation (λ = 1.54060 Å)
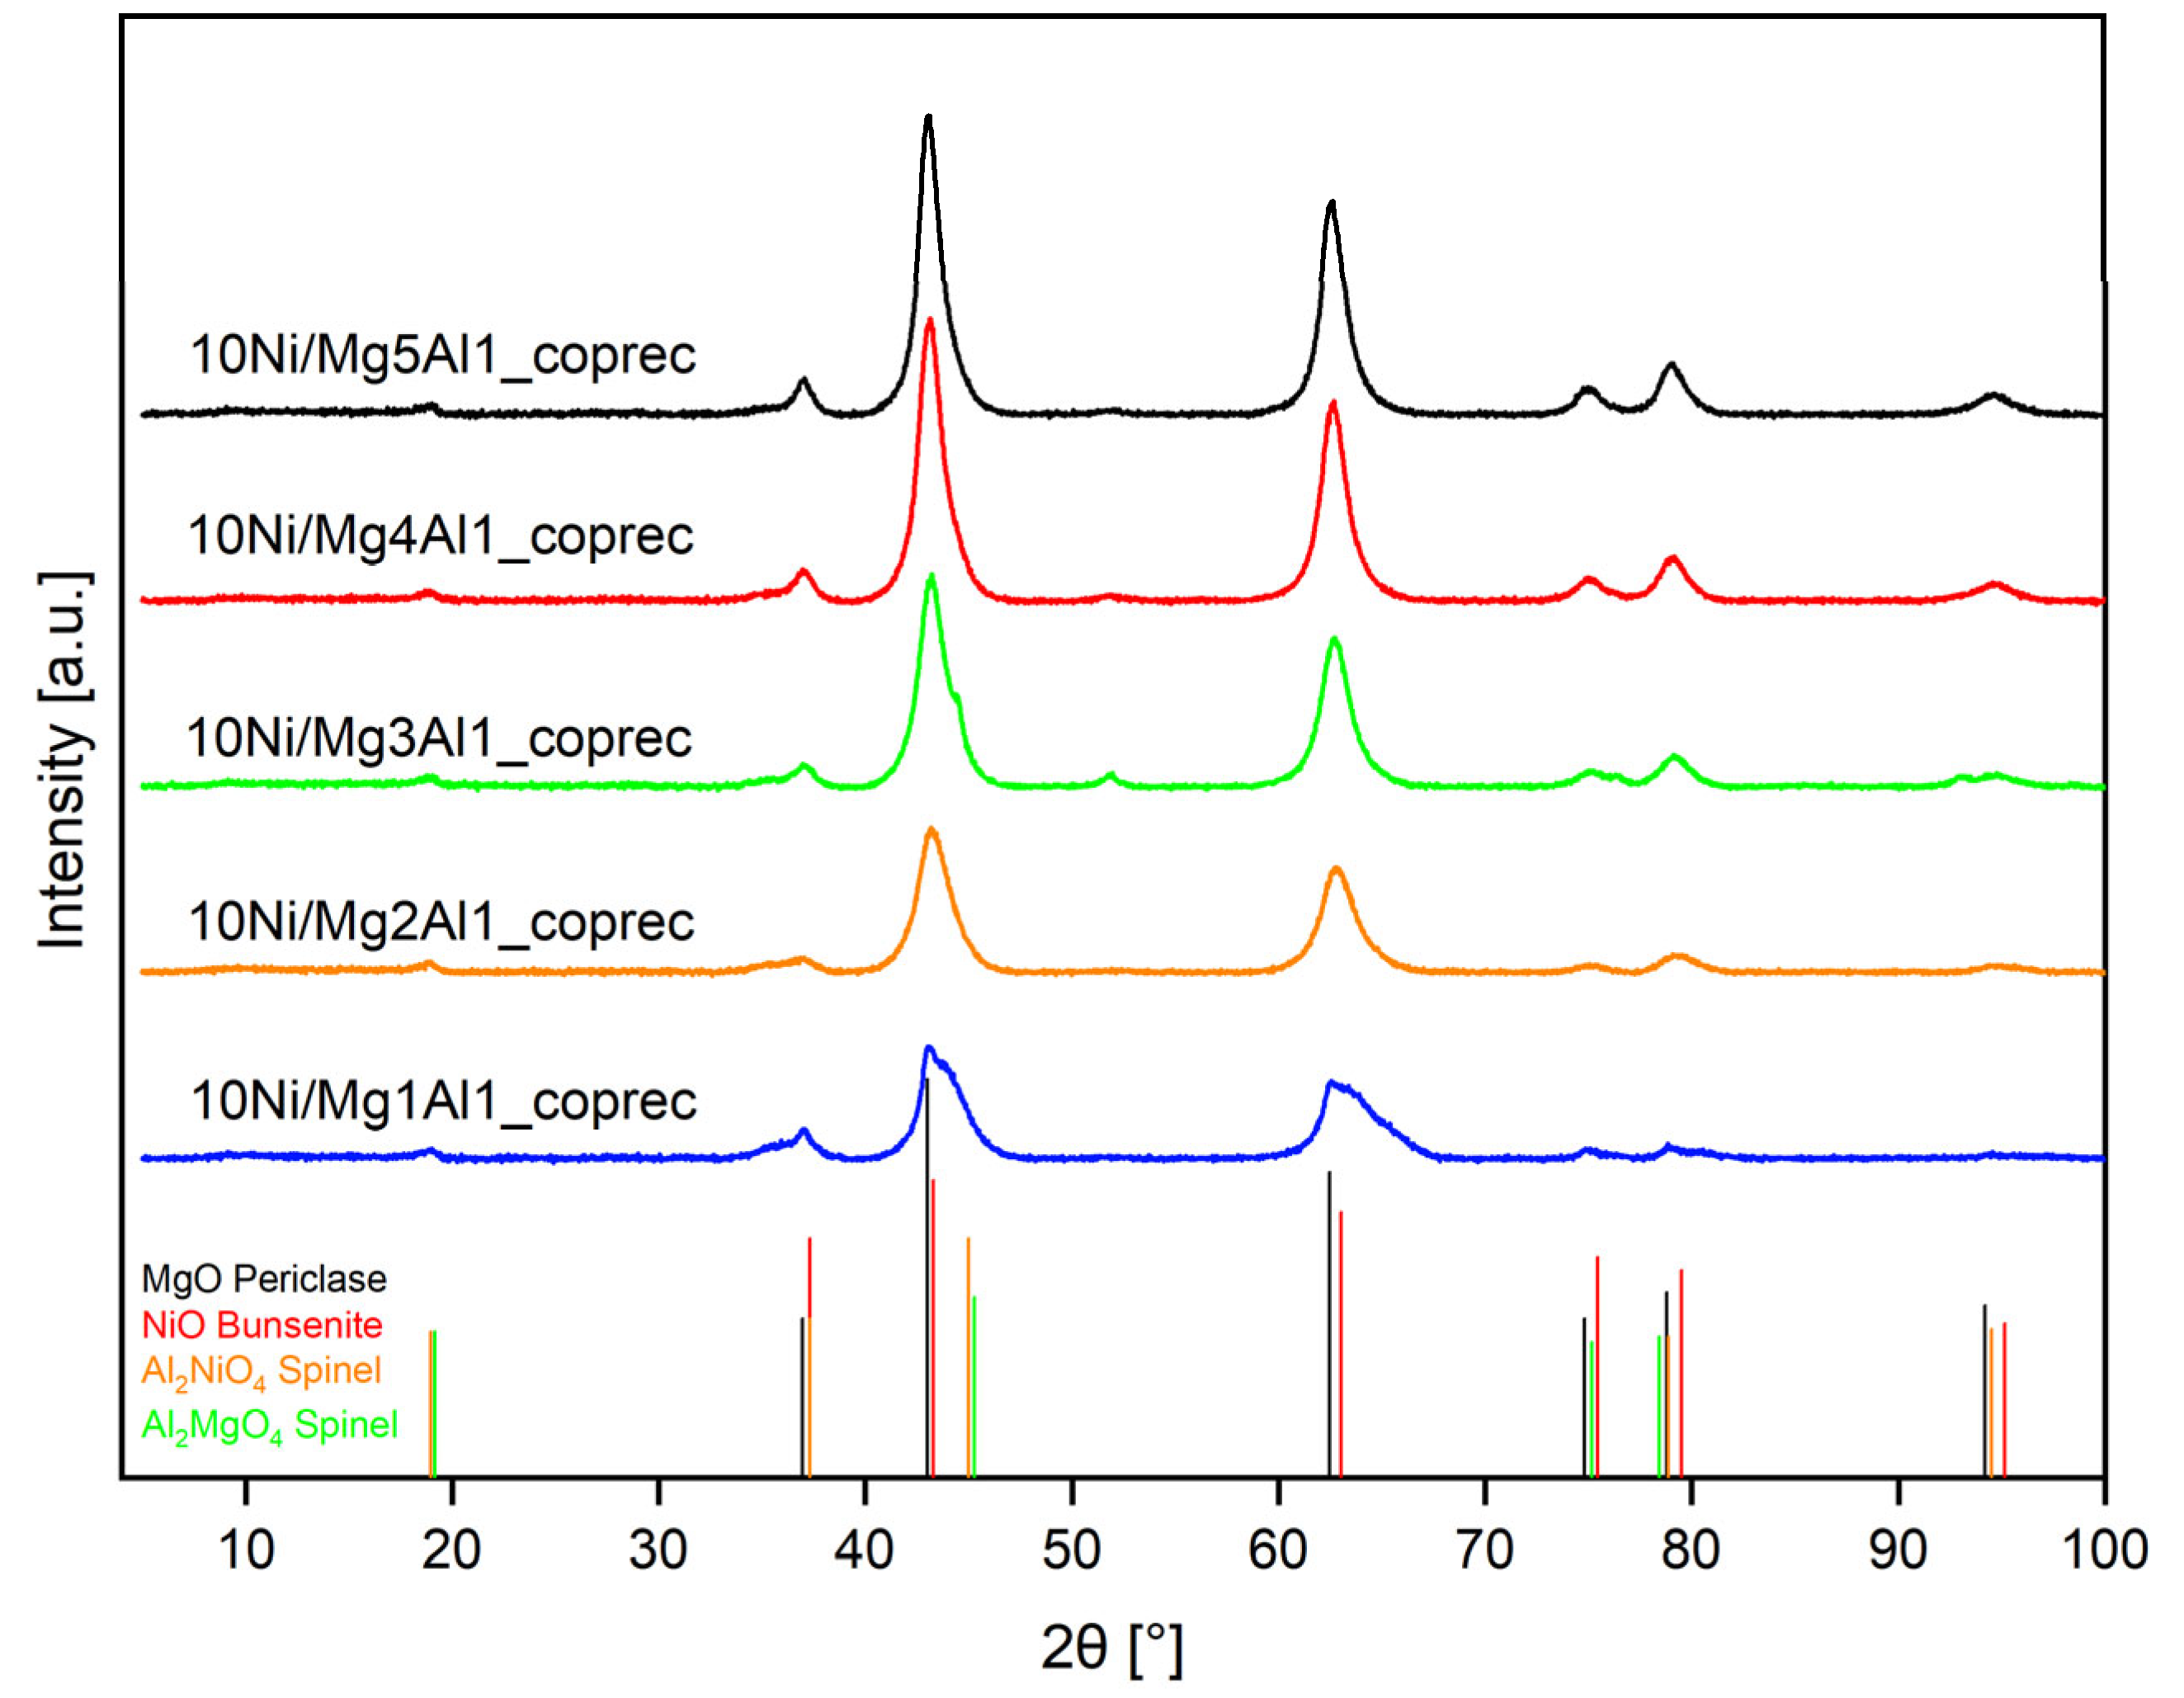
Figure 5.
Crystallite sizes of the five catalysts prepared via the co-precipitation method; samples were calcined at 500 °C for four hours in N2 and reduced at 550 °C for five hours in 2 vol% H2 in N2
Figure 5.
Crystallite sizes of the five catalysts prepared via the co-precipitation method; samples were calcined at 500 °C for four hours in N2 and reduced at 550 °C for five hours in 2 vol% H2 in N2
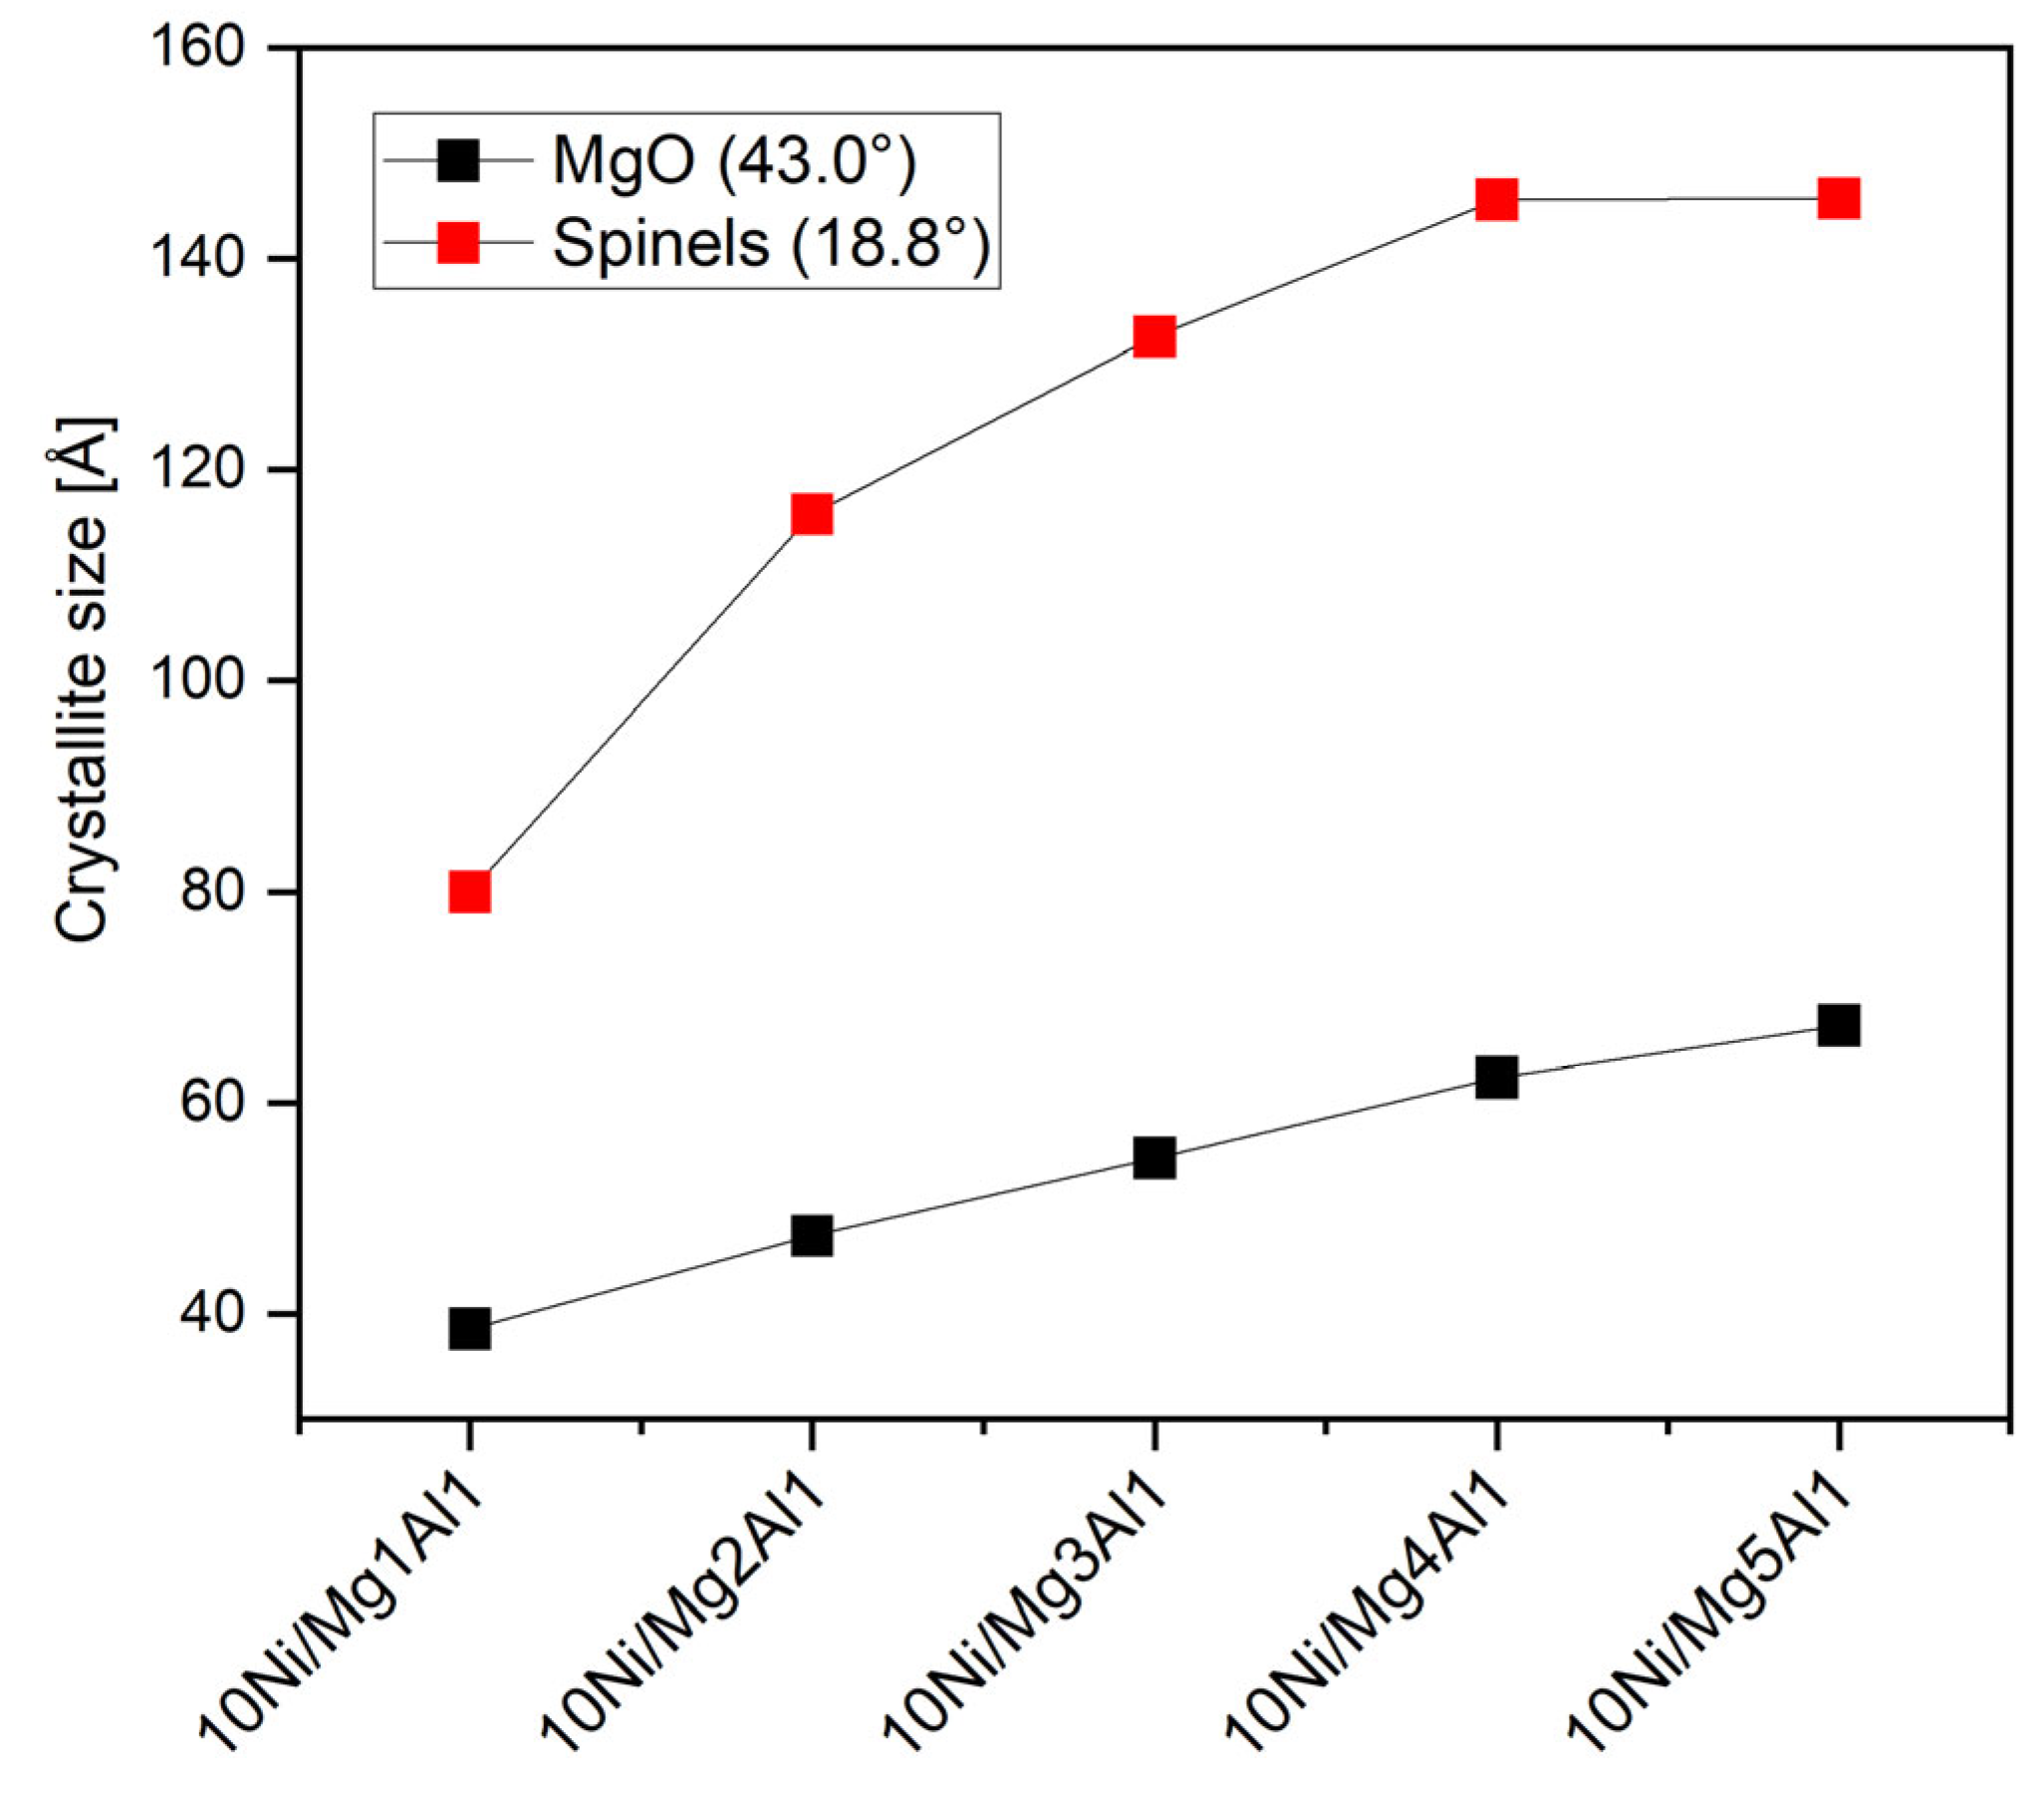
Figure 6.
SEM images of the catalyst Mg1Al1_coprec at magnifications of 1000 (left) and 10,000 (right).
Figure 6.
SEM images of the catalyst Mg1Al1_coprec at magnifications of 1000 (left) and 10,000 (right).
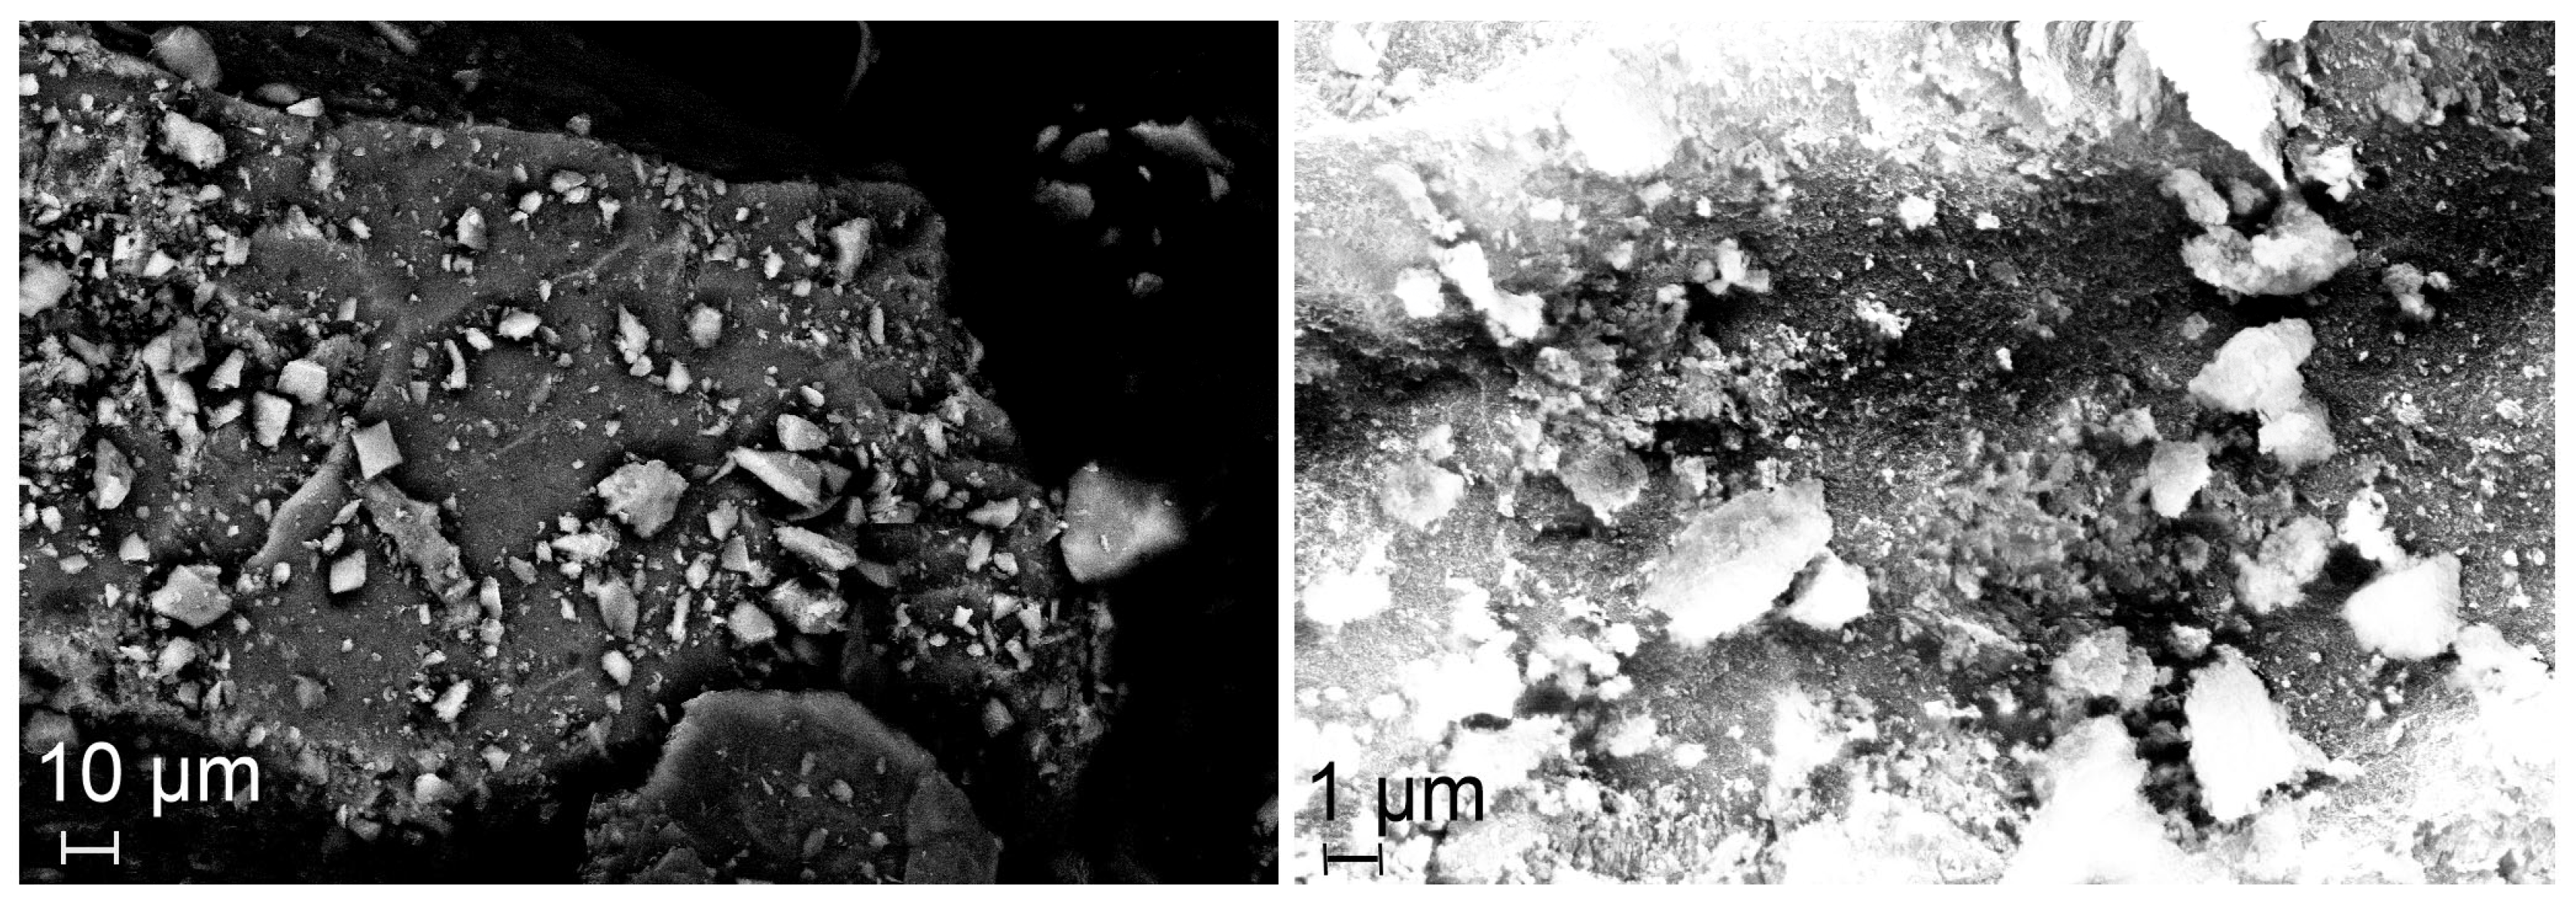
Figure 7.
Results of the catalytic tests at a reaction temperature of 185 °C with respect to the synthesis of iso-butanol with the five catalysts prepared via the co-precipitation method, m(catalyst) = 250 mg, d(powder) < 75 µm, V(reactor) = 70 ml, c0(EtOH) = 1600 mmol l-1, c(NaOH) = 450 mmol l-1, c(n-decane) = 15 mmol l-1, methanolic solution.
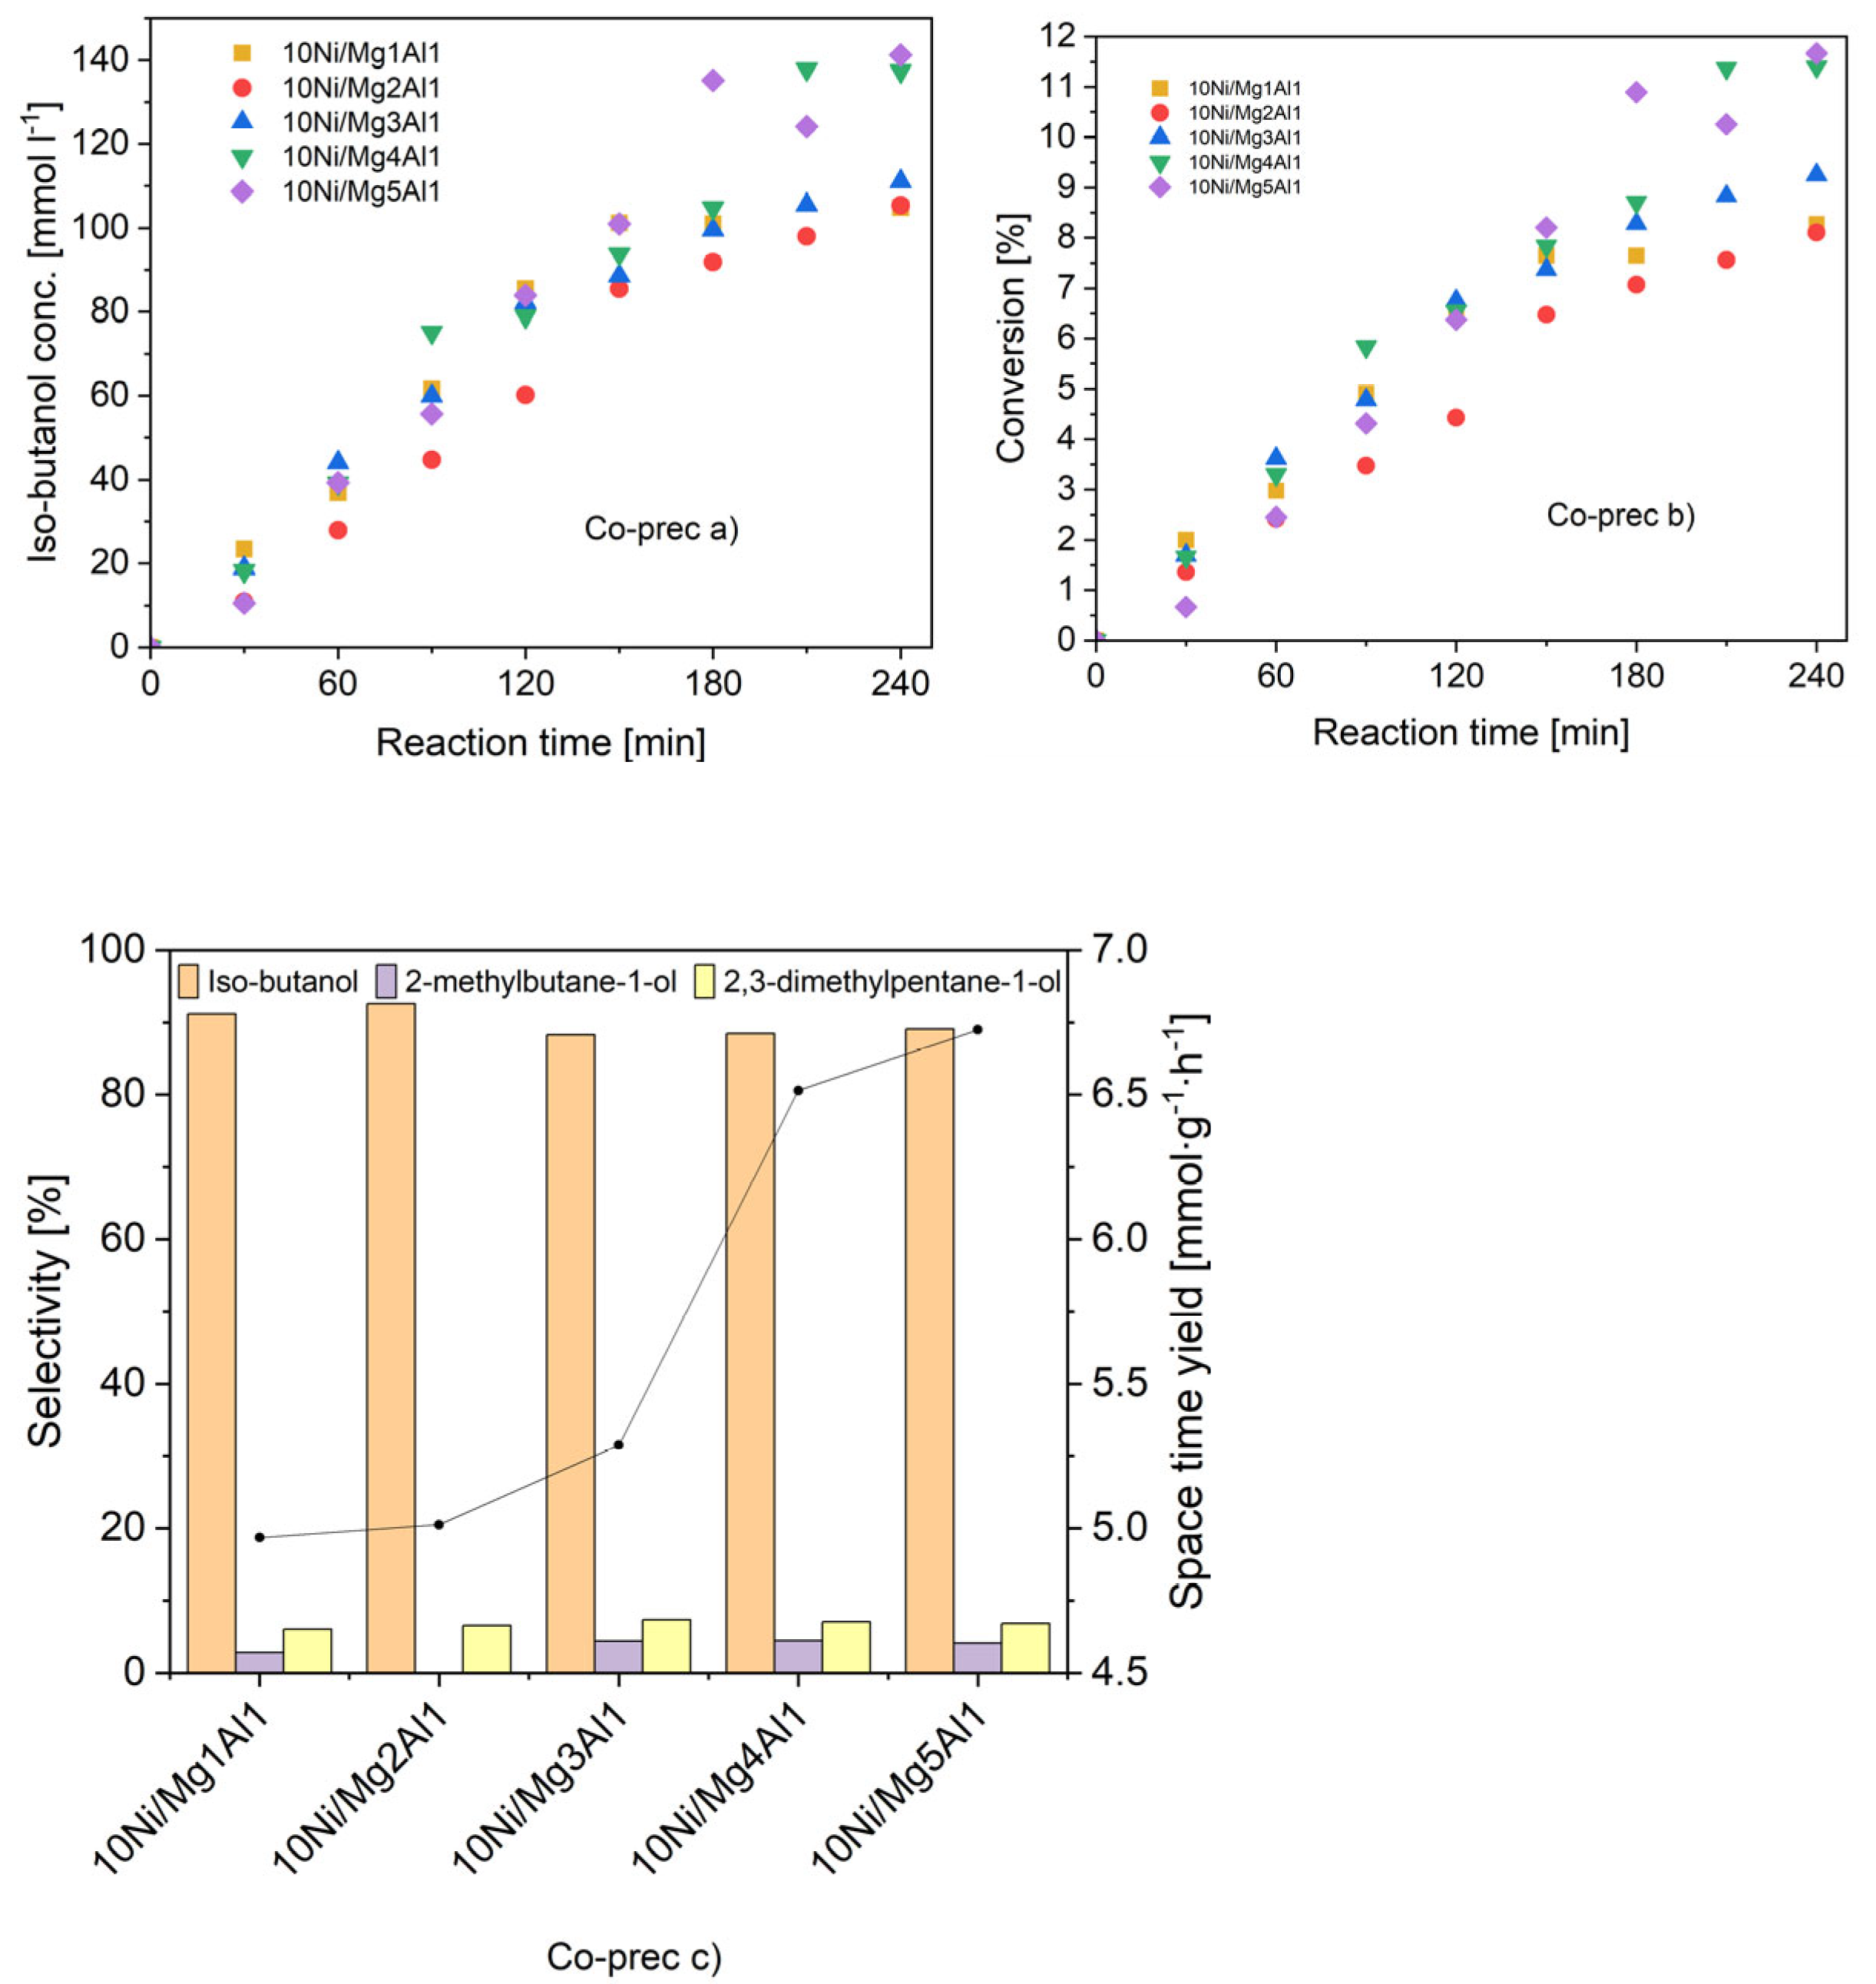
Figure 8.
TPD profiles (left CO2, right NH3) of the five catalysts prepared via the urea method; samples were calcined at 500 °C for four hours in N2 and reduced at 550 °C for five hours in 2 vol% H2 in N2, temperature range from 30 °C to 700 °C.
Figure 8.
TPD profiles (left CO2, right NH3) of the five catalysts prepared via the urea method; samples were calcined at 500 °C for four hours in N2 and reduced at 550 °C for five hours in 2 vol% H2 in N2, temperature range from 30 °C to 700 °C.
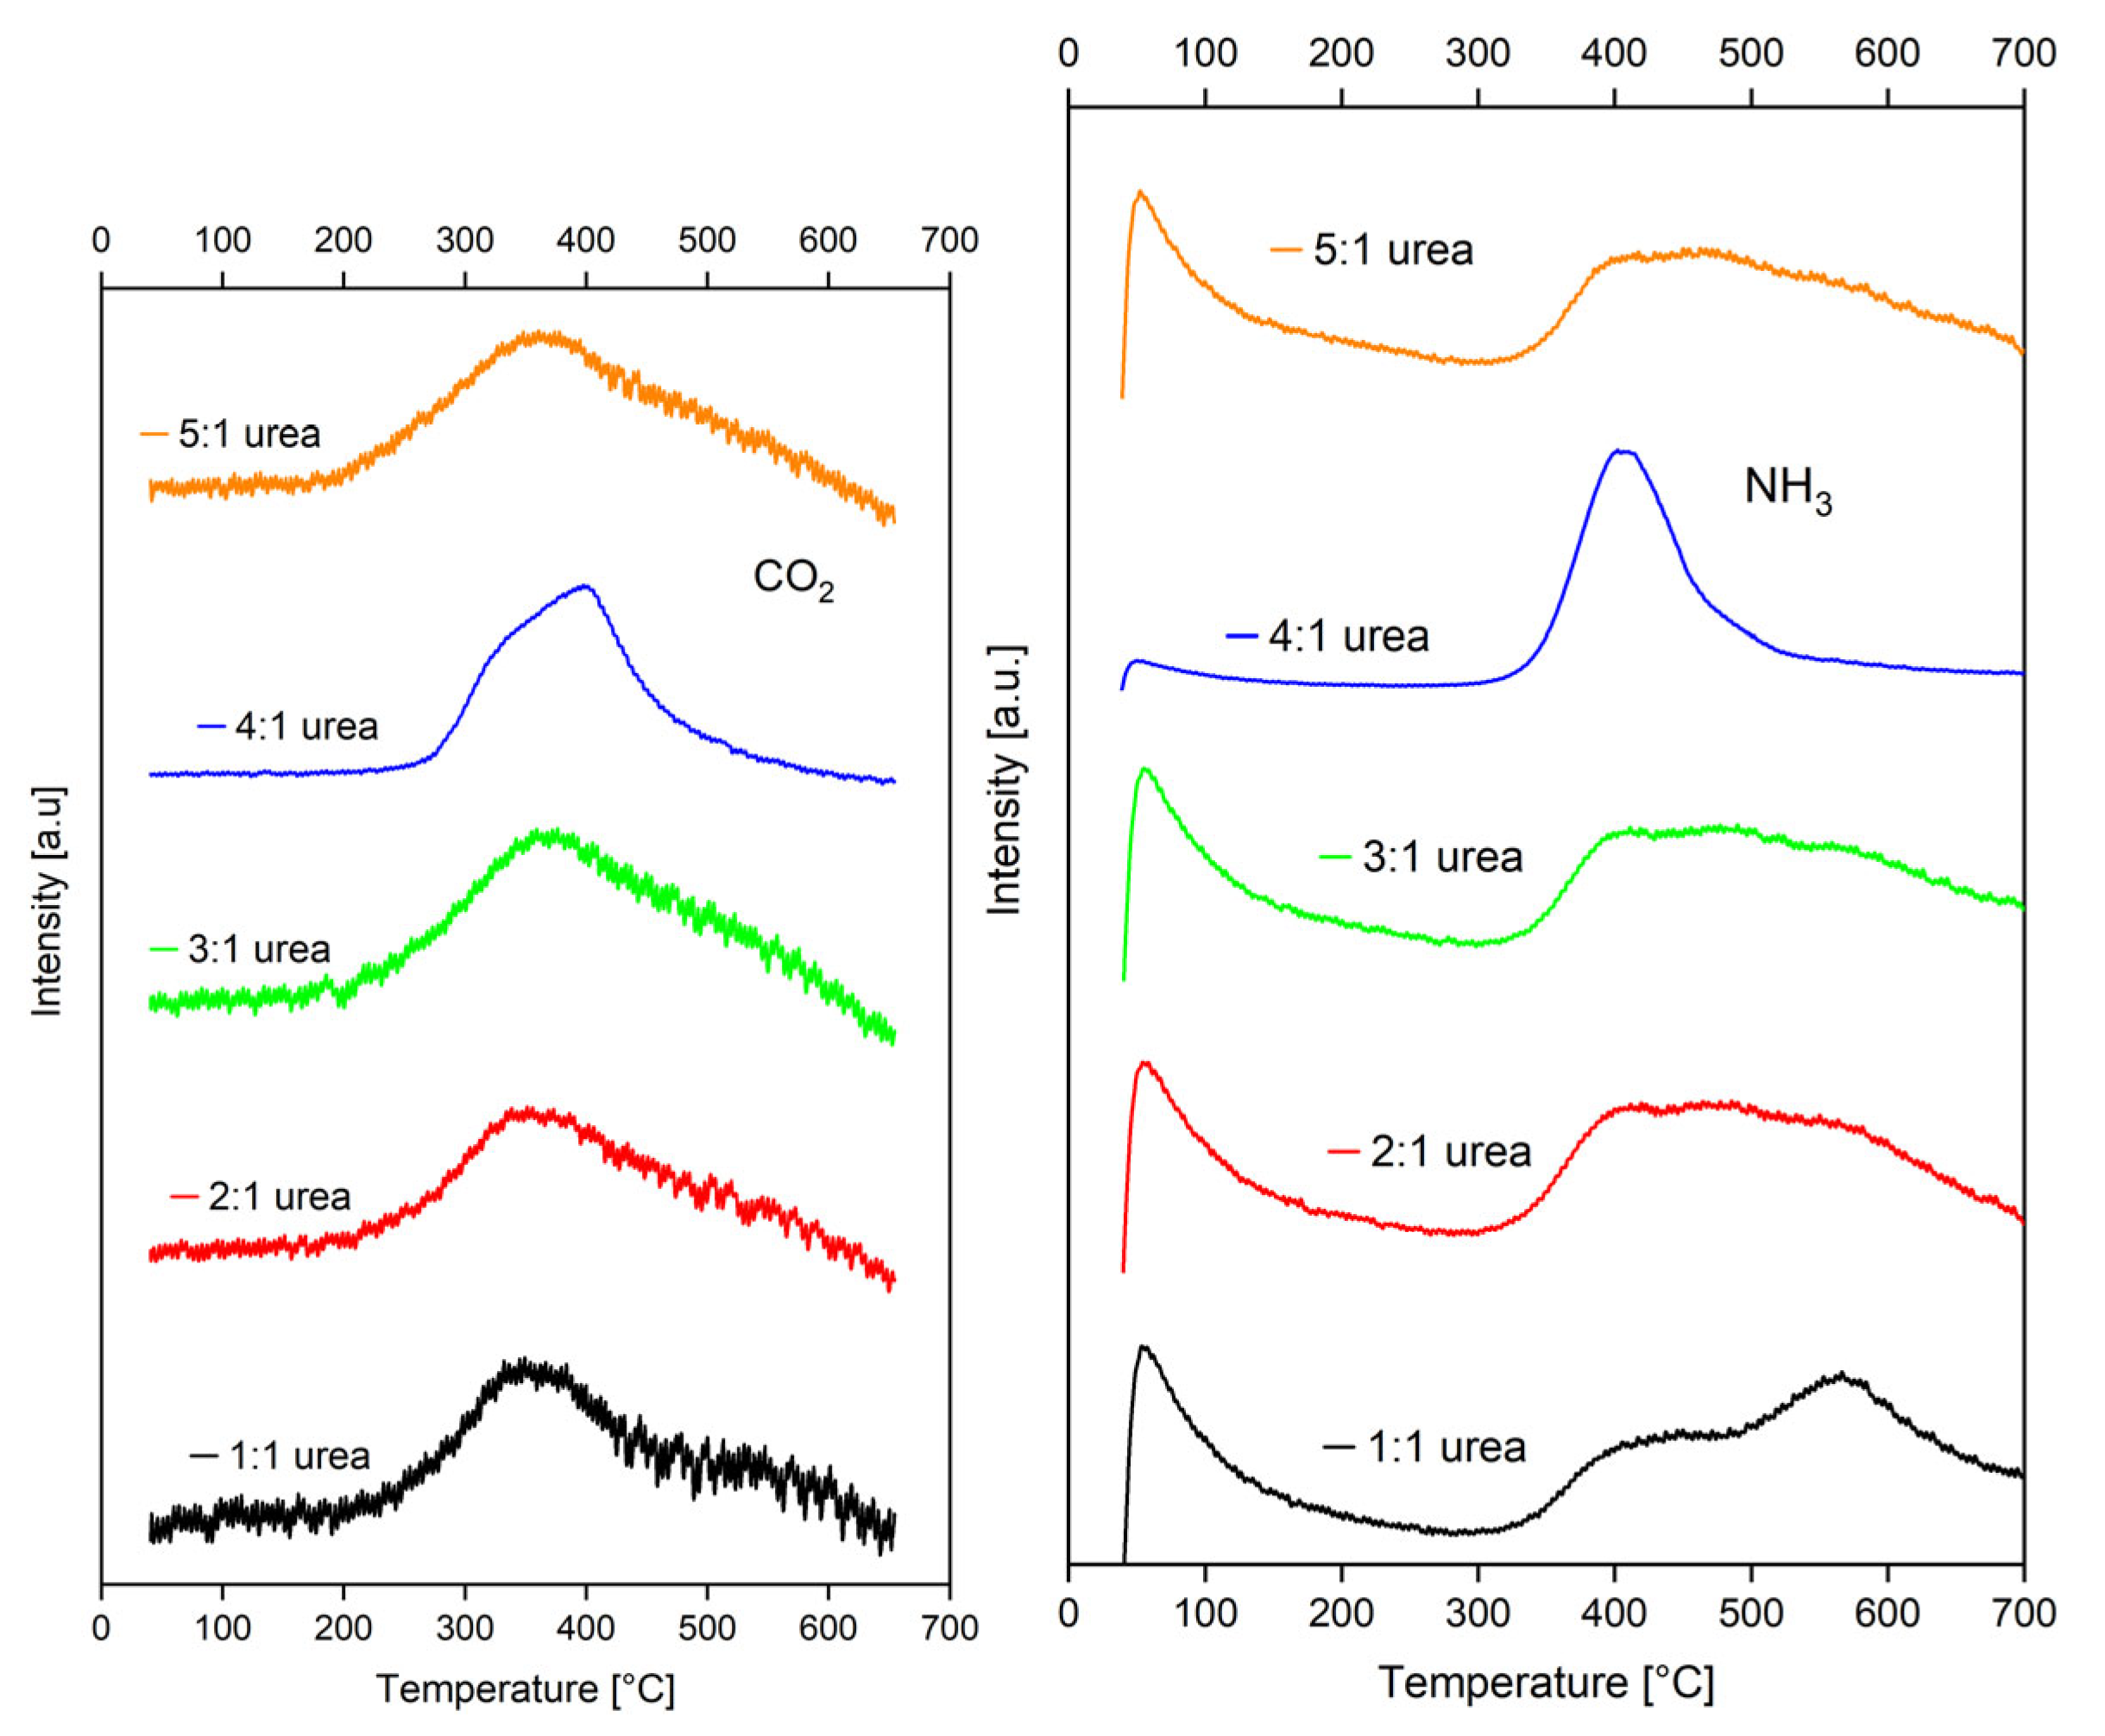
Figure 9.
XRD patterns of the five catalysts prepared via the urea-precipitation method, samples were calcined at 500 °C for four hours in N2 and reduced at 550 °C for five hours in 2 vol% H2 in N2, with the following measuring conditions: 2Ө = 5° to 99.995°, and Cu Kα-radiation (λ = 1.54060 Å)
Figure 9.
XRD patterns of the five catalysts prepared via the urea-precipitation method, samples were calcined at 500 °C for four hours in N2 and reduced at 550 °C for five hours in 2 vol% H2 in N2, with the following measuring conditions: 2Ө = 5° to 99.995°, and Cu Kα-radiation (λ = 1.54060 Å)
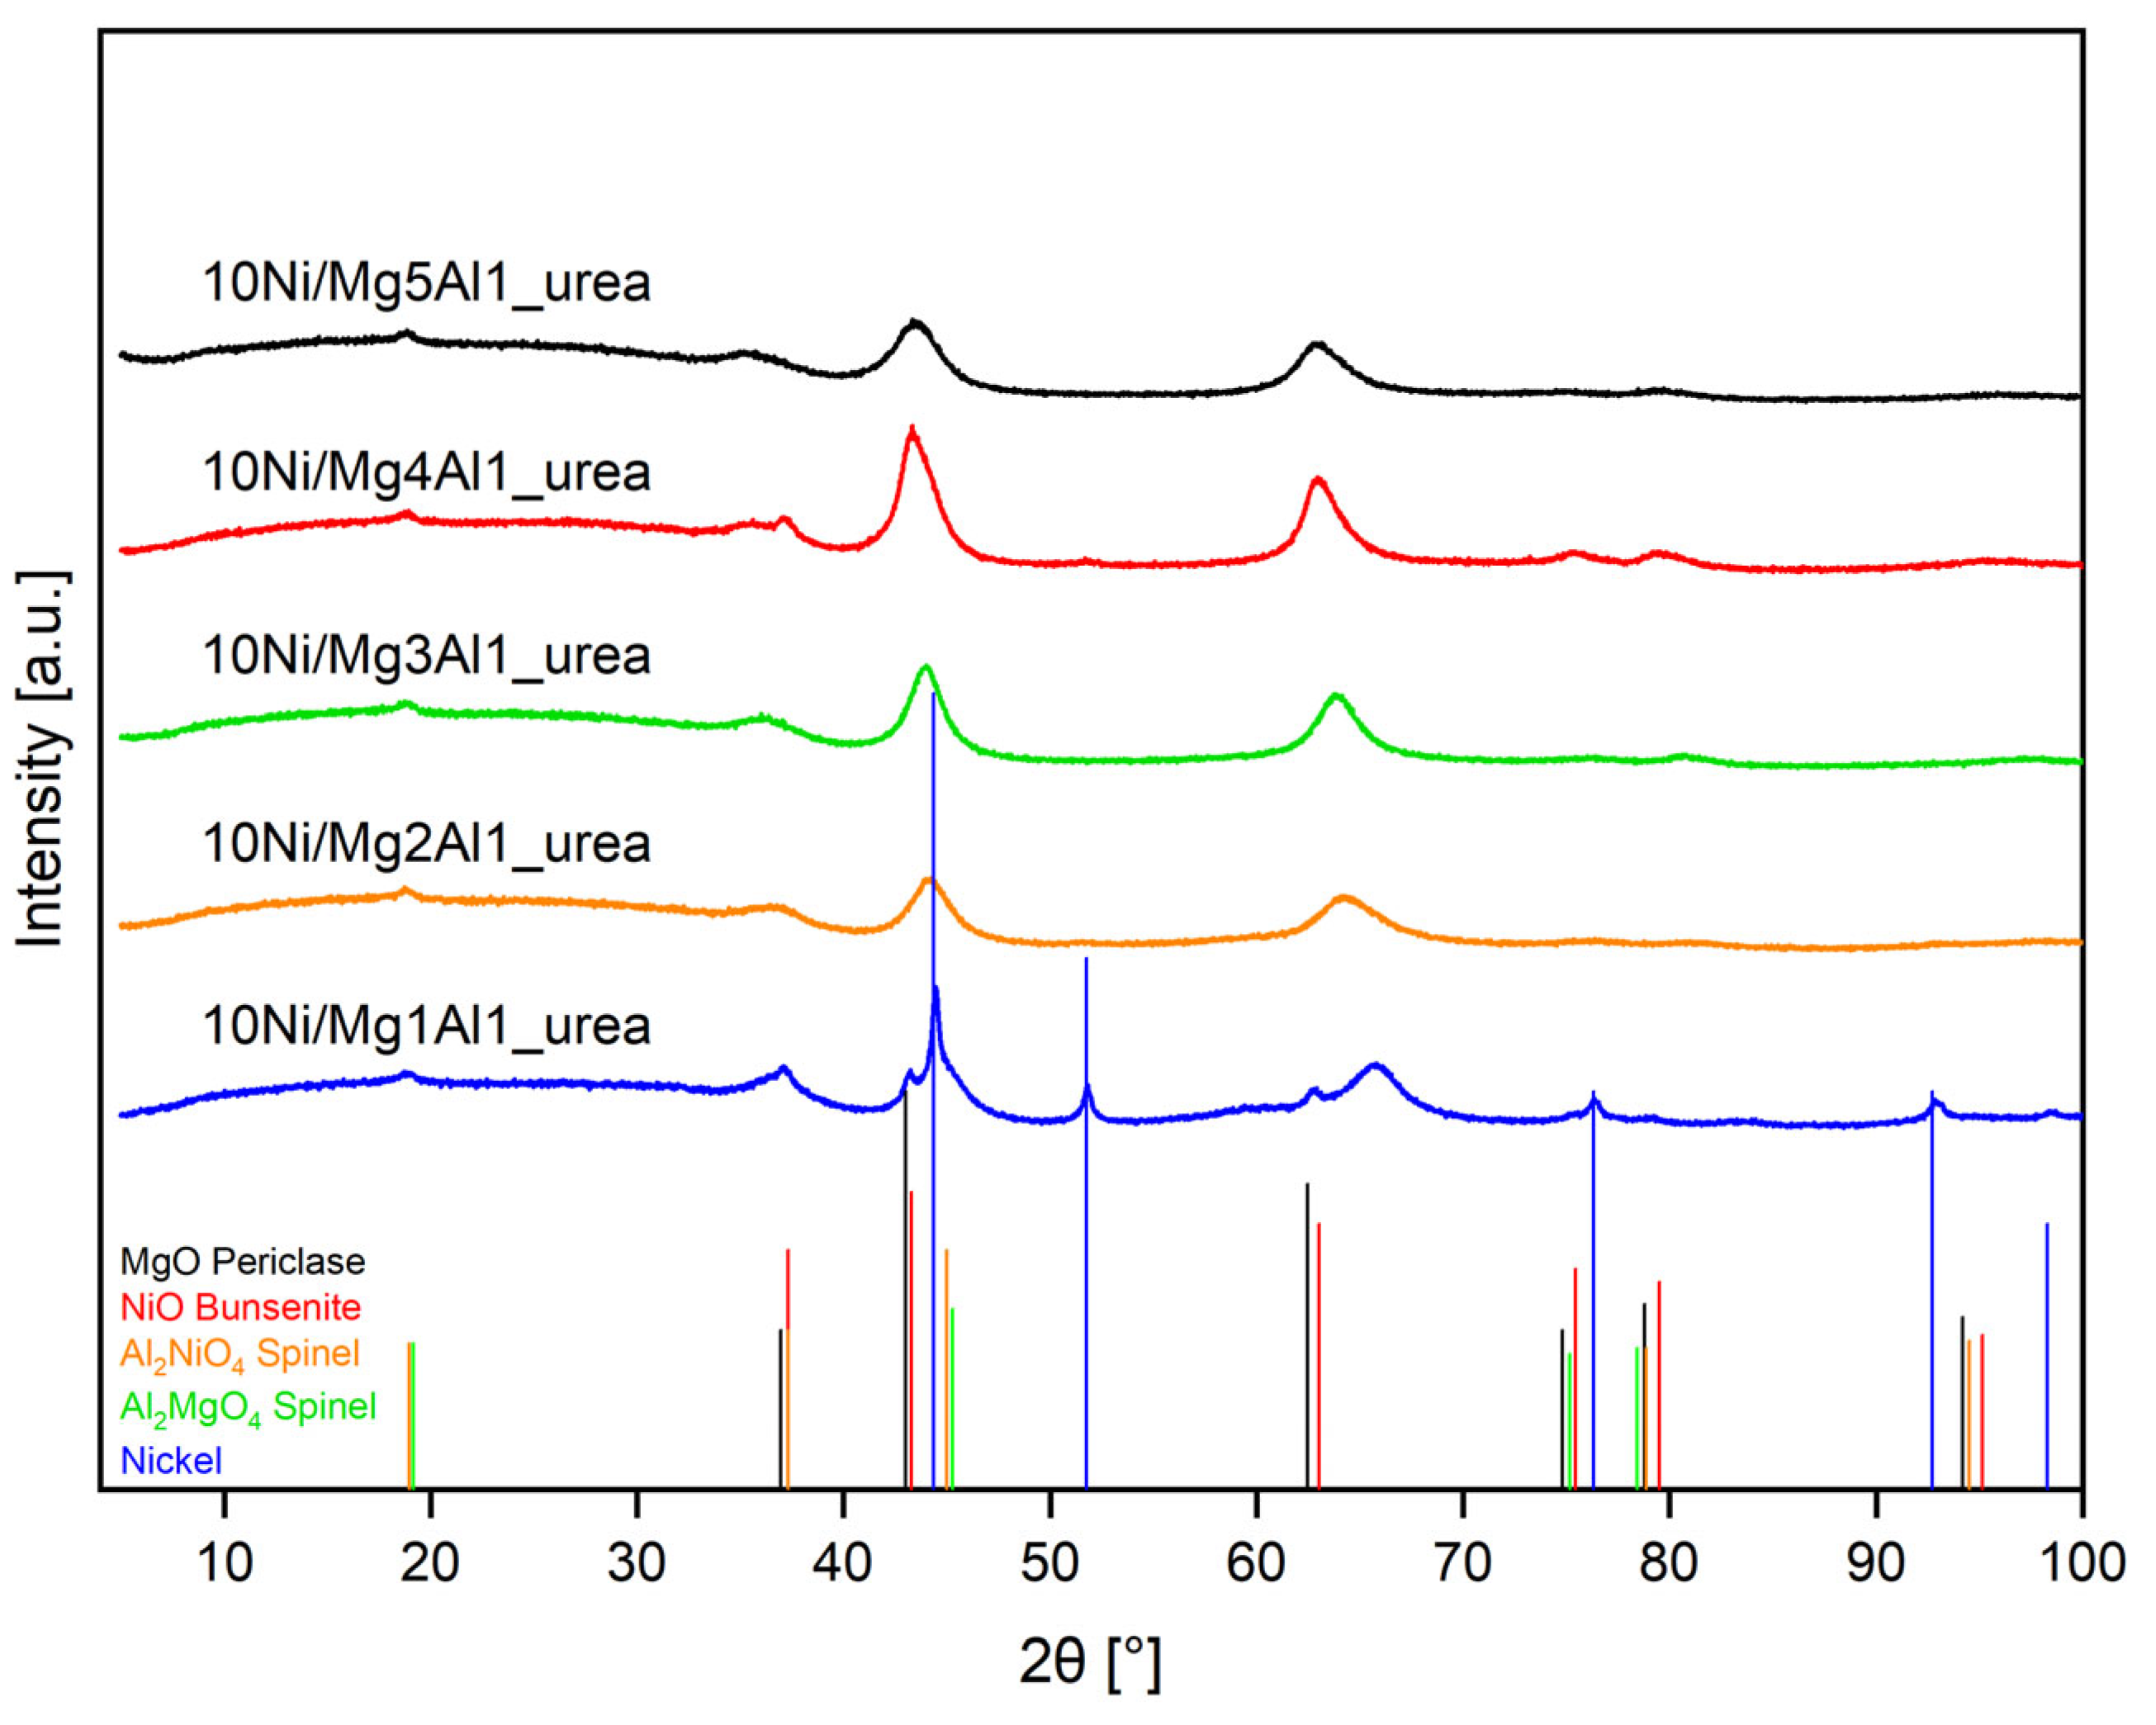
Figure 10.
Crystallite sizes of the five catalysts prepared via the urea method, samples were calcined at 500 °C for four hours in N2 and reduced at 550 °C for five hours in 2 vol% H2 in N2.
Figure 10.
Crystallite sizes of the five catalysts prepared via the urea method, samples were calcined at 500 °C for four hours in N2 and reduced at 550 °C for five hours in 2 vol% H2 in N2.
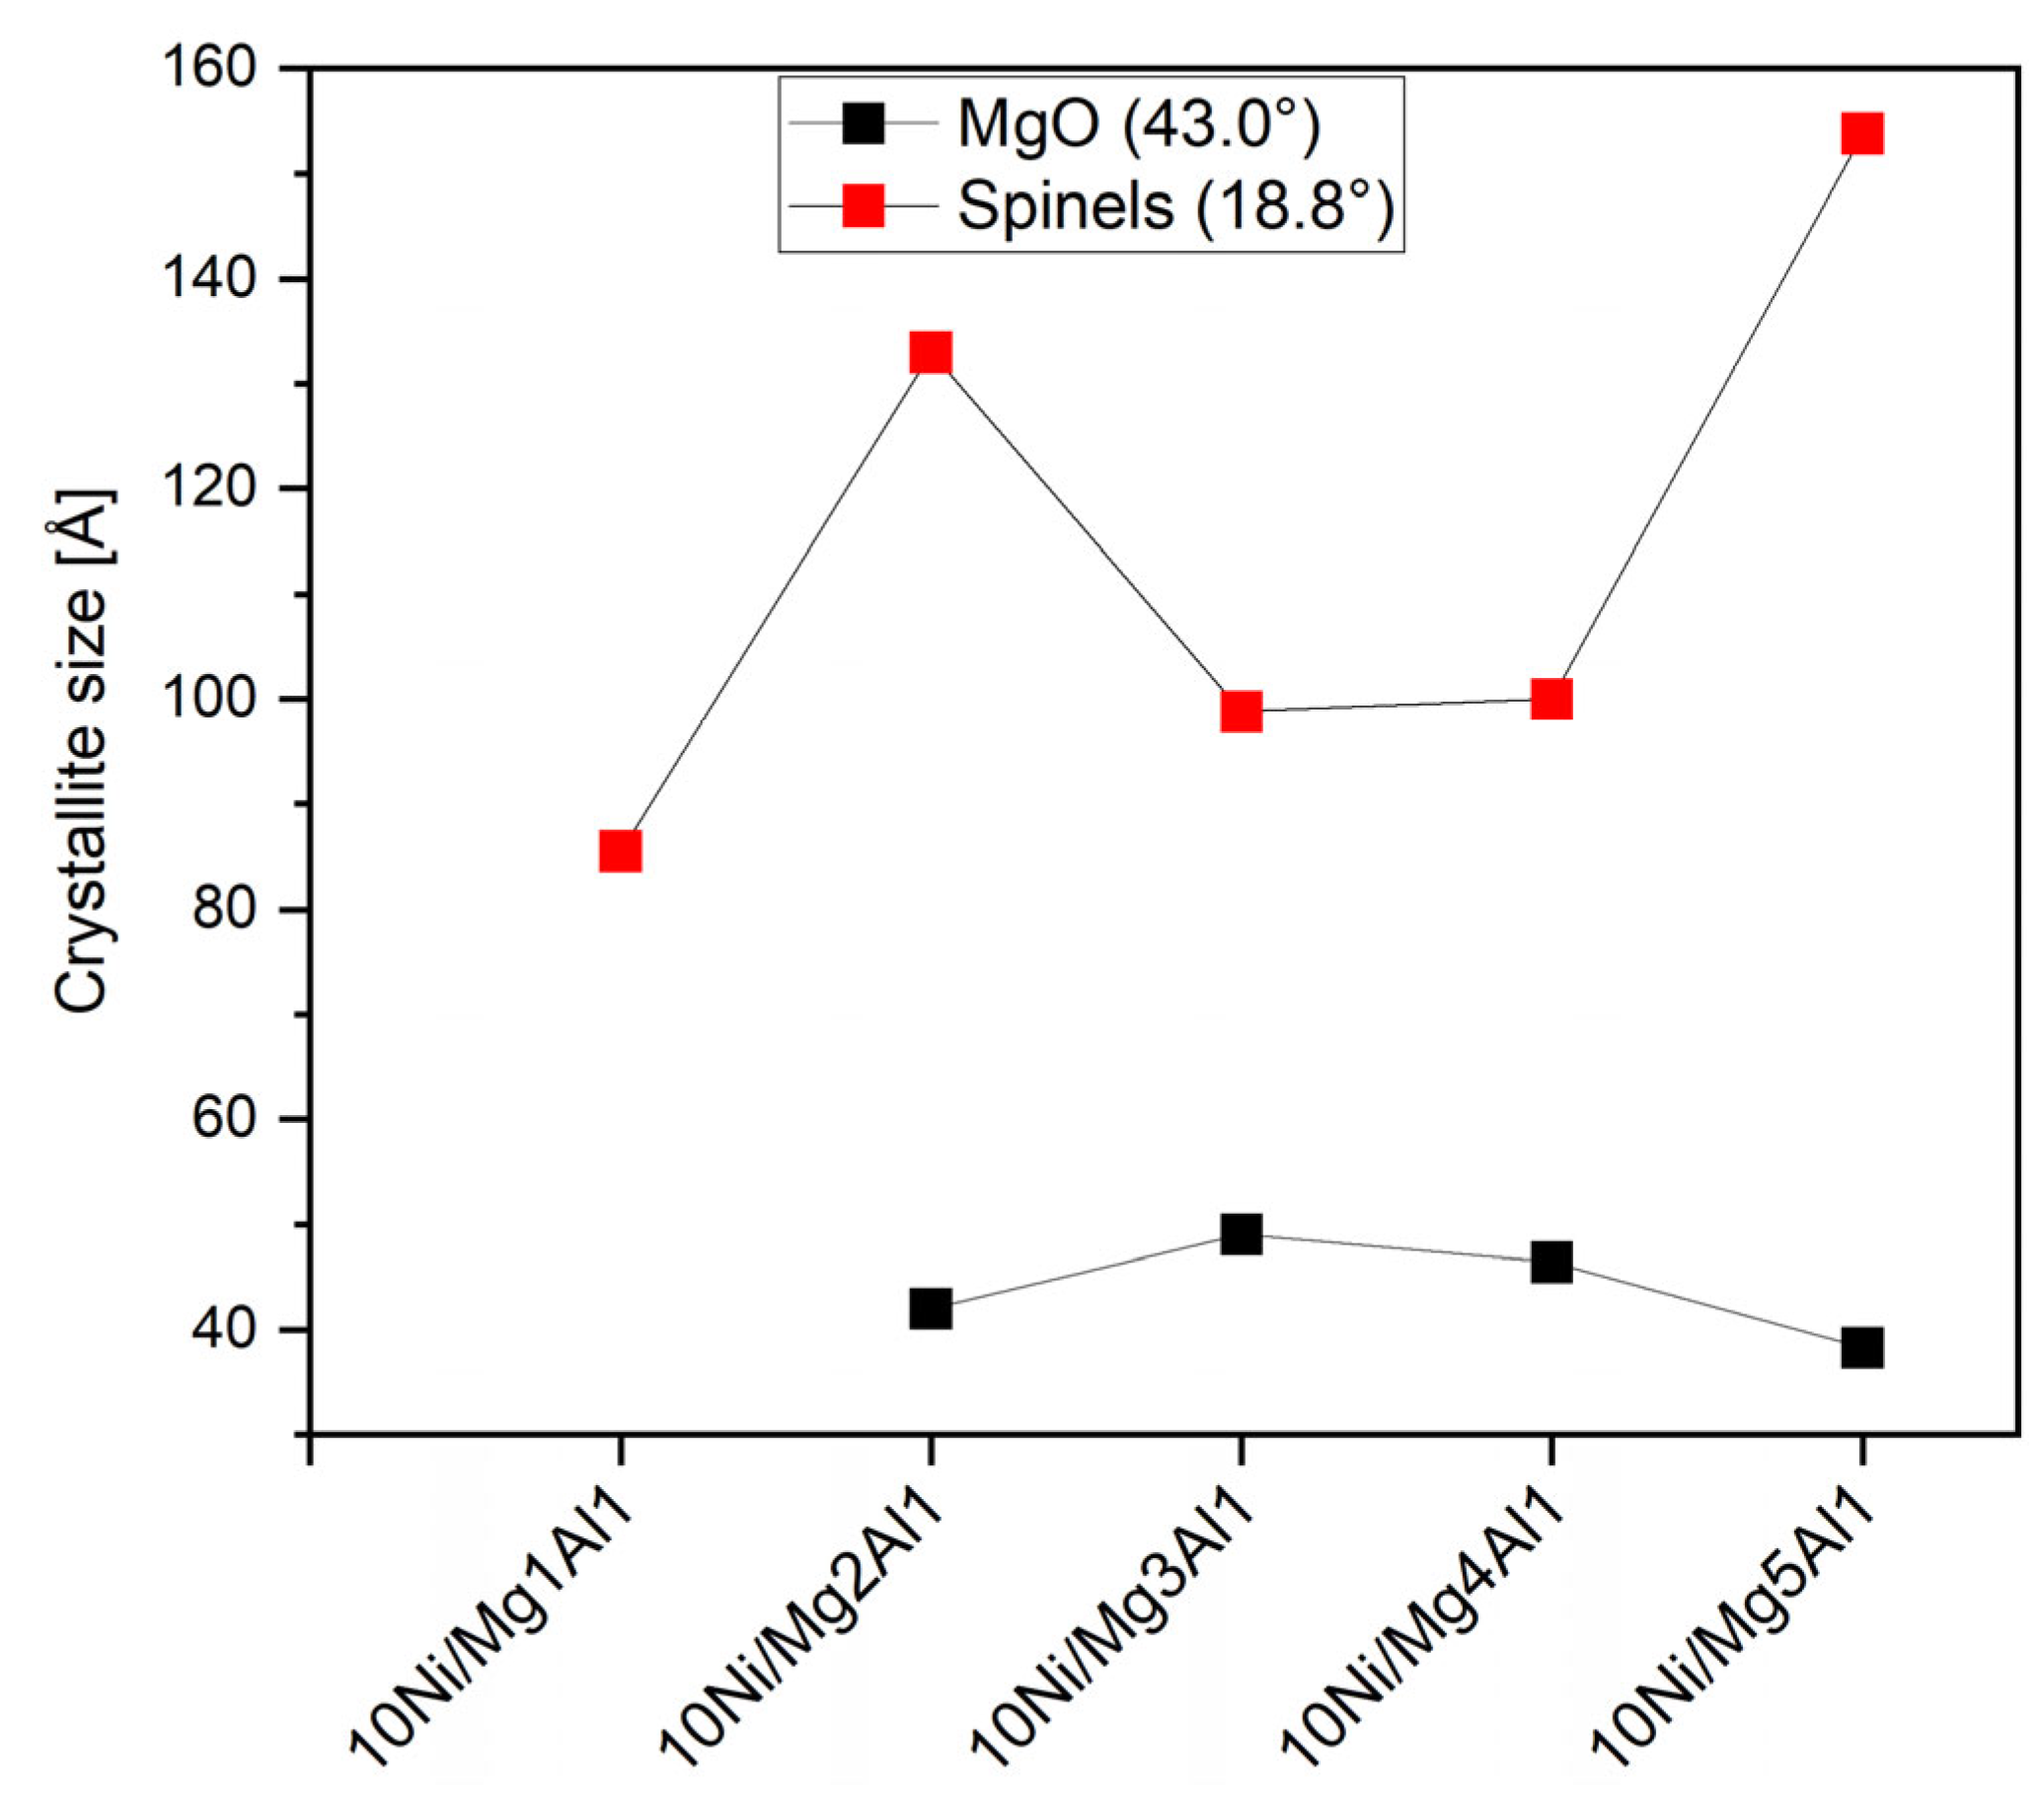
Figure 11.
SEM images of the catalyst 10Ni/Mg1Al1_urea at at magnifications of 2500 (left) and 10,000 (right).
Figure 11.
SEM images of the catalyst 10Ni/Mg1Al1_urea at at magnifications of 2500 (left) and 10,000 (right).
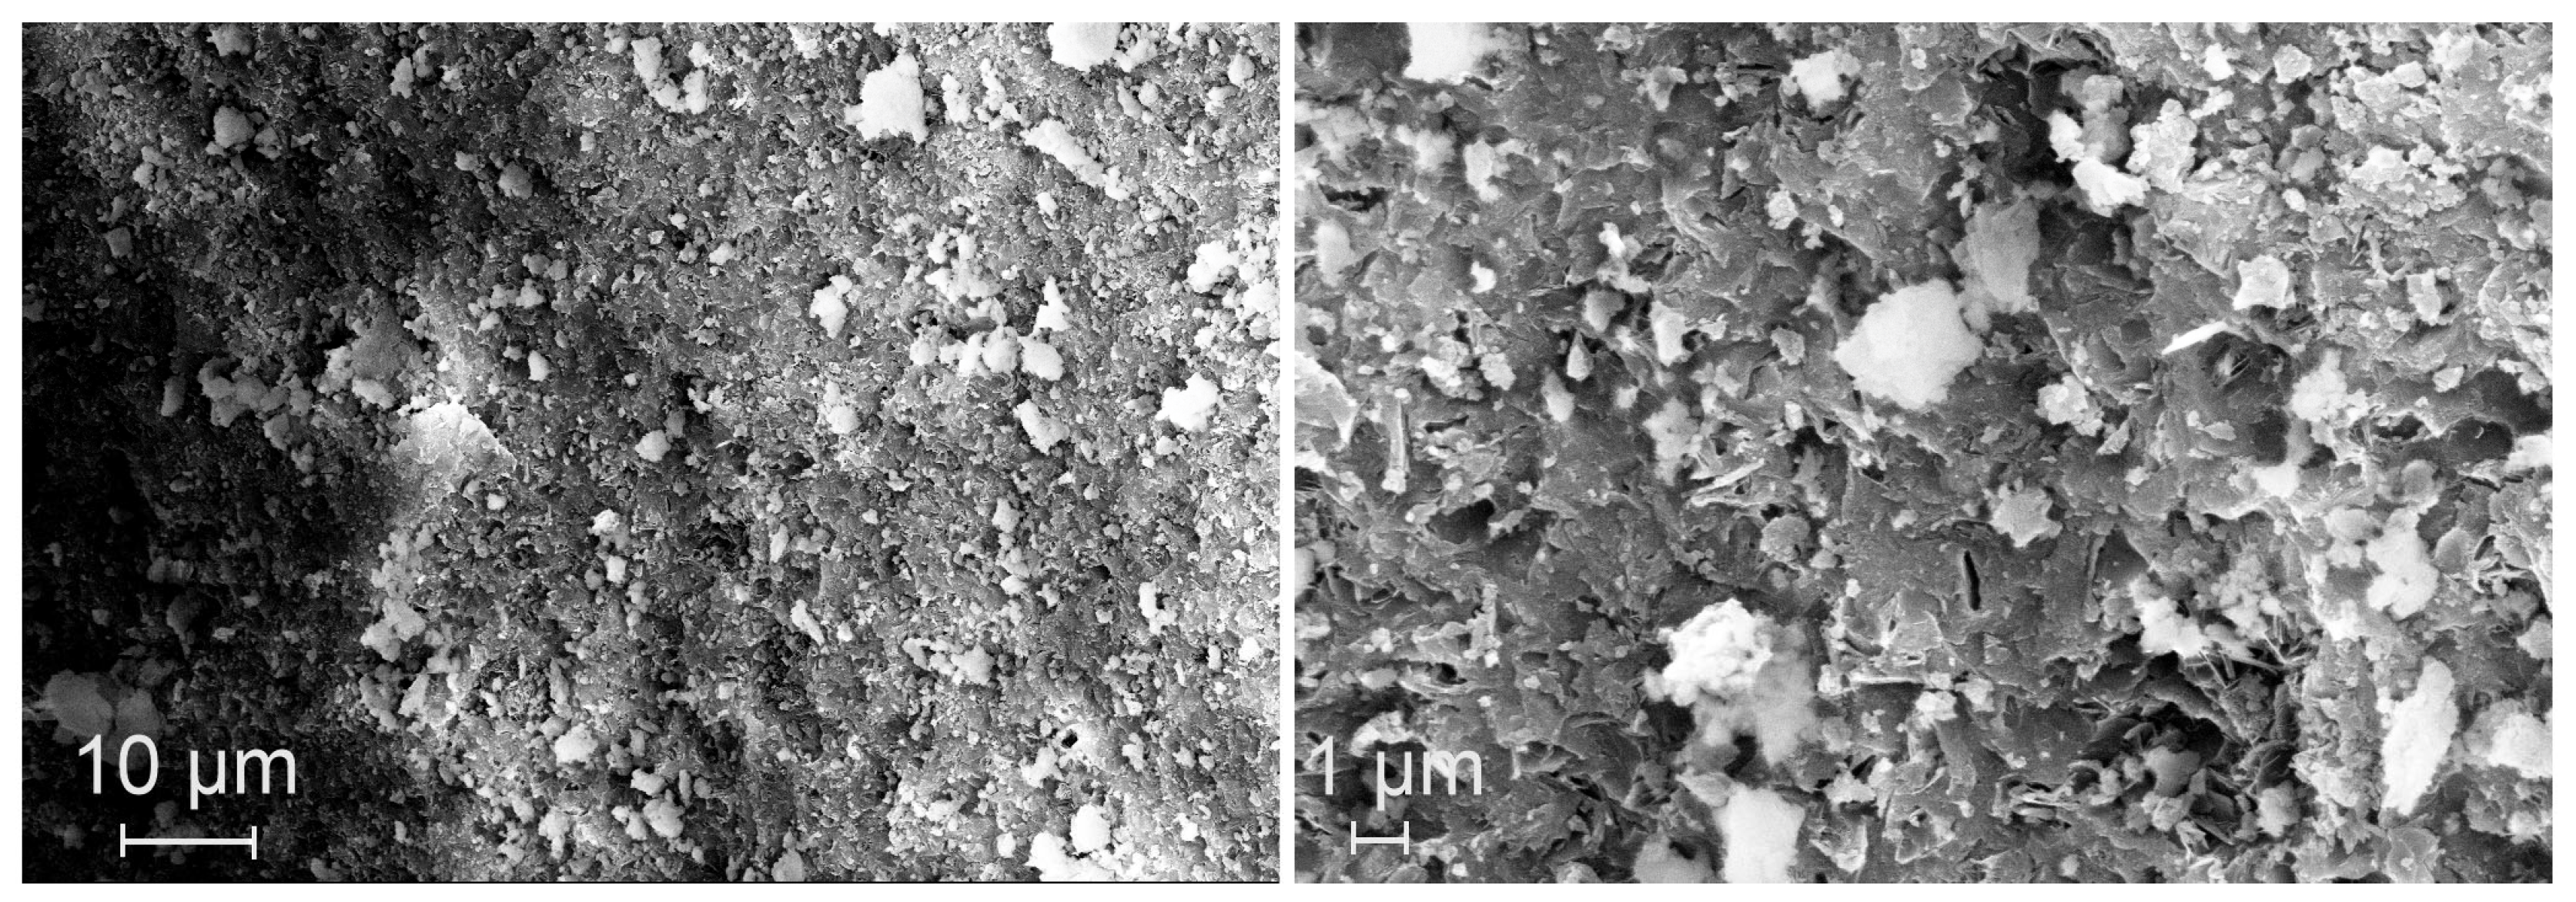
Figure 12.
Results of the catalytic tests at a reaction temperature of 185 °C with respect to the synthesis of iso-butanol with the five catalysts prepared via the urea method, m(catalyst) = 250 mg, d(powder) < 75 µm, V(reactor) = 70 ml, c0(EtOH) = 1600 mmol l-1, c(NaOH) = 450 mmol l-1, c(n-decane) = 15 mmol l-1, methanolic solution.
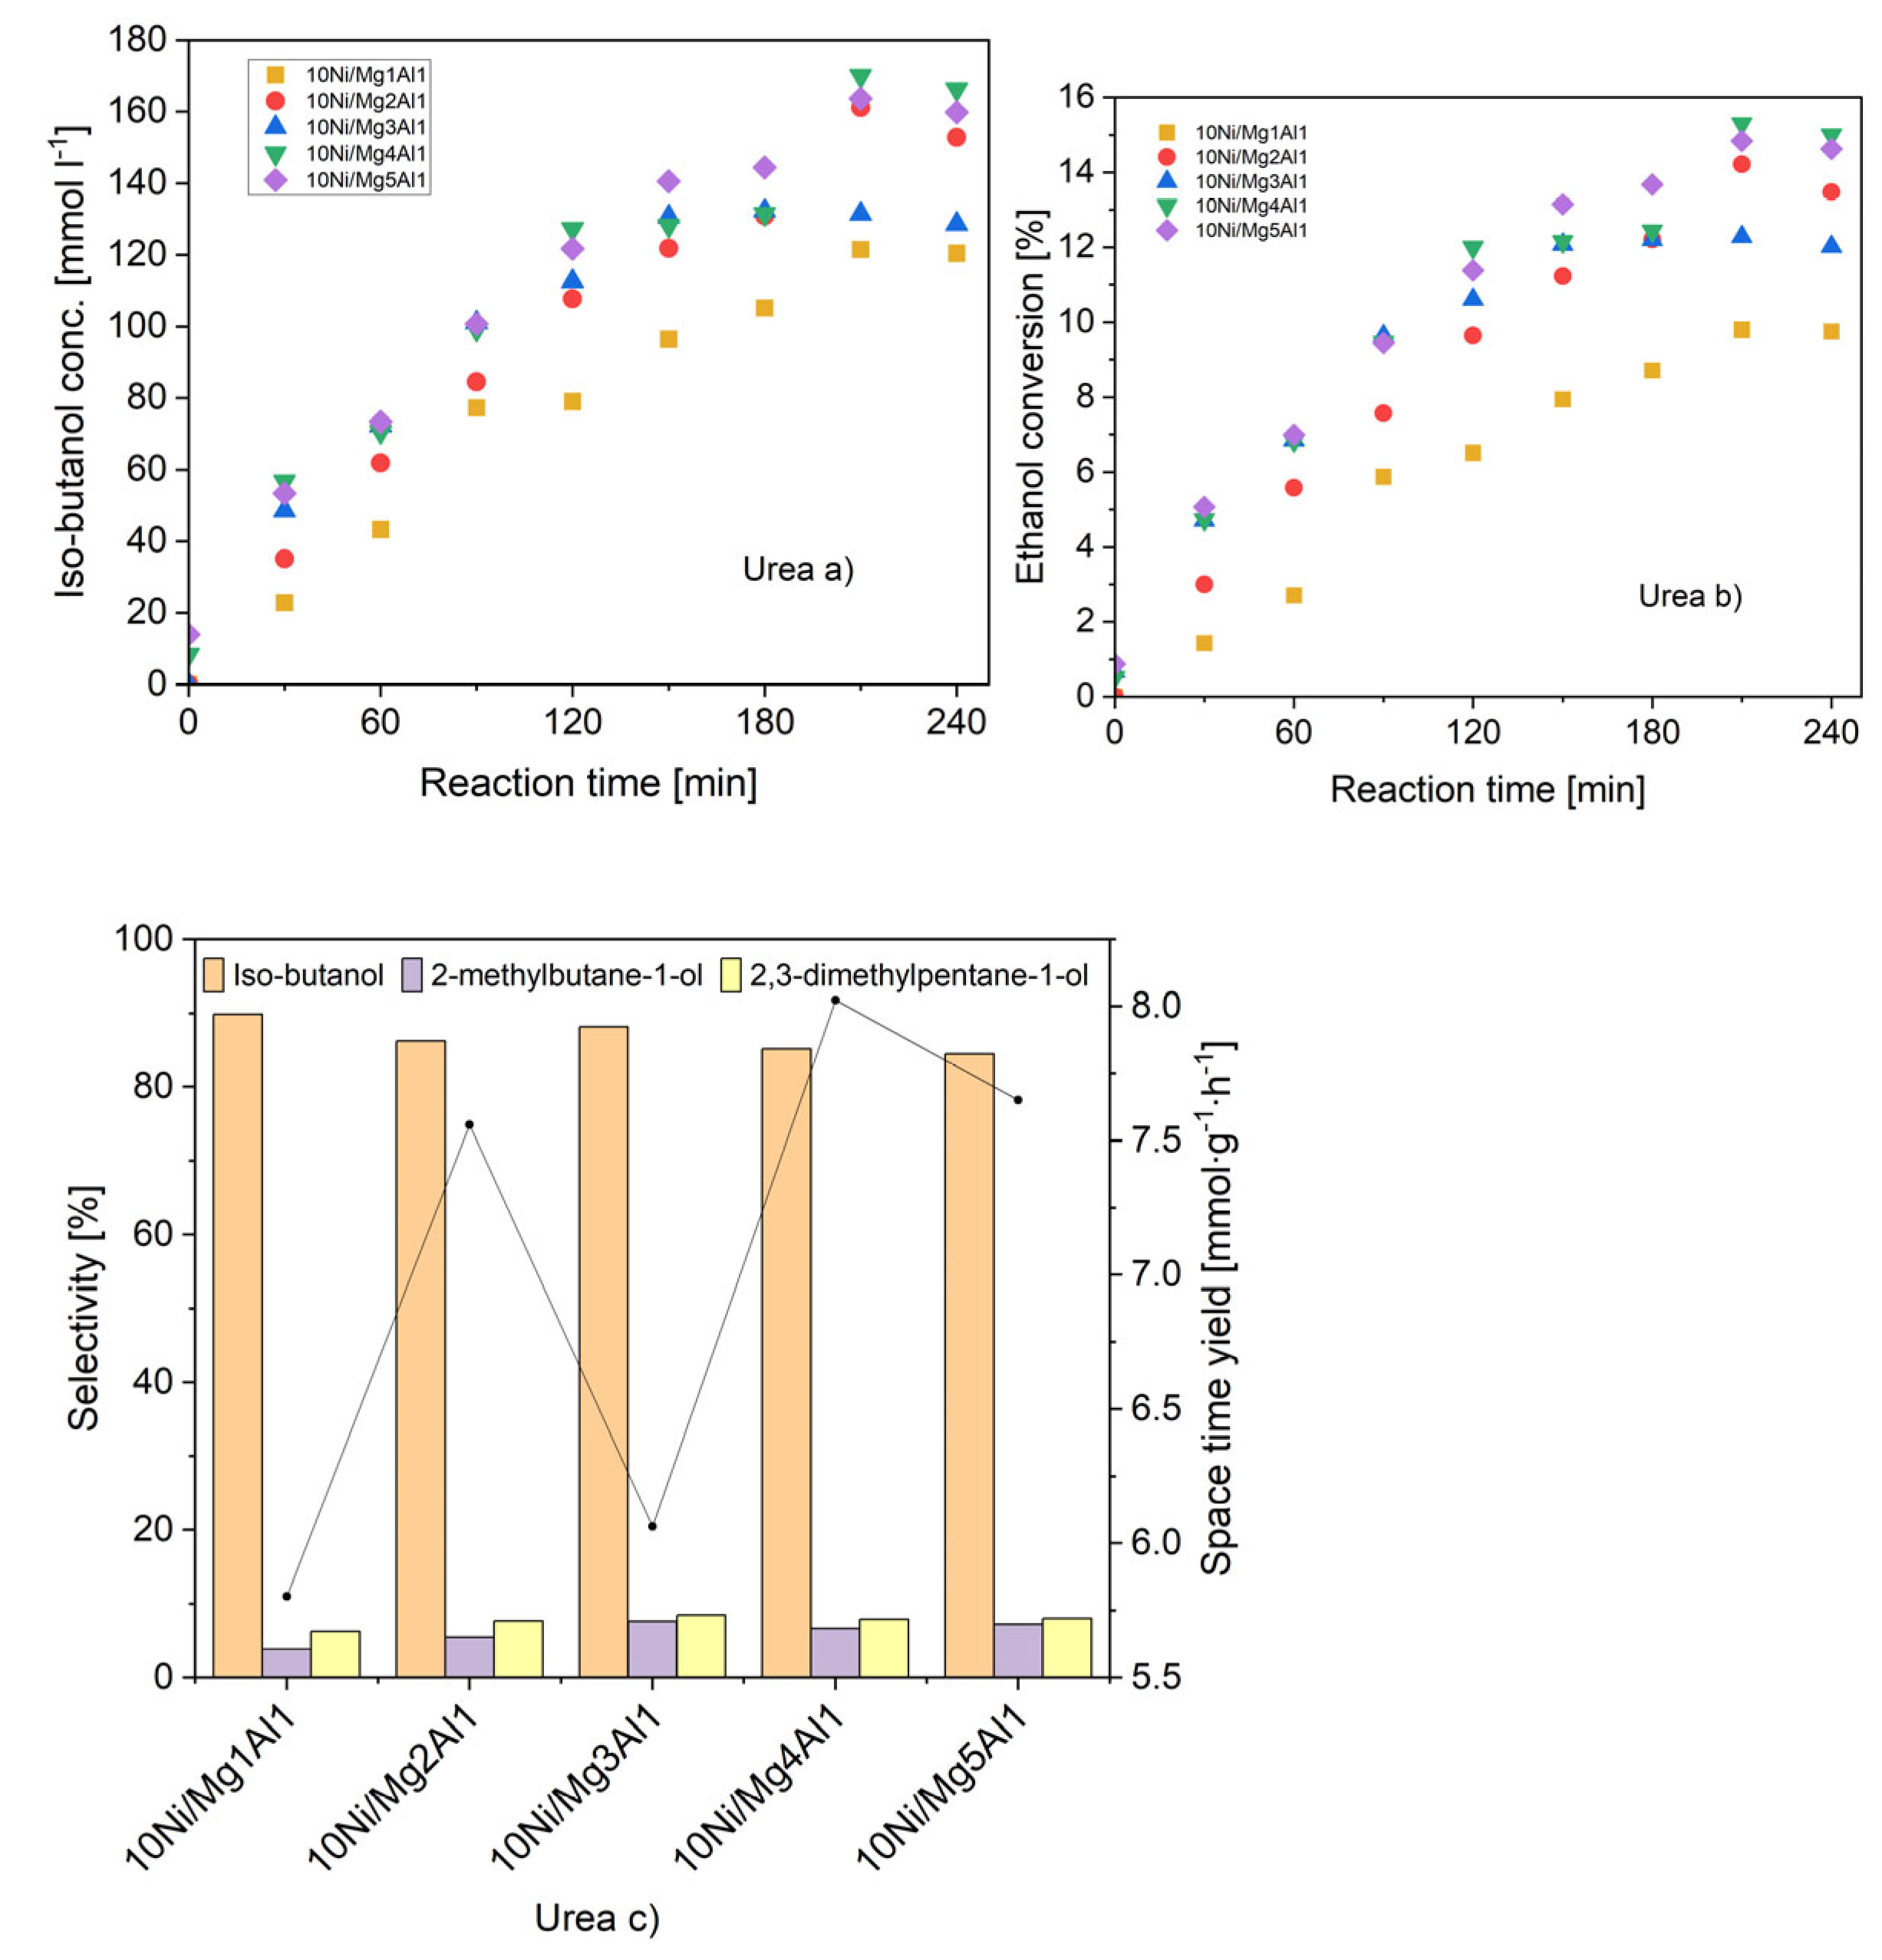

Table 1.
Percentage distribution of basic (from CO2-TPD) and acidic (from NH3-TPD) centers of different strengths on the five catalysts synthesized via the co-precipitation method
Table 1.
Percentage distribution of basic (from CO2-TPD) and acidic (from NH3-TPD) centers of different strengths on the five catalysts synthesized via the co-precipitation method
| Catalysts | Strong basic [%] |
Very strong basic [%] |
Weak acidic [%] |
Medium acidic [%] |
Strong acidic [%] |
|---|---|---|---|---|---|
| 10Ni/Mg1Al1_coprec | 83.3 | 16.7 | 28.5 | 19.0 | 52.5 |
| 10Ni/Mg2Al1_coprec | 65.8 | 34.2 | 32.5 | 4.8 | 62.7 |
| 10Ni/Mg3Al1_coprec | 72.3 | 27.7 | 28.2 | 1.7 | 70.1 |
| 10Ni/Mg4Al1_coprec | 79.0 | 21.0 | 26.9 | 6.7 | 66.4 |
| 10Ni/Mg5Al1_coprec | 100.0 | 0.0 | 33.1 | 7.9 | 58.9 |
Table 2.
Comparison of the Ni mass fractions and the molar ratios of Mg/Al (co-precipitation method) determined via: (i) ICP–OES measurements; and (ii) ciphered based on experimental quantities
Table 2.
Comparison of the Ni mass fractions and the molar ratios of Mg/Al (co-precipitation method) determined via: (i) ICP–OES measurements; and (ii) ciphered based on experimental quantities
| Catalysts | Ni mass fraction [wt%] ICP-OES calculated |
Molar ratios of Mg/Al [-] ICP-OES calculated |
||
|---|---|---|---|---|
| 10Ni/Mg1Al1_coprec | 9.20 ± 0.30 | 11.26 | 0.95 : 1 | 0.98 : 1 |
| 10Ni/Mg2Al1_coprec | 8.66 ± 0.11 | 11.15 | 1.97 : 1 | 2.00 : 1 |
| 10Ni/Mg3Al1_coprec | 8.85 ± 0.07 | 11.17 | 2.64 : 1 | 3.01 : 1 |
| 10Ni/Mg4Al1_coprec | 9.19 ± 0.05 | 11.48 | 3.03 : 1 | 4.00 : 1 |
| 10Ni/Mg5Al1_coprec | 9.76 ± 0.08 | 11.14 | 3.29 : 1 | 5.00 : 1 |
Table 3.
Results of the N2 sorption measurements with the five catalysts synthesized via the co-precipitation method.
Table 3.
Results of the N2 sorption measurements with the five catalysts synthesized via the co-precipitation method.
| Catalysts | Surface area [m2 g-1] |
Pore volume [cm3 g-1] |
Average pore size [Å] |
|---|---|---|---|
| 10Ni/Mg1Al1_coprec | 253.64 | 0.73 | 57.71 |
| 10Ni/Mg2Al1_coprec | 114.59 | 0.30 | 52.66 |
| 10Ni/Mg3Al1_coprec | 128.17 | 0.34 | 53.18 |
| 10Ni/Mg4Al1_coprec | 227.43 | 0.61 | 53.21 |
| 10Ni/Mg5Al1_coprec | 208.34 | 0.47 | 44.65 |
Table 4.
Percentage distribution of basic (from CO2-TPD) and acidic (from NH3-TPD) centers of different strengths on the five catalysts synthesized via the urea method
Table 4.
Percentage distribution of basic (from CO2-TPD) and acidic (from NH3-TPD) centers of different strengths on the five catalysts synthesized via the urea method
| Catalysts | Strong basic [%] |
Very strong basic [%] |
Weak acidic [%] |
Medium acidic [%] |
Strong acidic [%] |
|---|---|---|---|---|---|
| 10Ni/Mg1Al1_urea | 76.6 | 23.4 | 27.6 | 12.5 | 60.0 |
| 10Ni/Mg2Al1_urea | 100.00 | 0 | 27.8 | 18.6 | 53.5 |
| 10Ni/Mg3Al1_urea | 100.00 | 0 | 29.7 | 19.0 | 51.3 |
| 10Ni/Mg4Al1_urea | 100.00 | 0 | 1.7 | 98.3 | 0.0 |
| 10Ni/Mg5Al1_urea | 100.00 | 0 | 33.0 | 21.5 | 45.5 |
Table 5.
Comparison of the Ni mass fraction and the molar ratios of Mg/Al (urea method) determined via: (i) ICP–OES measurements; and (ii) ciphered based on experimental quantities
Table 5.
Comparison of the Ni mass fraction and the molar ratios of Mg/Al (urea method) determined via: (i) ICP–OES measurements; and (ii) ciphered based on experimental quantities
| Catalysts | Ni mass fraction [wt%] ICP-OES calculated |
Mg/Al molar ratios [-] ICP-OES calculated |
||
|---|---|---|---|---|
| 10Ni/Mg1Al1_urea | 8.96 ± 0.07 | 11.06 | 0.19 : 1 | 1.00 : 1 |
| 10Ni/Mg2Al1_urea | 8.60 ± 0.11 | 11.00 | 0.33 : 1 | 2.01 : 1 |
| 10Ni/Mg3Al1_urea | 10.24 ± 0.16 | 11.35 | 0.68 : 1 | 2.99 : 1 |
| 10Ni/Mg4Al1_urea | 14.48 ± 0.04 | 10.95 | 0.84 : 1 | 4.02 : 1 |
| 10Ni/Mg5Al1_urea | 10.40 ± 0.30 | 10.96 | 1.06 : 1 | 5.02 : 1 |
Table 6.
Results of the N2 sorption measurements with the five catalysts synthesized via the urea method.
Table 6.
Results of the N2 sorption measurements with the five catalysts synthesized via the urea method.
| Catalysts | Surface area [m2 g-1] |
Pore volume [cm3 g-1] |
Average pore size [Å] |
|---|---|---|---|
| 10Ni/Mg1Al1_urea | 186.5 | 0.42 | 45.3 |
| 10Ni/Mg2Al1_urea | 167.9 | 0.29 | 34.8 |
| 10Ni/Mg3Al1_urea | 245.0 | 0.31 | 25.1 |
| 10Ni/Mg4Al1_urea | 288.2 | 0.26 | 17.9 |
| 10Ni/Mg5Al1_urea | 210.7 | 0.24 | 22.9 |
Disclaimer/Publisher’s Note: The statements, opinions and data contained in all publications are solely those of the individual author(s) and contributor(s) and not of MDPI and/or the editor(s). MDPI and/or the editor(s) disclaim responsibility for any injury to people or property resulting from any ideas, methods, instructions or products referred to in the content. |
© 2026 by the authors. Licensee MDPI, Basel, Switzerland. This article is an open access article distributed under the terms and conditions of the Creative Commons Attribution (CC BY) license.
Copyright: This open access article is published under a Creative Commons CC BY 4.0 license, which permit the free download, distribution, and reuse, provided that the author and preprint are cited in any reuse.


