
Submitted:
22 January 2026
Posted:
09 February 2026
You are already at the latest version
Abstract
The rapid impacts of climate change call for urgent actions, such as a comprehensive flood risk assessment, to mitigate the increasing threat of flooding. In many tropical countries, like the Philippines, the most frequent disasters are caused by hydrometeorological events such as floods. This research study focuses on evaluating flood risk through the development of a Flood Risk Index and a Flood Risk Map (FRM), guided by the Hazard-Exposure-Vulnerability interpretation of risk. By incorporating the physical characteristics and frequency of flood hazards, the exposure of human populations and infrastructure, and their inherent vulnerabilities, the study aims to provide a detailed and actionable assessment of flood risk. The areas of interest in this study, Cebu City, Mandaue City, and Lapu-Lapu City, are the highly urbanized cities of Metro Cebu, which houses the critical economic and political infrastructures of the Province of Cebu. Flood risk indicators were identified for each dimension of risk, and the cities provided their performance score for each of the flood risk indicator as well as corresponding priority values. The composite flood risk index for Metro Cebu was generated using Rough-FUCOM method and Hamy Mean aggregator. On the other hand, the development of flood hazard maps was done using the values and weights of the spatial flood risk indicators. The spatial flood risk indicators were mapped into ArcGIS, reclassified into layers, and was then combined using a raster overlay function. The study found out that the highly urbanized cities of Metro Cebu have a moderate flood risk index. This means that Cebu City, Mandaue City, and Lapu-Lapu City have moderate susceptibility to flooding but considering the drastic changes to climate, the concerned LGUs should increase their efforts and efficiently allocate resources especially on constructing flood control structures on areas that are classified as high to very high-risk level, as indicated in the flood hazard maps.
Keywords:
flood risk
; FUCOM
; GIS
; rough sets
; flood risk index
; flood hazard maps
1. Introduction
Climate change has led to a rising occurrence of severe hydrometeorological incidents like extreme rainfall (Xu et al., 2022), and this is expected to elevate the frequency of powerful storms in the tropics (Mendelsohn et al., 2012). An immediate result of extreme rainfall, especially in urban contexts with intensive land use, is urban flooding (García-Soriano et al., 2020; Sharifi, 2019). Furthermore, in many tropical countries, like the Philippines, the most frequent disasters are caused by hydrometeorological events such as floods (Noy, 2009). This flooding situation results from interweaving elements of poor climate change mitigation approaches and socio-economic development (Nguyen et al., 2020). Over the last decades, there has been a notable rise in the frequency of flood occurrence, as well as an increase in the number of flood-related fatalities and the populations affected worldwide. This trend is mainly seen in countries with high population densities susceptible to tropical cyclones (Hu et al., 2018). Additionally, flooding annually results in significant economic damage in developing countries along the tropics (Alcántara-Ayala, 2002; Hu et al., 2018). Of all the natural disasters, floods have had the most substantial economic consequences globally in recent decades, leading to approximately $60 billion in losses in 2016 (Aerts et al., 2018). Unfortunately, the Philippines exhibits the situations and conditions that could aggravate the effects of climate change that are mentioned above.
To worsen this already grave situation, several studies about floods in the Philippines are working with incomplete data, which hinders them from holistically and accurately assessing the flood situation (Krumina, 2023; Saleem Ashraf et al., 2017). This problem of prevalent incomprehensive and low- resolution data related to hydrometeorology, topography, and land use in many developing countries, such as the Philippines, adds complexity to the decision-making processes, leading to increased uncertainty and inaccuracy in flood-related studies and resulting in suboptimal urban planning and flood management (Scott et al., 2013).
Cebu’s economic and cultural hub is Metro Cebu, particularly its highly urbanized cities: Cebu City, Mandaue City, and Lapu-Lapu City. These cities are dynamic and thriving urbanized areas home to urban developments, business opportunities, rich cultural heritage, natural resources, and tourist attractions. These cities also represent the economic center of the Visayas region, housing top firms and institutions in the education, healthcare, tourism, and recreation sectors (Sevilla, 2023). As a progressing center for commerce, manufacturing, and technology, they are also confronted with the continual challenges of flooding due to its coastal disposition and the concerning impacts of climate change. Over the years, Metro Cebu has experienced persistent flooding due to heavy precipitation, which could be beneficial in the contexts where water is necessary especially for agriculture and human use but could be destructive in urban contexts, leading to casualties and property damage. This ongoing issue has made it a significant focus for flood-related research that attempts to involve local authorities in formulating flood management efforts and strategies that will align with the findings (Dickella Gamaralalage et al., 2020; Eligue, 2023).
The first step in addressing a problem is to recognize and model its parameters. Diagnosing the problem is the first step in Schein’s Six Steps to Effective Problem-Solving, which includes the identification of the context and the background and symptoms of the issue (Schein, 2010). Similarly, identifying and quantifying the flood risk is paramount in addressing the issue to have a clear grasp of the flooding problem and to help communicate with the stakeholders regarding the importance and urgency of the issue. Flood risk assessment mainly aims to reduce the impact and losses in social, economic, health, and environmental aspects (IPCC, 2014). An evaluation of the flooding situation seeks to develop and establish technical and concrete guidelines for implementing different measures to reduce one or more of the risk dimensions: hazard, exposure, and vulnerability (Kron, 2005; Nirupama, 2012). Flood risks vary widely among countries facing comparable hazard frequency and severity degrees but with different exposure/vulnerability conditions (Nohrstedt et al., 2021). Up to date, there are four known types of approaches used for assessing the flood risk of a region: the index system method (Christie et al., 2018), the historical disaster statistics method (Halgamuge & Nirmalathas, 2017), scenario simulation analysis (Alfieri et al., 2015) and the use of geographic information systems (GIS)-based approaches (Gigović et al., 2017). The index method is a favorable method that can consider all potential aspects of flood risk, and it is commonly paired with a GIS-based tool that could further support the spatial and temporal aspects of flood risk. Several papers have used these two approaches simultaneously or in support of each other, producing holistic and target-oriented results and recommendations to resolve flooding issues (de Moel et al., 2015; Santos et al., 2020). The challenges of deriving a flood risk index are discussed thoroughly in the domain literature as it first deals with identifying and selecting indicators that could fully gauge a region’s susceptibility to flood. This is primarily because flood risk varies with a region’s terrain, climate, and characteristics. The gap in the literature regarding flood risk indices is the lack of a universal set of flood risk indicators.
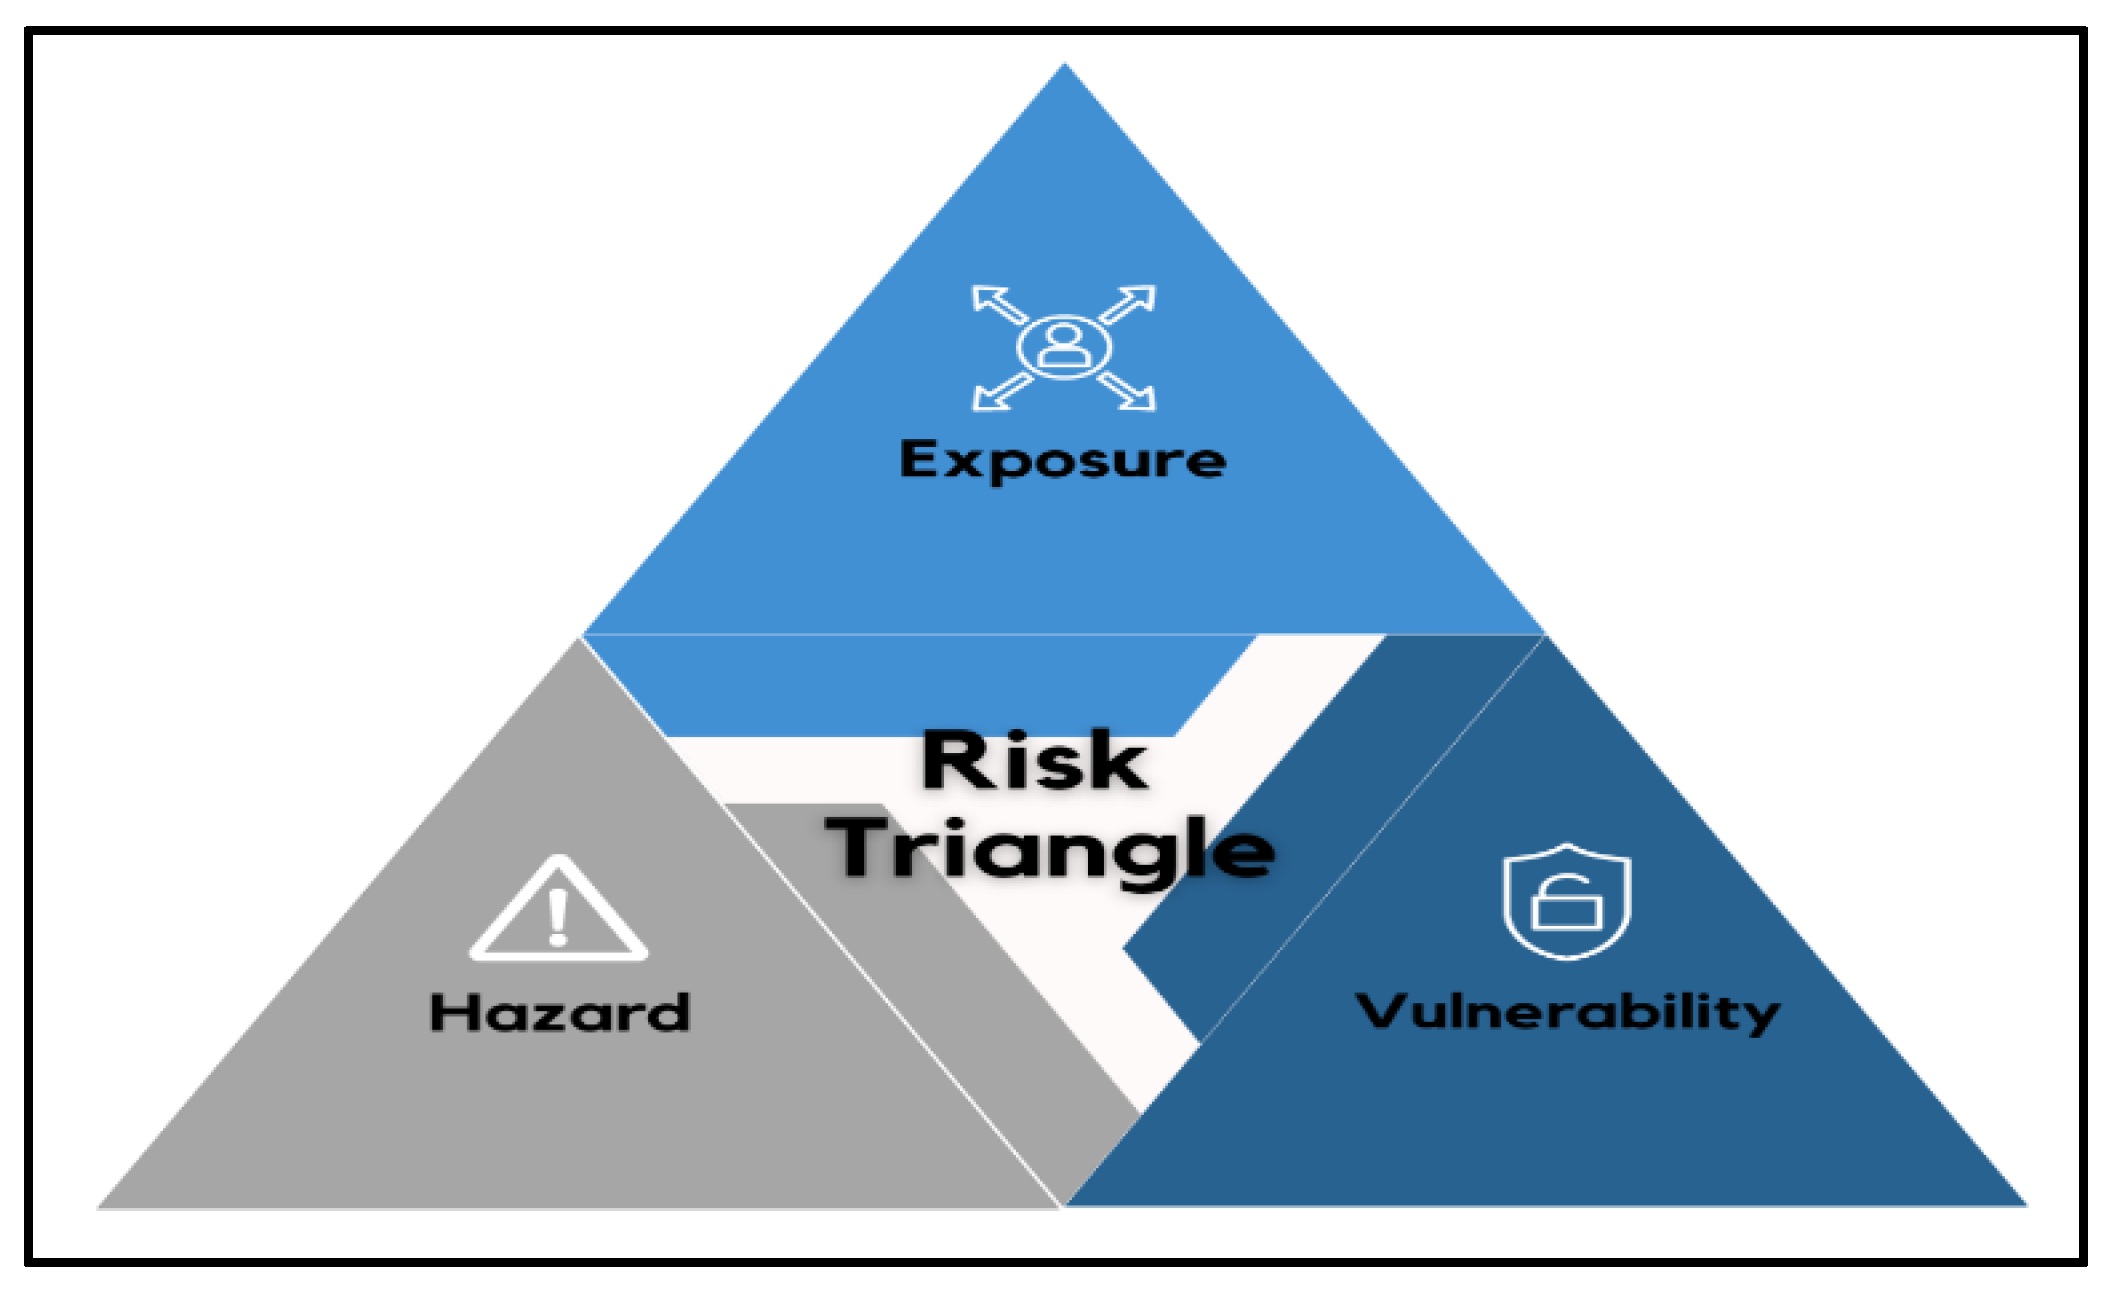
To identify the appropriate set of flood risk indicators that could holistically capture a region’s susceptibility, one must first understand the multifaceted nature of risk and its concept. David Crichton proposed the concept of a Risk Triangle, introducing the three risk dimensions: hazard, exposure, and vulnerability. To briefly describe, the hazard dimension considers the frequency and severity of a hazardous event; the exposure dimension, on the other hand, is concerned with the properties of the hazardous event, for instance, its value and location; and the vulnerability dimension represents the predisposition of the area of a system to be adversely affected by the impacts of a hazardous event. Furthermore, it reflects the area’s sensitivity to the potential harm. This concept became the basis for the Hazard-Exposure-Vulnerability (HEV) framework for risk assessment established by Cutter et al. (2013). An increasing number of studies have utilized the HEV model for risk assessment to assess hazards and obtain an accurate basis for resource allocation (Bin et al., 2023; Hoque et al., 2019; Lyu et al., 2020; Nguyen et al., 2019) which could help the proper authorities on what areas they could focus their efforts to formulate optimal solutions. This paper aims to encompass all dimensions of risk in order to generate a flood risk index that is reliable and holistic. To achieve this objective, an HEV risk assessment model is used as the foundation for identifying and selecting flood risk indicators in the available domain literature.
In advancing this paper’s agenda, assigning priority weights to the indicators is essential in a structured decision-making process. This ensures objectivity as different priorities and trade-offs are considered among these flood risk indicators. The Full Consistency Method (FUCOM) is a multi-attribute decision-making tool introduced by Pamučar et al. (2018) that uses an optimization model to determine the importance of weights. This method improves the analytic hierarchy process (AHP) by eliminating the burden of repetitive elicitation of judgments. FUCOM has proven its efficacy in numerous studies related to disaster risk management and analysis (Alam & Ali, 2023; Öcül et al., 2022). Furthermore, the quantification of the flood risk in the HUCs of Metro Cebu introduces the elements of uncertainty and vagueness as the researcher of this study anticipated an insufficiency of information due to a prominent, existing issue of limited data, as demonstrated by previous studies about flood risk assessment (Li et al., 2012; Monrat et al., 2018; Cabrera & Lee, 2018). The incompleteness can be attributed to a lack of equipment and devices to collect the flood markers’ data and a lack of trained personnel to conduct measurements and maintenance. To address these challenges in the computation of flood risk, the rough set theory, first introduced by Pawlak and Slowinski (2001), is well-suited to handle uncertainty and vagueness of the data for the flood risk indicators. Rough set theory has had its fair share of successful applications to various disciplines, such as machine learning (Hu et al., 2021), decision analysis and support (Sun et al., 2016); sustainability (Cinelli et al., 2019); public health (Moheimani et al., 2022); and disaster analysis (Li et al., 2020; Peng et al., 2014; Rajesh et al., 2019). In support of the flood risk index that will be generated, a flood risk map, specifically a flood hazard map, will also be developed to provide a spatial distribution of the flood risk on the areas of interest (Merz et al., 2007). They will be valuable in highlighting problem areas and presenting the flood situation to convene immediate but careful observations or cross- examinations while evaluating flood management policies or interventions. Hence, this paper will integrate the rough set theory with FUCOM to generate a flood risk index that could effectively gauge Metro Cebu’s susceptibility to flooding and produce a flood hazard map utilizing the geographical flood risk indicators to support the flood risk index.
Therefore, the objectives of this paper were threefold: (1) flood risk indicators based on the HEV model of risk assessment were identified and a computational framework that could holistically gauge the flood risk in Metro Cebu was developed, (2) Metro Cebu’s susceptibility to flooding via a composite flood risk index was determined, along with its performance for each risk dimension, and a flood hazard map for each of the cities, (3) came up with an evidence-based analysis and recommendations that could be valuable to the local government in remedying the flood situation of the highly-urbanized cities of Metro Cebu.
2. Literature Review
Figure 1.
David Crichton's Risk Triangle (Crichton, 1999).
2.1. Hazard-Exposure-Vulnerability (HEV) Model of Risk Assessment
The HEV model of risk assessment is a framework derived from the Crichton Risk Triangle concept, which defines risk as a combination of three risk dimensions: hazard, exposure, and vulnerability. A significant number of studies apply the HEV model of risk assessment to various types of hazardous events like tropical cyclones (Yang et al., 2022), droughts (Dilawar et al., 2022; Prabnakorn et al., 2019; Liu & Chen, 2021), glacial lake outburst flood (Rinzin et al., 2023), and flood (Bin et al., 2023; Gain et al., 2015; Pham et al., 2021; Hadipour et al., 2020). Considering all three risk dimensions when assessing a flood risk would put forward specific areas that could be the focus of the resource allocation. Furthermore, a handful of HEV-based risk assessment studies define the hazard risk element as a further description of the valuation of a hazardous event (e.g., flood depth, number of typhoons), which one could argue is a measure of severity. However, in this paper, the hazard risk dimension is characterized by its recorded data of damages and historical impacts with the most recent devastating flood event in mind as a reference point. Meanwhile, the exposure risk dimension is interpreted as a flood event's geographical and hydrometeorological factors. This is basically for describing what makes a region susceptible to flooding in terms of its predisposition. The vulnerability risk dimension comprises the socioeconomic factors and the mitigation measures that recent studies have proven essential.
2.2. Flood Risk Indicators for Hazard Risk Dimension
Hazard as a risk dimension is defined as the chance of flood occurrence and its severity. A handful of studies described the hazard risk dimension as an attribute of a flood hazard event. In the study of Koks et al. (2015), they defined the hazard risk dimension as a probability function, and they utilized a flood hazard map, highlighting regions that are most likely to have a flood event, given the conditions. Another study treated the hazard risk dimension as an interplay of probability and intensity of referenced glacial lake outburst flood events (Rinzin et al., 2023).
2.2.1. Casualty
Tyler et al. (2019) describes this flood risk indicator as the number of historical deaths consequent to flood events. In the study by Ikram et al. (2023), the indicator under the hazard risk dimension is the 25 year return flood data, which implies the severity and frequency of a flood event. This is aligned with Crichton’s definition of the hazard risk element. The measurement of this flood risk indicator involves calculating the average number of fatalities attributed to floods over the past five years. The distribution of the number of fatalities in the 5-point Likert scale is based on Lee & Vink’s (2015) report about the vulnerability of age groups regarding flood fatalities, to which their study revealed 122 flood fatalities in the Philippines from 2010 - 2013.
2.2.2. Economic Damage
According to Zeng et al. (2019), economic damage is the economic impact, including the disruption to livelihoods, businesses, and various economic activities. An economic aspect of the flood damages is a crucial factor to consider. Evaluating the actual economic costs of floods is essential for building resilient communities (Adeel et al., 2020). The measurement of this flood risk indicator is the average financial cost linked to historical flood-related damages within the last five years’ time frame.
2.2.3. Environmental Damage
The environmental aspect when assessing damage by a hazardous event is crucial. The environmental damage specified by Talbot et al. (2018) concerning floods is the release of hazardous material due to flood-damaged infrastructures or equipment. Gautam specifies other environmental damage markers and van der Hoek 003), such as soil degradation, aquatic life and agriculture impacts, and surface and groundwater pollution. However, these other markers do not apply to this paper’s study area since this is about quantifying the flood risk of the highly urbanized cities of Metro Cebu. Hence, the researcher of this study will measure the environmental damage of floods using the historical accounts of hazardous emissions consequent to damages by floods within the last five years.
2.3. Flood Risk Indicators for Exposure Risk Dimension
Exposure as a risk dimension is defined as the value, location, and subjected elements of a hazardous event. Most flood risk assessment studies have used exposure flood risk indicators because they are geographical or hydrometeorological. This is a common occurrence in studies that are aimed at developing a flood risk map or flood scenario simulation (Hu et al., 2017; Lyu et al., 2018; Wang et al., 2011).
2.3.1. River Flood Potential
It is defined as an area’s susceptibility to flooding. In order to measure the river flood potential, three sub-indicators will be used to represent it: (1) maximum inundation measured by the maximum depth of flood in meters, (2) inundated area measured by the total area of inundation in square meters, and (3) population in the inundated area (Onuşluel Gül, 2013; Nasiri et al., 2016; Vojtek & Vojteková, 2016). The data for these sub-indicators will be gathered by conducting a thorough review of existing related studies.
2.3.2. Coastal Flood Potential
This flood risk indicator is the level of an area’s susceptibility to level loading. To measure the area’s coastal flood potential, the researcher of this study will utilize Balica et al. (2012) exposure items for coastal flood as follows: (1) typhoons in the last five years, (2) a 50-return period river discharge, (3) foreshore slope, (4) soil subsidence, (5) distance of coastline, (6) population close to the coastline, (7) growth of population close to coastline, and (7) uncontrolled planning zones.
2.3.3. Urban Flood Potential
This study will characterize the urban flood potential by the sub-indicators of drainage density and land use or cover. Taromideh et al. (2022) included drainage density as one of the most critical urban flood indicators. It will be elucidated as the characterization of permeable or impermeable rock and soil presence. The drainages that will be considered are both natural and manmade drainages. To model the manmade drainages that can’t be seen on the digital elevation maps, a map of the manmade drainage map will be gathered as well for the researcher to manually place the manmade drainages during the GIS mapping. The drainage density values can be produced during GIS mapping. On the other hand, land use/land cover will be collected from the designated office within these cities and quantified through a percentage of the five LULC types (waterbody, agriculture land, settlement, barren land, and vegetation).
2.4. Flood Risk Indicators for the Vulnerability Risk Dimension
Vulnerability as a risk dimension is defined as the propensity of the exposed elements to hazard. Numerous studies have outlined vulnerability as integrating economic, social, and ecological dimensions (Deroliya et al., 2022; Scheuer et al., 2011). Other studies have defined vulnerability as a risk element that considers both human and physical dimensions that could be negatively affected by a hazardous event.
2.4.1. Socio-Demographic Characteristics
Following the Koks et al. (2015) framework, these attributes are social factors affecting flood vulnerability. The sub-indicators include general socio-economic status, age, number of single-parent households, and construction year of properties. These indicators are meant to consider a significant portion of the population that could be physically or socially vulnerable.
2.4.2. Population Density
This flood risk indicator refers to the number of people susceptible to flooding (Koks et al., 2015; Nasiri et al., 2016), which will be obtained from the census data of each city. Population density is a crucial indicator because the more densely populated an area is, the more it is vulnerable to hazardous events. This would imply that it is one of the factors that makes an area susceptible to flooding because of how populous communities behave and thrive. Their way of living could interfere with the natural order of things or disrupt the harmonious flow of water, soil, and living creatures. The most noteworthy part of a populous area is the poor management of waste that could cause further problems in the community and the area.
2.4.3. Density of the Built Environment
This refers to the density of infrastructures in high flood potential areas (Cutter et al., 2000; Koks et al., 2015; Nasiri et al., 2016; Wu et al., 2002). This data will be collected by sifting through records on the number of built infrastructures and households in the susceptible areas. Aside from considering physical and social vulnerability, Cutter et al. (2016) also considered place vulnerability. The population should see the place’s vulnerability as essential in this context. The structures and infrastructure should be considered some things the community relies on. It is essential to include the density of the built environment in determining flood risk because it will establish whether the community survives the aftermath of a hazardous event.
2.4.4. Quality and Availability of Flood Risk Response Measures
A city should have a comprehensive flood risk response plan and measures to ensure the people will not be inconvenienced. There will be a qualitative assessment for its valuation while adopting the Vermont framework for assessing the status and quality of flood mitigation measures (Balica & Wright, 2010; Bulti et al., 2019; Nasiri et al., 2016). The Flood Resilience and Mitigation Checklist for Vermont Communities is adopted in this study as it has been used by several flood-related studies (Haddam et al., 2018; Johansen et al., 2017). Although specifically made for Vermont communities, this Vermont flood checklist considers a holistic look at flood-related disasters and factors. It aims to revisit plans, policies, and regulations to ensure they align with the community’s resilience goals and objectives. The Vermont flood checklist will examine the local government’s comprehensive plans, hazard mitigation plans, zoning and subdivision regulations, building codes, stormwater management ordinances, and regional plans.
2.4.5. Quality and Availability of Flood Risk Mitigation Measures
The mitigation component should also be considered in developing an index that will holistically quantify an area’s flood risk, and it should be under the vulnerability risk dimension. This indicator will be measured using the Vermont framework for assessing the status and quality of flood mitigation measures discussed in the previous indicator section. This indicator is part of building the flood resilience of a community (Balica & Wright, 2010; Bulti et al., 2019; Nasiri et al., 2016), and considers the local government’s part of the flooding issues.
3. Methods
3.1. Research Design
This study employed a hierarchical flood risk assessment model for the highly urbanized cities (HUCs) of Metro Cebu, based on the Hazard–Exposure–Vulnerability (HEV) framework. The HEV model conceptualizes flood risk holistically by integrating hazard, exposure, and vulnerability. To address uncertainty, vagueness, and incomplete data, the study integrated Rough Set Theory and the Full Consistency Method (FUCOM) into the computational framework. Rough Set Theory provided a systematic way to handle imprecise data without requiring additional subjective parameters, while FUCOM was used to generate priority weights for flood risk indicators through fewer expert judgments compared to methods such as Analytic Hierarchy Process (AHP). The combination of these methods enabled the construction of a Flood Risk Index (FRI) and the development of GIS-based flood risk maps, which captures both quantitative indicator values and their spatial representation across the cities of Cebu City, Mandaue City, and Lapu-Lapu City.
3.2. Research Environment
Metro Cebu is the second largest metropolitan area in the Philippines, covering ~600 km² along the central-eastern flank of Cebu Island. It is an economic hub characterized by rapid urbanization, industrial growth, and population expansion, but is also highly flood-prone due to poor drainage, coastal location, and increased impermeable land cover. The study focused on three HUCs within Metro Cebu (Cebu City, Mandaue City, and Lapu-Lapu City)
3.3. Designated Technical Personnel representing Local Government Offices
The primary respondents were data owners and designated personnel from government offices in each city, specifically:
- City Disaster Risk Reduction and Management Office (CDRRMO)
- City Social Welfare and Development Office (CSWDO)
- City Planning and Development Office (CPDO)
- City Environment and Natural Resources Office (CENRO)
For the FUCOM weighting process, 7 decision-makers participated. Each was tasked with ranking the HEV flood risk indicators and providing vector priority values, which were later processed into indicator weights.
This study did not involve human participants as research subjects. Instead, technical inputs were obtained from designated personnel of relevant local government offices acting solely in their official professional capacity as representatives of their respective institutions.
3.4. Research Procedure and Data Treatment
3.4.1. Phase 1: Data Collection.
The first phase focused on the systematic gathering of both primary and secondary data. Secondary data included hydrological records such as rainfall intensity, river discharge, and historical flood events obtained from PAGASA and DPWH. The spatial data such as topographic maps, land use classifications, and population density were gathered from NAMRIA and LGUs across Metro Cebu. In parallel, primary data were collected through structured surveys and the Vermont framework checklist administered to the LGUs. This phase ensured that both technical and social dimensions of flood risk were represented in the dataset.
3.4.2. Phase 2: Data Processing and Risk Assessment.
The second phase involved processing and consolidating the collected data for analysis. Hydrological and meteorological datasets were cleaned and standardized via normalization to remove inconsistencies and ensure comparability across time periods. Geographic Information Systems (GIS) were then used to map flood hazard zones by overlaying elevation, land use, and historical flood data.
3.4.3. Phase 3: Data Treatment and Statistical Analysis.
The third phase applied FUCOM and rough sets to interpret the data and establish meaningful relationships between variables. Survey data were analyzed using descriptive statistics to summarize household characteristics and preparedness levels. Inferential statistics, including correlation and regression analysis, were used to examine the influence of socio-economic and behavioral factors on flood vulnerability. Risk levels were then quantified by integrating hazard intensity, exposure density, and vulnerability indices into a composite flood risk score. policy recommendations.
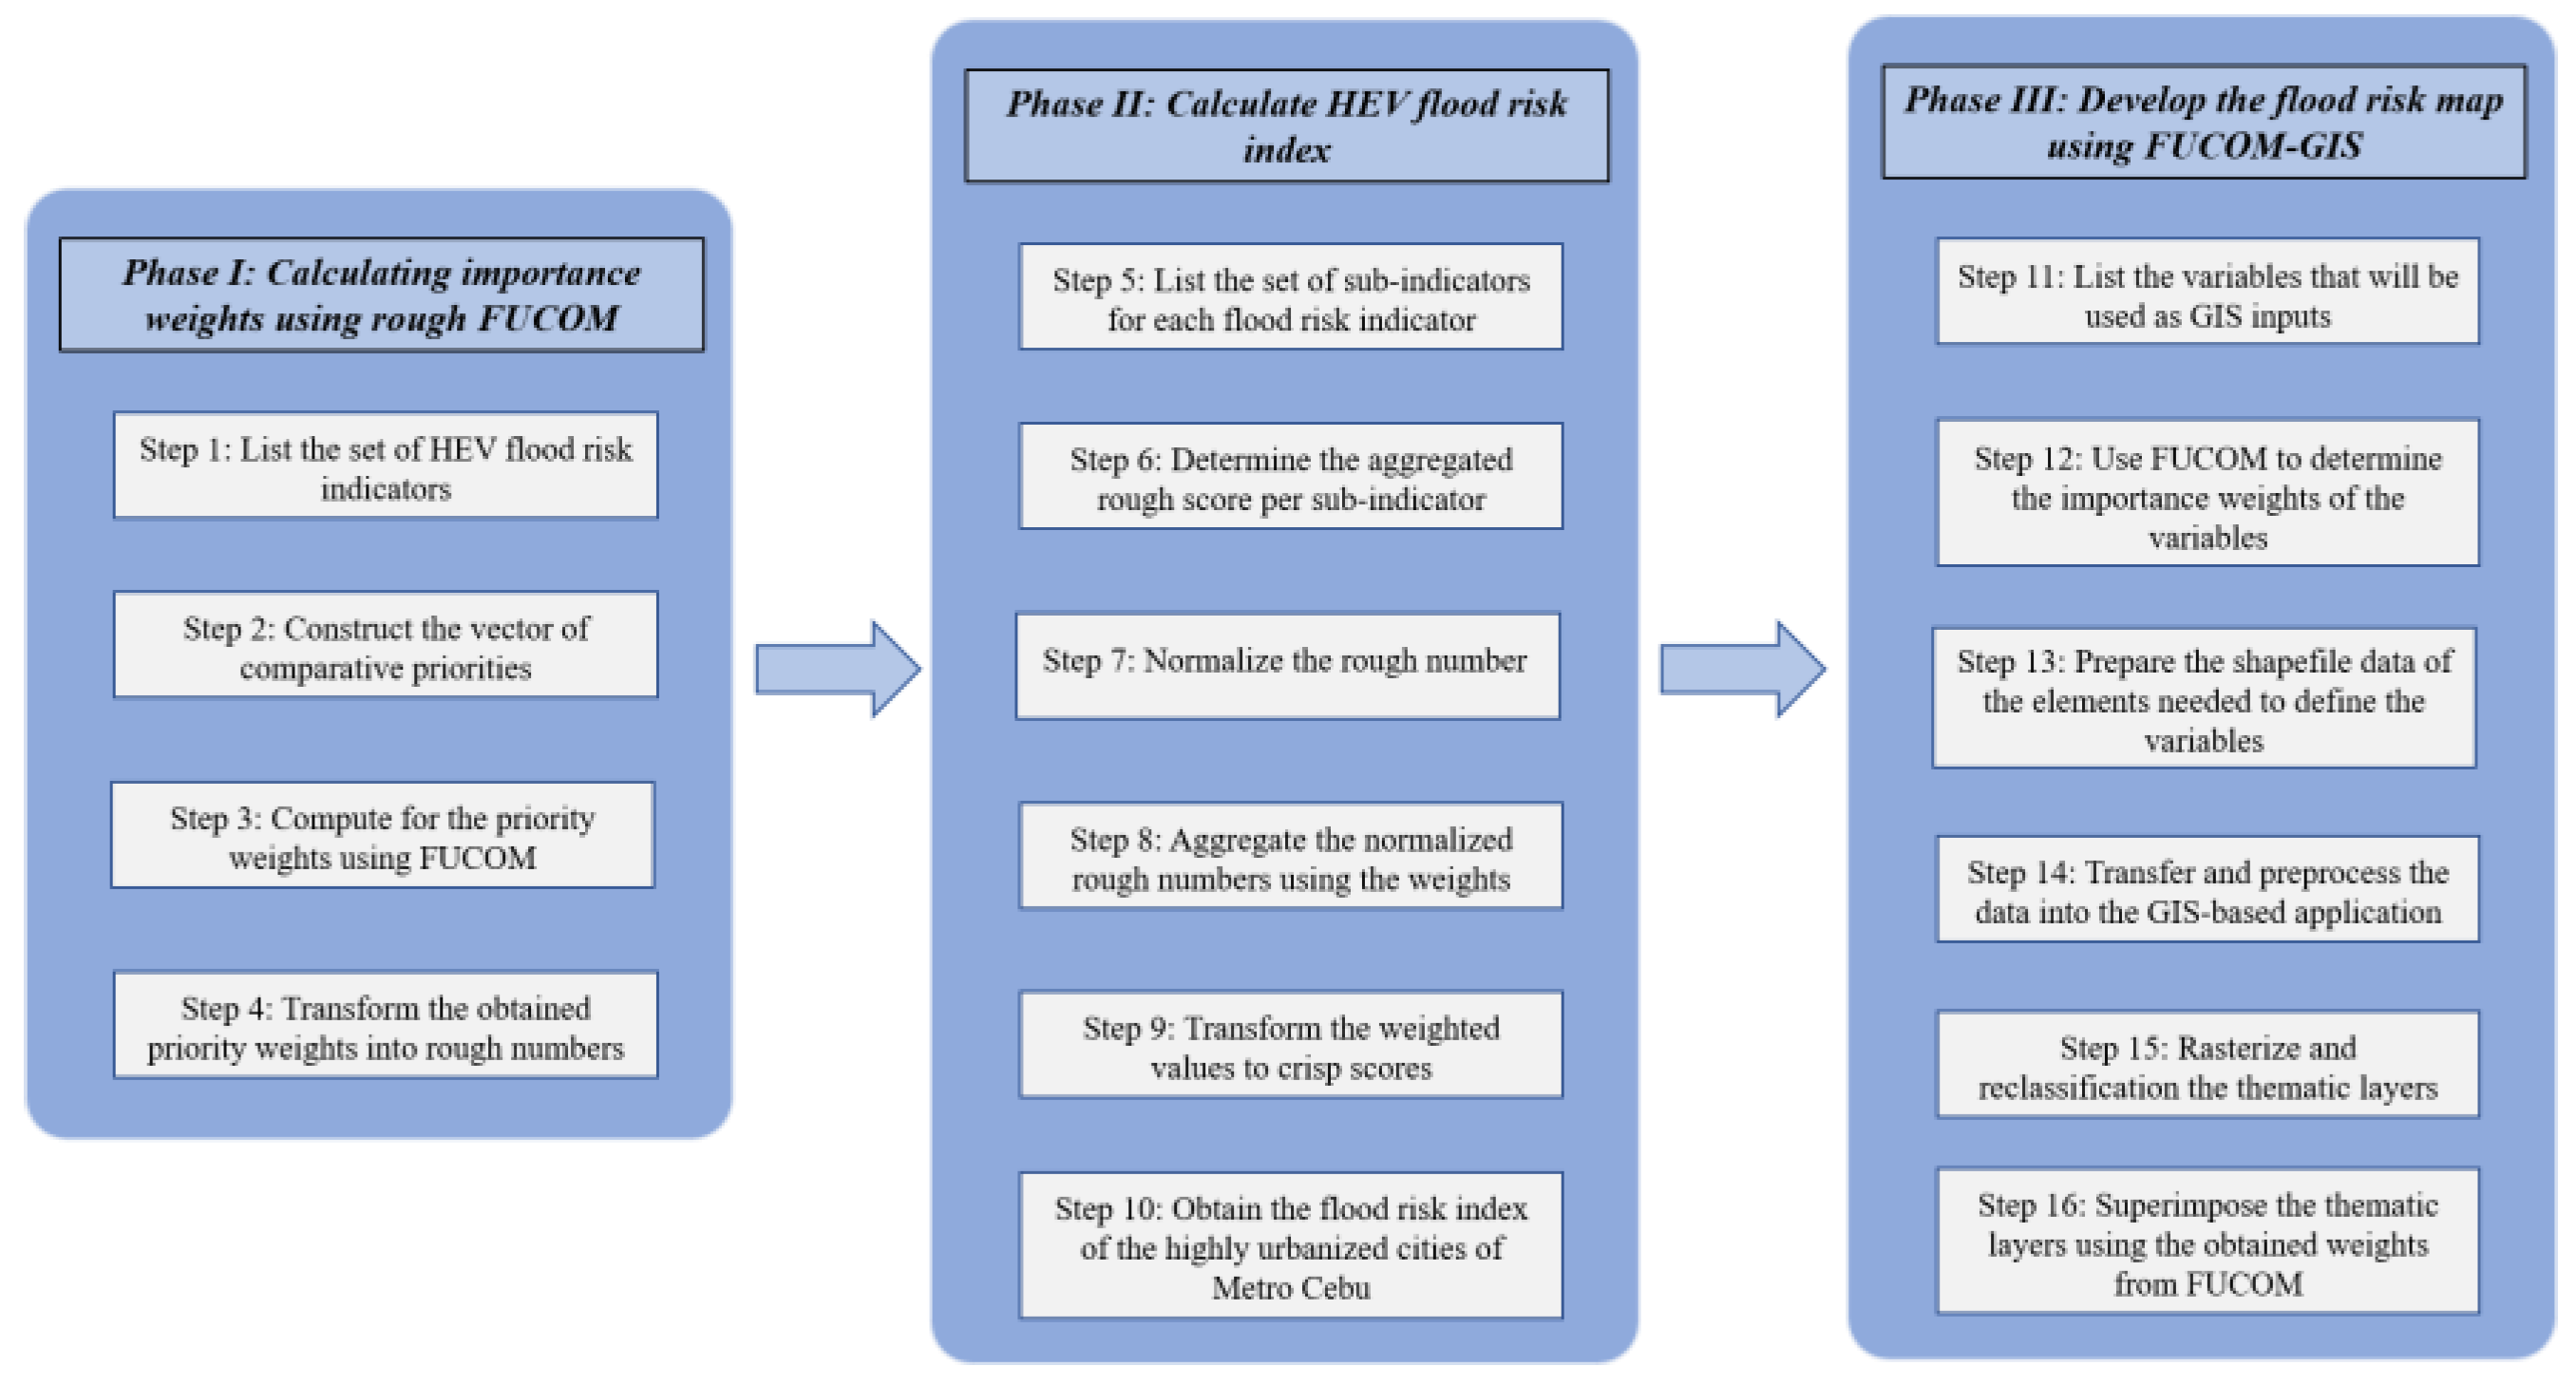
Figure 2.
Methodological scheme for the flood risk index and flood risk map.
4. Results
4.1. Quantifiable Flood Risk Indicators
Table 1 in the review of related literature and studies shows the list of identified quantifiable flood risk indicators for each risk dimension of the HEV model of risk. Each of the flood risk indicators was from a systematic literature review conducted by the researcher of this study.
Table 2 shows the raw data of each highly urbanized city in each flood risk indicator under the Hazard risk dimension. The data revealed that in terms of Casualty, Cebu City and Lapu-Lapu City have the same estimated range of values, while Mandaue City only has an 11-30 historical average number of casualties associated with a major flood event. One of the reasons for this is the higher concentration of informal settlements located in flood-prone areas. Informal settlers in these cities are more susceptible to flooding and may have difficulty evacuating. Informal settlements are also the usual places where flash floods or rapid water level rise could occur usually because of inadequate drainage systems. During the onset of these flash floods, residents will have less time for evacuation which could increase the risk of drowning. On the other hand, due to their higher population density and concentration of businesses, industries, and critical infrastructure, Cebu City and Mandaue City are likely more susceptible to substantial economic losses than Lapu-Lapu City in the event of a flood. In terms of environmental damage, Cebu City and Mandaue City also experienced significant damage. According to the CDRRMO of each of the concerned cities, water contamination, erosion and sedimentation, and disruption of waste management practices are common forms of environmental damage. During a major flood event, the resilience of the cities is heavily dependent on the recovery of the damage that greatly impacts the environment. For instance, the disruption of waste management facilities can lead to an unregulated release of hazardous materials that could pollute waterways and surrounding areas. Flood-contaminated water supplies pose health risks to the community.
Table 3 displays the results of the flood risk indicators under the Exposure risk dimension. On the sub-indicators under the River Flood Potential, it is very evident that Lapu-Lapu City’s values are very near the ideal conditions since it does not have rivers. On the other hand, Cebu City and Mandaue City are more abundant in rivers and creeks that serve as waterways. Cebu City has Mahiga Creek, which is the primary waterway that contributed to high flood risk. It is particularly exposed to encroachment on riverbanks by settlements. During flood events, the infrastructures that were built on the riverbanks can obstruct water flow and cause the river water level to rise and exacerbate flooding. Mandaue City has Butuanon River and due to rapid urbanization, impervious surfaces have become rampant. With regards to the Coastal Flood Potential of the three cities, Lapu-Lapu City has the greatest coastal flood risk although the three cities face coastal flooding risks due to their proximity to the sea. Cebu City has a long coastline and low-lying areas near the coasts, while Mandaue City is prone to saltwater intrusion due to low-lying areas near its coasts. Lapu-Lapu City, on the other hand, is surrounded by a coastline. Storm surges and big waves may require the city to invest in defenses adequate to act against wave action. The big issue of this city during a major coastal flooding event is the saltwater intrusion that would potentially contaminate potable water sources and pose health risks which affects the community. For the Urban Flood Potential, all three cities have issues with it primarily because these cities are currently experiencing rapid urbanization and inadequate drainage systems. However, Mandaue City has a much better score when it comes to drainage density compared to Cebu City and Lapu-Lapu City. The City Engineering office of each city estimated the average drainage density of the main drainage network of the cities. However, each of the cities claimed that there is still a lot to improve in their drainage system as most of the networks are outdated, unmaintained, and often clogged. These factors reduce the drainage density and overall efficiency. For the Land Use/Land Cover category, the CPDO of the cities have all classified their cities as a settlement category which means that major portion of a city are areas where human habitation and infrastructure are predominant, such as towns, villages, and other developed areas. Also, this means that the land uses are mostly residential, commercial, industrial, and institutional.
Table 4 shows the performance of HUCs against the flood risk indicators and sub-indicators of the Vulnerability risk dimension. From the raw data above, it can be observed that Cebu City’s socioeconomic status is very far from ideal considering that it has low general socioeconomic status, disadvantaged ages of the residents, a high number of single-parent households, and old properties. Furthermore, it has a high population density and density of the built environment. This is primarily because of the presence of important infrastructures which puts the community at risk as these infrastructures might release hazardous chemicals, and over time they could disintegrate and damage the ecosystems. Following Cebu City is Mandaue City as it only has a moderate general socioeconomic status and its population is composed of 60 – 90% individuals that are of age below 15 years old and above 60 years old, conveying that the population is mostly composed of vulnerable individuals. Looking at the bright side, Mandaue City has many new buildings, which means they're less likely to fall apart soon. However, this also means they might need maintenance during floods, which could be bad. Lapu-Lapu City, on the other hand, has a high general socioeconomic status and has less percentage of vulnerable individuals which could imply that the population is either less exposed to the flood risk or that they could easily be evacuated or relocated to safer areas before the flooding occurred. Furthermore, the spread of awareness and information as well as compliance with flood-related policies will be much easier if the non-vulnerable percentage of the population is much greater than the vulnerable ones. For flood risk mitigation and flood risk response measures, which were both configured using the Vermont framework, the HUC’s performance against each of the aspects of the framework is considerably fair, as there have been components or important elements that the cities were yet to address. Although Cebu City is an old city and a very established one (Nishimura, 2019), its flood risk mitigation and response measures were still considerably lacking. The scores of the HUCs for each aspect are dependent on the status and quality of the plans in place. From these results, we can conclude that Cebu City, Mandaue City, and Lapu-Lapu City are making progress with these plans, and they are in the process of addressing every aspect of flood risk.
4.2. Risk Dimension Indices
In the computation of risk dimension indices, priority weights were calculated. To get the priority weights, FUCOM was used in the calculations. Seven experts were chosen to rank the flood risk indicators and gave corresponding vector priorities. Table 5 shows the results of the FUCOM method which was done in a rough set environment. The table also shows the rank of the flood risk indicators according to their corresponding weights. This is done to emphasize which sets of flood risk indicators were given more importance by the supervisors of CDRRMOs and CDPOs of Cebu City, Mandaue City, and Lapu-Lapu City. Table 5 shows the top five flood risk indicators that were given more priority during planning and policymaking are Economic Damage, Casualty, Flood risk response measures, Flood risk mitigation measures, and Environmental Damage. The experts have claimed that economic damage and casualty are the top concerns and priorities of the CDRRMO and CPDO because these are the primary humanitarian causes and purpose of the formation of these offices. The main mission of CDDRMO is to protect human life and ensure the safety and well-being of the community, and it includes the safeguarding of the properties of the public as well. Furthermore, economic stability is also critical as survival and resilience greatly depend on abundant resources to facilitate the recovery of the community after the onset of a flood event or other disasters. Also, the reconstruction and re-establishment of livelihoods and businesses that support the functioning of the community is a top priority to recover from the negative impacts the flood event has caused.
4.3. Hazard Index
The way of collecting data for this study is by asking the HUCs their performance against the ideal values of each flood risk indicator and corresponding sub-indicators. The ratios of performance score to ideal value were then subtracted from 1 to get the susceptibility ratio of each flood risk indicator. The priority weights were then used for each susceptibility ratio and the risk index for each risk dimension was computed.
Figure 3 shows the susceptibility of the HUCs of Metro Cebu concerning the flood risk indicators under the Hazard risk dimension. Looking at the flood risk indicators susceptibility rates, Metro Cebu is susceptible to environmental damage primarily because of the aftermath of flood events and the authorities have a hard time re-establishing the systems that were disrupted, particularly the water and waste management systems. Casualty and Economic Damage were also high and needed to be taken care of.
4.4. Exposure Risk Index
For the computation of the Exposure Risk Index, the preparedness score for each of the flood risk indicators under the Exposure risk dimension was divided against their corresponding ideal scores. To deal with estimations and uncertainties with the exact values, 5-point Likert scales were used for each of the flood risk indicators so that the supervisors of CDRRMO and CDPO can easily rate the performance of their respective HUCs against each flood risk indicator.
Figure 4 shows that the Exposure risk index is at 0.6483, which means that Metro Cebu is leaning towards the high risk of flooding and will likely suffer major damages in terms of these flood risk indicators under the Exposure risk dimension during major flood events. Consequently, Coastal Flood Potential and River Flood Potential contributed to a higher exposure risk index since they are also valued at 0.7239 and 0.7263, respectively. This is primarily because the HUCs are coastal cities and Cebu City and Mandaue City have several rivers and creeks that tend to overflow during weather events that are characterized by heavy precipitation. The CDRRMO of each HUCs has common issues with flood forecasting and flood warning systems. They claimed that they have started projects about flood warning systems because a systematized way of warning the residents that water is about to rise, will be a lot of help in facilitating an efficient evacuation and rescue. On the other hand, Urban Flood Potential is not that of high-risk value considering its value at 0.4801.
4.5. Vulnerability Risk Index
The Vulnerability Risk Index of the HUCs of Metro Cebu was calculated in the same way the Hazard and Exposure Risk indices were calculated. There are five flood risk indicators under vulnerability and each of them is focused on the perspective of measuring the predisposition of the HUCs that might put them at a disadvantage during a flood event.
Figure 5 displays the Vulnerability Risk index along with the contributing risk scores of the flood risk indicators under it. An index value of 0.6072 is moderately risky enough. Referring to the table, we can say that the performance scores of HUCs against Flood Risk Response and Flood Risk Mitigation measures are considerably fair as the offices claimed that they are still working on the plans and ensuring that the city’s resources are efficiently allocated to maximize flood disaster resilience and facilitate sustainable development. As for the population density, which is the highest contributor to the vulnerability index, it is one of the challenging factors that the government has yet to address as it would require a greater number of resources to facilitate relocation. Addressing population density should be included in the long-term strategic planning but then again, the CDRRMO and CDPO are still focused on immediate risk, and much of their resources are allocated to short-term planning. Furthermore, the density of the built environment pertains to the urban development of the HUCs, and from the evidence presented, we can conclude that there is quite a problem with the urban planning and development aspect of the HUCs. One of the reasons for a problem in this aspect is that these HUCs are also old cities, thus they have a rich historical and cultural heritage which is evident in their old infrastructure and buildings that date back to the Spanish colonial era, such as churches, roads, temples, and revolution halls. Typically, commercial, and industrial centers are built around these establishments because the residents are usually gathered in those areas. Furthermore, urban growth is another supplementing factor as to why urban planning is commonly dismissed because stakeholders and investors usually overlook or choose to neglect zoning regulations and sustainable urban mobility plans. There is an obvious lack of discipline on the part of the businesspeople when it comes to following urban planning initiatives.
4.6. Composite Flood Risk Index
After calculating the individual indices for the risk dimensions, their values are aggregated and combined to determine the composite flood risk index of Metro Cebu. The bar graph below shows the indices of the risk dimensions and the composite flood risk index for Metro Cebu.
Figure 6 shows that the composite flood risk index of Metro Cebu is 0.6773. Based on the data, it appears that Metro Cebu is at a considerable risk regarding its susceptibility during flood events. That means that upon the evaluation of the preparedness and performance of the HUCs against the identified flood risk indicators in the context of this flood risk assessment, the composite flood risk index accounts for the deficiency of the HUCs in terms of flood preparedness and essential precautions.
Cebu City, Mandaue City, and Lapu-Lapu City have certainly worked on their flood response and flood mitigation measures, but they have serious predicaments in terms of river flood potential, coastal flood potential, and urban flood potential. They are also at a significant disadvantage when it comes to the vulnerability of the residents and the urban planning of the cities. Furthermore, the three cities harbor the important economic and commercial establishments of Cebu, therefore, a mismanaged major flood event can inflict substantial economic harm that could affect the economic stability of the cities. Referring to Figure 6, the Hazard index is the highest contributor as it represents the weakest chains of a city during disasters such as lives, property, economic stability, and environmental sustainability. It is followed by the Exposure index which represents the spatial and temporal dispositions of the cities. The cities are bestowed with inherent climate and topographical characteristics that often-become disadvantages during a flood disaster. Lastly, the Vulnerability index is also at par with the Hazard index and Exposure index, but it is the lowest value compared with the two. It is still considerably high as it represents the predisposition of the cities in terms of socio-demographic characteristics and urban development.
While there are no benchmark values or thresholds from other flood risk assessment studies that use the set of flood risk indicators like the ones used in this study however, there are flood risk assessment studies that interpreted risk using the HEV framework and have produced a flood risk index in their respective study areas. A recently published study by Wang et al. (2024) focused on assessing the flood susceptibility of the Naeseongcheon Stream Basin in Korea and found that using the grid-based approach, a flood risk index mean value of 1.7 for all the grids was computed. In Malaysia, a paper by Anuar et al. (2023) studied the flood risk of Malaysia’s rice bowl and quantified it at an index value of 0.75. In addition, a study by Santos et al. (2020) measured Portugal’s flood risk index at 0.630. The study areas of the aforementioned flood risk assessment studies had significant similarities with the Philippines in a way that they are coastal areas and are susceptible to flooding due to climate characteristics such as heavy rainfall, numerous typhoons, and frequent storm surges.
Broadly speaking, the flood risk index value of 0.6773 suggests a moderate risk level, but considering the rapid effects of climate change, this susceptibility index value indicates high risk and demands immediate attention and enhancement to the identified flood risk indicators. This risk level already necessitates proactive measures and efficient resource allocation. It is important to recognize that despite the exhaustiveness of the study with the selection of the flood risk indicators aligned with the risk dimensions, the use of rough sets to accommodate uncertainty and vagueness, and the rigor of multicriteria computations, there are still limitations. Hence, a flood risk index value is inadequate unless it is supported by flood hazard maps that could visually substantiate the findings of this study.
4.7. Flood Hazard Maps
In order to support the findings of the flood risk indices that were generated in the previous sections, flood hazard maps were developed. In the generation of the flood hazard map for each city, the ranks and the vectors elicited by the experts were utilized to distribute priority weights among the flood risk indicators that were applicable to map in the ArcGIS software. As a substitute for river flood inundation and inundated areas, since the cities have no available updated and complete data for all the rivers and creeks, proximity to rivers is used. It is based on the intuitive concept that areas closer to rivers are generally at a higher risk of flooding compared to areas farther away.
The priority weights in Table 6 were used in the ArcGIS software using an overlay raster function, specifically the weighted sum function, after they were reclassified. In the table below, it is evident how the priority weights of the flood risk indicators are still reflected and bears meaning of the importance or priority the study is concerned about. Distance to rivers is given a priority weight of 0.17477 to account for the most common cause of flooding here in Metro Cebu which are rivers and creeks. The drainage density and Land Use/Land Cover is also given a higher priority to account for another common cause of flooding in Metro Cebu which is poor urban planning and infrastructure.
4.7.1. Cebu City
Figure 7 shows the flood hazard map of Cebu City. The areas with no color to represent the risk level have no data for land use/land cover due to poor quality of satellite images extracted from www.earthexplorer.usgs.gov. The DEM raster cell size is at 30m by 30m. The TIFF file for the digital elevation model of all the three cities has poor quality as well. The raster data of the flood risk indicators shown in Table 6 have been reclassified into layers and overlayed to generate the flood risk level of the cells in the maps. Areas having “very low flood risk” is 5.28%, “low flood risk” is 56.81%, as evident in the mountainous areas of the city, “moderate flood risk”, on the other hand is 12.18%, “high flood risk” occupied 14.41% of the Cebu City area, while “very high flood risk” occupied the 11.31% of the city, as evident in the coastal areas. In Cebu City, the areas close to coastlines are very susceptible to flooding. These are also the areas that are very densely populated primarily because livelihood from commercial and industries are more robust in their areas due to easy access in trading, transportation, and urban infrastructures. It is also noteworthy that these barangays are low-lying areas, which means that flood basins are usually situated here, and flood accumulation volume is greater.
4.7.2. Mandaue City
Figure 8 shows the flood hazard map of Mandaue City. For Mandaue City, areas near the Butuanon River are the most susceptible to flooding. Areas classified as having "very low flood risk" comprise 4.01% of Mandaue City, while those with "low flood risk" make up 31.5%, predominantly in the elevated regions of the city. Conversely, areas with "moderate flood risk" account for 58.19%. Regions with a "high flood risk" cover 6.04% of the city, and "very high flood risk" zones, mostly located in coastal areas just like with Cebu City, constitute 0.24% of Mandaue City. The main basin of the area is situated near its mainstream. Because of the industrial growth of Mandaue City as evident in the volume of urban infrastructures built in its land area, even the elevated areas are populated the displacement of people to give way to urban developments and commercial residencies. On the lower part of the catchment, the drainage density of Mandaue City is quite extensive but it still very high risk to flooding because of the coastal proximity, low elevation, along with the proximity of the areas to the waterways of the city.
4.7.3. Lapu-Lapu City
Figure 9 shows the flood hazard map of Lapu-Lapu City which a substantial support for the results in the flood risk assessment which yielded flood risk indices for the highly urbanized cities of Metro Cebu. In Lapu-Lapu City, 0.02% of the areas are categorized as having "very low flood risk," and 2.81% are classified as "low flood risk,". On the other hand, "moderate flood risk" areas make up 30.38% of the city. "High flood risk" areas constitute 38.92%, while 27.87% of the city, mostly in coastal regions and near the bridges, are designated as having a "very high flood risk." Lapu-Lapu City, because of its low elevation and proximity to coastlines, has more high flood risk areas. For the population density data of Lapu-Lapu City, it was found out that only the barangays Basak and Gun-ob have a very high population density while the rest of the barangays have population density ranging from very low to moderate. Currently, the city of Lapu-Lapu have no available population and LULC data for the barangays in Olango Island, but they are currently working on it. Furthermore, because of the lack of rivers and creeks in Lapu-Lapu City, it has no river flood potential and therefore led to only a lower risk level compared to Cebu City and Mandaue City.
5. Discussion
The primary strength of this study is that it has an innovative conceptual model for assessing flood risk as it uses an entirely different set of flood risk indicators aligned with the risk dimensions that they belong to. The flood risk indicators are selected with the HEV model of risk interpretation as a guide. There is an existing limitation in the domain of flood risk assessments because other assessment methodologies are usually only using flood risk indicators that are only applicable in their area or only using common flood risk indicators. This study tries to address this limitation by holistically considering the dimensions of risk so that the authorities will not just address what is immediate or visible. On the part of these concerned authorities, it is evident in their comprehensive plans, that they only utilize flood hazard maps based on observed inundated areas and inundation. Although they might have made mention of the vulnerability of the community during flood events, they still fail to incorporate the vulnerability aspect in their flood risk assessments. In that way, the strategies and plans are all focused on the areas with flooding and not on the overall susceptibility of the area to flooding.
The integration of priority weights to the flood risk indicators upon the calculation of the risk indices is another strength of this paper. Additionally, the priority weights represent the expert perspectives of the supervisory heads of the CDRRMO and CDPO. This suggests that the priority weights assigned to the flood risk indicators are the corresponding values of importance these experts give during strategic planning and decision-making during flood disaster-related meetings. The calculation of the priority weights was done using FUCOM in the rough set environment. To recall, the experts ranked the flood risk indicators in decreasing order of importance. A vector of comparison was also elicited from the experts to emphasize the degree of importance of the specific indicator from the next ranked indicator. The scores were then gathered and treated using an optimization algorithm. The optimization process is done in LINGO software, where the priority weights were then calculated. Looking at the final list of priority weights, it is discernible that experts prioritize economic damage and casualty, reflecting the importance of protecting lives and properties. While flood risk response and mitigation measures are in progress, challenges remain in formulating long-term initiatives addressing vulnerabilities and improving urban planning. The composite flood risk index for Metro Cebu is 0.6773, indicating a moderate risk level but suggesting a need for immediate action and efficient resource allocation, particularly in the face of climate change.
The findings of the study indicate that Metro Cebu faces considerable flood risk among multiple risk dimensions: hazard, exposure, and vulnerability. In terms of the Hazard risk dimension, environmental damage, casualty, and economic damage are of primary concern. The Exposure risk index is elevated due to coastal and river flood potential, aggravated by inadequate flood forecasting and flood warning systems. The Vulnerability risk index is also high and is influenced by factors such as population density, urban planning issues, and socioeconomic characteristics. Moreover, the results of this flood risk assessment study hold significant implications in informing adaptive flood risk management strategies, providing invaluable perspectives for the stakeholders. Through the approach of this study in assessing the susceptibility of Metro Cebu to flooding, a more targeted resource allocation will be made possible. Using the flood risk maps that were generated, high-risk areas will immediately be given attention. Additionally, the results of the study support the concerned local government units and allow them to have evidence-based decision-making. Moreover, is it evident in the findings, particularly in the assignment of priority weights, that the stakeholders have a short-term perspective. Nonetheless, this study informs long-term planning for flood risk management. It also encourages the local government units and the community to strengthen risk reduction measures and enhance flood preparedness as well as community engagement since most of the flood risk indicators involved in this study are factors that the public can address or intervene in. Lastly, the indices as well as the composite flood risk index encourage the three highly urbanized cities of Metro Cebu to form a rigid collaboration to support each other in times of flood disasters. Individually, they have unique strengths and weaknesses and if they use their strengths to their optimal advantage, they would be able to maintain stability during flood events.
However, it's important to acknowledge the potential limitations and period of validity inherent in any research endeavor, particularly in the context of rapidly evolving factors such as climate change. While the findings provide valuable insights based on the current conditions and available data, ongoing monitoring and adaptation efforts will be crucial to ensure the continued relevance and applicability of the study's findings and conclusions over time. Furthermore, the involvement of expert perspectives from the supervisory heads of CDRRMO and CDPO in assigning priority weights to flood risk indicators adds credibility to the findings. Their input not only reflects real-world considerations but also considers the practical relevance of the study's outcomes in informing strategic decision-making processes.
6. Conclusion and Policy Insights
Overall, this study has provided valuable insights into the courses of action the local government units should take in managing Metro Cebu’s susceptibility to flooding. First, the study revealed the weight of priorities given to economic damage, casualty, flood risk response measures, flood risk mitigation measures, and environmental damage. Second, hazard, exposure, and vulnerability indices were calculated exposing poor performance in the identified flood risk indicators. Lastly, a composite flood risk index of Metro Cebu was calculated indicating a moderate risk level, necessitating proactive measures. In conclusion, this study highlights the critical role of a comprehensive flood risk assessment in supporting the decision-making process of the local government unit and stakeholders. The main contributions of the study to the domain of disaster risk assessment are that it unveiled the important interplay of the flood risk indicators that holistically considered all aspects of flooding and gauged current standing of Metro Cebu against the flood risk indicators specified. The generated indices and flood hazard maps provided a realistic evaluation that serves as a guide for tailored interventions and adaptive strategies. Finally, enhancing flood risk management requires a profound understanding of local contexts, predispositions, and conditions of the areas or cities where the proactive measures are to be implemented.
CRediT Authorship Contribution Statement
Rica V. Villarosa: Writing – original draft, Visualization, Validation, Methodology, Formal analysis, Conceptualization. Lorafe F. Lozano: Conceptualization, Validation, Supervision.
Informed Consent Statement
Not applicable. This study did not involve human participants as research subjects, nor did it collect personal or identifiable human data. All inputs were provided at the institutional level by designated personnel acting in their official professional capacity.
Data Availability
Link to the Supplementary material - 10.6084/m9.figshare.30050854.
Declaration of Competing Interests
The authors declare that they don’t have any competing personal or financial interests that might have influenced the work reported in this manuscript.
References
- Adeel, Z., Alarcón, A. M., Bakkensen, L., Franco, E., Garfin, G. M., McPherson, R. A., ... & Wen, X. (2020). Developing a comprehensive methodology for evaluating the economic impacts of floods in Canada, Mexico, and the United States. International Journal of Disaster Risk Reduction, 50, 101861. [CrossRef]
- Alam, I., & Ali, Y. (2023). Studying the effects of Türkiye earthquake disaster and its impact on real estate industry: A risk analysis based on input-output & non-linear optimization models. International Journal of Disaster Risk Reduction, 96, 103920. [CrossRef]
- Ali, K., Bajracharya, R. M., & Koirala, H. L. (2016). A review of flood risk assessment. International Journal of Environment, Agriculture and Biotechnology, 1(4), 238636.
- Armenakis, C., Du, E. X., Natesan, S., Persad, R. A., & Zhang, Y. (2017). Flood risk assessment in urban areas based on spatial analytics and social factors. Geosciences, 7(4), 123. [CrossRef]
- Berrang-Ford, L., Biesbroek, R., Ford, J. D., Lesnikowski, A., Tanabe, A., Wang, F. M., ... & Heymann, S. J. (2019). Tracking global climate change adaptation among governments. Nature Climate Change, 9(6), 440-449. [CrossRef]
- Bin, L., Xu, K., Pan, H., Zhuang, Y., & Shen, R. (2023). Urban flood risk assessment characterizes the relationship among hazard, exposure, and vulnerability. Environmental Science and Pollution Research, 30(36), 86463– 86477. [CrossRef]
- Buchecker, M., Salvini, G., Di Baldassarre, G., Semenzin, E., Maidl, E., & Marcomini, A. (2013). The role of risk perception in making flood risk management more effective. Natural Hazards and Earth System Sciences, 13(11), 3013-3030. [CrossRef]
- Cariolet, J. M., Vuillet, M., & Diab, Y. (2019). Mapping urban resilience to disasters–A review. Sustainable Cities and Society, 51, 101746. [CrossRef]
- Chandio, A. A., Jiang, Y., Rehman, A., & Rauf, A. (2020). Short and long-run impacts of climate change on agriculture: an empirical evidence from China. International Journal of Climate Change Strategies and Management, 12(2), 201-221. [CrossRef]
- Chen, J., Hill, A. A., & Urbano, L. D. (2009). A GIS-based model for urban flood inundation. Journal of Hydrology, 373(1-2), 184-192. [CrossRef]
- Chou, C., Chiang, J. C., Lan, C. W., Chung, C. H., Liao, Y. C., & Lee, C. J. (2013). Increase in the range between wet and dry season precipitation. Nature Geoscience, 6(4), 263-267. [CrossRef]
- Crost, B., Duquennois, C., Felter, J. H., & Rees, D. I. (2018). Climate change, agricultural production and civil conflict: Evidence from the Philippines. Journal of Environmental Economics and Management, 88, 379-395. [CrossRef]
- Dawod, G. M., Mirza, M. N., & Al-Ghamdi, K. A. (2011). GIS-based spatial mapping of flash flood hazard in Makkah City, Saudi Arabia. Journal of Geographic Information System, 3(03), 225.
- De Moel, H. D., Van Alphen, J., & Aerts, J. C. (2009). Flood maps in Europe–methods, availability and use. Natural Hazards and Earth System Sciences, 9(2), 289-301. [CrossRef]
- De Viana, A. V. (2014). The Philippines’ typhoon alley: the historic bagyos of the Philippines and their impact. Jurnal Kajian Wilayah, 5(2), 184-216.
- Dickella Gamaralalage, P. J., Maeda, T., & Gilby, S. (2020). Enhancing capacities for building climate and disaster- resilient cities in Asia: Case study of Cebu, Philippines and Nonthaburi, Thailand. Resilient Policies in Asian Cities: Adaptation to Climate Change and Natural Disasters, 169-193.
- Dilawar, A., Chen, B., Ashraf, A., Alphonse, K., Hussain, Y., Ali, S., ... & Hussain, S. (2022). Development of a GIS- based hazard, exposure, and vulnerability analyzing method for monitoring drought risk in Karachi, Pakistan. Geomatics, Natural Hazards and Risk, 13(1), 1700-1720. [CrossRef]
- Feng, D., Shi, X., & Renaud, F. G. (2023). Risk assessment for hurricane-induced pluvial flooding in urban areas using a GIS-based multi-criteria approach: A case study of Hurricane Harvey in Houston, USA. Science of the Total Environment, 166891. [CrossRef]
- Gain, A. K., Mojtahed, V., Biscaro, C., Balbi, S., & Giupponi, C. (2015). An integrated approach of flood risk assessment in the eastern part of Dhaka City. Natural Hazards, 79, 1499-1530. [CrossRef]
- Gautam, K. P., & Van Der Hoek, E. E. (2003). Literature study on the environmental impact of floods. Netherlands: Delft Cluster.
- Gera, W. (2018). Scalar politics in Philippine urban disaster management: reframing metropolitan governance for local resilience and sustainability. Erdkunde, 72(4), 287-312. [CrossRef]
- Godde, C. M., Mason-D’Croz, D., Mayberry, D. E., Thornton, P. K., & Herrero, M. (2021). Impacts of climate change on the livestock food supply chain; a review of the evidence. Global Food Security, 28, 100488. [CrossRef]
- Guoyi, L., Liu, J., & Shao, W. (2023). Urban flood risk assessment under rapid urbanization in Zhengzhou City, China. [CrossRef]
- Regional Sustainability, 4(3), 332–348.
- Hadipour, V., Vafaie, F., & Deilami, K. (2020). Coastal flooding risk assessment using a GIS-based spatial multi- criteria decision analysis approach. Water, 12(9), 2379. [CrossRef]
- Hammami, S., Zouhri, L., Souissi, D., Souei, A., Zghibi, A., Marzougui, A., & Dlala, M. (2019). Application of the GIS based multi-criteria decision analysis and analytical hierarchy process (AHP) in the flood susceptibility mapping (Tunisia). Arabian Journal of Geosciences, 12, 1-16. [CrossRef]
- Hu, S., Cheng, X., Zhou, D., & Zhang, H. (2017). GIS-based flood risk assessment in suburban areas: A case study of the Fangshan District, Beijing. Natural Hazards, 87, 1525–1543. [CrossRef]
- Ikram, Q. D., Jamalzi, A. R., Hamidi, A. R., Ullah, I., & Shahab, M. (2023). Flood risk assessment of the population in Afghanistan: A spatial analysis of hazard, exposure, and vulnerability. Natural Hazards Research. [CrossRef]
- Ivanova, D., Barrett, J., Wiedenhofer, D., Macura, B., Callaghan, M., & Creutzig, F. (2020). Quantifying the potential for climate change mitigation of consumption options. Environmental Research Letters, 15(9), 093001. [CrossRef]
- Janssens, C., Havlík, P., Krisztin, T., Baker, J., Frank, S., Hasegawa, T., ... & Maertens, M. (2020). Global hunger and climate change adaptation through international trade. Nature Climate Change, 10(9), 829-835. [CrossRef]
- Johnson, B. A., Estoque, R. C., Li, X., Kumar, P., Dasgupta, R., Avtar, R., & Magcale-Macandog, D. B. (2021). High- resolution urban change modeling and flood exposure estimation at a national scale using open geospatial data: A case study of the Philippines. Computers, Environment and Urban Systems, 90, 101704. [CrossRef]
- Johansen, C., Horney, J., & Tien, I. (2017). Metrics for evaluating and improving community resilience. Journal of Infrastructure Systems, 23(2), 04016032. [CrossRef]
- Kazakis, N., Kougias, I., & Patsialis, T. (2015). Assessment of flood hazard areas at a regional scale using an index- based approach and Analytical Hierarchy Process: Application in Rhodope–Evros region, Greece. Science of the Total Environment, 538, 555-563. [CrossRef]
- Kaźmierczak, A., & Cavan, G. (2011). Surface water flooding risk to urban communities: Vulnerability, hazard and exposure analysis. Landscape and Urban Planning, 103(2), 185-197.
- Kefi, M., Mishra, B. K., Masago, Y., & Fukushi, K. (2020). Analysis of flood damage and influencing factors in urban catchments: case studies in Manila, Philippines, and Jakarta, Indonesia. Natural Hazards. doi:10.1007/s11069- 020-04281-5. [CrossRef]
- Khan, M. M. A., Shaari, N. A. B., Bahar, A. M. A., Baten, M. A., & Nazaruddin, D. B. (2014). Flood impact assessment in Kota Bharu, Malaysia: a statistical analysis. World Applied Sciences Journal, 32(4), 626-634.
- Kittipongvises, S., Phetrak, A., Rattanapun, P., Brundiers, K., Buizer, J. L., & Melnick, R. (2020). AHP-GIS analysis for flood hazard assessment of the communities nearby the world heritage site on Ayutthaya Island, Thailand. International Journal of Disaster Risk Reduction, 48, 101612. [CrossRef]
- Lagmay, A. M. F. A., Racoma, B. A., Aracan, K. A., Alconis-Ayco, J., & Saddi, I. L. (2017). Disseminating near-real- time hazards information and flood maps in the Philippines through Web-GIS. Journal of Environmental Sciences, 59, 13-23. [CrossRef]
- Lavalle, C., Barredo, J. I., De Roo, A., Feyen, L., Niemeyer, S., Camia, A., ... & Barbosa, P. (2006). Pan European assessment of weather driven natural risks. European Week of Region and Cities Open Day, Brussels, 9-12.
- Li, Q., Zhou, J., Liu, D., & Jiang, X. (2012). Research on flood risk analysis and evaluation method based on variable fuzzy sets and information diffusion. Safety Science, 50(5), 1275-1283. [CrossRef]
- Liu, Y., & Chen, J. (2021). Future global socioeconomic risk to droughts based on estimates of hazard, exposure, and vulnerability in a changing climate. Science of the Total Environment, 751, 142159. [CrossRef]
- Lyu, H. M., Sun, W. J., Shen, S. L., & Arulrajah, A. (2018). Flood risk assessment in metro systems of mega-cities using a GIS-based modeling approach. Science of the Total Environment, 626, 1012-1025. [CrossRef]
- Malhi, G. S., Kaur, M., & Kaushik, P. (2021). Impact of climate change on agriculture and its mitigation strategies: A review. Sustainability, 13(3), 1318. [CrossRef]
- Mas, E., Bricker, J., Kure, S., Adriano, B., Yi, C., Suppasri, A., & Koshimura, S. (2015). Field survey report and satellite image interpretation of the 2013 Super Typhoon Haiyan in the Philippines. Natural Hazards and Earth System Sciences, 15(4), 805-816. [CrossRef]
- Merz, B., Thieken, A. H., & Gocht, M. (2007). Flood risk mapping at the local scale: concepts and challenges. Flood Risk Management in Europe: Innovation in Policy and Practice, 231-251.
- Mohanty, M. P., & Simonovic, S. P. (2021). Understanding dynamics of population flood exposure in Canada with multiple high-resolution population datasets. Science of The Total Environment, 759, 143559. [CrossRef]
- Mudashiru, R. B., Sabtu, N., Abustan, I., & Balogun, W. (2021). Flood hazard mapping methods: A review. Journal of Hydrology, 603, 126846. [CrossRef]
- Munawar, H. S. (2020). Flood disaster management: Risks, technologies, and future directions. Machine Vision Inspection Systems: Image Processing, Concepts, Methodologies and Applications, 1, 115-146. [CrossRef]
- Mustafa, A., Bruwier, M., Archambeau, P., Erpicum, S., Pirotton, M., Dewals, B., & Teller, J. (2018). Effects of spatial planning on future flood risks in urban environments. Journal of Environmental Management, 225, 193-204.
- Nalau, J., & Verrall, B. (2021). Mapping the evolution and current trends in climate change adaptation science. Climate Risk Management, 32, 100290. [CrossRef]
- Nishimura, M. (2019). Heritage in Cebu City, the Philippines: A Study of “Competitive” Heritage–A Preliminary Field Report (Doctoral dissertation, Waseda University).
- Qiao, Y. K., Peng, F. L., & Wang, Y. (2017). Monetary valuation of urban underground space: A critical issue for the decision-making of urban underground space development. Land use Policy, 69, 12-24. [CrossRef]
- Ramalho, J. (2019). Worlding aspirations and resilient futures: Framings of risk and contemporary city-making in Metro Cebu, the Philippines. Asia Pacific Viewpoint, 60(1), 24-36. [CrossRef]
- Rumson, A. G., & Hallett, S. H. (2019). Innovations in the use of data facilitating insurance as a resilience mechanism for coastal flood risk. Science of the Total Environment, 661, 598-612. [CrossRef]
- Saleem Ashraf, M. L., Iftikhar, M., Ashraf, I., & Hassan, Z. Y. (2017). Understanding flood risk management in Asia: concepts and challenges. Flood Risk Management; InTechOpen: London, UK, 177.
- Santillan, J. R., Marqueso, J. T., Makinano-Santillan, M., & Serviano, J. L. (2016). Beyond flood hazard maps: Detailed flood characterization with remote sensing, gis and 2D modelling. The International Archives of the Photogrammetry, Remote Sensing and Spatial Information Sciences, 42, 315-323. [CrossRef]
- Schmidt-Thomé, P., Greiving, S., Kallio, H., Fleischhauer, M., & Jarva, J. (2006). Economic risk maps of floods and earthquakes for European regions. Quaternary International, 150(1), 103-112. [CrossRef]
- Schuch, G., Serrao-Neumann, S., Morgan, E., & Choy, D. L. (2017). Water in the city: Green open spaces, land use planning and flood management–An Australian case study. Land use Policy, 63, 539-550. [CrossRef]
- Scott, M., White, I., Kuhlicke, C., Steinführer, A., Sultana, P., Thompson, P., ... & Russell, E. (2013). Living with flood risk/The more we know, the more we know we don't know: Reflections on a decade of planning, flood risk management and false precision/Searching for resilience or building social capacities for flood risks? Participatory floodplain management: Lessons from Bangladesh/Planning and retrofitting for floods: Insights from Australia/Neighborhood design considerations in flood risk management/Flood risk management– Challenges to the effective implementation of a paradigm shift. Planning Theory & Practice, 14(1), 103-140.
- Silva, S. F., Martinho, M., Capitão, R., Reis, T., Fortes, C. J., & Ferreira, J. C. (2017). An index-based method for coastal-flood risk assessment in low-lying areas (Costa de Caparica, Portugal). Ocean & Coastal Management, 144, 90-104. [CrossRef]
- Smith, N., Brown, C., McDonald, G., Ayers, M., Kipp, R., & Saunders, W. (2017). Challenges and opportunities for economic evaluation of disaster risk decisions. Economics of Disasters and Climate Change, 1(1), 111-120. [CrossRef]
- Sovacool, B. K. (2021). Who are the victims of low-carbon transitions? Towards a political ecology of climate change mitigation. Energy Research & Social Science, 73, 101916. [CrossRef]
- Stevens, M. R., & Hanschka, S. (2014). Municipal flood hazard mapping: the case of British Columbia, Canada. [CrossRef]
- Natural Hazards, 73, 907-932.
- Turner, B. A. (2020). The organizational and interorganizational development of disasters. In Risk Management (pp. [CrossRef]
- 145-164). Routledge.
- Ueckerdt, F., Bauer, C., Dirnaichner, A., Everall, J., Sacchi, R., & Luderer, G. (2021). Potential and risks of hydrogen- based e-fuels in climate change mitigation. Nature Climate Change, 11(5), 384-393. [CrossRef]
- Van Alphen, J., Martini, F., Loat, R., Slomp, R., & Passchier, R. (2009). Flood risk mapping in Europe, experiences and best practices. Journal of Flood Risk Management, 2(4), 285-292. [CrossRef]
- Wang, Y., Li, Z., Tang, Z., & Zeng, G. (2011). A GIS-based spatial multi-criteria approach for flood risk assessment in the Dongting Lake Region, Hunan, Central China. Water Resources Management, 25, 3465-3484. [CrossRef]
- Wang, T., Yang, L., Wu, S., Gao, J., & Wei, B. (2020). Quantitative assessment of natural disaster coping capacity: An application for typhoons. Sustainability, 12(15), 5949. [CrossRef]
- Yang, Z., Zhao, T., Tian, Y., Zhang, Y., & Chen, X. (2022). An integrated assessment of tropical cyclone risks in mainland China by considering hazard, exposure, vulnerability and mitigation. Hydrology Research, 53(8), 1090-1106. [CrossRef]
- Yu, M., Yang, C., & Li, Y. (2018). Big data in natural disaster management: a review. Geosciences, 8(5), 165. [CrossRef]
Figure 3.
Hazard risk index of the HUCs of Metro Cebu.
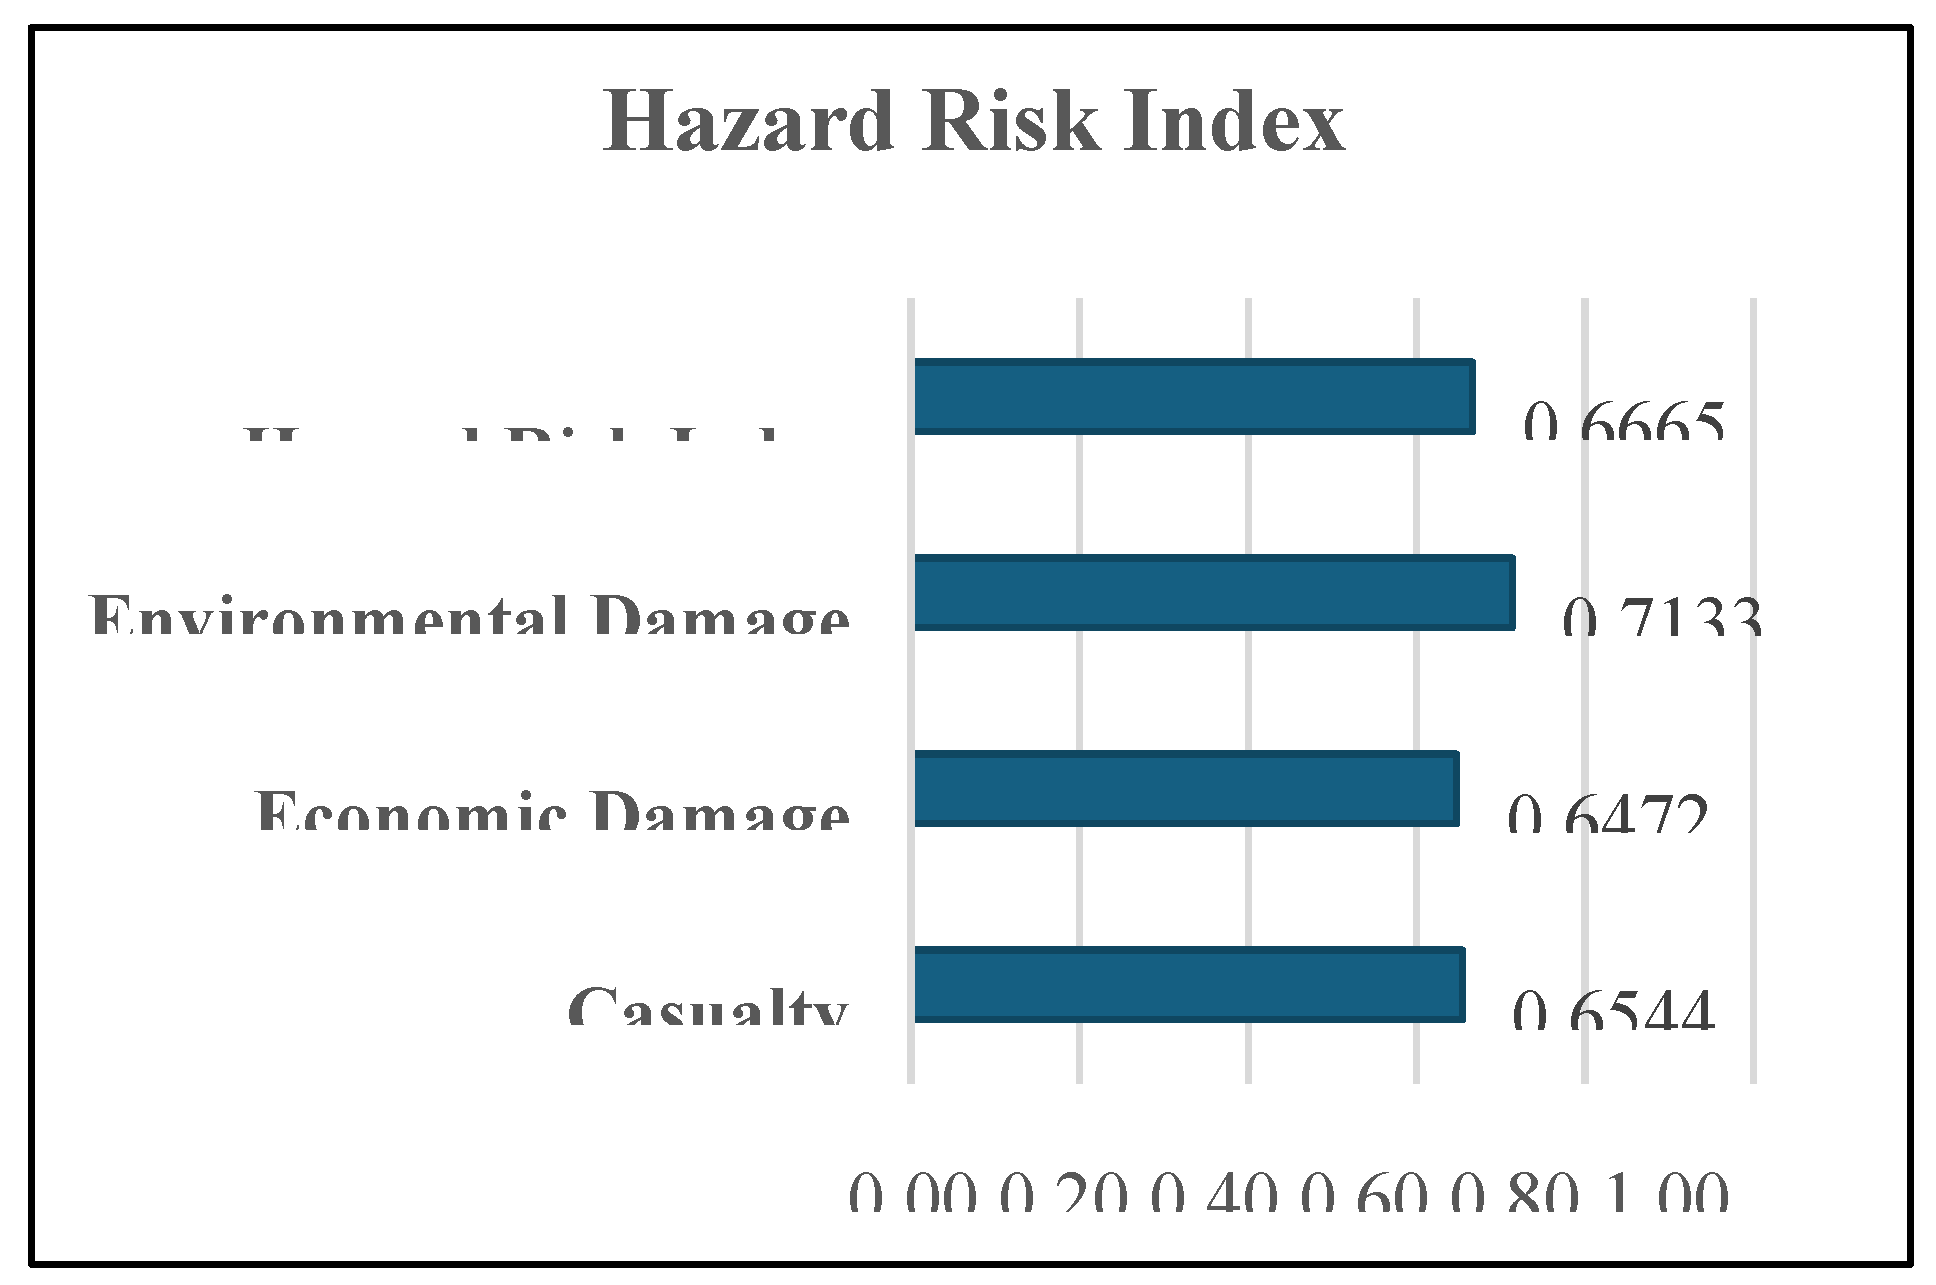
Figure 4.
Exposure risk index of the HUCs of Metro Cebu.
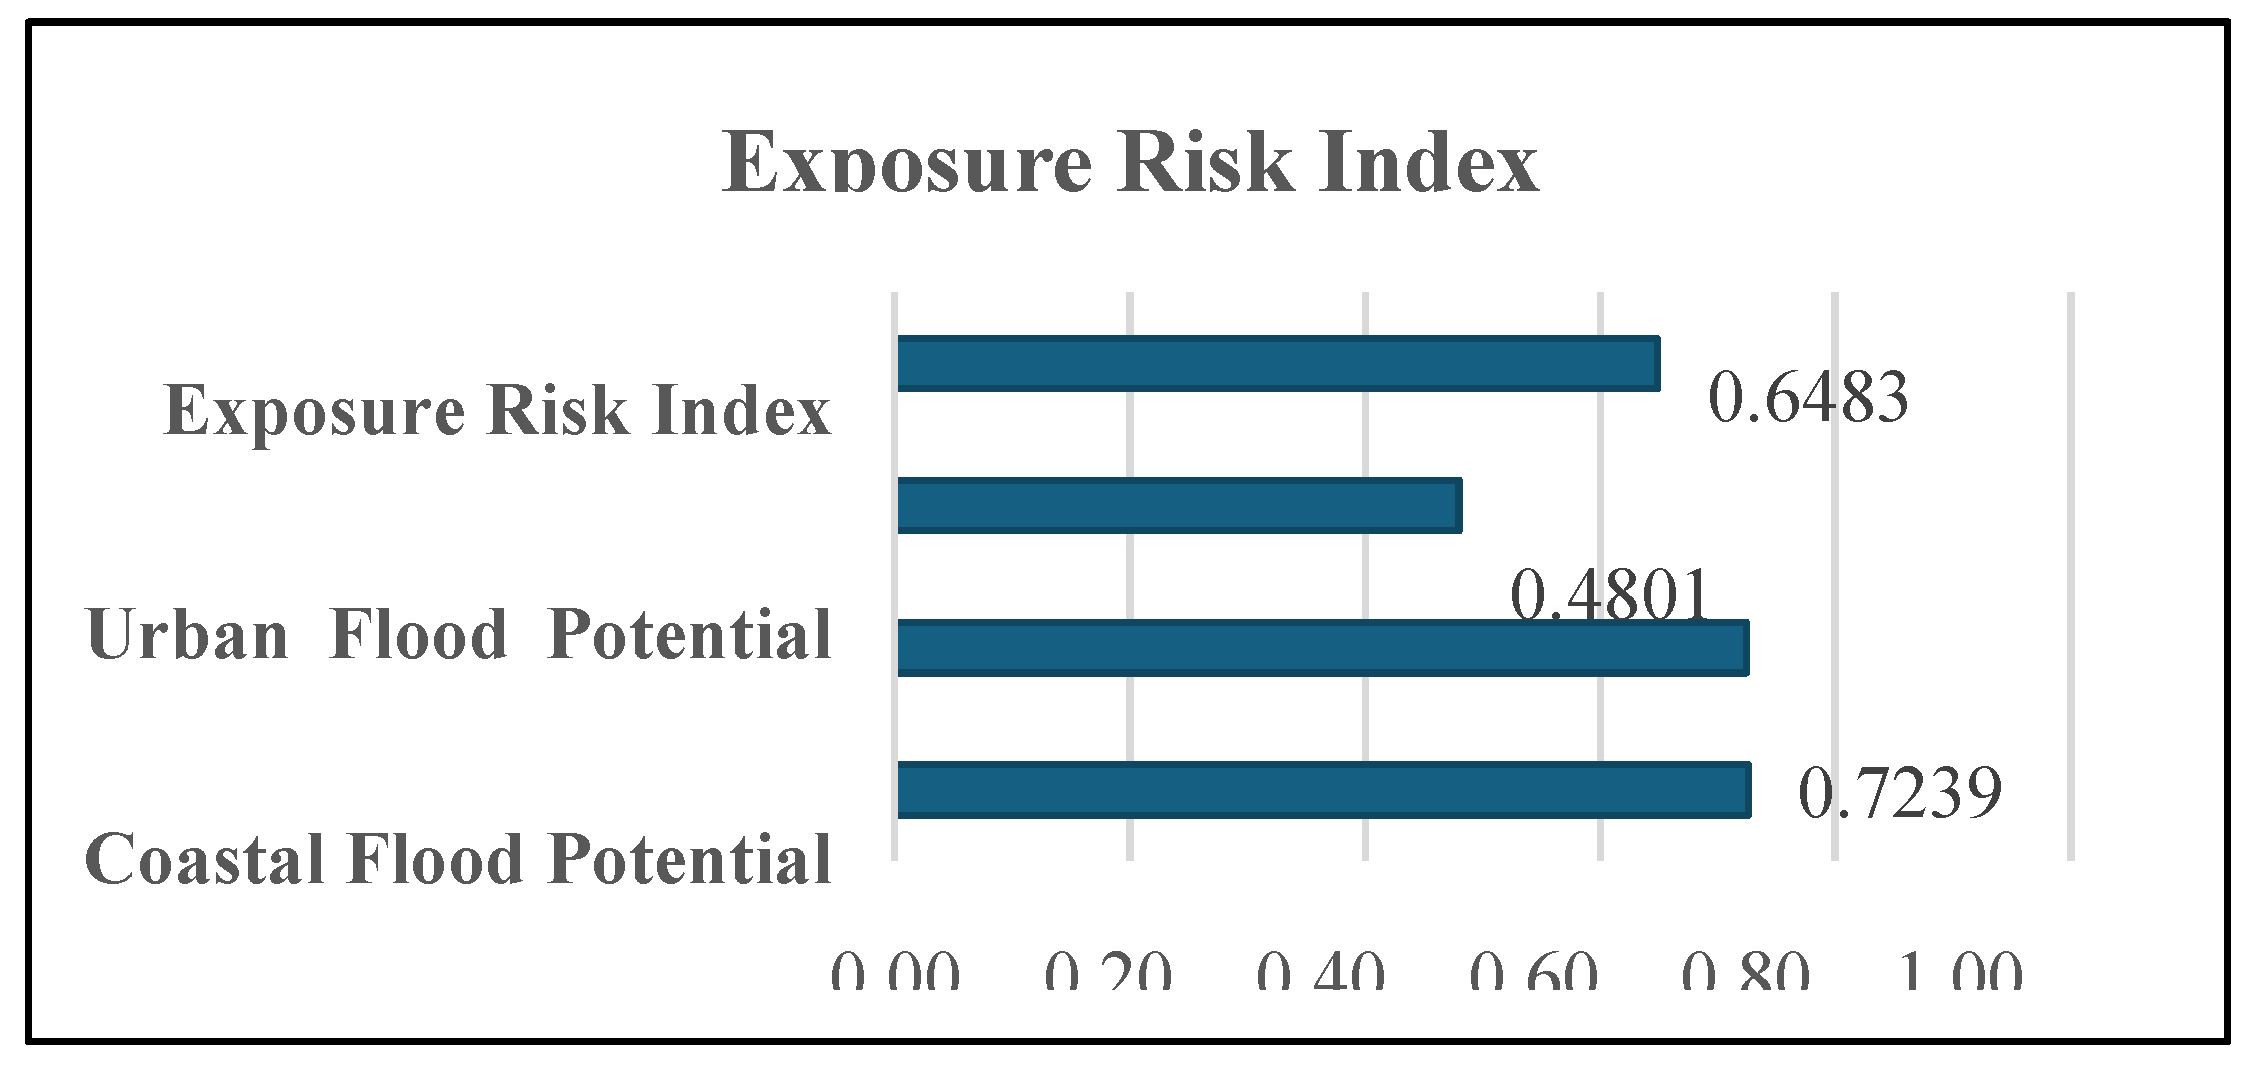
Figure 5.
Vulnerability risk index of the HUCs of Metro Cebu.
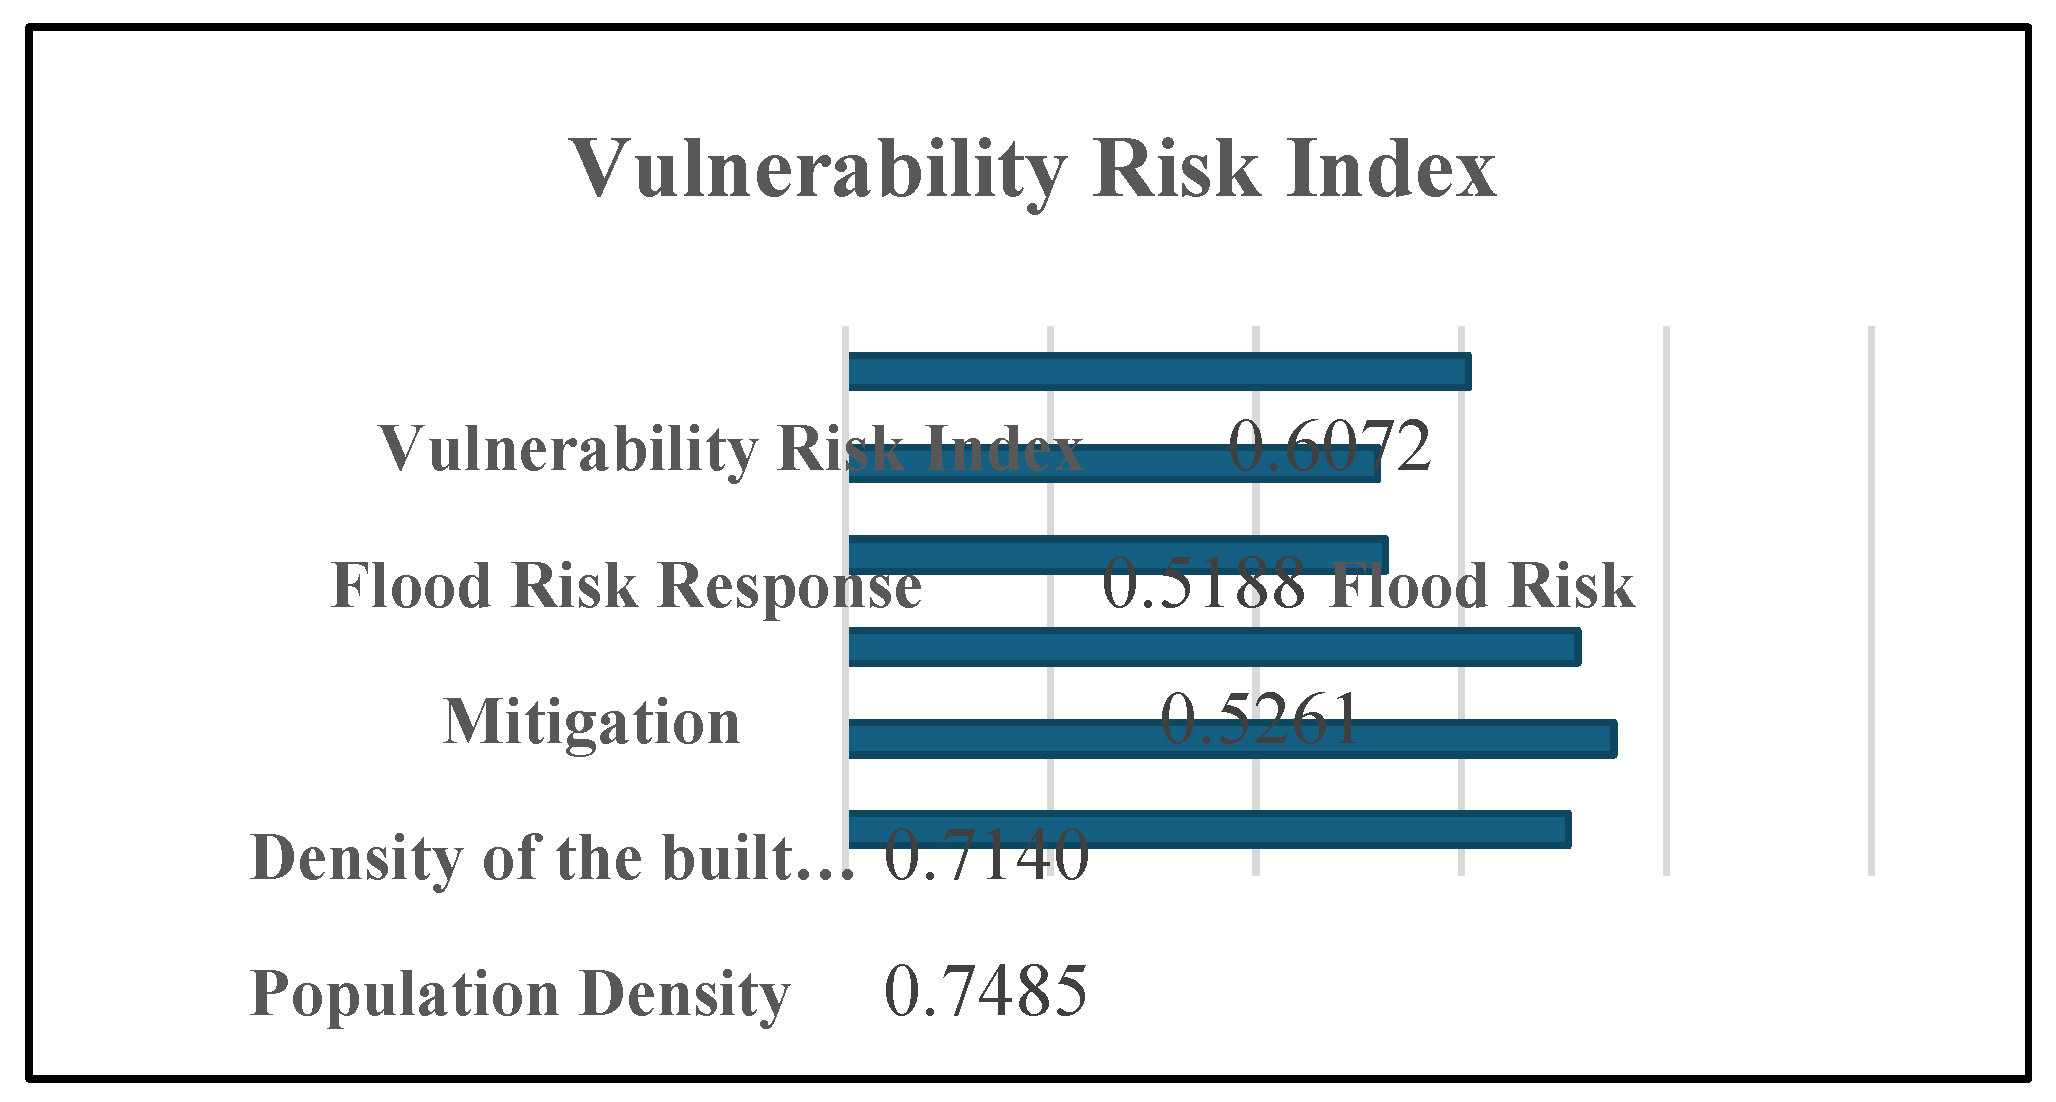
Figure 6.
Composite Flood Risk Index of Metro Cebu.
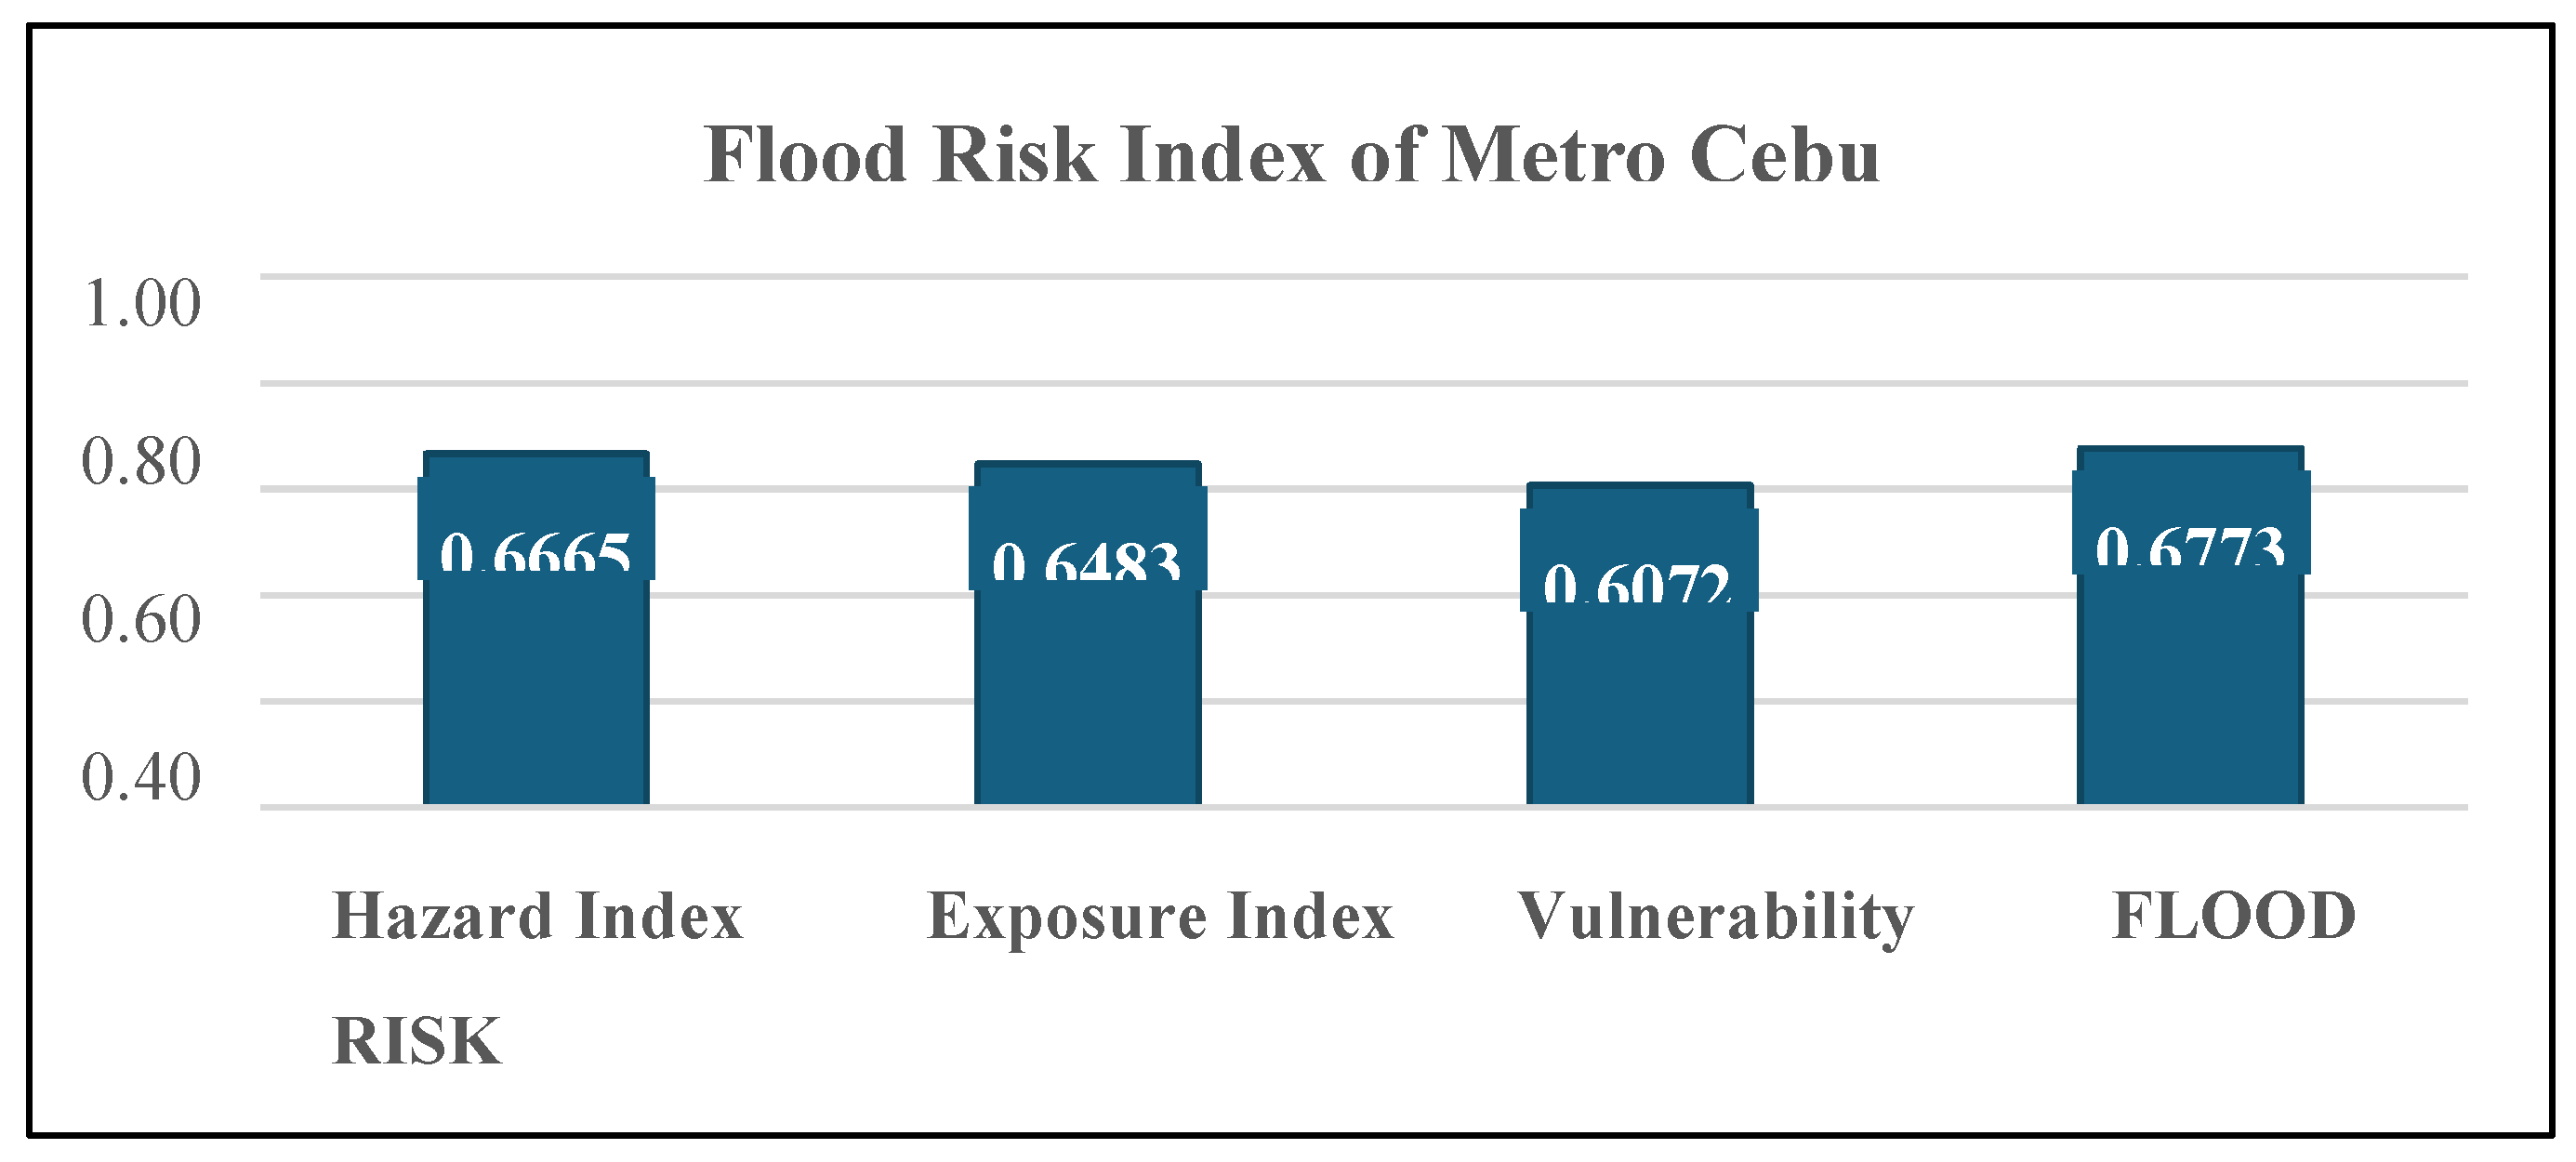
Figure 7.
Flood Hazard Map of Cebu City.
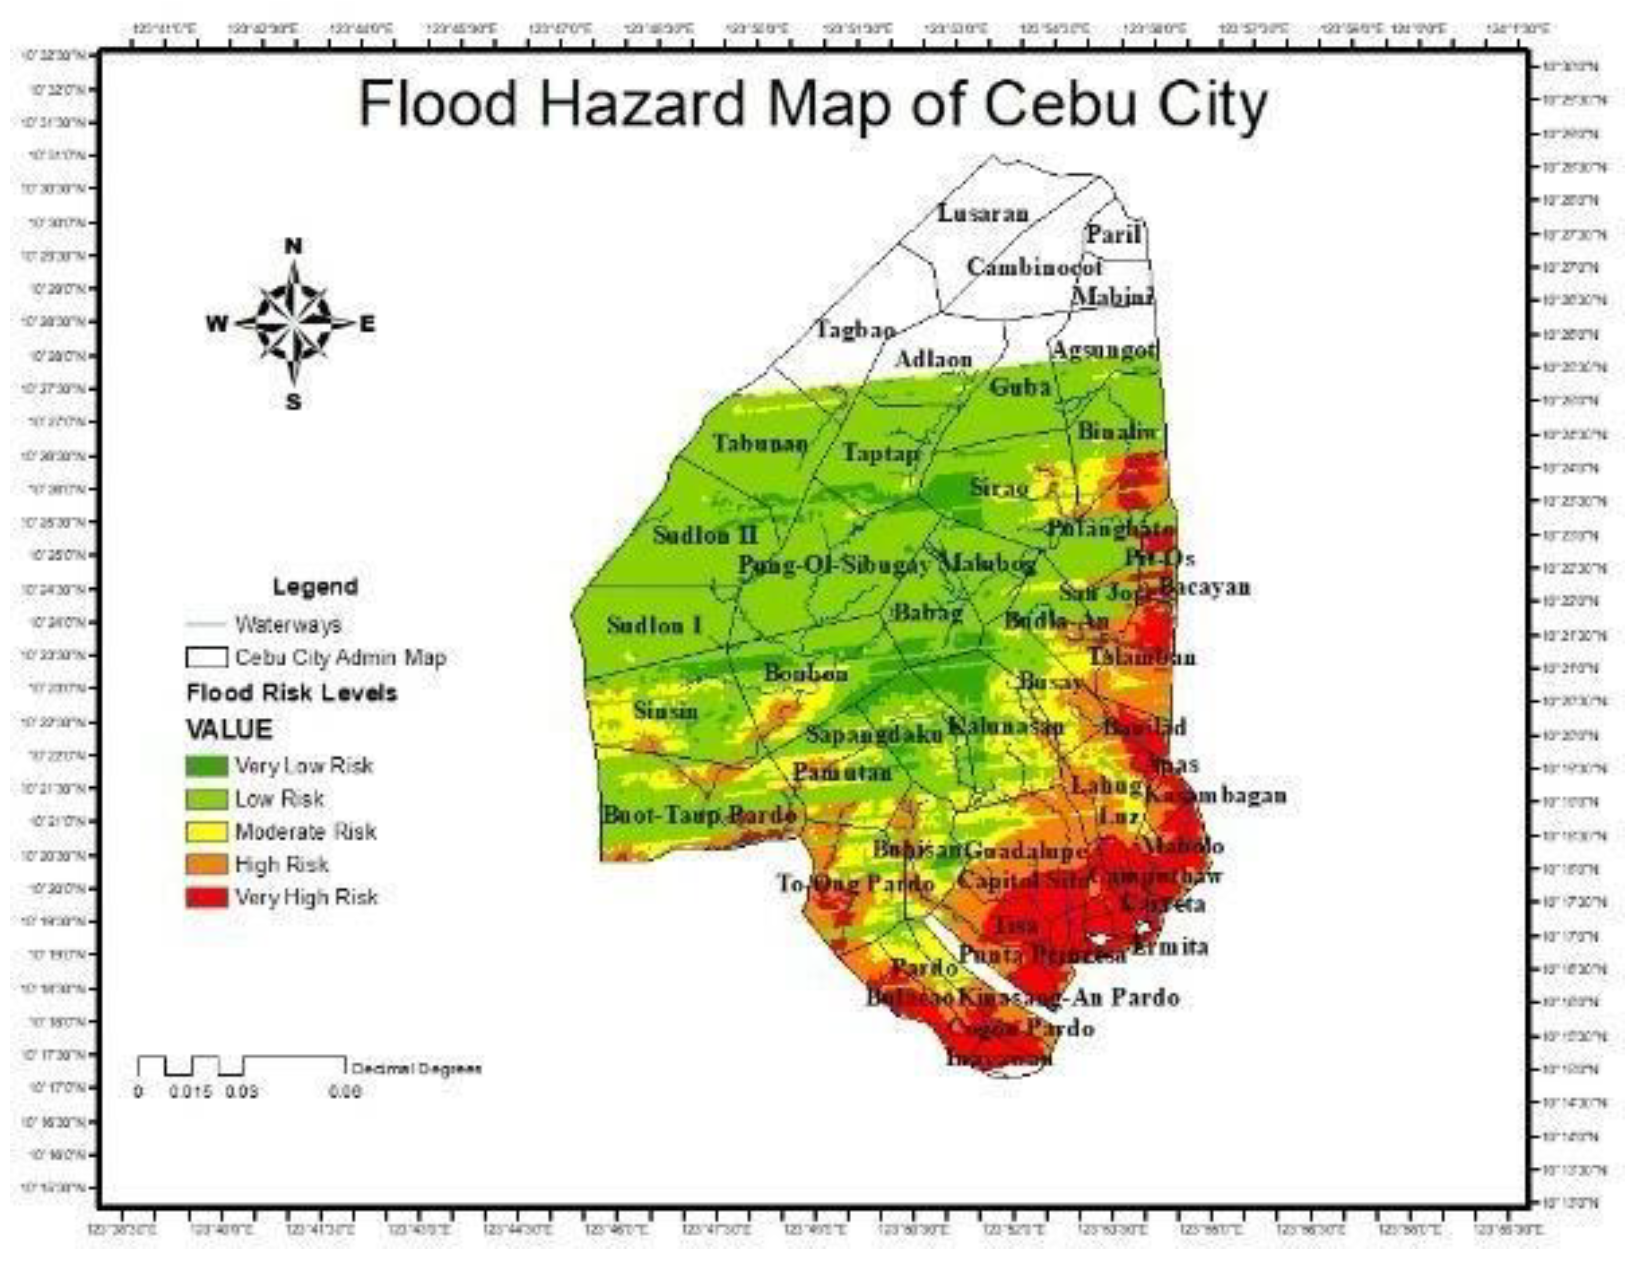
Figure 8.
Flood Hazard Map of Mandaue City.
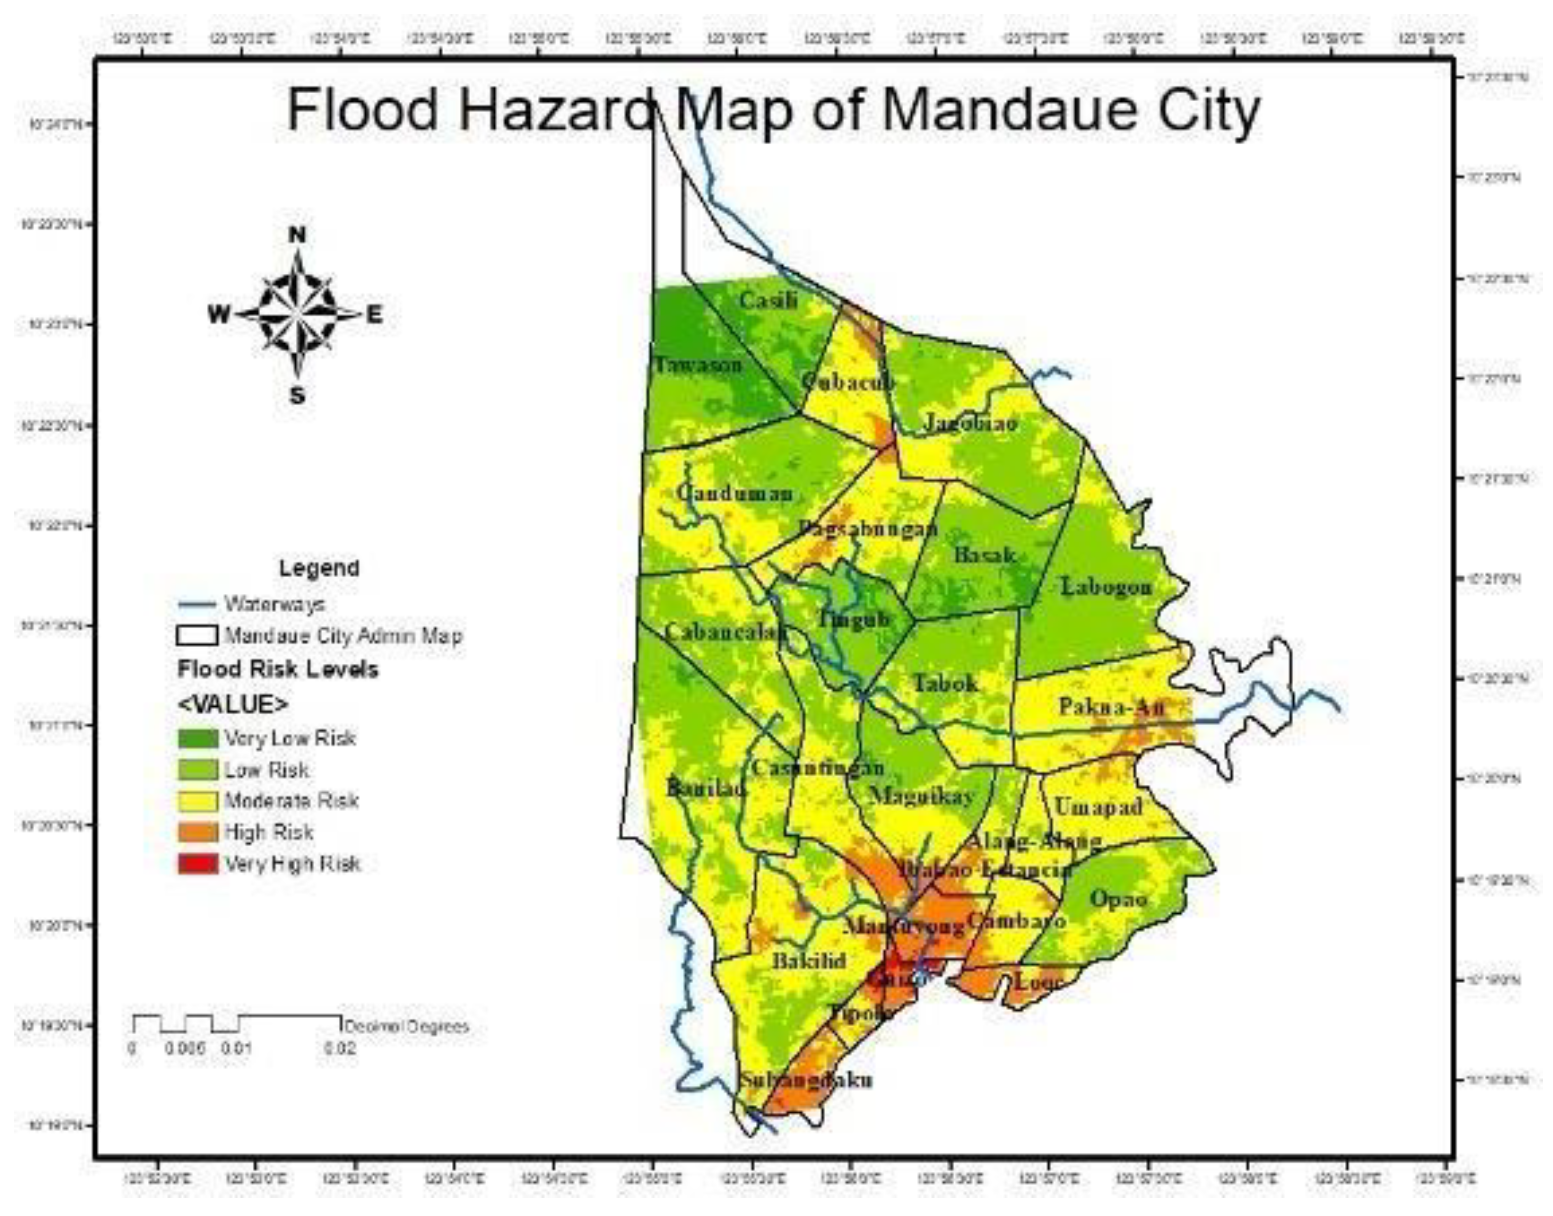
Figure 9.
Flood Hazard Map of Lapu-Lapu City.
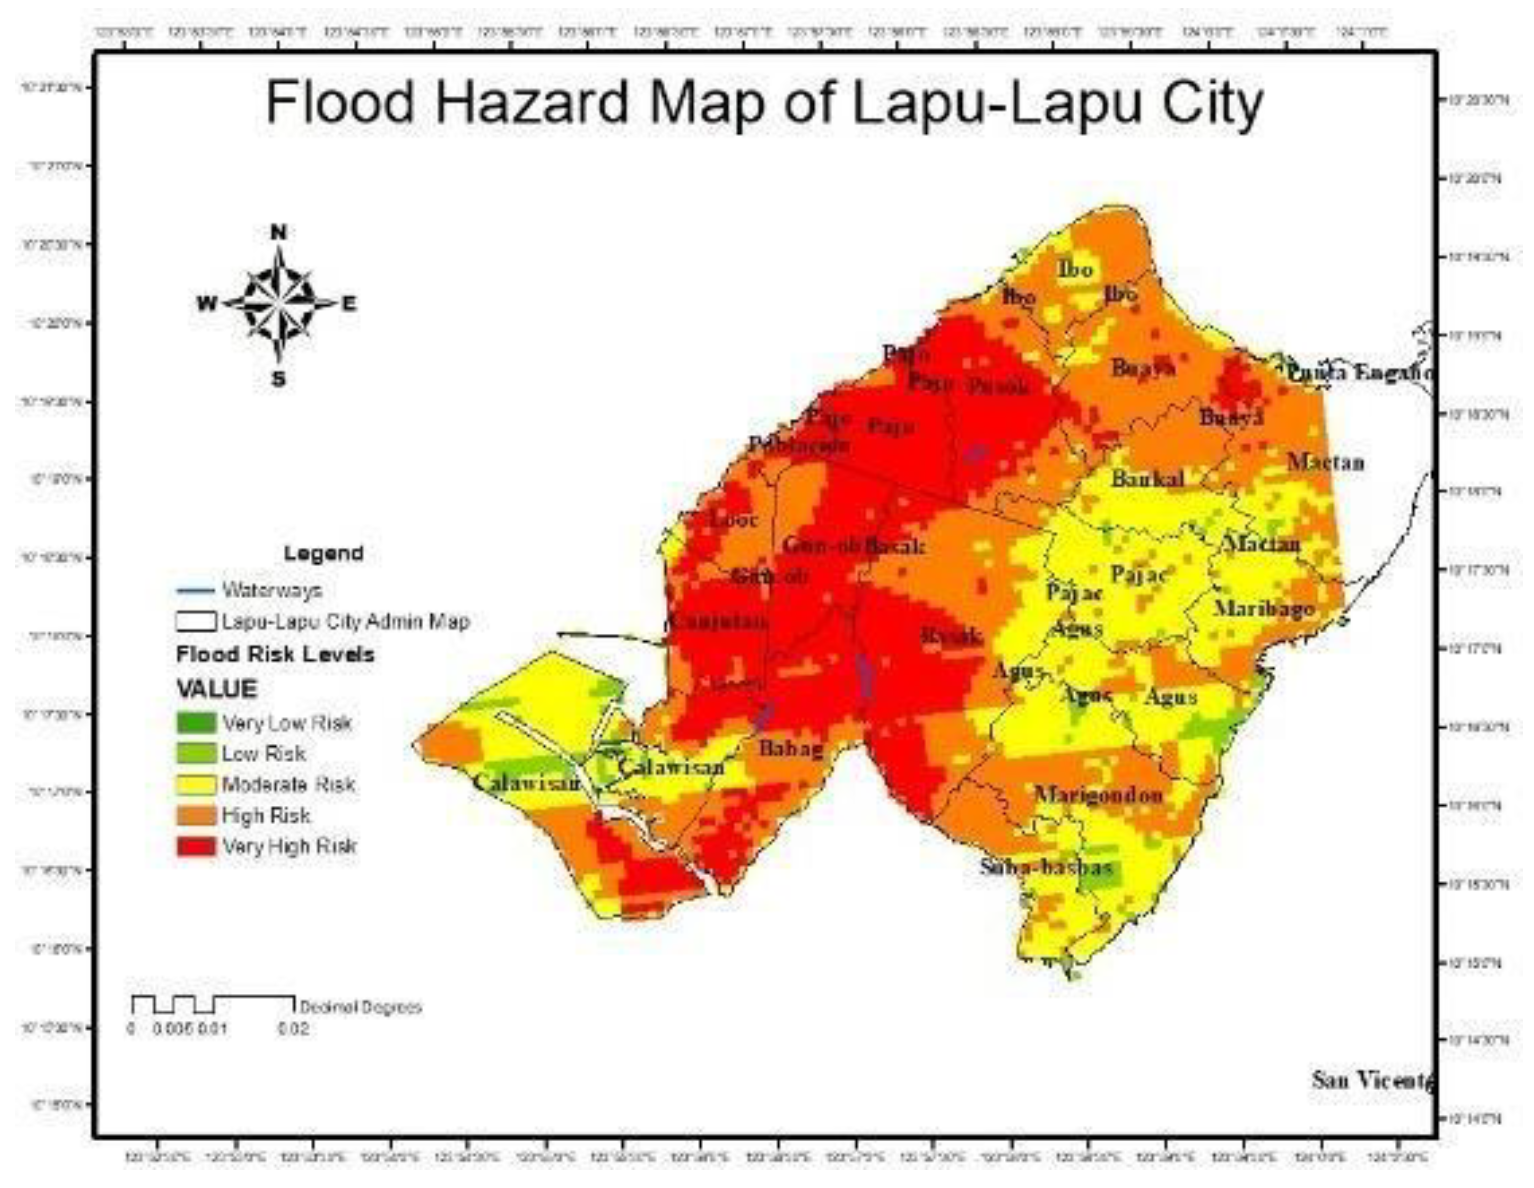

Table 1.
HEV flood risk indicator.
| Risk Dimension |
Brief description | Measurement | Reference |
| Hazards | |||
| Casualty | Historical deaths consequent to flood events |
Average historical deaths associated with flood |
Tyler et al., 2019 |
| Economic damage | Value of disruption to livelihood, businesses, and other economic activities |
The average total monetary value of historical damages associated with flood | Zeng et al., 2019 |
| Environmental damage | Release of hazardous material due to flood-damaged infrastructures or equipment |
Historical accounts of hazardous emissions consequent to damages by flood |
Talbot et al., 2018; Stuyt et al., 2007 |
| Exposure | |||
| River flood potential | Level of susceptibility to river flooding | River flood simulation using HEC-RAS | Onuşluel Gül, 2013; Vojtek & Vojteková, 2016 |
| Coastal flood potential | Level of susceptibility to coastal flooding | Using Balica et al. (2012)’s exposure items for coastal flood |
Balica et al., 2012 |
| Urban flood potential | Level of susceptibility to urban flooding | Data mining for the sub-indicators describing the risk of urban flood |
Taromideh et al., 2022; Hu et al., 2017 |
| Vulnerability | |||
| Socio- demographic characteristic | Flood factors following Koks et al. (2015) framework (socio- demographic) | Data mining for each item of Koks et al. (2015)’s framework | Koks et al., 2015; Pérez- Morales et al., 2018; Nasiri et al., 2016 |
| Population density | Total number of people susceptible to flooding |
Number of people obtained from census data | Koks et al., 2015; Nasiri et al., 2016 |
| Density of the built environment | Density of infrastructures in high flood potential areas | Records on the number of built infrastructure and households | Cutter et al., 2000; Wu et al., 2002; Koks et al., 2015; |
| Flood risk mitigation measures | Status and quality of mitigation measures | Vermont framework for flood mitigation measures | Bulti et al., 2019; Nasiri et al., 2016; Balica & Wright, 2010 |
| Flood risk response measures | Status and quality of response measures | Vermont framework for flood response measures | Bulti et al., 2019; Nasiri et al., 2016; Balica & Wright, 2010 |
Table 2.
Flood Risk Indicators (Hazard Dimension) - Results from HUCs.
| Hazard flood risk indicators |
Cebu City | Mandaue City | Lapu-Lapu City |
| Casualty | 31 – 70 casualties |
11-30 casualties | 31-70 casualties |
| Economic Damage | ₱500,000- ₱1,000,000 |
₱500,000- ₱1,000,000 |
₱100,000 - ₱500,000 |
| Environmental Damage |
High | Moderate | Low |
Table 3.
Flood risk indicators (Exposure Dimension) – Results from HUCs.
| Exposure flood risk indicators |
Cebu City | Mandaue City | Lapu-Lapu City | |
| River Flood Potential | ||||
|
2.0 - 4.0 m | 2.0 - 4.0 m | 1.0 - 2.0 m | |
|
60 – 90% | 30 – 60% | 10 – 30% | |
|
10,000 – 100,000 people |
1,000 – 10,000 people |
100 – 1000 people |
|
| Coastal Flood Potential | ||||
|
9 – 11 typhoons | 9 – 11 typhoons | 9 – 11 typhoons |
|
|
150 – 300 m3/s | 50 – 150 m3/s | Less than 10 m3/s |
|
|
Steeply sloping | Moderately sloping |
Gently sloping | |
|
5 – 10 mm | 5 – 10 mm | Less than 1 mm |
|
|
very high | moderate | high | |
|
10,000 – 100,000 people |
10,000 – 100,000 people |
1,000 – 10,000 people |
|
|
5 – 10% | 2 – 5% | 5 – 10% | |
|
Moderately uncontrolled | Moderately uncontrolled | Mostly controlled | |
| Urban Flood Potential | ||||
|
coarse | fine | Coarse | |
|
settlement | settlement | settlement | |
Table 4.
Flood risk indicators (Vulnerability Dimension) – Results from HUCs.
| Vulnerability flood risk indicators |
Cebu City | Mandaue City | Lapu-Lapu City |
| Socio-demographic characteristic | |||
|
Low socioeconomic status |
Moderate socioeconomic status |
High socioeconomic status |
|
60 – 90% below 15 and above 60 yrs. old |
60 – 90% below 15 and above 60 yrs. old |
30 – 60% below 15 and above 60 yrs. old |
|
30 – 50% | 5 – 10% | 5 – 10% |
|
30 – 60% more than 50 yrs. old | <30% more than 50 yrs. od | 30 – 60% more than 50 yrs. old |
| Population Density | high | high | moderate |
| Density of the built environment |
high | moderate | low |
| Flood risk mitigation measures | |||
|
2 | 2 | 3 |
|
3 | 3 | 3 |
|
2 | 3 | 2 |
| Flood risk response measures |
2 | 3 | 3 |
Table 5.
Priority weights of the flood risk indicators.
| Rank | Flood Risk Indicators | LOWER | UPPER | CRISP |
| 1 | Economic Damage | 0.1376 | 0.1187 | 0.1353 |
| 2 | Casualty | 0.1143 | 0.1376 | 0.1175 |
| 3 | Flood Risk Response Measures |
0.0973 | 0.1157 | 0.0994 |
| 4 | Flood Risk Mitigation Measures |
0.0838 | 0.1135 | 0.0870 |
| 5 | Environmental Damage | 0.0838 | 0.1079 | 0.0863 |
| 6 | River Flood Potential | 0.0786 | 0.1079 | 0.0816 |
| 7 | Coastal Flood Potential | 0.0769 | 0.0967 | 0.0787 |
| 8 | Urban Flood Potential | 0.0721 | 0.0851 | 0.0732 |
| 9 | Density of the built environment |
0.0468 | 0.0619 | 0.0477 |
| 10 | Socio-demographic characteristics |
0.0442 | 0.0661 | 0.0456 |
| 11 | Population Density | 0.0432 | 0.0686 | 0.0449 |
Table 6.
Priority weights of spatial and temporal flood risk indicators for FUCOM Overlay.
| Flood Risk Indicators | Priority Weights |
| River Flood Potential | 0.34953 |
| Distance from Rivers | 0.17477 |
| Population Density | 0.17477 |
| Coastal Flood Potential | 0.33716 |
| Rainfall Distribution | 0.06743 |
| Elevation | 0.06743 |
| Slope | 0.06743 |
| Population Density | 0.06743 |
| Distance to Coastline | 0.06743 |
| Urban Flood Potential | 0.31331 |
| Drainage Density | 0.15665 |
| Land use/Land Cover | 0.15665 |
Disclaimer/Publisher’s Note: The statements, opinions and data contained in all publications are solely those of the individual author(s) and contributor(s) and not of MDPI and/or the editor(s). MDPI and/or the editor(s) disclaim responsibility for any injury to people or property resulting from any ideas, methods, instructions or products referred to in the content. |
© 2026 by the authors. Licensee MDPI, Basel, Switzerland. This article is an open access article distributed under the terms and conditions of the Creative Commons Attribution (CC BY) license (http://creativecommons.org/licenses/by/4.0/).
Copyright: This open access article is published under a Creative Commons CC BY 4.0 license, which permit the free download, distribution, and reuse, provided that the author and preprint are cited in any reuse.


