
Submitted:
08 February 2026
Posted:
09 February 2026
You are already at the latest version
Abstract
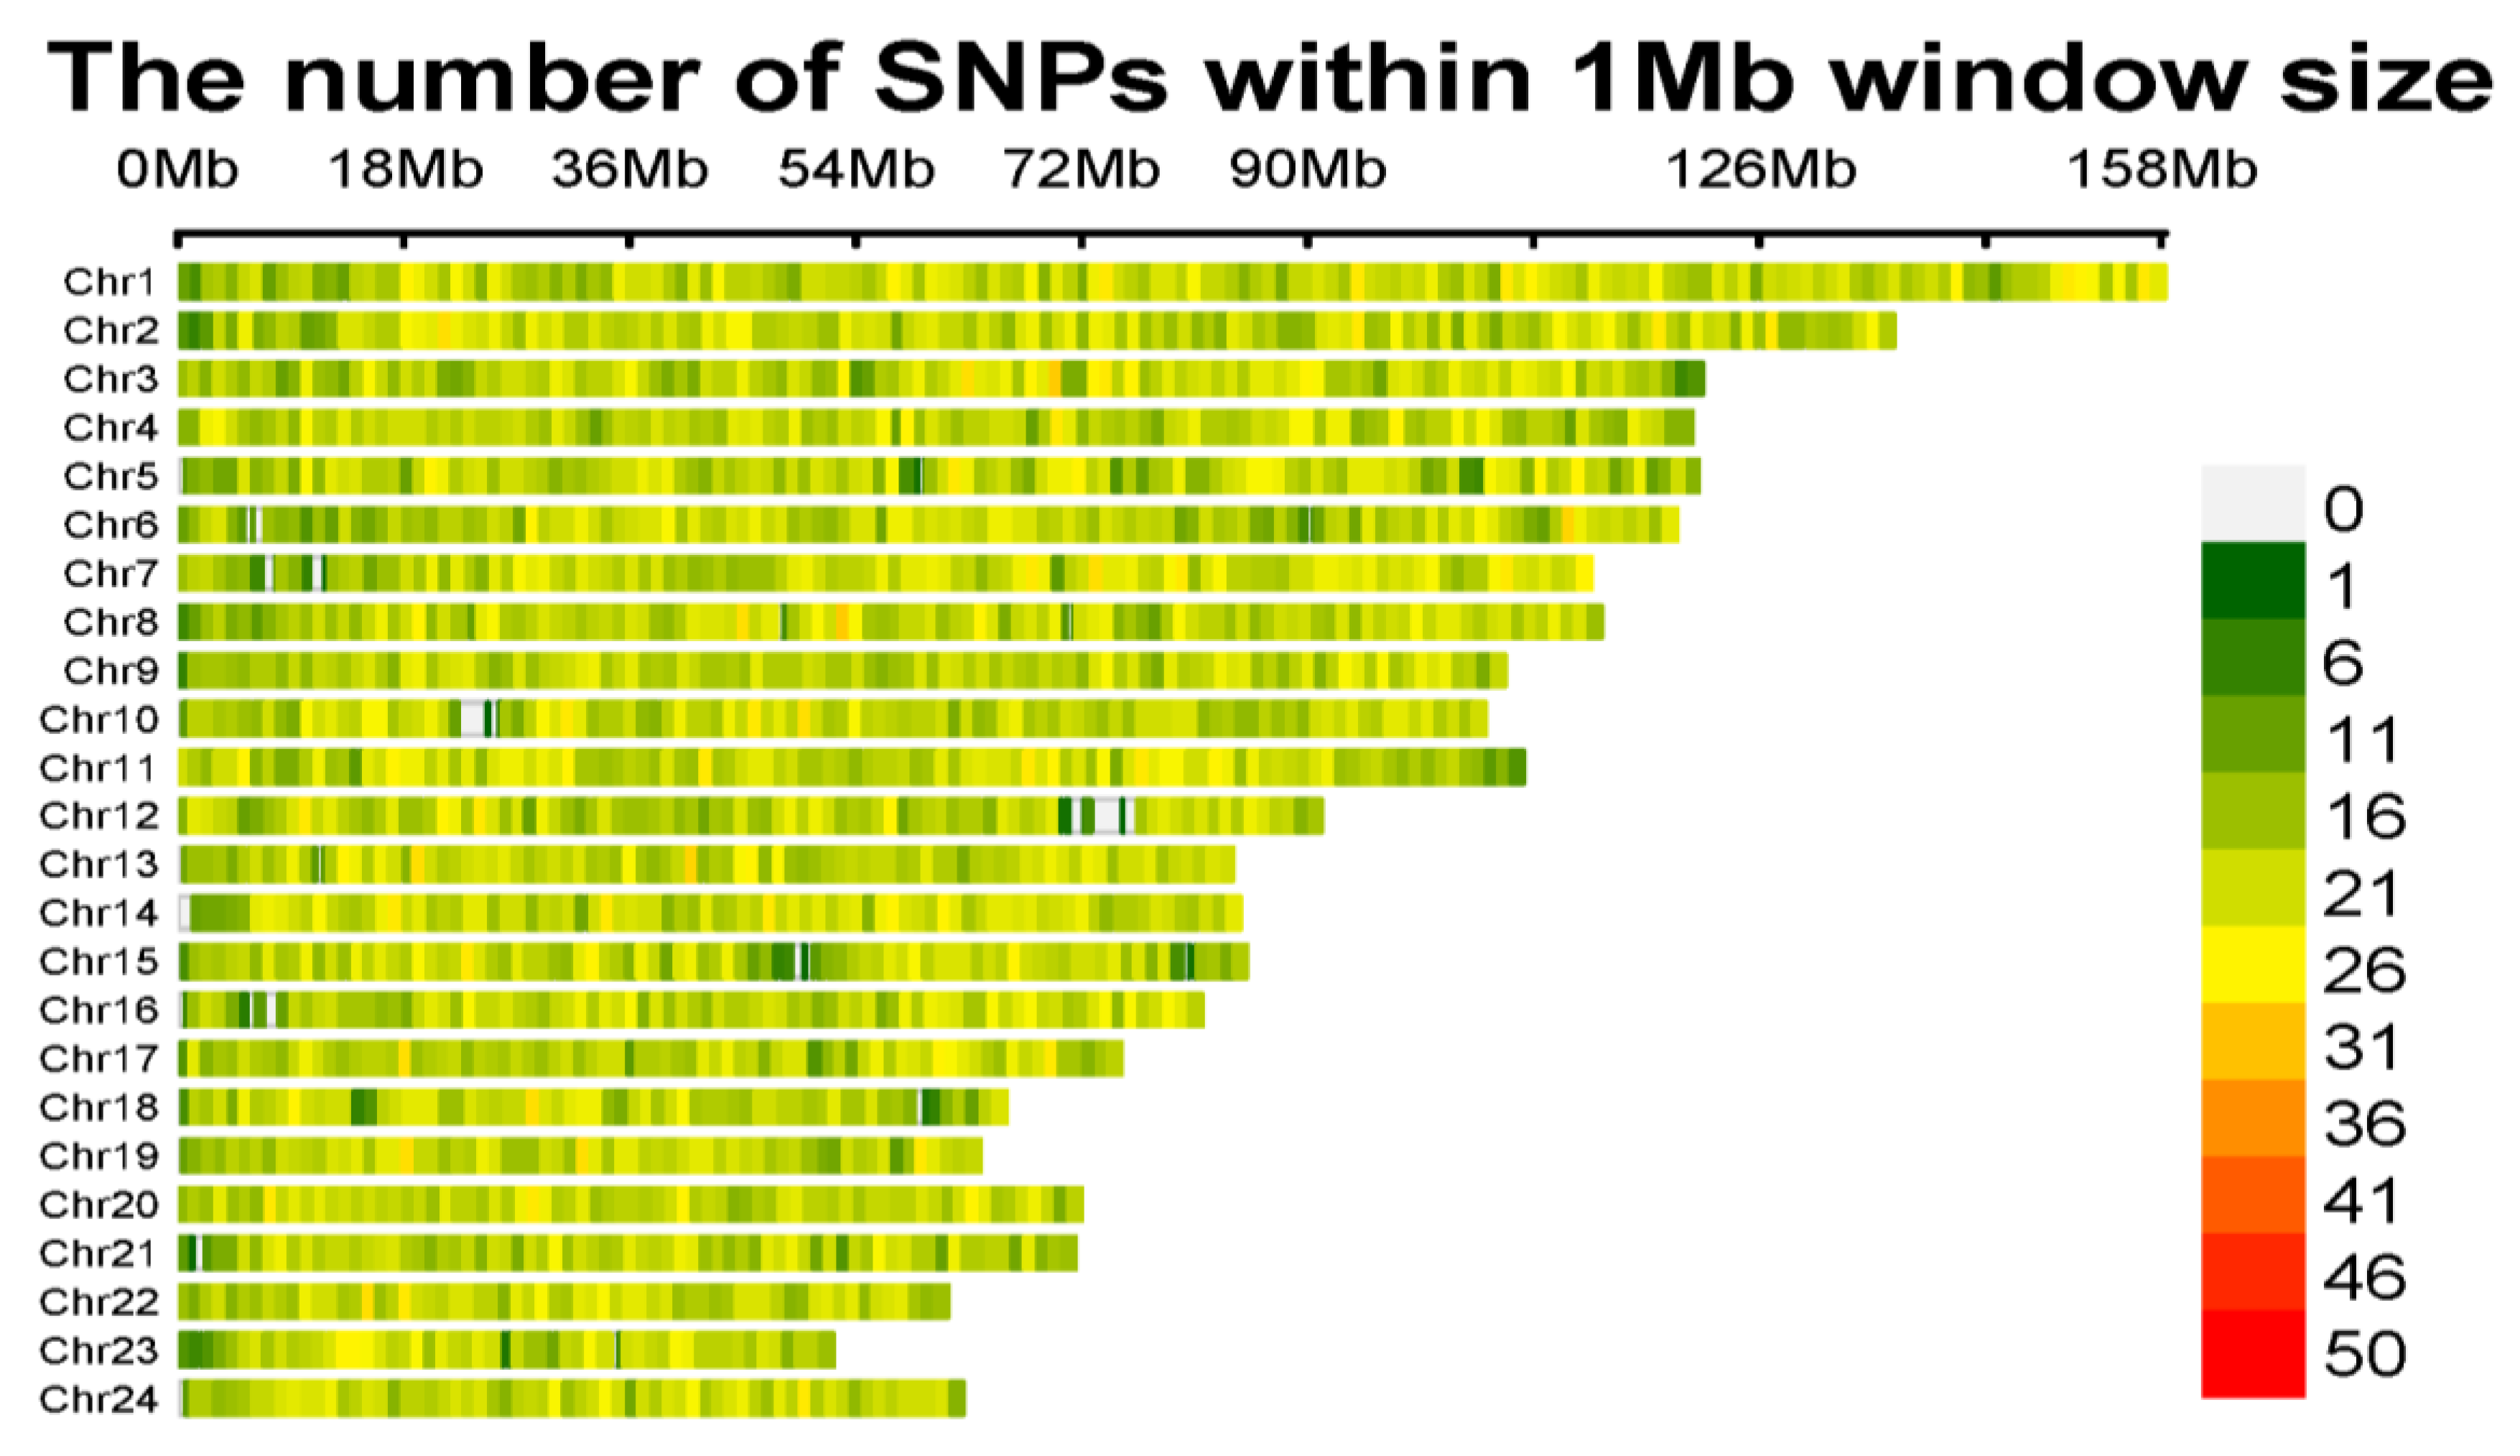
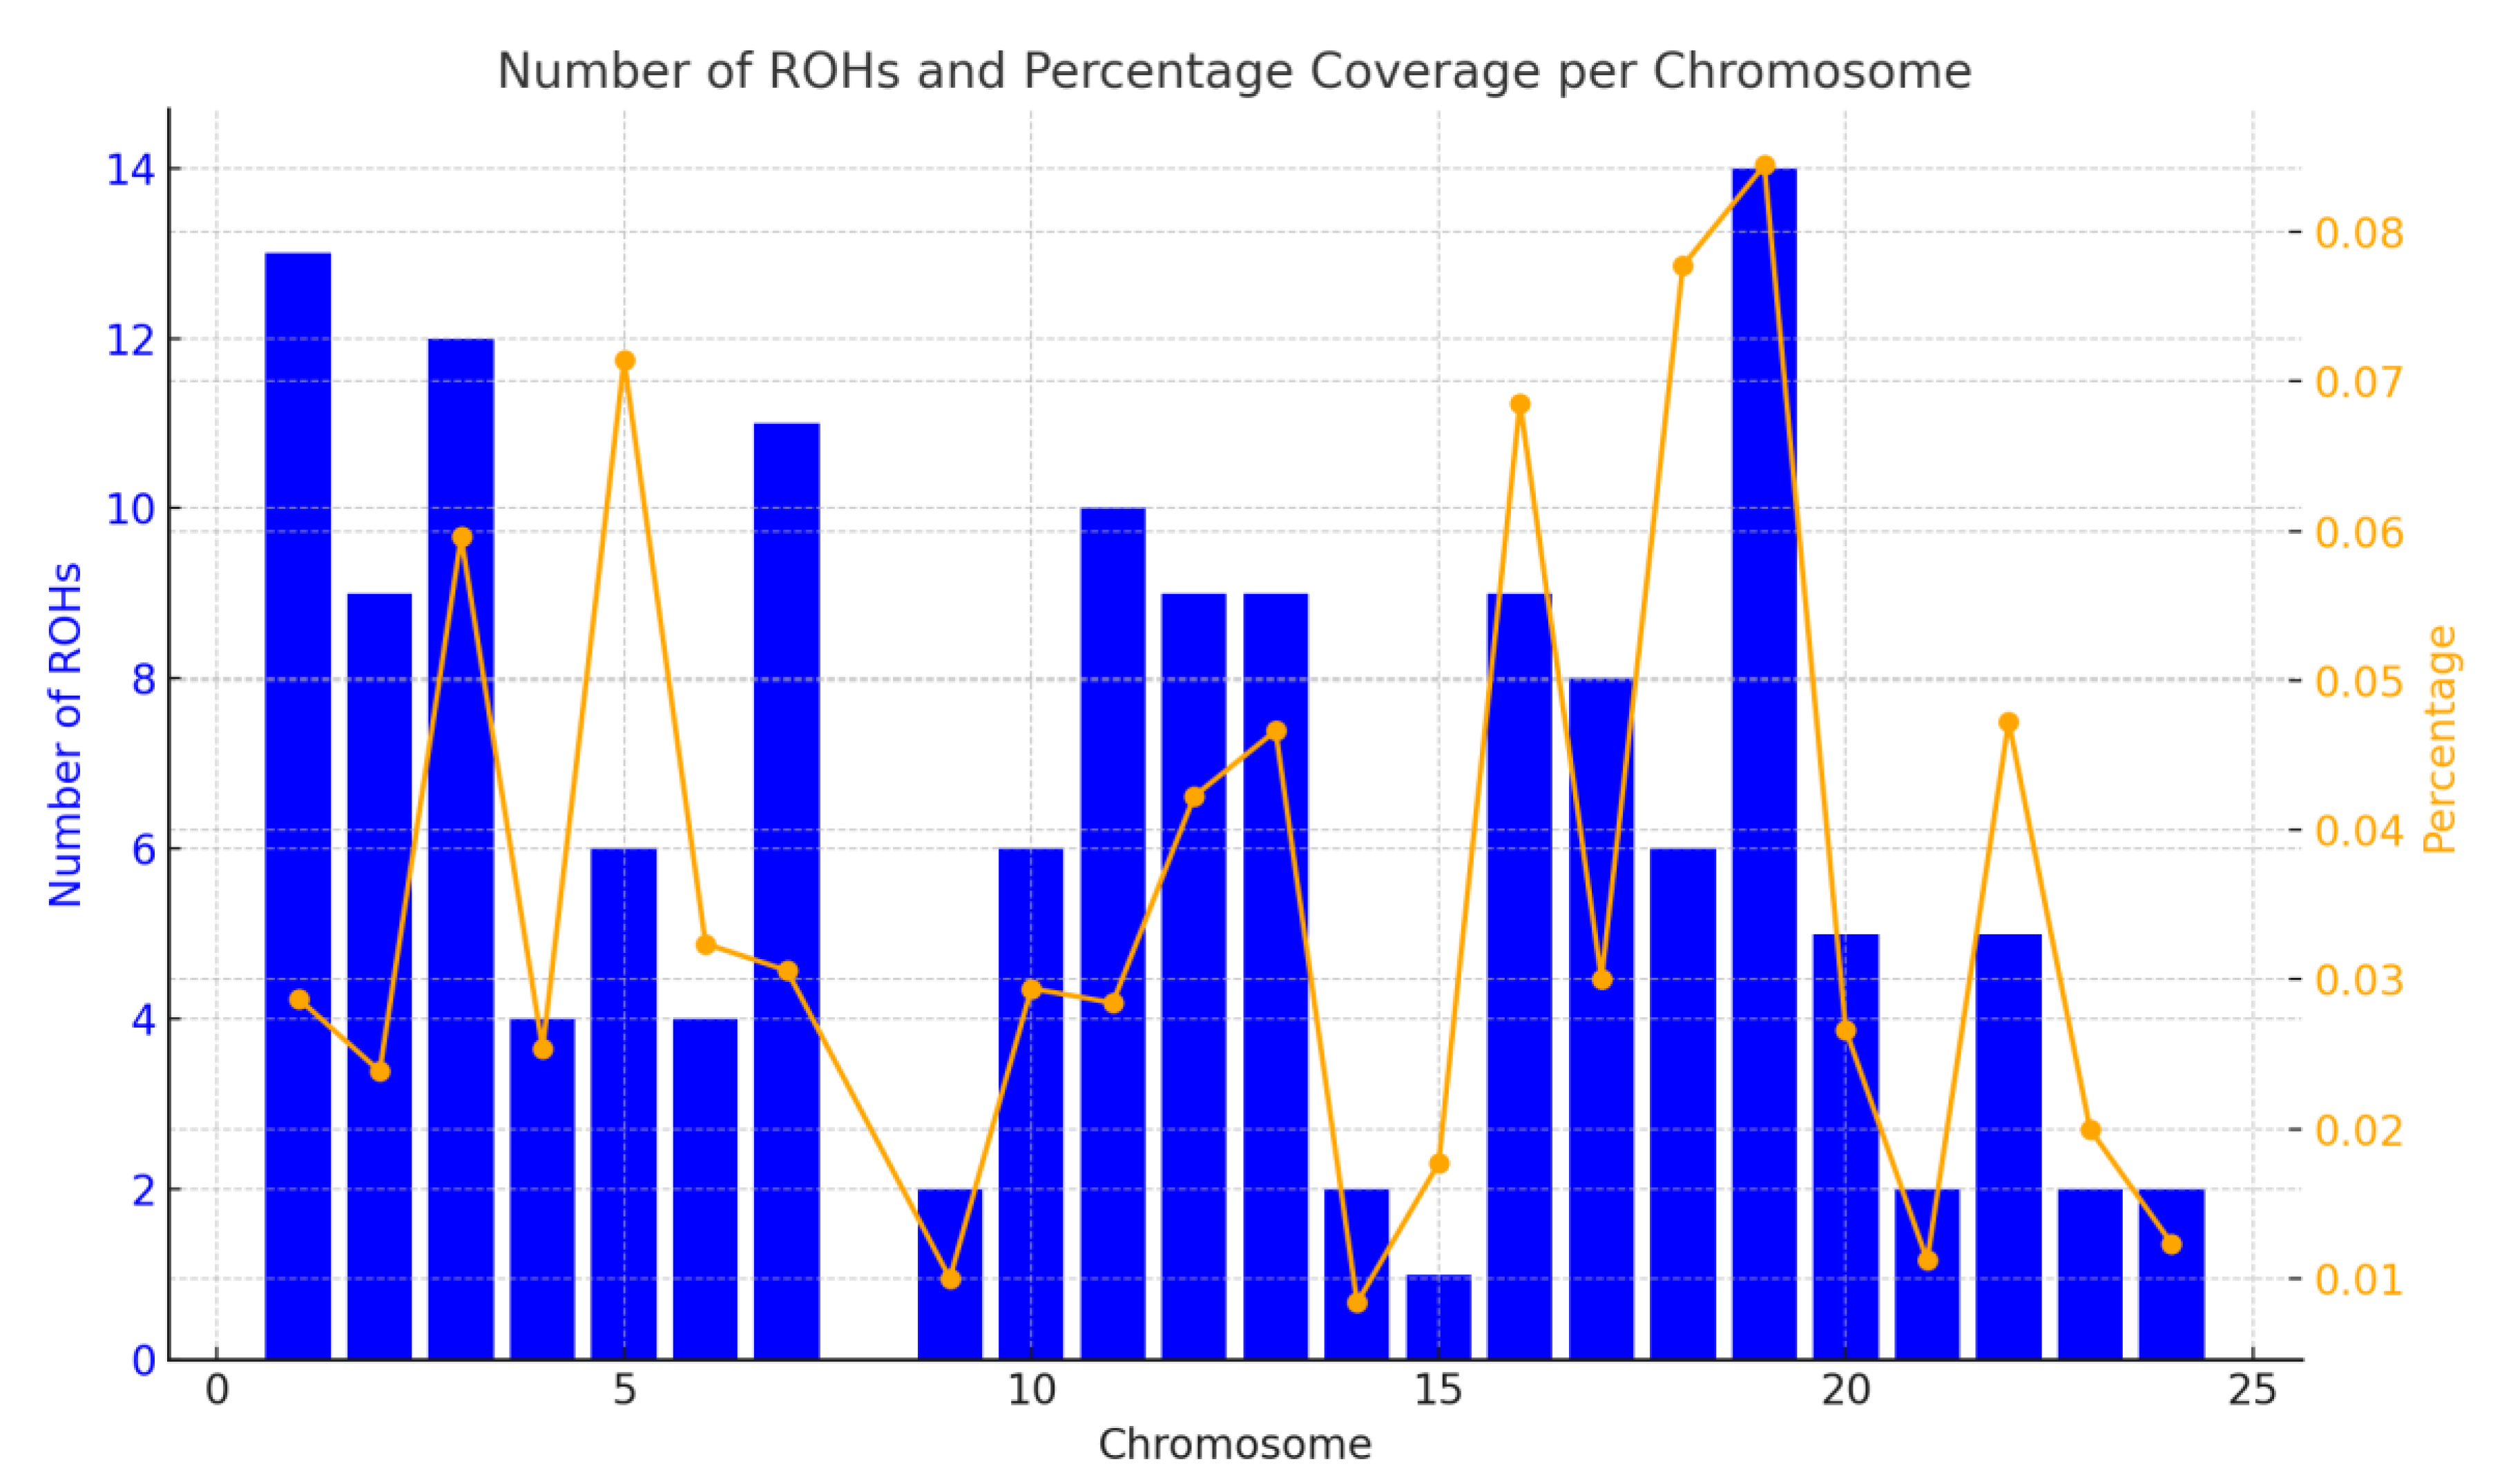
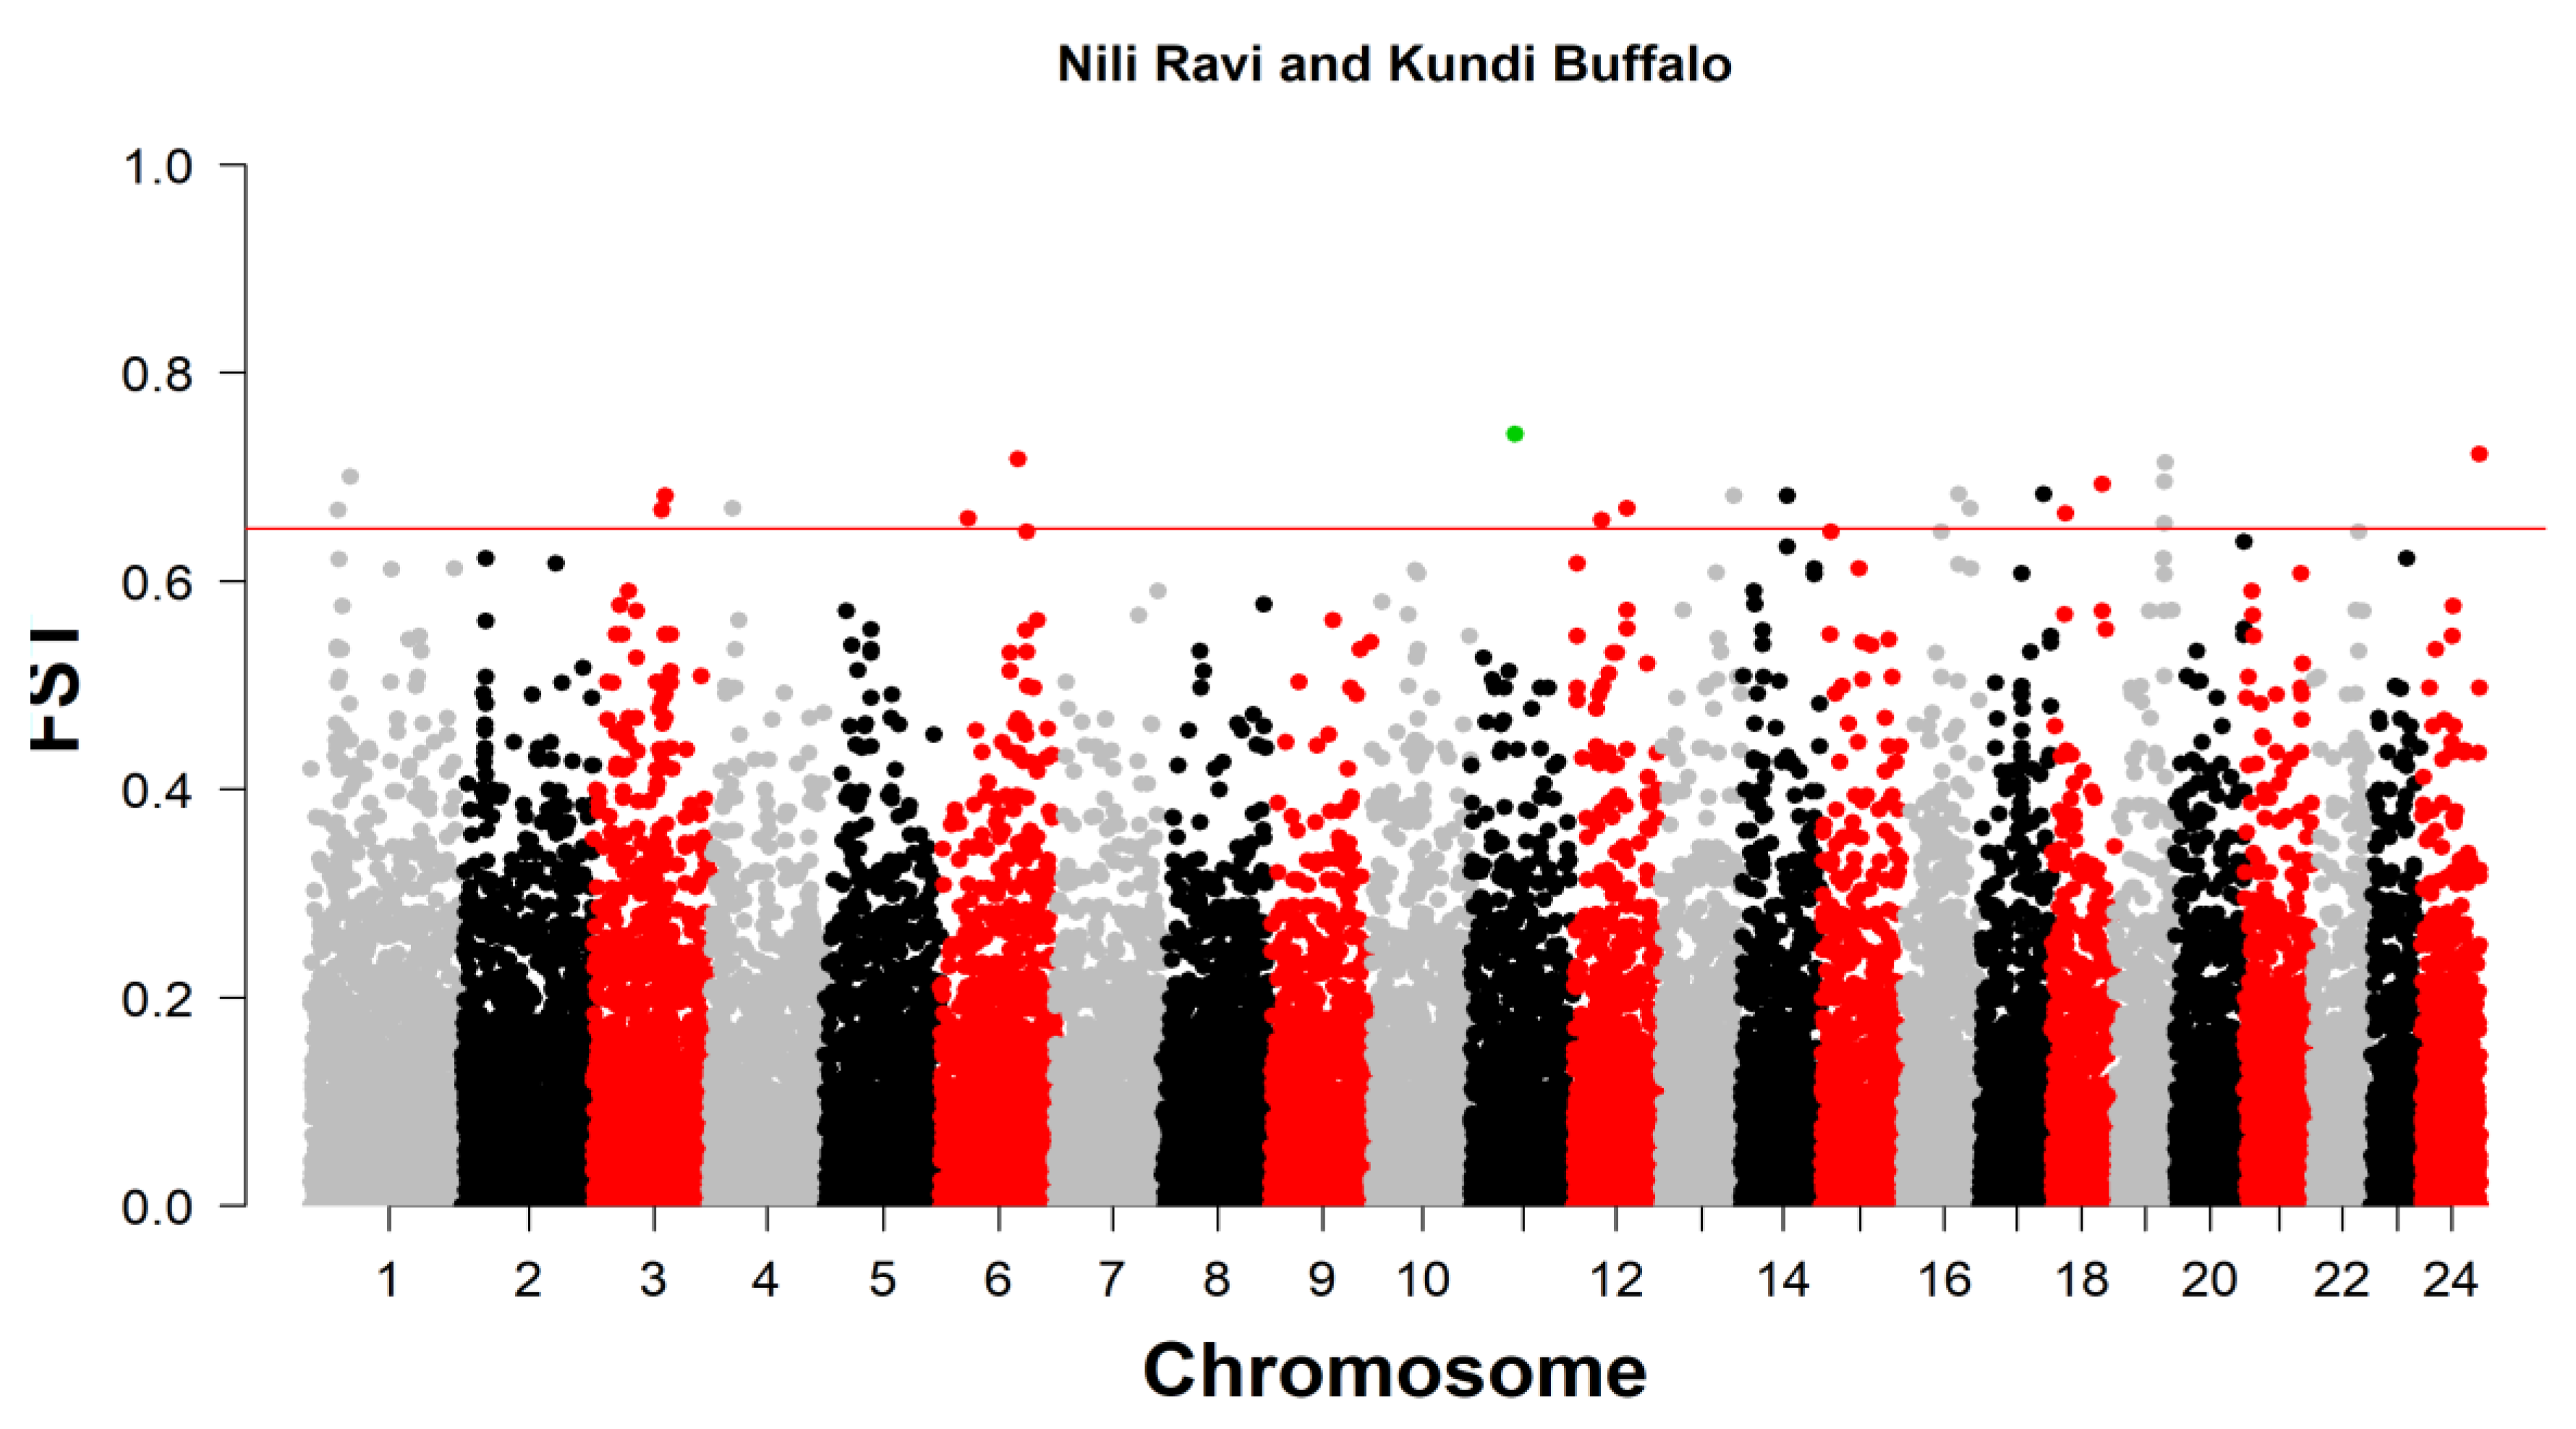
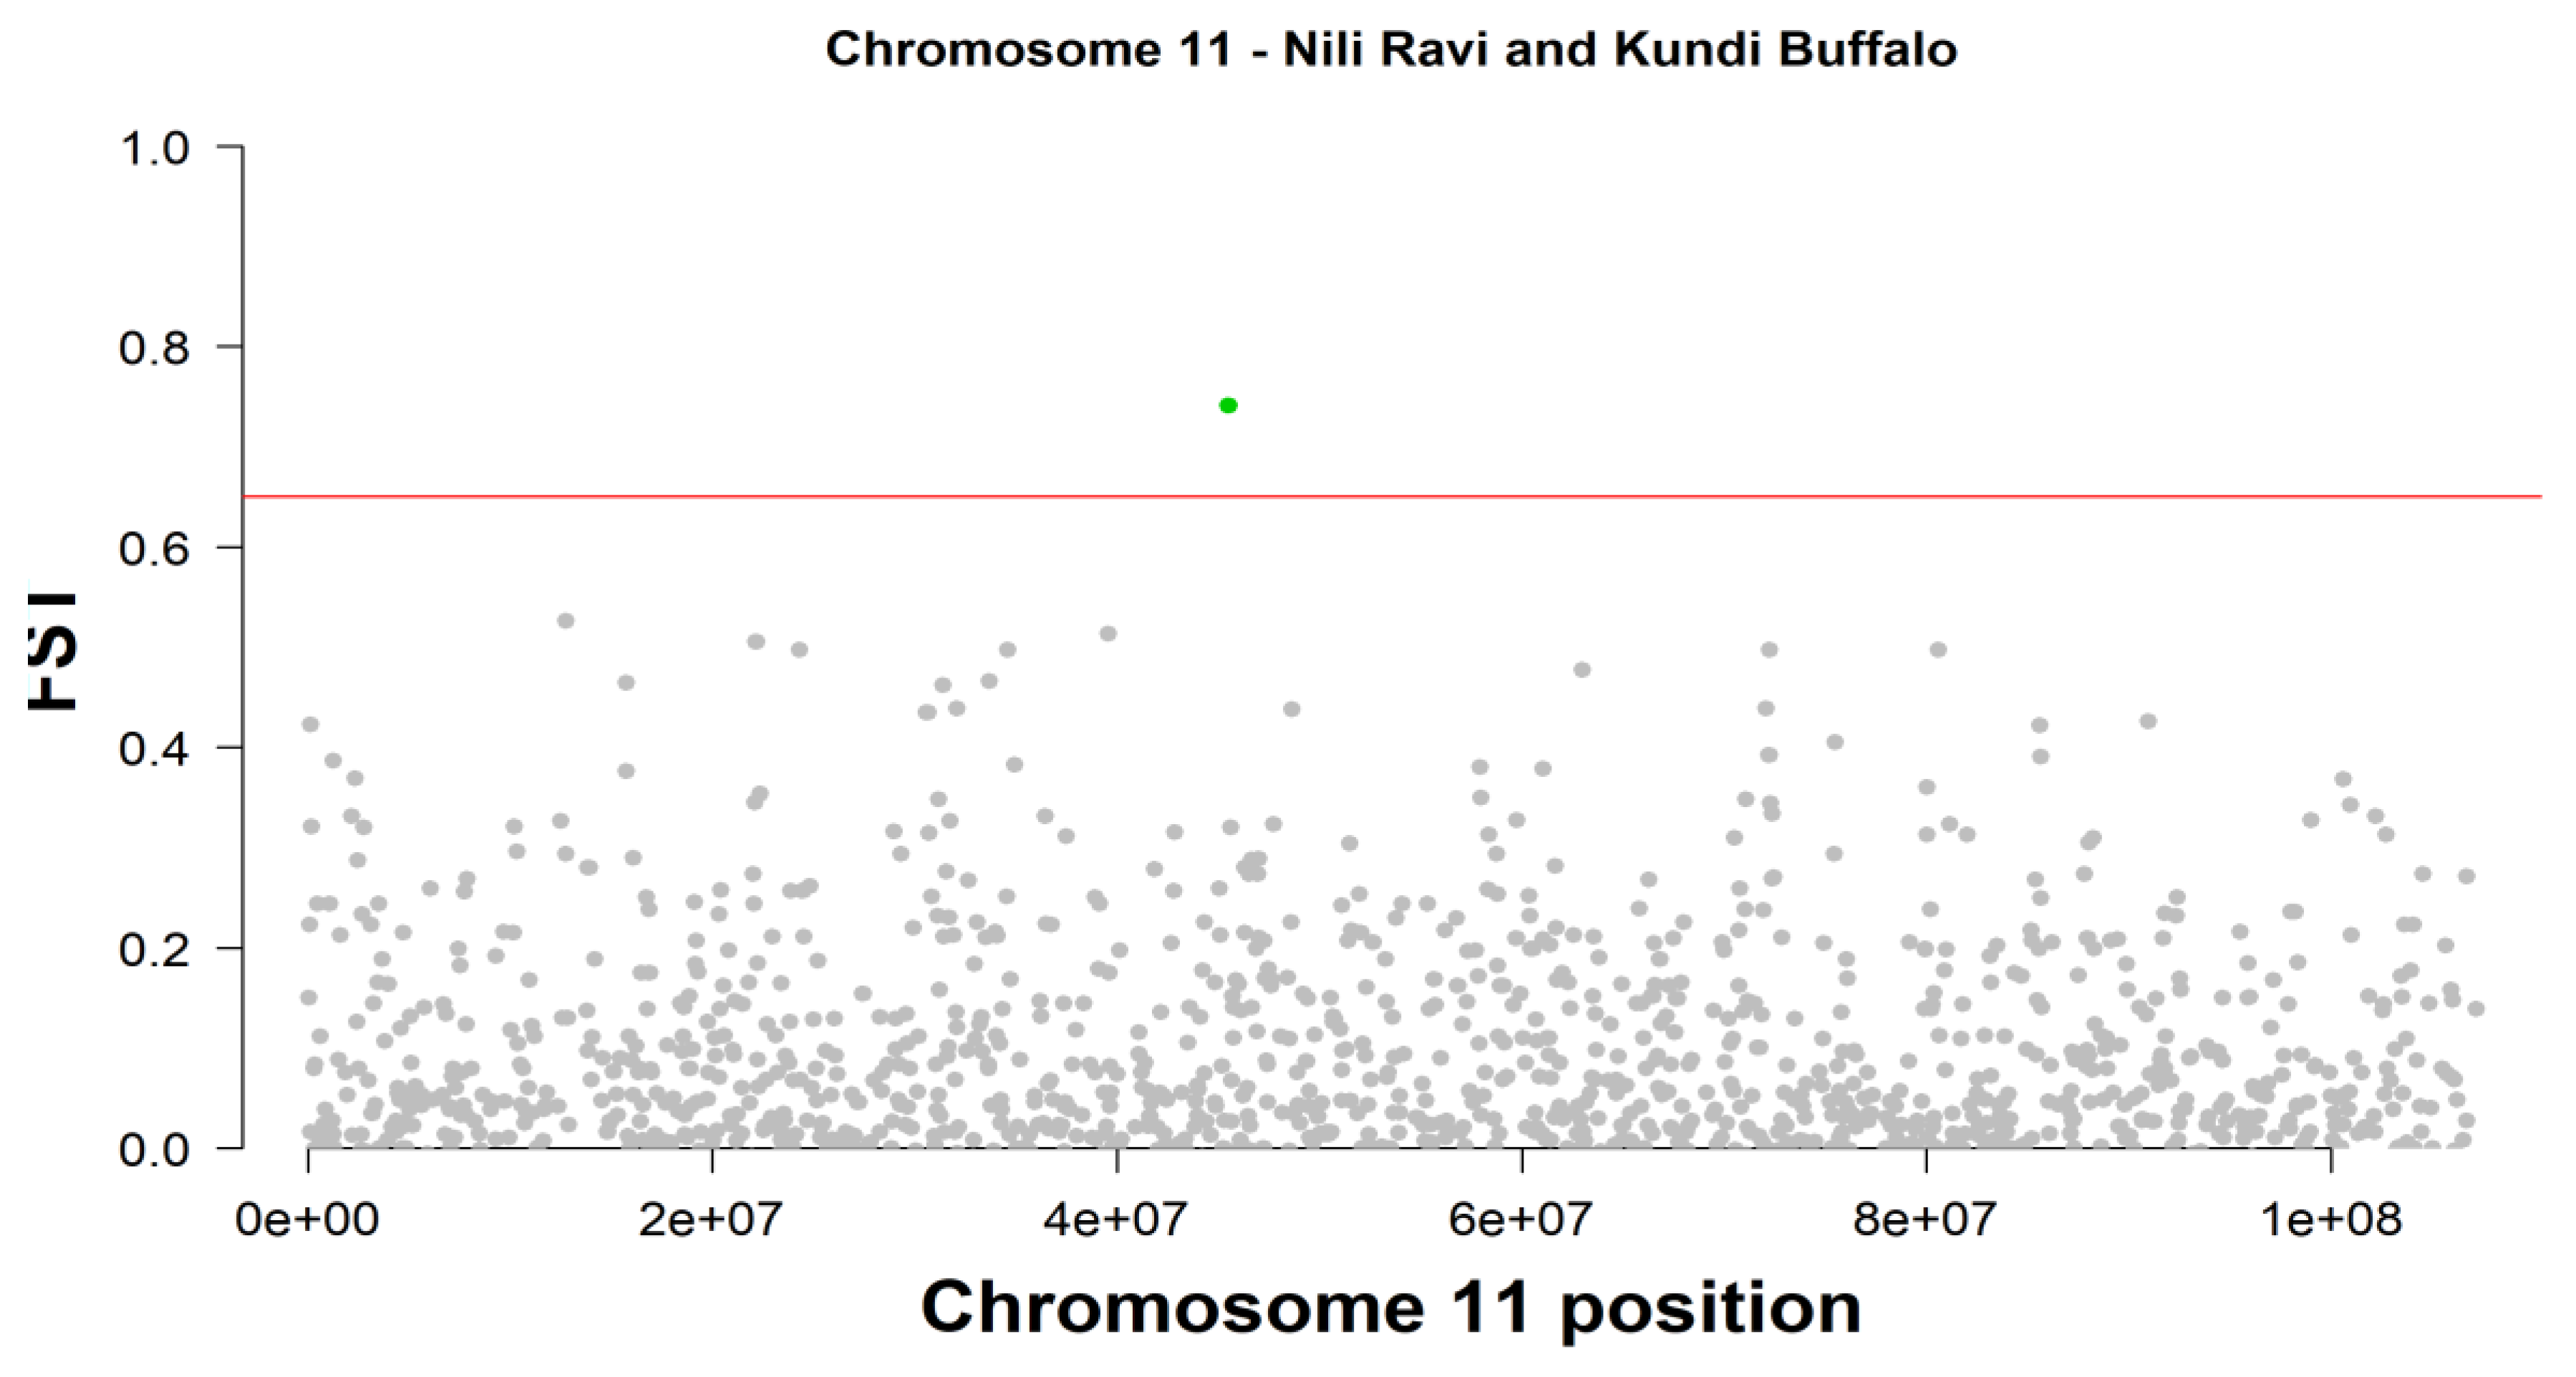
The present study analyzed the genomic landscape of Nili Ravi buffalo using the Axiom 90K SNP chip to assess SNP density, Runs of Homozygosity (ROH), and genomic differentiation. SNP density analysis revealed substantial variation across chromosomes, with Chromosome 1 exhibiting the highest density (>50 SNPs per 1Mb window), while Chr7, Chr13, and Chr20 had lower densities. High-density SNP regions were identified as potential genomic hotspots under selection, whereas regions with sparse SNP coverage indicated gaps in genetic diversity. ROH analysis identified four ROH length categories, with medium-length ROH (2–4 Mb and 4–8 Mb) constituting 68.9% of total ROHs, indicating a moderate inbreeding history. Chromosome 5 showed the highest short ROH occurrences (1–2 Mb), while Chromosome 3 had the longest ROHs (>16 Mb). The highest ROH coverage was observed on Chromosomes 5 (10%), 3 (9.9%), and 19 (8.8%). Eight genomic regions with high ROH frequencies on chromosomes 5, 11, and 19 contained candidate genes related to adaptability, productivity, and disease resistance. Key genes identified included COL8A1, ACACA, SREBF1, AKT3, and WNT11, linked to milk production, fat metabolism, and fertility traits. Genomic differentiation analysis using FST values (mean = 0.682) between Nili Ravi and Kundi buffalo populations identified 24 genomic regions under selection, with Chromosome 11 harboring the highest-ranked SNP (FST = 0.740787) associated with ARPP19. Other key candidate genes included CSMD1, ROR1, DNAJC15, and FBXW7, involved in disease resistance, metabolism, and reproductive traits. These findings provide crucial insights for genetic selection programs aimed at improving economically significant traits in Nili Ravi buffalo.
Keywords:
Introduction
Materials and Methods
Ethical Statement
Genotype Datasets and Populations
Quality Control and Marker Filtering
SNP Density Profiling
Runs of Homozygosity Detection and Genomic Inbreeding (FROH)
ROH Islands and Region Prioritization
Population Differentiation and Selection Signatures (FST)
Candidate Gene Mapping and Functional Interpretation
Parameter Justification and Rationale
Software and Computational Environment
Results
SNP Density Analysis of Nili Ravi Buffalo Genome
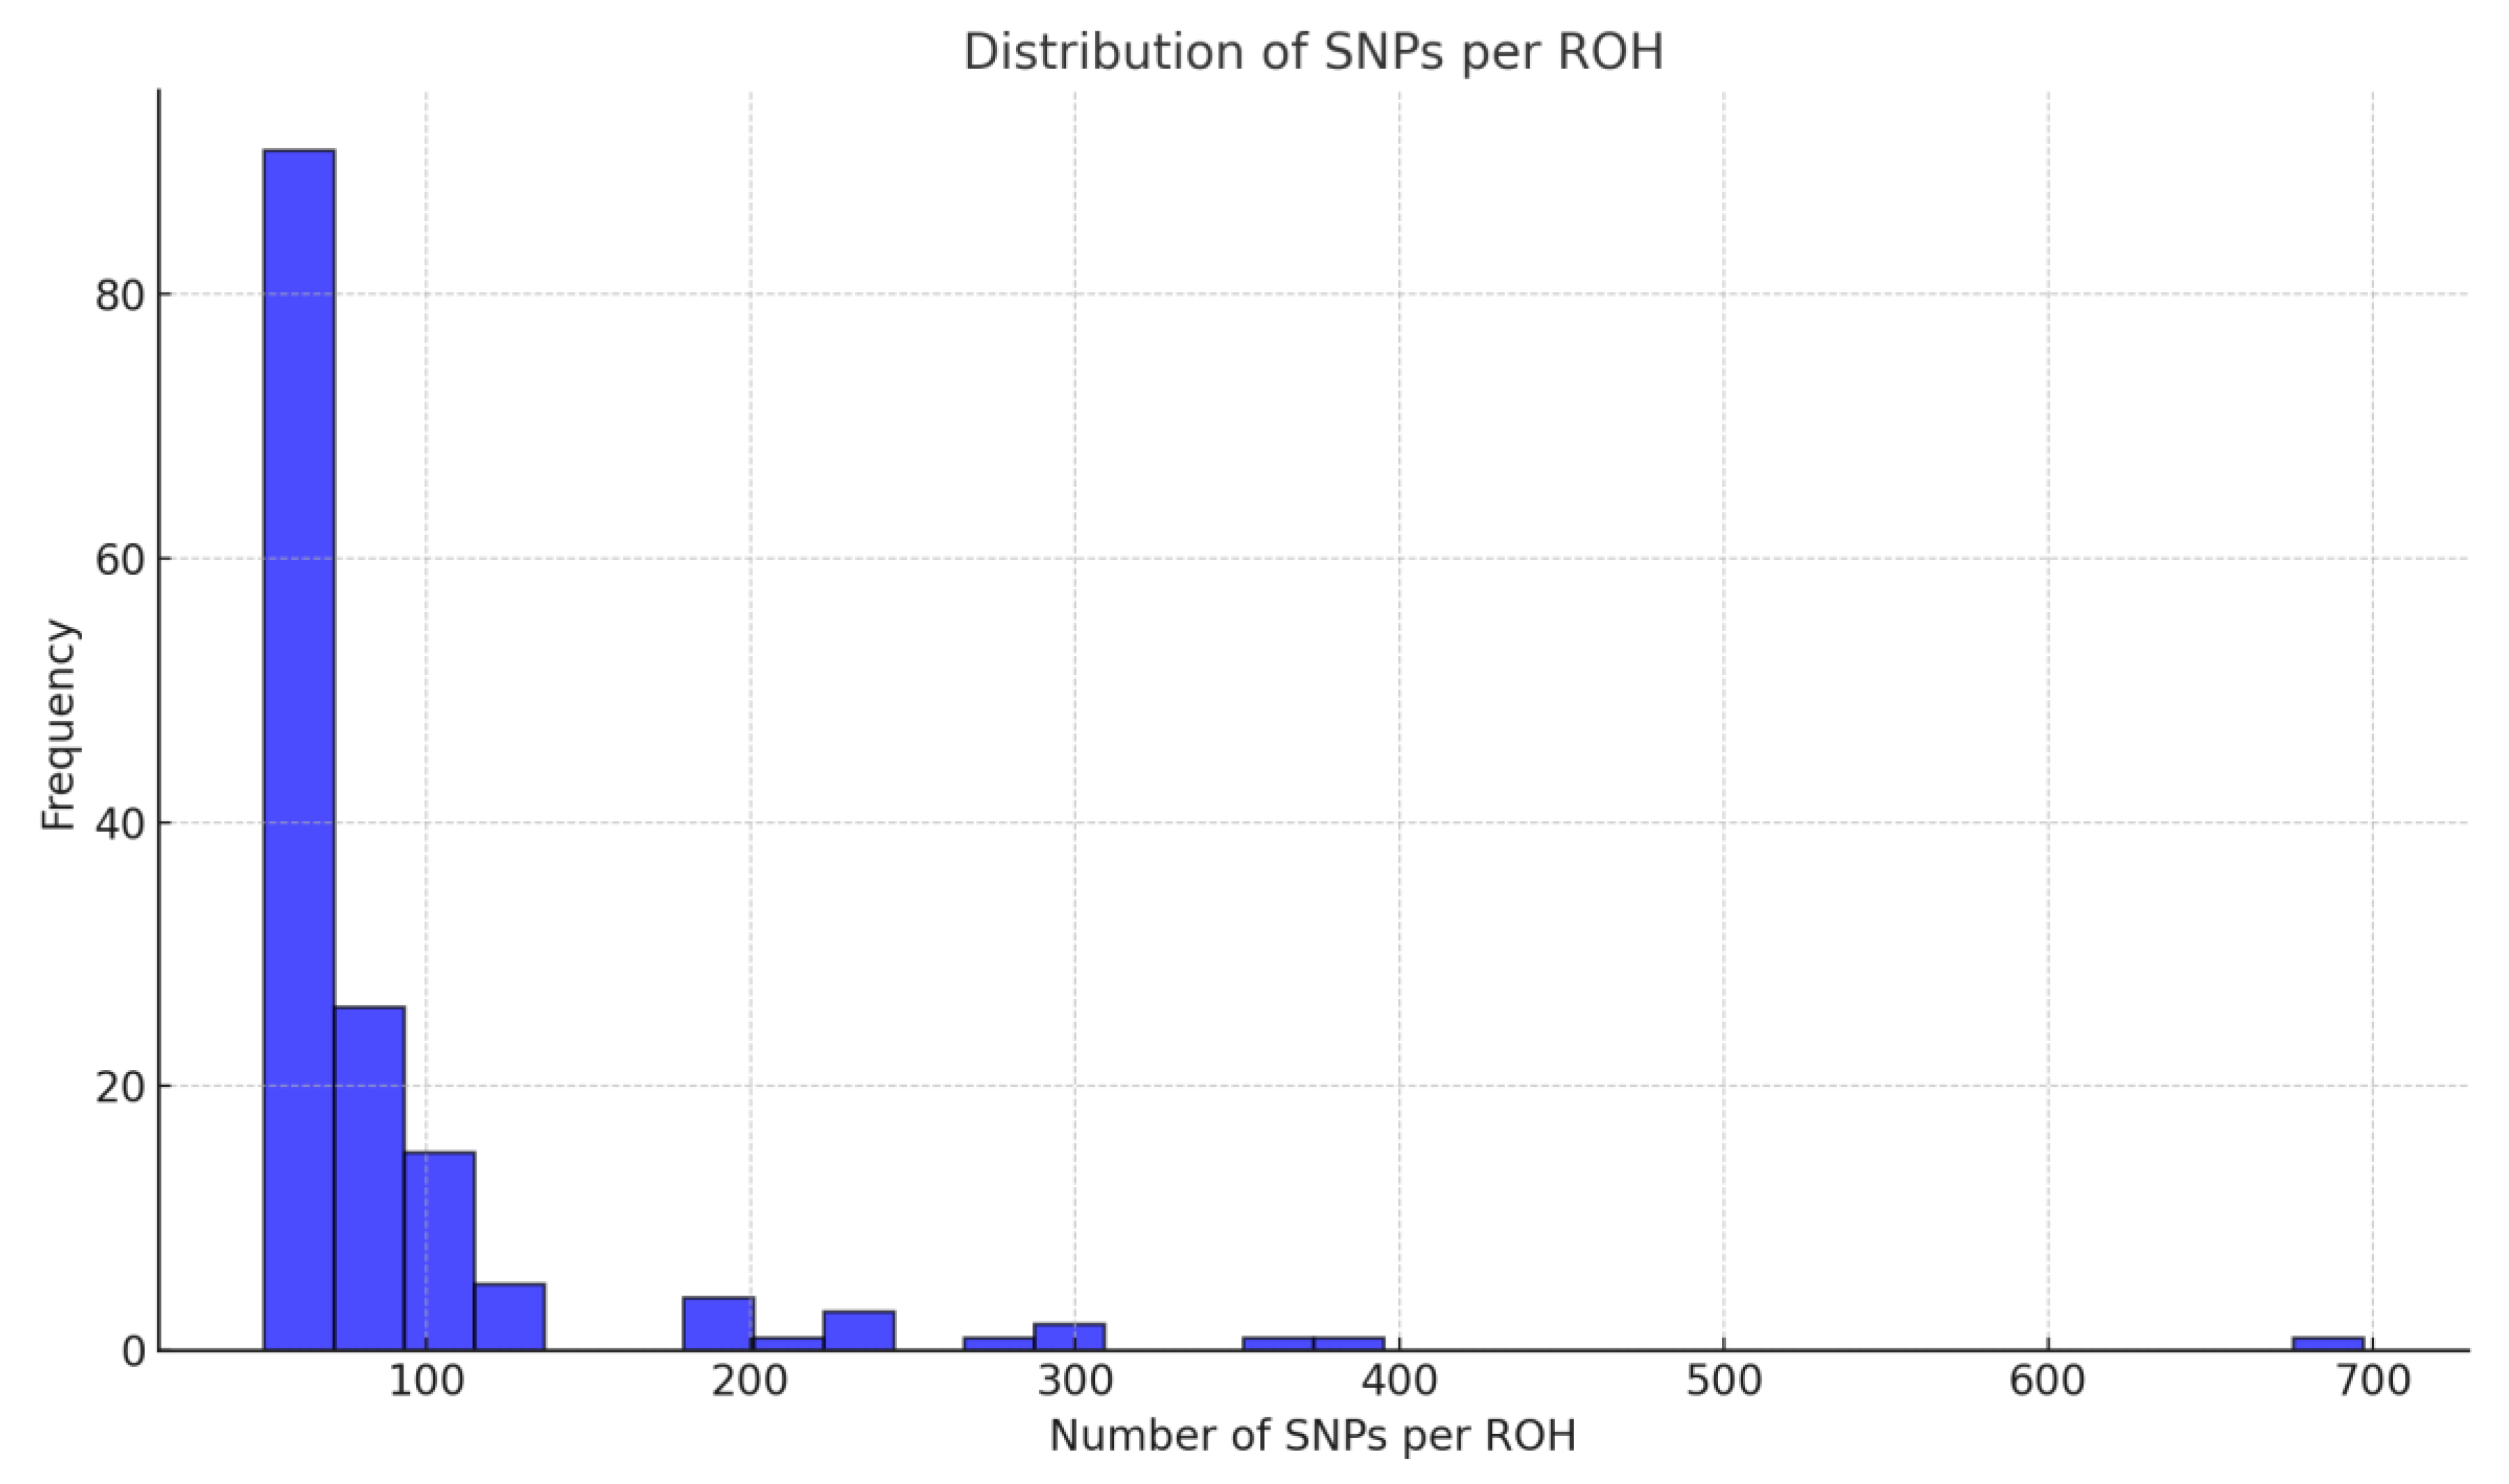
Distribution of Runs of Homozygosity
Genomic Regions with Highest ROH Frequency

| Chromosome | Start Position | End Position | Length (Mb) | Number of SNPs | Number of Genes |
|---|---|---|---|---|---|
| 1 | 15019865 | 152683005 | 35.62 | 809 | 404 |
| 1 | 65180343 | 73416245 | 8.24 | 183 | 91 |
| 3 | 25972800 | 99186056 | 33.13 | 796 | 398 |
| 3 | 40855142 | 49734555 | 8.88 | 190 | 95 |
| 3 | 69721967 | 86828369 | 17.11 | 394 | 197 |
| 4 | 28698913 | 70666413 | 6.97 | 156 | 78 |
| 4 | 10983916 | 21919119 | 10.94 | 232 | 116 |
| 5 | 44849610 | 84921927 | 8.48 | 193 | 96 |
| 5 | 24221296 | 33036520 | 8.82 | 181 | 90 |
| 5 | 26297959 | 59116943 | 43.34 | 931 | 465 |
| 11 | 13266082 | 93884820 | 26.69 | 628 | 314 |
| 12 | 214630 | 79549295 | 23.81 | 528 | 264 |
| 12 | 45100371 | 54904361 | 9.80 | 207 | 103 |
| 16 | 10633369 | 53866062 | 21.32 | 474 | 237 |
| 16 | 49469455 | 55213600 | 5.74 | 129 | 64 |
| 16 | 38486559 | 49280329 | 10.79 | 231 | 115 |
| 19 | 411773 | 54239343 | 32.15 | 724 | 362 |
| 19 | 11116210 | 40154446 | 13.66 | 322 | 161 |
| 21 | 37582611 | 52347729 | 5.86 | 131 | 65 |
| Chromosome | Start Position | End Position | Length (Mb) | Candidate Genes |
|---|---|---|---|---|
| 1 | 15019865 | 152683005 | 35.62 | COL8A1, GAP43, LOC102402668, BDH1, LOC112587334, LOC102397246, URB1, MRAP, LOC102391318, MAP3K7CL |
| 3 | 25972800 | 99186056 | 33.13 | AADAT, ACACA, SREBF1 |
| 4 | 28698913 | 70666413 | 6.97 | ISX, SOX5, TRNAC-GCA |
| 5 | 44849610 | 84921927 | 8.48 | LOC102413112, AKT3 |
| 5 | 24221296 | 33036520 | 8.82 | B3GALT6, PRDX6, CACYBP |
| 11 | 13266082 | 93884820 | 26.69 | DPH6, LOC112587918, LOC112577867, LOC112577895, SKOR1, MAP2K5, LOC112587919, LIN52, ABCD4, VSX2, LOC102409375, |
| 12 | 214630 | 79549295 | 23.81 | TRNAS-GGA, TRNAC-GCA |
| 16 | 10633369 | 53866062 | 21.32 | LOC112579629, TRNAP-UGG, WNT11, PARVA |
| 19 | 411773 | 54239343 | 32.15 | LOC112580680, CDH12, LOC102411033, FBXW11 |
| 19 | 11116210 | 40154446 | 13.66 | ADAMTS12 |
| 21 | 37582611 | 52347729 | 5.86 | WDR82, ERC2, ITIH3, ITIH1, LOC112581178, LOC112581179, NEK4, SPCS1, LOC112581322, GLT8D1, GNL3, LOC112581321, LOC112581323, LOC112581320, PBRM1, SMIM4 |
| Trait | Chr | Candidate Genes | Ref. |
|---|---|---|---|
| Milk Production* | 1 | COL8A1 | [12] |
| URB1, LOC112587334, LOC102397246, URB1, MRAP, LOC102391318, MAP3K7CL | [13] | ||
| 3 | AADAT, ACACA, SREBF1 | [14,15] | |
| 4 | TRNAC-GCA | [13] | |
| 5 | LOC102413112, AKT3, PRDX6 | [13,16,17] | |
| 11 | LOC112587918, LOC112577867, LOC112577895, SKOR1, MAP2K5, LOC112587919, LIN52, ABCD4, VSX2, LOC102409375 | [13] | |
| 12 | TRNAS-GGA, TRNAC-GCA | [13] | |
| 16 | LOC112579629, WNT11, TRNAP-UGG, PARVA | [13] | |
| 19 | LOC112580680, CDH12, LOC102411033, FBXW11, ADAMTS12 | [13] | |
| 21 | ERC2, ITIH3, ITIH1, LOC112581178, LOC112581179, NEK4, SPCS1, LOC112581322, GLT8D1, GNL3, LOC112581321, LOC112581323, LOC112581320, PBRM1, SMIM4 | [13] | |
| Feed Efficiency | 3 | AADAT | [19] |
| Fat Deposition | 3 | ACACA | [20] |
| Sex Determination | 4 | SOX5 | [21] |
| Immunity | 5 | AKT3 | [16] |
| Fertility | 11 | DPH6 | [22] |
| *Milk Production includes all traits (Milk Yield (MY), Protein%, Fat%, Milk Synthesis etc.,) | |||
Fixation Index (FST)
| CHR | SNP | POS | FST | Candidate Genes | QTLs | |||||
|---|---|---|---|---|---|---|---|---|---|---|
| 1 | Affx-79545940_AX-85063870 | 28538253 | 0.668151 | -- | -- | |||||
| 1 | Affx-38149651_AX-85130207 | 41198544 | 0.69978 | CSMD1 | -- | |||||
| 3 | Affx-79606245_AX-85124552 | 71378491 | 0.668151 | LOC112583840 | -- | |||||
| 3 | Affx-79537395_AX-85055280 | 75328696 | 0.681419 | -- | -- | |||||
| 4 | Affx-79588822_AX-85107011 | 24307759 | 0.669166 | -- | -- | |||||
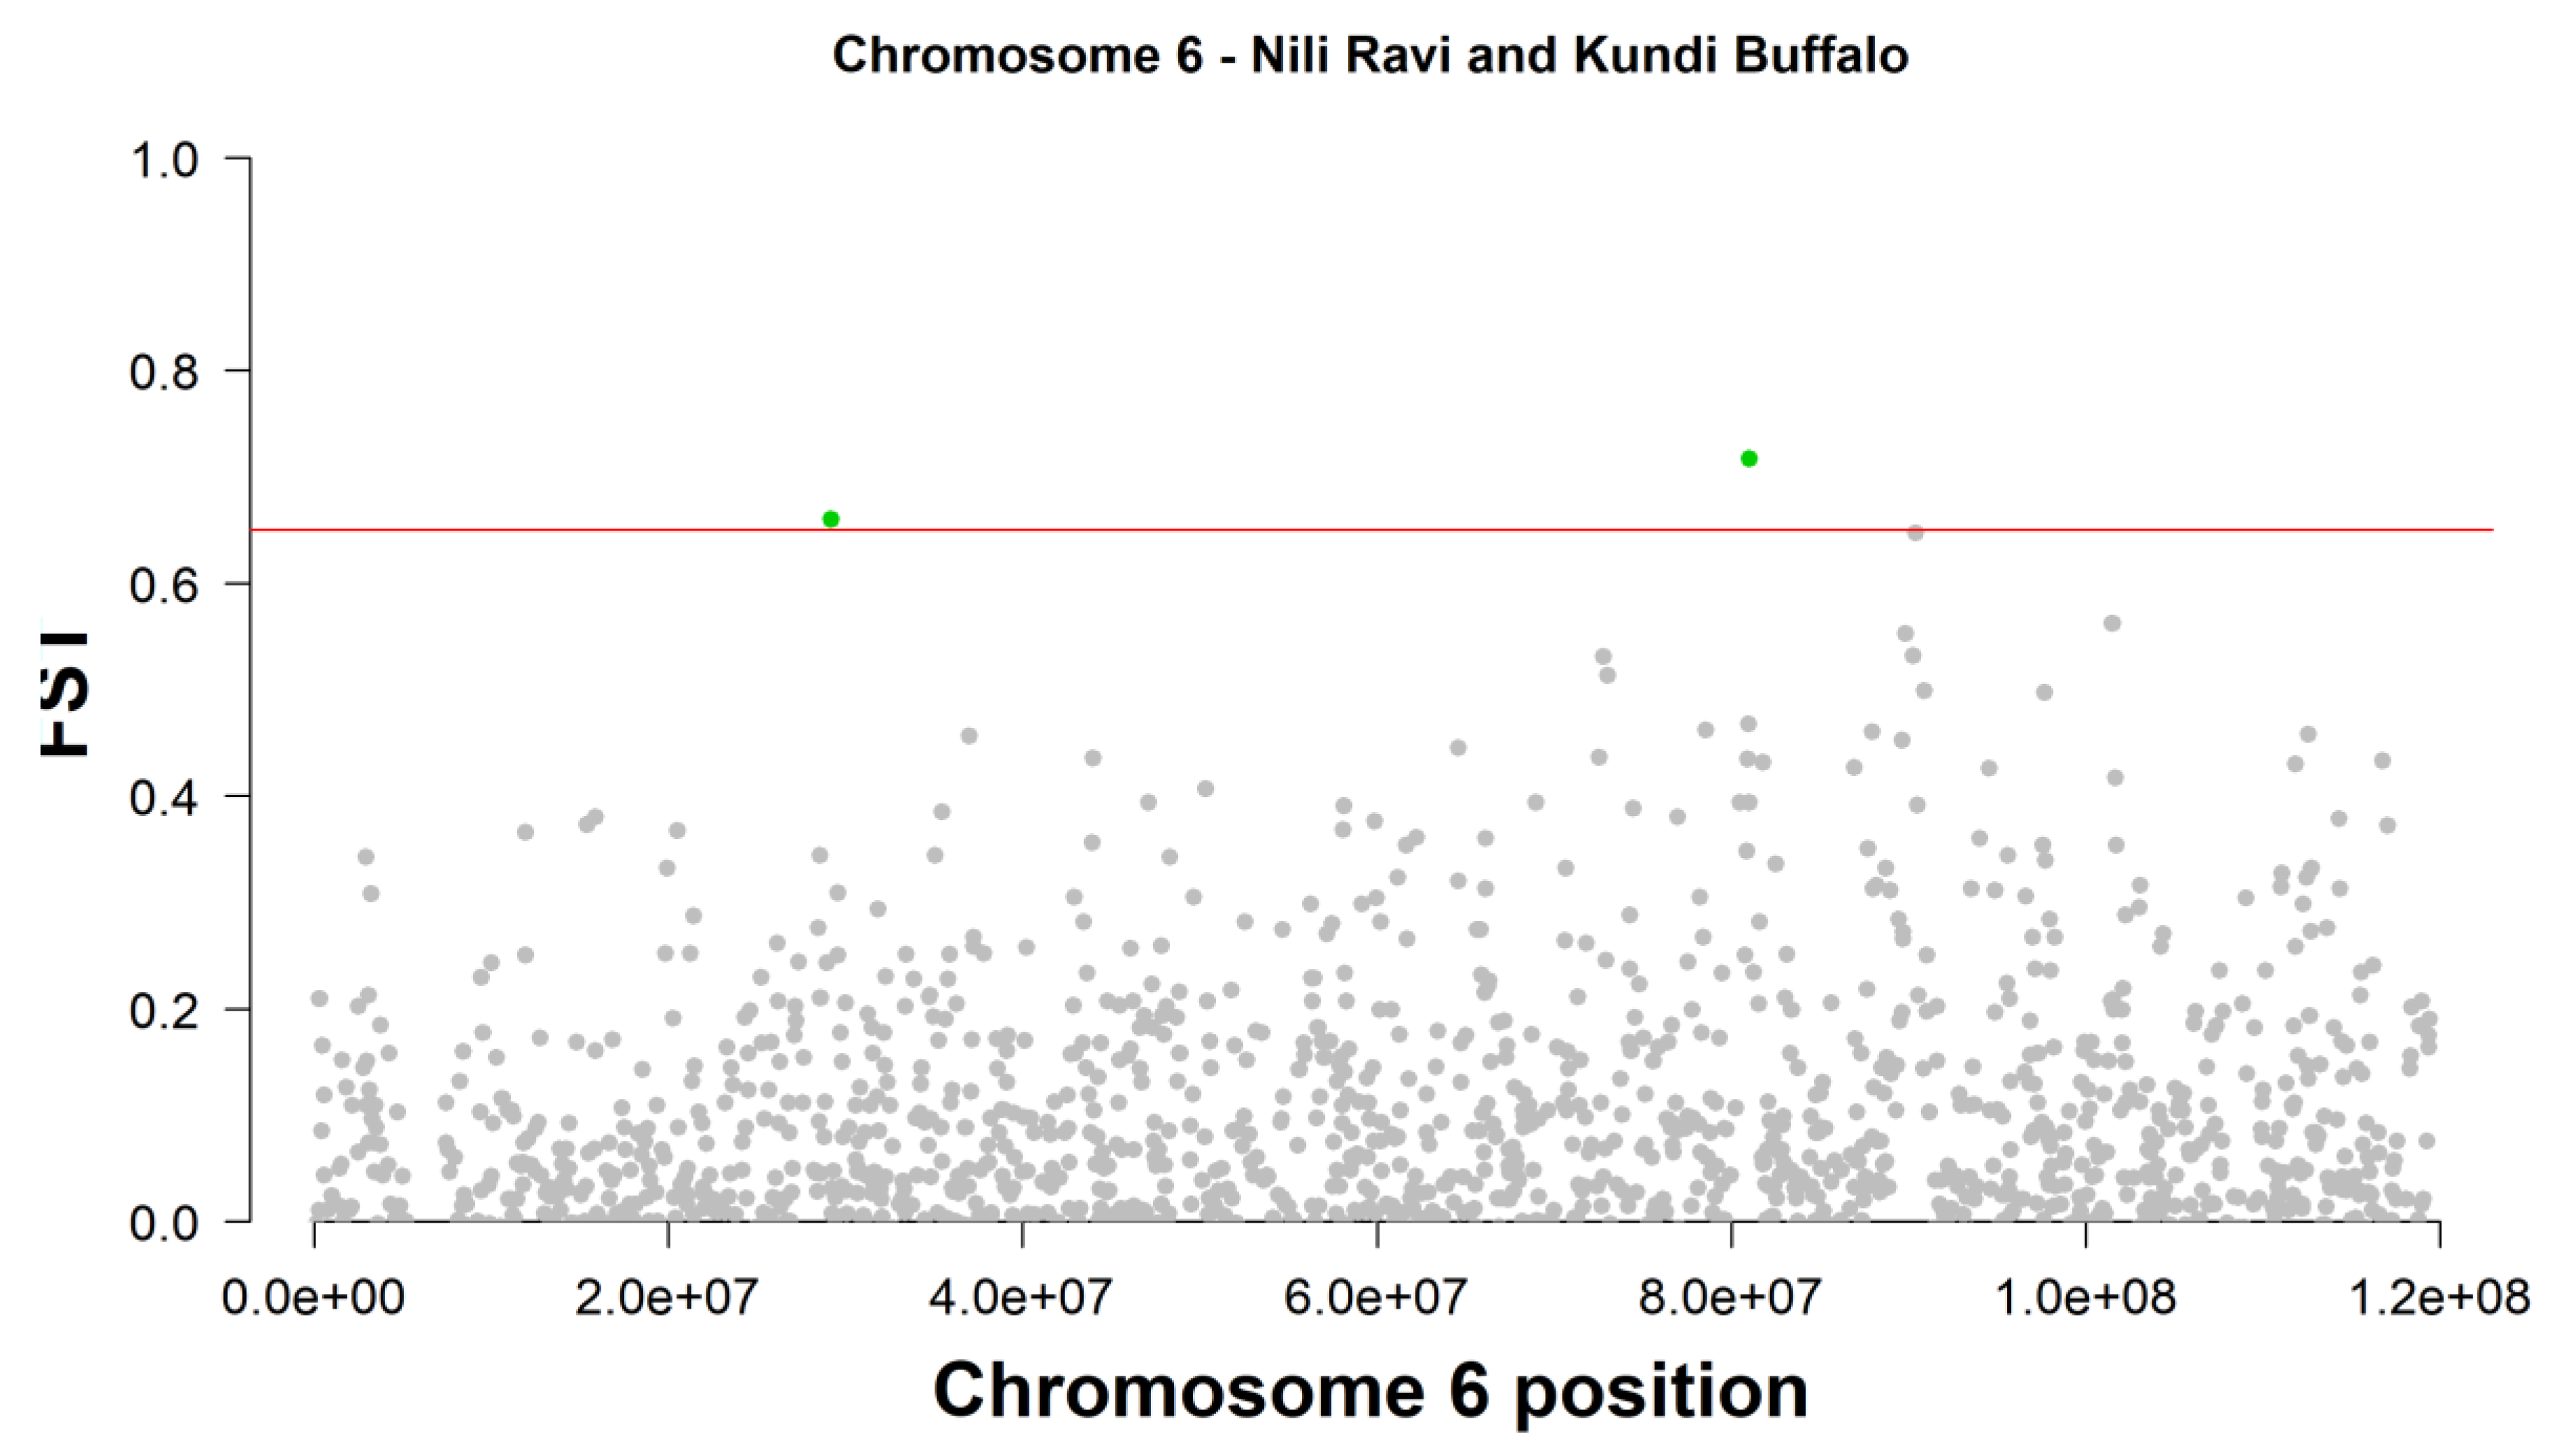
| 6 | Affx-79591522_AX-85109728 | 29202200 | 0.659603 | -- | -- | |||||
| 6 | Affx-79564503_AX-85082549 | 81014300 | 0.716468 | ROR1 | QTL:39967, QTL:39991; QTL:39968; QTL:39977; QTL:39986, QTL:39985; QTL:39974; QTL:39990, QTL:161879, QTL:39973; QTL:39989; QTL:39984, QTL:39971, QTL:39988; QTL:39983; QTL:39969, QTL:39992; QTL:39978; QTL:39987, QTL:39980, QTL:39970; QTL:39979, QTL:39981, QTL:39972, QTL:39982, QTL:39975 | |||||
| 11 | Affx-79586621_AX-85104799 | 45506934 | 0.740787 | ARPP19 | -- | |||||
| 11 | Affx-79590053_AX-85108255 | 45529532 | 0.740787 | FAM214A | -- | |||||
| 11 | Affx-79562201_AX-85080232 | 45553437 | 0.740787 | FAM214A | -- | |||||
| 12 | Affx-79556226_AX-85074216 | 29453692 | 0.65841 | KCNK12 | -- | |||||
| 12 | Affx-79556227_AX-85074217 | 29479420 | 0.65841 | KCNK12 | -- | |||||
| 12 | Affx-79540743_AX-85058645 | 55901962 | 0.669166 | -- | -- | |||||
| 13 | Affx-79535435_AX-85053315 | 76250277 | 0.681419 | DNAJC15 | -- | |||||
| 14 | Affx-79533482_AX-85051353 | 49246825 | 0.681419 | SVIL | -- | |||||
| 16 | Affx-79588482_AX-85106669 | 59661175 | 0.683124 | CADM1 | -- | |||||
| 16 | Affx-79563844_AX-85081887 | 71460237 | 0.669166 | MAML2 | QTL 181820 | |||||
| 17 | Affx-79529129_AX-85046979 | 67044810 | 0.683124 | FBXW7 | -- | |||||
| CHR | SNP | POS | FST | Candidate Genes | QTLs | |||||
| 18 | Affx-79562665_AX-85181992 | 14966032 | 0.664361 | GPT2 | QTL 25267, QTL 34630, QTL 34630, QTL 25268, QTL 25269 | |||||
| 18 | Affx-79585107_AX-85103273 | 53011744 | 0.693 | -- | -- | |||||
| 19 | Affx-79546221_AX-85064152 | 52241748 | 0.695334 | -- | -- | |||||
| 19 | Affx-79551876_AX-85069842 | 52458736 | 0.654996 | -- | -- | |||||
| 19 | Affx-79585129_AX-85103295 | 53279700 | 0.713347 | CDH18 | -- | |||||
| 24 | Affx-79550460_AX-85068420 | 61183215 | 0.721758 | -- | -- | |||||
Discussion
SNP Density Analysis
Distribution and Implications of Runs of Homozygosity (ROH)
Genomic Regions with High ROH Frequency
Candidate Genes and Functional Insights
Fixation Index (FST) and Divergent Selection
Implications for Breeding and Conservation
Data Availability Statement
Author Contributions
Funding
Acknowledgments
Conflicts of Interest
References
- Becskei, Z; Mila, S; Dragan, C; Mladen, R; Nikola, P; Marija, P; Sonja, D; Snezana, P. Assessment of water buffalo milk and traditional milk products in a sustainable production system. Sustain. 2020, 12, 12(16):6616. [Google Scholar] [CrossRef]
- Naveena, BM; Kiran, M. Buffalo meat quality, composition, and processing characteristics: Contribution to the global economy and nutritional security. Ani. Front. 2014, 4(4), 18–24. [Google Scholar] [CrossRef]
- Bilal, MQ; Suleman, M; Raziq, A. Buffalo: black gold of Pakistan. Livestock research for rural development. Pakistan. Pak. Vet. J. 2006, 18(9), 140–151. [Google Scholar]
- Falconer, DS; Mackay, TFC. Introduction to Quantitative Genetics, 4th Edition ed; Addison Wesley Longman: Harlow, 1996. [Google Scholar]
- Bashir, MK. Genetic and phenotypic aspects of some performance traits of Nili-Ravi buffaloes in Pakistan. Doctoral dissertation, PhD Thesis, Univ. Agri., Faisalabad, Pakistan, 2006. [Google Scholar]
- Bashir, MK; Khan, MS; Lateef, M; Mustafa, MI; Khalid, MF; Shahid-ur-Rehman, FU. Environmental factors affecting productive traits and their trends in Nili-Ravi buffaloes. Pak J Life S Sci. 2015, 13(3), 137–44. [Google Scholar]
- Purfield, DC; Berry, DP; McParland, S; Bradley, DG. Runs of homozygosity and population history in cattle. BMC Genet. 2012, 13, 70. [Google Scholar] [CrossRef]
- Borquis, RR; Baldi, F; Camargo, GMF; Cardoso, DF; Santos, DJA; Lugo, NH; Sargolzaei, M; Schenkel, FS; Albuquerque, LG; Tonhati, H. Water buffalo genome characterization by the Illumina Bovine HD BeadChip. Genet. Mol. Res. 2014, 1(1), 4202–4215. [Google Scholar] [CrossRef]
- Peripolli, E; Munari, DP; Silva, MVGB; Lima, ALF; Irgang, R; Baldi, F. Runs of homozygosity: current knowledge and applications in livestock. Anim. Genet. Available from. 2017, 48, 255–271. [Google Scholar] [CrossRef]
- Li, J; Liu, J; Liu, S; Campanile, G; Salzano, A; Gasparrini, B; Plastow, G; Zhang, C; Wang, Z; Liang, A; Yang, L. 2020 Genome-wide association study for buffalo mammary gland morphology. J. Dairy Sci. 87(1), 27–31.
- Ferenčaković, M; Sölkner, J; Curik, I. Estimating autozygosity from high-throughput information: effects of SNP density and genotyping errors. Genet. Sel. Evo 2013, 45, 1–9. [Google Scholar] [CrossRef]
- Lu, XR; Duan, AQ; Li, WQ; Abdel-Shafy, H; Rushdi, HE; Liang, SS; Ma, XY; Liang, XW; Deng, TX. Genome-wide analysis reveals genetic diversity, linkage disequilibrium, and selection for milk production traits in Chinese buffalo breeds. J. Dairy Sci. 2020, 03(5), 4545–56. [Google Scholar] [CrossRef] [PubMed]
- Lázaro, S. F.; Tonhati, H.; Oliveira, H. R.; Silva, A. A.; Nascimento, A. V.; Santos, D. J. A.; Stefani, G.; Brito, L. F. Genomic studies of milk-related traits in water buffalo (Bubalus bubalis) based on single-step genomic best linear unbiased prediction and random regression models. Journal of Dairy Science 2021, 104(5), 5768–5793. [Google Scholar] [CrossRef] [PubMed]
- Macciotta, NP; Colli, L; Cesarani, A; Ajmone-Marsan, P; Low, WY; Tearle, R; Williams, JL. The distribution of runs of homozygosity in the genome of river and swamp buffaloes reveals a history of adaptation, migration and crossbred events. Genet. Sel. Evol. 2021, 53(1), 1–21. [Google Scholar] [CrossRef] [PubMed]
- Stachowiak, M.; Nowacka-Woszuk, J.; Szydlowski, M.; Switonski, M. The ACACA and SREBF1 genes are promising markers for pig carcass and performance traits, but not for fatty acid content in the longissimus dorsi muscle and adipose tissue. Meat Science 2013, 95(1), 64–71. [Google Scholar] [CrossRef] [PubMed]
- Farmanullah, F.; Gouda, M.; Min, Z.; Sutong, X.; Kakar, M. U.; Khan, S. U.; Salim, M.; Khan, M.; Rehman, Z. U.; Talpur, H. S.; Khan, F. A.; Pandupuspitasari, N. S.; Shujun, Z. The variation in promoter sequences of the Akt3 gene between cow and buffalo revealed different responses against mastitis. Journal of Genetic Engineering and Biotechnology 2021, 19(1), 164. [Google Scholar] [CrossRef]
- Gu, M; Cosenza, G; Iannaccone, M; Macciotta, NPP; Guo, Y; Di Stasio, L; Pauciullo, A. The single nucleotide polymorphism g.133A&C in the stearoyl CoA desaturase gene (SCD) promoter affects gene expression and quali-quantitative properties of river buffalo milk. J. Dairy Sci. 2019, 102, 442–51. [Google Scholar] [CrossRef]
- Anwer, I. Characterization of Nili Ravi Buffalo using HD SNP genotyping array. M.Phil thesis, University of Veterianry and Animal Scioiences, Lahore-Pakistan, 2022. [Google Scholar]
- Seabury, CM; Oldeschulte, DL; Saatchi, M; Beever, JE; Decker, JE; Halley, YA; Bhattarai, EK; Molaei, M; Freetly, HC; Hansen, SL; Yampara-Iquise, H; Johnson, KA; Kerley, MS; Kim, J; Loy, DD; Marques, E; Neibergs, HL; Schnabel, RD; Shike, DW; Spangler, ML; Weaber, RL; Garrick, DJ; Taylor, JF. Genome-wide association study for feed efficiency and growth traits in U.S. beef cattle. BMC Genomics 2017, 18(1), 386. [Google Scholar] [CrossRef] [PubMed] [PubMed Central]
- Du, L.; Li, K.; Chang, T.; An, B.; Liang, M.; Deng, T.; Cao, S.; Du, Y.; Cai, W.; Gao, X.; Xu, L.; Zhang, L.; Li, J.; Gao, H. Integrating genomics and transcriptomics to identify candidate genes for subcutaneous fat deposition in beef cattle. Genomics 2022, 114(4), 110406. [Google Scholar] [CrossRef]
- Abdullah, M; Rehman, MS; Rehman, MSN; AlKahtane, AA; Al-Hazani, TM; Hassan, FU; Rehman, SU. Genome-Wide Identification, Evolutionary and Mutational Analysis of the Buffalo Sox Gene Family. Animals (Basel) 2023, 13(14), 2246. [Google Scholar] [CrossRef] [PubMed] [PubMed Central]
- Chen, S. Y.; Schenkel, F. S.; Melo, A. L. P.; Oliveira, H. R.; Pedrosa, V. B.; Araujo, A. C.; Melka, M. G.; Brito, L. F. Identifying pleiotropic variants and candidate genes for fertility and reproduction traits in Holstein cattle via association studies based on imputed whole-genome sequence genotypes. BMC Genomics 2022, 23(1), 331. [Google Scholar] [CrossRef]
- Pedrosa, V. B.; Schenkel, F. S.; Chen, S. Y.; Oliveira, H. R.; Casey, T. M.; Melka, M. G.; Brito, L. F. Genomewide association analyses of lactation persistency and milk production traits in Holstein cattle based on imputed whole-genome sequence data. Genes 2021, 12(11), 1830. [Google Scholar] [CrossRef]
- Matsumoto, H.; Inada, S.; Kobayashi, E.; Abe, T.; Hasebe, H.; Sasazaki, S.; Oyama, K.; Mannen, H. Identification of SNPs in the FASN gene and their effect on fatty acid milk composition in Holstein cattle. Livestock Science 2012, 144(3), 281–284. [Google Scholar] [CrossRef]
- Guo, J.; Jorjani, H.; Carlborg, Ö. A genome-wide association study using international breeding-evaluation data identifies major loci affecting production traits and stature in the Brown Swiss cattle breed. BMC Genetics 2012, 13, 82. [Google Scholar] [CrossRef]
- Chen, Y.; Steeneveld, W.; Frankena, K.; Leemans, I.; Aardema, H.; Vos, P. L. A. M.; Nielen, M.; Hostens, M. Association between days post-conception and lactation persistency in dairy cattle. Journal of Dairy Science 2024, 107(8), 5794–5804. [Google Scholar] [CrossRef]
- Qiu, J.; Ma, Z.; Hong, Z.; Yin, X.; Chen, Y.; Ahmed, H. Q.; Zan, L.; Li, A. Comparative analysis of the whole transcriptome landscapes of muscle and adipose tissue in Qinchuan beef cattle. BMC Genomics 2025, 26, 32. [Google Scholar] [CrossRef]
- Lee, S.H.; Van Der Werf, J.H.J; Kim, N.K.; Lee, S.H.; Gondro, C.; Park, E.W.; Oh, S.J.; Gibson, J.P.; Thompson, J.M. QTL and gene expression analyses identify genes affecting carcass weight and marbling on BTA14 in Hanwoo (Korean Cattle). Mamm. Genome 2011, 22, 589–601. [Google Scholar] [CrossRef]
- Hoff, J.L.; Decker, J.E.; Schnabel, R.D.; Seabury, C.M.; Neibergs, H.L.; Taylor, J.F. QTL-mapping and genomic prediction for bovine respiratory disease in U.S. Holsteins using sequence imputation and feature selection. BMC Genom. 2019, 20, 1–15. [Google Scholar] [CrossRef]
| Class | Number of ROH | Percent (%) | ROH length mean (Kb) | Standard Deviation (Kb) |
|---|---|---|---|---|
| ROH_1-4 Mb | 117 | 77.48 | 2764.18 | 517.75 |
| ROH_4-8 Mb | 21 | 13.91 | 4920.44 | 849.84 |
| ROH_8-16 Mb | 10 | 6.62 | 10698.10 | 1816.42 |
| ROH_16+ Mb | 3 | 1.99 | 22275.55 | 9131.46 |
Disclaimer/Publisher’s Note: The statements, opinions and data contained in all publications are solely those of the individual author(s) and contributor(s) and not of MDPI and/or the editor(s). MDPI and/or the editor(s) disclaim responsibility for any injury to people or property resulting from any ideas, methods, instructions or products referred to in the content. |
© 2026 by the authors. Licensee MDPI, Basel, Switzerland. This article is an open access article distributed under the terms and conditions of the Creative Commons Attribution (CC BY) license.


