Preprint
Article

This version is not peer-reviewed.

Combined Lactobacillus Postbiotics with Carrageenan and Soy Protein Induce Sustained Apoptosis Through Multi-Pathway Survival Disruption in Colon Cancer Cells

Submitted:

06 February 2026

Posted:

09 February 2026

You are already at the latest version

Abstract

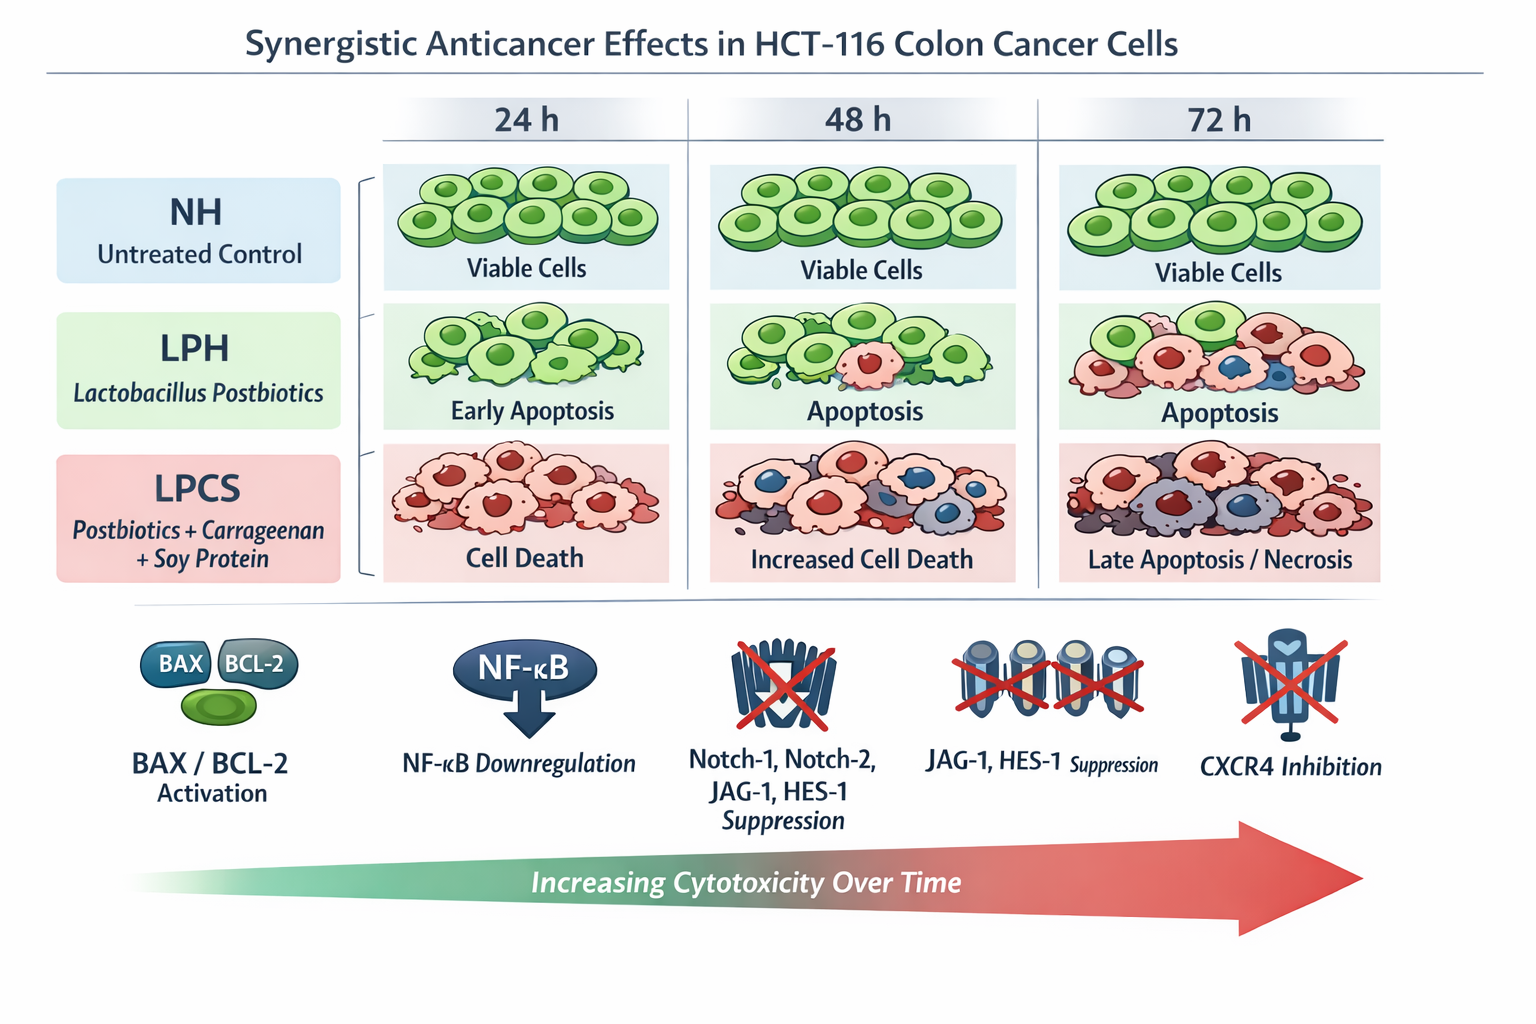
Background: Colorectal cancer remains a major cause of cancer-related mortality, highlighting the need for effective and low-toxicity therapeutic approaches. This study examined the time-dependent anticancer effects of Lactobacillus postbiotics alone and in combination with a carrageenan/soy protein blend in HCT-116 colorectal cancer cells. Methods: Cells were divided into three groups: untreated control (NH), postbiotics alone (LPH), and the combined formulation (LPCS). Cell viability, morphological alterations, apoptotic stages, gene expression, and temporal gene–gene correlations were analyzed at 24, 48, and 72 h. Results: The combined formulation induced the strongest and most sustained cytotoxic effects, with maximal late apoptosis and necrosis observed at 72 h. Postbiotics alone mainly triggered early apoptosis at 24 h, which diminished over time. Dynamic, time-dependent modulation of apoptotic regulators (BAX and BCL2), inflammatory signaling (NF- κB), and survival-related pathways (Notch-1, Notch-2, JAG-1, HES-1, and CXCR4) were observed. Combination treatment led to early stress responses followed by suppression of survival signaling and terminal disruption of apoptotic balance. Conclusion: These findings demonstrate that combining Lactobacillus postbiotics with carrageenan and soy protein enhances both the potency and durability of anticancer effects, supporting the development of multi-component postbiotic strategies for colorectal cancer.

Keywords: 
;  ;  ;  ;  ;  ;  ;  

1. Introduction

The rising incidence of cancer worldwide demands new, effective treatments that may minimize side effects and prevent drug resistance [1]. Traditional therapies like chemotherapy and radiation, though effective, often lead to severe side effects and resistance. These side effects have sparked interest in alternative therapies that target cancer cells more selectively and spare normal cells [2]. Scientists are increasingly recognizing natural compounds for their ability to disrupt key cellular pathways that drive cancer progression [3]. Regarding colon cancer, apoptotic genes such as BAX and BCL2 play crucial roles in immunity against tumor progression [4]. BAX (the pro-apoptotic factor) promotes programmed cell death [5], but BCL2 acts to prevent apoptosis, potentially aiding in tumor survival and resistance to treatments [4]. The critical balance between these genes (BAX and BCL2) determines whether apoptosis is triggered, which can lead to tumor reduction [5,6]. So, targeting these genes to enhance apoptosis offers an effective treatment strategy for colon cancer, thereby activating the body’s natural ability to eliminate cancer cells and slow disease progression [7].
Inflammation-related genes (NF- κB, COX-2, and TNF-α) are pivotal in colon cancer as they drive pathways that support tumor growth, angiogenesis, metastasis, and resistance to cell death [8]. Overactivation of these genes activated an inflammatory environment conducive to cancer progression [9]. Targeting these genes to mitigate inflammation presents a strategy to impede tumor growth and potentially enhance the efficacy of other cancer treatments, emphasizing the importance of managing gene expression in the development of treatments for colon cancer [10].
Notch signaling has a significant impact on colon cancer by affecting cell differentiation, proliferation, and interactions within the tumor microenvironment, as well as angiogenesis [11]. When dysregulated, this pathway leads to abnormal cell proliferation and sustains cancer stem cell populations, which are crucial for continued tumor growth and resistance to treatment [12]. Notch signaling enhances the tumor-supportive environment and promotes angiogenesis through regulatory factors, such as VEGF [13]. Additionally, Notch plays a role in helping cancer cells escape from the apoptosis process by promoting their survival signals during treatment [13,14]. Due to their vast influence, targeting the Notch signaling pathway is considered a promising strategy in cancer therapy, in particular colon cancer, aiming to interfere with these critical processes and potentially improve treatment outcomes [15].
Lactobacillus postbiotics, sourced from probiotics [16], combat colon cancer by balancing gut microbiota [17], supporting intestinal barriers [18], and enhancing immune responses [19], effectively reducing tumor inflammation and triggering cancer cell death [20]. Meanwhile, carrageenan, a natural polysaccharide from red seaweed [21], despite concerns about its inflammatory properties at high doses [22], demonstrates potent anti-cancer capabilities by inhibiting cell growth, promoting apoptosis, and acting as an antioxidant to minimize oxidative stress [23] [24]. Additionally, soy protein that is rich in isoflavones like genistein and daidzein [25] offers protective effects against colon cancer by inhibiting tumor proliferation [26], regulating hormone levels, and showcasing anti-inflammatory properties, thus collectively offering a multi-faceted approach to preventing and combating colon cancer [27].
This study aimed to assess whether combining Lactobacillus postbiotics with a carrageenan/soy protein blend enhances anticancer efficacy in HCT colorectal cancer cells compared with postbiotics alone. Specifically, the objectives were to evaluate time-dependent effects on cell viability and apoptosis, to examine modulation of key apoptotic, inflammatory, and survival pathways (BAX, BCL2, NF- κB, Notch signaling, and CXCR4), and to elucidate treatment-induced changes in regulatory networks underlying sustained apoptotic commitment and resistance suppression.

2. Results

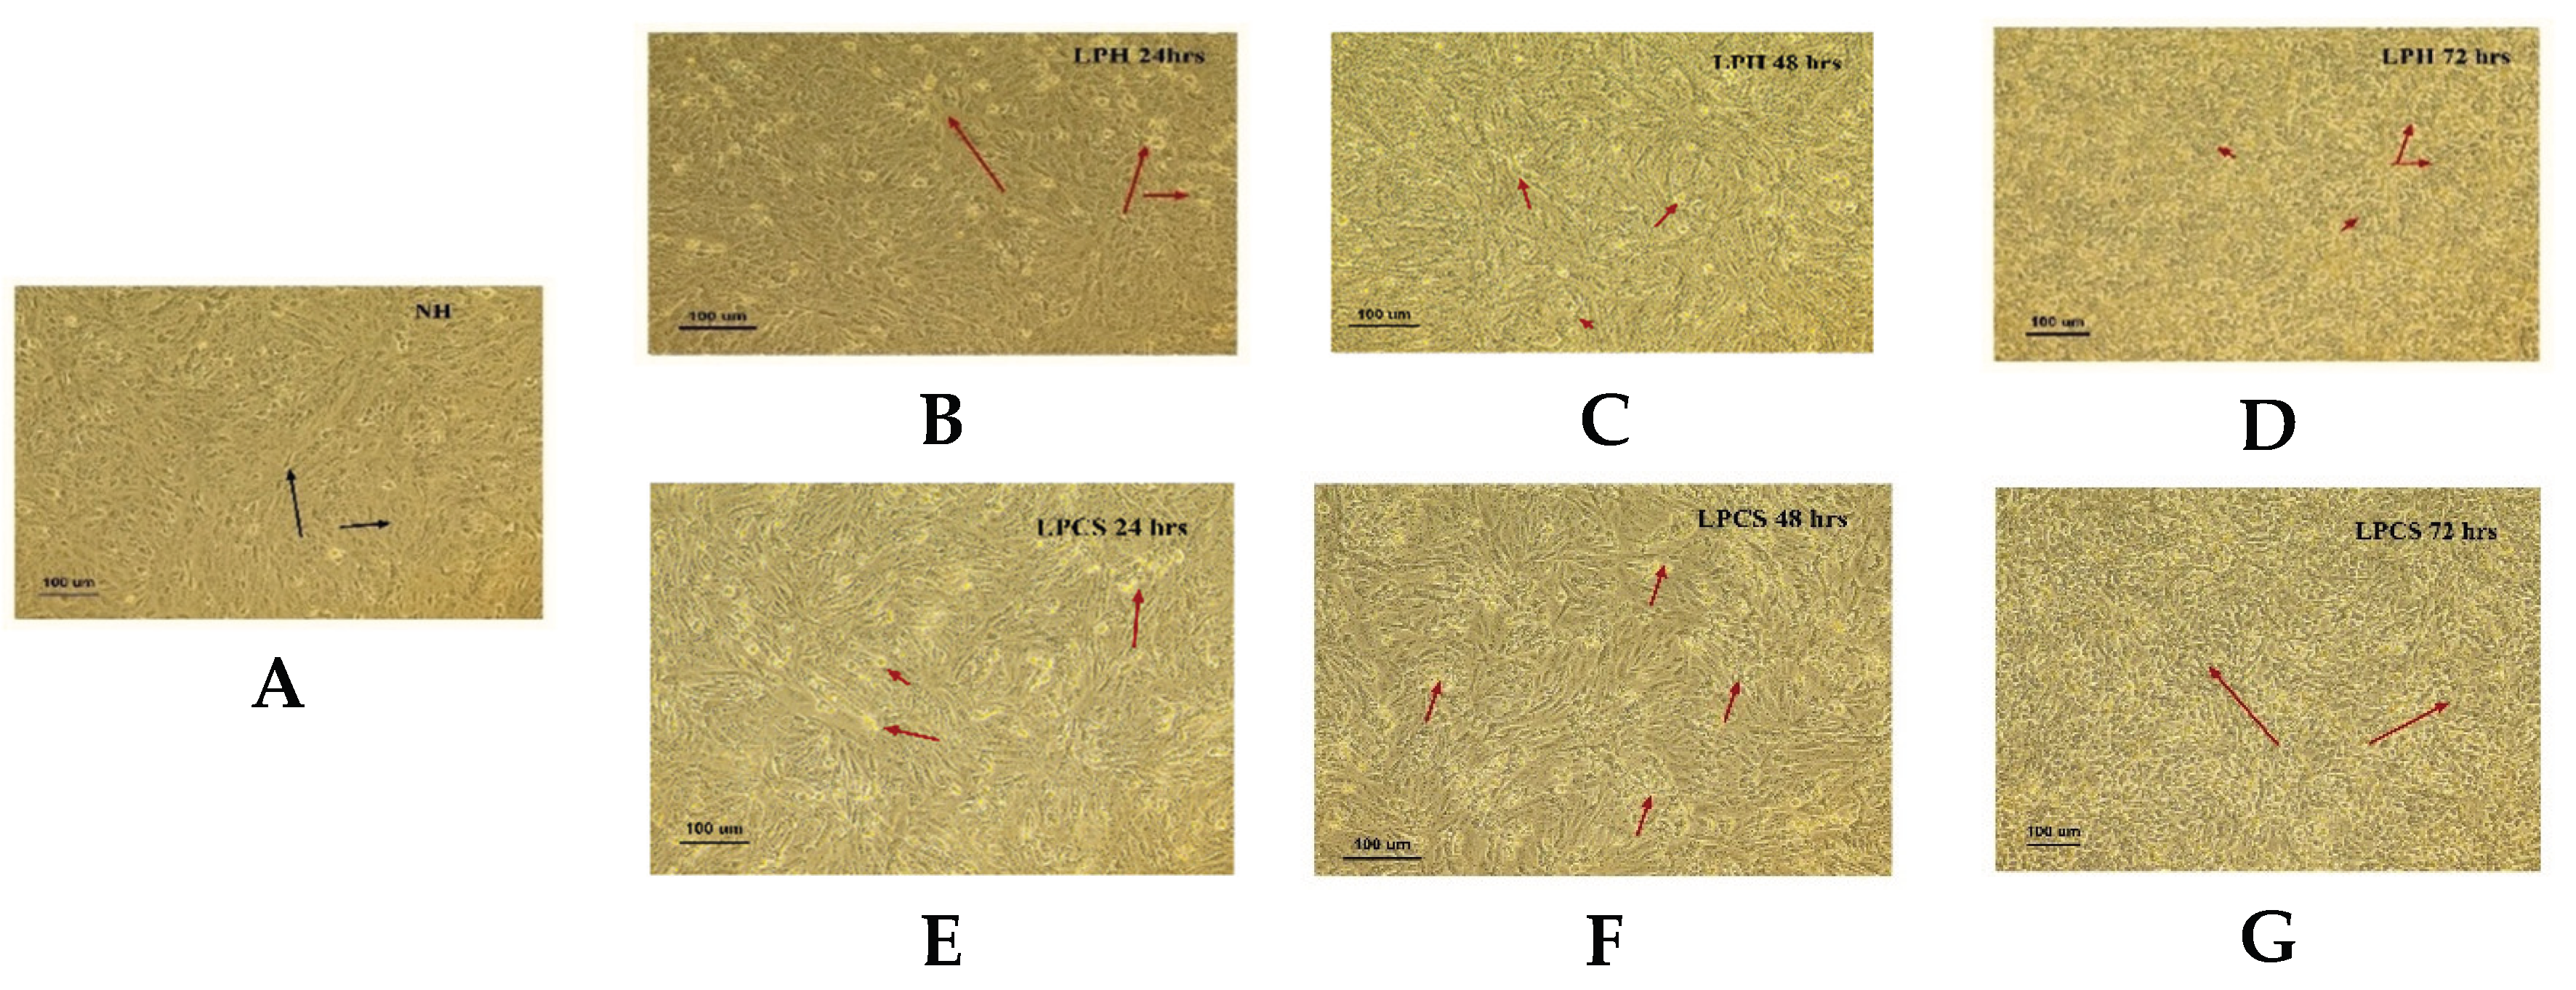
2.1. Morphological Evidence of Apoptosis in HCT Cells Following Postbiotic and Combination Treatments

Untreated HCT cells consistently preserved their typical round-to-oval morphology throughout the experimental period, exhibiting an intact centrally located nucleus and abundant surface microvilli (Figure 1A). HCT cells treated with Lactobacillus postbiotics alone showed clear time-dependent cytotoxic and apoptotic responses. After 24 h, treated cells displayed characteristic apoptotic features, including cell shrinkage, membrane blebbing, and nuclear condensation and fragmentation (Figure 1B). These morphological changes persisted at 48 h, accompanied by a further increase in overall cell death (Figure 1C). By 72 h, Lactobacillus postbiotics alone continued to induce substantial toxicity, with pronounced apoptotic morphology and increased cell detachment relative to earlier time points (Figure 1D).
In contrast, HCT cells exposed to the combined treatment of Lactobacillus postbiotics with the carrageenan/soy protein blend exhibited markedly enhanced anticancer activity at all examined time points. After 24 h, the combination treatment produced stronger cytotoxic effects than postbiotics alone, as evidenced by more pronounced apoptotic morphology (Figure 1E). This enhanced response was further amplified at 48 h, resulting in extensive cell shrinkage, detachment, and a substantial rise in apoptotic cell death (Figure 1F). After 72 h, cells treated with the combination therapy demonstrated the most severe morphological alterations, including widespread apoptosis and marked cellular detachment, exceeding the effects observed with Lactobacillus postbiotics alone (Figure 1G).

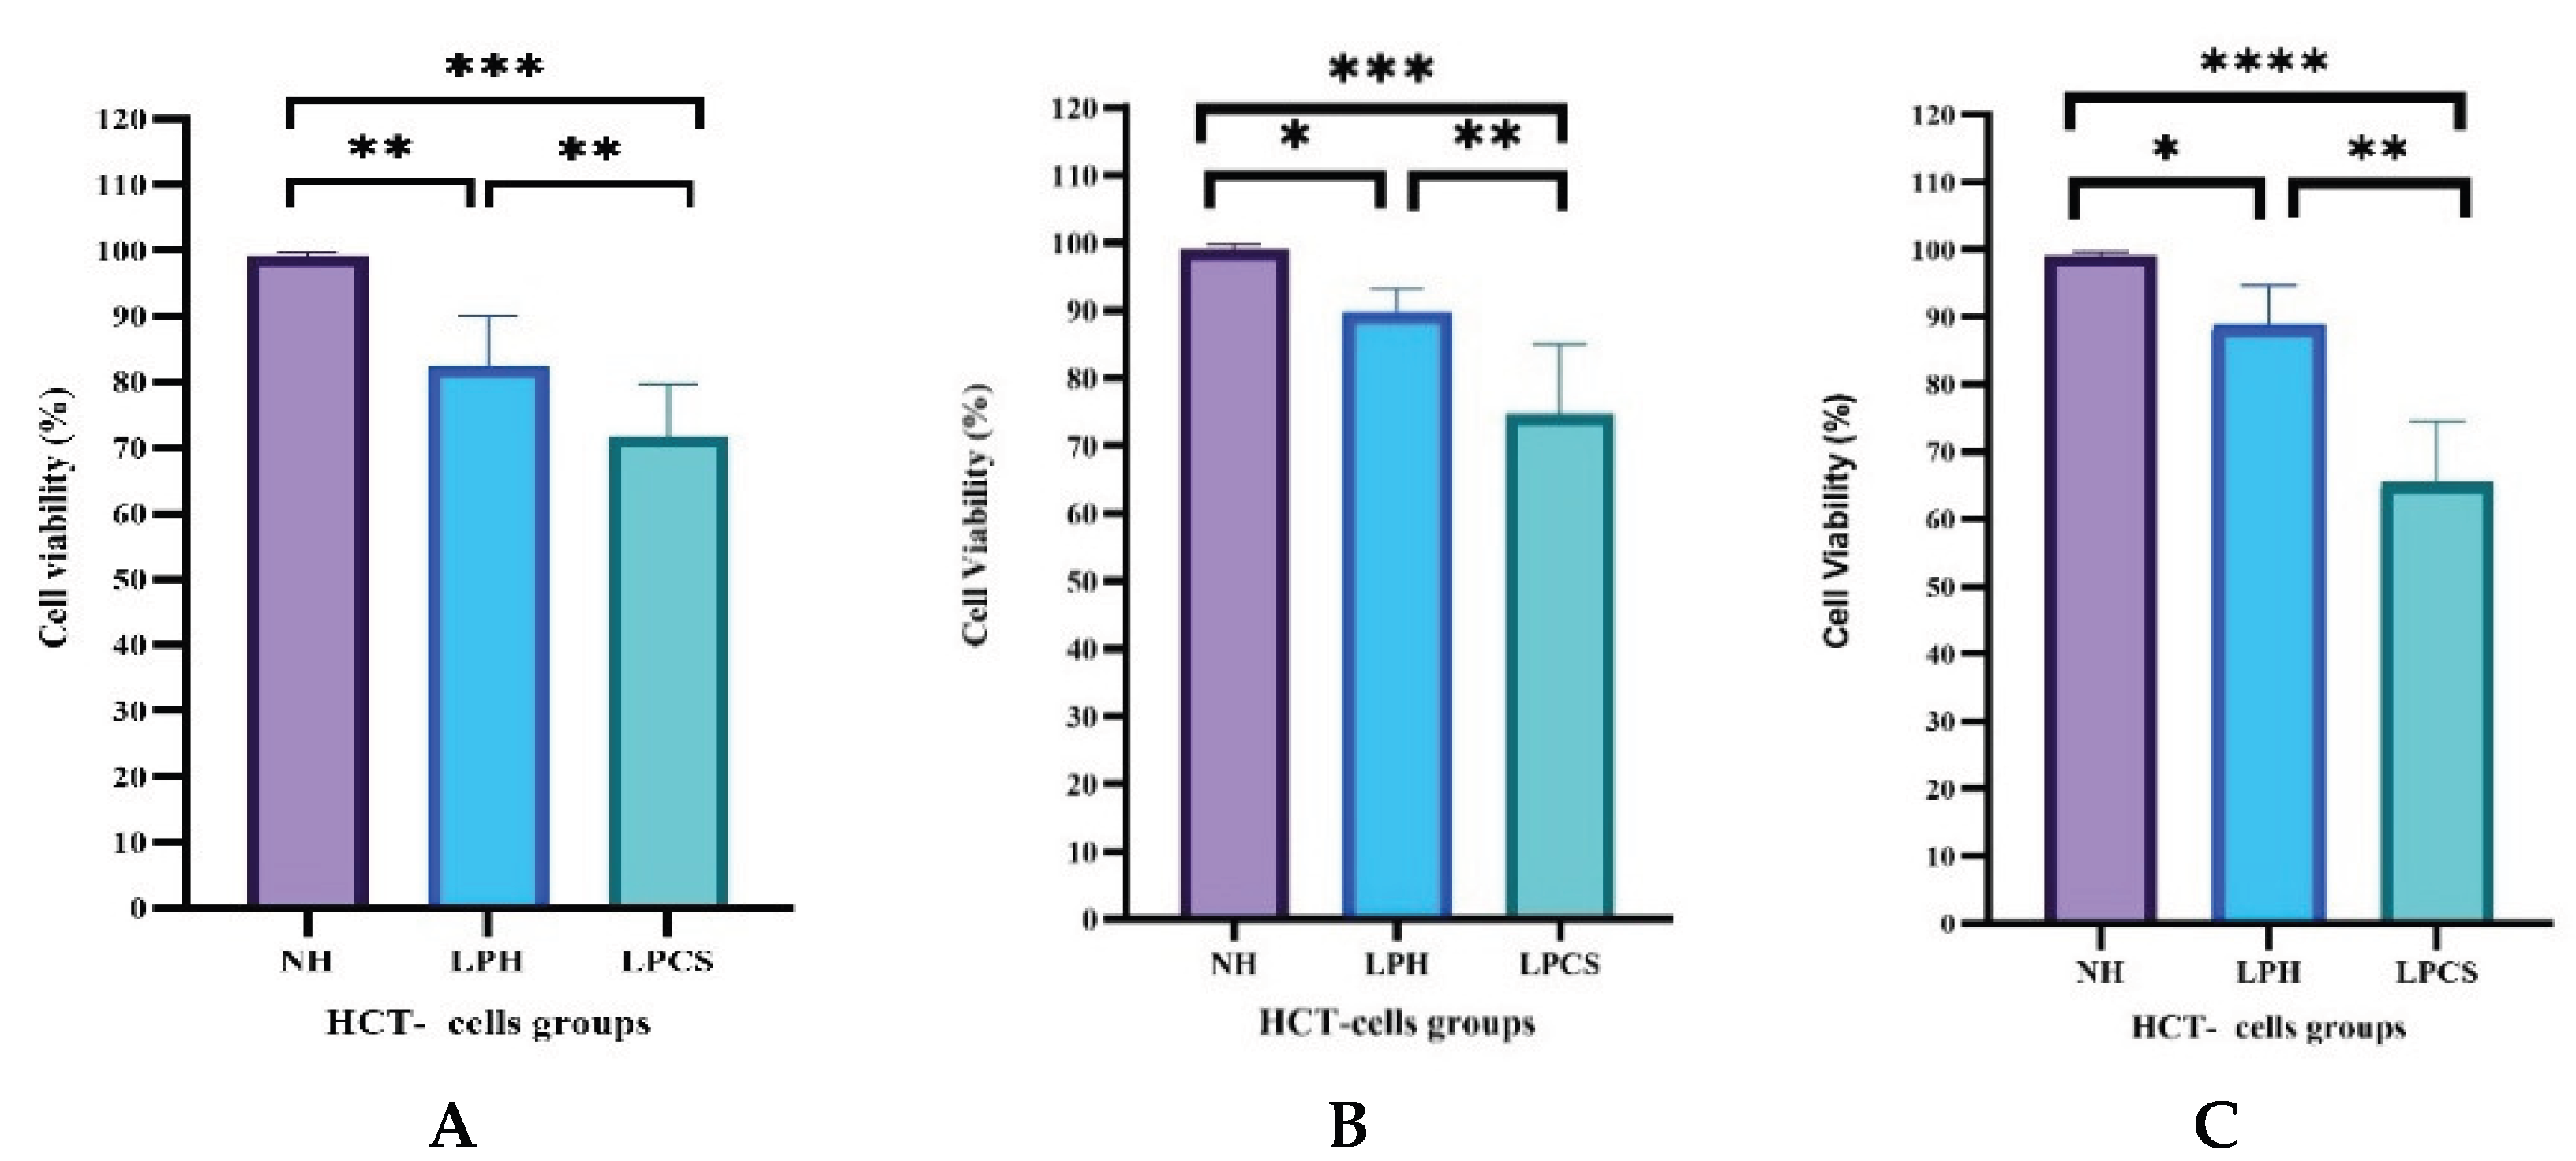
2.2. Time-Dependent Effects of Lactobacillus Postbiotics and Combination Therapy on HCT Cell Viability

At 24 h post-treatment, comparative analysis of HCT cell viability showed significant reductions in both treated groups relative to the untreated cells. The combination therapy, comprising Lactobacillus postbiotics, carrageenan, and soy protein, induced a markedly greater decrease in viability (≈73–76%; p < 0.0001) compared with both the control and the postbiotics-only group, and resulted in a further significant reduction relative to Lactobacillus postbiotics alone (p < 0.001). Treatment with Lactobacillus postbiotics alone produced a moderate but significant reduction in viability (≈84–90%; p < 0.001), indicating clear cytotoxic activity (Figure 2A). After 48 h, untreated cells maintained high viability, whereas treated groups showed a clear time-dependent decline. The combination treatment continued to exert a stronger cytotoxic effect, reducing viability to approximately 73% compared with the control (p < 0.0001) and remaining significantly more effective than postbiotics alone (p < 0.001). In contrast, cells treated with Lactobacillus postbiotics alone showed a moderate yet significant reduction in viability (≈90%; p < 0.05), with a slight recovery compared with 24 h values (Figure 2B). At 72 h, untreated HCT cells still exhibited high viability, whereas the combination therapy produced the most pronounced and sustained reduction in cell viability compared with both the control (p < 0.001) and postbiotics-only treatment (p < 0.0001). Postbiotic monotherapy also significantly suppressed cell viability relative to the control with levels comparable to those observed at 48 h (p < 0.001) (Figure 2C).

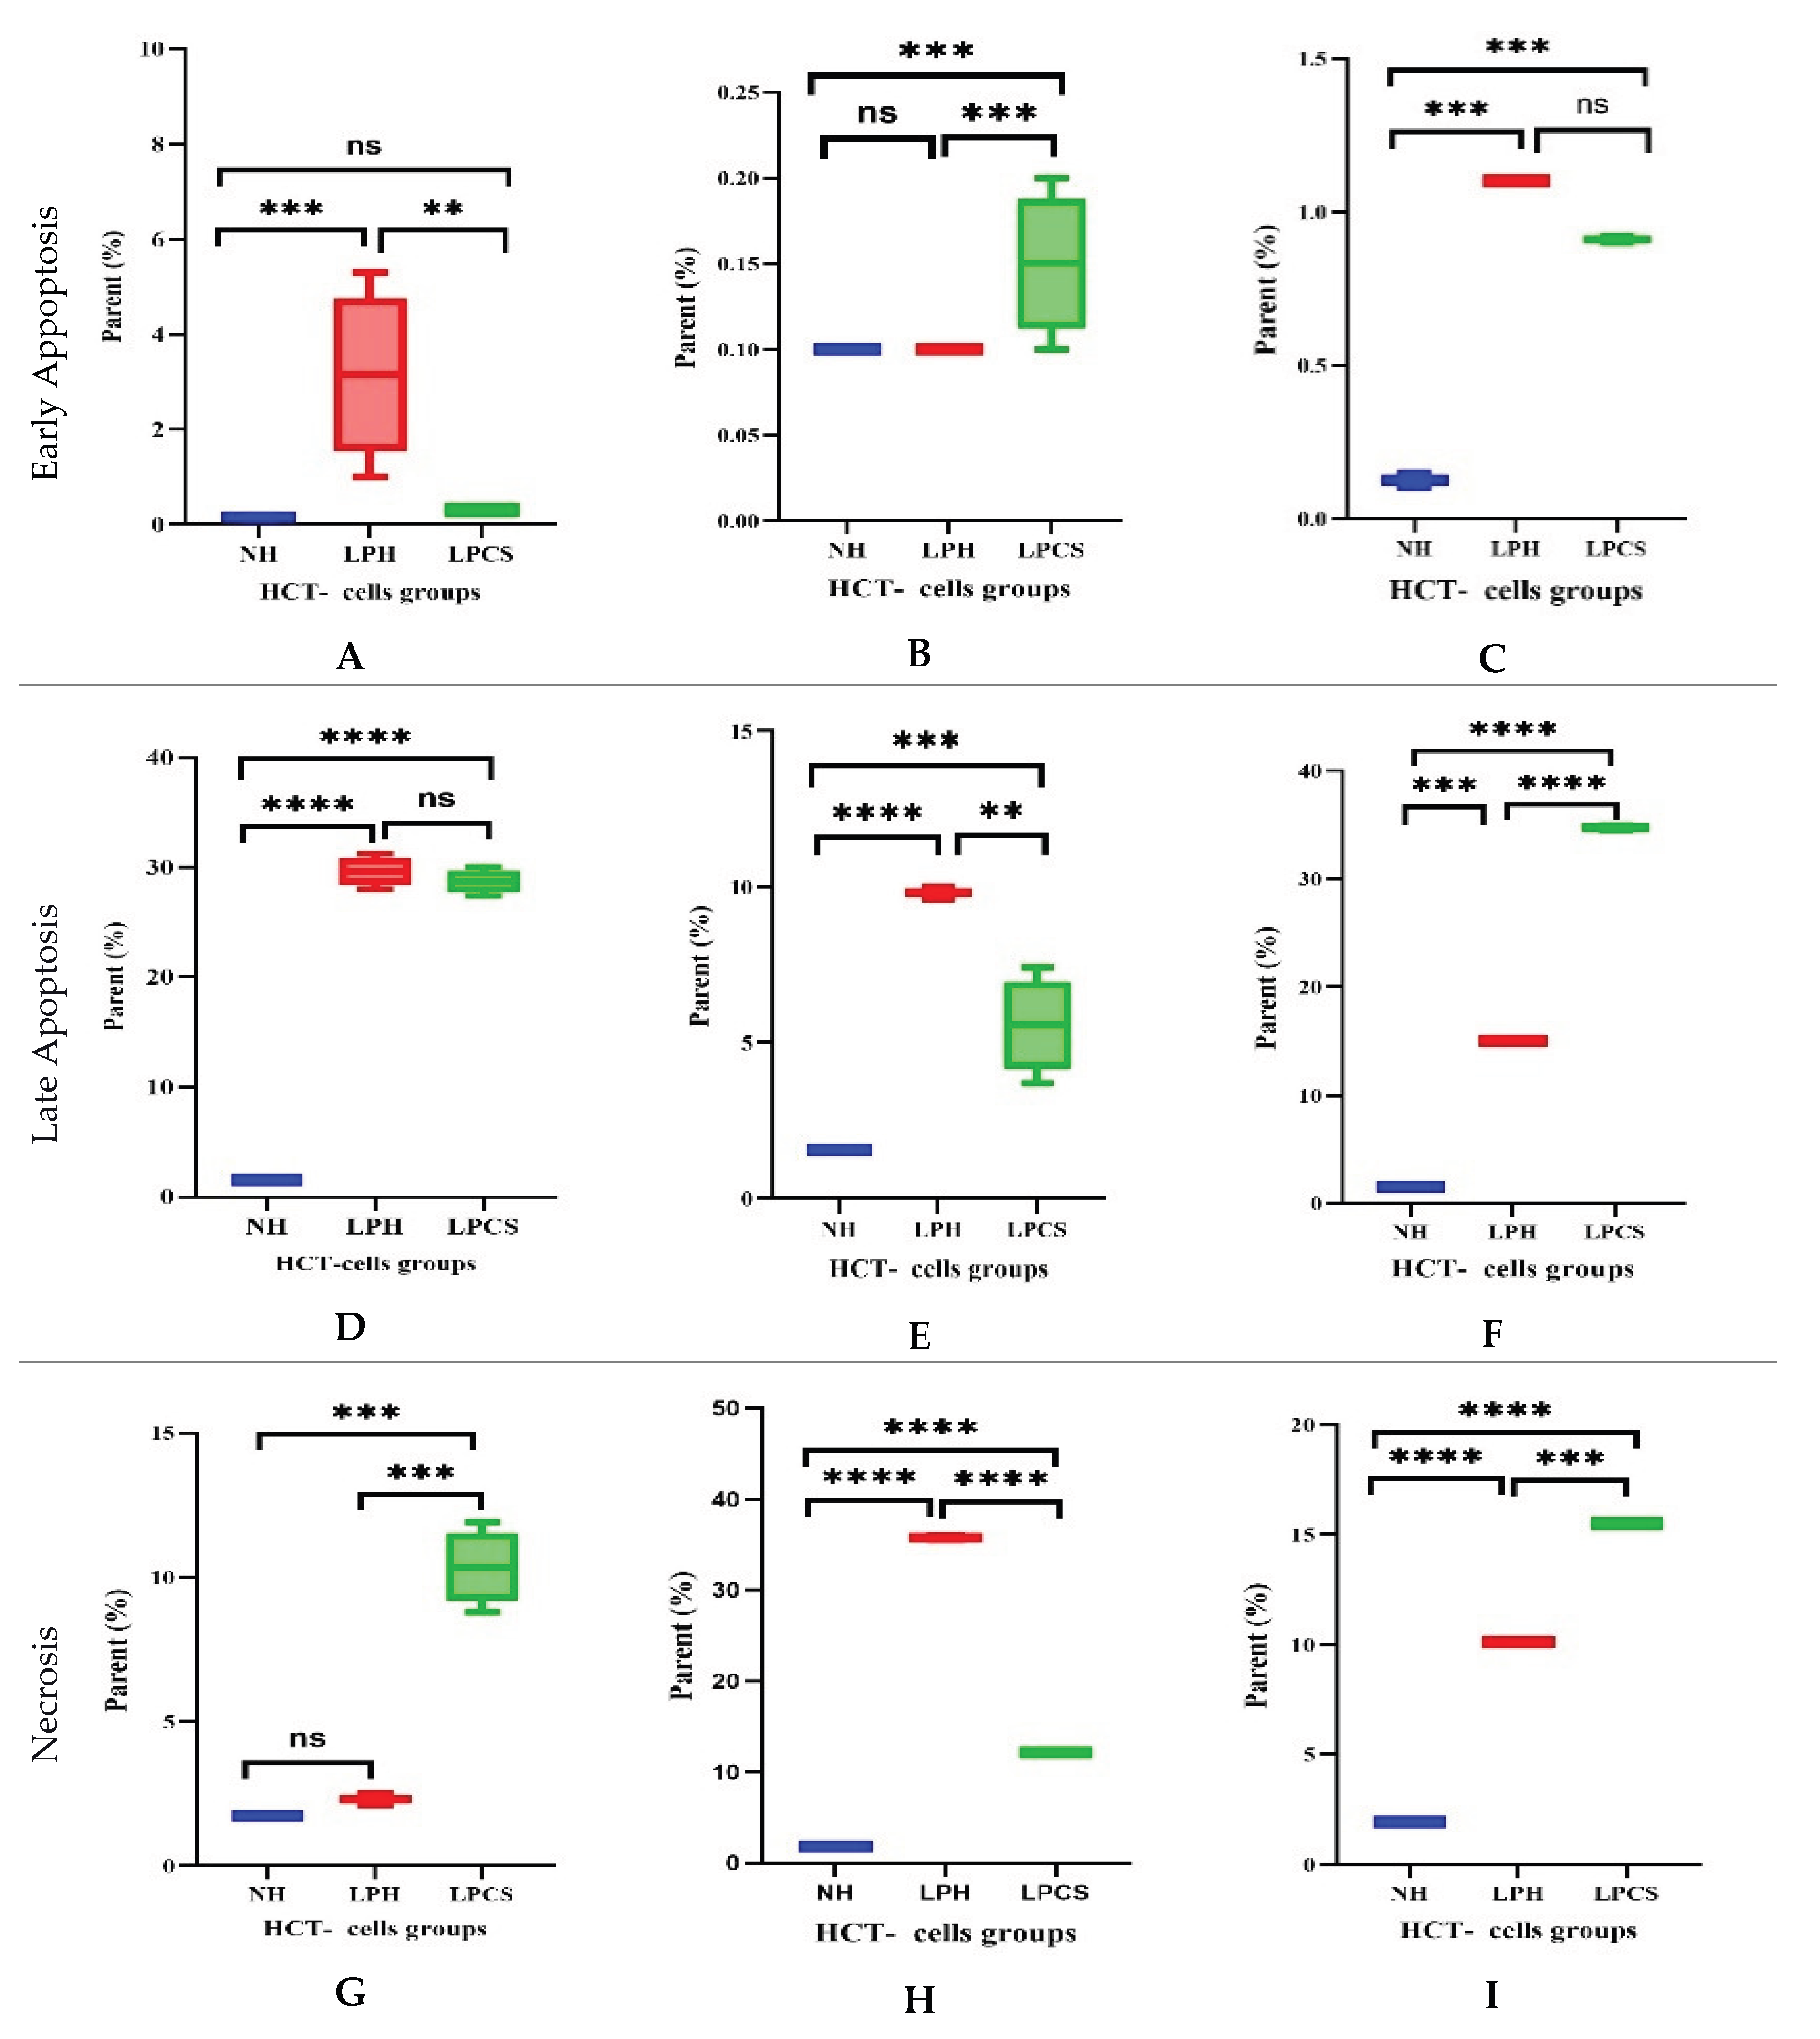
2.3. Time-Dependent Progression of Apoptosis and Necrosis in HCT Cells

Analysis of cell death pathways demonstrated a clear time-dependent response to the applied treatments. Early apoptosis analysis showed that, at 24 h, HCT cells treated with the combination of postbiotics, carrageenan, and soy protein displayed significantly lower early apoptosis than the postbiotics-only group (p < 0.001) and did not differ from untreated cells. In contrast, HCT cells treated with Lactobacillus postbiotics alone exhibited a significant increase in early apoptotic activity compared with the untreated control (p < 0.0002). (Figure 3A). At 48 h, the combination treatment significantly increased early-stage apoptosis relative to both the untreated control and the postbiotics-only group (p < 0.0002 for each comparison), whereas no significant difference was observed between postbiotics-treated and untreated cells (Figure 3B). After 72 h, early apoptotic activity remained significantly elevated in the combination group compared with the control (p < 0.0002), while no significant difference was detected between the two treatment groups; notably, postbiotics alone also significantly increased early apoptosis relative to untreated cells at this point (p < 0.0002) (Figure 3C).
Late apoptosis analysis further confirmed a time-dependent treatment effect. At 24 h, both Lactobacillus postbiotics alone and the combination treatment significantly increased late apoptotic cells compared with the untreated control (p < 0.0001), with no significant difference between the two treatment groups (Figure 3D). After 48 h, late apoptosis remained minimal in untreated cells, whereas both treatments significantly elevated apoptotic levels relative to the control. Notably, late apoptosis was significantly higher in the postbiotics-only group than in the combination group (p < 0.0002), although both effects remained significant compared with untreated cells (p < 0.0001 and p < 0.001, respectively) (Figure 3E). By 72 h, the combination treatment induced the highest level of late apoptosis, which was significantly greater than that observed in both the untreated control and the postbiotics-only group (p < 0.0001 for both comparisons). Postbiotics alone also significantly increased late apoptosis compared with the control (p < 0.001) (Figure 3F).
Necrosis analysis revealed a pronounced time-dependent pattern. At 24 h, the combination treatment significantly increased the proportion of necrotic HCT cells compared with both the untreated control and the postbiotics-only group (p < 0.0002), whereas no significant difference was observed between untreated cells and those treated with postbiotics alone (Figure 3G). After 48 h, untreated cells continued to exhibit minimal necrosis, while both treatments significantly enhanced necrotic cell death relative to the control (p < 0.0001). Necrosis was significantly greater in the postbiotics-only group than in the combination group (p < 0.0001), indicating distinct cytotoxic profiles (Figure 3H). At 72 h, the combination treatment produced the highest level of necrosis, significantly exceeding that of both the untreated control (p < 0.001) and the postbiotics-only group (p < 0.0001). Treatment with Lactobacillus postbiotics alone also resulted in a sustained and significant increase in necrotic cells compared with the control (p < 0.0001) (Figure 3I).

2.4. Time-Dependent Apoptotic Gene Expression Responses in HCT Cells

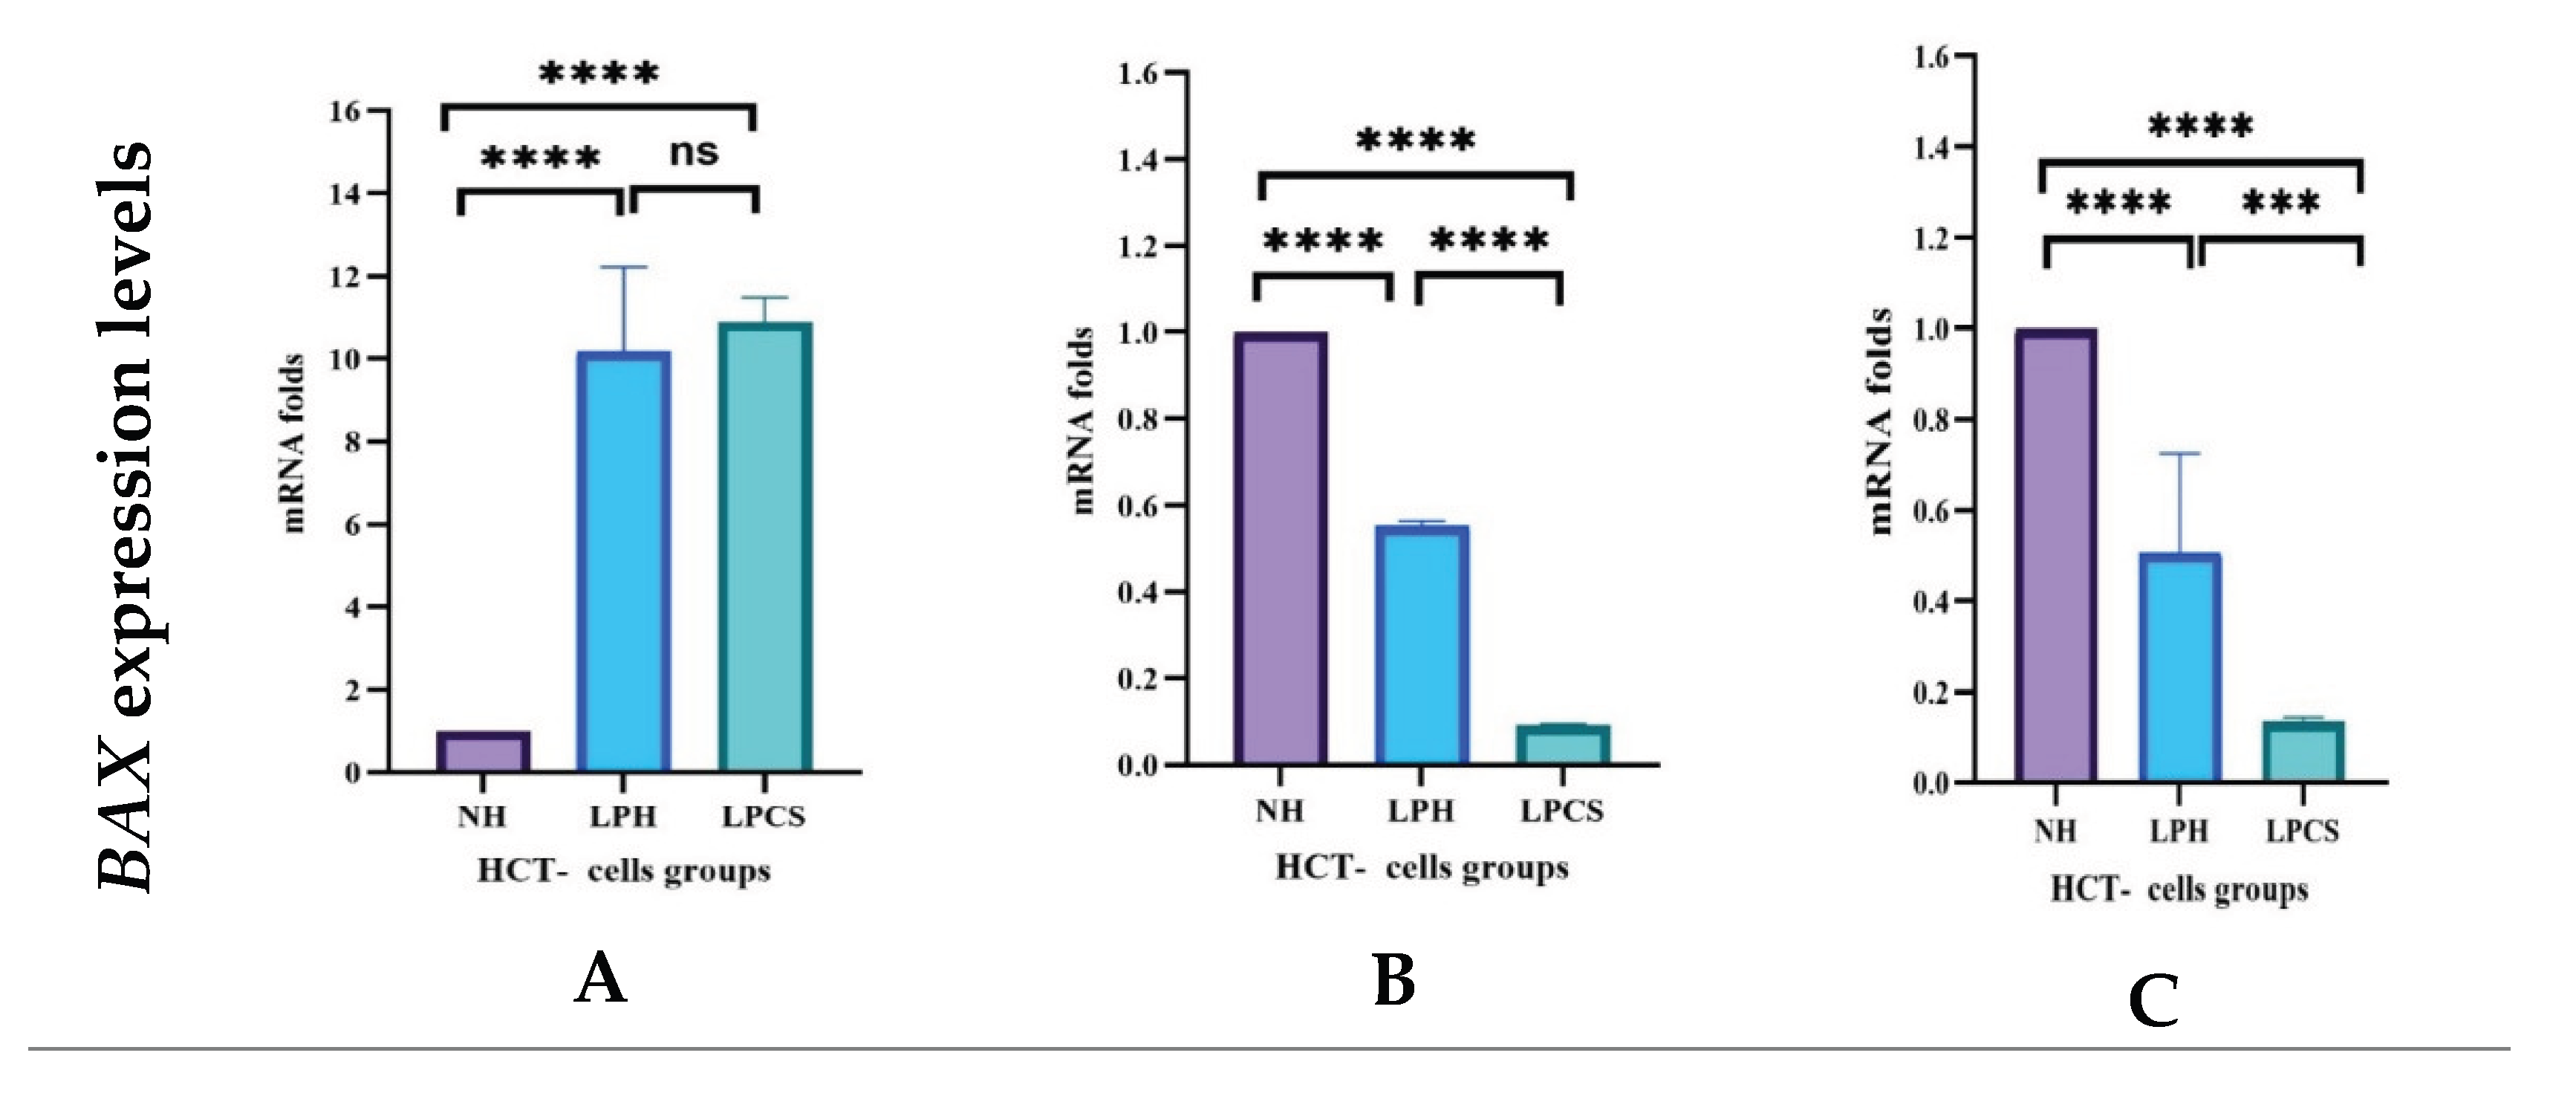
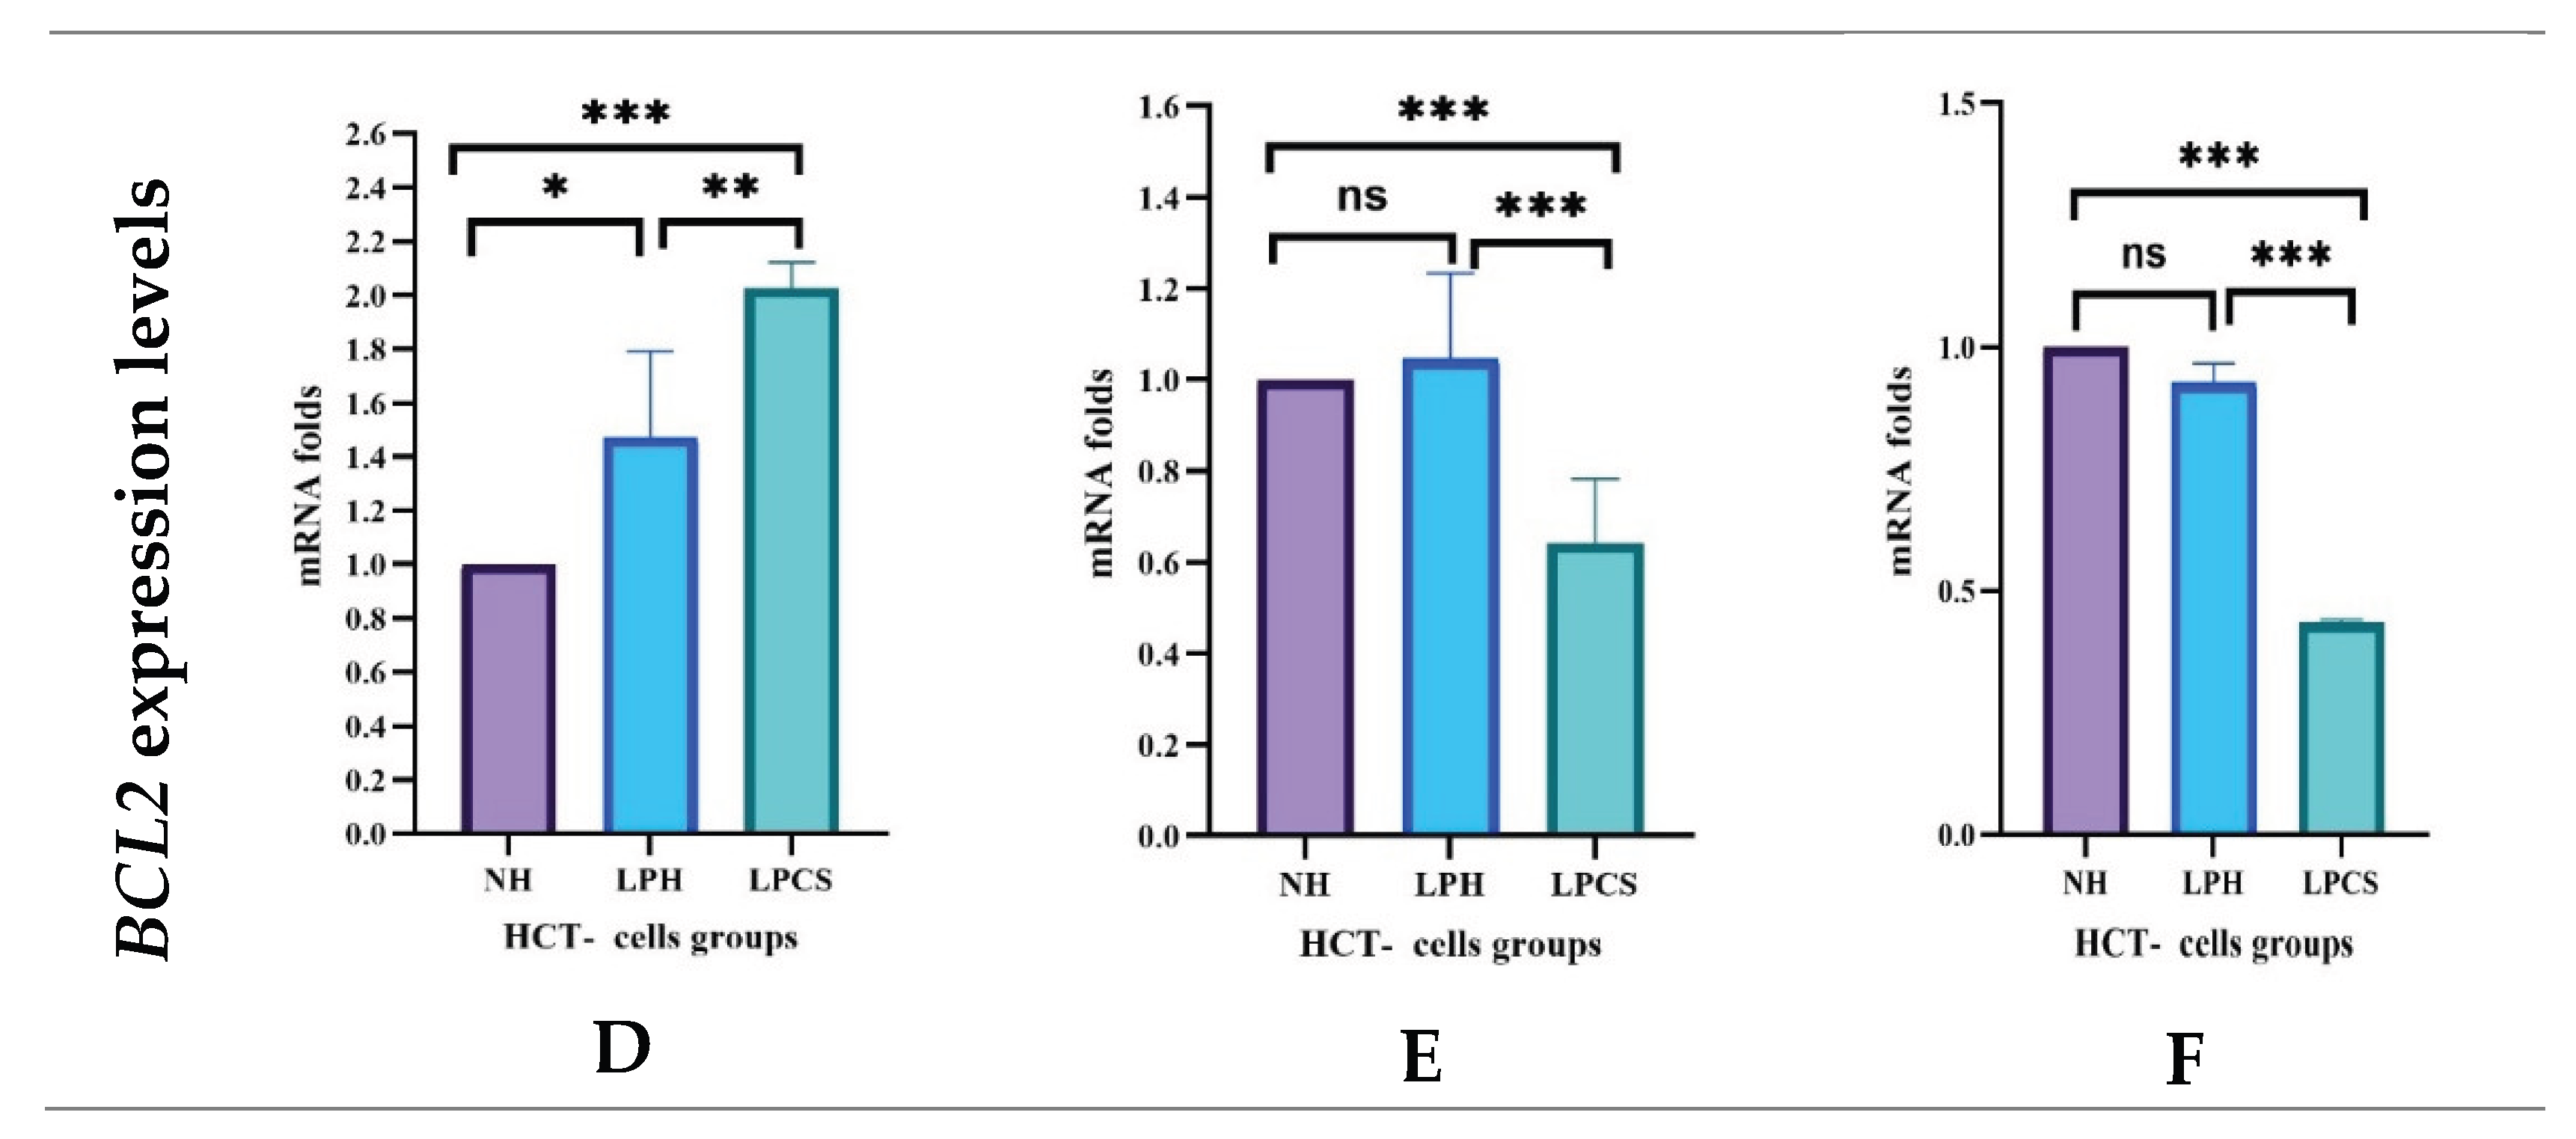
2.4.1. Levels of Apoptotic Regulatory Genes

Gene expression profiling revealed a pronounced time-dependent modulation of the apoptotic markers BAX and BCL2 in response to the different treatments. At 24 h, the combination of Lactobacillus postbiotics, carrageenan, and soy protein significantly upregulated BAX expression (10.8-fold) compared with untreated control cells (p < 0.0001), exceeding the 9.2-fold increase observed with postbiotics alone (p < 0.0001). However, the difference between the two treatment groups was not statistically significant (Figure 4A). At 48 h, BAX expression was markedly suppressed in cells treated with the combination therapy compared with both untreated controls and postbiotics-only treatment (p < 0.0001 for both comparisons), while postbiotics alone also significantly reduced BAX levels relative to the control (p < 0.0001) (Figure 4B). By 72 h, the combination regimen produced the strongest inhibitory effect on BAX expression, which was significantly lower than that in both untreated and postbiotics-treated cells (p < 0.0001 and p < 0.0002, respectively). Nevertheless, BAX expression was significantly suppressed in the postbiotics-only group compared to the untreated control cells (p < 0.0001) (Figure 4C).
In parallel, BCL2 expression displayed distinct temporal changes. After 24 h, BCL2 mRNA levels were significantly upregulated in both treatment groups, with a greater increase observed in the combination group (2.03-fold), while the postbiotics-only group (1.47-fold) compared to untreated control cells (p < 0.0002 and p < 0.001, respectively). BCL2 mRNA levels were significantly upregulated in the postbiotics-only group compared to the untreated control group (p < 0.05) (Figure 4D). At 48 h, BCL2 expression was significantly reduced in the combination-treated cells compared with both untreated controls and postbiotics-treated cells (p = 0.001 for each comparison), whereas BCL2 levels in the postbiotics-only group remained comparable to those of the control (Figure 4E). After 72 h, the combination treatment induced the most pronounced suppression of BCL2 expression, which was significantly lower than that observed in both untreated and postbiotics-only groups (p = 0.0000 for each comparison). In contrast, treatment with Lactobacillus postbiotics alone resulted in only a non-significant increase in BCL2 expression at this time point (Figure 4F).

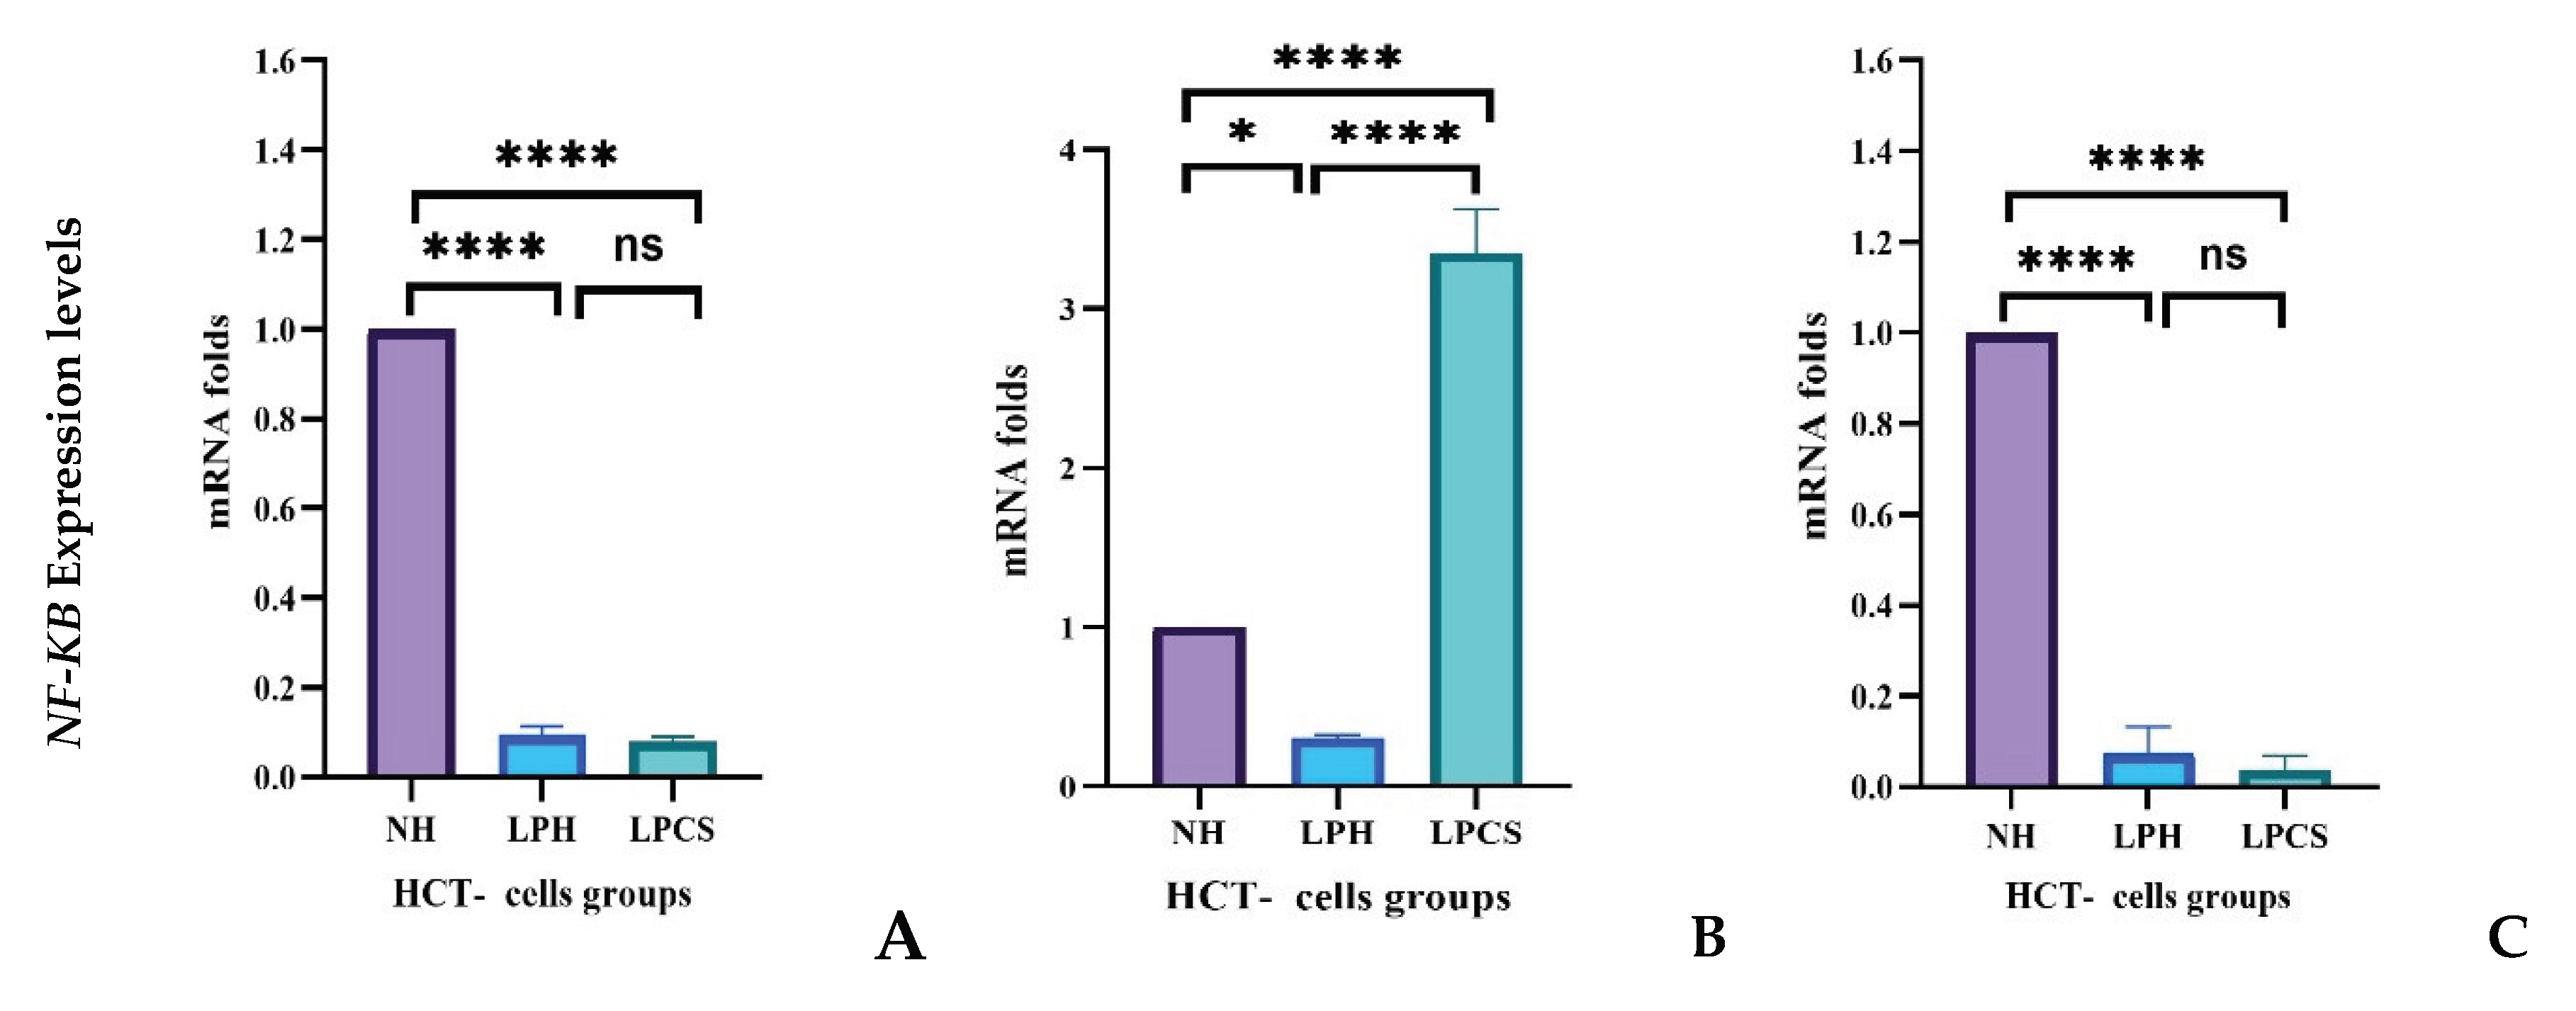
2.4.2. Levels of Inflammatory Gene Expression

Analysis of NF- κB gene expression revealed a dynamic, time-dependent response to the applied treatments. At 24 h, both the combination treatment and Lactobacillus postbiotics alone significantly downregulated NF- κB expression compared with untreated control cells (p < 0.0001 for both), with no significant difference observed between the two treatment groups (Figure 5A). After 48 h, cells treated with the combination formulation exhibited a marked upregulation of NF- κB expression (3.35-fold) relative to both untreated controls and the postbiotics-only group (p = 0.0001 for each comparison). In contrast, NF- κB mRNA levels in the postbiotics-treated group remained significantly lower than those in untreated cells (p < 0.05) (Figure 5B). By 72 h, NF- κB expression was significantly reduced in both treatment groups compared with the untreated control (p < 0.0001), and no significant difference was detected between the combination and postbiotics-only treatments (Figure 5C).

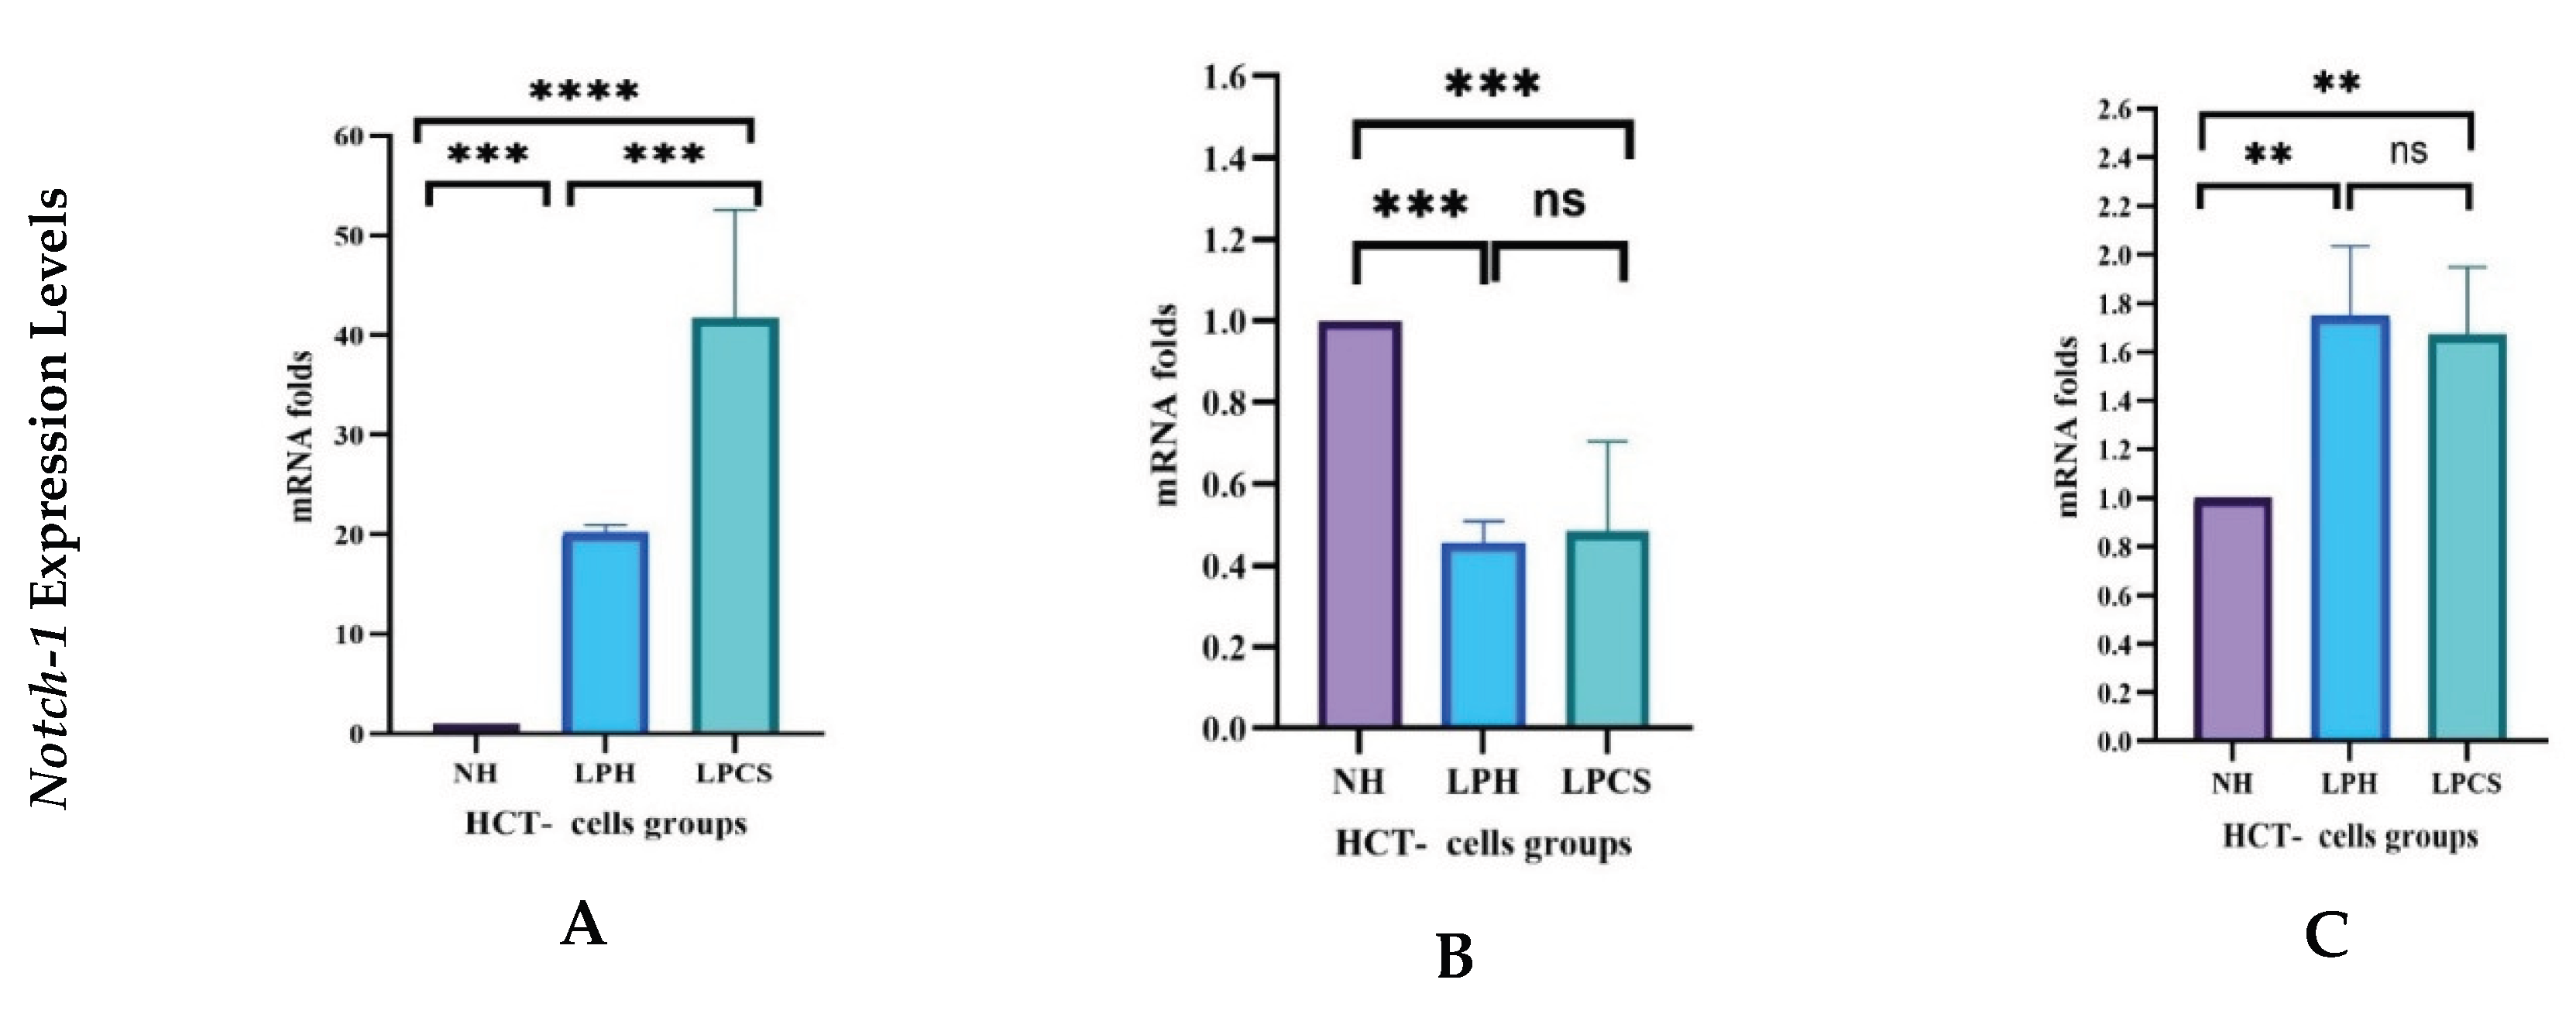
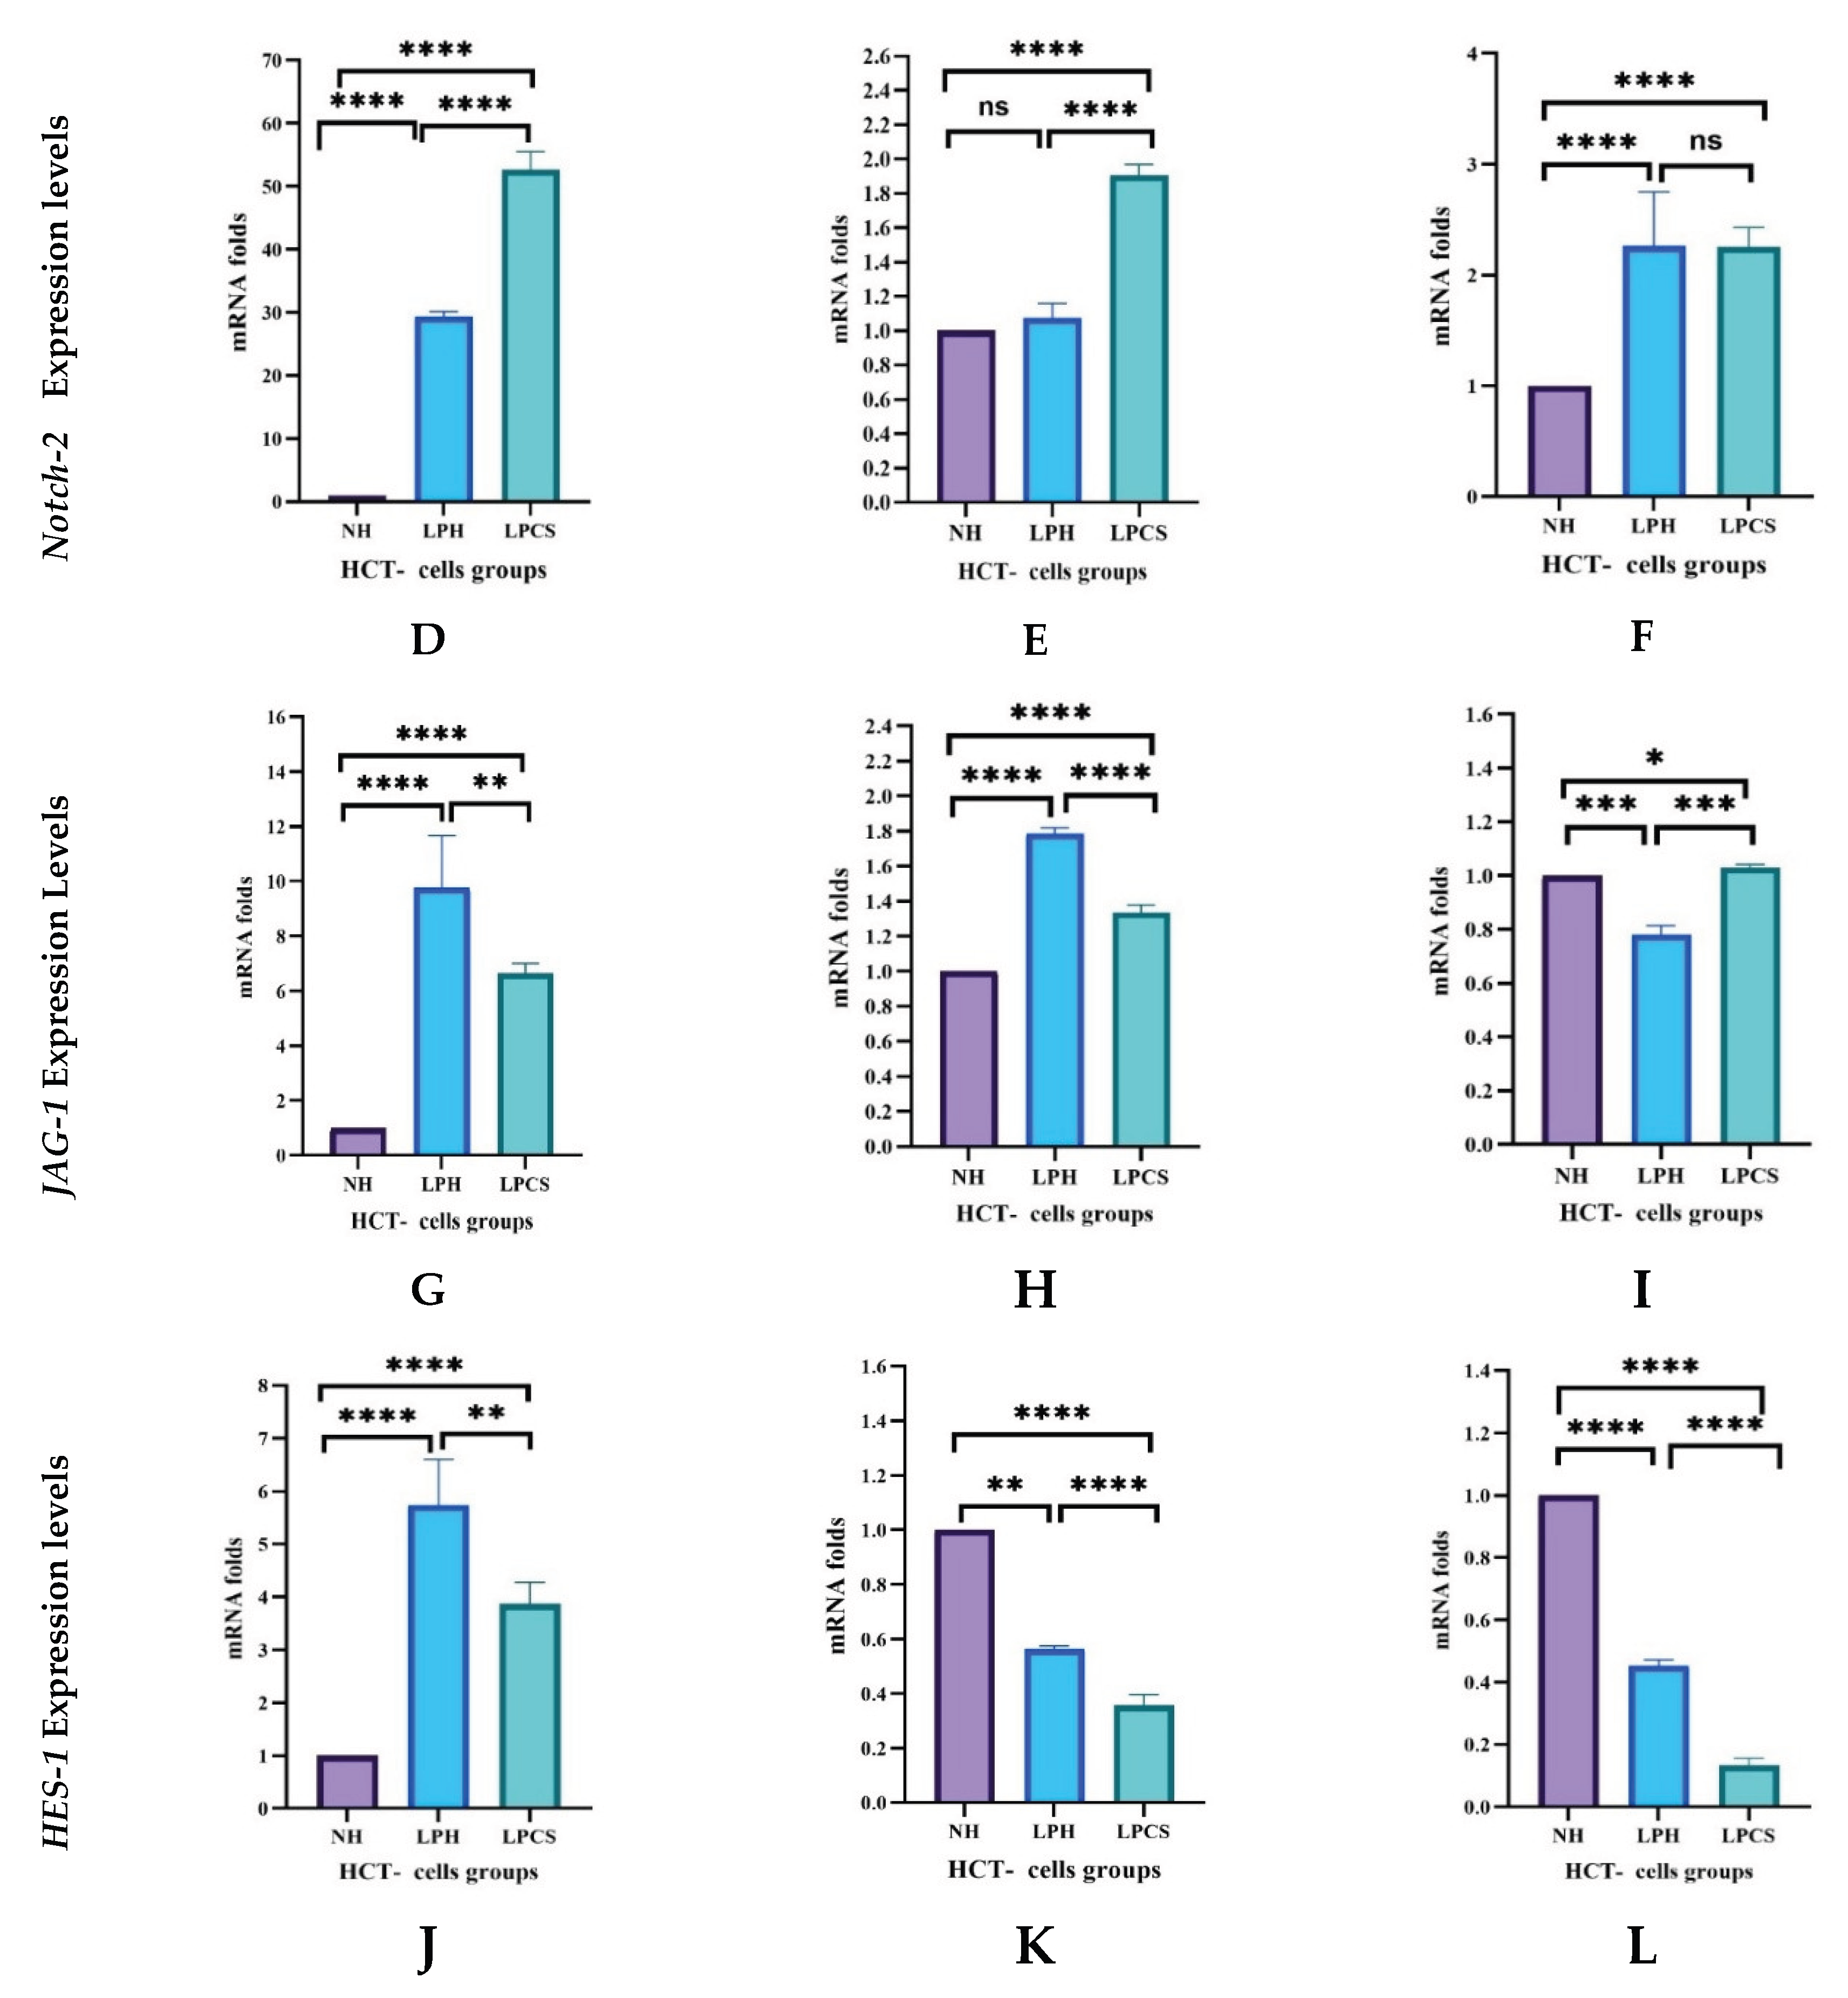
2.4.3. Levels of Notch Pathway Gene Expressions

Notch-1 expression exhibited distinct time-dependent changes in response to the treatments. At 24 h, Notch-1 mRNA levels were significantly elevated in the combination-treated group compared with both the postbiotics-only and untreated control groups (p < 0.0002 and p < 0.0001, respectively). Treatment with Lactobacillus postbiotics alone also resulted in a significant increase relative to control cells (p < 0.001) (Figure 6A). At 48 h, Notch-1 expression was significantly reduced in both treatment groups compared with the control (p < 0.0002 for each), with no significant difference between the two treatments (Figure 6B). By 72 h, Notch-1 levels were again significantly increased in both the combination and postbiotics-only groups (p < 0.001 for each comparison), although the difference between treatments was not statistically significant (Figure 6C).
Notch-2 expression also demonstrated clear temporal regulation. At 24 h, Notch-2 mRNA levels were significantly upregulated in both treatment groups compared with untreated controls (p < 0.0001 for each), with significantly greater induction observed in the combination-treated group (p < 0.0001) (Figure 6D). At 48 h, Notch-2 expression remained significantly elevated in the combination group relative to control cells (p < 0.0001), whereas the increase observed with postbiotics alone was not significant. Notch-2 levels were also significantly higher in the combination group than in the postbiotics-treated group (p < 0.0001) (Figure 6E). After 72 h, Notch-2 expression was significantly increased in both treatment groups compared with controls (p < 0.0001 for each), with no significant difference between treatments (Figure 6F).
JAG-1 expression was significantly and differentially modulated over time. At 24 h, both treatments induced significant upregulation of JAG-1 compared with untreated cells (p < 0.0001 for each), although expression levels were significantly lower in the combination group than in the postbiotics-only group (p < 0.001) (Figure 6G). At 48 h, JAG-1 expression remained significantly elevated in both treatment groups relative to controls (p < 0.0001 for each), with a pronounced reduction observed in the combination-treated group compared with postbiotics alone (p < 0.0001) (Figure 6H). By 72 h, JAG-1 expression was significantly increased in the combination-treated group compared with both untreated controls (p < 0.05) and the postbiotics-only group (p < 0.0001). In contrast, postbiotics treatment alone resulted in significant downregulation of JAG-1 relative to control cells (p < 0.0001) (Figure 6I).
HES-1 expression also showed significant time-dependent changes. At 24 h, HES-1 mRNA levels were significantly upregulated in both treatment groups compared with untreated controls (p < 0.0001 for each), with a greater increase observed in the postbiotics-only group (p < 0.001) (Figure 6J). At 48 h, HES-1 expression was significantly reduced in both treatment groups relative to controls (p < 0.0001 for each), with more pronounced suppression in the combination-treated group (p < 0.001) (Figure 6K). This trend persisted at 72 h, where HES-1 levels remained significantly downregulated in both treatment groups compared with controls (p < 0.0001), and suppression was significantly greater following combination therapy than postbiotics alone (p < 0.0001) (Figure 6L).

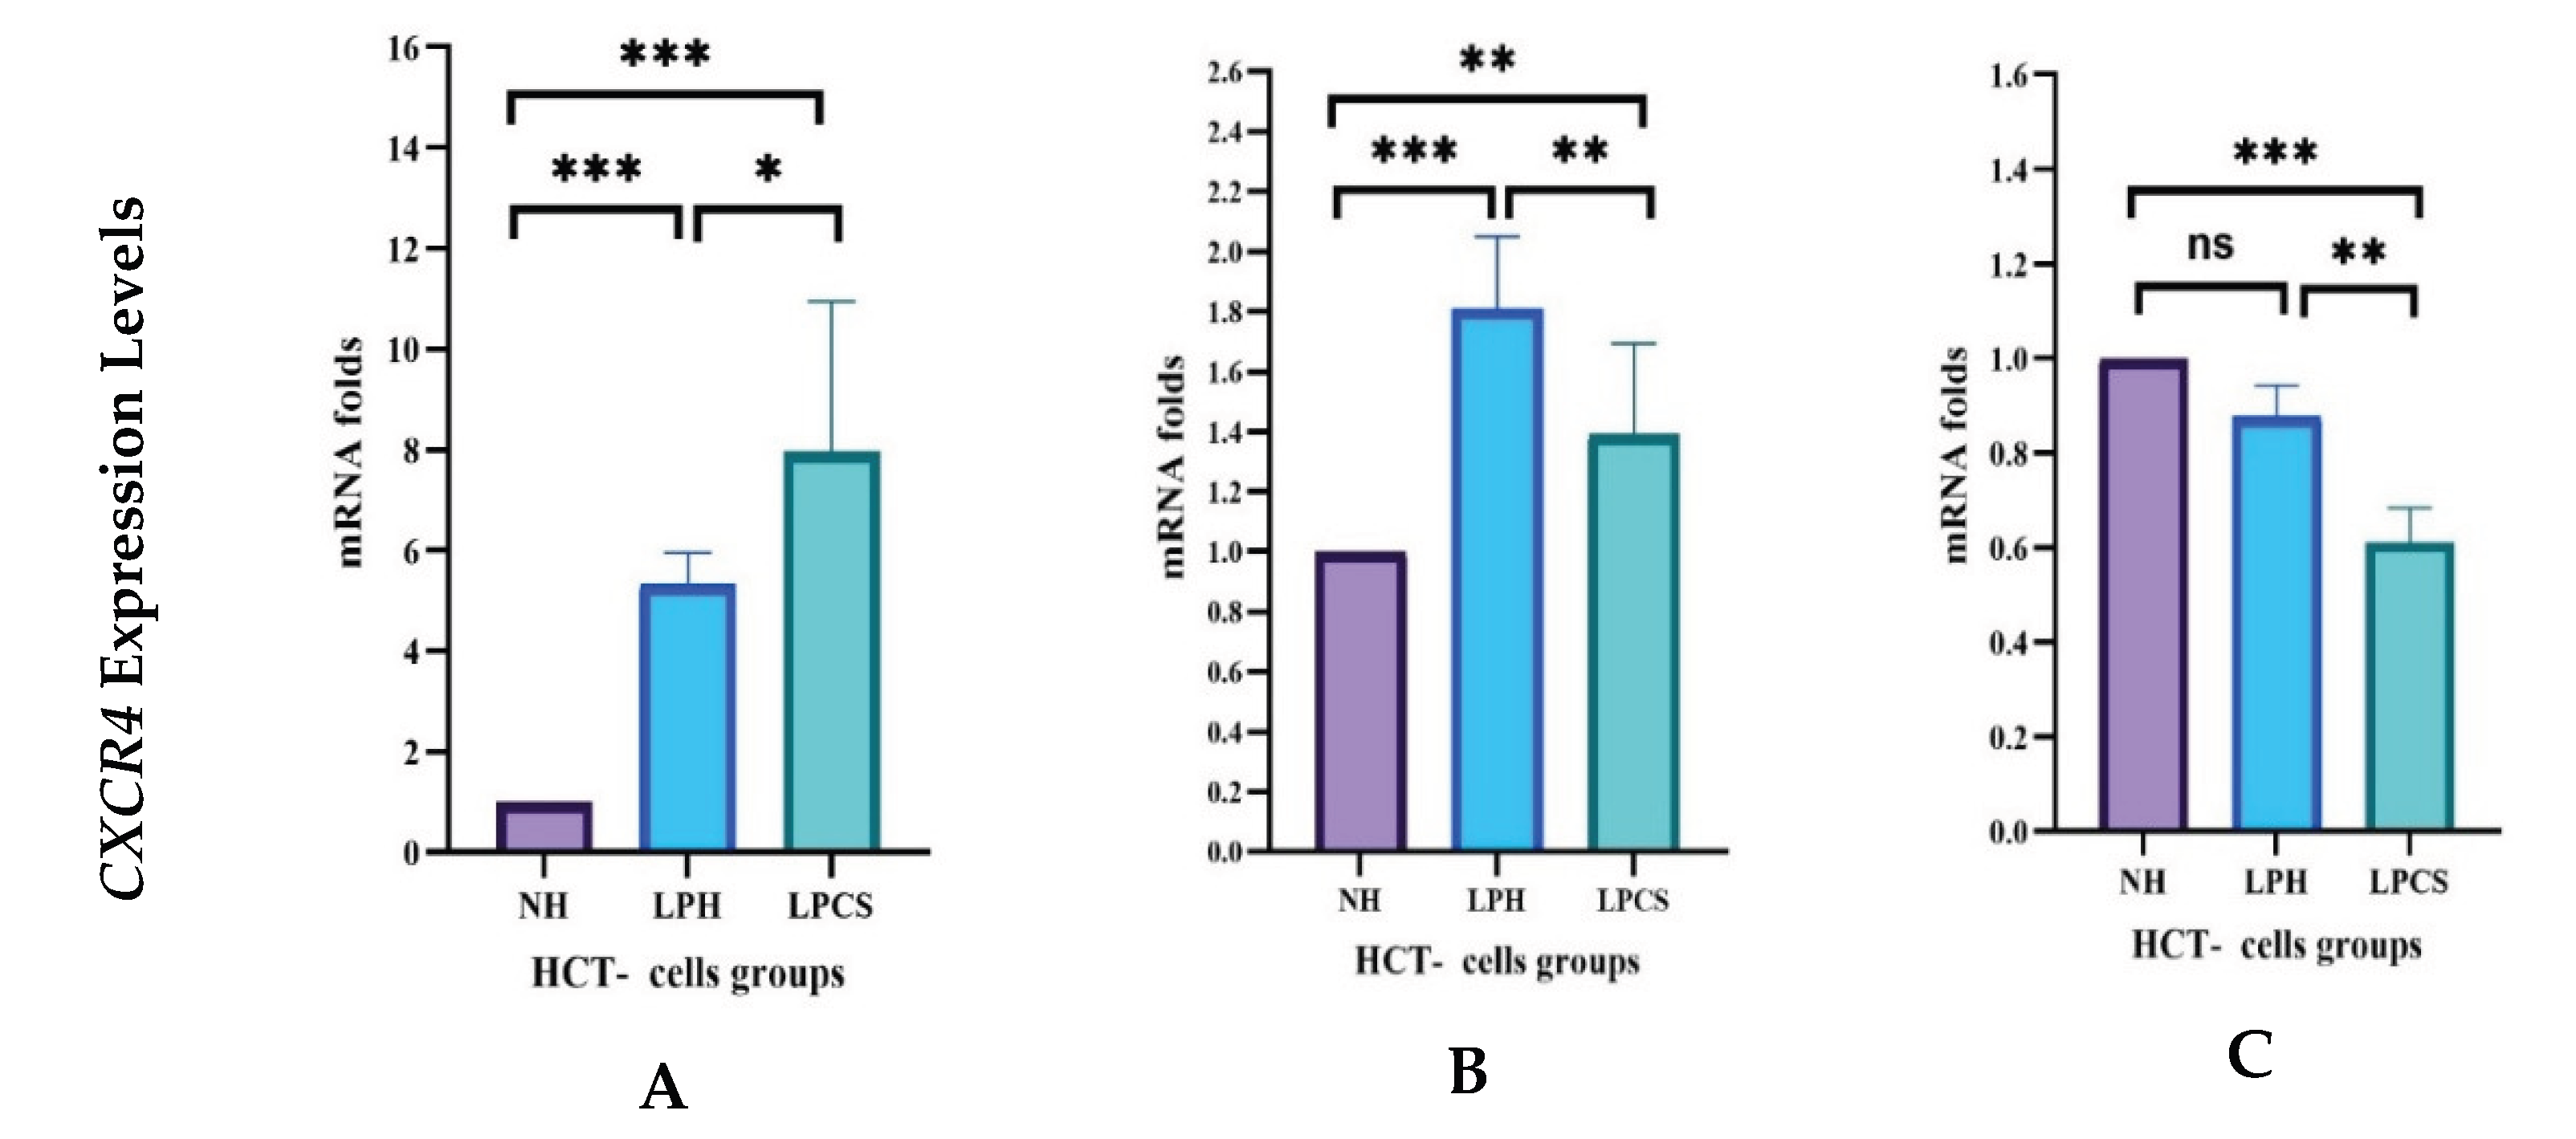
2.4.4. Levels of CXCR4 Receptor Gene Expression

The expression of CXCR4 exhibited distinct and time-dependent modulation in response to the applied treatments.
Similarly, CXCR4 expressions were significantly modulated by the treatments over time. At 24 h, CXCR4 mRNA levels were significantly elevated in both the combination and postbiotics-only groups compared with untreated controls (p < 0.0002 for each), with a significantly higher expression in the combination group than in the postbiotics-only group (p < 0.01) (Figure 7A). After 48 h, CXCR4 expression remained significantly increased in both treatment groups compared with the control (p < 0.0002 and p < 0.001 for each group, respectively). However, a modest but statistically significant reduction was observed in the combination group relative to the postbiotics-only group (p < 0.001) (Figure 7B). By 72 h, the combination treatment markedly suppressed CXCR4 expression compared with both untreated controls and postbiotics-only treatment (p < 0.0001 and p < 0.001, respectively), whereas Lactobacillus postbiotics alone did not significantly alter CXCR4 expression relative to untreated cells (Figure 7C).

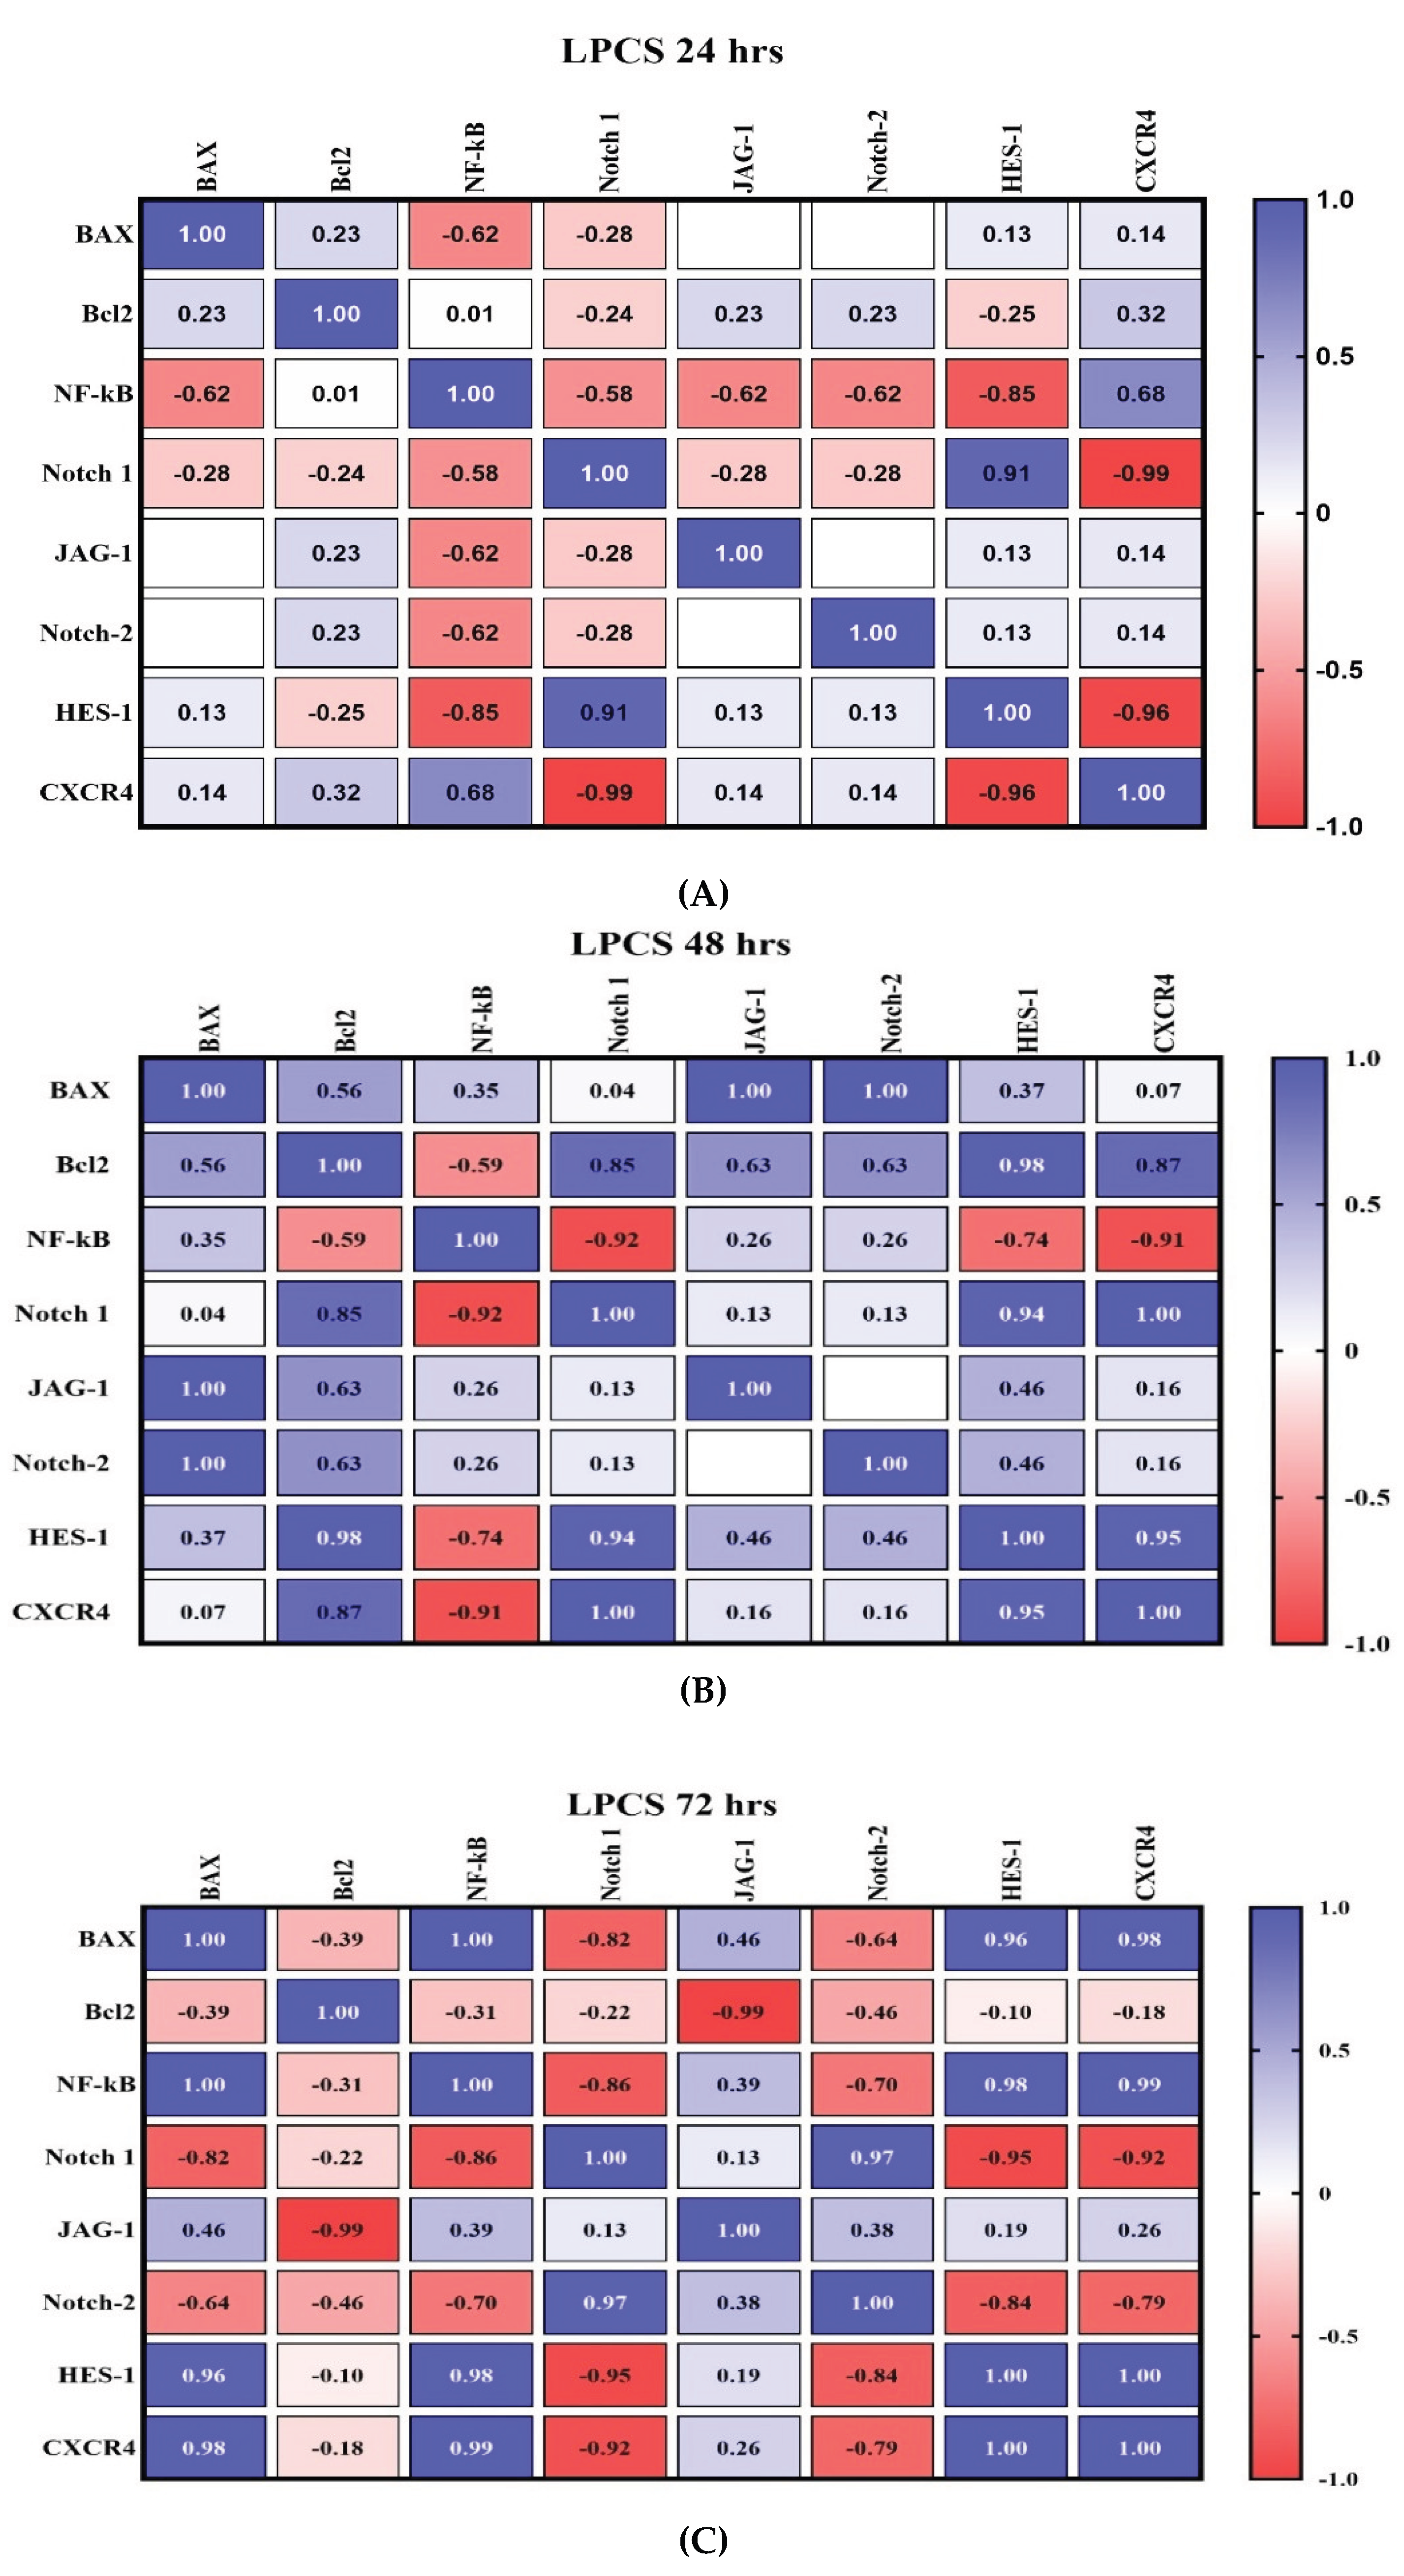
2.5. Detailed Analysis of Gene Expression Correlations Post-Treatment

2.5.1. Temporal Analysis of Gene Regulatory Networks in Lactobacillus, Carrageenan, and Soy Protein Combination Treatment

Correlation analysis at 24 h following the combination treatment revealed distinct interaction patterns among apoptosis, inflammation, and Notch-related genes (Figure 9). A strong negative correlation was observed between BAX and NF- κB (r = −0.62). BCL2 exhibited weak to moderate correlations with the analyzed genes. Notably, NF- κB showed consistent negative correlations with Notch-1, JAG-1, Notch-2, and HES-1, with correlation coefficients ranging from −0.58 to −0.85. A strong positive correlation was detected between Notch-1 and HES-1 (r = 0.91). In contrast, CXCR4 demonstrated strong negative correlations with Notch-1 (r = −0.99) and HES-1 (r = −0.96), while a positive correlation was observed between CXCR4 and NF- κB (r = 0.68) (Figure 8A).
Figure 8. Correlation heatmaps of gene expression profiles in HCT cells following Lactobacillus, Carrageenan, and Soy Protein Combination Treatment (LPCS) at different time points. The matrices display the pairwise correlation coefficients (r) between apoptotic markers (BAX, BCL2), signaling regulators (NF- κB, Notch-1, Notch-2, JAG-1, HES-1), and the metastatic marker CXCR4 at (A) 24 h, (B) 48 h, and (C) 72 h post-treatment. The color scale represents the strength and direction of the correlation, ranging from dark red (strong negative correlation, (r = -1.0) to dark blue (strong positive correlation, (r = 1.0), with white indicating no correlation (r = 0). Values inside the cells denote the specific Pearson correlation coefficient for each gene pair.
Preprints 197869 g008
Figure 9. Correlation heatmaps of gene expression profiles in Lactobacillus cells treated with postbiotics (LPH) at different time points. The matrices display the pairwise correlation coefficients (r) between apoptotic markers (BAX, BCL2), signaling regulators (NF- κB, Notch-1, Notch-2, JAG-1, HES-1), and the metastatic marker CXCR4 at (A) 24 h, (B) 48 h, and (C) 72 h post-treatment. The color scale represents the strength and direction of the correlation, ranging from dark red (strong negative correlation, (r = -1.0) to dark blue (strong positive correlation, (r = 1.0), with white indicating no correlation (r = 0). Values inside the cells denote the specific Pearson correlation coefficient for each gene pair.
Preprints 197869 g009
At 48 h, correlation analysis demonstrated altered association patterns among the examined genes (Figure 8B). Strong positive correlations were observed between BAX and JAG-1 (r = 1.00) and between BAX and Notch-2 (r = 1.00). Moderate positive correlations were also identified between BAX and BCL2 (r = 0.56) as well as NF- κB (r = 0.35). BCL2 showed strong positive correlations with Notch-1 (r = 0.85), HES-1 (r = 0.98), and CXCR4 (r = 0.87), alongside a negative correlation with NF- κB (r = −0.59). In contrast, NF- κB displayed strong negative correlations with Notch-1 (r = −0.92), HES-1 (r = −0.74), and CXCR4 (r = −0.91). Strong positive correlations were observed between Notch-1 and HES-1 (r = 0.94) and between Notch-1 and CXCR4 (r = 1.00). Both JAG-1 and Notch-2 showed moderate positive correlations with HES-1 (r = 0.46), while HES-1 was strongly positively correlated with CXCR4 (r = 0.95) (Figure 8B).
At 72 h, correlation analysis revealed further shifts in gene association patterns (Figure 8C). Strong positive correlations were detected between BAX and NF- κB (r = 1.00), BAX and HES-1 (r = 0.96), and BAX and CXCR4 (r = 0.98). Similarly, NF- κB exhibited strong positive correlations with HES-1 (r = 0.98) and CXCR4 (r = 0.99). In contrast, Notch-1 showed strong negative correlations with BAX (r = −0.82), NF- κB (r = −0.86), HES-1 (r = −0.95), and CXCR4 (r = −0.92), while maintaining a strong positive correlation with Notch-2 (r = 0.97). JAG-1 displayed a strong negative correlation with BCL2 (r = −0.99) and moderate positive correlations with BAX (r = 0.46) and NF- κB (r = 0.39). Additionally, Notch-2 showed negative correlations with BAX (r = −0.64), NF- κB (r = −0.70), HES-1 (r = −0.84), and CXCR4 (r = −0.79). A perfect positive correlation was observed between HES-1 and CXCR4 (r = 1.00) (Figure 8C).

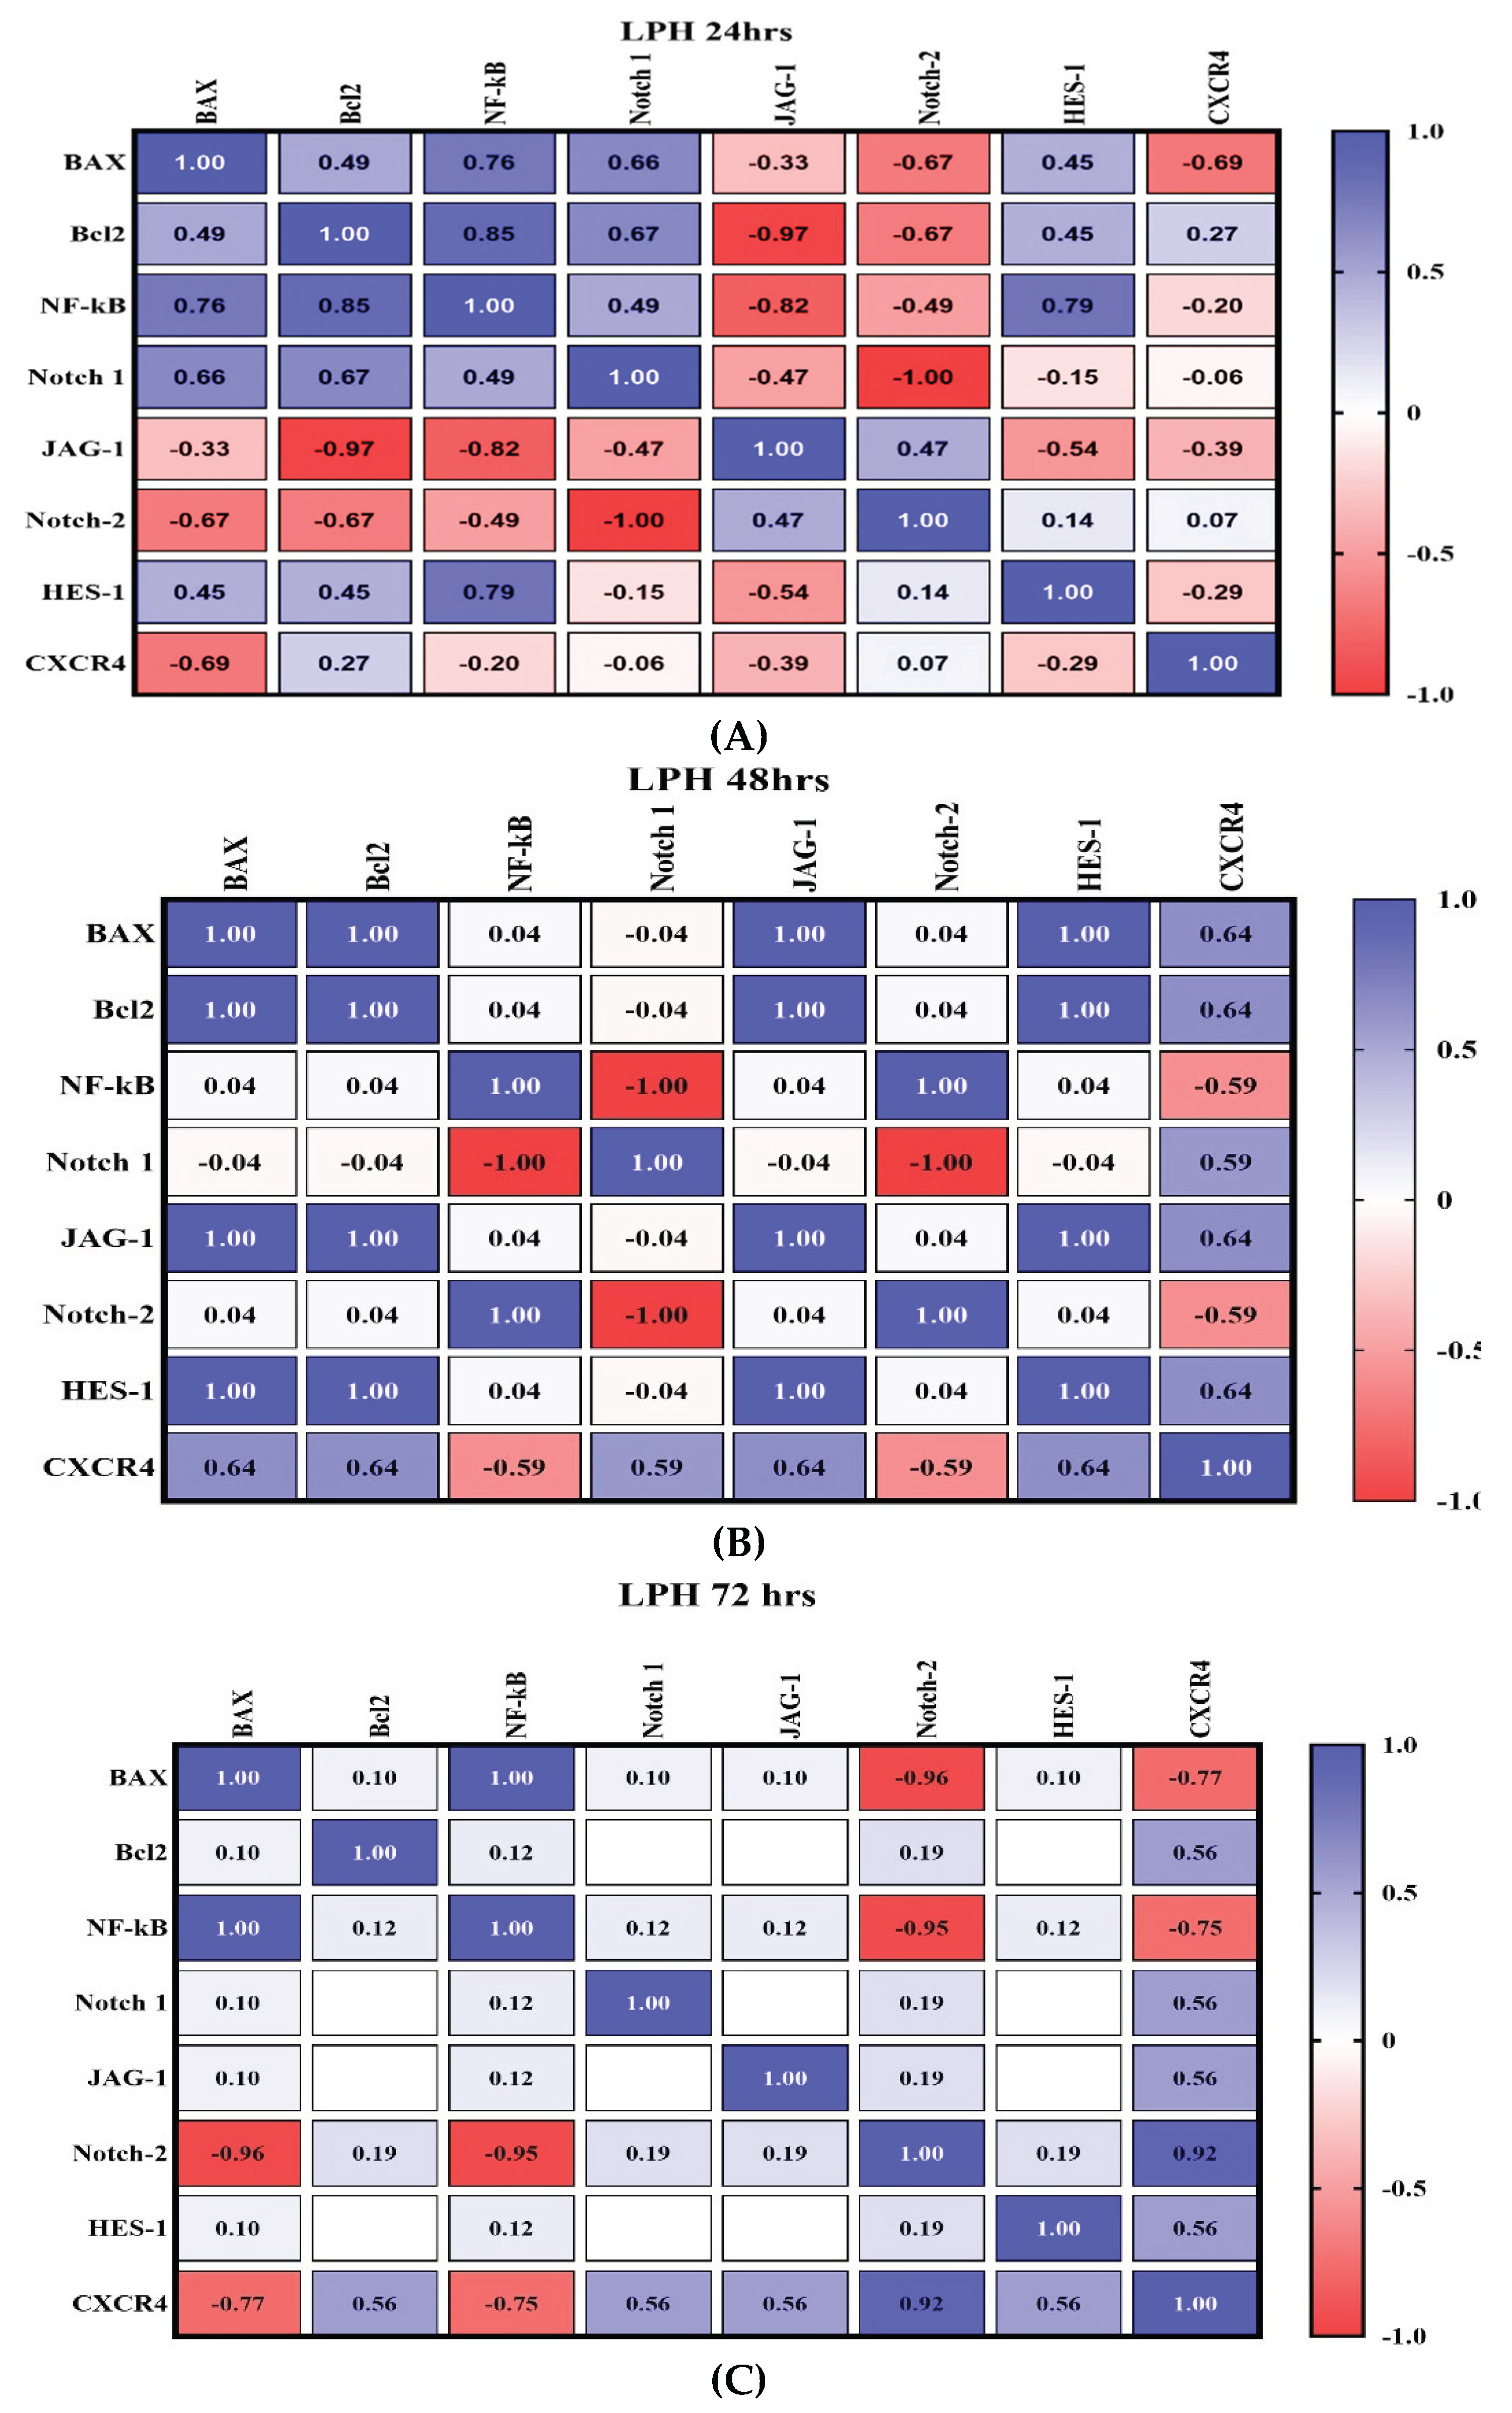
2.5.2. Temporal Analysis of Gene Regulatory Networks in Lactobacillus Postbiotic-Treated Cells

The temporal evolution of gene correlation patterns revealed distinct regulatory shifts at 24, 48, and 72 h post-treatment (Figure 9).
At 24 h, the initial response was characterized by a dynamic and competitive regulatory landscape. A defining feature of this early phase was a striking “isoform switch” within the Notch signaling pathway, evidenced by a perfect inverse correlation between Notch-1 and Notch-2 (r = -1.00). Additionally, JAG-1 acted as a potent negative regulator of survival, displaying profound inverse correlations with both BCL2 (r = -0.97) and NF- κB (r = -0.82). Notably, CXCR4 expression at this stage was inversely associated with the initiation of apoptosis, as indicated by its negative correlation with BAX (r = -0.69) (Figure 9A)
At 48 hours: A strong, positively correlated cluster formed, including BAX, BCL2, JAG-1, and HES-1, all of which showed perfect co-expression (r = 1.00). Conversely, the antagonistic polarity within the Notch pathway persisted; Notch-1 maintained a perfect negative correlation (r = -1.00) with the Notch-2 /NF- κB axis, while these two markers were perfectly co-regulated (r = 1.00). Additionally, CXCR4 expression shifted to moderately align with the apoptotic BAX/BCL2 cluster (r = 0.64) and negatively correlated with the NF- κB/Notch-2 survival pathway (r = -0.59) (Figure 9B).
At 72 hours: A synchronized stress-response pathway was identified between BAX and NF- κB (r = 1.00). In contrast, Notch-2 and CXCR4 formed a strong, closely correlated cluster (r = 0.92) linked to metastatic potential. These two signaling pathways showed a significant inverse relationship: the Notch-2 /CXCR4 cluster was strongly negatively correlated with the BAX/NF- κB axis (r values ranging from -0.75 to -0.96). Meanwhile, markers such as BCL2, Notch-1, JAG-1, and HES-1 demonstrated moderate correlations with CXCR4 (r = 0.56) but were disconnected from the BAX/NF- κB response. (Figure 9C).

3. Discussion

In this study, the combination of Lactobacillus postbiotics with a carrageenan/soy protein blend exhibited the most pronounced and sustained anticancer activity in HCT colorectal cancer cells, with maximal efficacy observed at 72 h. The combined treatment induced severe and progressive morphological damage, including marked cell shrinkage, extensive apoptotic features, and pronounced cell detachment, together with the highest levels of late apoptosis and necrosis, indicating a clear shift from reversible cellular stress to irreversible cell death [5]. Importantly, the cytotoxic response followed a distinct time-dependent trajectory. Although early apoptotic signaling was minimal at 24 h in the combination group, a significant decrease in cell viability was already observed at this time point, indicating early growth inhibition and cellular stress that likely began before this checkpoint [28]. Further observations revealed that, by 48 h, early apoptotic characteristics increased markedly in parallel with additional loss of viability and worsening morphological relapses, representing a critical transition from apoptotic priming to commitment [29]. This process culminated at 72 h in dominant late apoptosis and necrosis, consistent with cumulative cytotoxic pressure and terminal engagement of cell death pathways [30]. This stepwise progression is biologically plausible, as postbiotic metabolites, such as organic acids and bacteriocin-like peptides, are known to disrupt mitochondrial function and cellular energy metabolism [31]. Meanwhile, the carrageenan/soy protein matrix may enhance membrane perturbation, oxidative stress modulation, and caspase-dependent apoptotic signaling, thereby amplifying cellular damage during prolonged exposure [32]. In contrast, Lactobacillus postbiotics alone exerted their strongest effects at the early 24 h time point, characterized by a significant increase in early apoptosis consistent with rapid initiation of intrinsic apoptotic signaling reported for short-chain fatty acids and related postbiotic compounds [33]. However, these effects were not sustained at later time points, as evidenced by partial recovery of cell viability and reduced dominance of terminal death markers, suggesting activation of adaptive or pro-survival mechanisms under sublethal stress conditions [34]. Collectively, these findings indicate that while postbiotics alone primarily trigger early apoptotic responses, their combination with carrageenan and soy protein markedly enhances both the magnitude and durability of cytotoxic effects, driving a sustained progression toward late apoptosis and necrosis. This highlights the therapeutic potential of multi-component postbiotic formulations to overcome adaptive resistance and achieve prolonged and irreversible anticancer activity in colorectal cancer models, supporting their further development as rational, network-targeting strategies in cancer therapy.
In the present study, gene expression analysis demonstrated a clear time-dependent modulation of the apoptotic regulators BAX and BCL2, with the combination of Lactobacillus postbiotics, carrageenan, and soy protein exerting the most pronounced effects, particularly at 72 h. At 24 h, the combination significantly upregulated BAX, indicating early activation of pro-apoptotic signaling comparable to postbiotics alone [35], while the concurrent transient increase in BCL2 suggested an initial adaptive survival response to cellular stress [36]. Also, by 48 h, the combination treatment induced a coordinated suppression of both BAX and BCL2 relative to controls and postbiotics alone, reflecting a shift from early transcriptional stress responses toward commitment to apoptosis, likely governed by post-transcriptional and execution-phase mechanisms [37]. At 72 h, the combination produced the strongest modulation, with profound downregulation of BCL2 and BAX, consistent with loss of anti-apoptotic protection, irreversible apoptotic commitment, and progression to late apoptosis and necrosis [4]. In contrast, Lactobacillus postbiotics alone showed their most effective response at 24 h through significant BAX upregulation but failed to sustain suppression of BCL2 at later checkpoints, indicating a less durable apoptotic response [38]. Overall, these current findings highlight that while current postbiotics alone primarily trigger early apoptotic signaling, their combination with carrageenan and soy protein more effectively disrupts apoptotic balance over time, resulting in sustained and irreversible cancer cell death.
Analysis of the current NF- κB gene expression levels revealed a clear time-dependent response across all checkpoints (24, 48, and 72 h) and treatment groups. In the present study, at 24 h, both the combination of Lactobacillus postbiotics with carrageenan and soy protein and postbiotics alone significantly downregulated NF- κB expression compared with untreated cells, indicating early suppression of pro-survival and inflammatory signaling, lowering the apoptotic threshold, and limiting stress-adaptation capacity [39], with no significant difference between the current treated groups. By hour 48, the present combination treatment uniquely induced a significant upregulation of NF- κB relative to both untreated and postbiotics-only groups, suggesting a transient compensatory or stress-adaptation response [40], whereas NF- κB expression in the postbiotics-only group remained suppressed; however, this short-lived activation did not indicate treatment failure, as it was not sustained. In the present study, by 72 h, NF- κB expression was again significantly downregulated in both treatment groups compared with untreated controls, coinciding with maximal cytotoxicity and dominant late apoptotic outcomes [41] under the combination treatment. In contrast, although postbiotics alone maintained NF- κB suppression at intermediate time points, this was insufficient to produce durable apoptotic or cytotoxic effects. Overall, the present results indicate that while Lactobacillus postbiotics alone primarily mediate early and sustained NF- κB inhibition, their combination with carrageenan and soy protein induces a dynamic regulatory pattern characterized by early suppression, transient activation, and final inhibition of NF- κB signaling, which likely underlies the superior and sustained anticancer efficacy of the combined formulation during prolonged exposure.
The present findings demonstrate a complex, time-dependent modulation of the Notch signaling pathway in response to treatment, with the combination of Lactobacillus postbiotics, carrageenan, and soy protein exerting the most pronounced and sustained regulatory effects. In the current combination-treated group, Notch-1 and Notch-2 expressions were significantly upregulated at 24 h, indicating early activation of Notch signaling [42], a response that has been reported in colorectal cancer cells undergoing stress adaptation or differentiation-associated signaling [13]. Such early activation may reflect an initial cellular attempt to maintain survival or plasticity under treatment-induced stress [43]. However, by 48 h, both Notch receptors were significantly suppressed relative to untreated cells, coinciding with increased cytotoxic pressure and suggesting disruption of Notch-dependent survival mechanisms [44]. This present mid-phase suppression is particularly relevant, as persistent Notch signaling in colorectal cancer is associated with enhanced proliferation, stemness, and resistance to apoptosis [11] [15]. In the present study, at 72 h, Notch-1 and Notch-2 expression were again elevated in the combination group, likely reflecting late-stage transcriptional dysregulation or compensatory signaling in cells undergoing terminal stress rather than effective pathway reactivation [45]. Moreover, the regulation of the Notch ligand JAG-1 further highlights the distinctive impact of the current combination treatment. Although JAG-1 was initially upregulated at 24 h, its expression was significantly lower than that observed with postbiotics alone, and this reduction became more pronounced at 48 h, indicating effective attenuation of ligand-mediated Notch activation [46] during the critical mid-treatment phase. By 72 h, JAG-1 expression level was significantly increased in the combination group compared with both controls and postbiotics alone, which may reflect aberrant ligand expression in cells undergoing irreversible damage [47]. Importantly, downstream signaling was strongly affected, as evidenced by significant suppression of HES-1 at 48 and 72 h, with inhibition being more pronounced in the current combination group. Given that HES-1 is a key transcriptional effector that maintains proliferation and inhibits differentiation and apoptosis [48], its sustained suppression supports effective blockade of functional Notch signaling and aligns with the enhanced apoptotic outcomes observed under combination treatment [13]. In contrast, Lactobacillus postbiotics alone exerted their most prominent effects during the early 24 h time point, where significant upregulation of Notch-1, Notch-2, JAG-1, and HES-1 was observed relative to untreated cells. This pattern is consistent with a transient activation of Notch signaling, potentially reflecting a stress-response or survival mechanism triggered by postbiotic metabolites [15]. At 48 h, postbiotics alone suppressed Notch-1 and HES-1 but did significantly reduce Notch-2 expression, indicating incomplete inhibition of the pathway [49]. By 72 h, while Notch-1 and Notch-2 expression remained elevated, JAG-1 was significantly downregulated, and HES-1 suppression persisted, suggesting partial and inconsistent disruption of Notch signaling that may limit long-term cytotoxic efficacy [50]. Overall, analysis across all checkpoints demonstrates that while both treatments modulate the Notch pathway in a time-dependent manner, the combination of Lactobacillus postbiotics with carrageenan and soy protein induces a more coordinated and sustained disruption of Notch signaling. Early receptor activation is followed by mid-phase suppression of receptors, ligands, and downstream effectors, culminating in pronounced inhibition of HES-1, a key mediator of Notch-driven tumor maintenance. This dynamic yet ultimately suppressive regulation of the Notch axis likely contributes to the superior and sustained anticancer efficacy of the combined formulation compared with postbiotics alone.
The results demonstrate a clear time-dependent modulation of CXCR4 expression, with the combination of Lactobacillus postbiotics, carrageenan, and soy protein exerting the most pronounced regulatory effect during prolonged exposure. In the combination-treated cells, CXCR4 expression was significantly upregulated at 24 h, likely reflecting an early stress- or chemokine-responsive adaptation, as CXCR4 is rapidly inducible under inflammatory and oxidative conditions [51] and is commonly activated as a transient survival response in colorectal cancer cells [52]. At 48 h, CXCR4 levels remained elevated relative to untreated controls but were significantly lower than those observed with postbiotics alone, indicating the initiation of effective suppression of CXCR4-mediated signaling [53]. Notably, by 72 h, the combination treatment induced a marked downregulation of CXCR4 compared with both untreated and postbiotics-only groups, suggesting robust inhibition of the CXCR4 axis. Given the established role of CXCR4 in promoting colorectal cancer cell survival, invasion, angiogenesis, and metastatic dissemination through CXCL12 signaling, its sustained late-stage suppression is biologically significant and likely contributes to the enhanced cytotoxic and anti-migratory effects observed under combination treatment [54]. In contrast, Lactobacillus postbiotics alone produced a transient increase in CXCR4 expression at 24 h that persisted at 48 h, but failed to suppress CXCR4 at 72 h, indicating maintenance of CXCR4-dependent signaling over time [53]. Overall, while both treatments initially induced CXCR4 expression, only the combined formulation achieved progressive and durable suppression by the final checkpoint, highlighting its superior capacity to disrupt CXCR4-mediated pro-tumorigenic pathways.
Temporal gene–gene correlation analysis revealed pronounced time-dependent regulatory rewiring, with the combination treatment producing the most coordinated and biologically decisive effects across all time points. At 24 h, the combined formulation induced a highly dynamic adaptive state characterized by strong antagonism within the Notch pathway, evidenced by an inverse relationship between Notch-1 and Notch-2, together with negative correlations between JAG-1 and the survival regulators BCL-2 and NF- κB, indicating early suppression of pro-survival and inflammatory signaling [55]. During this early phase, CXCR4 showed inverse association with BAX and alignment with NF- κB, suggesting a transient chemokine-driven stress adaptation response that may support short-term resistance [56]. By 48 h, sustained combination exposure triggered substantial network reorganization, marked by the emergence of a tightly co-regulated module involving BAX, BCL-2, JAG-1, and HES-1, reflecting a transitional state toward apoptotic commitment in which apoptotic pressure coexisted with compensatory survival attempts [57]. Antagonistic polarity within the Notch pathway persisted, with Notch-1 remaining inversely associated with the Notch-2 /NF- κB survival axis, while CXCR4 progressively disengaged from inflammatory signaling and aligned more closely with the apoptotic network. At 72 h, the regulatory architecture underwent decisive polarization, with a dominant stress-apoptotic axis centered on BAX and NF- κB emerging, accompanied by collapse of BCL-2–mediated protection and functional disengagement of Notch- and CXCR4-dependent survival and migratory pathways [58]. This stepwise transition from early adaptive stress responses to terminal apoptotic signaling provides strong mechanistic support for the superior and sustained anticancer efficacy of the combination treatment through coordinated dismantling of survival, inflammatory, and resistance networks.
In contrast, Lactobacillus postbiotics alone elicited an early but limited and reversible regulatory response that failed to progress toward stable apoptotic commitment. At 24 h, postbiotics induced modest perturbations in apoptotic and inflammatory signaling, consistent with transient metabolic and mitochondrial stress; however, gene–gene interactions remained fragmented and did not form tightly co-regulated apoptotic clusters. By 48 h, most correlations weakened or reverted toward baseline, indicating activation of adaptive and compensatory survival mechanisms [59], including partial restoration of NF- κB- and Notch-associated signaling. At the same time, apoptotic markers failed to maintain coordinated engagement [60]. At 72 h, the regulatory network remained dispersed, with no evidence of dominant stress-apoptotic axis formation or network collapse, consistent with sublethal stress adaptation and reduced terminal apoptosis [34]. Collectively, these findings indicate that postbiotics alone induce only transient apoptotic priming, whereas the combination treatment uniquely enforces sustained network-level disruption and irreversible apoptotic signaling, highlighting the mechanistic basis for its enhanced anticancer efficacy.

4. Materials and Methods

4.1. Preparation of Lactobacillus acidophilus Postbiotics and Treatment Formulations

Commercial Saudi yogurt obtained from Jeddah was used as a source of Lactobacillus acidophilus. Following sterilization (121 °C, 15 min), bacterial isolates were cultured on de Man, Rogosa, and Sharpe (MRS) agar at 37 °C for 72 h. Selected colonies were subsequently expanded in MRS broth and incubated at 37 °C for 2–3 days under 5% CO2 with gentle agitation (100 rpm) to enhance bacterial growth. Cultures were centrifuged at 5000×g for 20 min at 4 °C, and the resulting cell-free supernatant was collected and lyophilized. The pH of the Lactobacillus postbiotic supernatant ranged from approximately 4.2 to 4.6 [61]. The freeze-dried postbiotic preparations were stored at −20 °C until further use.
κ-Carrageenan (Sigma-Aldrich, CAS No. 11114-20-8) and commercial soy protein (iHerb®) were used in combination treatments. Both compounds were diluted in culture medium and sterilized by filtration through 0.22 µm membrane filters. Working solutions were prepared at final amounts of 0.025 mg carrageenan and 0.005 mg soy protein per 100 µL of DMEM, corresponding to treatments applied to 5 × 10³ HCT cells.

4.2. HCT-116 Cell Maintenance, Treatment, and Sample Harvesting

Human colorectal carcinoma HCT-116 cells (ATCC® CCL-247™) were cultured in Dulbecco’s Modified Eagle Medium (DMEM) supplemented with 10% fetal bovine serum and antibiotics under standard conditions (37 °C, 5% CO2). Cells were routinely maintained and passed at approximately 70% confluence using conventional cell dissociation procedures, with cell viability assessed before experimentation. The experimental design included three groups: untreated control cells (NH), cells treated with Lactobacillus acidophilus postbiotics (LPH), and cells treated with a combination of Lactobacillus postbiotics, κ-carrageenan, and soy protein (LCSH). Following treatment for 24, 48, or 72 h, cells were harvested by centrifugation, culture supernatants were removed, and cell pellets were collected for downstream RNA analyses (Table 1).

4.3. Evaluation of Cytotoxicity and Apoptosis in HCT-116 Cells

The cytotoxic and apoptotic effects of the different treatments on HCT-116 cells were assessed at 24, 48, and 72 h using complementary approaches, including an MTT-based cell viability assay and flow cytometric analysis of apoptosis.

4.3.1. MTT Cell Viability Assay

HCT-116 cells were seeded in 96-well plates at a density of 5 × 10³ cells per well and allowed to adhere for 24 h. Cells were then either left untreated (UHC) or exposed to the carrageenan/soy protein formulation (CS-HCT) and incubated at 37 °C for the indicated time points. At each endpoint, the culture medium was replaced with fresh medium containing 10 µL of MTT solution (12 mM) and incubated for an additional 4 h. Subsequently, 25 µL of medium was removed, and 50 µL of dimethyl sulfoxide (DMSO) was added to dissolve the formazan crystals. Absorbance was measured at 540 nm using a microplate reader, and cell viability was expressed relative to untreated controls.

4.3.2. Flow Cytometric Analysis of Apoptosis

For apoptosis analysis, HCT-116 cells were seeded in T-25 flasks at a density of 2 × 10⁶ cells per flask and treated as described above. After incubation for 24, 48, or 72 h, cells were harvested, washed twice with phosphate-buffered saline (PBS), and resuspended in 100 µL of 1× binding buffer. Cells were stained with 5 µL of FITC-conjugated Annexin V and 5 µL of propidium iodide (PI) using the Annexin V-FITC Apoptosis Detection Kit II (Cat. No. 51-6710AK), followed by incubation for 5 min in the dark. After dilution with 300 µL of 1× binding buffer, apoptotic populations were quantified by flow cytometry (Beckman Coulter, USA).

4.4. Quantitative Gene Expression Analysis

HCT-116 cells (6 × 10⁶ cells per flask) were treated and harvested at 24, 48, and 72 h. Total RNA was isolated using the QIAGEN RNeasy® Midi Kit according to the manufacturer’s instructions. Complementary DNA (cDNA) was synthesized using the Im-Prom-II™ Reverse Transcription System. Quantitative Real-Time PCR (qPCR) was performed using BioFact™ SYBR Green Master Mix and gene-specific primers (Supplementary Data, Table A1). Gene expression levels were normalized to GAPDH and calculated using the 2ΔΔCt method [62].

4.5. Statistical Analysis and Data Visualization

Statistical analyses were performed using GraphPad Prism (version 10). One-way analysis of variance (ANOVA) was applied to assess differences within control groups and between treated and untreated cells, with statistical significance set at p < 0.05. To enhance data processing, correlation analysis, and visualization, Python-based libraries, including NumPy, pandas, and seaborn, were employed. NumPy was used for numerical computations, pandas for structured data handling, and seaborn for graphical representation, enabling efficient and transparent data analysis consistent with contemporary research standards.

5. Conclusions

This study demonstrates that combining Lactobacillus postbiotics with a carrageenan/soy protein blend produces a more potent and sustained anticancer effect in HCT colorectal cancer cells than postbiotics alone. The combined treatment induced clear time-dependent progression from early cellular stress and growth inhibition to irreversible late apoptosis and necrosis at 72 h, supported by coordinated modulation of apoptotic regulators, dynamic suppression of NF- κB signaling, and sustained disruption of the Notch and CXCR4 pathways. Temporal gene–gene correlation analysis further revealed that the combination treatment drives network-level collapse of survival and adaptive signaling, whereas postbiotics alone elicited only transient apoptotic priming followed by partial recovery of pro-survival mechanisms. Collectively, these findings indicate that multi-component postbiotic formulations can overcome adaptive resistance by enforcing durable, system-wide disruption of cancer cell survival pathways, supporting their further development as promising therapeutic strategies for colorectal cancer.

Author Contributions

J.A. designed the study, performed the experimental analyses, wrote, revised, and edited the manuscript. S. Z. participated in manuscript editing; all authors revised and approved the manuscript.

Funding

This research was funded by the Deanship of Scientific Research, King Abdulaziz University, grant number (G: 271-247-1442).

Institutional Review Board Statement

Not applicable.

Informed Consent Statement

Not applicable.

Data Availability Statement

The original contributions presented in this study are included in the article/supplementary material. Further inquiries can be directed to the corresponding author(s).

Acknowledgments

All authors would like to acknowledge the King Abdulaziz University for conducting this study and the Deanship of Scientific Research for financial support, grant No. (G: 271-247-1442).

Conflicts of Interest

The authors declare no conflicts of interest.

Appendix A

Table A1. Oligonucleotide primers were employed for gene expression studies, using GAPDH as the reference gene.
Primer Name Primer sequence Primer length
Notch-1 Forward GAC ATC ACG GAT CAT ATG GA 20
Notch-1 Reverse CTC GCA TTG ACC ATT CAA AC 20
Notch-2 Forward GAT GCC ACC TGA ACA ACT GC 20
Notch-2 _Reverse TGA CAA CAG CAA CAG CAA GG 20
Jadded-1_Forward AGC GAC CTG TGT GGA TGA G 19
Jadded-1_Reverse GGC TGG AGA CTG GAA GAC C 19
HES-1 Forward CCA GTT TGC TTT CCT CAT TCC 21
HES-1 Reverse TCT TCT CTC CCA GTA TTC AAG TTCC 25
BAX Forward CCT GTG CAC CAA GGT GCC GGA ACT 24
BAX_Reverse CCA CCC TGG TCT TGG ATC CAG CCC 24
BCL-2 Forward TTG TGG CCT TCT TTG AGT TCG GTG 24
BCL-2_Reverse GGT GCC GGT TCA GGT ACT CAG TCA 24
NF-kB Forward ATC CCA TCT TTG ACA ATC GTG C 22
NF-kB Reverse CTG GTC CCG TGA AAT ACA CCT C 22
CXCR-4 Forward TTC TAC CCC AAT GAC TTG TG 20
CXCR-4 Reverse ATG TAG TAA GGC AGC CAA CA 20
GAPDH Forward GCA CCG TCA AGG CTG AGA AC 20
GAPDH Reverse TGG TGA AGA CGC CAG TGG A 19

References

  1. Zou, J.-Y.; Chen, Q.-L.; Luo, X.-C.; Damdinjav, D.; Abdelmohsen, U. R.; Li, H.-Y.; Battulga, T.; Chen, H.-B.; Wang, Y.-Q.; Zhang, J.-Y., Natural products reverse cancer multidrug resistance. Frontiers in Pharmacology 2024, Volume 15 - 2024.
  2. Garg, P.; Malhotra, J.; Kulkarni, P.; Horne, D.; Salgia, R.; Singhal, S. S., Emerging Therapeutic Strategies to Overcome Drug Resistance in Cancer Cells. Cancers 2024, 16, (13), 2478.
  3. Nan, Y.; Su, H.; Zhou, B.; Liu, S., The function of natural compounds in important anticancer mechanisms. Front Oncol 2022, 12, 1049888.
  4. Qian, S.; Wei, Z.; Yang, W.; Huang, J.; Yang, Y.; Wang, J., The role of BCL-2 family proteins in regulating apoptosis and cancer therapy. Front Oncol 2022, 12, 985363.
  5. Mustafa, M.; Ahmad, R.; Tantry, I. Q.; Ahmad, W.; Siddiqui, S.; Alam, M.; Abbas, K.; Moinuddin; Hassan, M. I.; Habib, S.; Islam, S., Apoptosis: A Comprehensive Overview of Signaling Pathways, Morphological Changes, and Physiological Significance and Therapeutic Implications. Cells 2024, 13, (22), 1838.
  6. Wong, R. S., Apoptosis in cancer: from pathogenesis to treatment. J Exp Clin Cancer Res 2011, 30, (1), 87.
  7. Haynes, J.; Manogaran, P., Mechanisms and Strategies to Overcome Drug Resistance in Colorectal Cancer. International Journal of Molecular Sciences 2025, 26, (5), 1988.
  8. Sadati, S.; Khalaji, A.; Bonyad, A.; Khoshdooz, S.; Hosseini Kolbadi, K. S.; Bahrami, A.; Moeinfar, M. S.; Morshedi, M.; Ghamsaraian, A.; Eterafi, M.; Eshraghi, R.; Khaksary Mahabady, M.; Mirzaei, H., NF-κB and apoptosis: colorectal cancer progression and novel strategies for treatment. Eur J Med Res 2025, 30, (1), 616.
  9. Nishida, A.; Andoh, A., The Role of Inflammation in Cancer: Mechanisms of Tumor Initiation, Progression, and Metastasis. Cells 2025, 14, (7), 488.
  10. Bakrim, S.; Fessikh, M. E.; Elhrech, H.; Omari, N. E.; Amanullah, M.; Ming, L. C.; Moshawih, S.; Bouyahya, A., Targeting inflammation in cancer therapy: from mechanistic insights to emerging therapeutic approaches. J Transl Med 2025, 23, (1), 588.
  11. Sun, J.; Chen, Y.; Xu, Z.; Wang, W.; Li, P., Notch signaling in the tumor immune microenvironment of colorectal cancer: mechanisms and therapeutic opportunities. J Transl Med 2025, 23, (1), 315.
  12. Iluta, S.; Nistor, M.; Buruiana, S.; Dima, D., Notch and Hedgehog Signaling Unveiled: Crosstalk, Roles, and Breakthroughs in Cancer Stem Cell Research. Life 2025, 15, (2), 228.
  13. Shi, Q.; Xue, C.; Zeng, Y.; Yuan, X.; Chu, Q.; Jiang, S.; Wang, J.; Zhang, Y.; Zhu, D.; Li, L., Notch signaling pathway in cancer: from mechanistic insights to targeted therapies. Signal Transduct Target Ther 2024, 9, (1), 128.
  14. Kumar, V.; Vashishta, M.; Kong, L.; Wu, X.; Lu, J. J.; Guha, C.; Dwarakanath, B. S., The Role of Notch, Hedgehog, and Wnt Signaling Pathways in the Resistance of Tumors to Anticancer Therapies. Front Cell Dev Biol 2021, 9, 650772.
  15. Li, Q.; Geng, S.; Luo, H.; Wang, W.; Mo, Y. Q.; Luo, Q.; Wang, L.; Song, G. B.; Sheng, J. P.; Xu, B., Signaling pathways involved in colorectal cancer: pathogenesis and targeted therapy. Signal Transduct Target Ther 2024, 9, (1), 266.
  16. Magryś, A.; Pawlik, M., Postbiotic Fractions of Probiotics Lactobacillus plantarum 299v and Lactobacillus rhamnosus GG Show Immune-Modulating Effects. Cells 2023, 12, (21).
  17. D’Amore, T.; Zolfanelli, C.; Lauciello, V.; Di Ciancia, A.; Vagliasindi, A.; Smaoui, S.; Varzakas, T., Using Postbiotics from Functional Foods for Managing Colorectal Cancer: Mechanisms, Sources, Therapeutic Potential, and Clinical Perspectives. Microorganisms 2025, 13, (6), 1335.
  18. Guo, J.; Zhao, Y.; Guo, W.; Sun, Y.; Zhang, W.; Zhao, Q.; Zhang, Y.; Jiang, Y., Effects of Lactobacillus paracei JY062 Postbiotic on Intestinal Barrier, Immunity, and Gut Microbiota. Nutrients 2025, 17, (7), 1272.
  19. Szydłowska, A.; Sionek, B., Probiotics and Postbiotics as the Functional Food Components Affecting the Immune Response. Microorganisms 2022, 11, (1).
  20. Balendra, V.; Rosenfeld, R.; Amoroso, C.; Castagnone, C.; Rossino, M. G.; Garrone, O.; Ghidini, M., Postbiotics as Adjuvant Therapy in Cancer Care. Nutrients 2024, 16, (15).
  21. Krylova, N. V.; Kravchenko, A. O.; Iunikhina, O. V.; Pott, A. B.; Likhatskaya, G. N.; Volod’ko, A. V.; Zaporozhets, T. S.; Shchelkanov, M. Y.; Yermak, I. M., Influence of the Structural Features of Carrageenans from Red Algae of the Far Eastern Seas on Their Antiviral Properties. Marine Drugs 2022, 20, (1), 60.
  22. Komisarska, P.; Pinyosinwat, A.; Saleem, M.; Szczuko, M., Carrageenan as a Potential Factor of Inflammatory Bowel Diseases. Nutrients 2024, 16, (9).
  23. Silva-Pinto, P. A.; de Pontes, J. T. C.; Aguilar-Morón, B.; Canales, C. S. C.; Pavan, F. R.; Roque-Borda, C. A., Phytochemical insights into flavonoids in cancer: Mechanisms, therapeutic potential, and the case of quercetin. Heliyon 2025, 11, (4), e42682.
  24. Hadidi, M.; Liñán-Atero, R.; Tarahi, M.; Christodoulou, M. C.; Aghababaei, F., The Potential Health Benefits of Gallic Acid: Therapeutic and Food Applications. Antioxidants (Basel) 2024, 13, (8).
  25. Poschner, S.; Maier-Salamon, A.; Zehl, M.; Wackerlig, J.; Dobusch, D.; Pachmann, B.; Sterlini, K. L.; Jäger, W., The Impacts of Genistein and Daidzein on Estrogen Conjugations in Human Breast Cancer Cells: A Targeted Metabolomics Approach. Frontiers in Pharmacology 2017, Volume 8 - 2017.
  26. Fan, Y.; Wang, M.; Li, Z.; Jiang, H.; Shi, J.; Shi, X.; Liu, S.; Zhao, J.; Kong, L.; Zhang, W.; Ma, L., Intake of Soy, Soy Isoflavones and Soy Protein and Risk of Cancer Incidence and Mortality. Front Nutr 2022, 9, 847421.
  27. Basson, A. R.; Ahmed, S.; Almutairi, R.; Seo, B.; Cominelli, F., Regulation of Intestinal Inflammation by Soybean and Soy-Derived Compounds. Foods 2021, 10, (4), 774.
  28. Koch, D. T.; Yu, H.; Beirith, I.; Schirren, M.; Drefs, M.; Liu, Y.; Knoblauch, M.; Koliogiannis, D.; Sheng, W.; De Toni, E. N.; Bazhin, A. V.; Renz, B. W.; Guba, M. O.; Werner, J.; Ilmer, M., Tigecycline causes loss of cell viability mediated by mitochondrial OXPHOS and RAC1 in hepatocellular carcinoma cells. J Transl Med 2023, 21, (1), 876.
  29. Vitale, I.; Pietrocola, F.; Guilbaud, E.; Aaronson, S. A.; Abrams, J. M.; Adam, D.; Agostini, M.; et al., Apoptotic cell death in disease: Current understanding of the NCCD 2023. Cell Death Differ 2023, 30, (5), 1097-1154.
  30. Chu, X.; Tian, W.; Ning, J.; Xiao, G.; Zhou, Y.; Wang, Z.; Zhai, Z.; Tanzhu, G.; Yang, J.; Zhou, R., Cancer stem cells: advances in knowledge and implications for cancer therapy. Signal Transduct Target Ther 2024, 9, (1), 170.
  31. Hijová, E., Postbiotics as Metabolites and Their Biotherapeutic Potential. International Journal of Molecular Sciences 2024, 25, (10), 5441.
  32. Gomez, X.; Sanon, S.; Zambrano, K.; Asquel, S.; Bassantes, M.; Morales, J. E.; Otanez, G.; Pomaquero, C.; Villarroel, S.; Zurita, A.; Calvache, C.; Celi, K.; Contreras, T.; Corrales, D.; Naciph, M. B.; Pena, J.; Caicedo, A., Key points for the development of antioxidant cocktails to prevent cellular stress and damage caused by reactive oxygen species (ROS) during manned space missions. NPJ Microgravity 2021, 7, (1), 35.
  33. Caliman-Sturdza, O. A.; Vaz, J. A.; Lupaescu, A. V.; Lobiuc, A.; Bran, C.; Gheorghita, R. E., Antioxidant and Anti-Inflammatory Activities of Probiotic Strains. International Journal of Molecular Sciences 2026, 27, (2), 1079.
  34. Zong, Y.; Li, H.; Liao, P.; Chen, L.; Pan, Y.; Zheng, Y.; Zhang, C.; Liu, D.; Zheng, M.; Gao, J., Mitochondrial dysfunction: mechanisms and advances in therapy. Signal Transduct Target Ther 2024, 9, (1), 124.
  35. White, S. A.; Zhang, L. S.; Pasula, D. J.; Yang, Y. H. C.; Luciani, D. S., Bax and Bak jointly control survival and dampen the early unfolded protein response in pancreatic beta-cells under glucolipotoxic stress. Sci Rep 2020, 10, (1), 10986.
  36. Palabiyik, A. A., The role of Bcl-2 in controlling the transition between autophagy and apoptosis (Review). Mol Med Rep 2025, 32, (1).
  37. Asoudeh-Fard, A.; Yeylagh-Beygi, M.; Asoudeh-Fard, M.; Abbasi, M.; Bagher Nazari, M.; Gholami, A.; Parsaei, A., Bifidobacterium enhances the antitumor efficacy of carboplatin in glioblastoma cells: targeting apoptotic and cell cycle regulatory pathways via Caspase, AKT/PTEN, and P53/P21 signaling. Cancer Cell Int 2025, 26, (1), 12.
  38. Park, S. H., Recent Research on the Role of Lactobacilli Probiotics in Cancer Management. Nutrients 2026, 18, (2).
  39. Guo, Q.; Jin, Y.; Chen, X.; Ye, X.; Shen, X.; Lin, M.; Zeng, C.; Zhou, T.; Zhang, J., NF-κB in biology and targeted therapy: new insights and translational implications. Signal Transduct Target Ther 2024, 9, (1), 53.
  40. Szrejder, M.; Piwkowska, A., Gut Microbiome-Derived Short-Chain Fatty Acids in Glomerular Protection and Modulation of Chronic Kidney Disease Progression. Nutrients 2025, 17, (17), 2904.
  41. Ito, Y.; Kikuchi, E.; Tanaka, N.; Kosaka, T.; Suzuki, E.; Mizuno, R.; Shinojima, T.; Miyajima, A.; Umezawa, K.; Oya, M., Down-regulation of NF kappa B activation is an effective therapeutic modality in acquired platinum-resistant bladder cancer. BMC Cancer 2015, 15, 324.
  42. Gallenstein, N.; Tichy, L.; Weigand, M. A.; Schenz, J., Notch Signaling in Acute Inflammation and Sepsis. International Journal of Molecular Sciences 2023, 24, (4), 3458.
  43. Luan, W.; Wright, A. L.; Brown-Wright, H.; Le, S.; San Gil, R.; Madrid San Martin, L.; Ling, K.; Jafar-Nejad, P.; Rigo, F.; Walker, A. K., Early activation of cellular stress and death pathways caused by cytoplasmic TDP-43 in the rNLS8 mouse model of ALS and FTD. Mol Psychiatry 2023, 28, (6), 2445-2461.
  44. Edelmann, J., NOTCH1 Signalling: A key pathway for the development of high-risk chronic lymphocytic leukaemia. Frontiers in Oncology 2022, Volume 12 - 2022.
  45. Chen, C.; Du, Y.; Nie, R.; Wang, S.; Wang, H.; Li, P., Notch signaling in cancers: mechanism and potential therapy. Frontiers in Cell and Developmental Biology 2025, Volume 13 - 2025.
  46. Dai, Y.; Wilson, G.; Huang, B.; Peng, M.; Teng, G.; Zhang, D.; Zhang, R.; Ebert, M. P.; Chen, J.; Wong, B. C.; Chan, K. W.; George, J.; Qiao, L., Silencing of Jagged1 inhibits cell growth and invasion in colorectal cancer. Cell Death Dis 2014, 5, (4), e1170.
  47. He, J.; Li, L.; Lv, L.; Chen, X.; Ge, M.; Ren, Y.; Tang, X.; Liu, P.; Gao, W., JAG1 is correlated to suppressive immune microenvironment and predicts immunotherapy resistance in lung adenocarcinoma. Frontiers in Oncology 2023, Volume 13 - 2023.
  48. Zhang, Q.; Wang, H. Y.; Nayak, A.; Nunez-Cruz, S.; Slupianek, A.; Liu, X.; Basappa, J.; Fan, J. S.; Chekol, S.; Nejati, R.; Bogusz, A. M.; Turner, S. D.; Swaminathan, K.; Wasik, M. A., Induction of Transcriptional Inhibitor HES1 and the Related Repression of Tumor-Suppressor TXNIP Are Important Components of Cell-Transformation Program Imposed by Oncogenic Kinase NPM-ALK. Am J Pathol 2022, 192, (8), 1186-1198.
  49. Asefa, Z.; Belay, A.; Welelaw, E.; Haile, M., Postbiotics and their biotherapeutic potential for chronic disease and their feature perspective: a review. Frontiers in Microbiomes 2025, Volume 4 - 2025.
  50. Giambra, V.; Caldarelli, M.; Franza, L.; Rio, P.; Bruno, G.; di Iasio, S.; Mastrogiovanni, A.; Gasbarrini, A.; Gambassi, G.; Cianci, R., The Role of Notch Signaling and Gut Microbiota in Autoinflammatory Diseases: Mechanisms and Future Views. Biomedicines 2025, 13, (4), 768.
  51. Schioppa, T.; Uranchimeg, B.; Saccani, A.; Biswas, S. K.; Doni, A.; Rapisarda, A.; Bernasconi, S.; Saccani, S.; Nebuloni, M.; Vago, L.; Mantovani, A.; Melillo, G.; Sica, A., Regulation of the chemokine receptor CXCR4 by hypoxia. J Exp Med 2003, 198, (9), 1391-402.
  52. Fleszar, M. G.; Zawadzki, M.; Fortuna, P.; Bednarz-Misa, I.; Krauze, I.; Maciejewska, K.; Klekowski, J.; Chabowski, M.; Witkiewicz, W.; Krzystek-Korpacka, M., Robot-Assisted Colorectal Cancer Surgery Mitigates Early Postoperative Immunosuppression and Angiogenesis. International Journal of Molecular Sciences 2025, 26, (20), 10041.
  53. Artusa, V.; Calabrone, L.; Mortara, L.; Peri, F.; Bruno, A., Microbiota-Derived Natural Products Targeting Cancer Stem Cells: Inside the Gut Pharma Factory. International Journal of Molecular Sciences 2023, 24, (5), 4997.
  54. Smaldone, G.; Di Matteo, F.; Castelluccio, R.; Napolitano, V.; Miranda, M. R.; Manfra, M.; Campiglia, P.; Vestuto, V., Targeting the CXCR4/CXCL12 Axis in Cancer Therapy: Analysis of Recent Advances in the Development of Potential Anticancer Agents. Molecules 2025, 30, (6), 1380.
  55. Li, M.; Chen, F.; Clifton, N.; Sullivan, D. M.; Dalton, W. S.; Gabrilovich, D. I.; Nefedova, Y., Combined inhibition of Notch signaling and Bcl-2/Bcl-xL results in synergistic antimyeloma effect. Mol Cancer Ther 2010, 9, (12), 3200-9.
  56. Shin, H. C.; Seo, J.; Kang, B. W.; Moon, J. H.; Chae, Y. S.; Lee, S. J.; Lee, Y. J.; Han, S.; Seo, S. K.; Kim, J. G.; Sohn, S. K.; Park, T. I., Clinical significance of nuclear factor κB and chemokine receptor CXCR4 expression in patients with diffuse large B-cell lymphoma who received rituximab-based therapy. Korean J Intern Med 2014, 29, (6), 785-92.
  57. Hasnan, J.; Yusof, M. I.; Damitri, T. D.; Faridah, A. R.; Adenan, A. S.; Norbaini, T. H., Relationship between apoptotic markers (Bax and Bcl-2) and biochemical markers in type 2 diabetes mellitus. Singapore Med J 2010, 51, (1), 50-5.
  58. Naseri, M. H.; Mahdavi, M.; Davoodi, J.; Tackallou, S. H.; Goudarzvand, M.; Neishabouri, S. H., Upregulation of Bax and downregulation of Bcl2 during 3-NC mediated apoptosis in human cancer cells. Cancer Cell Int 2015, 15, 55.
  59. Gurunathan, S.; Thangaraj, P.; Kim, J. H., Postbiotics: Functional Food Materials and Therapeutic Agents for Cancer, Diabetes, and Inflammatory Diseases. Foods 2023, 13, (1).
  60. Xia, H.-H.; Huang, J.-Z., Tryptophan metabolism at the crossroads of the neuro-immuno-microbial axis: implications for precision medicine in chronic diseases. Frontiers in Cellular and Infection Microbiology 2026, Volume 15 - 2025.
  61. Yuliana, T.; Tyano, F. N.; Harlina, P. W.; Cahyana, Y.; Marta, H.; Krama, A., Characterizing Probiotic Lactic Acid Bacteria from Buffalo Milk Fermentation (Dadih) for Beef Biopreservation. Applied Sciences 2023, 13, (24), 13089.
  62. Livak, K. J.; Schmittgen, T. D., Analysis of relative gene expression data using real-time quantitative PCR and the 2(-Delta Delta C(T)) Method. Methods 2001, 25, (4), 402-8.
Figure 1. Morphological assessment of apoptosis features in HCT cells following treatments at different time points. (A) Untreated control HCT cells (NH) (black arrows) represent normal morphology with intact cell structure and clearly visible nuclei. (B) HCT cells treated with Lactobacillus postbiotics (LPH) for 24 h showed typical apoptotic features, including cellular shrinkage and membrane blebbing (red arrows). (C) After 48 h, LPH-treated cells continued to display apoptotic morphology, characterized by enhanced cellular contraction and membrane blebbing (red arrows). (D) Micrographs obtained after 72 h of LPH treatment revealed persistent apoptotic characteristics, including cell shrinkage and prominent membrane blebs (red arrows). (E) At 24 h, the combined treatment with Lactobacillus postbiotics and carrageenan/soy protein (LPCS) induced pronounced morphological alterations and markedly increased cell death (red arrows). (F) At 48 h, LPCS treatment resulted in dramatic cytotoxic effects, with substantially elevated levels of cell death (red arrows). (G) After 72 h, LPCS treatment produced the most pronounced cytotoxic response, with extensive apoptotic morphology and a markedly higher incidence of cell death (red arrows). The scale bar is 100 um.
Preprints 197869 g001
Figure 2. Effect of different treatments on HCT cell viability, (a) after 24 h, (b) 48h, (c) 72h. The untreated control group is designated as “NH,” while “LPH” represents cells treated with Lactobacillus postbiotics, and “LCSH” indicates cells receiving the combination therapy, including Lactobacillus postbiotics, carrageenan, and soy protein, indicating enhanced anticancer activity of the combined formulation. Data are presented as mean ± SD. Statistical significance between groups is indicated by *p<0.01, **p < 0.001, ***p<0.0002, ****p<0.0001.
Preprints 197869 g002
Figure 3. Time-dependent effects of Lactobacillus postbiotics and combination treatment on apoptotic and necrotic responses in HCT cells. Panels (a–c) illustrate early apoptosis at 24, 48, and 72 h, respectively; panels (d–f) show late apoptosis at the corresponding time points; and panels (g–i) depict necrosis after 24, 48, and 72 h of treatment. The untreated control group is denoted as NH, LPH represents cells treated with Lactobacillus postbiotics alone, and LCSH indicates cells treated with the combination of Lactobacillus postbiotics, carrageenan, and soy protein. The combination treatment demonstrates enhanced anticancer activity through increased induction of apoptotic and necrotic cell death. Data is expressed as mean ± SD. Statistical significance is indicated as p < 0.05, *p < 0.01, **p < 0.001, ***p<0.0002, and ****p < 0.0001.
Preprints 197869 g003
Figure 4. displays the comparative mRNA expression patterns of mitochondrial regulatory-related genes in HCT cells after exposure to various treatments. Panels (A–C) illustrate BAX expression at 24, 48, and 72 h, respectively; panels (D–F) show BCL2 expression at the corresponding time points. The untreated control group is denoted as NH, LPH represents cells treated with Lactobacillus postbiotics alone, and LCSH indicates cells treated with the combination of Lactobacillus postbiotics, carrageenan, and soy protein. The combination treatment demonstrates enhanced anticancer activity through increased induction of apoptotic and necrotic cell death. Data is expressed as mean ± SD. Statistical significance is indicated as p < 0.05, *p < 0.01, **p < 0.001, and ***p < 0.0002, ****p <0.0001, ns (non-significant).
Preprints 197869 g004aPreprints 197869 g004b
Figure 5. displays the comparative mRNA expression patterns of the NF-kB gene in HCT cells after exposure to various treatments. Panels (a–c) illustrate NF-kB expression at 24, 48, and 72 h. The untreated control group is denoted as NH, LPH represents cells treated with Lactobacillus postbiotics alone, and LCSH indicates cells treated with the combination of Lactobacillus postbiotics, carrageenan, and soy protein. The combination treatment demonstrates enhanced anticancer activity through increased induction of apoptotic and necrotic cell death. Data is expressed as mean ± SD. Statistical significance is indicated as p < 0.05, *p < 0.01, and ****p <0.0001, ns (non-significant).
Preprints 197869 g005
Figure 6. displays the comparative mRNA expression patterns of Notch pathway-related genes in HCT cells after exposure to various treatments. Panels (A-C) illustrate Notch-1 expression at 24, 48, and 72 h, respectively; panels (D-F) show Notch-2 expression at 24, 48, and 72 h, respectively; panels (G-I) show JAG-1 expression at 24, 48, and 72 h; panels (J-L) show HES-1 expression at the corresponding time points. The untreated control group is denoted as NH, LPH represents cells treated with Lactobacillus postbiotics alone, and LCSH indicates cells treated with the combination of Lactobacillus postbiotics, carrageenan, and soy protein. The combination treatment demonstrates enhanced anticancer activity through increased induction of apoptotic and necrotic cell death. Data is expressed as mean ± SD. Statistical significance is indicated as p < 0.05, *p < 0.01, **p < 0.001, and ***p < 0.0002, ****p <0.0001, ns (non-significant).
Preprints 197869 g006aPreprints 197869 g006b
Figure 7. displays the comparative mRNA expression patterns of the metastatic marker gene in HCT cells after exposure to various treatments. Panels (A-C) show CXCR4 expression at the corresponding time points. The untreated control group is denoted as NH, LPH represents cells treated with Lactobacillus postbiotics alone, and LCSH indicates cells treated with the combination of Lactobacillus postbiotics, carrageenan, and soy protein. The combination treatment demonstrates enhanced anticancer activity through increased induction of apoptotic and necrotic cell death. Data is expressed as mean ± SD. Statistical significance is indicated as p < 0.05, *p < 0.01, **p < 0.001, ***p < 0.0002, and ns (non-significant).
Preprints 197869 g007
Table 1. Experimental treatment conditions for HCT-116 cell groups (NH, lactobacillus postbiotics, and LCSH) in gene expression analysis.
Comparative Item Untreated Control group Lactobacillus postbiotics group Lactobacillus postbiotics, κ-Carrageenan, and soy protein group
Number of HCT cells in each flask 4 x 10⁶
Treatment concentration Untreated 50 mg postbiotic /10 ml growth media 50 mg postbiotic + 25 mg carrageenan + 5 mg soy protein/10 ml growth media
Disclaimer/Publisher’s Note: The statements, opinions and data contained in all publications are solely those of the individual author(s) and contributor(s) and not of MDPI and/or the editor(s). MDPI and/or the editor(s) disclaim responsibility for any injury to people or property resulting from any ideas, methods, instructions or products referred to in the content.
Copyright: This open access article is published under a Creative Commons CC BY 4.0 license, which permit the free download, distribution, and reuse, provided that the author and preprint are cited in any reuse.
Prerpints.org logo

Preprints.org is a free preprint server supported by MDPI in Basel, Switzerland.

Subscribe

Disclaimer

Terms of Use

Privacy Policy

Privacy Settings

© 2026 MDPI (Basel, Switzerland) unless otherwise stated