Preprint
Article

This version is not peer-reviewed.

PTEN Dephosphorylates BECLIN-1 to Regulate Serum-Dependent Autophagy in Thyroid Cancer Cells

Submitted:

06 February 2026

Posted:

09 February 2026

Read the latest preprint version here

Abstract

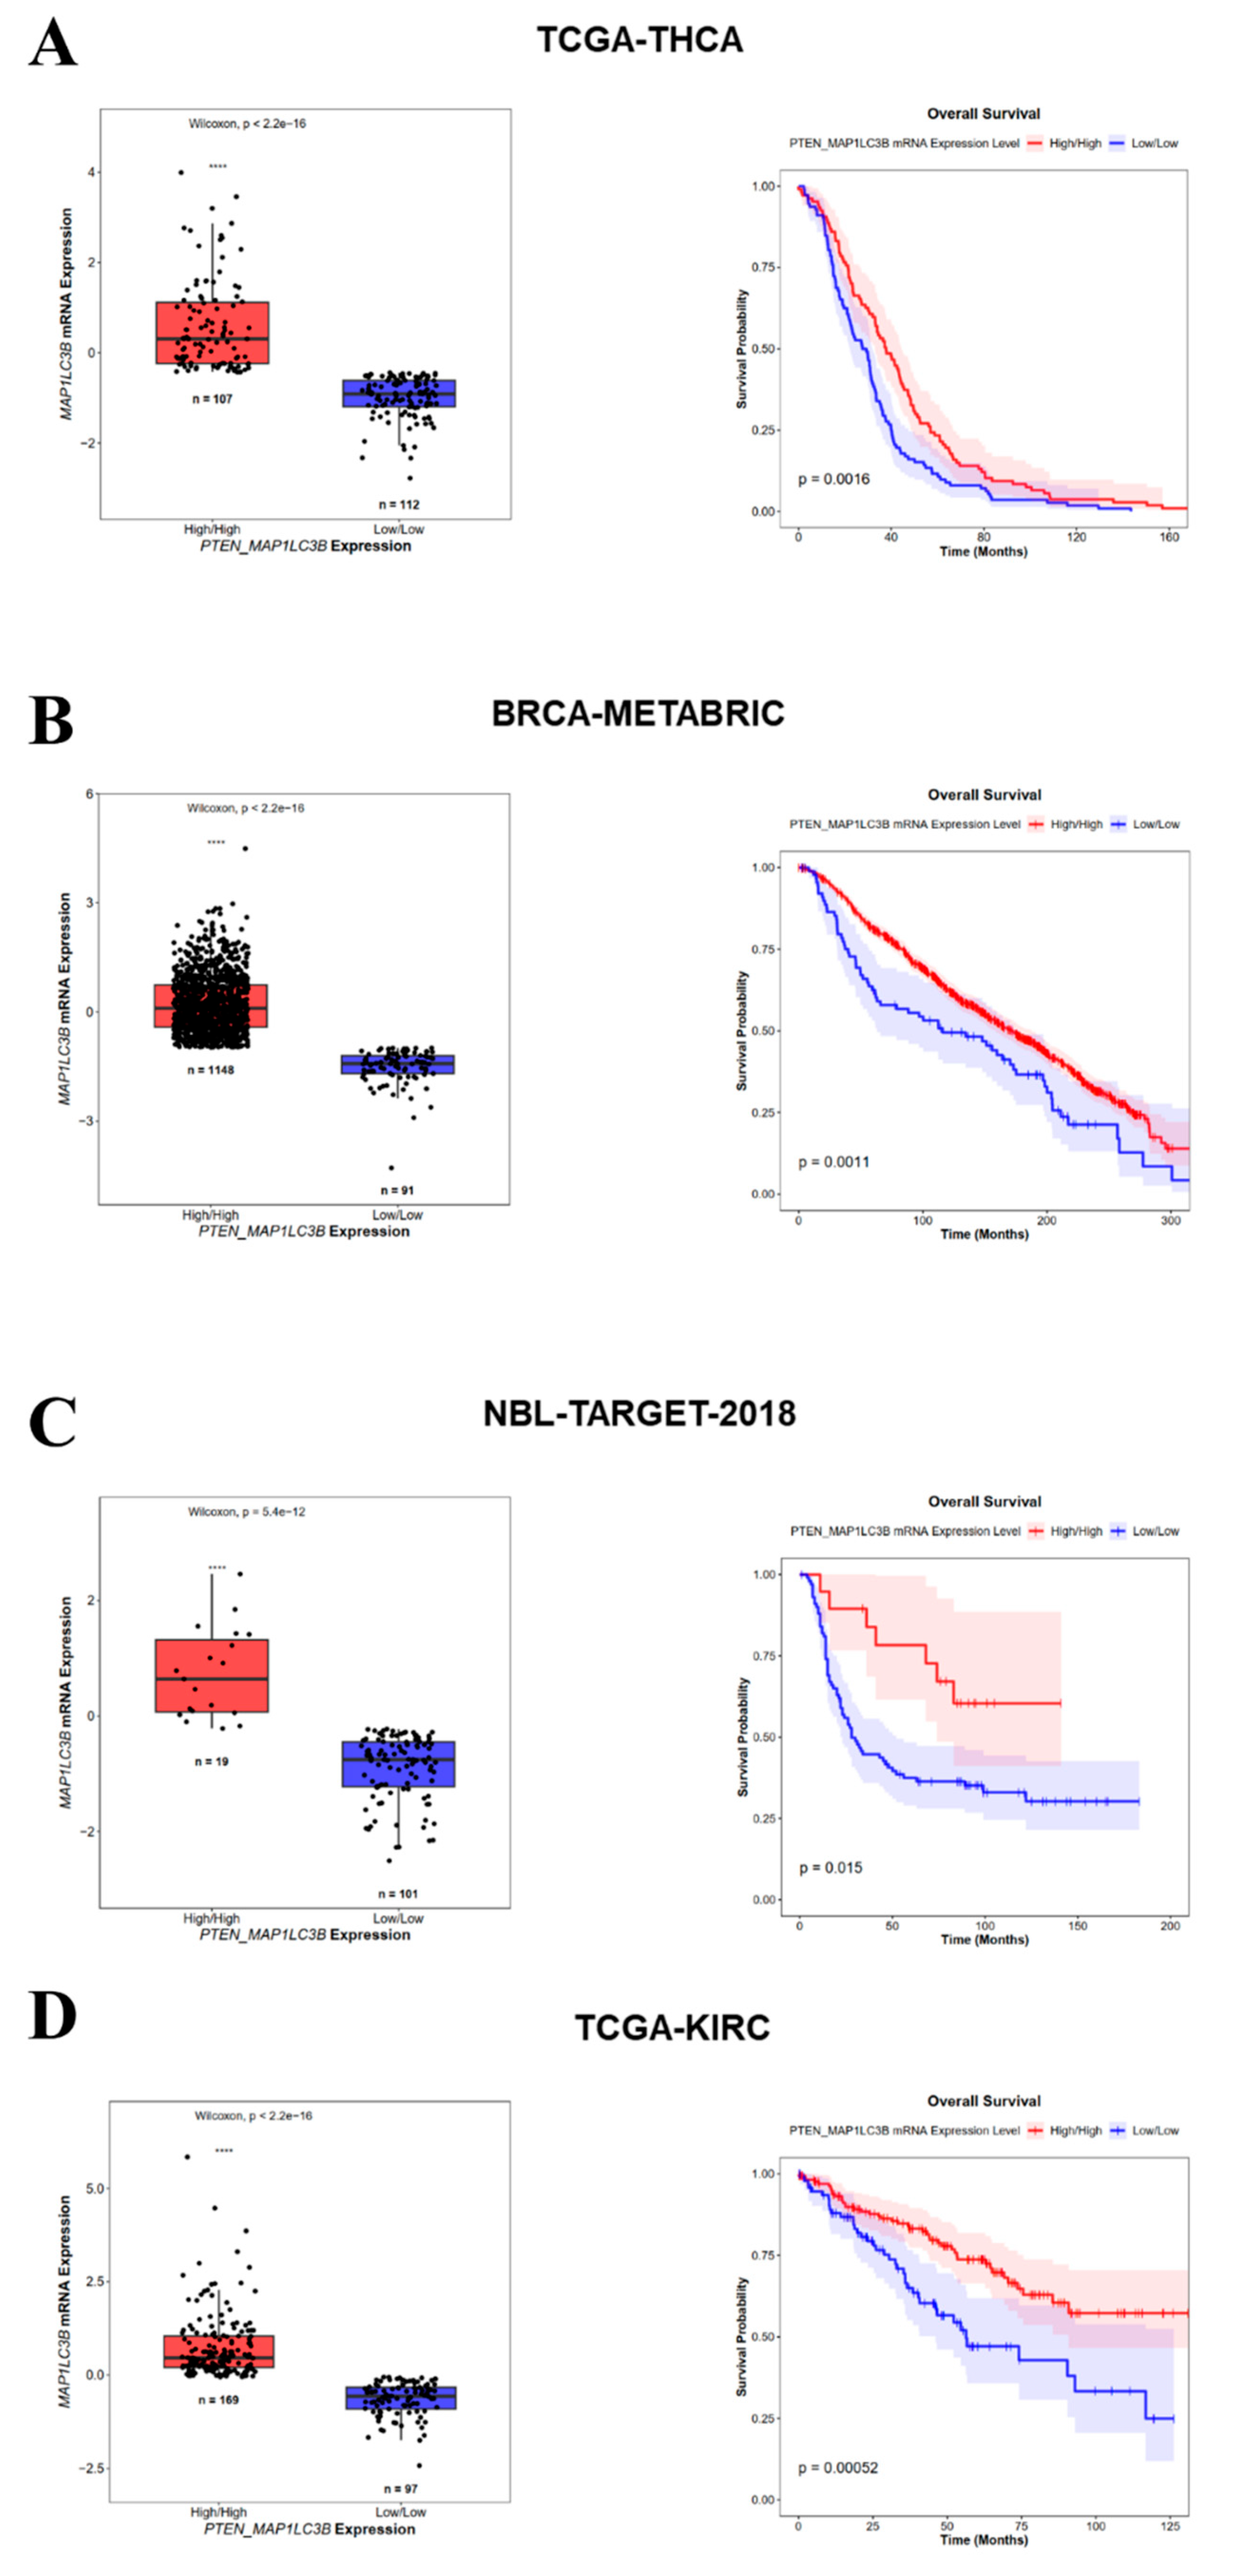
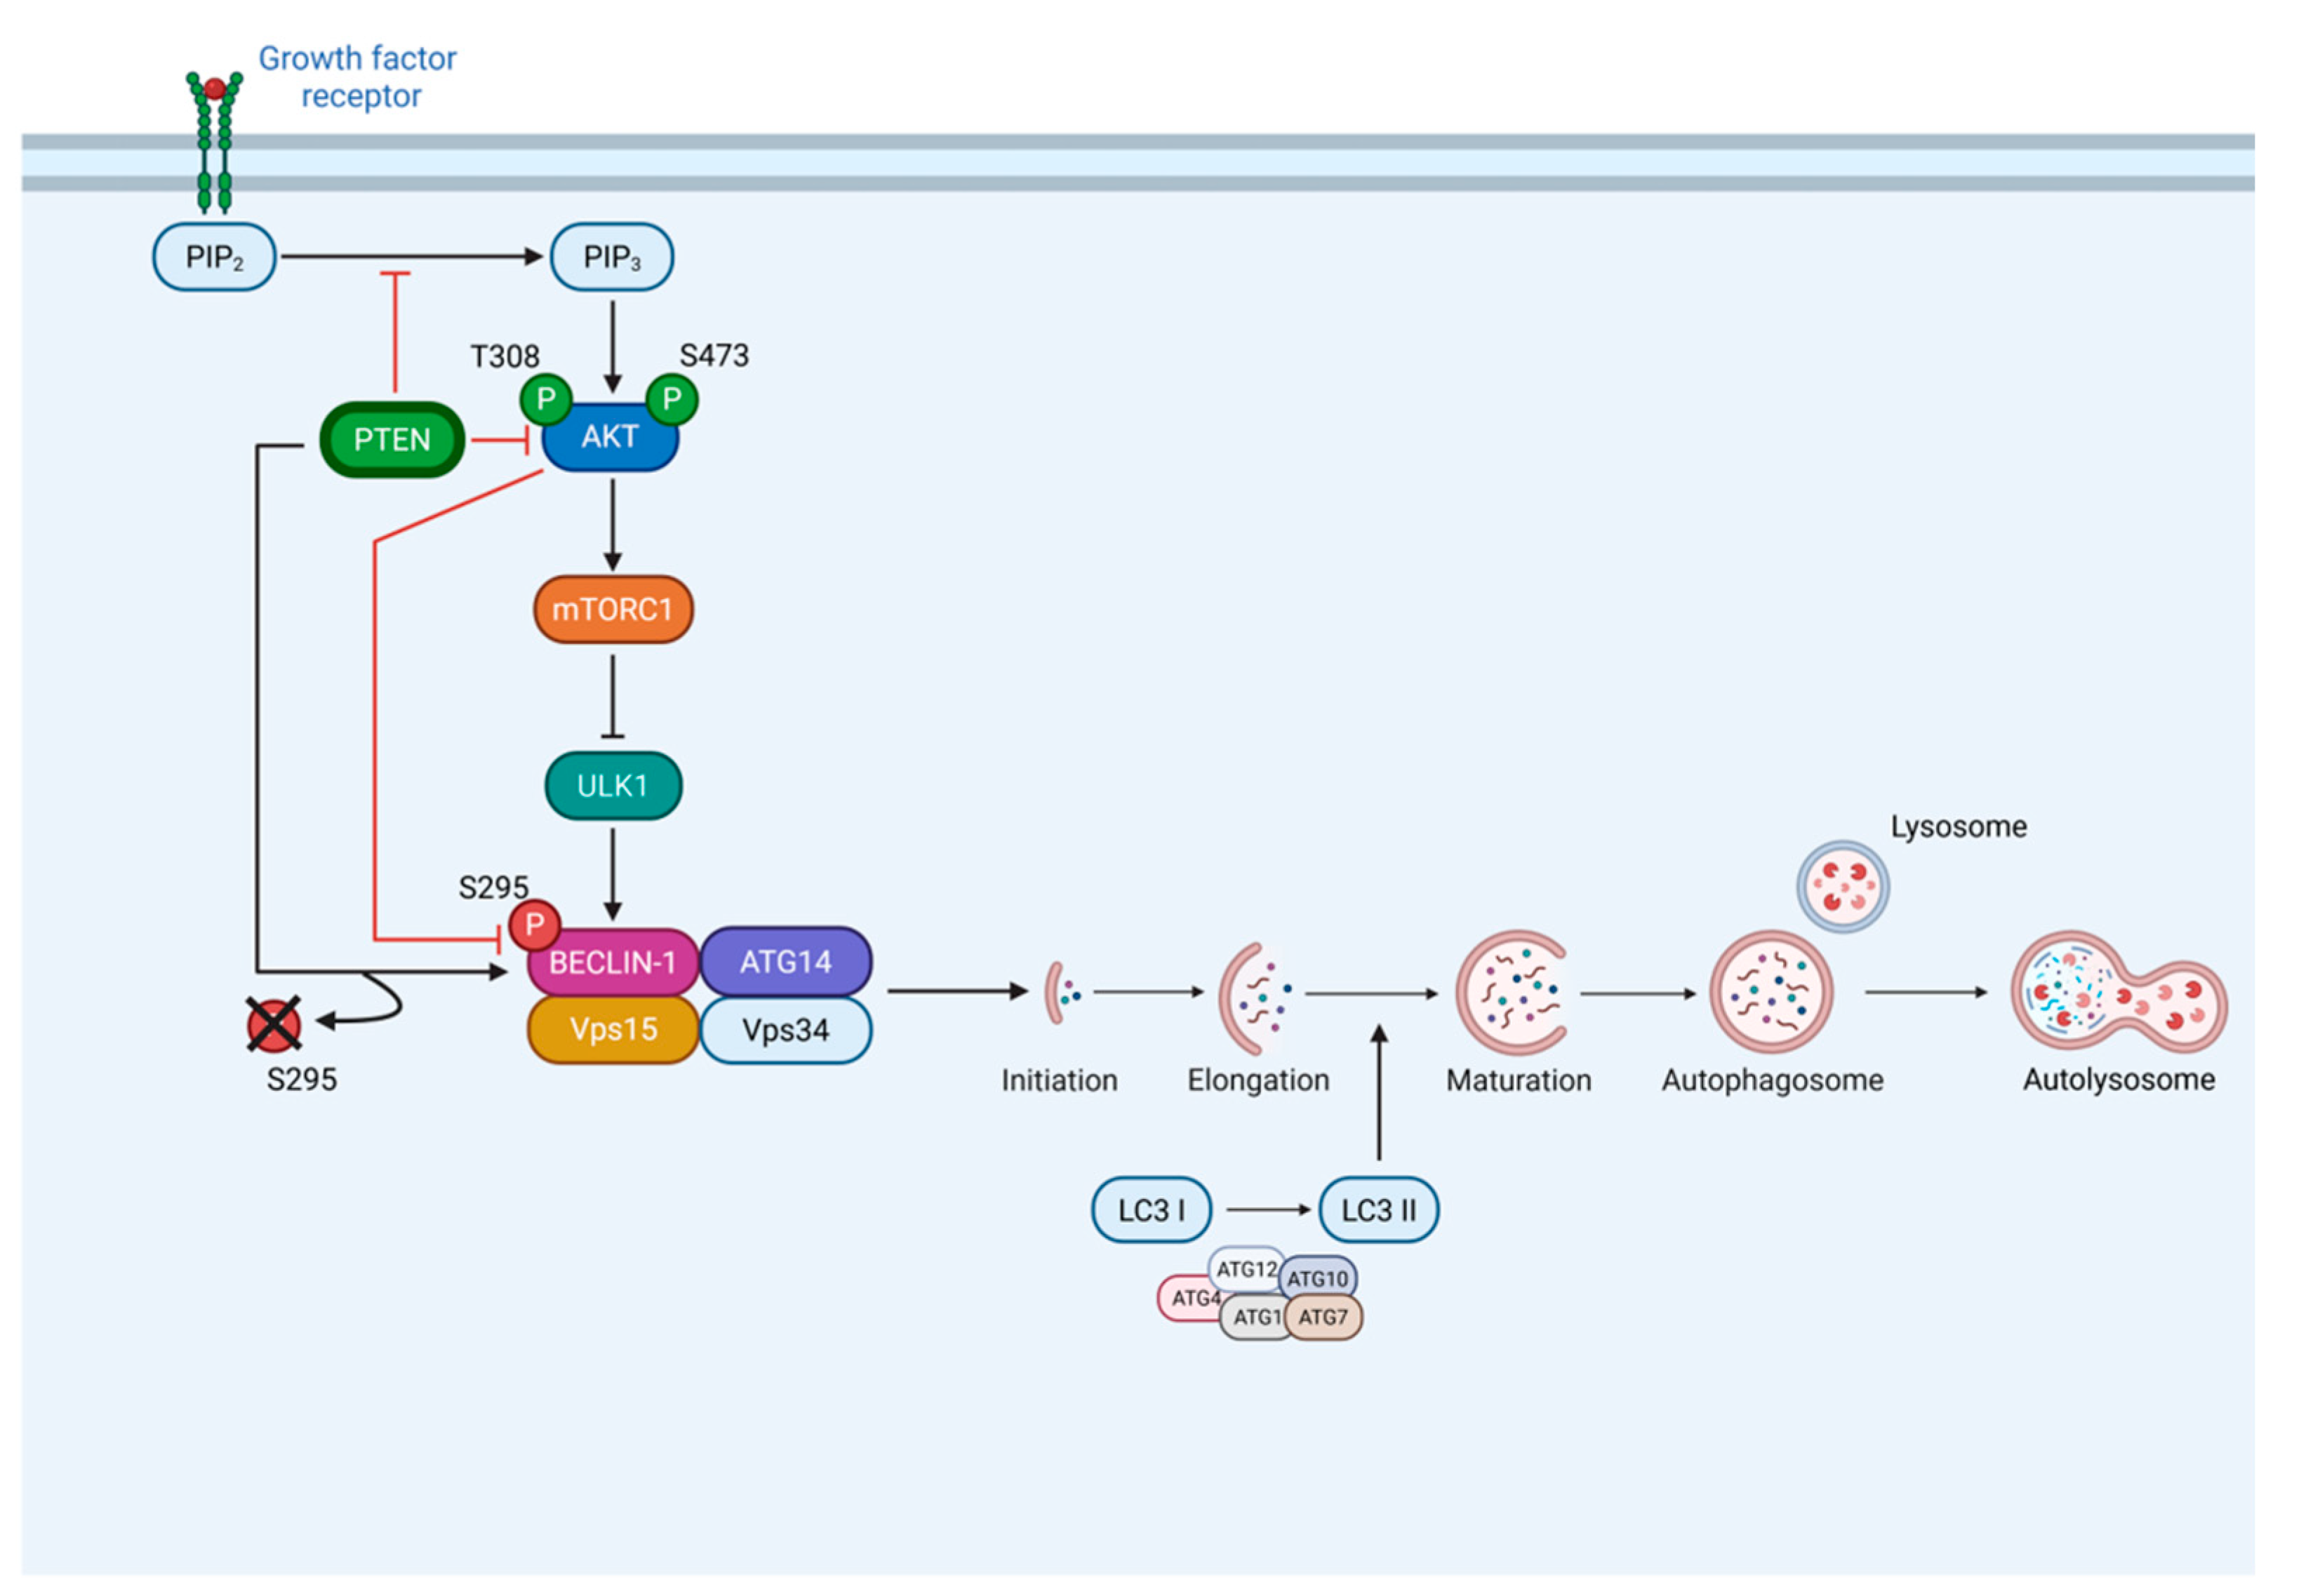
PTEN is a well-established tumor suppressor that plays a central role in the regulation of cell growth, metabolism, and survival. As a protein-lipid dual phosphatase, PTEN negatively regulates the PI3K/AKT signaling pathway, which in turn modulates autophagy, a conserved catabolic process that allows cells to degrade and recycle intracellular components, through the downstream effector mTORC1. While this represents the canonical mechanism by which PTEN influences autophagy, here we show that PTEN also regulates autophagy through an alternative, AKT-independent pathway. Specifically, through genetic manipulations of PTEN expression in thyroid cancer cells, we identify BECLIN-1 as a direct target of PTEN protein phosphatase activity. PTEN physically associates with BECLIN-1 under both basal and nutrient-deprived conditions, promoting its dephosphorylation at serine 295, thus relieving AKT inhibition resulting in autophagy activation. This regulatory event correlates with increased autophagic flux under starvation, as reflected by enhanced LC3 I to LC3 II conversion. Importantly, BECLIN-1 dephosphorylation is mediated by PTEN protein phosphatase activity and does not require its lipid phosphatase function. Furthermore, bioinformatic analyses reveal that high PTEN expression, together with enhanced autophagic activity (MAP1LC3B), is associated with improved clinical outcome in cancer patients. These findings uncover a direct, AKT-independent mechanism by which PTEN controls autophagy by modulating BECLIN-1 phosphorylation status. Together, our results provide novel insight into how PTEN coordinates cellular adaptation to metabolic stress and highlight an additional pathway through which PTEN regulates the autophagic machinery in cancer cells.

Keywords: 
;  ;  ;  ;  ;  ;  ;  ;  

1. Introduction

Autophagy is an evolutionarily conserved process in eukaryotes that involves the lysosomal degradation and recycling of long-lived proteins, organelles, and other cytoplasmic components in response to stress conditions, such as hypoxia, nutrient starvation, mechanical injury, and viral infection [1,2,3]. Autophagy is orchestrated by a core set of autophagy-related proteins, which coordinate the initiation, nucleation, and elongation of the autophagosome and its subsequent fusion with lysosomes. Among these, BECLIN-1 plays a central role in autophagosome nucleation as a part of the Class III phosphatidylinositol 3-kinase (PI3K) complex, which also includes ATG14, VPS34, and VPS15, acting as a scaffold for multiple proteins that drive phagophore formation. Fine-tuned regulation of BECLIN-1 is critical for autophagy induction, with an impact on cancer cell survival/cell death regulation and clinical outcome in cancer patients [4,5,6,7,8,9,10].
Autophagy is tightly regulated by upstream nutrient and growth factor signaling pathways, with the PI3K/AKT/mTORC1 axis playing a central inhibitory role [11]. Growth factor stimulation activates phosphatidylinositol 3-kinase (PI3K), leading to the conversion of phosphatidylinositol (3,4)-bisphosphate (PIP2) into phosphatidylinositol (3,4,5)-trisphosphate (PIP3), the phosphate donor for the phosphorylation of the serine/threonine kinase AKT. Once activated, AKT phosphorylates downstream targets including TSC2 and BECLIN-1. Phosphorylation of TSC2 releases its inhibition of the small GTPase Rheb, allowing Rheb to recruit mTORC1 to the lysosome and activate it [12,13]. Activated mTORC1 further suppresses autophagy by phosphorylating the ULK1/ATG13/FIP200 complex, thereby blocking autophagosome initiation [14,15].
In parallel, AKT-mediated phosphorylation of BECLIN-1 at Ser234 and Ser295 compromises its function as a scaffold in the class III PI3K complex, impairing autophagosome nucleation [16]. This dual regulation ensures that autophagy remains repressed under nutrient and growth factor-rich conditions. Conversely, upon nutrient and serum deprivation, both mTORC1 activity and AKT-mediated BECLIN-1 phosphorylation decrease, relieving the inhibitory constraints and enabling autophagy induction.
A central antagonist of the PI3K/AKT pathway is the tumor suppressor PTEN (phosphatase and tensin homolog deleted on chromosome ten), one of the most frequently mutated tumor suppressors in human cancers. PTEN possesses dual lipid and protein phosphatase activities [17,18,19]. Through its lipid phosphatase activity, PTEN dephosphorylates PIP3, antagonizing growth factor-mediated AKT activation and thereby limiting mTORC1 signaling [20]. In addition, PTEN can directly dephosphorylate AKT at Thr308 and Ser473, further reducing AKT activity [18,21,22].
While several substrates of PTEN protein phosphatase activity have been identified, only a few are known to regulate autophagy. Despite extensive knowledge on AKT-mediated inhibitory phosphorylation of BECLIN-1, the molecular mechanisms responsible for the removal of these inhibitory post-translational modifications during nutrient and serum deprivation remain largely undefined. Based on this rationale, we hypothesized that PTEN, in addition to its canonical role in antagonizing PI3K/AKT signaling, could directly target BECLIN-1, thereby dephosphorylating inhibitory residues and promoting autophagy independently of AKT.
Our findings demonstrate that PTEN physically interacts with the ECD domain of BECLIN-1 and, via its protein phosphatase activity, specifically dephosphorylates Ser295. This reveals a previously unrecognized mechanism by which PTEN directly modulates the autophagic machinery, extending its regulatory function beyond the canonical PI3K/AKT/mTORC1 pathway. By interrogating clinical databases, we also found that the combined expression of PTEN and LC3, indicative of active autophagy, associates with better overall survival in cancer patients.

2. Materials and Methods

2.1. Cell Culture and Reagents

The WRO follicular thyroid cancer cell line was cultured in RPMI-1640 medium (cod. R8758; Sigma-Aldrich Corp., St. Louis, MO, USA), supplemented with 10% fetal bovine serum (FBS, cod. ECS0180L; Euroclone, Milan, Italy), and 1% penicillin/streptomycin (PES, cod. P0781; Sigma-Aldrich Corp.).
FTC-133 cell line was cultured in 50% Dulbecco’s Modified Eagle Medium (DMEM, cod. D5671; Sigma-Aldrich Corp.) and 50% Ham’s F12 Nutrient Mixture (HAM, cod. N4888; Sigma-Aldrich Corp.) supplemented with 10% FBS, 1% glutamine (cod. G7513; Sigma-Aldrich Corp.), and 1% PES.
All the cell lines were maintained under starvation conditions (37 °C, 95 v/v% air: 5 v/v% CO2).
For serum starvation, the cells were incubated in medium supplemented only with 1% glutamine and 1% PES; for serum and amino acid starvation, the cells were incubated with Earle’s Balanced Salt Solution (EBSS, cod. E2888; Sigma-Aldrich Corp.) without any supplements; instead, for only amino acid starvation, EBSS medium was supplemented with 10% FBS.
Where indicated, the cells were treated with 30µM Chloroquine (ClQ, cod. C-6628; Sigma-Aldrich Corp.) for 4h under the following conditions: complete culture medium, serum starvation, EBSS or EBSS supplemented with FBS.

2.2. Transient Transfection

FTC-133 cells were seeded in Petri dishes at a density of 60,000 cells/cm2 and allowed to adhere for 48 h before transfection. Transient overexpression of PTEN was performed using Lipofectamine 3000 and P3000 reagents (cod. L3000-015, Life Technologies, Carlsbad, CA, USA). Liposomal complexes were prepared in Opti-MEM I Reduced Serum Medium (cod. 11058021, Life Technologies) using 2µg of the following plasmids: PTEN-WT, and PTEN-G129E [18]. As a control, transfection with the empty vector (Sham) was included. After 6h of incubation, the transfection medium was replaced with complete culture medium. 36h post- transfection, cells were subjected to the indicated experimental conditions, as previously described.

2.3. Antibodies

The primary antibodies used for immunofluorescence, Western blotting or Co-IPP, at the indicated dilutions, are as follows: rabbit anti-LC3 (1:1000, cod. L7543; Sigma-Aldrich Corp.), mouse anti-LAMP1 (1:1000 cod. 555798; BD Bioscience; Franklin Lakes, NJ, USA), rabbit anti-GAPDH (1:1000, cod. G9545; Sigma-Aldrich Corp.), mouse anti-β-Actin (1:2000, cod. A5441; Sigma-Aldrich Corp), rabbit anti-PTEN (1:500, cod. 07-1372; Millipore; Darmstadt, Germany), rabbit anti-phospho-BECLIN-1 Ser295 (1:250, cod. Ab183313; Abcam), mouse anti-BECLIN-1 (1:500; cod. 612112; BD Bioscience).
For immunoblotting analysis, the following secondary antibodies were used: horseradish peroxidase (HRP)-conjugated goat anti-mouse IgG (1:10,000; cat. no. 170-6516; Bio-Rad, Hercules, CA, USA) and HRP-conjugated goat anti-rabbit IgG (1:10,000; cat. no. 170-6515; Bio-Rad).
For immunofluorescence, Alexa Fluor 488–conjugated goat anti-rabbit IgG (1:1,000; cat. no. A32731; Thermo Fisher Scientific) or Alexa Fluor 555–conjugated goat anti-mouse IgG (1:1,000; cat. no. A32727; Thermo Fisher Scientific) were employed.

2.4. Western Blotting Analysis

Cells were seeded in Petri dishes at a density of 60,000 cells/cm2 and, upon reaching approximately 80% confluence, were treated or cultured under the indicated medium conditions for 4h.
Cell lysates were prepared by ultrasonication followed by freeze–thaw cycles in lysis buffer supplemented with protease inhibitors. Homogenization was performed using a Microson™ XL 2000 ultrasonic cell disruptor (Misonix Inc., Farmingdale, NY, USA). Protein concentration was determined using a NanoDrop™ 2000 spectrophotometer (Thermo Scientific).
Equal amounts of protein (30 μg) were denatured in Laemmli buffer, resolved by SDS–PAGE, and transferred onto PVDF membranes (Bio-Rad, Hercules, CA, USA). Membranes were blocked for 1 h at room temperature with 5% non-fat dry milk and incubated overnight at 4 °C with the indicated primary antibodies.
After incubation with HRP-conjugated secondary antibodies, immunoreactive bands were visualized using a luminol-based chemiluminescent substrate (PerkinElmer Inc., Waltham, MA, USA) and detected with the ChemiDoc XRS Imaging System (Bio-Rad). Band intensities were quantified by densitometric analysis using Quantity One software (Bio-Rad).

2.5. Immunofluorescence

Cells were seeded on coverslips at a density of 30,000 cells/cm2 and allowed to adhere before the designated experimental conditions. Treated cells were fixed in ice-cold methanol and permeabilized with 0.2% Triton-PBS. Cells were then incubated overnight at 4 °C with primary antibodies (diluted in 0.1% Triton -PBS + 10% FBS). On the following day, cells were incubated for 1 h at room temperature with dye-conjugated secondary antibodies. Nuclear staining was performed using the UV-fluorescent dye DAPI (4′,6-diamidino-2-phenylindole). Coverslips were mounted onto glass slides using SlowFade mounting reagent (cat. no. S36936; Invitrogen) and analyzed with a fluorescence microscope (Leica DMI6000).
Quantification of fluorescence intensity was carried out by measuring integrated density values (IntDen) using ImageJ software (v1.54; NIH).

2.6. Co-Immunoprecipitation

Cells were seeded in 60mm Petri dishes at a density of 60,000 cells/cm2 and cultured under the indicated medium conditions for the indicated time (2 or 4h).
Before cell collection, cultures were treated with the cross-linking dithiobis succinimidyl propionate (DSP; cod. D3669, Sigma-Aldrich Corp.) for 15 min at 37 °C. Cells were collected in Lysis buffer containing protease inhibitors and phosphate inhibitors (NaNa3VO4 and NaF).
Equivalent amounts of protein lysates (500 μg) were incubated overnight at 4 °C with anti-PTEN antibody (5 μL). Immune complexes were recovered by incubation with Protein G Sepharose® 4 Fast Flow beads (cod. 17-0618-01; Sigma-Aldrich Corp.) followed by centrifugation at 12,000× g. After extensive washing with 1× PBS to remove unbound proteins, immunoprecipitates were eluted in 1× Laemmli buffer and denatured at 95 °C for 10 minutes.
Eluted proteins were finally resolved by SDS–PAGE and analyzed by Western blotting.

2.7. Statistical Analysis

Statistical analyses and graphical outputs were performed using GraphPad Prism software (version 8.0). Comparisons between two experimental groups were carried out using a t-test analysis. For analysis involving multiple groups, one-way or two-way ANOVA was applied, followed by Bonferroni’s test. A two-tailed p-value < 0.05 was considered statistically significant. All experiments were independently repeated at least three times. Data are expressed as mean ± standard deviation (SD).

2.8. Protein-Protein Interaction Prediction

The complete amino acid sequences of PTEN and BECLIN-1 were retrieved from the CCDS® database (accession numbers: CCDS31238.1, CCDS11441.1). HDOCK server (http://hdock.phys.hust.edu.cn), an online server that can predict protein-protein interactions through a hybrid algorithm of template-based docking, was used to carry out protein-protein docking between PTEN and BECLIN-1. According to the HDOCK server workflow, up to 100 docking poses are generated for each complex, of which the top 10 ranked models are displayed on the results webpage [23]. The PTEN-BECLIN-1 complex with the highest negative docking score and confidence interval was selected and visualized using Mol* 3D Viewer (https://www.rcsb.org/3d-view).

2.9. Bioinformatic Analysis

All clinical annotations and gene expression data were retrieved from the cBioPortal database (https://www.cbioportal.org, last accessed on 22 January 2026). Four large, independent, publicly available cohorts were analysed: Breast Cancer (BRCA-METABRIC), Thyroid Cancer (TCGA-THCA), Kidney Renal Clear Cell Carcinoma (TCGA-KIRC), and Pediatric Neuroblastoma (NBL-TARGET-2018).
Patient cohorts were stratified into High and Low expression groups based on the relative mRNA expression (z-scores) of PTEN and MAP1LC3B. To minimize the potential bias from dichotomisation, optimal cut-points were determined using maximally selected rank statistics. This was implemented via the ‘surv_cutpoint’ function within the survminer R package (v.0.5.1), which identifies the threshold that yields the most significant difference in survival outcomes.
All Statistical analyses were performed in the R environment (v.4.4.2; R Foundation for Statistical Computing, Vienna, Austria). Kaplan-Meier curves were visualized from the ‘survival’ package (v.3.8-3), and boxplots were created using the ‘ggplot2’ (v. 4.0.1) and ‘ggpubr’ (v. 0.6.2) packages.
A Cox regression model was applied to assess the association between gene expression and survival outcomes. The log-rank test was used to evaluate the statistical significance of the survival curves, and a p-value &lt; 0.05 was considered statistically significant.

3. Results

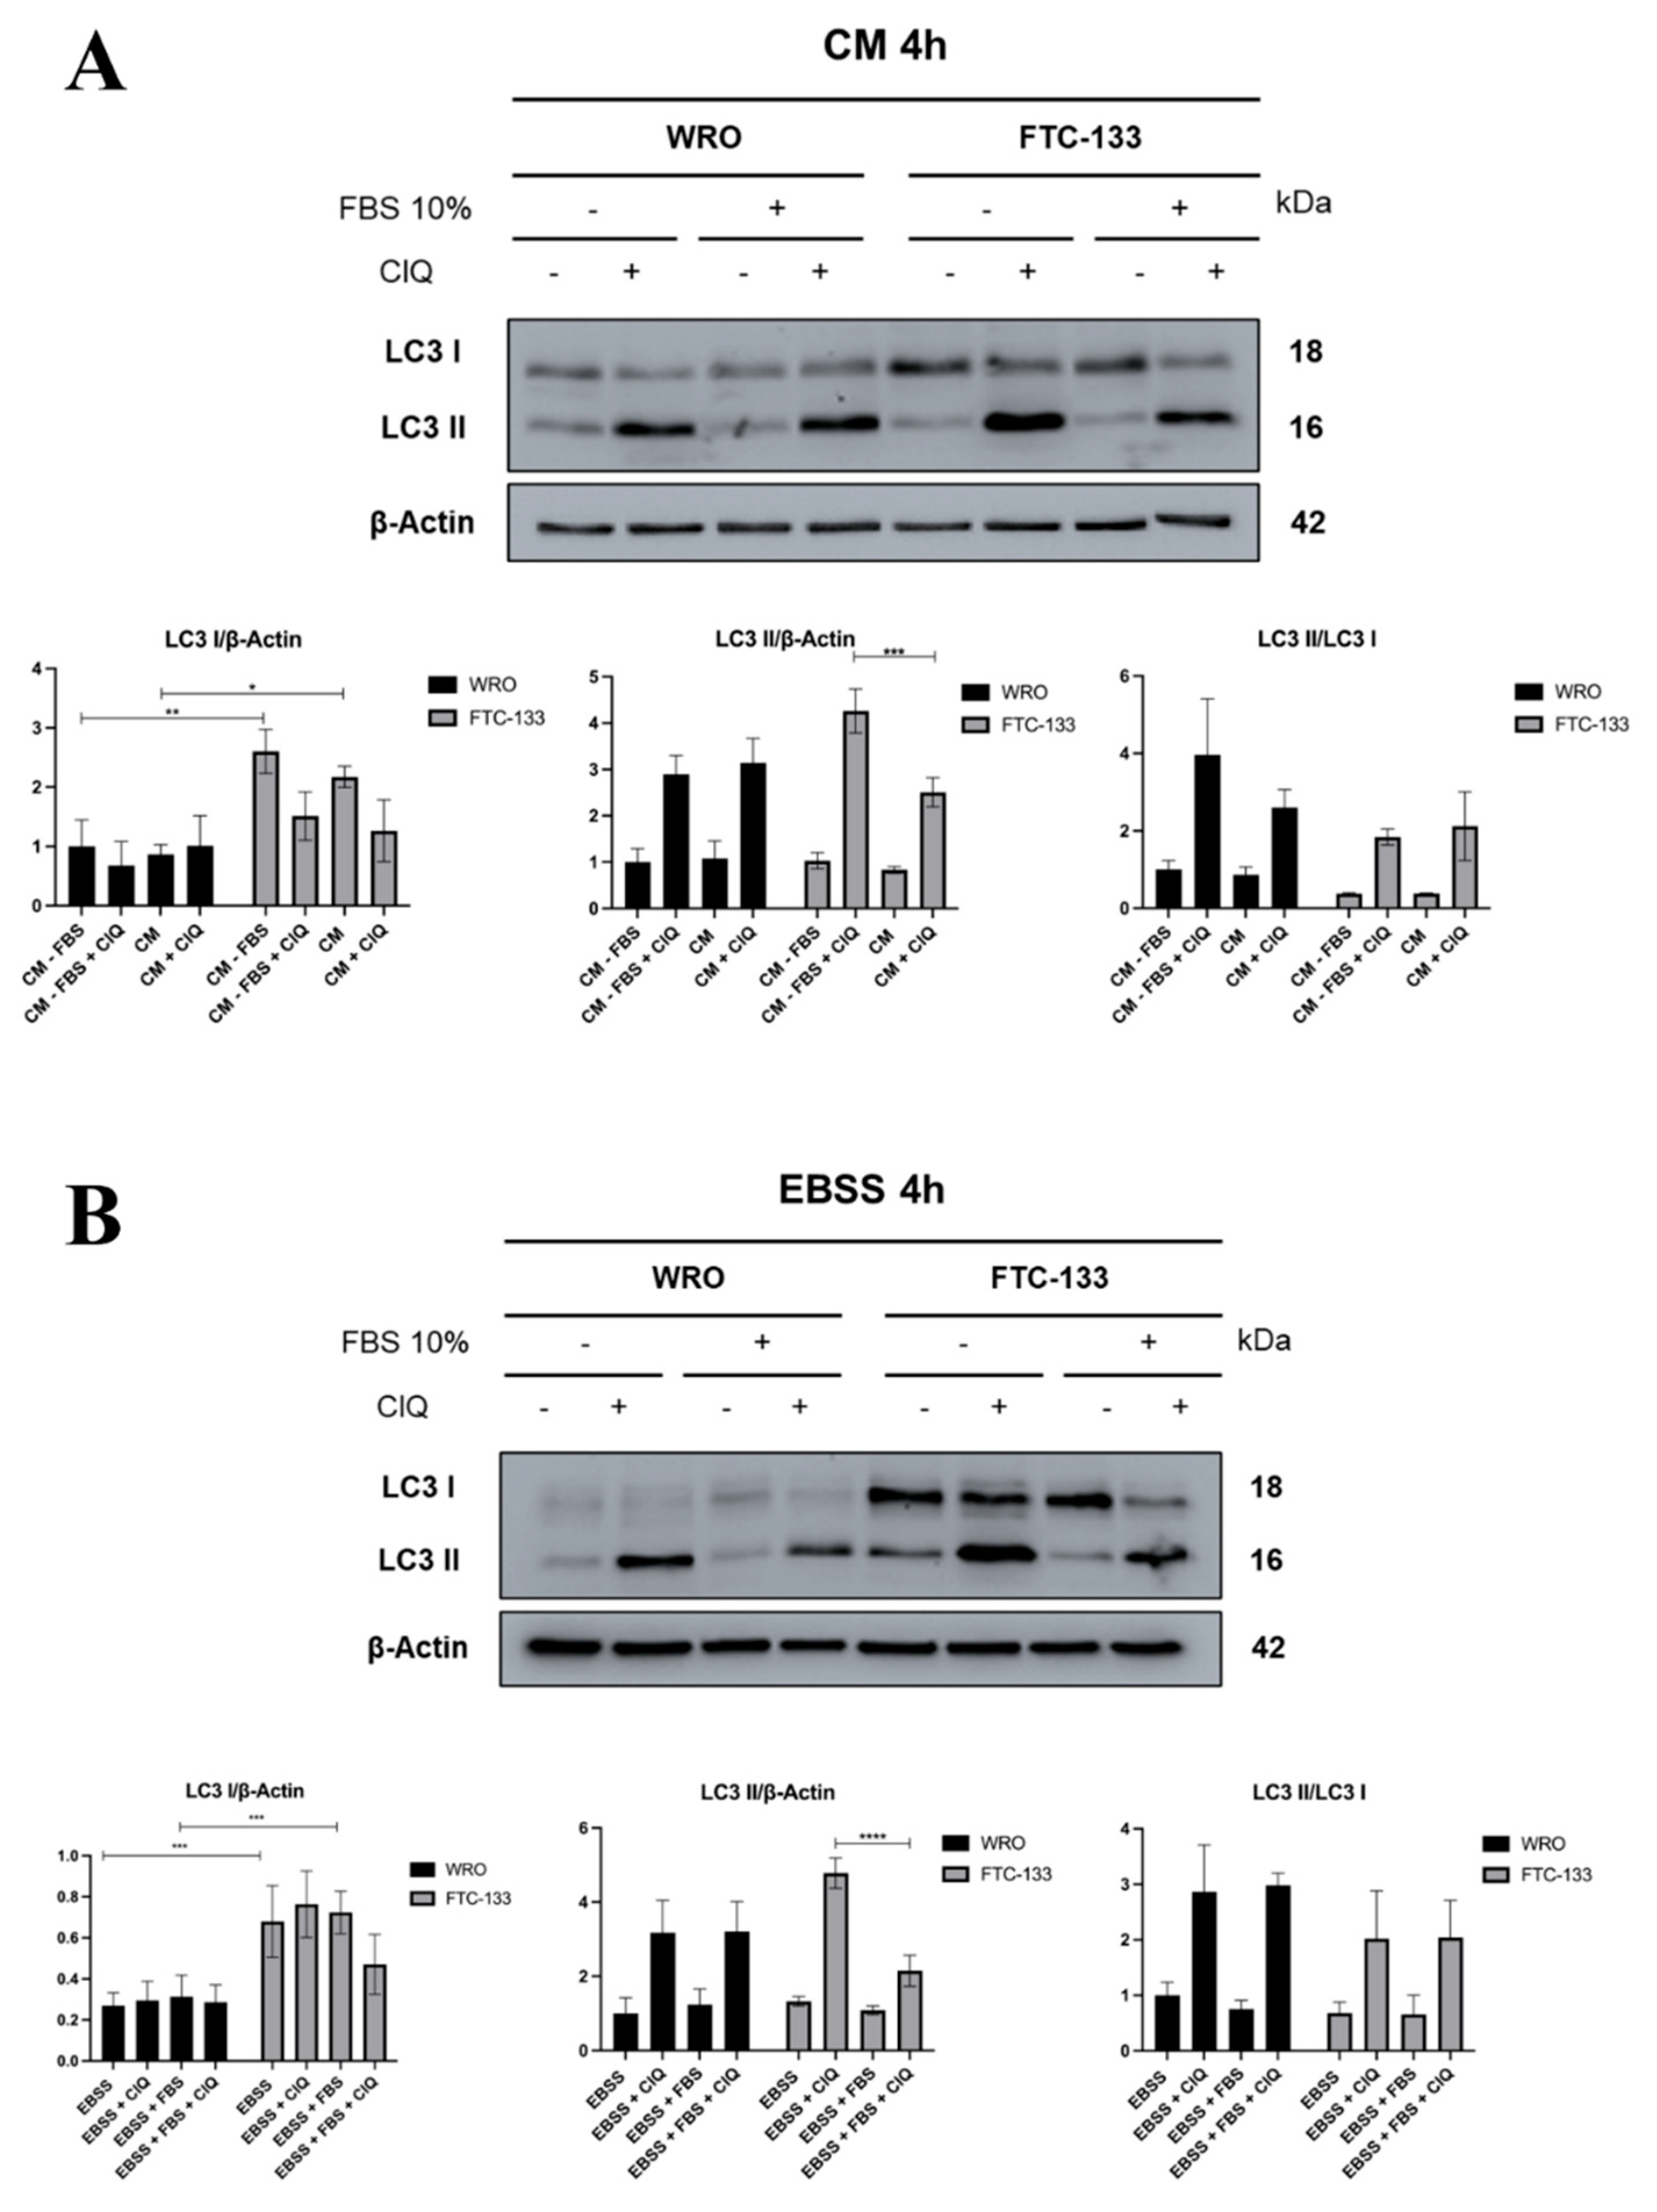
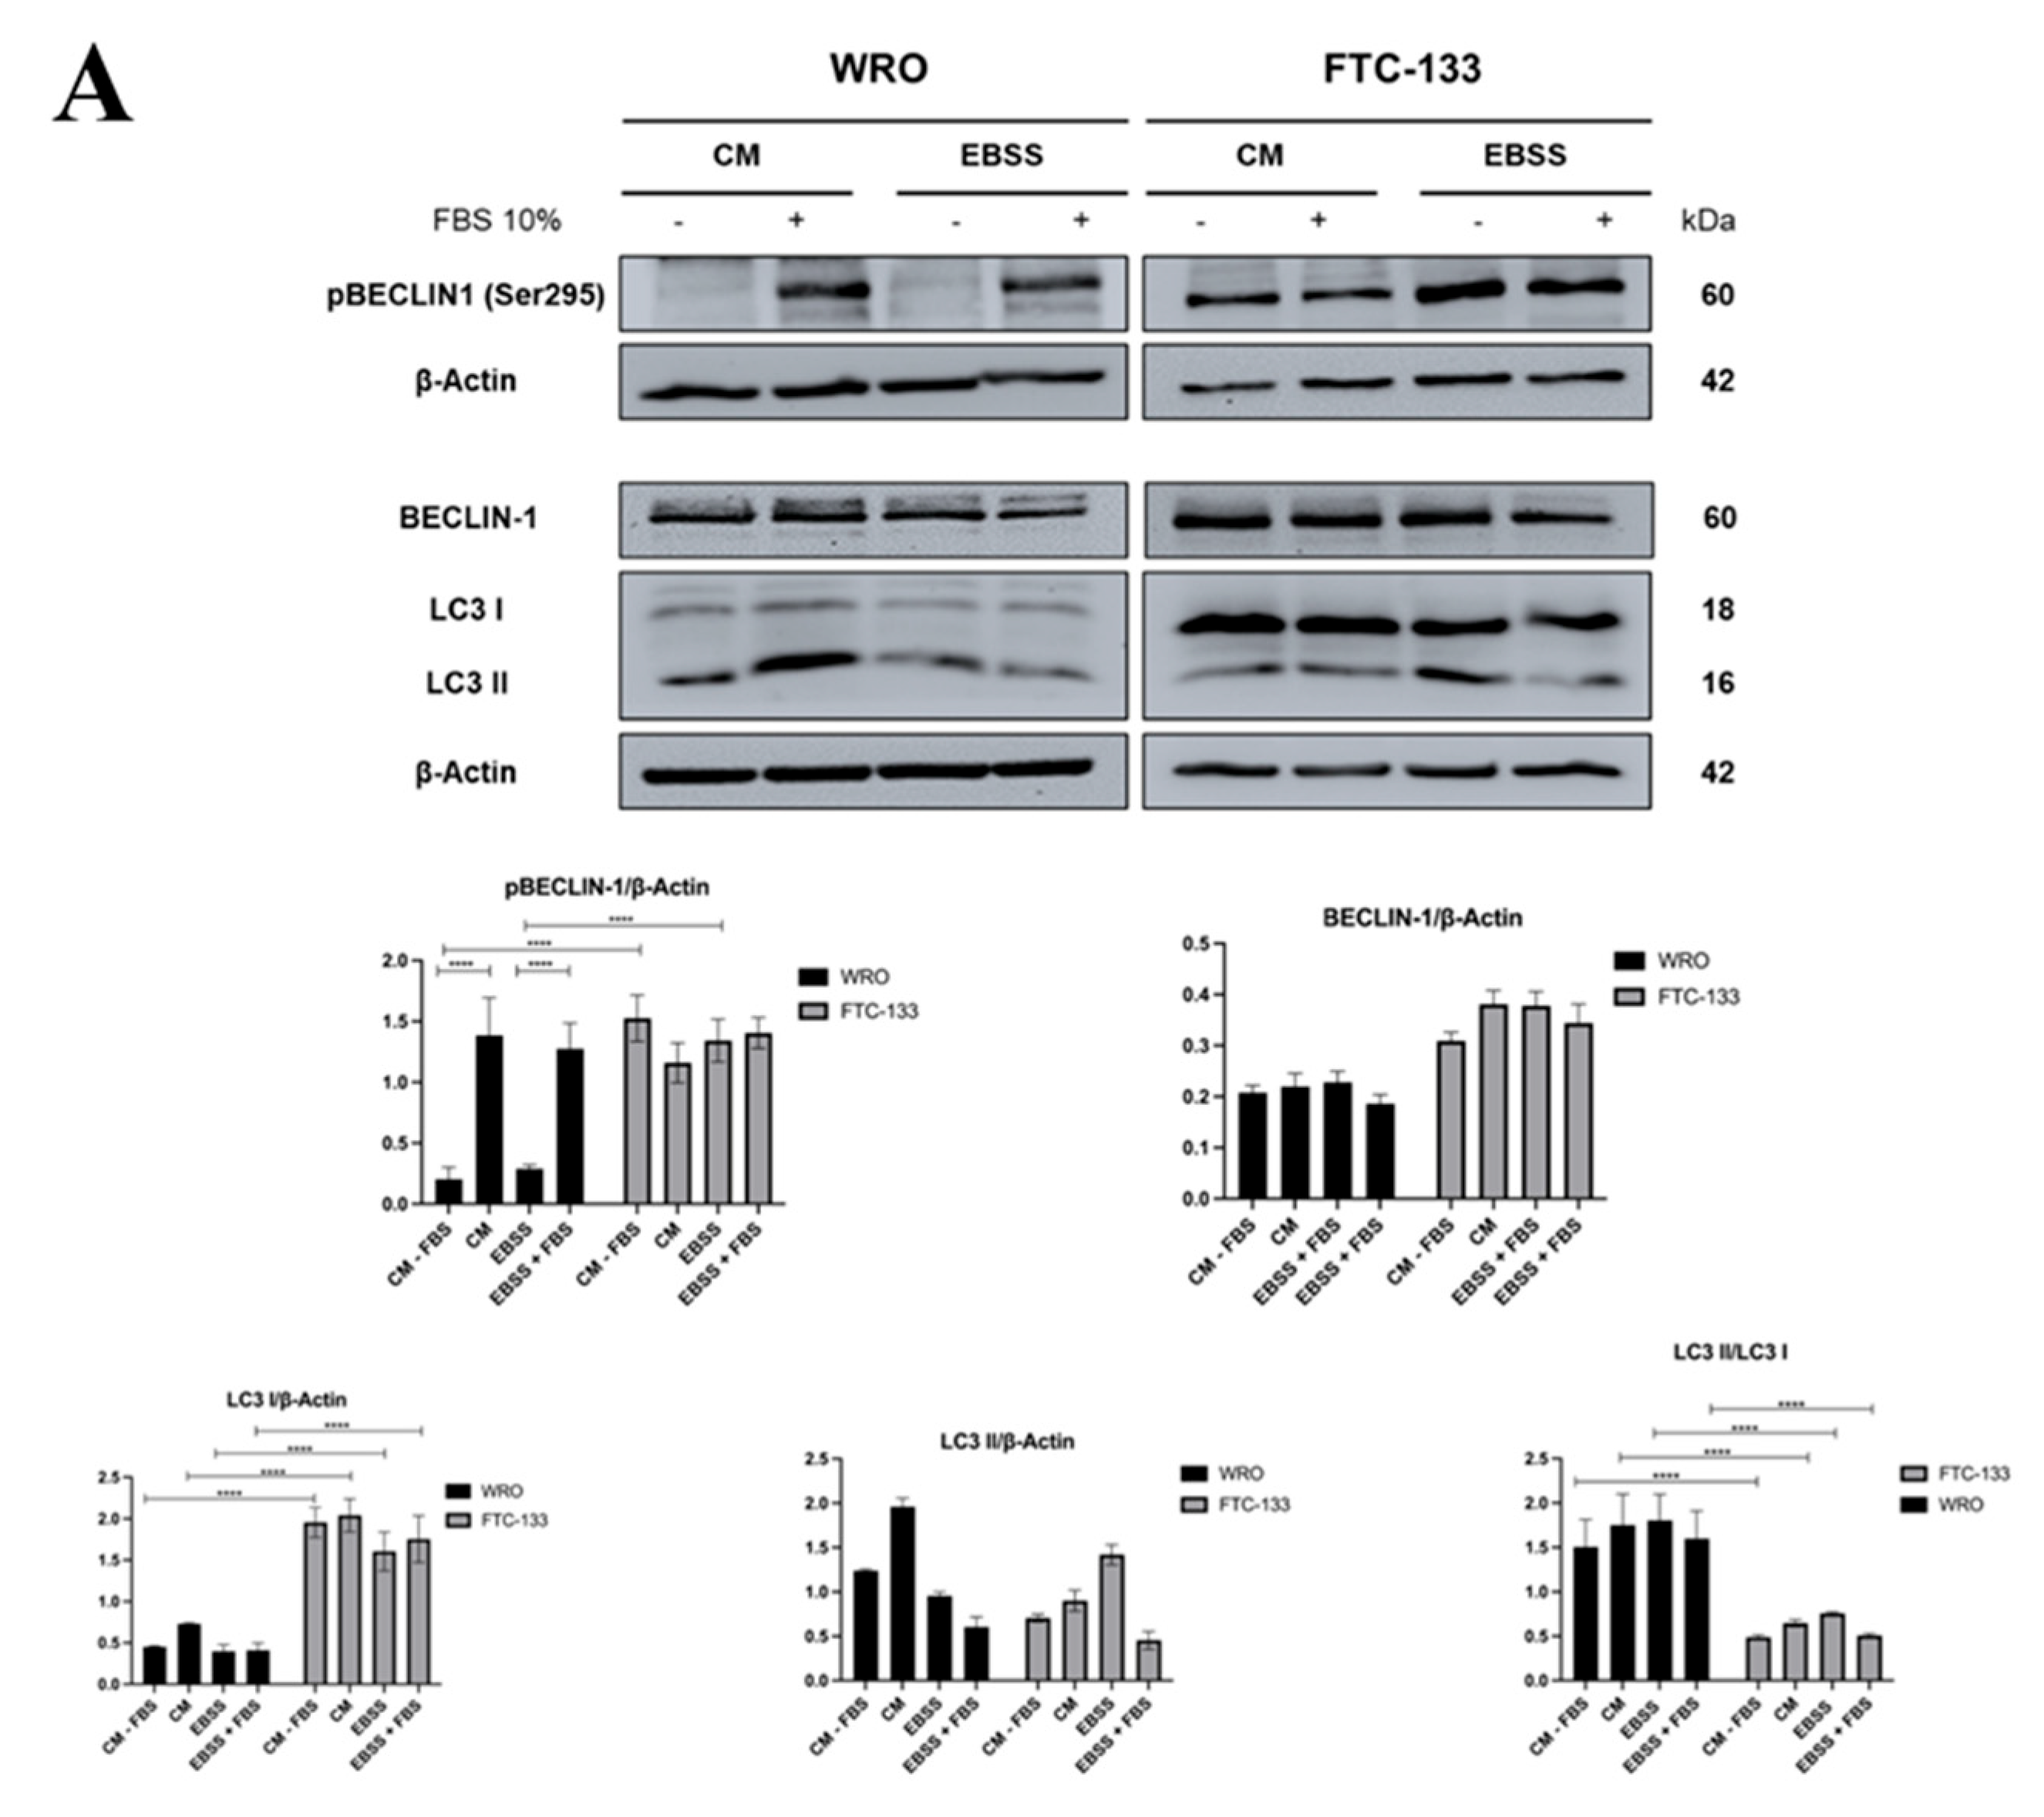
3.1. Serum inhibition of Autophagosome Formation is more Effective in PTEN-deficient than in PTEN-proficient Thyroid Cancer Cells

The PI3K–AKT–mTORC1 signaling axis plays a central role in the regulation of autophagy by integrating nutrient and growth factor availability [11]. Activation of this pathway under nutrient- and serum-rich conditions suppresses autophagy, whereas its inhibition is associated with autophagy induction. To investigate how serum and nutrient availability influence autophagy in a PTEN-dependent manner, we analyzed the autophagic response in two thyroid cancer cell lines with distinct PTEN status: WRO cells, which express functional PTEN, and FTC-133 cells, which are PTEN-deficient due to a truncating R130STOP mutation and monoallelic PTEN deletion, resulting in complete loss of PTEN protein expression [24,25].
WRO and FTC-133 cells were cultured for 4 h in complete medium (CM), media without fetal bovine serum (FBS), EBSS, or EBSS supplemented with FBS, and autophagy was assessed by monitoring LC3 processing. Under these conditions, the LC3 II/LC3 I ratio, indicative of autophagosome formation, did not show significant changes in either cell line, regardless of nutrient or serum availability (Figure 1A-B).
To more accurately evaluate autophagic flux, we assessed the accumulation of lipidated LC3 II in the presence of chloroquine (ClQ), which inhibits lysosomal acidification and autophagosome–lysosome fusion, thereby preventing autophagosome degradation [26]. Under these conditions, FTC-133 cells displayed a marked reduction in LC3 II accumulation when cultured in CM or EBSS supplemented with FBS, indicating impaired autophagosome turnover in the presence of serum.
Notably, analysis of total LC3 revealed a significant difference in basal LC3 I levels between the two cell lines. FTC-133 cells consistently exhibited higher LC3 I expression compared to WRO cells, independently of the culture conditions, suggesting altered autophagy regulation associated with PTEN loss.
To further investigate autophagosome–lysosome fusion, we performed an immunofluorescence staining for the autophagosomal marker LC3 (green) and the lysosomal marker LAMP1 (red). PTEN-proficient cells (WRO) showed a significantly increased yellow signal under serum and nutrient deprivation compared to PTEN-deficient cells (FTC-133), indicative of enhanced autophagosome–lysosome fusion (Figure 1C).
Collectively, these results demonstrate that serum-mediated inhibition of autophagy is more pronounced in PTEN-deficient FTC-133 cells, as reflected by reduced autophagosome accumulation and impaired autophagosome–lysosome fusion under serum-rich conditions.
The above data show that in the presence of growth factors, there is a reduction in the autophagosome accumulation in PTEN-deficient cells. This data might well be explained by the phosphorylation status of BECLIN-1; for this reason, we focused in particular on the phosphorylation at Serine 295 (Ser295) of BECLIN-1, which is mediated by AKT in the presence of growth factors. Our findings demonstrate that in the PTEN-proficient WRO cells, BECLIN-1 phosphorylation (Ser295) was significantly reduced in the absence of serum, while we observed sustained BECLIN-1 Ser295 phosphorylation in FTC-133 cells regardless of serum availability (Figure 2A).
To confirm the functional consequences of this phosphorylation status on autophagy, we evaluated the autophagic flux by monitoring the LC3 conversion. Analysis of the LC3 II/ LC3 I ratio demonstrated that WRO cells exhibited higher autophagic flux compared to FTC-133 cells across all the culture conditions (Figure 2A). Consistently, FTC-133 cells showed accumulation of LC3 I, indicative of impaired LC3 I lipidation and reduced autophagosome formation.
Taken together, these data indicate that PTEN loss is associated with constitutive BECLIN-1 Ser295 phosphorylation and impaired autophagy flux, supporting a role for PTEN in relieving AKT-mediated inhibition of autophagy.

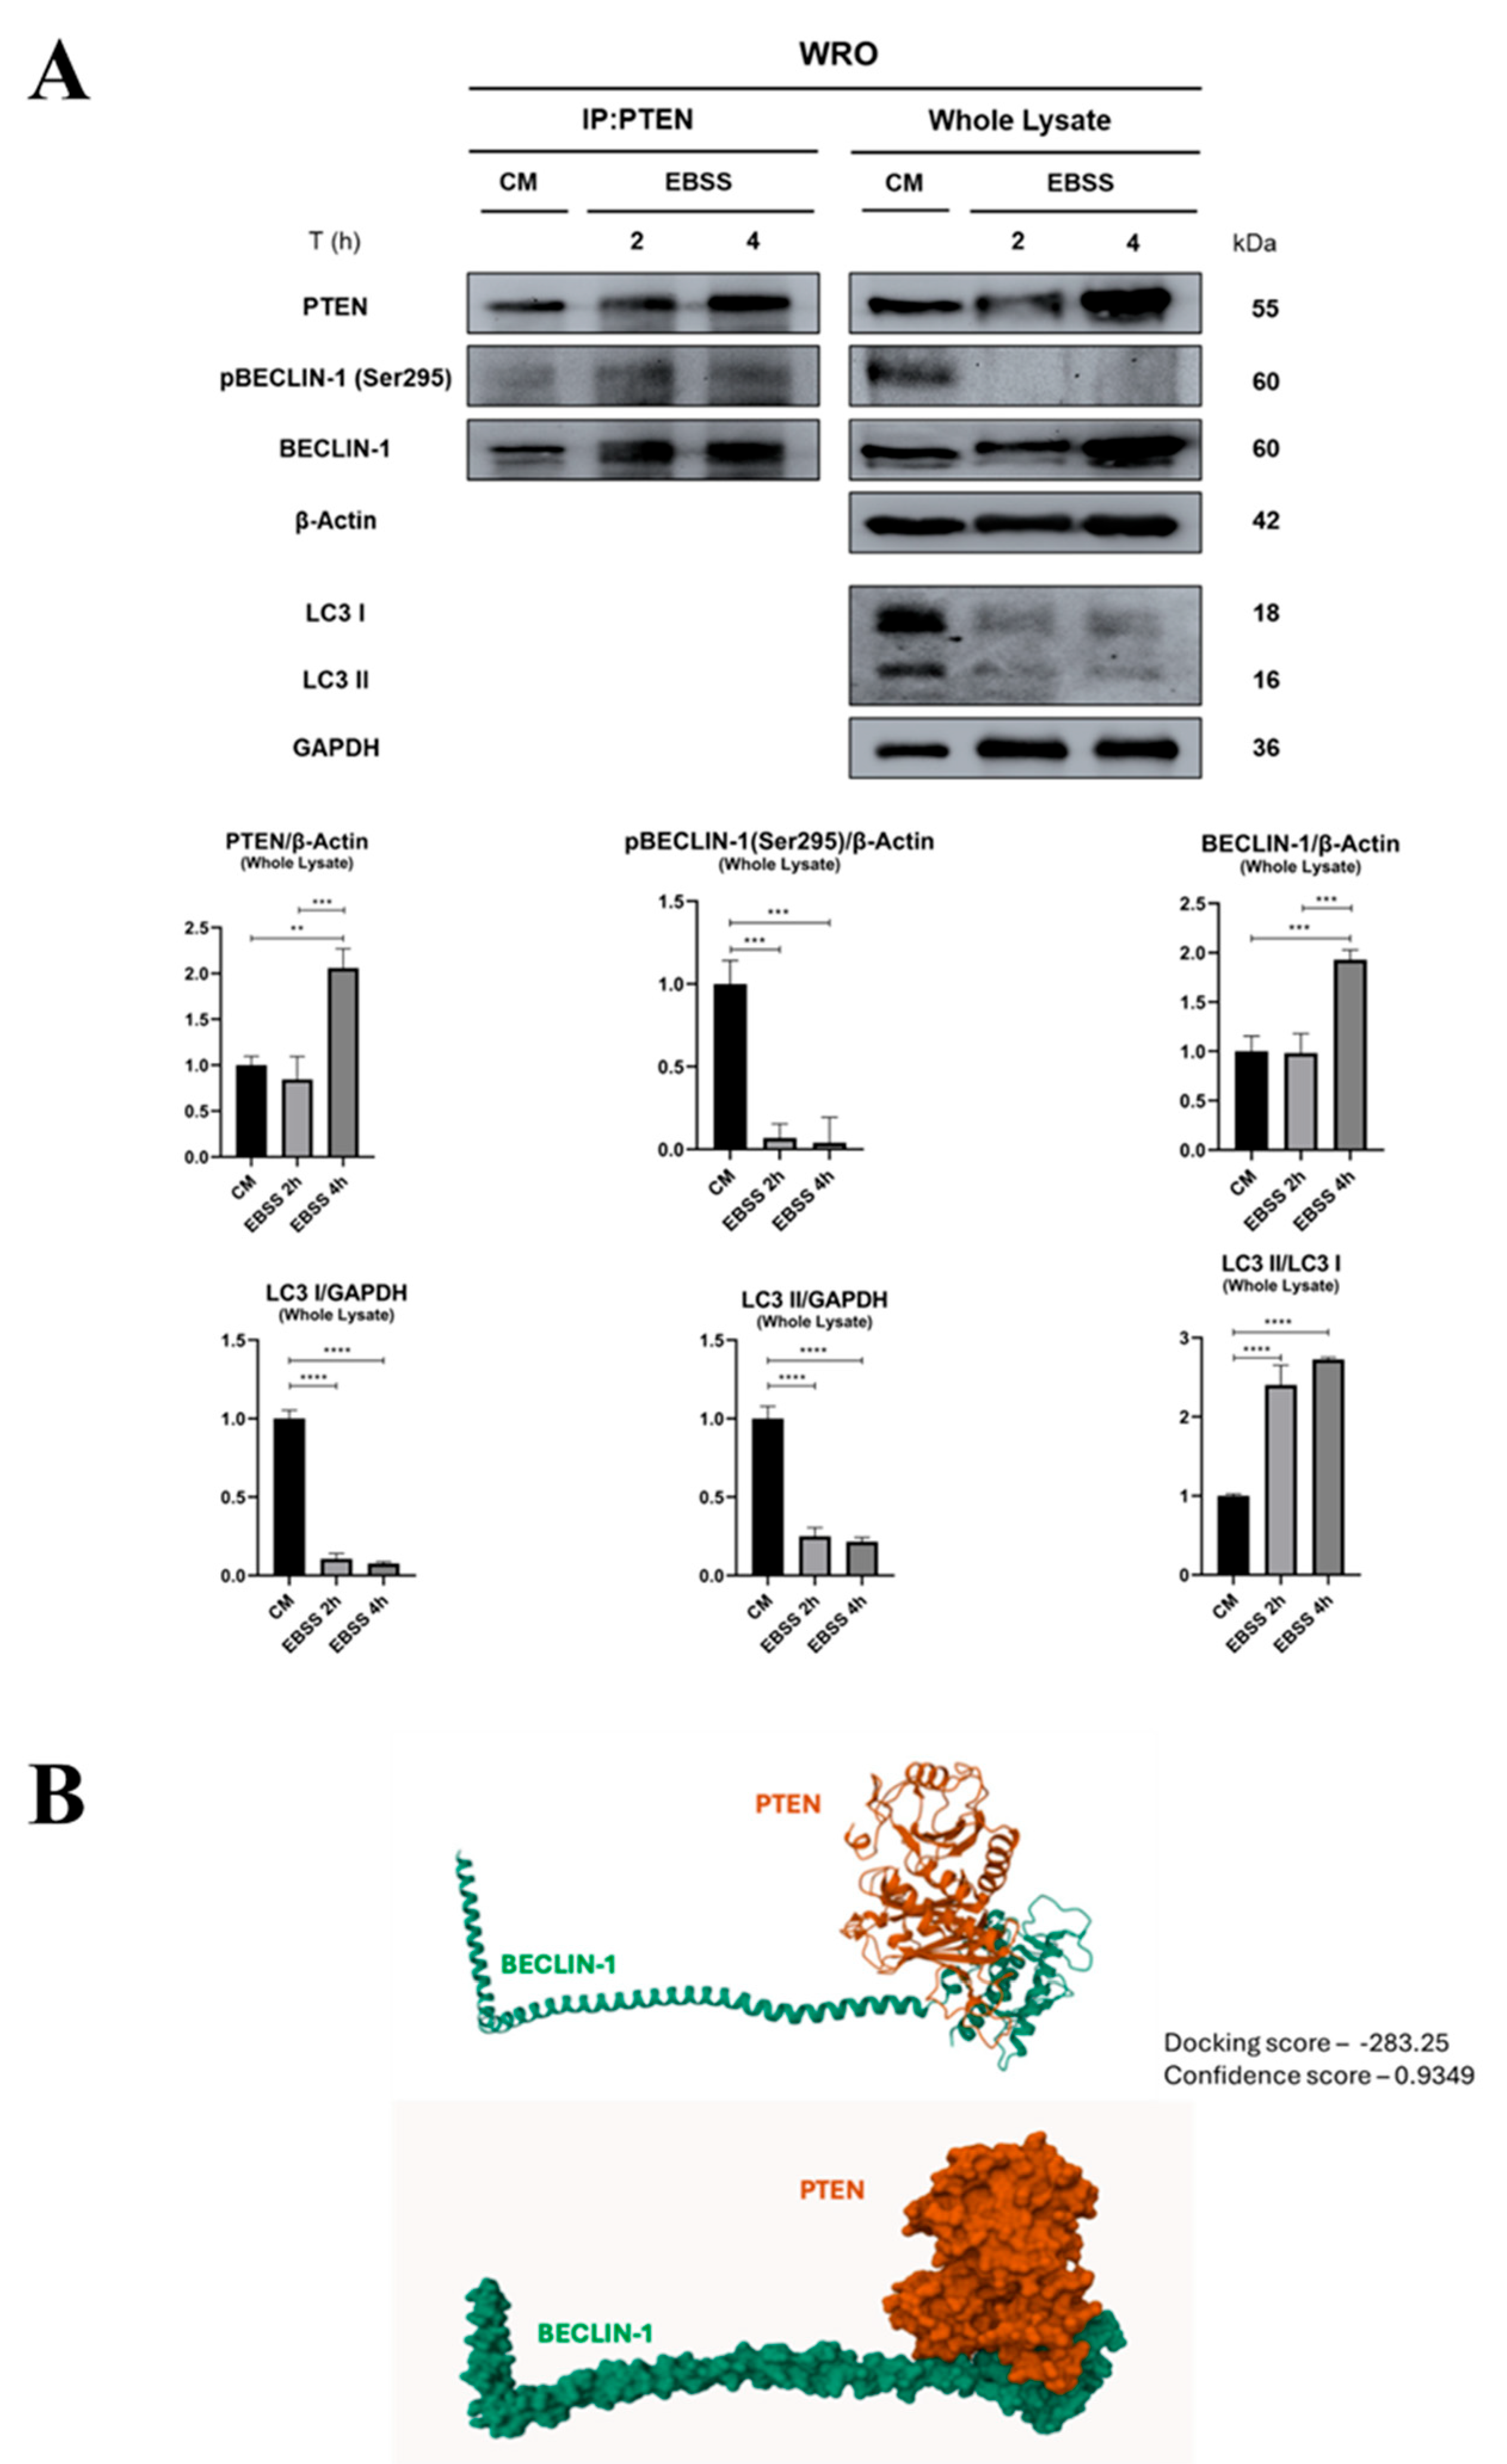
3.2. PTEN Interacts with BECLIN-1 and Promotes Ser295 Dephosphorylation

To further elucidate the mechanism by which PTEN regulates autophagy through BECLIN-1, we performed a co-immunoprecipitation in WRO cells, which express functional PTEN. PTEN was found to physically interact with BECLIN-1 in complete media (CM) as well as during nutrient and serum deprivation (EBSS), at both 2 and 4 hours of starvation (Figure 3A). Analysis of total cell lysates confirmed that EBSS-induced starvation leads to dephosphorylation of BECLIN-1 at serine 295 (Ser295), consistent with enhanced autophagic activity, as indicated by the accumulation of LC3 I under CM and a more rapid conversion to LC3 II under EBSS conditions, reflecting increased autophagic flux (Figure 3A). To support these findings at the structural level, we performed in silico docking predictions using the HDOCK server, which indicated that PTEN and BECLIN-1 are likely to interact through the ECD domain of BECLIN-1 (Figure 3B). This interaction provides a plausible explanation for why dephosphorylation at Ser295 is observed only in PTEN-expressing cells during starvation.
To confirm that dephosphorylation of BECLIN-1 at Ser295 is directly mediated by PTEN, we overexpressed wild-type PTEN (PTEN-WT) in FTC-133 cells, which do not express endogenous PTEN [18]. Western blot analysis revealed that exogenous overexpression of PTEN induces dephosphorylation of BECLIN-1 at Ser295 under both serum deprivation and combined nutrient and serum deprivation conditions, confirming that this mechanism is PTEN-dependent (Figure 4A). To further validate the interaction between PTEN and BECLIN-1, we performed immunofluorescence staining for PTEN (green) and BECLIN-1 (red) in PTEN-overexpressing FTC-133 cells, observing colocalization (yellow signal) under serum deprivation and nutrient deprivation (EBSS) conditions (Figure 4B).
Given that FTC-133 cells lack endogenous PTEN and exhibit low basal autophagic activity, we next investigated whether the re-expression of PTEN, associated with BECLIN-1 dephosphorylation at Ser295, also resulted in functional activation of autophagy. Western blot analysis revealed that PTEN-WT overexpression markedly enhanced autophagic flux, as evidenced by an increased conversion of LC3 I into LC3 II under both serum-deprived and EBSS conditions (Figure 4C).

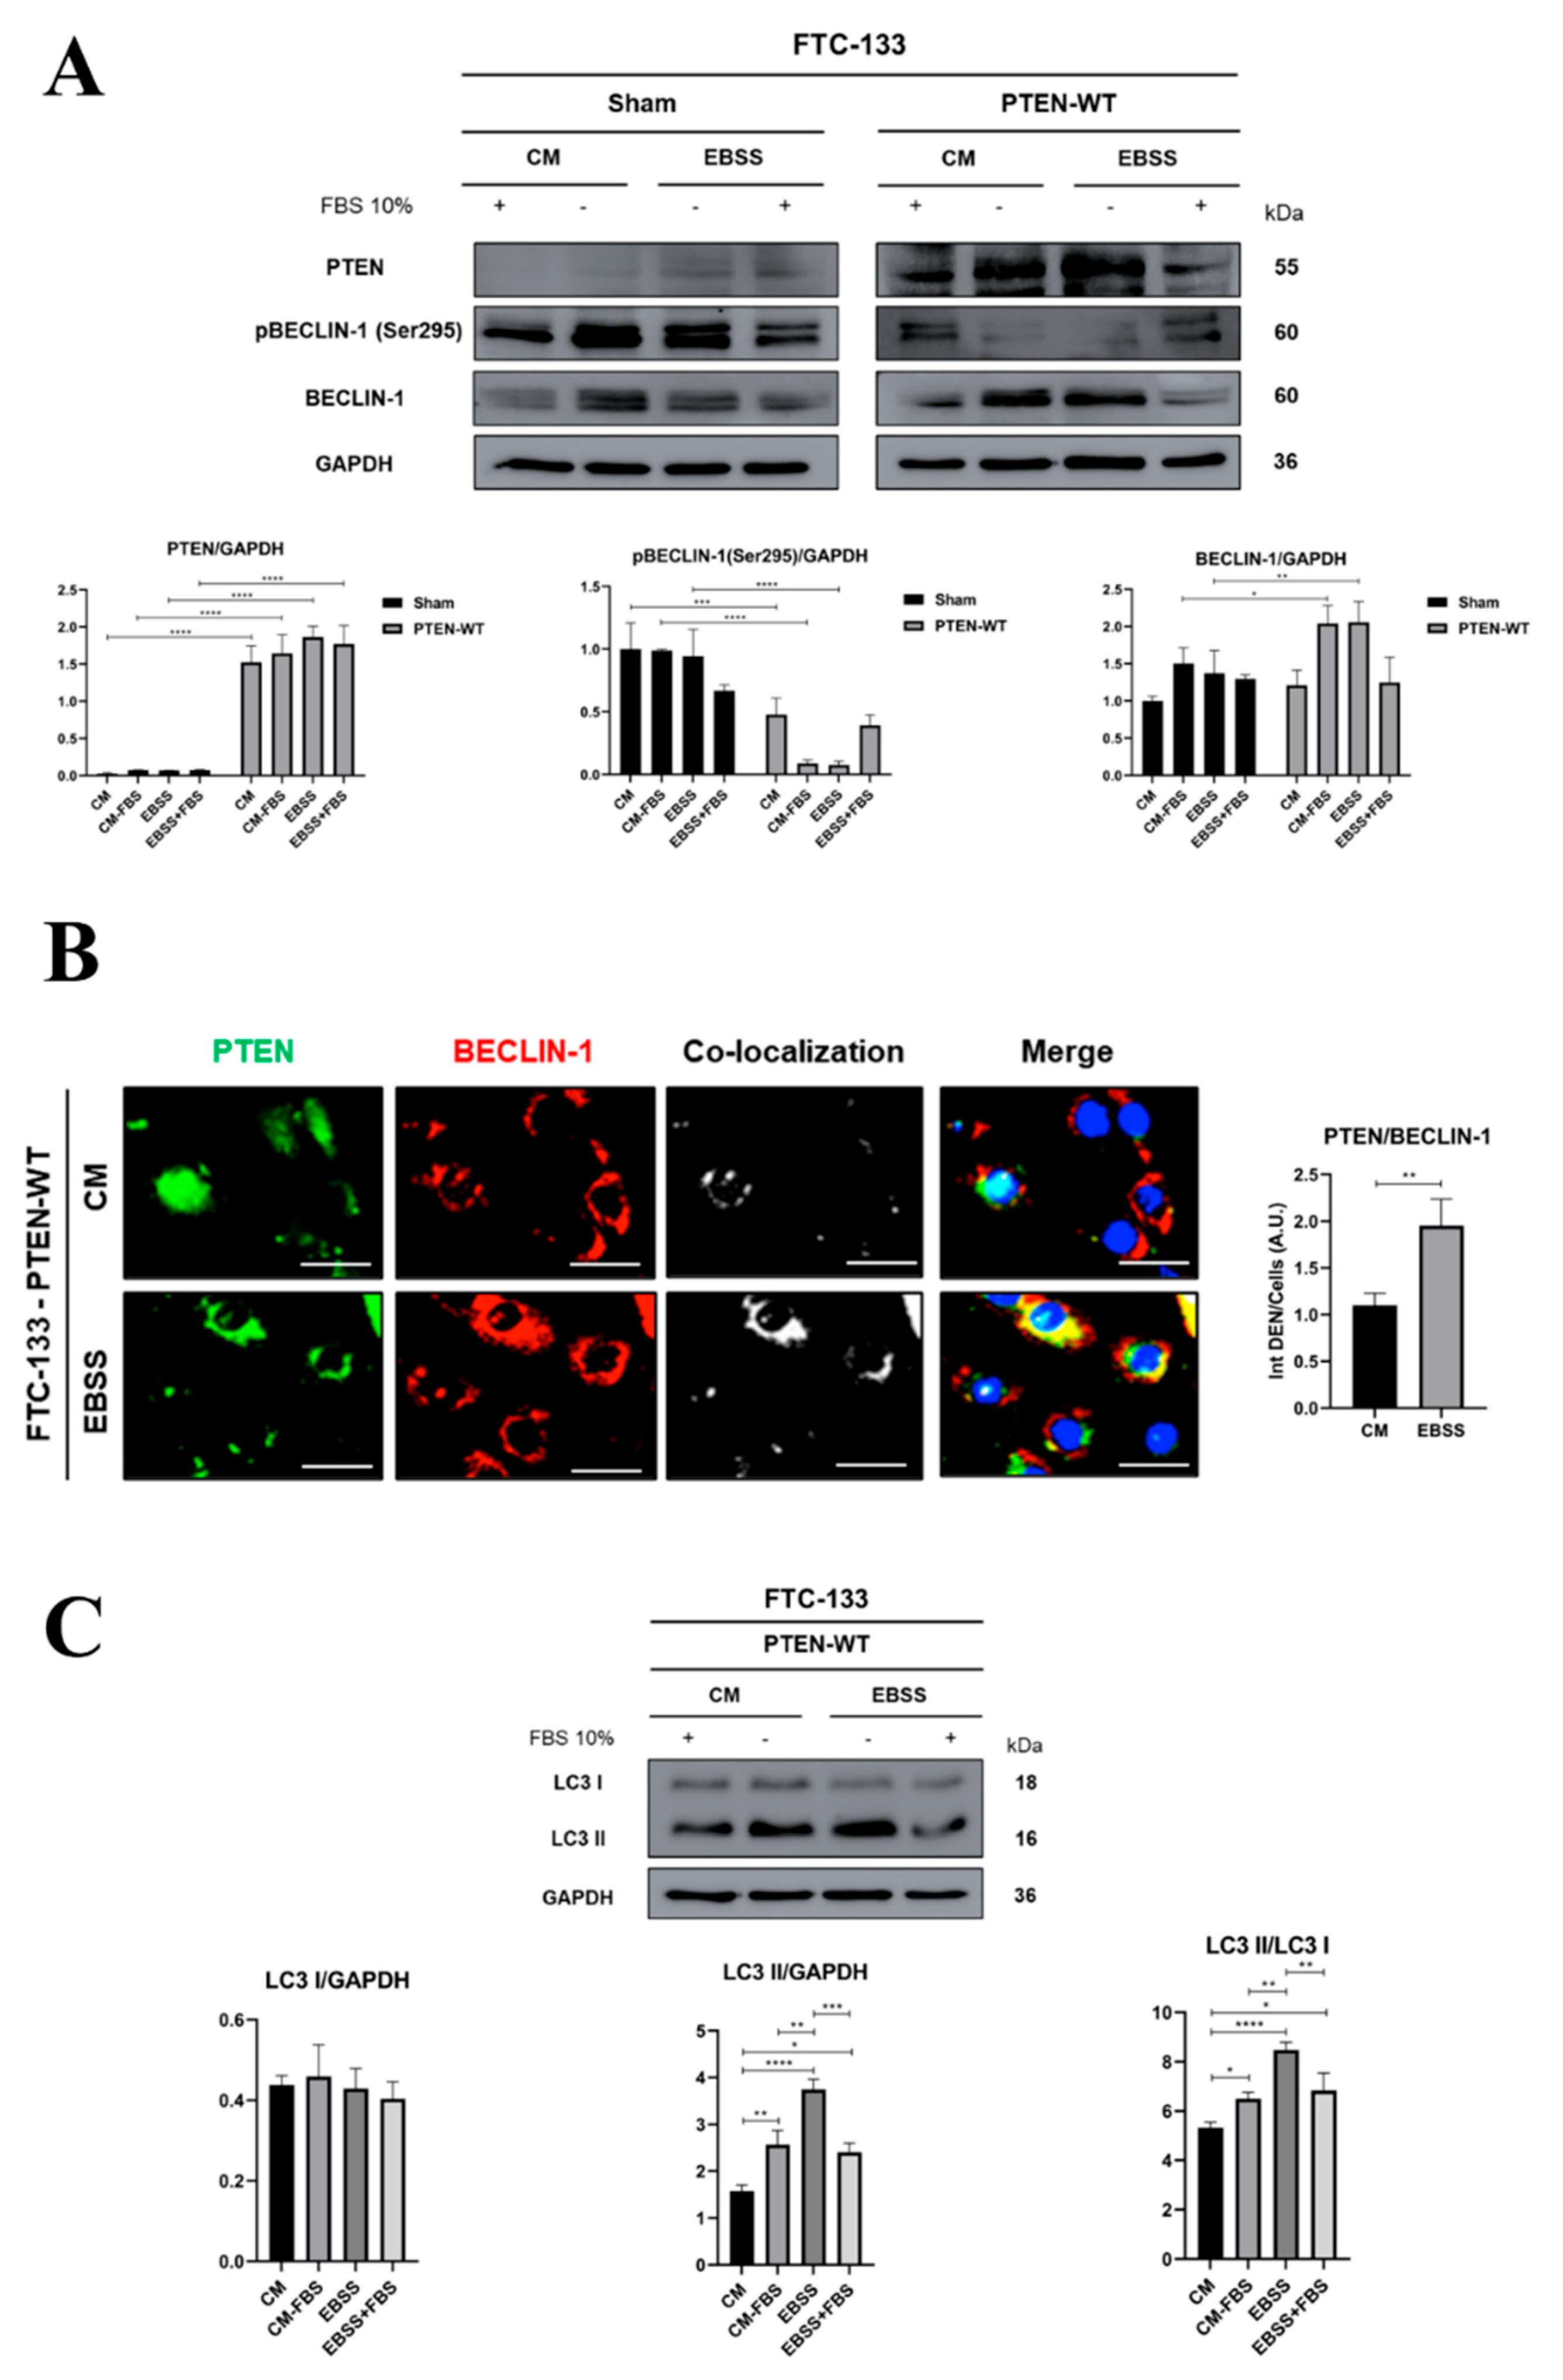
3.3. PTEN Protein Phosphatase Domain Is Mandatory for BECLIN-1 Dephosphorylation and Formation of the Autophagy Interactome

PTEN is a dual-specific phosphatase endowed with both lipid and protein phosphatase activities. To investigate whether the protein phosphatase function of PTEN is necessary and sufficient to mediate BECLIN-1 dephosphorylation at Ser295, FTC-133 cells were transfected with the PTEN-G129E mutant, which selectively lacks lipid phosphatase activity while retaining protein phosphatase function [18]. Bioinformatic analysis predicted that the G129E mutation does not disrupt the PTEN–BECLIN-1 interaction (Figure 5A). Further, the expression of PTEN-G129E in FTC-133 cells resulted in a marked dephosphorylation of BECLIN-1 at Ser295 under both serum-deprived and nutrient-deprived conditions, compared to Sham-transfected controls (Figure 5B).
To determine whether BECLIN-1 Ser295 dephosphorylation by PTEN protein phosphatase activity can be translated even into functional modulation of autophagy, we next analyzed the autophagic flux by monitoring the LC3 conversion. Our data showed that the expression of PTEN-G129E led to a substantial increase in autophagy, as indicated by a pronounced decrease in LC3 I levels and a concomitant strong accumulation of LC3 II (Figure 5C). Although EBSS treatment elicited the highest upregulation of autophagy, PTEN-G129E expression significantly enhanced autophagic activity even under basal conditions.

3.4. High PTEN and MAP1LC3B Expression Correlates with a Better Prognosis in Cancer Patients

To give clinical relevance to our data, we interrogated the cBioPortal database (https://www.cbioportal.org) to assess the prognostic value of PTEN-dependent autophagy across multiple cancers. We selected Thyroid Cancer (TCGA-THCA), Breast Cancer (BRCA-METABRIC), Neuroblastoma (NBL-TARGET-2018), and Kidney Renal Cell Carcinoma (TCGA-KIRC). We established a dual-gene signature based on the co-expression of PTEN and MAP1LC3B, stratifying the cohorts into ‘High-Autophagy’ (High PTEN/High MAP1LC3B) and ‘Low-Autophagy’ (Low PTEN/Low MAP1LC3B) subgroups, and in the selected cancer contexts. The results show that high autophagy correlated with significantly improved overall survival if compared to that of patients with low autophagy (p = 0.0016, p = 0.0011, p = 0.015, p = 0.00052). Our results show that patients with combined high expression of PTEN and MAP1LC3B have a better prognosis compared to patients with low expression levels of both genes. These data indicate that the PTEN-MAP1LC3B axis, as a readout for autophagy, can be considered as a prognostic signature for dividing patients into high and low-risk groups.

4. Discussion

Autophagy is a conserved cellular process essential for adaptation to metabolic stress and maintenance of cellular homeostasis through lysosomal degradation of cytoplasmic components [1,2,27], and it is tightly regulated by nutrient and growth factor availability through signaling pathways that converge on the autophagy initiation machinery [28].
Among these, the PI3K-AKT-mTORC1 axis plays a central role in autophagy regulation, and it is frequently dysregulated in cancer, contributing to tumorigenesis, metastasis, and therapy resistance [29]. Upon growth factor and cytokine stimulation, PI3K phosphorylates PIP2 to generate PIP3, leading to AKT activation [30]. Activated AKT modulates autophagy through two parallel mechanisms: activation of mTORC1 via phosphorylation of the TSC1/TSC2 complex, and phosphorylation of BECLIN-1 at Ser295 [16,31]. mTORC1 activation suppresses autophagy initiation by sequestering TFEB in the cytoplasm and phosphorylating ULK1 [32,33], while AKT-mediated phosphorylation of BECLIN-1 at Ser295, a critical residue for VPS34 complex assembly, limits the autophagosome formation [16].
Under physiological conditions, the tumor suppressor PTEN tightly restrains this signaling cascade, primarily through its lipid phosphatase activity, which reduces PIP3 levels and consequently limits AKT activation [34,35]. We hypothesized that loss of functional PTEN would sustain AKT-mediated phosphorylation of BECLIN-1 at Ser295, maintaining repression of the autophagy machinery even under nutrient and serum-deprived conditions that normally induce autophagy. Consistent with this hypothesis, PTEN-null FTC-133 cells exhibited persistent BECLIN-1 Ser295 phosphorylation and a marked accumulation of LC3 I, indicating impaired conversion to lipidated LC3 II and reduced autophagic flux.
Beyond its canonical lipid phosphatase activity, accumulating evidence highlights the importance of PTEN’s protein phosphatase function. While PTEN is known to dephosphorylate targets such as FAK, β-Catenin, and AKT to regulate migration, survival, and glycolysis [17,18,19,35,36], our results demonstrate that PTEN directly interacts with BECLIN-1 and, via its protein phosphatase activity, dephosphorylates Ser295. Expression of the PTEN-G129E mutant [18], which retains protein phosphatase but lacks lipid phosphatase activity, was sufficient to induce BECLIN-1 Ser295 dephosphorylation and restore autophagic flux, as evidenced by pronounced LC3 I to LC3 II conversion even under basal conditions, with maximal effect upon EBSS-mediated nutrient deprivation. This further rules out the possibility that PTEN could interfere with BECLIN-1 phosphorylation by preventing AKT activation.
These findings indicate that PTEN exerts a dual regulatory role on autophagy: upstream by limiting AKT activation through lipid phosphatase activity, and downstream by directly relieving BECLIN-1 inhibition through protein phosphatase activity. Consequently, PTEN loss results in sustained BECLIN-1 phosphorylation, reduced autophagic flux, and accumulation of inactive LC3 I, highlighting a critical mechanism by which PTEN modulates autophagy in cancer cells.
To extend previous studies linking low PTEN expression to poor clinical outcomes [37,38,39], we investigated the translational relevance of PTEN-dependent autophagy regulation. Using a bioinformatic approach, we assessed the prognostic impact of co-expression of PTEN and MAP1LC3B, as a readout of autophagic activity. Across multiple tumor types, patients with concomitantly high PTEN and MAP1LC3B expression displayed a significantly improved overall survival.
These results indicate that PTEN expression, together with sustained autophagic activity, is associated with a more favorable clinical outcome. In the context of our mechanistic findings, this correlation suggests that the PTEN-autophagic axis may possess prognostic significance and could potentially serve as a biomarker for patient stratification.
Overall, our study identifies PTEN as a key regulator of autophagy through an AKT-independent mechanism and links molecular control of BECLIN-1 activity to clinically relevant outcomes. These findings highlight the importance of PTEN-dependent autophagic competence in shaping cancer progression and patient prognosis.

5. Conclusions

Overall, these findings identify an additional, AKT-independent mechanism by which PTEN regulates autophagy. Beyond its canonical role in modulating autophagy through the PI3K/AKT pathway, PTEN directly interacts with BECLIN-1 and promotes its dephosphorylation at Ser295 via its protein phosphatase activity and enhances autophagic flux under starvation conditions.

Abbreviation

The following abbreviations are used in this manuscript:
CM Control Media
ClQ Chloroquine
EBSS Earle’s Balanced Salt Solution
FBS Fetal Bovine Serum
Ser295 Serine 295

Author Contributions

Conceptualization, A.C. and C.I.; validation, U.W., C.L., C.M., A.F., A.C., and C.V.; formal analysis, U.W., C.L., A.F., and C.V.; bioinformatic analysis, U.W.; figure preparations, C.L., U.W., and A.F.; writing—original draft preparation, C.L., U.W., and A.C.; writing—review, editing, and supervision, C.I., and D.N.D. All authors have read and agreed to the published version of the manuscript.

Funding

This research received no external funding.

Institutional Review Board Statement

Not applicable.

Informed Consent Statement

Not applicable.

Data Availability Statement

All data and materials are published in the manuscript.

Acknowledgments

U.W. is the recipient of a PhD fellowship granted by Comoli, Ferrari & SpA (Novara, Italy). C.L. is the recipient of a PhD fellowship granted by Next-Generation EU-MUR (Rome, Italy). The fluorescence microscope was donated by Comoli, Ferrari & SpA (Novara, Italy). The authors give thanks to the Associazione per la Ricerca Medica Ippocrate-Rhazi (ARM-IR, Novara, Italy) for the support. The authors are grateful for the support of the Consorzio Interuniversitario per le Biotecnologie (CIB, Trieste, Italy).

Conflicts of Interest

The authors declare no conflicts of interest.

References

  1. Niu, X; You, Q; Hou, K; Tian, Y; Wei, P; Zhu, Y; Gao, B; Ashrafizadeh, M; Aref, AR; Kalbasi, A; Cañadas, I; Sethi, G; Tergaonkar, V; Wang, L; Lin, Y; Kang, D; Klionsky, DJ. Autophagy in cancer development, immune evasion, and drug resistance. Drug Resist Updat. 2025, 78, 101170. [Google Scholar] [CrossRef] [PubMed]
  2. Mizushima, N. A brief history of autophagy from cell biology to physiology and disease. Nat Cell Biol. 2018, 20(5), 521–527. [Google Scholar] [CrossRef] [PubMed]
  3. Gómez-Virgilio, L; Silva-Lucero, MD; Flores-Morelos, DS; Gallardo-Nieto, J; Lopez-Toledo, G; Abarca-Fernandez, AM; Zacapala-Gómez, AE; Luna-Muñoz, J; Montiel-Sosa, F; Soto-Rojas, LO; Pacheco-Herrero, M; Cardenas-Aguayo, MD. Autophagy: A Key Regulator of Homeostasis and Disease: An Overview of Molecular Mechanisms and Modulators. Cells 2022, 11(15), 2262. [Google Scholar] [CrossRef] [PubMed] [PubMed Central]
  4. Kang, R; Zeh, HJ; Lotze, MT; Tang, D. The Beclin 1 network regulates autophagy and apoptosis. Cell Death Differ 2011, 18(4), 571–80. [Google Scholar] [CrossRef] [PubMed] [PubMed Central]
  5. Tran, S; Fairlie, WD; Lee, EF. BECLIN1: Protein Structure, Function and Regulation. Cells 2021, 10(6), 1522. [Google Scholar] [CrossRef] [PubMed] [PubMed Central]
  6. Itakura, E; Kishi, C; Inoue, K; Mizushima, N. Beclin 1 forms two distinct phosphatidylinositol 3-kinase complexes with mammalian Atg14 and UVRAG. Mol Biol Cell 2008, 19(12), 5360–72. [Google Scholar] [CrossRef] [PubMed] [PubMed Central]
  7. Maheshwari, C; Castiglioni, A; Walusimbi, U; Vidoni, C; Ferraresi, A; Dhanasekaran, DN; Isidoro, C. The Biological Role and Clinical Significance of BECLIN-1 in Cancer. Int J Mol Sci 2025, 26(19), 9380. [Google Scholar] [CrossRef] [PubMed] [PubMed Central]
  8. Salwa, A; Ferraresi, A; Secomandi, E; Vallino, L; Moia, R; Patriarca, A; Garavaglia, B; Gaidano, G; Isidoro, C. High BECN1 Expression Negatively Correlates with BCL2 Expression and Predicts Better Prognosis in Diffuse Large B-Cell Lymphoma: Role of Autophagy. Cells 2023, 12(15), 1924. [Google Scholar] [CrossRef] [PubMed] [PubMed Central]
  9. Zheng, T; Li, D; He, Z; Feng, S; Zhao, S. Prognostic and clinicopathological significance of Beclin-1 in non-small-cell lung cancer: a meta-analysis. Onco Targets Ther 2018, 11, 4167–4175. [Google Scholar] [CrossRef] [PubMed] [PubMed Central]
  10. Zheng, HC; Zhao, S; Xue, H; Zhao, EH; Jiang, HM; Hao, CL. The Roles of Beclin 1 Expression in Gastric Cancer: A Marker for Carcinogenesis, Aggressive Behaviors and Favorable Prognosis, and a Target of Gene Therapy. Front Oncol. 2020, 10, 613679. [Google Scholar] [CrossRef] [PubMed] [PubMed Central]
  11. Xu, Z; Han, X; Ou, D; Liu, T; Li, Z; Jiang, G; Liu, J; Zhang, J. Targeting PI3K/AKT/mTOR-mediated autophagy for tumor therapy. Appl Microbiol Biotechnol 2020, 104(2), 575–587. [Google Scholar] [CrossRef] [PubMed]
  12. Zhang, HP; Jiang, RY; Zhu, JY; Sun, KN; Huang, Y; Zhou, HH; Zheng, YB; Wang, XJ. PI3K/AKT/mTOR signaling pathway: an important driver and therapeutic target in triple-negative breast cancer. Breast Cancer 2024, 31(4), 539–551. [Google Scholar] [CrossRef] [PubMed] [PubMed Central]
  13. Miricescu, D; Totan, A; Stanescu-Spinu, II; Badoiu, SC; Stefani, C; Greabu, M. PI3K/AKT/mTOR Signaling Pathway in Breast Cancer: From Molecular Landscape to Clinical Aspects. Int J Mol Sci. 2020, 22(1), 173. [Google Scholar] [CrossRef] [PubMed] [PubMed Central]
  14. Pareek, G; Kundu, M. Physiological functions of ULK1/2. J Mol Biol. 2024, 436(15), 168472. [Google Scholar] [CrossRef] [PubMed] [PubMed Central]
  15. Melick, CH; Jewell, JL. Regulation of mTORC1 by Upstream Stimuli. Genes (Basel) 2020, 11(9), 989. [Google Scholar] [CrossRef] [PubMed] [PubMed Central]
  16. Wang, RC; Wei, Y; An, Z; Zou, Z; Xiao, G; Bhagat, G; White, M; Reichelt, J; Levine, B. Akt-mediated regulation of autophagy and tumorigenesis through Beclin 1 phosphorylation. Science 2012, 338(6109), 956–9. [Google Scholar] [CrossRef] [PubMed] [PubMed Central]
  17. Papa, A; Pandolfi, PP. The PTEN⁻PI3K Axis in Cancer. Biomolecules 2019, 9(4), 153. [Google Scholar] [CrossRef] [PubMed] [PubMed Central]
  18. Phadngam, S; Castiglioni, A; Ferraresi, A; Morani, F; Follo, C; Isidoro, C. PTEN dephosphorylates AKT to prevent the expression of GLUT1 on plasmamembrane and to limit glucose consumption in cancer cells. Oncotarget 2016, 7(51), 84999–85020. [Google Scholar] [CrossRef]
  19. Morani, F; Phadngam, S; Follo, C; Titone, R; Aimaretti, G; Galetto, A; Alabiso, O; Isidoro, C. PTEN regulates plasma membrane expression of glucose transporter 1 and glucose uptake in thyroid cancer cells. J Mol Endocrinol. 2014, 53(2), 247–58. [Google Scholar] [CrossRef] [PubMed]
  20. Alobid, S. Targeting the PI3K/AKT/mTOR signaling pathway in prostate cancer: Molecular dysregulation, therapeutic advances, and future directions. Saudi Pharm J 2026, 34(1), 2. [Google Scholar] [CrossRef] [PubMed] [PubMed Central]
  21. Shi, Y; Wang, J; Chandarlapaty, S; Cross, J; Thompson, C; Rosen, N; Jiang, X. PTEN is a protein tyrosine phosphatase for IRS1. Nat Struct Mol Biol. 2014, 21(6), 522–7. [Google Scholar] [CrossRef] [PubMed] [PubMed Central]
  22. Feng, J; Liang, J; Li, J; Li, Y; Liang, H; Zhao, X; McNutt, MA; Yin, Y. PTEN Controls the DNA Replication Process through MCM2 in Response to Replicative Stress. Cell Rep. 2015, 13(7), 1295–1303. [Google Scholar] [CrossRef] [PubMed]
  23. Yan, Y; Tao, H; He, J; Huang, SY. The HDOCK server for integrated protein-protein docking. Nat Protoc 2020, 15(5), 1829–1852. [Google Scholar] [CrossRef] [PubMed]
  24. Morani, F; Phadngam, S; Follo, C; Titone, R; Thongrakard, V; Galetto, A; Alabiso, O; Isidoro, C. PTEN deficiency and mutant p53 confer glucose-addiction to thyroid cancer cells: impact of glucose depletion on cell proliferation, cell survival, autophagy and cell migration. Genes Cancer 2014, 5(7-8), 226–39. [Google Scholar] [CrossRef] [PubMed] [PubMed Central]
  25. Weng, LP; Gimm, O; Kum, JB; Smith, WM; Zhou, XP; Wynford-Thomas, D; Leone, G; Eng, C. Transient ectopic expression of PTEN in thyroid cancer cell lines induces cell cycle arrest and cell type-dependent cell death. Hum Mol Genet. 2001, 10(3), 251–8. [Google Scholar] [CrossRef] [PubMed]
  26. Vidoni, C; Ferraresi, A; Seca, C; Secomandi, E; Isidoro, C. Methods for Monitoring Macroautophagy in Pancreatic Cancer Cells. Methods Mol Biol. 2019, 1882, 197–206. [Google Scholar] [CrossRef] [PubMed]
  27. Levy, JMM; Towers, CG; Thorburn, A. Targeting autophagy in cancer. Nat Rev Cancer 2017, 17(9), 528–542. [Google Scholar] [CrossRef] [PubMed] [PubMed Central]
  28. Russell, RC; Yuan, HX; Guan, KL. Autophagy regulation by nutrient signaling. Cell Res 2014, 24(1), 42–57. [Google Scholar] [CrossRef] [PubMed] [PubMed Central]
  29. Jiang, M; Zhang, K; Zhang, Z; Zeng, X; Huang, Z; Qin, P; Xie, Z; Cai, X; Ashrafizadeh, M; Tian, Y; Wei, R. PI3K/AKT/mTOR Axis in Cancer: From Pathogenesis to Treatment. MedComm (2020) 2025, 6(8), e70295. [Google Scholar] [CrossRef] [PubMed] [PubMed Central]
  30. He, Y; Sun, MM; Zhang, GG; Yang, J; Chen, KS; Xu, WW; Li, B. Targeting PI3K/Akt signal transduction for cancer therapy. Signal Transduct Target Ther 2021, 6(1), 425. [Google Scholar] [CrossRef] [PubMed] [PubMed Central]
  31. Liu, R; Chen, Y; Liu, G; Li, C; Song, Y; Cao, Z; Li, W; Hu, J; Lu, C; Liu, Y. PI3K/AKT pathway as a key link modulates the multidrug resistance of cancers. Cell Death Dis. 2020, 11(9), 797. [Google Scholar] [CrossRef] [PubMed] [PubMed Central]
  32. Vega-Rubin-de-Celis, S; Peña-Llopis, S; Konda, M; Brugarolas, J. Multistep regulation of TFEB by MTORC1. Autophagy 2017, 13(3), 464–472. [Google Scholar] [CrossRef] [PubMed] [PubMed Central]
  33. Kim, J; Kundu, M; Viollet, B; Guan, KL. AMPK and mTOR regulate autophagy through direct phosphorylation of Ulk1. Nat Cell Biol. 2011, 13(2), 132–41. [Google Scholar] [CrossRef] [PubMed] [PubMed Central]
  34. Lyu, J; Yu, X; He, L; Cheng, T; Zhou, J; Cheng, C; Chen, Z; Cheng, G; Qiu, Z; Zhou, W. The protein phosphatase activity of PTEN is essential for regulating neural stem cell differentiation. Mol Brain 2015, 8, 26. [Google Scholar] [CrossRef] [PubMed] [PubMed Central]
  35. Liu, A; Zhu, Y; Chen, W; Merlino, G; Yu, Y. PTEN Dual Lipid- and Protein-Phosphatase Function in Tumor Progression. Cancers (Basel) 2022, 14(15), 3666. [Google Scholar] [CrossRef] [PubMed] [PubMed Central]
  36. Xu, X; Bok, I; Jasani, N; Wang, K; Chadourne, M; Mecozzi, N; Deng, O; Welsh, EA; Kinose, F; Rix, U; Karreth, FA. PTEN Lipid Phosphatase Activity Suppresses Melanoma Formation by Opposing an AKT/mTOR/FRA1 Signaling Axis. Cancer Res. 2024, 84(3), 388–404. [Google Scholar] [CrossRef] [PubMed] [PubMed Central]
  37. Xiao, J; Hu, CP; He, BX; Chen, X; Lu, XX; Xie, MX; Li, W; He, SY; You, SJ; Chen, Q. PTEN expression is a prognostic marker for patients with non-small cell lung cancer: a systematic review and meta-analysis of the literature. Oncotarget 2016, 7(36), 57832–57840. [Google Scholar] [CrossRef] [PubMed] [PubMed Central]
  38. Qiu, ZX; Zhao, S; Li, L; Li, WM. Loss of Expression of PTEN is Associated with Worse Prognosis in Patients with Cancer. Asian Pac J Cancer Prev. 2015, 16(11), 4691–8. [Google Scholar] [CrossRef] [PubMed]
  39. da Costa, AA; D’Almeida Costa, F; Ribeiro, AR; Guimarães, AP; Chinen, LT; Lopes, CA; de Lima, VC. Low PTEN expression is associated with worse overall survival in head and neck squamous cell carcinoma patients treated with chemotherapy and cetuximab. Int J Clin Oncol 2015, 20(2), 282–9. [Google Scholar] [CrossRef] [PubMed]
Figure 1. FTC-133 cells are more sensitive to serum inhibition of autophagy. WRO and FTC-133 cells were plated and incubated for 4h in CM (A) or EBSS (B), with or without 10% FBS, in the presence or absence of 30µM chloroquine (ClQ). The expressions of LC3 I, LC3 II, and β-Actin as a loading control were analyzed by immunoblotting of cell homogenates. Densitometric analysis of the immunoblotting was represented as LC3 I/β-Actin, LC3 II/β-Actin, and LC3 II/LC3I ratios as a measure of autophagosome formation. Histograms report data ± SD representing three independent replicates. A two-way ANOVA test was performed. Significance was considered as follows: **** p < 0.0001; *** p < 0.001, ** p < 0.01, * p < 0.05. (C) WRO and FTC-133 cells were plated on sterile coverslips and exposed to EBSS in the presence or absence of FBS (10%). After 4h, the cells were fixed and stained for LC3 (green) and LAMP1 (red). Nuclei were stained with DAPI. Quantification of fluorescence intensities was performed using the ImageJ software. Histogram reports the average ± S.D calculated on three different fields for each condition in the experiment. A two-way ANOVA test was performed. Significance was considered as follows: **** p < 0.0001; *** p < 0.001. Scale bar = 20µm.
Preprints 197887 g001
Figure 2. PTEN-deficient cells display persistent BECLIN-1 Ser295 phosphorylation and impaired autophagy. (A) WRO and FTC-133 cells were plated and incubated for 4h in CM or EBSS, with or without 10% FBS. Cell homogenates were analyzed through western blotting for the expression of pBECLIN-1 (Ser295), BECLIN-1, LC3 I, and LC3 II. β-Actin was used as a loading control. Densitometric analysis of the immunoblotting was represented as pBECLIN-1/β-Actin, BECLIN-1/β-Actin, LC3 I/β-Actin, LC3 II/β-Actin, and LC3 II/LC3I ratios as a measure of autophagosome formation. Histograms report data ± SD representing three independent replicates. A two-way ANOVA test was performed. Significance was considered as follows: **** p < 0.0001.
Preprints 197887 g002
Figure 3. PTEN physically interacts with BECLIN-1 and promotes Ser295 dephosphorylation during starvation. (A) WRO cells were plated on Petri dishes and exposed to complete media (CM) or nutrient and serum deprivation (EBSS) for 2 and 4 hours. Cells were then processed for the immunoprecipitation of PTEN or for the western blotting analysis for BECLIN-1, p-BECLIN-1 (Ser295), PTEN, and LC3. β-Actin and GAPDH were used as a loading control. Densitometric analysis of the blots is reported. Significance was considered as follows: **** p < 0.0001; *** p < 0.001; ** p < 0.01. (B) In silico protein-protein docking analysis of PTEN and BECLIN-1 was performed using the HDOCK server. The Docking score and the Confidence score of the interaction are reported.
Preprints 197887 g003
Figure 4. PTEN overexpression induces BECLIN-1 Ser295 dephosphorylation and enhances autophagy in FTC-133 cells. (A) FTC-133 cells were plated in Petri dishes, transfected with either Sham or PTEN-WT plasmid and exposed for 4h to serum deprivation or combined nutrient and serum deprivation (EBSS), where indicated. Cell lysates were analyzed by western blotting for total PTEN, p-BECLIN-1 (Ser295), and BECLIN-1. GAPDH was used as a loading control. Densitometric analysis of the blots is reported. (B) FTC-133 PTEN-WT-overexpressing cells were fixed and subjected to immunofluorescence staining for PTEN (green) and BECLIN-1 (red). Nuclei were stained with DAPI. Colocalization (yellow signal) was observed under serum and nutrient deprivation. Scale bar= 20µm. (C) FTC-133 cells were transfected with the PTEN-WT plasmid, cultivated as previously described, and analyzed through western blotting for the expression of LC3 and GAPDH as a loading control. Densitometric analysis is reported. Significance was considered as follows: **** p < 0.0001; *** p < 0.001; ** p < 0.01; * p < 0.05.
Preprints 197887 g004
Figure 5. BECLIN-1 Ser295 dephosphorylation depends on the protein phosphatase activity of PTEN. (A) In silico protein-protein interaction of PTEN-G129E and BECLIN-1 was performed using the HDOCK server. The Docking score and the Confidence score of the interaction are reported. (B) FTC-133 cells were seeded in Petri dishes, transfected with either Sham or PTEN-G129E plasmid and exposed for 4h to serum deprivation or combined nutrient and serum deprivation (EBSS), where indicated after 36h from the transfection. Cell lysates were analyzed by western blotting for total PTEN, p-BECLIN-1 (Ser295), and BECLIN-1. GAPDH was used as a loading control. (C) FTC-133 cells were transfected with PTEN-G129E and cultivated as previously described. Cell lysates were analyzed by western blotting for LC3, and GAPDH was used as a loading control. Densitometric analysis of the blots is reported. Significance was considered as follows: **** p < 0.0001; *** p < 0.001; ** p < 0.01; * p < 0.05.
Preprints 197887 g005
Figure 6. High expression of PTEN and MAP1LC3 is associated with a better prognosis. Box-plots showing the distribution of patients according to PTEN and MAP1LC3B expression and the corresponding Overall Survival in (A) TCGA-THCA; (B) BRCA-METABRIC; (C) NBL-TARGET-2018; (D) TCGA-KIRC.
Preprints 197887 g006
Figure 7. Schematic representation of the PTEN–BECLIN-1 regulatory mechanism. Under starvation conditions, PTEN physically interacts with BECLIN-1, promoting its dephosphorylation at Ser295. This dephosphorylation event facilitates the activation of autophagic machinery, ultimately leading to the induction of the autophagic process.
Preprints 197887 g007
Disclaimer/Publisher’s Note: The statements, opinions and data contained in all publications are solely those of the individual author(s) and contributor(s) and not of MDPI and/or the editor(s). MDPI and/or the editor(s) disclaim responsibility for any injury to people or property resulting from any ideas, methods, instructions or products referred to in the content.
Copyright: This open access article is published under a Creative Commons CC BY 4.0 license, which permit the free download, distribution, and reuse, provided that the author and preprint are cited in any reuse.
Prerpints.org logo

Preprints.org is a free preprint server supported by MDPI in Basel, Switzerland.

Subscribe

Disclaimer

Terms of Use

Privacy Policy

Privacy Settings

© 2026 MDPI (Basel, Switzerland) unless otherwise stated