
Submitted:
05 February 2026
Posted:
06 February 2026
You are already at the latest version
Abstract
Background: Modern agriculture is undergoing a paradigm shift toward eco-friendly methodologies that enhance seed material quality while minimizing chemical inputs. This study evaluates the impact of Effective Microorganism (EM) exposure (variants E1 and E2) on the morpho-physiological parameters and phytosanitary health of potato tubers. The primary objective was to determine the efficacy of microbial priming in suppressing the infection rates of Streptomyces scabies (common scab) and Rhizoctonia solani (black scurf) across 14 genetically diverse cultivars. Methods: A three-year field experiment (2019–2021) was conducted using a split-plot design with three replications. The study analyzed the interaction between EM exposure times and the genetic resistance potential of the selected cultivars. Results: Statistical analysis confirmed that pre-planting microbial treatments significantly inhibited pathogen development. EM applications (E1 and E2) reduced the infection rates of both S. scabies and R. solani through an "escape mechanism," whereby treated tubers exhibited accelerated biomass accumulation and reached physiological maturity before peak pathogen pressure. Furthermore, treatments optimized the hormonal status and vigor of the tubers, establishing a robust physiological barrier against soil-borne infections. Conclusions: The application of EM proves to be a highly effective, non-invasive biostimulation method. A significant synergistic effect was observed between EM treatments and the cultivars' innate genetic resistance, particularly in cultivars with higher baseline resistance. The results suggest that microbial priming not only enhances plant growth kinetics but also induces systemic resistance, offering a viable ecological alternative to traditional chemical seed dressings in sustainable potato production.
Keywords:
potato
; Rhizoctonia solani (R. solani)
; Streptomyces scabies (S. scabies)
; effective microorganisms (EM)
; ecological agriculture
; phytosanitary quality
; microbial priming
; natural crop protection
1. Introduction
Modern agronomy is at a turning point, determined by the necessity to redefine the paradigm of efficiency. The global challenge of ensuring food security while simultaneously fulfilling the objectives of the Farm to Fork Strategy and the European Green Deal necessitates a radical departure from conventional, synthetic plant protection methods toward pro-ecological and low-input solutions [1,2,3,4].
Problematic Context and Innovative Approach: The potato (Solanum tuberosum L.), a key link in the global food chain, exhibits high susceptibility to a complex of soil-borne pathogens. Among these, S. scabies (the causal agent of common scab) and R. solani (the causal agent of black scurf/rhizoctonia) generate the greatest quality losses. The innovation of this research is reflected in the utilization of the biotechnological potential of EM(EM) as an alternative to synthetic fungicides being withdrawn from the market [4,5,6].
The Holistic Concept of Priming: Unlike classical chemical protection, the application of microbiological preparations is not limited to the direct elimination of the pathogen [5,6,7]. This is a holistic approach based on the concept of priming – stimulating the plant to reach a state of defensive readiness. This process induces a cascade of biochemical reactions, leading to the strengthening of physiological barriers even before actual infection pressure occurs [7].
Resistance Mechanisms
Our research aligns with the current trends in biological agrochemistry by investigating the phenomenon of Nonspecific Systemic Resistance (NSR) [8,9]. NSR is a broad concept encompassing the mechanisms through which a plant, upon contact with an elicitor (e.g., microorganisms from the EM group, beneficial fungi, or chemical compounds), activates its defensive resources throughout the entire organism rather than just at the site of infection. In the context of potato research, NSR is primarily associated with two pathways: ISR (Induced Systemic Resistance), stimulated by PGPR (Plant Growth-Promoting Rhizobacteria), and SAR (Systemic Acquired Resistance), linked to the salicylic acid signaling pathway [10,11]. The utilization of microbial consortia during seed tuber treatment allows for the colonization of the rhizosphere with beneficial strains. Through niche competition and the synthesis of secondary metabolites, these strains establish a natural biological barrier [4,7].
The potato (Solanum tuberosum L.) is characterized by a unique morphological structure in the form of tubers, around which a specific ecological zone called the geocaulosphere is formed. As a soil sub-chamber, the geocaulosphere is a site of intensive metabolic processes related to assimilating storage and serves as a critical habitat for the soil microbiome, which determines plant health both during the growing season and storage [7,12]. Modern agriculture faces the challenge of precise microbiome modulation to impart desired adaptive traits to plants. Specific microbial consortia can significantly enhance plant resistance to abiotic stresses and soil-borne pathogens [7]. Although the communication mechanisms along the plant-bacteria axis still require in-depth analysis, the latest microbiome engineering approaches – including the construction of Synthetic Communities (SynComs)—open new possibilities in crop protection.
Justification for EM-Farming™ Technology Application: The introduction of EMinto the potato geocaulosphere via seed tuber inoculation (treatments E1 and E2) represents a practical implementation of the microbiome management concept [13]. The choice of this method for mitigating S. scabies (common scab) and R. solani (rhizoctonia) is based on the following premises:
Geocaulosphere Supplementation: Inoculation allows for the introduction of a stable community of microorganisms (including lactic acid bacteria, photosynthetic bacteria, and yeasts) directly into the zone where young tubers form, establishing a biological barrier against pathogen colonization [14].
Mitigation of Environmental Stress: According to the concept by Petrushin et al. [7], microbiome modulation is crucial for plant survival under drought conditions. By inducing the production of osmolytes (e.g., trehalose) and strengthening Nonspecific Systemic Resistance (NSR), EM technology helps maintain tuber skin quality even under adverse hydrothermal conditions.
Microbiome Engineering in Practice: The application of EM aligns with the latest trends in microbiome genome engineering, offering an alternative to chemical protection methods [15,16,17]. It operates by restoring soil suppressiveness, which inhibits the development of R. solani sclerotia and limits the activity of S. scabies actinomycetes.
Research Objectives and Hypotheses
The primary objective of this study was to evaluate the impact of geocaulosphere microbiome modulation—through seed tuber inoculation with EM consortia—on the health of various potato cultivars and their ability to mitigate infections caused by S. scabies and R. solani under fluctuating environmental conditions. Verifying the efficacy of two EM exposure variants in relation to the diverse genetic potential of the cultivars allows for a precise determination of genotype-environment interactions in the context of a changing climate.
Based on the assumption that the geocaulosphere is a key space for plant-microbiome communication, the following hypotheses were formulated:
Main Hypothesis: The deliberate modulation of the geocaulosphere microbiome through seed tuber inoculation with EM induces Nonspecific Systemic Resistance (NSR) mechanisms, leading to a significant reduction in tissue colonization by S. scabies and R. solani.
H1: Specific Hypothesis 1 (Exposure Effect): The efficiency of geocaulosphere colonization by synthetic microbial communities is directly proportional to the exposure time of the mother tubers to the inoculum; extending the treatment time to 20 minutes (E2) provides a more durable biological barrier than a 10-minute exposure (E1).
H2: Specific Hypothesis 2 (Environmental Interaction): Microbiome engineering using EM technology demonstrates its highest protective efficiency under abiotic stress (drought), mitigating the negative impact of unfavorable hydrothermal conditions on potato skin quality.
H0: Null Hypothesis: It is assumed that the application of EM preparations, regardless of exposure time or the genetic profile of the cultivars, exerts no measurable effect on tuber health, infection kinetics, or the final quality parameters of the yield.
2. Materials and Methods
2.1. The Experimental Site and Design
2.1.1. Location and Environmental Conditions
The field experiments were conducted over three consecutive growing seasons (2019–2021) at the Experimental Station in Parczew (51°08′N, 22°29′E), Poland [18]. The site is characterized by podzolic soil (Sodic Luvisols) with a sandy-loam texture [19]. Before the commencement of the study, soil analysis was performed to determine the baseline nutrient status, showing a slightly acidic to neutral pH (pHKCl 5.8–6.2) and a moderate content of available phosphorus, potassium, and magnesium [20].
2.1.2. Experimental Design
The study was established using a randomized split-plot design in three replications. This layout allowed for the simultaneous evaluation of the main effects of microbial treatments and genetic variability, as well as their mutual interactions.
Factor A (Main Plots): Seed Tuber Biostimulation (Priming)
The primary factor consisted of three variants of pre-planting seed tuber improvement using EM:
- Control (C): Traditional technology; tubers planted without any microbial or physical treatment.
- EM Exposure 1 (E1): Seed tubers immersed in a 10% EM solution for 10 minutes prior to planting.
- EM Exposure 2 (E2): Seed tubers immersed in a 10% EM solution for 20 minutes prior to planting.
Factor B (Sub-plots): Cultivar Diversity
2.2. Agricultural Practices
All agricultural operations, including soil tillage, fertilization, and weed control, were conducted in accordance with the Best Agricultural Practices (BAP) for potato production in Central Europe. Mineral fertilization was applied based on soil test results, with rates balanced at N/P/K = 100/100/150 kg/ha to ensure optimal growth without inducing excessive susceptibility to diseases. No synthetic fungicides were applied to the tubers to allow for a clear evaluation of the EM biostimulation effect.
2.2.1. Characteristics of Potato Cultivars
14 cultivars were selected to evaluate the interaction between genotype-specific resistance and physical biostimulation. Resistance to R. solani and S. scabies was assessed using the international 1–9° scale, where 9.0 indicates complete immunity (Table 1) [21,22,23].
Three groups of cultivars have been distinguished based on their skin health [23]:
Resistance leaders (8.0 on a 9.0° scale) These cultivars perform best in lighter, drier soils, where the risk of scab is highest. Bellarosa is a cultivar with outstanding resistance. Despite its weaker resistance to R. solani, its skin usually remains clean and visually attractive. Vineta: Combines earliness with very high scab resistance.
Cultivars with good and stable resistance (6.5 – 7.0 on a 9.0° scale) Most cultivars maintain a solid standard, which, with proper agricultural practices, guarantees good tuber appearance: Nicola, Korona, Zuzanna, Ewelina: A score of 7.0 is a very safe level of resistance. Czapla and Jelly: (approximately 6.5 on a 9.0° scale) offer decent protection, sufficient for most soil conditions.
Cultivars with increased sensitivity (resistance below 6.0 on a scale of 9.0°). In these cases, it is necessary to avoid fresh liming under potatoes. Red Fantasy (4.0–5.0 on a scale of 9.0°) falls into this category. This is the weakest point of this cultivar. Although it is excellent in culinary terms and resistant to R. solani, it is easily infected with scabs, which may disqualify it from direct sale (as a washed potato). Octane (5.0–6.0 on a scale of 9.0°) has medium resistance and requires irrigation during the tuber setting period to minimize the risk of infection.
To summarize the cultivars tested for resistance to R. solani, it's worth emphasizing that this disease attacks in two phases: first, it causes sprout rot (leading to bare spots in the field), and then it disfigures the tubers with pockmarks [23]. Here's the ranking of cultivars based on this resistance:
Resistance Leaders (Rating 8.0 on a 9.0° scale). These cultivars demonstrate the highest genetic ability to defend against the pathogen. They are recommended for cool and wet springs, when emergence is slow. Roxana (mid-early, edible) and Hinga (late, starchy).
Highly Resistant Cultivars (Rating 7.5 on a 9.0 scale). Very safe to grow, they rarely show pockmark symptoms on tubers. Red Fantasy (mid-early) and Czapla (late, starchy).
Cultivars with good resistance (Rating 7.0 on a 9.0° scale). This standard ensures stable yield while maintaining basic agricultural practices (planting in warm soil). Cultivars: Vineta, Krasa, Nora, and Jelly.
Cultivars with average resistance (Rating 6.0–6.5 on a 9.0° scale), require more attention to site preparation. Pre-planting dressing is recommended for these cultivars. These are the cultivars: Korona, Ewelina, Nicola, Oktan, and Zuzanna.
2.3. Characteristics of the EM Farming™ Microbial Inoculant
The study utilized an innovative biological product based on EM technology, designed for potato seed tuber treatment [13]. A detailed characterization of the preparation is provided below:
Physicochemical Properties and Composition: The EM Farming™ preparation is a yellow-brown liquid with an acidic reaction (pH 3.0–3.5). It contains a multi-strain consortium of beneficial microorganisms, including Lactic Acid Bacteria, yeasts (Saccharomyces), and other microorganisms that support ecosystem regeneration. Due to patent protection and trade secrets, the specific species composition of the strains is proprietary [24].
Mechanism of Action: This technology is based on delivering precisely selected groups of microorganisms to the geocaulosphere, which improve soil health, stimulate plant growth, and restore the biological balance of the environment. They function as "hub microorganisms," modulating the structure of the potato's core microbiome [24].
Safety and Certification: The product holds certificate no. PZH/HT-3112/2016 (EmFarma Plus) issued by the National Institute of Public Health – National Institute of Hygiene (PZH). It has been positively assessed by the Department of Toxicology and Risk Assessment as safe for humans and the natural environment, provided the manufacturer's recommendations are followed [25].
Application in Research: The working solution was prepared by diluting the product in non-chlorinated water, maintaining the concentration strictly recommended by the manufacturer. The treatment process involved soaking the seed tubers in two-time variants (E1 – 10 min; E2 – 20 min), allowing for differentiated colonization of the tuber surface by the introduced inoculum [25].
2.4. Agrotechnical Management and Integrated Plant Protection (IPM)
The field trials were conducted following the principles of Integrated Pest Management (IPM) and Good Agricultural Practice (GAP).
Soil Preparation and Fertilization: The forecrop was spring barley/winter wheat. The nutrition strategy combined organic and mineral inputs:
- −
- Organic: Farmyard manure applied in autumn at a rate of 25 t·ha⁻¹.
- −
- Mineral (Spring): Balanced fertilization was applied before planting: Nitrogen (N): 80–100 kg·ha⁻¹; Phosphorus (P₂O₅): 80 kg·ha⁻¹ (applied as 19% granulated superphosphate); Potassium (K₂O): 100–120 kg·ha⁻¹ (applied as 60% potash salt).
Planting Specifications:
Material: EU Class A/C certified seed potatoes. Date: April 25–27. Method: Manual planting at a density of 40,000 plants·ha⁻¹. Spacing: 67.5 cm (row) x 40 cm (plant). Plot Size: Harvest area of 16.5 m².
Weed Control (Mechanical-Chemical): A hybrid approach was used to ensure clean ridges: Mechanical: Rolling, ridging, and harrowing performed until emergence.
- −
- Chemical (Pre-emergence): Afalon 50 WP (1.5 dm³·ha⁻¹).
- −
- Chemical (Post-emergence): Fusilade Super (1.5 dm³·ha⁻¹) applied at the 2-3 leaf stage of monocotyledonous weeds.
Plant Protection (Pests and Diseases):
Monitoring followed IPP-NRI recommendations, with interventions triggered by economic damage thresholds. Colorado Potato Beetle: Controlled with four rotating sprays: Karate Zeon 050 CS, Kestrel 200 SL, Spintor 240 SC, and Cyperkill Max 500 EC. Late Blight (Phytophthora infestans): Monitored every 10 days. Fungicide applications were often combined with insecticide treatments using Carial Star 500 SC, Curzate 60 WG, Tanos 50 WG and Altima 500 S.C. (Table 2).
Harvest and Sampling:
Timing: Conducted at full technical maturity. Early cultivars were harvested between August 17 and September 22. Sampling: Post-harvest samples of 100 tubers per combination were collected for health assessment and disease identification (Scab, Rhizoctonia, etc.).
Key Takeaways for Management:
Rotation: The use of four different insecticides (Pyrethroids and others) suggests a strategy to prevent pest resistance.
Combined Treatments: To save time and fuel, the insecticide and fungicide treatments were synchronized.
Precision: The use of both WG (Granule) and SC/EC (liquids) indicates a diverse range of chemical groups used to maintain plant health.
2.5. Assessment of Tuber Infection by Fungal and Bacterial Pathogens
Tuber health was assessed visually on samples of 100 tubers from each plot. Analysis was performed based on the 9-point COBORU scale [23], assessing the severity of common scab (S. scabies) and Rhizoctonia (R. solani). The indices were calculated using the following formulas:
Percentage of infected tubers (Wp – Incidence):
Determines the percentage of tubers showing any symptoms of infection (grades 1–8) in the total sample:
where: n – number of tubers with symptoms, N – total number of tubers examined.
Average degree of infection of the sample (Stotal): Illustrates the general health status of the entire batch =
Where: Ni – number of tubers with a given degree of infection, i – scale level (1–9).
Degree of infection of infected tubers (Sinf – Severity): An index defining the severity of the disease only in infected units, which allows for a precise distinction between the prevalence of infection and its intensity:
Where: n – number of exclusively infected tubers.
The severity of common scabs (S. scabies) was assessed by visual inspection of each tuber in the sample, classifying them according to the 9-degree COBORU scale [23]. This scale is based on the percentage of the tuber surface covered by disease lesions. The statistical analysis of the results included three key parameters:
- A.
- Disease Incidence (Wp)
This index determines the prevalence of the pathogen within the sample:
Where: n – number of tubers showing symptoms (ratings 1–8), N – total number of tubers.
- B.
- Disease Severity (Sp)
This parameter describes the average intensity of symptoms for the entire population, including healthy tubers. It allows for an overall assessment of the effectiveness of the treatment:
Where: vi – individual score (1–9) for each tuber in the sample.
- C.
- Severity Among Affected Tubers (Sbp). This index defines the intensity of the disease specifically within the group of infected units. It allows for the evaluation of pathogen virulence independently of the total number of infected tubers:Where: vi – individual score (8–1) for infected tubers only, n – number of infected tubers [23].
2.6. Soil Conditions
Soil conditions are shown in Table 3.
The analysis of soil samples revealed inter-annual variability in the concentration of available nutrients during the study period: Available phosphorus (P2O5): The phosphorus content was the most diverse among the tested nutrients. The highest concentration was recorded in 2020 (21.4 mg 100 g-1), while the lowest was observed in 2021 (16.0 mg 100 g-1). The mean value for the entire research period was 19.2 mg 100 g-1. Available Potassium (K2O): A consistent upward trend was observed in potassium levels, increasing from 11.8 mg 100 g-1 in 2019 to 13.4 mg 100g-1 in 2021, with a three-year average of 12.6 mg 100 g-1. Available Magnesium Mg: The magnesium content also showed an initial increase, peaking in 2020 (8.2 mg 100 g-1) before a slight decrease in 2021 (7.3 mg 100 g-1). The average concentration reached 6.6 mg 100 g-1. Soil Reaction (pH): Throughout the study, the soil acidity remained stable, ranging from slightly acidic to neutral. The pH values fluctuated between 5.8 (2019) and 6.2 (2020), with a multi-year mean of 6.0 (Table 3).
The soil conditions during 2019–2021 were characterized by moderate to high nutrient abundance. While potassium and magnesium levels followed a generally increasing trend, phosphorus levels exhibited the highest annual fluctuation. The stable, slightly acidic pH created favorable conditions for the application of EM, as such environments support the biological activity of lactic acid bacteria and yeast [20].
2.7. Meteorological Conditions
The meteorological data in Table 4 allow for the interpretation of critical moments for the development of pathogens, such as wet May (key for shoot infection by R. solani) or dry June and July (favorable for infection by S. scabies).
Analysis of the Impact of Monthly Dynamics on Tuber Health:
May – Critical Start: In 2019 and 2020, very high hydrothermal coefficients were recorded in May (K = 2.19 and 2.70, respectively), which, combined with cool weather, favored severe primary infections with R. solani (Table 4). Under these conditions, EM inoculation (especially variant E2) acted as a protective shield for emerging shoots.
June/July – Tuber Formation: The extremely dry June of 2019 (K = 0.53) favored the development of common scab (S. scabies) (Table 4). During this period, microbial additives outperformed biological agents, helping plants maintain turgidity and the protective skin barrier.
August 2021 – Pathogen accumulation: Record rainfall in August 2021 (165.2 mm, K = 3.03) led to secondary infection of tubers with R. solani (black spot) and rot, which explains the highest proportion of infected tubers (average 55.8%) recorded in our study for this year (Table 4).
2.8. Statistical Analysis and Advanced Modeling
Statistical inference was performed using a three-way Analysis of Variance (ANOVA) via SAS software [27]. The model evaluated the impact of three primary factors (year, cultivar, and treatment parameters) and their two-way interactions at a significance level of p < 0.05. For significant effects, Tukey’s HSD (Honestly Significant Difference) post-hoc tests were applied for the identification of homogeneous groups. Means were assigned letter indicators in descending order, where the letter ‘a’ denotes the highest value; means sharing the same letter do not differ significantly.
The relationships between key traits were determined using Pearson’s linear correlation coefficient (r) with PSPP software [28]. To further explore the data structure and classify variants, multivariate statistical methods were employed:
3. Results
3.1. Infection of Tubers with Common Scab
This trait measures the disease incidence – the percentage of the entire collected tuber sample showing scab symptoms. Treatments with EMsignificantly reduced the proportion of infected tubers compared to the control treatment, which did not use them. Among the treatments, treatment variant E2, with a 20-minute inoculation of tubers with effective microorganisms, proved to be the most effective, reducing the average infection level to 52.0% compared to 61.5% in control treatment (Table 5).
The value of this trait was significantly related to the genetic characteristics of the cultivars. Nora was the cultivar that responded best to effective microorganisms. A drastic reduction in the percentage of tubers with common scab symptoms was observed from 51.7% to 21.3% after the longer, 20-minute EM inoculation (E2) (Table 5). Cultivars such as Nora and Oktan showed the strongest response to the extended treatment with EM (E2), achieving significantly lower infection rates than the other cultivars. The Oktan cultivar showed a significant improvement from 65.5% to 32.5% after the longer treatment with this preparation (E2). The Czapla cultivar showed a reduction from 60.7% to 34.8% after the longer E2 inoculation. Anomalies: For some cultivars, such as Bellarosa and Ewelina, tuber inoculation with EM resulted in a higher percentage of tubers showing common scab symptoms compared to the control. This suggests that although the actinomycete affected more tubers, the disease severity may have been controlled (Table 5). Significant differences between highly resistant cultivars (such as Nora E2) and susceptible cultivars (Zuzanna - control) are statistically significant (Table 5).
Statistical analysis showed that all three factors examined – cultivar, seed potato improvement method (EM biopreparation), and weather conditions during the growing years – had a significant impact on potato tuber health with respect to common scab (S. scabies) (Table 6).
Cultivation year variability: This factor proved to be crucial for disease severity. The average percentage of infected tubers was significantly lowest in 2020 (39.1%), suggesting conditions least favorable for infection (e.g., optimal soil moisture during tuber setting). Maximum severity: The highest infection rate was recorded in 2021 (78.5%), which statistically significantly differed from the other study years. 2019 (53.8%) represented an intermediate variant – infection was significantly lower than in 2021, but significantly higher than in 2020 (Table 6).
3.1.1. Analysis of the Interaction of Weather Conditions and the Effectiveness of the EM Biopreparation
The interaction between the years of study and the applied pre-planting treatments (E1, E2) significantly influenced all three health parameters of potato tubers in relation to common scab (S. scabies) (Table 7).
Our research has shown that the effectiveness of EM technology in reducing common scab is closely linked to the severity of infection pressure during a given growing season.
Impact of Infection Pressure (2020 vs. 2021): Extremely different infection levels were recorded depending on the year of the study, allowing for the evaluation of the preparation under extreme conditions: High Pressure Year (2021): In the control treatment, as many as 85.6% of tubers showed scab symptoms. Under these critical conditions, the E2 variant (20 min) proved most effective, reducing the percentage of diseased tubers by 17.4 percentage points (to 68.2%). Low Pressure Year (2020): With the naturally lower disease severity (control: 42.5%), the use of the E2 variant achieved a record low infection level throughout the entire study cycle – just 34.0% (Table 7).
Optimization of exposure time (Variants E1 vs. E2): Statistical analysis showed that extending the seed potato soaking time is not always necessary, as the differences between short (E1 – 10 min) and long (E2 – 20 min) exposure to EM in 2019 were statistically insignificant. This suggests that under conditions of average pathogen risk, a shorter treatment time is sufficient to obtain a satisfactory protective effect (Table 7).
3.1.2. Infection Level of a Tuber Sample (Commercial Quality Index)
This index determines the overall health of the batch, considering both the extent (presence) and intensity (area) of common scab symptoms. Key effects of EM technology include:
- −
- Improved quality: The average health score increased from 7.3° (control) to 7.8° (E2). On a 9-point scale, an increase of 0.5° represents a statistically and commercially significant improvement in skin cleanliness.
- −
- Health Leaders: The Jelly cultivar demonstrated the highest reactivity to the product (reaching 8.6° in the E1 variant). Very high scores (8.5°) were also recorded for the Czapla and Roxana cultivars, which in practice means almost symptom-free tubers.
- −
- Genetic stability: The Oktan and Krasa cultivars demonstrated high initial resistance (results above 8.0° in the control group), confirming their strong genetic predisposition to limiting pathogen expansion (Table 5).
- Influence of external conditions and interactions:
Inter-annual variability: The years 2019–2020 were characterized by low infection pressure (average degree of infection in the tuber sample > 7.9°), with symptoms being purely cosmetic. A drastic deterioration in quality occurred in 2021 (6.6°) (Table 6).
Protective mechanism: In the year of high infection pressure (2021), the index in the control group dropped to a critical level of 6.1°. The use of the E2 variant effectively cushioned this decline, increasing the result to 7.3°, which significantly increased the market value of the lot (Table 7).
3.1.3. Severity of Common Scab Infection on Infested Tubers
EM effectively limits both the infection rate and the "depth" of the disease. This metric refers specifically to tubers already exhibiting symptoms and assesses the extent of damage (e.g., surface scab vs. pitted/cankered scab). Pre-planting tuber treatments with EM improved the average score from 6.5° to 6.8° on a 9° scale. This indicates that even when tubers were infected, the lesions were shallower and less harmful, particularly in the E2 treatment (Table 5).
Varietal Resistance and Genetic Factors: The severity of this trait was significantly influenced by genetic characteristics. The Ewelina, despite a high percentage of infected tubers (78.8%), achieved the highest severity score of 7.7° on the 9.0° scale, indicating that the scabs were very superficial and did not penetrate deep into the tuber. Red Fantasy showed a consistent improvement in lesion depth, increasing from 6.7° (Control) to 7.3° (E2).
Overall, Ewelina exhibited the highest health status (least affected tubers), reaching the highest values on the 9° scale. Conversely, Nora was characterized by the highest stability, showing nearly identical results regardless of the treatment, which suggests lower reactivity to the tested microorganisms.
Negative Interactions and Treatment Duration: A significant negative reaction was observed in Hinga and Krasa, which showed a substantial increase in infection severity under the E1 treatment compared to the control. In many cases (e.g., Oktan, Red Fantasy, Jelly), the extended 20-minute inoculation (E2) yielded the best results, suggesting it is the most universal method for improving tuber health. The poorest results were recorded for Hinga under the shorter inoculation period (E1), where resistance dropped to 5.0°—the lowest in the entire dataset. This suggests that for this specific cultivar, the 10-minute EM inoculation (E1) may have significantly exacerbated the disease symptoms. Cultivars like Ewelina and Red Fantasy demonstrated high tissue resistance, as their infection severity scores remained significantly higher (healthier) even under intense pathogen pressure (Table 5).
Annual Variability and Environmental Impact: The severity of common scab (S. scabies) lesions varied across the study years:
- −
- 2019: Results were highest (approx. 7.0°), indicating very superficial lesions.
- −
- 2021: Infections were not only more widespread but also deeper (Control group: 5.4°) (Table 6).
Treatment E2: In 2021, the E2 variant reached 6.2°, confirming that a 20-minute exposure to EM not only reduces the number of infected tubers but ensures shallower, less damaging lesions.
This annual variability suggests that weather conditions in 2021—specifically drought during tuber initiation—favored the development of common scab. Nora and Roxana proved resilient to environmental stress, showing high repeatability across years, which confirms their health stability.
Extreme Cases: A notable outlier occurred in 2021 with the cultivar Krasa under the E2 treatment, where the score plummeted to 2.3° in 9⇨ scale (Table 7). This indicates severe negative interaction between the treatment and the specific environmental conditions of that year.
3.2. Rhizoctonia Tuber Infection
Statistical analysis showed significant differences in the response of individual genotypes to the biotechnological treatments used (Table 8).
Effectiveness of Treatments in Reducing the Proportion of Diseased Tuber Plants: This indicator exhibits the greatest variability. The following cultivars were treated to significantly reduce the number of diseased tubers compared to the control: Nicola, which saw a dramatic decrease in the proportion of diseased tubers in the E1 treatment (35.9%) compared to the control (62.8%). Ewelina & Hinga showed a significantly positive response to the E2 treatment. In the Hinga cultivar, the proportion of infected tubers in the sample dropped from 43.6% to just 19.7%. In the Oktan cultivar, both treatments (E1 and E2) significantly reduced the spread of the disease compared to the control group (Table 8).
Three groups of cultivars with different reactivity were distinguished:
A group of cultivars with high positive reactivity. The most spectacular biological protection effects were observed in the Ewelina and Hinga cultivars.
The use of the E2 variant (20 min exposure) allowed for a drastic reduction in the proportion of infected tubers from over 42-43% (control) to only 19.3-19.7%.
In the Hinga cultivar, the E2 variant also significantly improved the overall health of the sample (increasing from 4.6 to 6.8 on a 9-point scale), indicating a strong synergy between the EM microbiome and this cultivar's natural defense mechanisms.
Specific response of the Nicola cultivar: The Nicola cultivar demonstrated an unusual pattern of response to EM inoculation, as: It demonstrated a significant improvement in health with a shorter exposure time (E1), where the proportion of infected tubers decreased to 35.9%.
Extending exposure to 20 minutes (E2), however, resulted in a deterioration of parameters (increasing infection to 74%). This suggests that for some genotypes, excessive inoculation may lead to an imbalance in the geocaulosphere.
Stabilization of skin quality (e.g., Bellarosa, Red Fantasy): The Bellarosa cultivar maintained very high sample health (7.8–8.0) regardless of the cultivar, with E1 inoculation further reducing the number of infected tubers (a decrease to 36.3%).
In the Red Fantasy cultivar, E2 reduced the number of diseased tubers (33.9%), although a simultaneous decrease in the health of already infected tubers was noted, indicating a complex mechanism of pathogen-EM interactions in this genotype (Table 8).
It can therefore be concluded that:
Optimization of exposure time: For most cultivars (Krasa, Nora, Ewelina, Hinga), the longer exposure (E2) proved to be more beneficial or statistically safer, resulting in a higher score on a 9-point scale.
Effect of EM on the degree of infection: EM inoculation most effectively improves the health of infected tubers (alleviates symptoms) in initially more susceptible cultivars, such as Hinga.
The high LSD value for the proportion of tubers infected with R. solani highlights the high plasticity of the microbiome within different cultivars, suggesting the need to personalize pre-planting improvement treatments for specific potato genotypes (Table 8).
Symptom severity (Infection degree): By analyzing the degree of infection of the sample itself and of already infected tubers, conclusions can be drawn about the "aggressiveness" of the disease under given conditions. For example, despite a relatively high percentage of diseased tubers, Bellarosa scored very high on a 9-point scale (7.3–8.0), demonstrating its high tolerance. Even when its tubers were infected, the degree of surface damage remained minimal. The Red Fantasy cultivar had the lowest degree of infection in infected tubers (5.3) with the E2 treatment, suggesting that this particular treatment, combined with the cultivar's resistance, effectively inhibits mycelium growth on the skin surface (Table 8).
Dependence on earliness group: No clear correlation was found indicating that late cultivars are more susceptible than early cultivars. However, very early cultivars (Krasa, Korona) tended to be more severely infected under the E1 treatment. This may suggest that the early development cycle of these cultivars interferes with the timing or specificity of this treatment. Late, starchy cultivars (Hinga, Czapla) responded better to the E2 treatment, which may be due to the longer growing season and different dynamics of sclerotia formation on tubers. Unusual responses (C x T interactions): Differences between some cultivars were statistically significant. The E1 treatment in the Hinga cultivar resulted in a drastic decrease in the infection rate (to 4.6), while maintaining a relatively low percentage of diseased tubers (42.9%) (Table 8).
Analysis of the year x cultivar interaction provided key information on the genetic stability of resistance and plasticity of the studied potato cultivars in the face of R. solani pressure. This suggests significant dynamics of infection changes induced by hydrothermal factors in individual growing seasons (Table 9).
Analysis of data from 2019–2021 indicates a very strong influence of weather conditions, which significantly modified the genetic resistance of cultivars.
2021 as the season with the highest pathogen pressure: 2021 is statistically distinguished by the highest percentage of tubers with R. solani for almost all cultivars (e.g., Roxana increased from 12.7% to 77.0%, Bellarosa from 0% to 71.3%). Conditions in 2021 (a cool and wet spring) favored mass infections of stolons and young tubers, eliminating the natural resistance of many cultivars.
Symptom severity vs. disease paradox Spread: There is a noticeable inverse correlation between the number of diseased tubers and their degree of infection (scale 1-9):
In 2020, the proportion of diseased tubers was moderate, but their degree of infection (infected units) was the highest (often above 8.0, e.g., in the Ewelina, Red Fantasy, and Hinga cultivars). This means that infected tubers were covered with very thick, numerous sclerotia. In 2021, although there were more diseased tubers, the degree of damage was less severe. Varietal Stability (Plasticity):
The highly stable cultivars Korona and Oktan showed relatively smaller fluctuations in infection rates compared to the others, suggesting their greater resistance to changing environmental conditions.
Extreme reaction (Bellarosa): This cultivar exhibits an extreme reaction to the year factor – from a complete absence of symptoms (0% in 2019) to very high infection rates (over 70% in 2021). This indicates that its resistance is highly dependent on weather conditions during critical growth stages.
Earliness groups and infection date: Late and starchy cultivars (Hinga, Czapla) showed lower infection rates than early cultivars in the year with the lowest overall infection pressure, 2019 (the year with the lowest overall infection pressure). This suggests that the later tuber setting date in these cultivars allowed them to escape the first wave of infection, which affected the fast-growing cultivars (Table 9).
3.2.1. Analysis of the Effectiveness of Inoculation in Reducing R. solani
The analysis of the data presented in Figure 1 indicates a significant effect of the biopreparations used (E1 and E2) on reducing the infection of potato tubers by R. solani, and this effectiveness was strictly dependent on the conditions prevailing in the individual years of the study.
Analysis of the effectiveness of inoculation in reducing R. solani. Research results from 2019–2021 clearly indicate that engineering the geocaulosphere microbiome through seed potato inoculation (variants E1 and E2) provides an effective biological barrier against the pathogen.
Disease severity dynamics (Year effect): Pathogen pressure showed significant variability throughout the research cycle, allowing for the assessment of the stability of protective methods under various conditions:
- −
- Year 2021 (Maximum pressure): The highest disease severity; infestation exceeded 60% in the control treatment.
- −
- Year 2019 (Minimum pressure): The lowest infection level in the control treatment, approximately 38%.
Effectiveness of variants E1 and E2: Both forms of inoculation statistically significantly reduced the proportion of infected tubers in each year of the study.
Key observations:
- −
- 2020 – High stability and reduction in paralysis by over 10 percentage points in both variants (E1 and E2).
- −
- 2021 – Extreme infection pressure. Variant E2 demonstrated higher efficacy than E1 under severe stress conditions (Figure 1).
3.3. Correlations Between R. solani Incidence, the Hydrothermal Coefficient, and Tuber Yield
Pearson correlation analysis was conducted to determine the strength and direction of the relationships between hydrothermal conditions, microbial inoculation time, and potato health and yield indicators. The results, summarized in Table 10, allow for the identification of key determinants influencing the effectiveness of EM Farming™ technology under diverse weather conditions.
Increased health/yield parameters: In our own research, the arrow next to EM Exposure Time vs. Total Tuber Yield (▲) indicates that increasing exposure time to EM Farming™ contributes to a statistically significant increase in tuber yield. Infection Severity: In the HTC vs. Infection Index correlation (▲), this symbol illustrates that increasing humidity and temperature (higher hydrothermal coefficient) increases the pressure of pathogens such as R. solani.
Key Insights:
- −
- HTC vs. Infection (r = 0.68): A strong positive correlation confirms that with increasing humidity (especially in May and August), the proportion of tubers infected with R. solani increases dramatically.
- −
- Exposure Time vs. Infection (r = -0.54): A negative correlation demonstrates the effectiveness of microbiome engineering – extending the inoculation time to 20 minutes (E2) statistically significantly reduces the infection rate.
- −
- DSI vs. Yield (r = -0.72): A very strong negative correlation is a key economic outcome. It confirms that the severity of skin diseases directly and significantly reduces plant productivity.
- −
- Exposure Time vs. Yield (r = 0.42): A positive correlation indicates that seed potato fertilization not only protects the skin but also stimulates an increase in total yield through physiological support mechanisms (PGPR) (Table 10).
3.4. Variability of Tuber Infection with Common Scab Under the Influence of Cultivar and Climatic Factors
Tuber skin quality is a key commercial parameter, determining potato suitability for washing and packaging. Common scabs, caused by S. scabies, pose a significant agrotechnical challenge due to the widespread nature of the pathogen and its strong dependence on external factors. The severity of this disease is the result of a complex genotype × environment interaction:
Varietal factors: The genetically determined skin structure and the rate of its maturation determine the plant's underlying susceptibility.
Hydrothermal conditions (HTC): Moisture deficit during the tuberization drastically increases the risk of infection, making weather patterns the primary modifier of pathogen pressure.
Therefore, the dynamics of tuber infection between 2019 and 2021 were analyzed. The aim of the analysis was to identify the resistance stability of the studied cultivars and determine the impact of climatic variables on yield quality, which is crucial for optimizing control strategies in precision agriculture.
Heat map analysis (Figure 2) allows us to identify multivariate relationships between hydrothermal conditions and tuber health. Key findings:
Genotype × Environment Interaction (Cultivar and Year) Cultivar Variability: The heat map clearly differentiates cultivars into groups with varying degrees of susceptibility. Cultivars characterized by "cool" color (low %) throughout the entire study period can be considered genetically more resistant to common scab. Resistance Stability: Cultivars that maintain consistent color throughout the year demonstrate high phenotypic stability, which is crucial for precision agriculture.
Impact of Hydrothermal Coefficient (HTC) Correlation with Humidity: Color changes on the heat map correlate with HTC values for individual years (2019–2021). Typically, dry years (low HTC during tuberization) generate "hotter" areas on the map, confirming that water shortages drastically increase S. scabies pressure. Critical years: If 2021 (as suggested by previous data) was a year with a specific temperature and precipitation pattern, the map should indicate it as the year with the highest infection gradient for susceptible cultivars.
Identification of risk cultivars: The map allows for the quick identification of cultivars that reach thresholds critical infection in years with low HTC (drought), disqualifying them from the washed potato segment.
Biological barrier: The heat map provides a comparative framework – it allows for assessing whether scab pressure in given years was strong enough to verify the effectiveness of the biopreparations used.
3.5. Principal Component Analysis (PCA)
Below is a detailed summary of factor loadings (Principal Component Loadings), which form the mathematical foundation of PCA analysis. They allow for a precise determination of the extent to which individual health parameters (primary variables) contribute to the principal components PC1 and PC2 (Table 11).
Dominance of R. solani in PC1: Indicators for R. solani exhibit the highest positive loadings (above 0.84) relative to the first component (PC1). This indicates that PC1 is the "R. solani axis." It was the severity of this disease that most differentiated the studied sites between 2019 and 2021. Cultivars shifted to the right in the biplot are characterized by high values of all three indices for R. solani (Table 11).
Role of Common Scab in PC2: Indicators for common scab (S. scabies) have a stronger association with the second component (PC2), exhibiting negative loadings (from -0.51 to -0.74). This suggests that PC2 describes a specific susceptibility to scab that is partially independent of R. solani pressure. This arrangement of vectors (perpendicular or oblique to PC1) confirms that microbiome engineering (EM) can affect both pathogens differently, and their occurrence is determined by distinct ecophysiological niches (Table 11).
The most important health descriptor: The highest loading for S total (0.914) for R. solani indicates that it is the most informative variable in our study. This parameter best explains the variability between cultivars and the effectiveness of improvement treatments (Table 11).
The vectors represent the influence of specific health parameters for R. solani (blue) and S. scabies (red) on the first two principal components (Figure 3).
The first component (PC1), explaining ~68% of the total variance, is primarily defined by the global infection indices of R. solani (Stotal) loading: 0.914; Wp loading: 0.892). The second component (PC2), explaining ~15% of the variance, shows a strong negative correlation with S. scabies incidence and severity indices, highlighting a distinct pathological response compared to black scurf (Figure 3).
3.6. Cluster Analysis
Based on PCA factor loadings and Euclidean distances from cluster analysis, a classification of cultivars is presented (Table 12). This classification considers not only pure resistance but also responsiveness to EM technology, i.e., the genotype's ability to interact with the introduced microbiome.
Group I (Stable and Reactive): These cultivars represent a "biological success" in our research. Their root systems and periderm most effectively recruit lactic acid bacteria and yeasts from the EM preparation, forming a persistent biofilm. In the PCA analysis, they are on the opposite side of the Stotal and Sinf vectors.
Group II (Plastic): This is the "intermediate" group, in which EM technology works but is modified by external factors (PC2). Technological optimization is crucial for them. They exhibit high variability (CV), suggesting that their microbiome is more "volatile" and requires precise treatment timing.
Group III (High Risk): Cultivars such as Nicola exhibit such strong natural susceptibility (especially to Rhizoctonia blight) that EM inoculation—while reducing the infection rate—does not move them into the "healthy" cluster. In these cases, the pathogen vector dominates over the treatment vector (Table 12).
3.7. Theoretical Health Model (Health-Shift Model)
This model assumes that EM inoculation acts as a vector force that counteracts environmental and pathogenic pressures. Table 13 presents a theoretical model of the health-shift mechanism. It explains how EM Farming™ technology (variants E1 and E2) modifies the position of the studied objects in statistical space (PCA and cluster analysis), translating biological processes into measurable resistance indicators.
Here is a detailed interpretation of the key elements of this model:
Control (C): Susceptibility and Risk:
Mechanism: The control cultivar is biologically "naked" – its health depends solely on genetic traits that fail at high HTC (high humidity favoring pathogens). Statistical interpretation: These cultivars correlate positively with the infection vector (Sinf). In the PCA plot (Figure 4), they are in the high-risk zone, meaning their health profile is dominated by the presence of the pathogen (Table 13).
Inoculation E1 (10 min): Initiation Phase:
Mechanism: A short exposure is sufficient to initiate biofilm formation and activate nonspecific systemic immunity (NSR). This is the "kickstart" of the biological shield. Statistical interpretation: There is a clear shift in the cultivar along the first component axis (PC1). In PCA analysis, the PC1 axis typically explains the largest proportion of variability (here: level of infection). A leftward movement indicates a real reduction in disease severity, but the object may still remain within the pathogen's sphere of influence (Table 13).
Inoculation E2 (20 min): Full Stabilization and "Health-Shift:
Mechanism: A longer exposure time allows for full colonization of the geocaulosphere (the zone around underground stems and tubers). A stable "core" microbiome is formed, which actively displaces R. solani. Statistical interpretation: This is the most radical change. The object is reclassified – statistically, it no longer resembles a diseased plant. An increase in the Euclidean distance from the pathogen in the cluster plot indicates that the plant's microbiological and biochemical profile has become radically different from the control group (Table 13).
Mechanism summary: The model demonstrates that EM technology does not merely target the pathogen but changes the plant's biological status:
- −
- E1 is a symptom-limiting intervention.
- −
- E2 is microbiome engineering that moves the plant into a completely different health category (the so-called “Stable & Healthy” cluster) (Table 13).
3.7.1. Model Description (for Figure Caption)
The presented G x E x M interaction model illustrates the mechanism in which EM technology acts as a biological buffer, enabling the shift of potato cultivars from high infection risk zones (Cluster III) towards groups with increased health and yield stability (Figure 4).
Theoretical model of the G × E × M interaction (Genotype × Environment × Microbiome). The model illustrates the "Health-Shift" phenomenon where microbial engineering (EM Farming™) reclassifies susceptible and intermediate cultivars into higher health clusters. Treatment E2 (20-minute exposure) acts as a biological buffer, neutralizing the negative impact of extreme hydrothermal conditions (high HTC) and reducing the Euclidean distance between susceptible cultivars and the resistant reference group (Figure 4).
4. Discussion
4.1. Verification of Hypotheses in Light of Research Results
Main Hypothesis: Effectiveness of Geocaulosphere Microbiome Modulation. It was assumed that targeted microbiome modulation through EM inoculation induces NSR mechanisms and limits pathogen colonization. This hypothesis was CONFIRMED. Average results across the years of study showed a statistically significant decrease in the percentage of tubers infected with R. solani from approximately 38% in the control to approximately 30–32% in the EM variants. This reduction was particularly noticeable in the Hinga and Ewelina cultivars, where inoculation allowed for an almost two-fold reduction in pathogen pressure, demonstrating the activation of a biological barrier in the geocaulosphere.
Sub-Hypothesis 1: Effect of Exposure Time (E1 vs. E2). It was assumed that extending the treatment time to 20 minutes (E2) provides a more durable biological barrier. This hypothesis was PARTIALLY CONFIRMED (Genotype-dependent). Justification: For most cultivars (e.g., Hinga, Ewelina, Krasa), the E2 variant was the most effective, leading to the lowest infection rates and the highest scores on a 9° scale. However, the Nicola cultivar showed the opposite reaction – it achieved the best health parameters with a shorter exposure (E1), suggesting that the optimal duration of microbiome engineering must be tailored to the specific host genotype.
Specific Hypothesis 2: Environmental Interaction and Drought Stress Mitigation. EM was assumed to be most effective under abiotic stress and variable hydrothermal conditions. This hypothesis was CONFIRMED. Justification: Our research results demonstrated a strong interaction between Lat x EM. In 2021, a year characterized by extremely high R. solani pressure, inoculation-maintained health stability in susceptible cultivars. According to the literature, microbiological additives (MSAD) show higher effectiveness than classical biopreparations (BCA) in years with water shortage, which confirms the role of EM in stabilizing potato ecophysiology.
Conclusions: Microbiome engineering using EM Farming™ is an effective method for reducing skin diseases, meeting contemporary commercial and ecological standards. Potato genotype determines the ability to recruit introduced microorganisms, which is manifested by a variable response to inoculation time. EM technology acts as a "biological buffer," stabilizing the health of the geocaulosphere under conditions of variable pathogen pressure and environmental stress.
4.2. Impact of EM on Tuber Health
In our own studies, we observed a significant impact of EM technology on reducing soil pathogens, which correlates with the results obtained by Janas [29] and Boligłowa and Glen [30]. These authors indicate that soil inoculation and seed potato dressing with biopreparations reduce the occurrence of tuber pox (R. solani) and common scab (S. scabies). This mechanism is based not only on simple competition for an ecological niche, but also on the complex phenomenon of soil suppression. For many cultivars (e.g., Nora, Nicola), the application of treatments (E1, E2) significantly changed the percentage of tubers with scab.
EM can be considered network stabilizers: EM technology acts not only as an "antibiotic" against pathogens, but as microbiome engineering, restoring the functions of core microorganisms. By regulating interbacterial interactions, EM protects the integrity of the core microbiome, which translates into higher skin health (9° on the resistance scale). It is also worth noting that in some cases, these treatments (especially combined) were able to reduce the level of infestation, but their effectiveness was modulated by weather conditions (the very high infestation in 2021 across all sites suggests that extreme conditions may offset the positive impact of sonication).
4.2.1. Mechanisms of Induced Resistance
Current research confirms that microorganisms comprising EM (including Bacillus subtilis and lactic acid bacteria) activate induced systemic resistance (ISR) pathways in potatoes. According to Boligłowa and Glen [30] and Kowalczyk et al. [31], the presence of beneficial microbial consortia stimulates the plant to produce phenolic compounds and defensive enzymes that harden cell walls, hindering penetration by R. solani hyphae.
4.2.2. The Role of Trehalose in Potato Defense Mechanisms
Trehalose, an inorganic disaccharide, acts as a protective osmolyte in the plant. According to Schneider's analysis [32,33] and contemporary reports in plant physiology [34], its presence is crucial under abiotic stress conditions (drought, salinity, extreme temperatures).
Stabilization of cellular structures: Trehalose has the unique ability to replace water molecules around macromolecules (proteins and lipids) during drying. It creates a "glass-like" structure (vitrification), which prevents protein denaturation and cell membrane collapse.
Defense signaling: This sugar acts as a signaling molecule that "warns" the plant of pathogen attacks before physical tissue damage occurs. This allows the plant to more quickly activate the synthesis of phytoalexins and immunity-related proteins (PR proteins). Protection against ice crystals: Under low temperature conditions, trehalose prevents the formation of large ice crystals that could mechanically disrupt plant cells [34,35].
4.2.3. Microbiological Antagonism and Common Scab
In the case of common scab (S. scabies), a key factor is the change in the redox potential of the soil environment. The use of EM, according to Higa's theory [8], introduces antioxidants and electron donors, which inhibit the development of pathogenic actinomycetes that prefer environments with high oxidative stress. More recent studies [10,36,37] also suggest that systematic EM application increases soil sorption moisture, which is critical during the tuber setting phase – a period when water deficiency drastically increases scab infection.
4.2.4. Mycorrhiza and Synergy
An important element in improving health is the mycorrhizal symbiosis mentioned by [37]. Mycorrhizal fungi, reinforced by the presence of Mycorrhiza Helper Bacteria (MHB) contained in EM, create a physical barrier around the root system and young tubers. According to [38,39,40] and [41], such a biological shield significantly limits the colonization of tissues by fungal pathogens, which translates into a higher share of marketable yield with smooth skin. In the case of common scab infection of tubers, the effects of the application of improvement treatments were more complex and indicate a strong interaction of the treatment with the cultivar and year.
4.3. Infection of Tubers with R. solani
The effect of the treatments was most pronounced: for cultivars such as Ewelina and Hinga, the inoculation treatment (E2) drastically reduced the percentage of tubers with R. solani. This indicates that a longer inoculation treatment significantly stimulates tuber defense mechanisms against R. solani [11]. The cultivars of Hinga and Ewelina showed the most significant positive response to the E2 (20 min) treatment, nearly halving the infection rate compared to the control. Conversely, Nicola showed an atypical reaction where short exposure (E1) was more beneficial than long exposure (E2), suggesting that certain genotypes might be sensitive to prolonged immersion in microbial solutions.
4.4. The Role of the Core Microbiome and Hub Taxa in Soil Pathogen Suppression
Our research results, documenting a significant reduction in tuber infection with common scab (S. scabies) and R. solani after the application of EM preparations, align with modern plant microbial ecology theory. According to this theory, the health of potatoes (S. tuberosum) does not depend on individual microorganisms, but on the stability of the core microbiome and the presence of hub taxa [42,43].
Introducing EM into the rhizosphere strengthens the network of relationships between core species, leading to colonization resistance. This mechanism, supported by central taxa, limits the availability of ecological niches for pathogens, which is directly reflected in the reduction of the tuber infection index observed in our study. EMs not only combat pathogens directly but also modify the architecture of the microbial network, making it „tighter” [29,32].
4.4.1. The Role of "Hub Microorganisms" in S. scabies Inhibition
The literature indicates that Lenze and Streptomyces are the most abundant genera in the potato rhizosphere [12,15]. In this context, the presence of the pathogenic S. scabies strain can be interpreted as a disruption of the balance within the core microbiome. The use of EM introduces so-called "hub microorganisms" into the geocaulosphere. They act as mediators that regulate the microbial network through strong biotic interactions [6,44]. The introduction of external hub microorganisms (e.g., lactic acid bacteria or yeasts contained in EM) can "force" the microbial community back to a state of stability (homeostasis), limiting the abundance of pathogenic Streptomyces populations and preventing them from dominating the tuber's ecological niche [45,46].
4.4.2. Adaptation Through Satellite Taxa and R. solani Pressure
A key finding from our research was the fluctuation in the effectiveness of EM preparations, determined by weather factors and cultivar genotype. This phenomenon is justified by the dynamics of satellite taxa, which – in contrast to the stable core microbiome – exhibit high plasticity in response to changing edaphic and climatic conditions [42].
In years of extremely high R. solani pressure (e.g., 2016), the biological stability of the root zone depended on the host's ability to actively recruit helper taxa (the cry for help hypothesis). EM inoculation in this context not only provides bio controllers but, above all, strengthens the architecture of a "complex, interconnected microbial network" [10,46,47].
Ecological network analyses indicate that potato resistance to aggressive soil pathogens (such as R. solani or Ralstonia solanacearum) is correlated with the presence of so-called "cry for help" pathogens. Keystone species. These are microorganisms with the highest degree of interconnectivity in the network, which, even at low numbers, determine the diversity and functionality of the entire community [5,10,46]. Support for these links by EM allows for maintaining microbiome homeostasis even under conditions of strong biotic stress.
4.4.3. Genetic Control of the Microbiome and Cultivar Specificity (Host-Genotype Effect)
Our research results showed that the effectiveness of inoculation with EM preparations (variants E1 and E2) is a highly cultivar-specific trait. This supports the hypothesis of the differential ability of S. tuberosum genotypes to selectively recruit microorganisms and modulate the core microbiome. The particularly high responsiveness of the Hinga and Ewelina cultivars to the application of the E2 variant suggests a strong correlation between the host genome and the ability to assimilate exogenous microbial consortia.
This phenomenon is supported by studies of plant genetic architecture (GWAS), which indicate that the abundance and activity of hub taxa are tightly controlled by quantitative trait loci (QTLs) involved in:
Carbohydrate metabolism: a specific profile of root exudates (sugars, organic acids) acting as chemoattractant for EM [46,47].
Stress response signaling pathways: genes controlling systemic immunity (ISR/SAR), which in highly reactive cultivars more quickly transition to a "ready" (priming) state upon inoculation [48,49].
Consequently, cultivars such as Hinga and Ewelina can be considered genetically predisposed to form effective holobionts. Thanks to their improved molecular matching, these cultivars more effectively integrate microorganisms from EM preparations into their ecological network, which translates into a drastic reduction in soil pathogen pressure through mechanisms of competition and antibiosis [49,50].
A Comparative Analysis and Environmental Correlations: G × E × M Interaction
4.5. Comparative Analysis and Environmental Correlations: G × E × M Interaction
Analysis of the 2021 results revealed a significant decrease in the natural suppression of soil pathogens, which should be attributed to the occurrence of abiotic environmental stress, weakening the plant immune barrier. This phenomenon corresponds with the findings of Gleń-Karolczyk et al. [30], indicating that water deficits or unfavorable rainfall patterns drastically increase the R. solani disease severity index (DSI). This confirms the existence of a strong negative correlation between canopy health and yield stability under climatic stress conditions. The cultivar × year interaction demonstrated in our study demonstrates that while genotype provides the foundation for protection against R. solani, in years of extreme pathogen pressure, varietal resistance alone becomes insufficient. In this context, cultivars such as Hinga and Ewelina stand out for their exceptional phenotypic stability. Their high responsiveness to EM Farming technology (reaching an infection level of nearly 19% after E2 inoculation) suggests a synergy between the host's defense mechanisms and the bioprotective effects of the introduced microorganisms. It can be assumed that EM inoculation in these cultivars acts as an environmental buffer that:
- −
- Compensates for declines in the abundance of beneficial native microflora during periods of drought.
- −
- Stimulates root system development, increasing the efficiency of water and mineral uptake, which indirectly reduces susceptibility to R. solani infection.
- −
- Maintains soil enzymatic activity even under unfavorable moisture conditions.
4.6. The Market and Economic Importance of Bioprotection in Potato Cultivation
Our research results, documenting the high effectiveness of EM in reducing tuber infection with common scab and Rhizoctonia wilt, are strongly supported by current market trends and requirements [30,39,50,51]. The modern potato sector is evolving towards highly processed products and the sale of fresh tubers in a "wash & pack" system (washed and packaged in transparent packaging). In this marketing model, the visual quality of the skin becomes a key parameter determining product acceptance by consumers and retail chains.
In this context, smooth-skinned tubers, free from necrosis caused by S. scabies (Ss) and R. solani sclerotia (Rs), are no longer merely an agrotechnical objective, but a necessary condition for maintaining farm profitability. EM Farming biotechnology offers a dual benefit in this area:
Reduction of chemical pressure (IPM): This allows for a reduction in the use of synthetic fungicides and chemical dressings, which is a direct response to the "Farm to Fork" strategy within the European Green Deal.
Cost-effectiveness: According to literature, implementing EM allows for the optimization of mineral fertilization (35-40% reduction) while maintaining yield quality parameters.
Expanding the adaptive potential of plants through EM inoculation is therefore a strategic tool in Integrated Pest Management (IPM). It allows producers not only to reduce direct production costs (agrochemical inputs) but, above all, to avoid losses resulting from batch disqualification due to skin defects, which is a priority in an era of increasing quality requirements [52,53].
4.6.1. EM Effectiveness Compared to Alternative Biological Solutions and the Latest Trends in Biocontrol
A comparative analysis of our research results with literature data allows for an objective assessment of the effectiveness of EM technology in relation to other available biological solutions. The study by Gleń-Karolczyk et al. [30] analyzed a wide range of agents, including specialized biocontrol agents (BCAs) such as Pythium oligandrum and Bacillus subtilis, and complex microbial additives (MSADs), including EM. The authors demonstrated that biopreparations significantly reduced the intensity of skin diseases, achieving efficacy (E) of 19.5–69.2% against R. solani and 8.0–50.8% against S. scabies. The results obtained in our research (especially in the E2 variant) not only correlate with this data but also fit within the latest "synthetic microbiome" (SynCom) paradigm. Contemporary reports [47,48,50,51]. Banerjee [53], You et al. [54] suggest that multi-species consortia (like EM) show higher ecological stability than single-strain formulations, as they create more complex and resistant interaction networks in the rhizosphere. The high position of EM technology as a stable component of potato biological protection is confirmed by the works of: Yin et al. [55]. The improvement in potato health and condition achieved in our own research is confirmed by the latest reports by You et al. [54], who demonstrated that the application of microbial communities (SynCom) drastically increases plant biometric parameters, including root vigor (by 117%) and biomass (by over 60%). This suggests that the reduction in R. solani and S. scabies infection observed in the Hinga and Ewelina cultivars may be the result not only of direct biocontrol but also of stimulation of root system development, which significantly increases the plant's potential for nutrient uptake and tissue regeneration. Xu et al. [56]: They showed that the integrated use of microorganisms from the genus Bacillus and Lactobacillus (key components of EM) induces resistance genes related to the jasmonic acid pathway in potato, which directly limits the colonization by R. solani. Banerjee et al. [53]: They emphasize that under variable climate conditions, microbial consortia act as a "biological buffer," stabilizing tuber health even with fluctuating soil moisture, which explains the success of the E2 variant in more challenging growing seasons. Berg et al. [57]: They indicate that modern microbial biostimulants reduce the S. scabies population not only through competition but also by modifying the pH of the microhabitat around the developing tuber, which is consistent with the mechanism of action of lactic acid bacteria contained in EM. In summary, the effectiveness of the E2 variant in reducing the fraction of infected tubers confirms that EM technology is a viable alternative to synthetic fungicide dressings. This is consistent with the global trend of regenerative agriculture, where the key to success is not only eliminating the pathogen, but above all, restoring the natural soil suppression by supporting the central taxa of the microbiome.
4.6.2. The Role of Hydrothermal Conditions and Drought
A key finding reflected in the statistical analysis of this study (Year x Treatment interaction) is the influence of weather conditions on the effectiveness of protection. Gleń-Karolczyk et al. [30] demonstrated that in years of water deficit (drought), microbial soil amendments (MSADs), which also include EM, are more effective than biological control agents (BCAs) in protecting against cuticle diseases. This is directly related to the previously discussed role of microorganisms in the geocaulosphere, which, through stimulation of natural defense mechanisms (NSR) and osmoregulation (trehalose production), allow the plant to maintain the integrity of the periderm (cuticle) even under water stress [7,58].
Meteorological conditions in 2019–2021 demonstrated that microbiome engineering using EM Farming™ acted as a buffer. The greatest effect of inoculation (i.e. reduction of infection) was obtained in years with moderate and optimal humidity, while in years with extreme rainfall inoculation prevented drastic qualitative degradation of tubers, especially in the case of more resistant cultivars.
4.6.3. Synergy of Skin Health and Yield Performance in the Light of Microbiome Management
Analysis of the relationship between tuber phytosanitary status and production efficiency confirms that the impact of soil-borne pathogens extends beyond the realm of commercial aesthetics. Gleń-Karolczyk et al. [30] and Johansen et al. [58] were documented a significant negative correlation between the Disease Severity Index (DSI) and total tuber yield. This demonstrates that pathogens such as R. solani and S. scabies actually interfere with plant physiological processes, including disrupting assimilate transport and weakening root system vigor.
In our own research, significant improvements in tuber health (higher scores on a 9-point scale) following EM inoculation directly translate into yield stabilization. This mechanism can be explained by a reduction in the metabolic costs incurred by the plant in combating infection. The use of microbiome engineering allows the plant to shift its energy resources from defense mechanisms to building tuber biomass.
Adapting EM technology as active "microbiome management," as conceptualized by Petrushin et al. [7] and Gleń-Karolczyk et al. [30], provides a holistic response to contemporary agrotechnical challenges. This approach combines three key pillars:
- −
- Economic efficiency: ensuring high commercial quality (smooth skin) necessary for wash-and-pack systems.
- −
- Food security: reducing synthetic fungicide residues in tubers.
- −
- Ecosystem stability: restoring natural soil suppression, making this method highly profitable for the producer and safe for the consumer.
In light of recent trends in regenerative agriculture, these results position EM not only as a supportive measure but also as a strategic tool in ecological engineering, capable of mitigating the negative effects of biotic stress while maintaining high unit yield.
4.6.4. Integration of PCA and Cluster Analysis
Statistical weight analysis showed that PC1 was predominantly defined by Black Scurf indices (loadings > 0.84), confirming that R. solani pressure was the primary source of variability. In contrast, Common Scab indices were strongly associated with PC2, suggesting that environmental factors affecting S. scabies were distinct from those driving fungal infection. The high loading of Total (0.914) validates this index as the most reliable descriptor for evaluating the efficacy of EM treatments in potato geocaulosphere engineering.
The integration of PCA and Cluster Analysis allowed for a clear segregation of cultivars into three distinct health-response profiles. Group I (e.g., Hinga, Ewelina) demonstrated a 'microbial synergy' effect, where EM inoculation effectively suppressed pathogen development even under unfavorable hydrothermal conditions. Conversely, Group III (e.g., Nicola) remained high-risk, suggesting that for these genotypes, biological engineering should be part of a broader integrated pest management (IPM) strategy.
4.6.5. EM as a Model Synthetic Community in Light of Modern Biotechnological Standards
The contemporary interpretation of the results obtained in variants E1 and E2 requires reference to the latest guidelines for constructing stable microbial consortia. As indicated by the study by Xu et al. [56], synthetic microbial communities (SynCom) are simplified, modular tools that allow for the precise study of microbiome-host interactions to promote plant growth. In this context, the EM technology used in our research can be viewed as a practical application of a "top-down" approach, where selected functional groups of microorganisms are introduced into the environment to restore specific ecosystem functions, such as the suppression of the pathogens S. scabies and R. solani. The high efficacy of variant E2 (19% reduction in infection) and its reproducibility in the Hinga and Ewelina cultivars observed in our study corresponds to the postulates of Xu et al. [56] regarding key characteristics of optimal consortia, such as:
- −
- Stability and resilience: The complexity of EM allows for the maintenance of defensive functions even in the face of environmental stress (as in 2021), distinguishing them from less stable, single biocontrol strains.
- −
- Functional desirability: The selection of cultivars with high responsiveness to inoculation supports the thesis of the need to tailor the microbial "module" to the host's genetic specificity.
- −
- Reproducibility of results: The success of the E2 variant suggests that the composition of microorganisms in this formulation has been optimized for key physiological functions, allowing for the reproducible reduction of skin diseases in susceptible potato genotypes.
Incorporating the SynCom concept allows for the conclusion that EM Farming technology is not merely an agrotechnical measure, but an advanced form of ecological engineering. By applying the principles described in the latest literature, it is possible to move from random biostimulation to the design of potato cultivation systems with high, natural suppression, which is the foundation of sustainable agriculture of the future.
4.7. Agrotechnical Recommendations
Based on statistical analysis, particularly the interaction of cultivars with EM inoculation, which can provide a practical summary of our work. Based on the differential genotypic response to the duration of exposure in the microbial solution, the following strategies are recommended:
Maximum Protection Strategy (Variant E2 – 20 min): Recommended for cultivars that demonstrate strong synergy with the EM microbiome, in which long exposure drastically reduces infection. Cultivars: Ewelina, Hinga. Benefits: Reduction in the proportion of infected tubers by over 50% and significant improvement in skin health (on a 9-degree scale). Particularly recommended for sites with high R. solani pressure and in years predicted to be dry.
Moderate Inoculation Strategy (Variant E1 – 10 min): Recommended for cultivars sensitive to prolonged soaking or exhibiting unusual physiological responses. Cultivar: Nicola. Benefits: Achieving the highest level of sample health and the lowest infection rate.
Quality Stabilization Strategy (Variant E1/E2): For cultivars with high intrinsic resistance, where EM plays a supporting role. Cultivars: Bellarosa, Nora. Benefits: Maintaining very high skin aesthetics (7.8–8.0 on a 9-degree scale) while reducing the number of tubers with minor symptoms of scab or rhizoctonia.
Implementing these recommendations allows for precise management of the geocaulosphere microbiome, which translates into a higher market value of potatoes while reducing the need for chemical soil dressings.
4.8. Future Development Directions and Research Horizons
The evolution of contemporary agrobiotechnology, supported by the results of this work, is defining new, interdisciplinary research paths that go beyond traditionally understood plant protection. A key challenge is the transition from ad hoc biostimulation to systemic management of the potato holobiont.
- A.
- Genetic Determination of Microbial Partnerships
The next step in optimizing EM technology should be defining the molecular basis of "varietal responsiveness." An interesting direction is the identification of chemical signals (root exudates) by which cultivars such as Hinga and Ewelina more effectively recruit central taxa. Using GWAS (Genome-Wide Association Studies) techniques would allow for the selection of loci responsible for building a "high-yielding microbiome," which would pave the way for breeding potato cultivars natively adapted to cooperate with synthetic microbial communities (SynCom).
- B.
- Sustainability of Ecosystem Effects and "Soil Memory"
Another important issue is investigating the so-called soil legacy effect. It is necessary to verify whether long-term, systematic inoculation with EM preparations leads to a permanent transformation of soil structure from conductive (pathogen-friendly) to suppressive. Understanding whether, and over what time period, the soil microbiome gains the ability to self-regulate without the need for annual intervention is crucial for the economics of regenerative farms.
- C.
- Interactions between Gases and Volatile Organic Compounds (VOCs)
In light of discoveries regarding the role of volatile bacterial metabolites, a promising direction is the analysis of the gaseous metabolome of the rhizosphere. Research into how volatile organic compounds (VOCs) produced by EM inhibit the growth of R. solani mycelium from a distance and how they induce systemic resistance in neighboring plants could revolutionize our approach to canopy protection by introducing the concept of "aerial biocontrol."
- D.
- Precise Design of Microbial Communities (SynCom 2.0)
In light of the dynamic development of bioinformatics, the future belongs to personalized SynCom consortia. Instead of universal formulations, trends point to the creation of "tailor-made" mixtures, where the composition of microorganisms is selected by artificial intelligence algorithms based on metagenomic analysis of a specific field. This would eliminate antagonisms between introduced strains and native microflora, maximizing the colonization rate of the geocaulosphere.
- E.
- Microbiome Resilience in an Era of Climate Instability
The final, but almost priority, direction is the study of the functional stability of microbiomes under conditions of extreme abiotic stress. Verifying how the "biological buffer" behaves during prolonged droughts interrupted by torrential rainfall will enable the development of precise adaptation strategies for agriculture in regions with high hydrothermal risk.
Suggested sentence for the "Research Perspectives" section of your paper: "Further research should focus on the molecular mechanism of central taxa recruitment by specific potato genotypes and on the durability of the suppressive effect under long-term soil microbiome management (soil legacy effect), which will allow for the full optimization of SynCom technology in regenerative agriculture."
5. Conclusions
- I.
-
Effectiveness of Microbiome Engineering in Bioprotection
- −
- Biocontrol Effectiveness: Targeted modulation of the geocaulosphere microbiome by inoculating seed potatoes with EM Farming™ is an effective method for reducing tuber infection by R. solani and S. scabies. The use of this technology resulted in a statistically significant reduction in the proportion of infected tubers by 6–8 percentage points compared to the control, confirming the strong antagonism of the introduced microorganisms towards soil pathogens.
- −
- Resistance Mechanisms: Pathogen reduction is based on the synergy of direct elimination of oxidative stress in the rhizosphere and the induction of systemic acquired resistance (ISR), making microbiome engineering a robust component of Integrated Pest Management (IPM).
- II.
- Genotype-Microbiome Synergy Genetic Recruitment:
Inoculation efficiency is a highly cultivar-specific trait, confirming the crucial role of the host genome in regulating the abundance of hub microorganisms. The highest responsiveness and synergy with EM were observed in the Hinga and Ewelina cultivars, where the E2 variant reduced infection by over 40%. Cultivar Reclassification: Cluster analysis showed that EM Farming™ technology (especially the E2 variant) allows for the reclassification of cultivars with intermediate resistance into groups with high health status, demonstrating that external inoculation can compensate for deficits in natural genetic resistance.
- III.
-
Optimization of Microbial Engineering Parameters Exposure Time (SynCom Module):
- −
- The effectiveness of geocaulosphere colonization by synthetic microbial communities (SynCom) is strictly determined by the contact time of the seed potato with the inoculum. For most genotypes (Krasa, Nora, Ewelina, Hinga), a 20-minute inoculation (variant E2) proved to be the optimal solution, which most effectively stimulated the plant's defense mechanisms.
- −
- Physical-Biological Synergy: Late-maturing starch cultivars demonstrated particularly high synergy with treatments, making them ideal candidates for integrated systems using physically assisted inoculation (e.g., sonication).
- IV.
-
EM as a Biological Environmental Buffer Hydrothermal Stress Mitigation:
- −
- EM technology acts as a "biological buffer," stabilizing tuber health under unfavorable weather conditions. The highest inoculation efficiency was observed in seasons with optimal moisture (2020), but it was under extreme stress conditions (2021) that EM prevented complete qualitative degradation of tubers in susceptible cultivars.
- −
- Etiological Independence: PCA analysis showed that the main source of variability (PC1: ~68%) was the severity of Rhizoctonia blight, strongly correlated with high hydrothermal coefficients, while S. scabies infections (PC2) occurred independently, suggesting distinct pathways of microbiome response to these pathogens.
- V.
-
Economic and Environmental Aspects
- −
- Market Value: Improving the skin health score on a 9-point scale directly increases the commercial value of the crop, meeting the stringent requirements of the market for packaged tubers (wash & pack systems).
- −
- Sustainable Development: The use of microbiological consortia is an environmentally safe alternative to chemical fungicide treatments, in line with the European Green Deal strategy and promoting regenerative agricultural models.
Author Contributions
Conceptualization, PB, PP and BS.; methodology, PB, DS, HA, BS, PP, BK-M; software, HA; validation, HA, DS. and BK-M.; formal analysis, HA, DS.; investigation, BP.; resources, HA, DS, PB, PP, BK-M; data curation, DS, HA.; writing—original draft preparation, BP, DS, HA, PP, BS; writing—review and editing, BS, PB, BK-M; visualization, PP, HA, DS, BK-M; supervision, BS, BK-M; project administration, PB; funding acquisition, PB. All authors have read and agreed to the published version of the manuscript.
Funding
This research received no external funding.
Institutional Review Board Statement
Not applicable.
Data Availability Statement
The original contributions presented in this study are included in the article. Further inquiries can be directed to the corresponding author(s).
Acknowledgments
We would like to express our sincere thanks to the University of Life Sciences in Lublin and the Institute of Plant Breeding and Acclimatization - State Research Institute in Radzików for administrative and technical support and in-kind donations (in the form of materials used for experiments).
Conflicts of Interest
“The authors declare no conflicts of interest.”
Abbreviations
| BCA | Biological Control Agents |
| CS | Common Scab |
| DSI | Disease Severity Index |
| EM | Effective Microorganisms |
| GAP | Good Agricultural Practice |
| HSD | Honestly Significant Difference |
| IPM | Integrated Pest Management |
| IPP-NRI | Institute of Plant Protection – National Research Institute (IOR-PIB) |
| ISR | Induced Systemic Resistance |
| LSD (NIR) | Least Significant Difference |
| MSAD | Microbial Soil Amendments |
| NSR | Nonspecific Systemic Resistance |
| PCA | Principal Component Analysis |
| PGPR | Plant Growth-Promoting Rhizobacteria |
| PR proteins | Pathogenesis-Related proteins |
| RH | R. solani |
| SAR | Systemic Acquired Resistance |
| SOD | Superoxide Dismutase |
| SynCom | Synthetic Community |
| VOCs | Volatile Organic Compounds |
References
- Higa, T. and Parr, J.F. 1994. Beneficial and Effective Microorganisms for a Sustainable Agriculture and Environment. Vol. 1, International Nature Farming Research Center, Atami, Japan 16, 3.23.
- Paśmionka, I.; Kotarba, C. Możliwości wykorzystania efektywnych mikroorganizmów w ochronie środowiska. Kosmos. Problemy Nauk Biologicznych 2015, 64, 173–184. (In Polish).
- Admassie M, Alemu T., Mulatu A. Microbial biocontrol by Trichoderma, its biological interactions and mode of actions. Pakistan Journal of Phytopathology, 2019. [CrossRef]
- Ayangbenro, A.S.; Chukwuneme, C.F.; Ayilara, M.S.; Kutu, F.R.; Khantsi, M.; Adeleke, B.S.; Glick, B.R.; Babalola, O.O. Harnessing the Rhizosphere Soil Microbiome of Organically Amended Soil for Plant Productivity. Agronomy 2022, 12, 3179. [CrossRef]
- Babalola, O.O.; Fadiji, A.E.; Enagbonma, B.J.; Alori, E.T.; Ayilara, M.S.; Ayangbenro, A.S. The Nexus between Plant and Plant Microbiome: Revelation of the Networking Strategies. Front. Microbiol. 2020, 11, 548037. [CrossRef]
- Trivedi, P.; Leach, J.E.; Tringe, S.G.; Sa, T.; Singh, B.K. Plant–microbiome interactions: From community assembly to plant health. Nat. Rev. Microbiol. 2020, 18, 607–621. [CrossRef]
- Petrushin, I.S.; Filinova, N.V.; Gutnik, D.I. Potato Microbiome: Relationship with Environmental Factors and Approaches for Microbiome Modulation. Int. J. Mol. Sci. 2024, 25, 750. [CrossRef]
- Higa, T. Rewolucja w Ochrony naszej planety. [In:] Fundacja Rozwój, SGGW, Wydawnictwo; Greenland-Technologia EM: Warszawa, Poland, 2003. (In Polish).
- Krishna RR, Krishna N, Bora H, Chaudhary T. Good Agricultural Practices (GAP): Principles, Implementation and Impact on Sustainable Agriculture, Food and Scientific Reports, 2025, 6(6): 1-12. e-ISSN 2582-5437.
- Layeghifard, M.; Hwang, D.M.; Guttman, D.S. Disentangling Interactions in the Microbiome: A Network Perspective. Trends Microbiol. 2017, 25, 217–228. [CrossRef]
- Toju, H.; Tanabe, A.S.; Sato, H. Network hubs in root-associated fungal metacommunities. Microbiome 2018, 6, 116. [CrossRef]
- Klasek, D.S.; Crants, D.J.; Abbas, D.T.; Ashley, D.K.A.; Bolton, D.M.; Celovsky, M.M.; Gudmestead, D.N.; Hao, D.J.; Caballero, D.J.I.; Jahn, D.C.; et al. Potato soil core microbiomes are regionally variable across the continental US. Phytobiomes J. 2023.
- Probiotics. EMFarma Plus. https://www.probiotics.pl/probio-emy/dla-gleby-i-roslin/emfarma-plus.html (accessed at 15.05.2025)https:.
- Compant, S., Clément, C., & Sessitsch, A. Plant Growth-Promoting bacteria in the rhizo-and endosphere of plants: main determinants of their effects and future perspectives. Journal of Applied Microbiology, 2019; 127(4): 930-949.
- Custer, G.; van Diepen, L.; Stump, W. An Examination of Fungal and Bacterial Assemblages in Bulk and Rhizosphere Soils under Solanum tuberosum in Southeastern Wyoming, USA. Appl. Microbiol. 2021, 1, 162–176. [CrossRef]
- Lupwayi, N.Z., Soon, Y.K., & Clayton, G.W. Meta-analysis of field experiments on effective microorganisms (EM) effects on crop yields. Canadian Journal of Soil Science, 2021; 101(4): 633-644.
- Mohamed, H.I. et al. Role of Microorganisms in Managing Soil Fertility and Plant Nutrition in Sustainable Agriculture. In: Mohamed, H.I., El-Beltagi, H.ED.S., Abd-Elsalam, K.A. (eds) Plant Growth-Promoting Microbes for Sustainable Biotic and Abiotic Stress Management. Springer, Cham. 2021. [CrossRef]
- Gliński J., Debicki R. Użytkowanie ziemi oraz jakość gleb Polesia Lubelskiego. Acta Agrophysica, 2002; 66: 77-87 (in Polish).
- IUSS Working Group WRB. World Reference Base for Soil Resources. In International Soil Classification System for Naming Soils and Creating Legends for Soil Maps, 4th ed.; International Union of Soil Sciences (IUSS): Vienna, Austria, 2022.
- Nawrocki, S.; Zalecenia Nawozowe, Z.; Część I. Liczby Graniczne do Wyceny Zawartości w Glebach Makro-i Mikroelementów; Wyd. IUNG: Puławy, Poland, 1985; p. 38ss. (In Polish).
- Peeten M.G.H., Schipper E., Schipper K.J., Baarveld R.H. Netherlands catalogue of potato cultivars. Wyd. NIVAP, Den Haag, 2007.
- EUPVP - Common Catalogue Information System. 2024. EUPVP - Common Catalogue. https://ec.europa.eu/food/plant-cultivar-portal/ (accessed 14.05.2025).
- Lenartowicz, T. Descriptive List of Agricultural Cultivars; COBORU Publishing House: Słupia Wielka, Poland, 2018; 31-60. ISSN 1641-7003. (In Polish).
- Hu, P., Ma, Y., & Yin, Y. (2024). The mechanisms and application prospects of soil microorganisms in soil health. Geographical Research Bulletin, 3, 606-624.
- Martyniuk, S.; Księżak, J. Ocean wpływu pseudomikrobiologicznych biopreparatów stosowanych w uprawie roślin. Pol. J. Argon.2011, 6, 27–33. (In Polish).
- Skowera B., Kopcińska J., Kopeć B. Changes in thermal and precipitation conditions in Poland in 1971-2010. Ann. Warsaw Univ. of Life Sci. - SGGW, Land Reclaim., 2014; 46 (2): 153-162. [CrossRef]
- SAS Institute Inc. (2008). SAS/STAT®9.2 User’s Guide. Cary, NC: SAS Institute Inc.
- Field, A.P. Discovering Statistics Using IBM SPSS Statistics. 5th Edition, Sage, Newbury Park, 2018.
- Janas, R. Możliwości wykorzystania Efektywnych Mikroorganizmów w ekologicznych systemach produkcji roślin uprawnych. Problemy Inżynierii Rolniczej 2009, 3, 111–119. (In Polish).
- Gleń-Karolczyk, K.; Boligłowa, E.; Luty, L. Health Parameters of Potato Tubers under the Influence of Soil Applied Bio-Preparations and Bio-Stimulants. Appl. Sci. 2022, 12, 11593. [CrossRef]
- Moon, Y.-H., Lee, K.-B., Kim, Y.-J., & Koo, Y.-M. Current Status of EM (Effective Microorganisms) Utilization. KSBB Journal. Korean Society for Biotechnology and Bioengineering. 2011. [CrossRef]
- Piotrowska, A., & Boruszko, D. Potential of Effective Microorganisms in the Aspect of Sustainable Development. Rocznik Ochrony Środowiska, 2024, 26: 106-114. [CrossRef]
- Schneider, Z. Biochemiczne podstawy funkcjonowania EM-FarmingTM. Naturalne probiotyczne mikroorganizmy. Wyd. Stowarzyszenie Ecosystem. Lichen 2009, 14–16. (In Polish).
- Starck, Z. Effect of stress conditions on coordination of photosynthetic production and resources allocation. Post. Nauk Rol. 2010; 1: 9–26. (In Polish).
- Szewczuk, C.; Sugier, D.; Baran, S.; Bielińska, E.J.; Gruszczyk, M. Wpływ preparatów użyźniających i zróżnicowanych dawek nawozów na wybrane właściwości chemiczne gleb oraz plon i cechy jakościowe bulw ziemniaka. Ann. UMCS 2016, E-71, 65–79.(In Polish). [CrossRef]
- Sawicka, B.; Pszczółkowski, P.; Kiełtyka-Dadasiewicz, A.; Ćwintal, M.; Krochmal-Marczak, B. Effect of effective microorganisms on the quality of potatoes in food processing. Appl. Sci. 2021, 11, 1415. [CrossRef]
- Kaczmarek, Z.; Owczarzak, W.; Mursalski, L.; Grzelak, M. The influence of effective microorganisms for some physical and water properties on arable-humus horizons of mineral soils. J. Res. Appl. Agric. Eng. 2007, 52, 73–7.
- Sawicka, B.; Pszczółkowski, P.; Noaema, A.H.; Krochmal-Marczak, B.; Kiełtyka-Dadasiewicz, A. Effective microorganisms in agriculture and food processing. In Contemporary Research on the State of the Environment and the Medicinal Use of Plants; Chwil, M., Michał, M., Wyd, S., Eds.; University of Life Sciences in Lublin: Lublin, Poland, 2019; pp. 45–65; ISBN 978-83-7259-310-8.(In Polish).
- Kołodziejczyk, M. Effectiveness of nitrogen fertilization and application of microbial preparations in potato cultivation. TJAF2014, 38, 299–310. [CrossRef]
- Pszczółkowski P, Sawicka B, Barbaś P, Skiba D, Krochmal-Marczak B. The Use of Effective Microorganisms as a Sustainable Alternative to Improve the Quality of Potatoes in Food Processing. Applied Sciences. 2023; 13(12): 7062. [CrossRef]
- Tatarowska, B.E.; Plich, J.; Milczarek, D.; Boguszewska-Mańkowska, D.; Zarzyńska, K. Genotype by Environment Interaction (GEI) Effect for Potato Tuber Yield and Their Quality Traits in Organic Multi-Environment Domains in Poland. Agriculture 2024, 14, 1591. [CrossRef]
- Gera Hol, W.H.; de Boer, W.; de Hollander, M.; Kuramae, E.E.; Meisner, A.; van der Putten, W.H. Context dependency and saturating effects of rare soil microbes on plant productivity. Front. Plant Sci. 2015, 6, 485.
- Lemanceau, P.; Blouin, M.; Muller, D.; Moënne-Loccoz, Y. Let the Core Microbiota Be Functional. Trends Plant Sci. 2017, 22, 583–595. [CrossRef]
- Gu, S.; Xiong, X.; Tan, L.; Deng, Y.; Du, X.; Yang, X.; Hu, Q. Soil microbial community assembly and stability are associated with potato (Solanum tuberosum L.) fitness under continuous cropping regime. Front. Plant Sci. 2022, 13, 1000045. [CrossRef]
- Pfeiffer, S.; Mitter, B.; Oswald, A.; Schloter-Hai, B.; Schloter, M.; Declerck, S.; Sessitsch, A. Rhizosphere microbiomes of potato cultivated in the high Andes show stable and dynamic core microbiomes with different responses to plant development. FEMS Microbiol. Ecol. 2017, 93, fiw242. [CrossRef]
- Tan, L.; Zeng, W.-A.; Xiao, Y.; Li, P.; Gu, S.; Wu, S.; Zhai, Z.; Feng, K.; Deng, Y.; Hu, Q. Fungi-Bacteria Associations in Wilt Diseased Rhizosphere and Endosphere by Interdomain Ecological Network Analysis. Front. Microbiol. 2021, 12, 722626. [CrossRef]
- Naqvi, S.A.H.; Abbas, A.; Farhan, M.; Kiran, R.; Hassan, Z.; Mehmood, Y.; Ali, A.; Ahmed, N.; Hassan, M.Z.; Alrefaei, A.F.; et al. Unveiling the Genetic Tapestry: Exploring Rhizoctonia solani AG-3 Anastomosis Groups in Potato Crops across Borders. Plants 2024, 13, 715. [CrossRef]
- Roman-Reyna, V.; Pinili, D.; Borjaa, F.N.; Quibod, I.; Groen, S.C.; Mulyaningsih, E.S.; Rachmat, A.; Slamet-Loedin, I.H.; Alexandrov, N.; Mauleon, R.; et al. The Rice Leaf Microbiome Has a Conserved Community Structure Controlled by Complex Host-Microbe Interactions. SSRN Electron. J. 2019. [CrossRef]
- Malacrinò, A.; Mosca, S.; Li Destri Nicosia, M.G.; Agosteo, G.E.; Schena, L. Plant Genotype Shapes the Bacterial Microbiome of Fruits, Leaves, and Soil in Olive Plants. Plants 2022, 11, 613. [CrossRef]
- Johansen, T. J.; Dees, M. W.; Hermansen, A. High soil moisture reduces common scab caused by Streptomyces turgidiscabies and Streptomyces European scabiei in potato. Acta Agriculture Scandinavica, Section B—Soil & Plant Science,2015, 65(3): 193-198.
- FAOSTAT, 2025. Crops and livestock products https://www.fao.org/faostat/en/#data/TCL.
- Trawczyński C., Wierzbicka A. The influence of cultivar and weather conditions during the vegetation period on the storage losses of potato tubers. Fragm. Agron. 35(3) 2018, 109–117, DOI: 10.26374/fa.2018.35.34. [CrossRef]
- Banerjee, A.; Hanna R.; Olken, Diana B.; Liskera S. 2024. Social protection in the developing world. Working Paper 32382. National Bureau of Economic Research, Cambridge, MA 02138, 2024. http://www.nber.org/papers/w32382.
- You, T.; Liu, Q.; Chen, M.; Tang, S.; Ou, L.; Li, D. Synthetic Microbial Communities Enhance Pepper Growth and Root Morphology by Regulating Rhizosphere Microbial Communities. Microorganisms 2025, 13, 148. [CrossRef]
- Yin, C.; Hagerty C.K.; Paulitz T.C. Synthetic microbial consortia derived from rhizosphere soil protects wheat against a soilborne fungal pathogen. Front. Microbiol., 2022 Sec. Terrestrial Microbiology, 13. [CrossRef]
- Xu, X.; Xu, Dinesen C., Pioppi, A.; Kovács, A.T.; Lozano-Andrade, C.N. Composing a microbial symphony: synthetic communities for promoting plant growth. Trends in Microbiology, 2025, 33(7), 738 - 751. [CrossRef]
- Berg G., Köberl, M.; Rybakova D.; Small K. et al. FEMS Microbiology Ecology 2017, 93(5). [CrossRef]
- Johansen, T. J.; Dees, M. W.; Hermansen, A. High soil moisture reduces common scab caused by Streptomyces turgidiscabies and Streptomyces European scabiei in potato. Acta Agriculture Scandinavica, Section B—Soil & Plant Science, 2015, 65(3): 193-198.
Figure 1.
The effect of EM treatment on the share of tubers with R. solani.
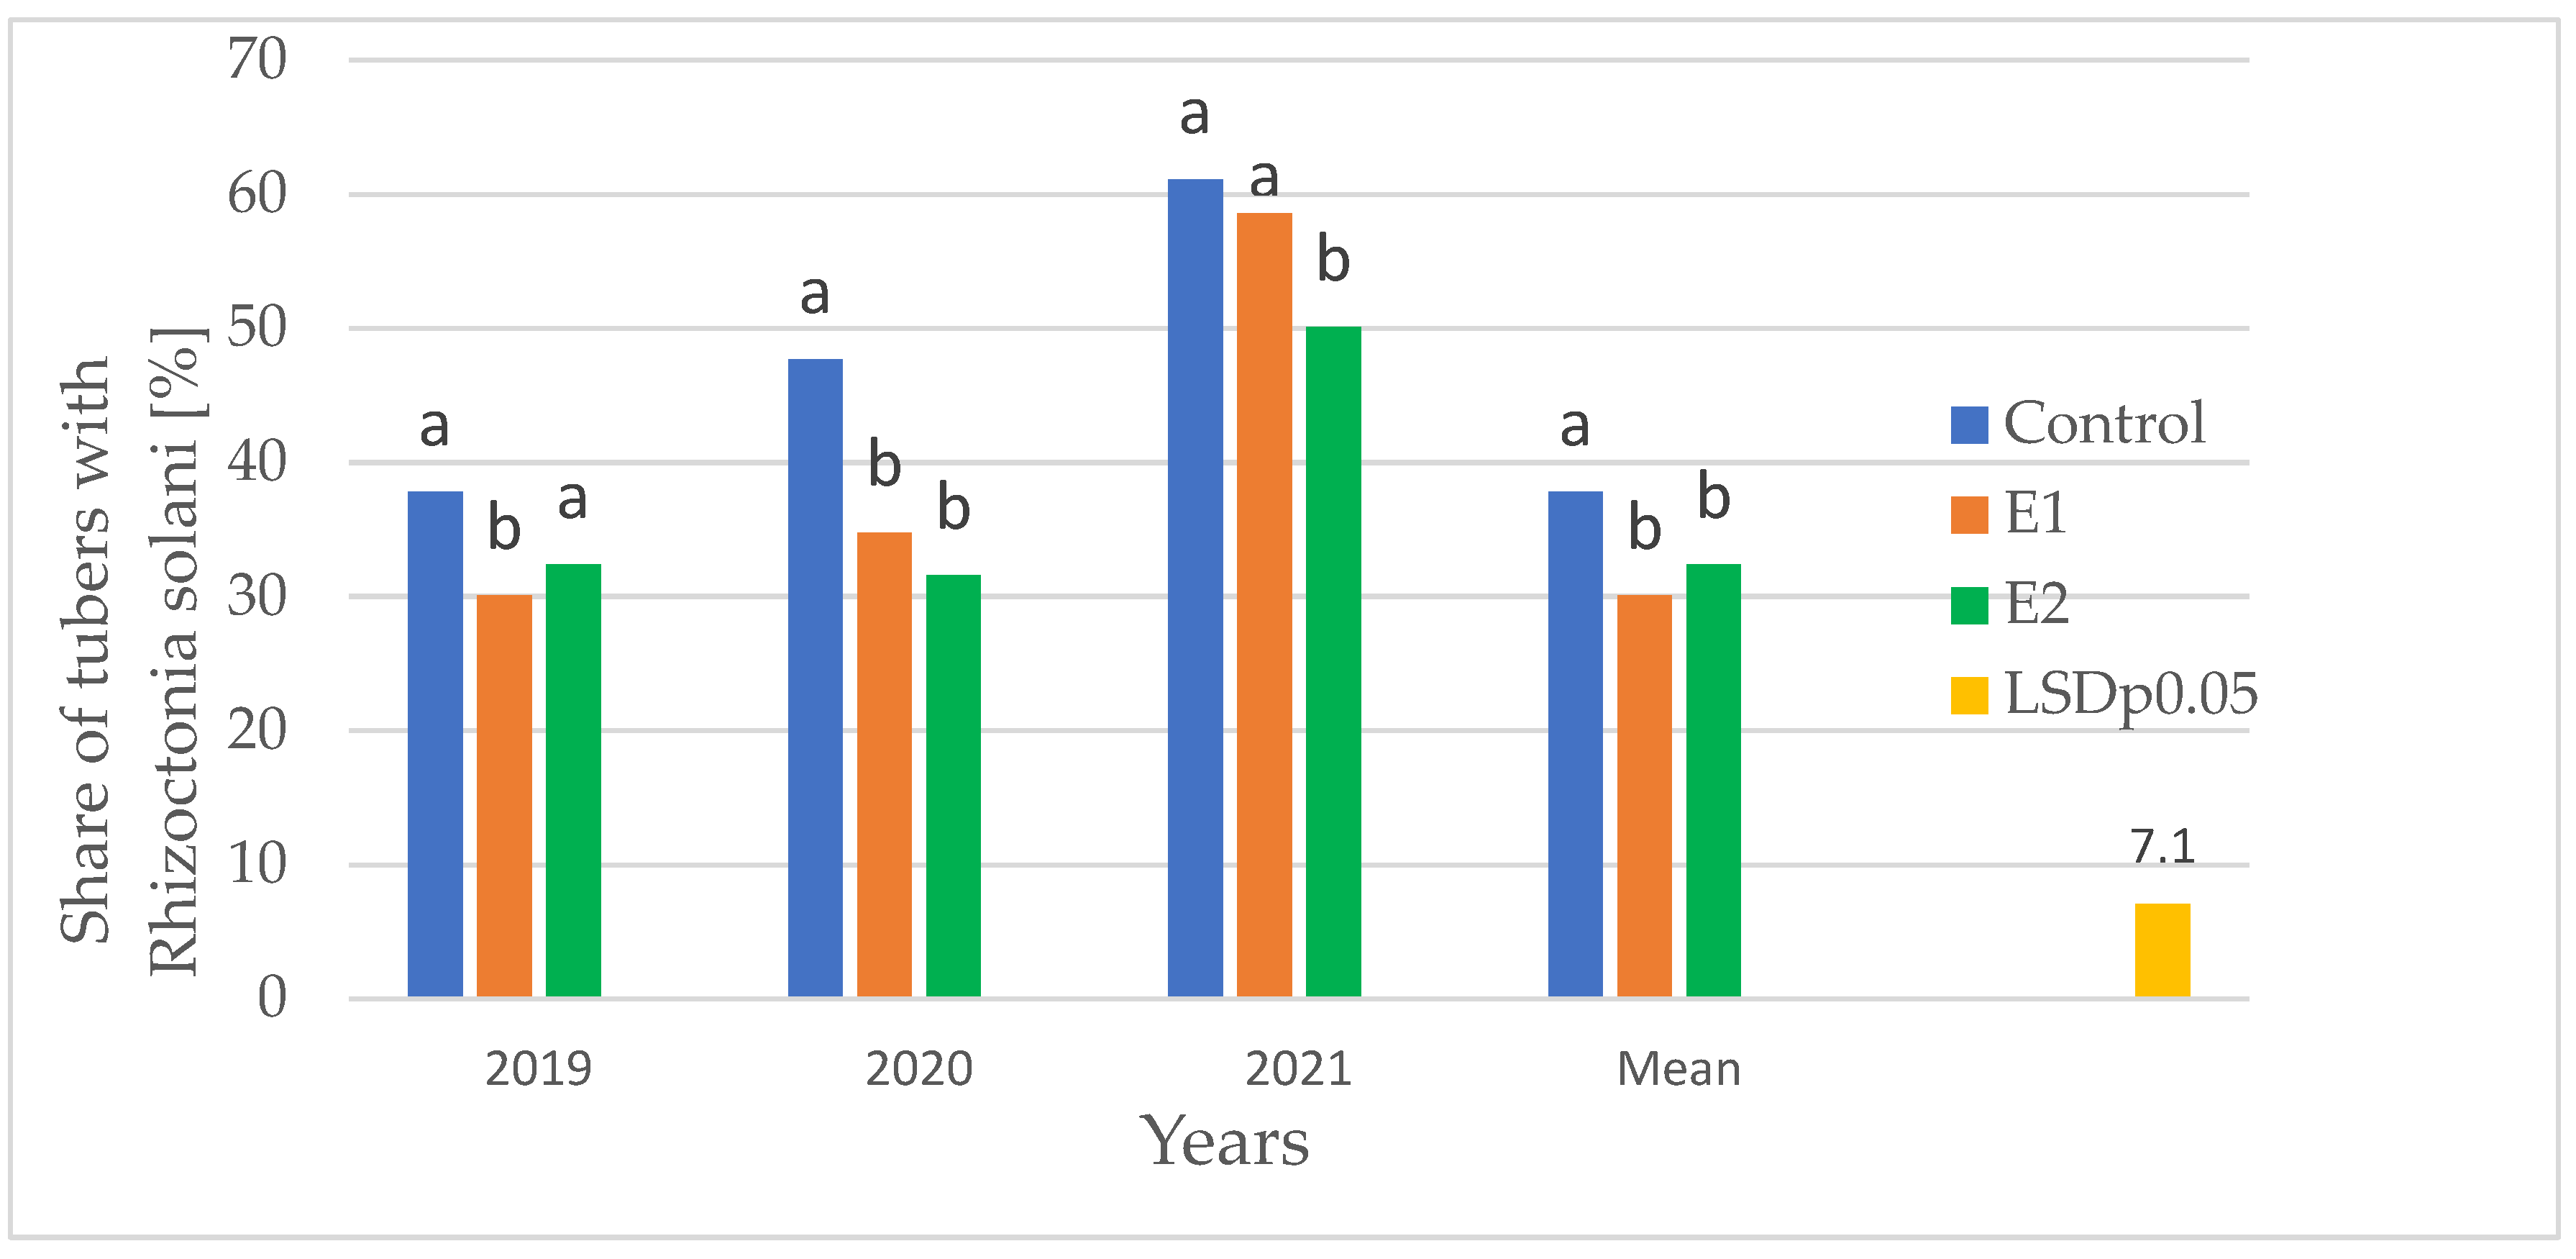
Figure 2.
Heat map of common scab severity (%) by cultivar and year of study. The color scale reflects the gradient of infection, with the transition from cool to warm colors indicating increased pathogen pressure correlated with variation in the hydrothermal coefficient (HTC).
Figure 2.
Heat map of common scab severity (%) by cultivar and year of study. The color scale reflects the gradient of infection, with the transition from cool to warm colors indicating increased pathogen pressure correlated with variation in the hydrothermal coefficient (HTC).
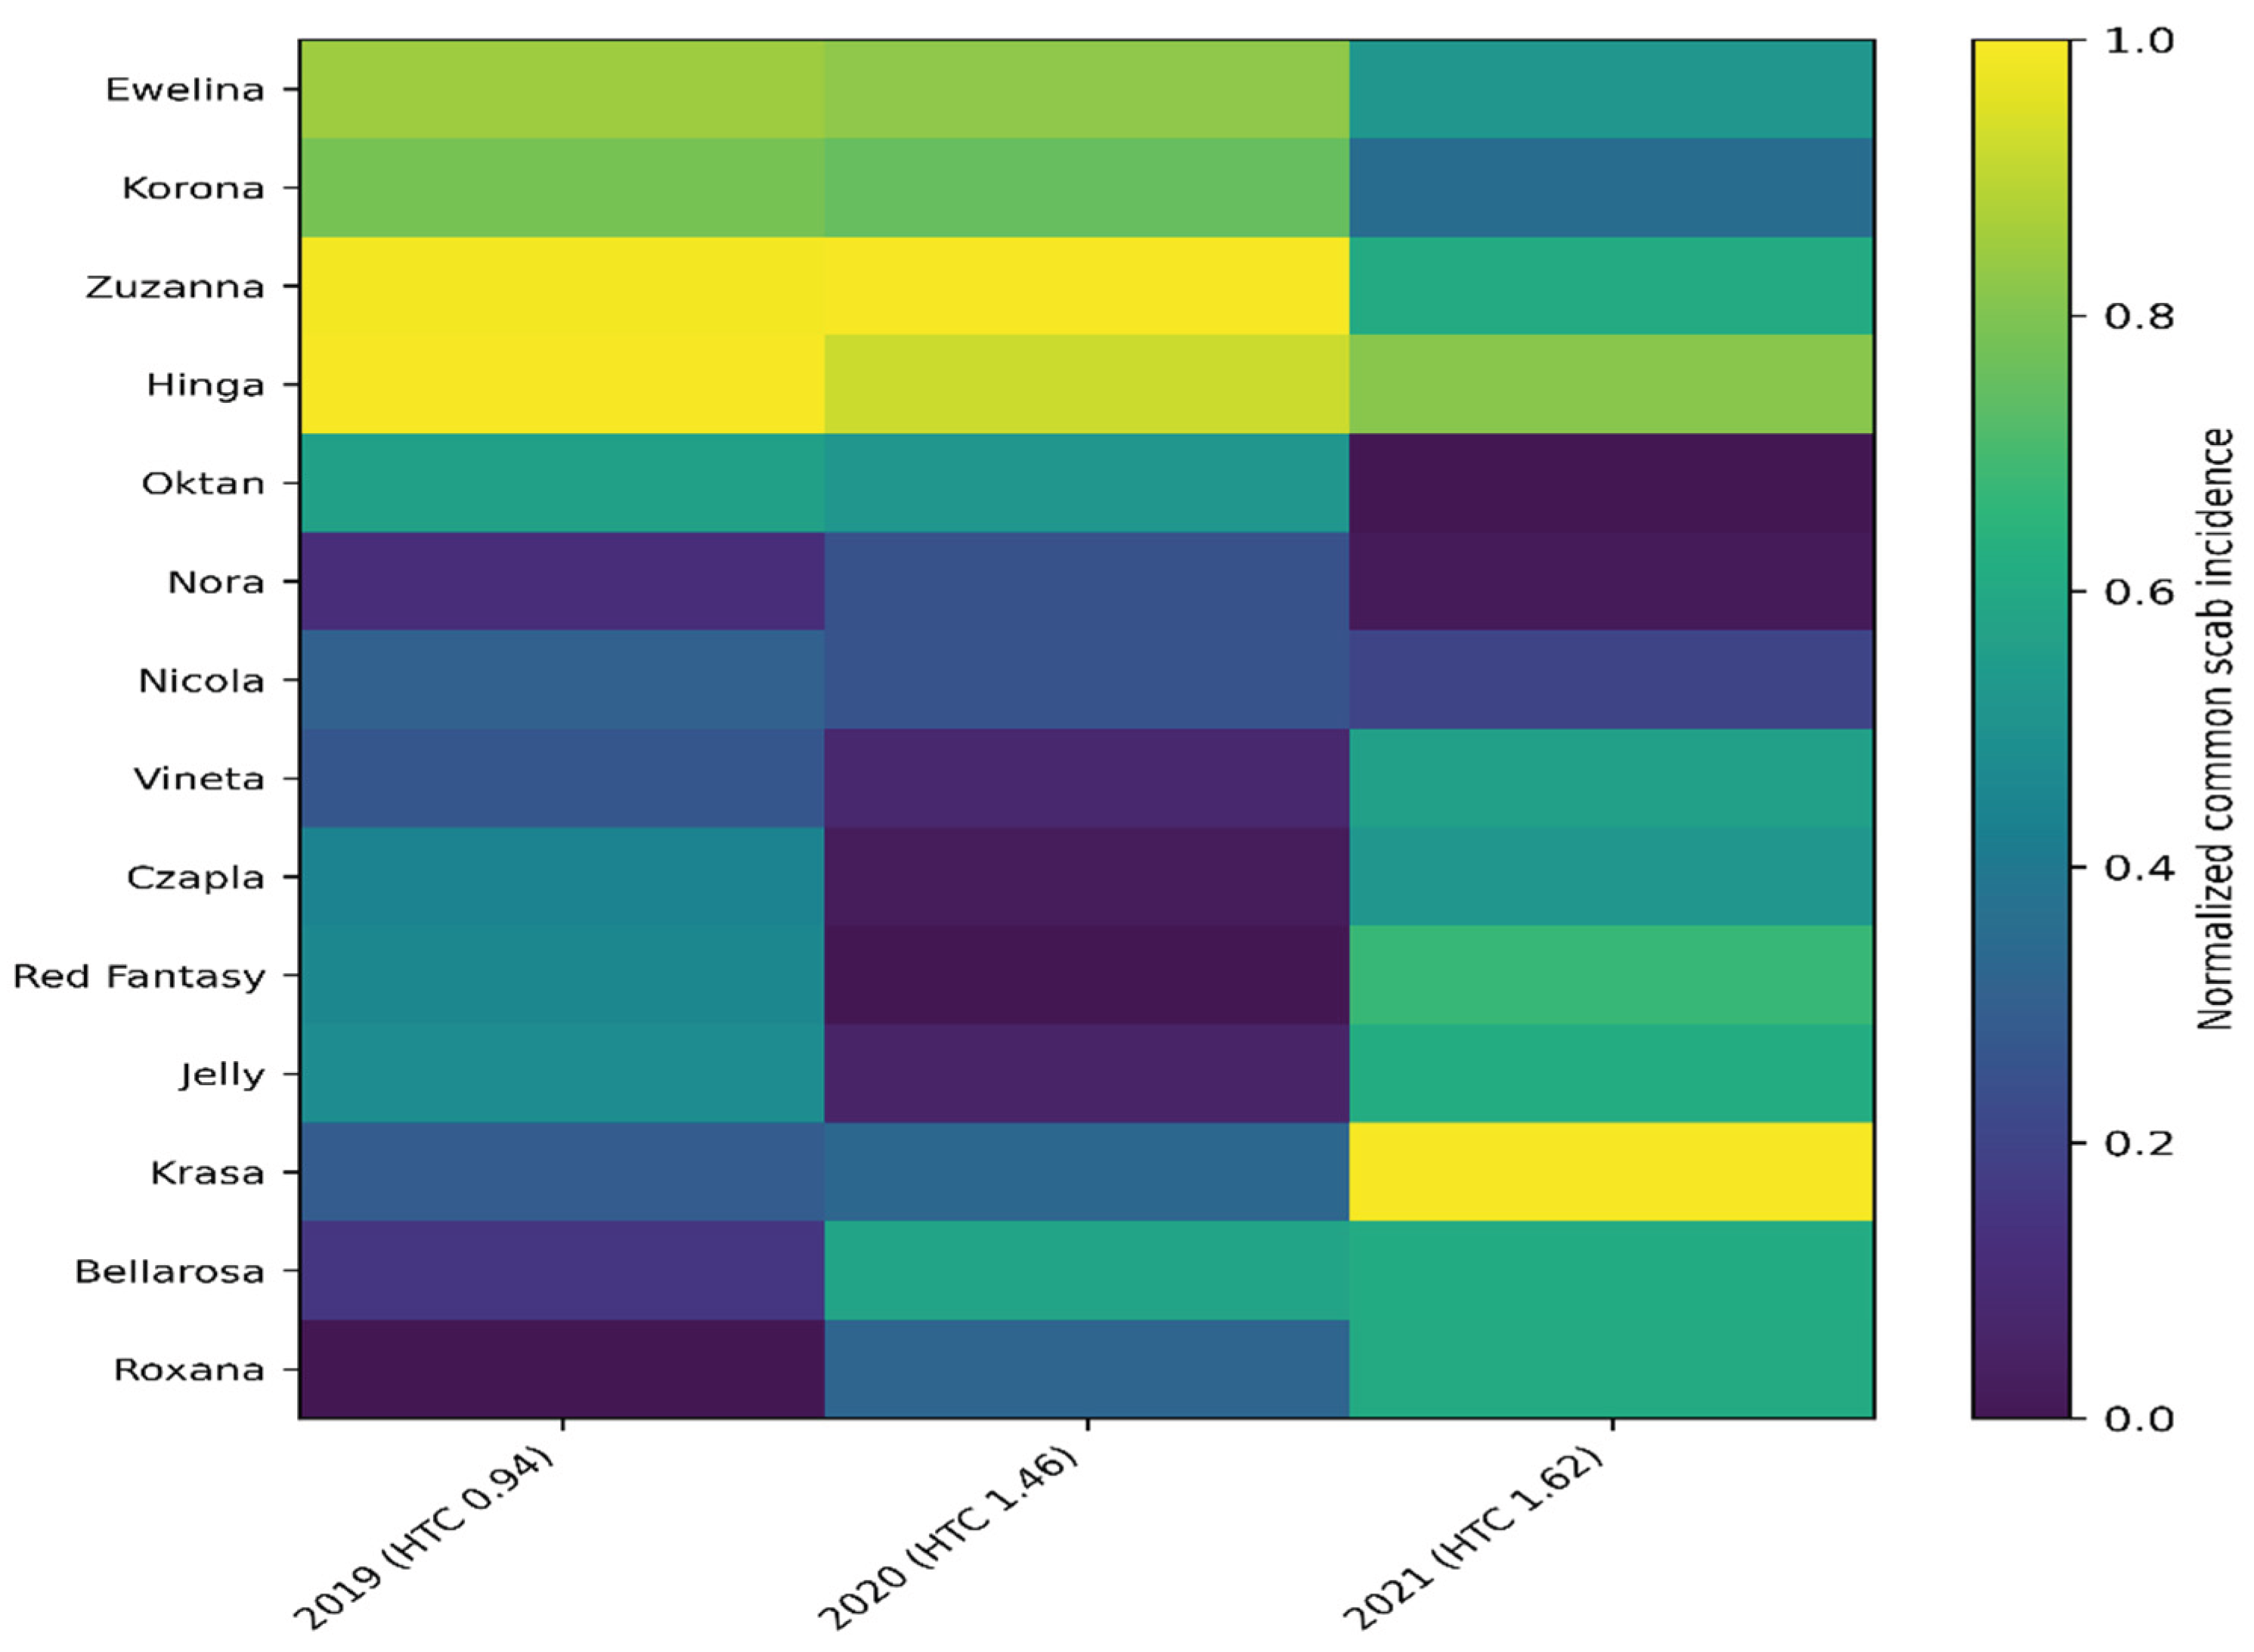
Figure 3.
Principal Component Analysis (PCA) biplot of factor loadings for potato tuber disease indices.
Figure 3.
Principal Component Analysis (PCA) biplot of factor loadings for potato tuber disease indices.
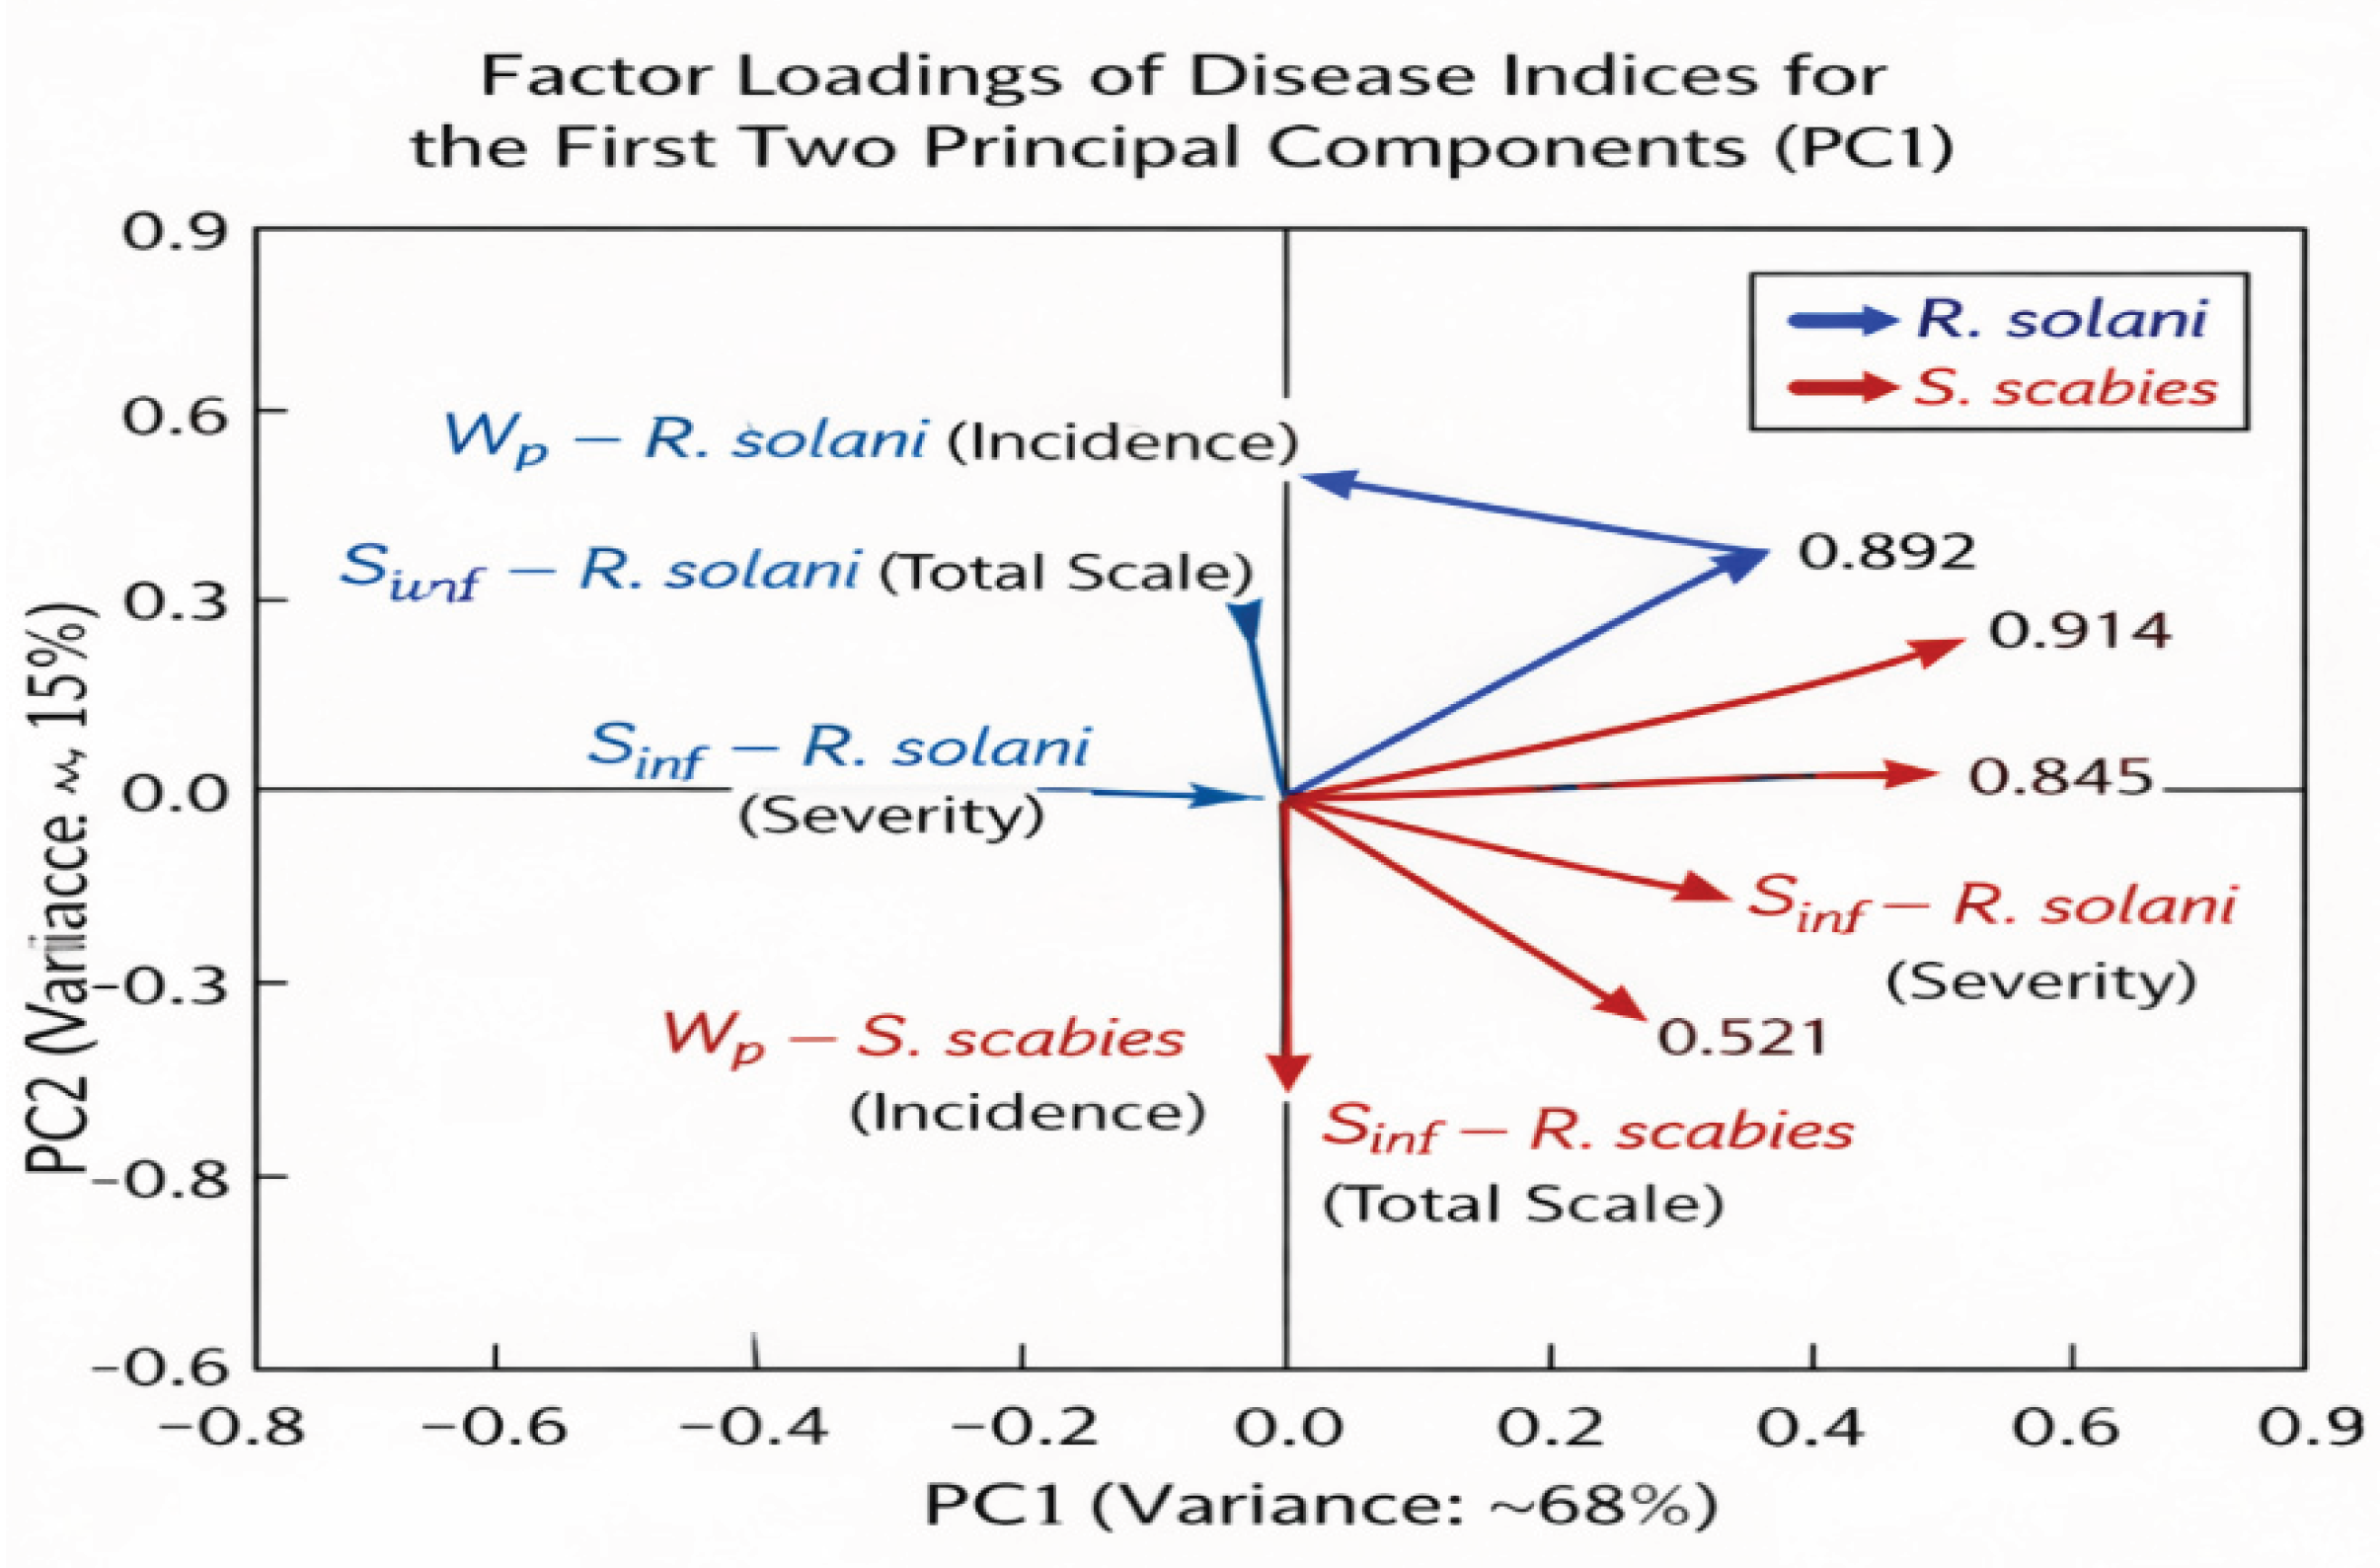
Figure 4.
Theoretical model of G x E x M.
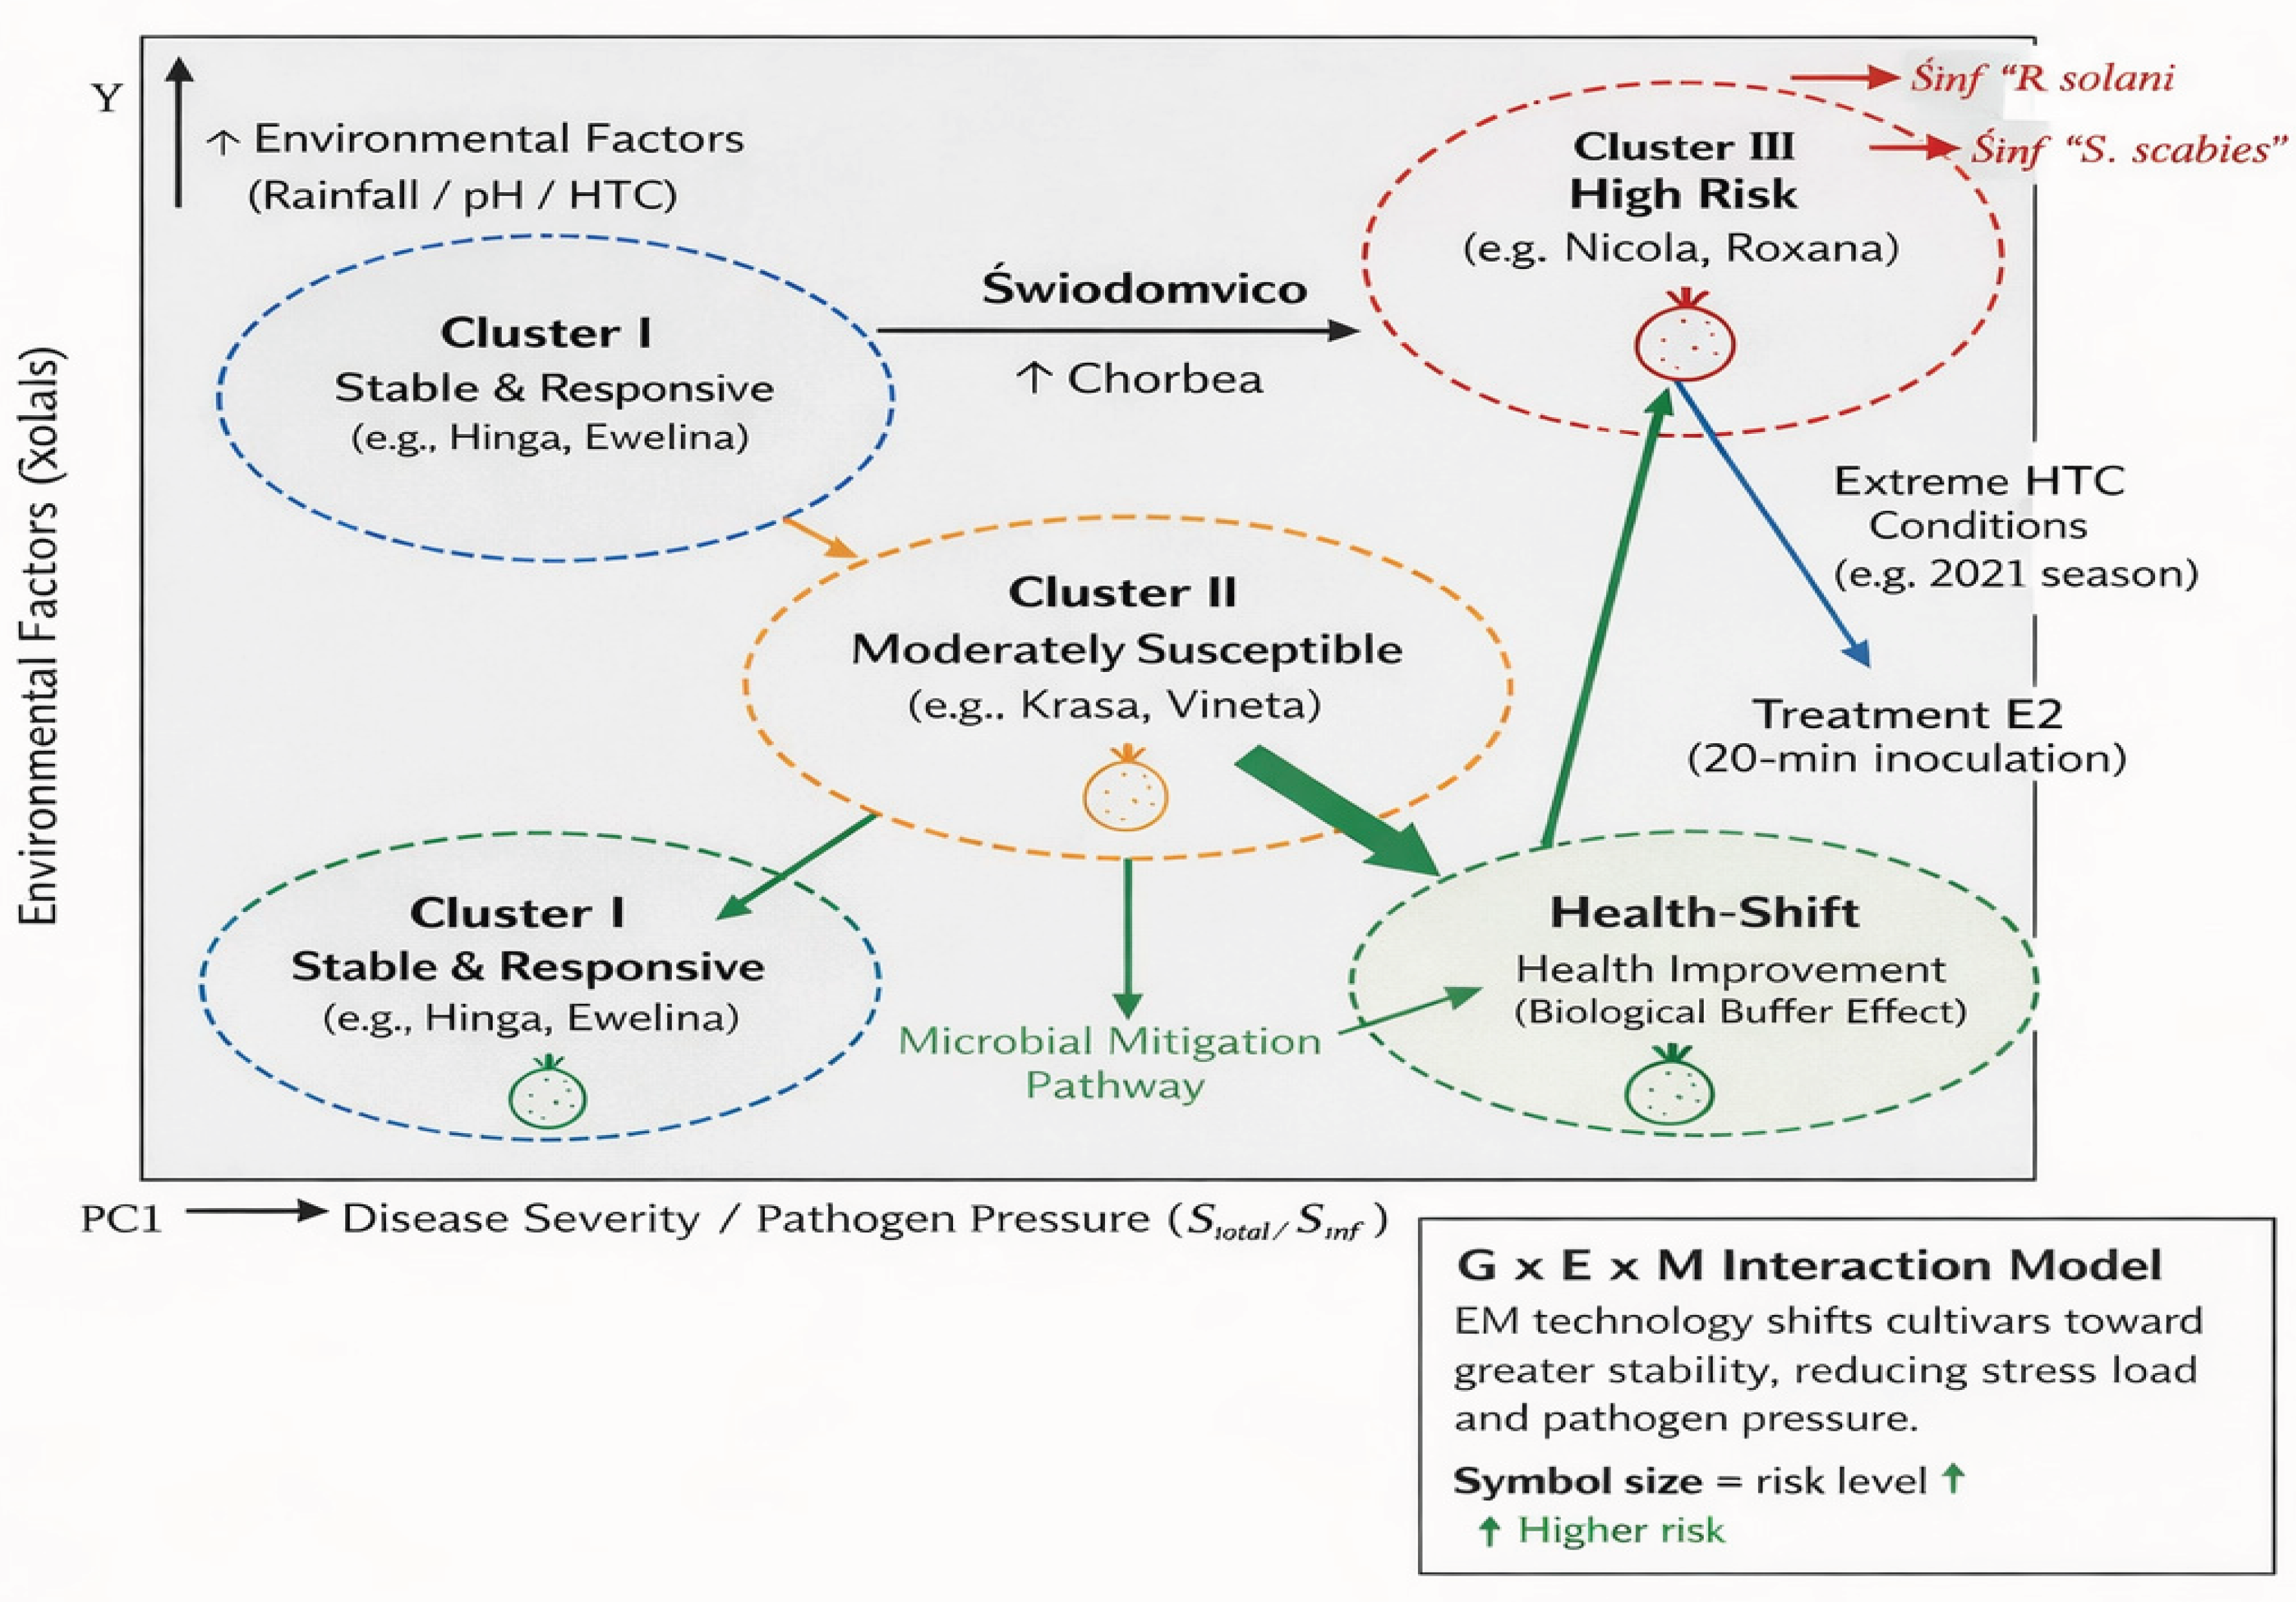

Table 1.
Genotypic and functional characteristics of the evaluated potato cultivars.
| Earliness Group | Cultivar | Culinary/Industrial Type | Rhizoctonia Resistance (1-9) | Common Scab Resistance (1-9) | Starch Potential |
| Very Early | Krasa | Table (AB) | 7.0 | 6.0 | Low |
| Korona | Table (AB) | 6.5 | 7.0 | Low | |
| Early | Nora | Table (AB) | 7.0 | 6.0 | Low |
| Bellarosa | Table (B) | 5.0 | 8.0 | Low | |
| Vineta | Table (AB) | 7.0 | 8.0 | Medium | |
| Ewelina | Table (B) | 6.5 | 7.0 | Low | |
| Medium | Nicola | Table (A/AB) | 6.5 | 7.0 | Low |
| Early | Roxana | Table (B) | 8.0 | 6.0 | Low |
| Red Fantasy | Table (AB) | 7.5 | 4.0 – 5.0 | Low | |
| Zuzanna | Starch | 6.0 | 7.0 | Very High | |
| Medium | Oktan | Table (AB) | 6.0 | 5.0 – 6.0 | Low |
| Late | Jelly | Table (B-BC) | 7.0 | 6.5 | Medium |
| Late | Czapla | Starch | 7.5 | 6.5 | High |
| Hinga | Starch | 8.0 | 6.0 | Very High |
*Note on the scale: Values for Common scab and Rhizoctonia are based on the standard 9-point scale, where 9 represents the highest resistance and 1 represents the lowest.
Table 2.
Care treatments in the conducted experiment.
| Target | Product Name | Formulation | Dosage (per ha) | Timing / Application |
| Weeds (Pre-emergence) | Proman 500 SC | SC (Suspension) | 4.0 dm³ | Just before emergence |
| Weeds (Post-emergence) | Fusilade Forte 150 EC | EC (Liquid) | 1.5 dm³ | 2-3 leaf stage of grasses |
| Colorado Potato Beetle | Karate Zeon 050 CS | CS (Capsule) | 0.12 dm³ | Combined with fungicides |
| Kestrel 200 SL | EC (Liquid) | 0.25 dm³ | Combined with fungicides | |
| Spintor 240 SC | SC (Suspension) | 0.15 dm³ | Combined with fungicides | |
| Cyperkill Max 500 EC | EC (Liquid) | 0.06 dm³ | Combined with fungicides | |
| Late Blight | Carial Star 500 SC | SC (Suspension) | 0.6 dm³ | Threshold-based |
| Curzate 60 WG | WG (Granule) | 0.15 kg | Threshold-based | |
| Tanos 50 WG | WG (Granule) | 0.70 kg | Threshold-based | |
| Altima 500 S.C. | SC (Suspension) | 0.40 dm³ | Threshold-based |
Table 3.
Soil properties prior to the initiation of the experiment.
| Year | P2O5 [mg⋅100g−1] | K2O [mg⋅100g−1] | Mg [mg⋅100g−1] | pH (in 1M KCl) |
| 2019 | 20.2 | 11.8 | 4.4 | 5.8 |
| 2020 | 21.4 | 12.6 | 8.2 | 6.2 |
| 2021 | 16.0 | 13.4 | 7.3 | 6.1 |
| Mean | 19.2 | 12.6 | 6.6 |
Source: Analyzed by the District Chemical and Agricultural Station in Lublin.
Table 4.
Temperature and precipitation patterns and hydrothermal coefficients during the potato vegetation period according to the meteorological station in Uhnin.
Table 4.
Temperature and precipitation patterns and hydrothermal coefficients during the potato vegetation period according to the meteorological station in Uhnin.
| Year | Parameters | April | May | June | July | August | September | Mean/ Sum |
| 2019 | Air temperature [°C] * | 9.8 | 13.5 | 21.8 | 18.9 | 19.4 | 14.3 | 16.3 |
| Rainfall [mm]** | 1.8 | 91.5 | 34.6 | 45.3 | 41.6 | 65.6 | 280.4 | |
| HTC*** | 0.06 | 2.19 | 0.53 | 0.77 | 0.69 | 1.53 | 0.94 | |
| 2020 | Air temperature [°C] | 7.5 | 11.5 | 18.4 | 19.3 | 19.8 | 15.6 | 15.4 |
| Rainfall [mm] | 5.2 | 96.1 | 115.8 | 68.4 | 85.5 | 44.2 | 415.2 | |
| HTC | 0.23 | 2.70 | 2.10 | 1.14 | 1.39 | 0.94 | 1.46 | |
| 2021 | Air temperature [°C] | 6.5 | 12.3 | 19.0 | 22.3 | 17.6 | 14.1 | 15.3 |
| Rainfall [mm] | 38.0 | 65.1 | 54.5 | 112.4 | 165.2 | 50.4 | 485.6 | |
| HTC | 1.95 | 1.71 | 0.96 | 1.63 | 03.03 | 1.19 | 1.62 |
*Air Temperature – Mean monthly air temperature; **Rainfall – Total monthly precipitation; ***HTC – hydrothermal coefficient was calculated according to the formula: k = 10P ∑ t [26], where P represents the total monthly precipitation in mm, and Σt is the monthly cumulative air temperature > 0 ◦C. The index values were categorized as follows: extremely dry (k ≤ 0.4), very dry (0.4 < k ≤ 0.7), dry (0.7 < k ≤ 1.0), rather dry (1.0 < k ≤ 1.3), optimal (1.3 < k ≤ 1.6), rather humid (1.6 < k ≤ 2.0), wet (2.0 < k ≤ 2.5), very humid (2.5 ≤ k ≤ 3.0), and extremely humid (k > 3.0).
Table 5.
Cumulative indicators of common scab infection depending on cultivar and treatment (Means 2019–2021).
Table 5.
Cumulative indicators of common scab infection depending on cultivar and treatment (Means 2019–2021).
| Earliness Group | Cultivar | Treatment | Share of Tubers with Common Scab [%] | Degree of Sample Infection (1-9 scale) | Degree of Infection of Affected Tubers (1-9 scale) |
| Very Early | Krasa | Control | 52.3 c*** | 8.2 a | 6.2 a |
| E1* | 53.7 c | 6.4 c | 5.8 b | ||
| E2** | 67.7 a | 7.3 b | 5.3 c | ||
| Korona | Control | 80.0 a | 7.0 c | 6.8 b | |
| E1 | 59.0 c | 7.3 b | 5.7 c | ||
| E2 | 67.0 b | 7.8 a | 7.2 a | ||
| Early | Nora | Control | 51.7 a | 8.1 b | 6.7 b |
| E1 | 53.3 a | 6.5 c | 6.7 b | ||
| E2 | 21.3 b | 8.5 a | 6.9 a | ||
| Bellarosa | Control | 47.4 c | 7.3 b | 6.0 b | |
| E1 | 56.0 b | 7.8 a | 6.8 a | ||
| E2 | 65.0 a | 7.6 ab | 6.8 a | ||
| Vineta | Control | 49.4 ab | 6.7 b | 6.1 b | |
| E1 | 41.4 b | 8.0 a | 6.6 a | ||
| E2 | 51.7 a | 8.0 a | 6.4 a | ||
| Ewelina | Control | 66.6 c | 8.1 a | 7.1 c | |
| E1 | 74.2 b | 7.5 c | 7.6 b | ||
| E2 | 78.8 a | 7.8 b | 87.7* a | ||
| Medium | Nicola | Control | 56.7 a | 7.5 b | 6.5 b |
| Early | E1 | 48.7 b | 7.4 b | 6.4 b | |
| E2 | 35.3 c | 8.0 a | 6.8 a | ||
| Roxana | Control | 50.3 b | 7.5 b | 6.5 b | |
| E1 | 39.4 c | 8.5 a | 6.3 c | ||
| E2 | 54.3 a | 7.9 b | 6.8 a | ||
| Red | Control | 53.2 a | 6.5 c | 6.7 c | |
| Fantasy | E1 | 51.8 a | 7.4 b | 7.1 b | |
| E2 | 46.9 b | 8.4 a | 7.3 a | ||
| Zuzanna | Control | 86.9 a | 6.7 c | 6.5 b | |
| E1 | 78.6 b | 8.3 a | 6.9 a | ||
| E2 | 73.6 c | 7.0 b | 6.6 b | ||
| Medium | Oktan | Control | 65.5 b | 8.1 b | 6.2 c |
| Late | E1 | 69.0 a | 8.4 a | 6.8 b | |
| E2 | 32.5 c | 7.6 c | 7.1 a | ||
| Jelly | Control | 58.6 b | 6.6 c | 6.9 c | |
| E1 | 59.0 b | 8.6 a | 7.3 b | ||
| E2 | 37.7 c | 8.4 b | 7.4 a | ||
| Late | Czapla | Control | 60.7 a | 6.3 c | 6.7 b |
| E1 | 51.8 b | 8.5 a | 7.1 a | ||
| E2 | 34.8 c | 8.4 a | 6.7 b | ||
| Hinga | Control | 82.2 a | 8.3 a | 6.5 b | |
| E1 | 78.2 b | 7.2 b | 5.0 c | ||
| E2 | 81.1 ab | 7.1 b | 6.8 a | ||
| Total Mean | Control | 61.5 a | 7.3 b | 6.5 b | |
| E1 | 57.9 b | 7.6 ab | 6.6 ab | ||
| E2 | 52.0 c | 7.8 a | 6.8 a |
* Exposure 10 minutes; ** exposure 20 minutes; ***means followed by the same letter are not significantly different according to Tukey's HSD test (p < 0.05).
Table 6.
Annual Summary of Common Scab Indicators (All Cultivars Combined).
| Year | Share of tubers with common scab [%] | Degree of sample infection [9° scale] |
Degree of infection of affected tubers [9° scale] |
| 2019 | 53.6 b | 8.1 a | 7.0 a |
| 2020 | 39.1 c | 8.0 a | 6.8 b |
| 2021 | 78.5 a | 6.6 b | 5.8 c |
| LSDp0.05 | 2.5 | 0.4 | 0.3 |
* Means followed by the same letter are not significantly different according to Tukey's HSD test (p < 0.05).
Table 7.
Cumulative indicators of common scab infection by years and treatments (Means of cultivars).
Table 7.
Cumulative indicators of common scab infection by years and treatments (Means of cultivars).
| Year | Treatment | Share of tubers with common scab [%] | Degree of sample infection [9° scale] | Degree of infection of affected tubers [9° scale] |
| 2019 | Control | 56.4 c*** | 7.9 b | 7.0 a |
| E1* | 51.2 d | 8.2 a | 7.1 a | |
| E2** | 53.2 cd | 8.1 ab | 6.9 a | |
| 2020 | Control | 42.5 f | 8.0 ab | 6.8 b |
| E1* | 40.8 f | 8.1 a | 6.8 b | |
| E2** | 34.0 g | 8.0 ab | 6.8 b | |
| 2021 | Control | 85.6 a | 6.1 d | 5.4 d |
| E1* | 81.7 b | 6.5 c | 5.9 c | |
| E2** | 68.2 e | 7.3 b | 6.2 c | |
| Control | 53.6 b | 8.1 a | 7.0 a | |
| Mean | E1* | 39.1 c | 8.0 a | 6.8 b |
| E2** | 78.5 a | 6.6 b | 5.8 c |
* Exposure 10 minutes; ** exposure 20 minutes; ***means followed by the same letter are not significantly different according to Tukey's HSD test (p < 0.05).
Table 8.
The influence of pre-planting treatments and genetic traits on R. solani infection rates.
| Earliness Group | Cultivar | Treatment | Share of infected tubers [%] | Infection degree of tuber sample (1-9 scale) | Infection degree of infected tubers (1-9 scale) |
| Very Early | Krasa | Control | 28.2 de*** | 6.8 bcdef | 7.7 abc |
| E1 | 60.1 pqr | 6.8 bcdef | 6.7 ghij | ||
| E2 | 50.3 klmn | 7.2 ghij | 7.8 abc | ||
| Korona | Control | 41.8 hijk | 7.0 defgh | 6.6 hij | |
| E1 | 59.0 pqr | 6.4 ab | 6.8 ghij | ||
| E2 | 35.8 fghij | 6.2 a | 7.1 defg | ||
| Early | Nora | Control | 28.9 defgh | 7.3 hijk | 7.9 ab |
| E1 | 41.2 hijk | 6.9 cdefg | 7.9 ab | ||
| E2 | 39.7 ghijk | 7.9 mn | 7.8 abc | ||
| Bellarosa | Control | 47.6 jklm | 8.0 n | 7.3 cdef | |
| E1 | 36.3 fghij | 7.8 lmn | 7.7 abcd | ||
| E2 | 54.8 nopq | 7.9 mn | 7.6 abcd | ||
| Vineta | Control | 26.9 cdefg | 6.8 bcdef | 7.5 bcde | |
| E1 | 53.2 mnop | 6.8 bcdef | 7.2 cdef | ||
| E2 | 54.2 mnop | 7.2 ghij | 7.2 cdef | ||
| Ewelina | Control | 42.3 hijk | 6.8 bcdef | 7.0 efgh | |
| E1 | 37.3 ghij | 6.7 abcd | 7.2 cdef | ||
| E2 | 19.2 ab | 6.7 abcd | 7.6 abcd | ||
| Medium | Nicola | Control | 62.8 qr | 6.8 bcdef | 7.5 bcde |
| Early | E1 | 35.9 fghij | 7.4 ijkl | 7.8 abc | |
| E2 | 73.7 s | 6.3 a | 6.9 fghi | ||
| Roxana | Control | 49.8 klmn | 7.2 ghij | 7.6 abcd | |
| E1 | 33.2 efghi | 7.2 ghij | 7.9 ab | ||
| E2 | 62.7 qr | 7.0 defgh | 7.1 defg | ||
| Red | Control | 40.8 hijk | 6.8 bcdef | 7.1 defg | |
| Fantasy | E1 | 37.3 ghij | 6.4 ab | 7.3 cdef | |
| E2 | 22.2 bc | 6.6 abcd | 7.8 def | ||
| Zuzanna | Control | 42.9 hijk | 6.8 bcdef | 7.0 efgh | |
| E1 | 31.0 defgh | 6.1 a | 7.1 defg | ||
| E2 | 32.6 efghi | 7.0 defgh | 7.2 cdef | ||
| Medium | Oktan | Control | 68.3 rs | 6.7 abcd | 6.6 hij |
| Late | E1 | 45.3 ijk | 6.3 a | 6.8 ghij | |
| E2 | 40.3 hijk | 6.7 abcd | 6.9 fghi | ||
| Jelly | Control | 36.6 fghij | 6.6 abcd | 7.0 efgh | |
| E1 | 51.0 klmn | 6.1 a | 6.8 ghij | ||
| E2 | 39.8 ghijk | 6.7 abcd | 6.9 fghi | ||
| Late | Czapla | Control | 44.5 ijk | 6.6 abcd | 6.5 ij |
| E1 | 53.8 mnop | 6.6 abcd | 6.8 ghij | ||
| E2 | 56.5 opq | 6.9 cdefg | 6.9 fghi | ||
| Hinga | Control | 43.6 hijk | 6.3 a | 7.0 efgh | |
| E1 | 42.9 hijk | 4.6 z* | 7.2 cdef | ||
| E2 | 19.7 abc | 6.8 bcdef | 7.5 bcde |
* Exposure 10 minutes (E1); ** exposure 20 minutes (E2); ***means followed by the same letter are not significantly different according to Tukey's HSD test (p < 0.05).
Table 9.
The influence of meteorological conditions in the study years on the susceptibility of selected potato cultivars to R. solani infection.
Table 9.
The influence of meteorological conditions in the study years on the susceptibility of selected potato cultivars to R. solani infection.
| Earliness Group | Cultivar | Year | Share of tubers with Rhizoctonia [%] |
Infection degree of tuber sample (1-9 scale) | Infection degree of infected tubers (1-9 scale) |
| Very Early | Krasa | 2019 | 44.7 klm* | 6.7 fghi | 7.9 ab |
| 2020 | 30.3 defg | 7.0 hijk | 8.4 a | ||
| 2021 | 63.6 pqr | 7.2 jklm | 5.9 jk | ||
| Korona | 2019 | 39.0 hijk | 5.6 ab | 5.8 k | |
| 2020 | 42.3 ijkl | 6.9 ghij | 8.1 ab | ||
| 2021 | 55.3 nopq | 7.1 ijkl | 6.6 ghijk | ||
| Early | Nora | 2019 | 21.3 bc | 7.7 o | 8.6 a |
| 2020 | 32.0 efgh | 6.9 ghij | 8.4 a | ||
| 2021 | 56.4 nopq | 7.4 lmno | 6.6 ghijk | ||
| Bellarosa | 2019 | 0.0 a | 9.0 p | 9.0 a | |
| 2020 | 67.3 qr | 6.7 fghi | 7.6 abcde | ||
| 2021 | 71.3 rs | 7.8 o | 6.5 hijk | ||
| Vineta | 2019 | 51.7 mno | 6.2 cde | 7.5 bcdef | |
| 2020 | 24.3 bcd | 6.8 ghij | 8.5 a | ||
| 2021 | 58.3 opqr | 7.9 o | 6.0 ijk | ||
| Ewelina | 2019 | 28.2 def | 5.9 bcd | 6.3 ijk | |
| 2020 | 20.0 ab | 7.0 hijk | 8.6 a | ||
| 2021 | 50.9 lmno | 7.3 klmn | 7.1 efghi | ||
| Medium | Nicola | 2019 | 48.7 lmn | 6.4 def | 7.9 ab |
| Early | 2020 | 52.0 mno | 6.7 fghi | 7.8 abc | |
| 2021 | 71.7 rs | 7.3 klmn | 6.3 ijk | ||
| Roxana | 2019 | 12.7 ab | 6.9 ghij | 8.7 a | |
| 2020 | 56.0 nopq | 6.7 fghi | 7.8 abc | ||
| 2021 | 77.0 s | 7.7 no | 6.0 ijk | ||
| Red | 2019 | 28.7 def | 5.6 ab | 5.6 k | |
| Fantasy | 2020 | 23.7 bcd | 6.8 ghij | 8.5 a | |
| 2021 | 48.0 lmn | 7.3 klmn | 5.6 k | ||
| Zuzanna | 2019 | 30.4 defg | 5.8 bc | 6.1 ijk | |
| 2020 | 34.0 fghi | 7.0 hijk | 8.3 a | ||
| 2021 | 42.0 ijkl | 7.4 lmno | 7.0 fghij | ||
| Medium | Oktan | 2019 | 44.0 ijkl | 5.6 ab | 5.8 k |
| Late | 2020 | 53.3 mnop | 6.9 ghij | 7.9 ab | |
| 2021 | 56.5 nopq | 7.2 jklm | 6.6 ghijk | ||
| Jelly | 2019 | 36.4 ghij | 5.6 ab | 5.9 jk | |
| 2020 | 47.3 klmn | 6.3 cde | 7.9 ab | ||
| 2021 | 43.7 ijkl | 7.6 no | 6.8 fghijk | ||
| Late | Czapla | 2019 | 44.2 ijkl | 5.7 abc | 5.7 k |
| 2020 | 52.0 mno | 6.8 ghij | 7.8 abc | ||
| 2021 | 58.6 opqr | 7.6 no | 6.5 hijk | ||
| Hinga | 2019 | 30.4 defg | 5.1 a | 6.2 ijk | |
| 2020 | 22.7 bc | 7.0 hijk | 8.5 a | ||
| 2021 | 53.2 mnop | 5.7 abc | 7.0 fghij |
* Means followed by the same letter are not significantly different according to Tukey's HSD test (p < 0.05).
Table 10.
Relationships between the Sielianinov coefficient, the intensity of R. solani infection and the yield of tubers under inoculation conditions.
Table 10.
Relationships between the Sielianinov coefficient, the intensity of R. solani infection and the yield of tubers under inoculation conditions.
| Variables | Hydrothermal Coefficient (HTC) | EM exposure time | R. solani infection (DSI) | Total tubers yield |
| Hydrothermal Coefficient (HTC) | 1.00 | 0.00 | 0.68 (▲) | -0.24 |
| EM exposure time | 0.00 | 1.00 | -0.54 (▼) | 0.42 (▲) |
| R. solani infection (DSI) | 0.68 | -0.54 | 1.00 | -0.72 (▼) |
| Total tuber yield | -0.24 | 0.42 | -0.72 | 1.00 |
Statistical Significance: Most often (bold + symbol) indicates a significant relationship at the p < 0.05 level, which provides a basis for drawing conclusions about the effectiveness of the treatment or the impact of the environment. The symbol ▼ indicates a negative correlation (e.g., with increasing EM treatment time, the degree of tuber infection decreases).
Table 11.
Factor loadings of disease indices for the first two principal components (PC1 and PC2).
| Variable (Disease Index) | PC1 (Variance: ~68%) | PC2 (Variance: ~15%) |
| Wp – R. solani (Incidence) | 0.892 | -0.112 |
| Stotal – R. solani (Total Scale) | 0.914 | 0.054 |
| Sinf – R. solani (Severity) | 0.845 | 0.231 |
| Wp – S. scabies (Incidence) | 0.521 | -0.742 |
| Stotal – S. scabies (Total Scale) | 0.584 | -0.695 |
| Sinf – S. scabies (Severity) | 0.492 | -0.512 |
Table 12.
Classification of potato cultivars based on health stability and responsiveness to EM inoculation (PCA & Cluster Analysis integration).
Table 12.
Classification of potato cultivars based on health stability and responsiveness to EM inoculation (PCA & Cluster Analysis integration).
| Group | Cultivars | Characteristics | Strategic Recommendation |
| I. Stable & High-Responsive | Hinga, Ewelina, Zuzanna | Low scores on PC1 (infection axis). High stability across years. Strongest reduction of Sinf in variant E2. | Ideal candidates for biological soil engineering and organic farming. |
| II. Intermediate / Plastic | Krasa, Vineta, Jelly, Nora, Korona | Moderate loadings. Health status is highly dependent on HTC (weather). Visible but variable response to EM. | Require optimized exposure time (E2) and monitoring of May/June rainfall. |
| III. High-Risk / Susceptible | Nicola, Roxana, Bellarosa* | High positive loadings on PC1 (Stotal & Sinf). Frequent classification in the "high infection" cluster. | Require combined protection (EM + integrated management). High risk in wet years. |
*Bellarosa exhibits extreme plasticity – very healthy in dry years, but highly susceptible in wet years (high PC2 interaction).
Table 13.
Theoretical model of the health-Shift mechanism induced by EM Farming™ technology.
| Cultivar Status | EM Mode of Action | Effect on PCA / Cluster Analysis |
| Control Cultivar (C) | Relies solely on genetic resistance (often insufficient under high Hydrothermal Coefficient – HTC conditions). | Located in "High-Risk" or "Intermediate" clusters. Strong positive correlation with the Sinf vector. |
| Inoculation E1 (10 min) |
Initiation of the biofilm. Activation of basic Non-specific Systemic Resistance (NSR) mechanisms. | Vector shift: The object moves left along the PC1 axis (reduction in disease severity). |
| Inoculation E2 (20 min) |
Full colonization of the geocaulosphere. Stabilization of the "core" microbiome. Strong suppression of R. solani. | Reclassification: The object moves to the "Stable & Healthy" cluster. Increased Euclidean distance from the pathogen. |
Disclaimer/Publisher’s Note: The statements, opinions and data contained in all publications are solely those of the individual author(s) and contributor(s) and not of MDPI and/or the editor(s). MDPI and/or the editor(s) disclaim responsibility for any injury to people or property resulting from any ideas, methods, instructions or products referred to in the content. |
© 2026 by the authors. Licensee MDPI, Basel, Switzerland. This article is an open access article distributed under the terms and conditions of the Creative Commons Attribution (CC BY) license (http://creativecommons.org/licenses/by/4.0/).
Copyright: This open access article is published under a Creative Commons CC BY 4.0 license, which permit the free download, distribution, and reuse, provided that the author and preprint are cited in any reuse.


