
Submitted:
04 February 2026
Posted:
05 February 2026
You are already at the latest version
Abstract
This study addresses the decarbonisation of the glass industry from an integrated energy system perspective, analysing the role of renewable electricity, electrification, and hydrogen in meeting the high and continuous thermal demands of glass melting. While direct electrification emerges as the most efficient option from a purely energetic standpoint, the intermittency of renewable generation poses significant challenges to continuous furnace operation, highlighting a potential complementary role for hydrogen. The general framework is applied to a representative oxyfuel glass furnace, using a mixed-integer linear programming (MILP) optimisation that minimises melting costs under variable solar and wind generation, battery storage, and hydrogen production and storage. Results show that high levels of furnace electrification combined with wind-dominated renewable supply yields the lowest decarbonisation costs, which can become negative under favourable conditions. However, battery and hydrogen integration extend achievable emission reductions from around 50% to 80%, with hydrogen proving particularly relevant for enabling continuous operation under limited renewable availability. Sensitivity analysis identifies energy and carbon price regimes in which storage-based solutions become cost-effective, confirming that hydrogen, while less efficient than direct electrification, can play a strategic role in deep decarbonisation by supporting continuous industrial operation. The proposed framework is transferable to other hard-to-abate industrial sectors facing similar constraints.
Keywords:
glass industry
; renewable energy
; decarbonisation
; hard-to-abate
; hydrogen
; electrification
1. Introduction
Heavy industry accounts for around 70% of industrial emissions [1] and is classified as hard-to-abate due to structural and economic constraints [2]. Energy-related emissions, both direct and indirect, constitute nearly 80% of total emissions [3], highlighting the central role of energy-focused decarbonisation strategies across industrial subsectors. While process-emission-intensive sectors such as steel and cement focus on chemical and material innovations to address intrinsic chemical reactions that release CO2, energy-emission-intensive sectors such as chemicals, aluminium, glass, and paper prioritise energy efficiency and fuel switching to reduce fossil fuel consumption.
Focusing on energy-related emissions, energy efficiency has contributed transversally to substantial gains in industrial decarbonisation driven by the large impact of energy on production costs. For instance, the energy intensity of steel production decreased from 50 GJ/t in 1960 to 20 GJ/t in 2020 [4], while that of glass manufacturing from about 20 GJ/t in 1930 to around 6 GJ/t in 1990 [5]. Nonetheless, as thermodynamic limits of material production are approached [6], complementary strategies to reduce the carbon intensity of energy use are increasingly needed.
Renewable energy integration is essential to the sustainability of fuel switching options such as hydrogen combustion and direct electrification, requiring the alignment of intermittent renewable electricity with the high and continuous thermal demands of heavy industry. Regardless of whether direct or indirect electrification pathways are considered [7], the magnitude and temporal mismatch between supply and demand requires careful strategic planning of renewable generation plants, energy infrastructure, and industrial systems. Industrial decarbonisation studies increasingly shift from treating renewable energy as exogenous to optimising its integration. While renewable energy discussions largely centre on electricity generation, the integration of renewables into hard-to-abate sectors is constrained by the limited feasibility of direct process electrification. In this context, green hydrogen offers a promising pathway to bridge this gap by converting renewable electricity into a flexible energy carrier capable of supplying high-temperature industrial thermal demand [8,9,10].
Table 1 summarises the most relevant contributions on renewable energy integration in hard-to-abate industrial sectors, reporting the industrial sector, plant size and site location considered, together with the modelling approaches adopted, the inclusion of sensitivity analyses, and the renewable energy sources, fuel switching options, and load-matching technologies examined. While these studies provide valuable insights into renewable energy integration in hard-to-abate industries, they are characterised by a high degree of heterogeneity in terms of the industrial sectors addressed, the technological solutions considered, and the scale of the analysed plants.
Reflecting its dominant contribution to industrial emissions, the metallurgical industry emerges as the most extensively analysed sector, whereas other energy-intensive industries, including glass manufacturing, remain comparatively underrepresented and often investigated under less homogeneous assumptions. Among the studies, plant capacities reach about 1 Mt/year for steel, cement, and aluminium, while only around 100 kt/year for glass. Regional coverage spans different continents, including Europe, Asia and North America, with solar and wind energy analysed depending on local availability and often studied in combination to identify optimal generation mixes. Hydrogen is frequently analysed as a comprehensive strategy to cover plant thermal energy demands, while batteries are included when direct electrification is possible or when electric loads are considered. Technical evaluations are conducted either with simulation or optimisation approaches [11], sometimes complemented by sensitivity analyses on economic and environmental parameters.
Among hard-to-abate industrial sectors, the glass industry is particularly relevant to investigate alternative fuel switching pathways, due to its limited plant size and energy intensity as well as the potential to combine direct electrification and hydrogen combustion in hybrid glass furnaces. Indeed, while electrification of glass production appears the most straightforward pathway, it is constrained by small nominal pull rates, restrictions in cullet use, lower flexibility, and shorter furnace lifetime [12]. On the other hand, hydrogen can offer more operational flexibility for renewable energy integration while exerting fewer constraints on existing melting furnaces.
Several studies have addressed decarbonisation pathways in the glass industry. At a sectoral level, technological roadmaps were defined for the UK under scenarios of reasonable action and radical transition [29], for Germany, highlighting possible compliance with carbon dioxide budgets targets of 2°C [30], and for Italy, contrasting green fuels with carbon capture [31]. However, none of these roadmaps is supported by quantification of renewable capacity addition requirements. Plant-specific analysis rely on the assessment of representative furnaces, such as a small 100 t/d container glass furnace [16], a large 300 t/d container glass furnace [12], or a large 800 t/d flat glass furnace [32]. Renewable energy integration has been based on existing nearby renewable plants [26], optimised based on economic and environmental performance [26] or on the achievement of specific decarbonisation targets [27].
This study pursues a twofold objective: first, to provide a general perspective on the decarbonisation opportunities and challenges of the glass sector; and second, to explore and assess potential renewable energy integration strategies through a representative case study. The analysis combines a detailed techno-economic assessment of electrification and hydrogen pathways with a comprehensive sensitivity analysis on key economic parameters. The case study illustrates the application of the methodology to a typical oxyfuel container glass furnace, integrated with renewable energy sources, electrochemical storage, and hydrogen infrastructure. The results aim to guide the sector’s energy transition by identifying broadly applicable, cost-optimal decarbonisation pathways. The work is organised as follows. Section 2 presents the issue of decarbonising the glass industry, outlining energy and carbon profiles. Section 3 presents technical constraints to decarbonisation of glass melting, focusing on electrification and hydrogen combustion as the most promising decarbonisation pathways. Section 4 describes a general methodological framework, including the system layout, energy balances and optimisation approach, key performance indicators, and detailed component modelling. Section 5 analyses the impact of design choices on decarbonisation costs and conducts a comprehensive sensitivity analysis under varying economic parameters. Lastly, Section 6 pinpoints the main findings and discusses their implications for deep decarbonisation of the glass industry through renewable energy.
2. Decarbonising the Glass Industry: Status and Prospects
Glass manufacturing is among the most energy-intensive industrial processes and has traditionally relied on fossil fuels, primarily natural gas. As a hard-to-abate sector, it faces persistent decarbonisation challenges, particularly in production contexts where high-temperature thermal demand remains dominant.
The glass industry comprises several product categories, including container glass, flat glass, glass fibres, and specialty glasses, each characterised by different production volumes and energy requirements. Among these, container and flat glass represent the largest shares of production, accounting respectively for 44% and 29% at the global level, 50% and 25% in the US, and 58% and 23% in the EU [33].
Figure 1 schematically illustrates the glass production process, showing the main steps together with their characteristic temperature ranges and typical SEC and highlighting the magnitude of the thermal and energy demands. The glass production process can be divided into four main steps: batching, melting, forming, and finishing. Batching and melting are common to all glass types, while forming and finishing differ depending on the product segment. Melting is the step reaching the highest temperatures, typically in the range of 1500–1600 °C and is the most energy-intensive step of the process. In container glass manufacturing, it accounts for 80% of the total energy consumption, of which about 90% is supplied by fossil fuels, primarily natural gas. The extreme peak temperatures required determine the critical challenges associated with modifying or decarbonising this process. This schematic represents a general overview, with temperatures subject to variation based on production type and recycled material content.
From a sectoral perspective, the glass industry is characterised by significant environmental impact and overall energy consumption, with a strong reliance on natural gas due to its high thermal requirements. Several studies in the literature have quantified these impacts and energy uses at regional and global scales. While global energy consumption amounts to approximately 650 EJ (over 180,000 TWh), highlighting the relatively modest contribution of the glass sector, the data summarised in Table 2, arranged by the authors and constructed using data from the literature, provide a consistent picture of the industry’s current energy and carbon profiles.
The discrepancies observed between the regional data for the US and Europe and the global figures likely reflect the use of alternative, more carbon-intensive fuels in certain production contexts, in addition to natural gas. This highlights that energy mixes can vary significantly across regions, influencing the environmental profile of glass production.
To place the energy and emission impacts of the sector in context with glass products, Table 3 reports the specific energy consumption (SEC, in kWh/kg) for different glass product categories [38]. The melting and refining stage dominates the energy demand across all products, accounting for roughly 50–60% of the total energy required for unit mass of product, in general referred as Specific Energy Consumption (SEC). Product-specific differences are evident: flat and container glass require moderate energy (around 2–3 kWh/kg), while specialty products such as “other pressed and blown glass” and glass wool show higher intensities, up to 5 kWh/kg. Forming and finishing stages contribute smaller shares, but still represent meaningful portions of total energy, highlighting opportunities for efficiency improvements across multiple process steps.
Beyond general sector-level figures, which can only provide a broad indication, it is useful to examine energy use and CO2 emissions relative to actual production. To this end, more detailed data on specific glass types help illustrate how energy and carbon intensity vary across products and regions. From a product perspective, median specific emissions in the EU range from 0.36 tCO2/t for coloured container glass to 0.50 tCO2/t for flat glass, while in the US, values are slightly higher, at 0.40 tCO2/t for container glass and 0.54 tCO2/t for flat glass [42,43,44]. Energy-related emissions dominate across all glass types, accounting for 75–95% of total emissions, with process emissions contributing the remainder [45]. Fuel combustion represents the largest share (around 60–80%), while electricity uses accounts for 10–30%, varying with geographic location and production context [45].
As a result, several glass companies have committed to reducing their carbon emissions, defining short- and long-term decarbonisation targets for Scope 1, 2, and 3 emissions. Regarding EU container glass companies, Scope 1 and 2 emission reduction targets ranging from 25% to 50% have been established for 2030, with more ambitious values of up to 64% set for 2035 and carbon neutrality by 2050 [46]. For Scope 3 emissions, the most ambitious target identified corresponds to a 37.5% reduction by 2034 [46]. The targets set correspond to average annual reduction rates of around 4% for Scope 1 and 2 emissions and around 2% for Scope 3, testifying the relevance of the commitment made.
3. Decarbonising the Glass Industry: Technical Framework
Several decarbonisation strategies have been proposed for the glass industry [45,47,48,49,50,51,52,53,54], most of which focus on addressing the key challenge of supplying the very high thermal power required for melting in glass furnaces with low-carbon energy. Broadly, these strategies can be grouped into three categories:
- (i)
- general implementation of energy efficiency and savings measures;
- (ii)
- replacement of conventional fuels through electrification of the melting process supported by renewable electricity;
- (iii)
- process-oriented combustion modifications, such as oxyfuel combustion and the use of green hydrogen in blended combustion. Together, these approaches aim to maintain process performance while significantly reducing carbon emissions.
Examining the entire process provides insight into where targeted interventions can maximize energy use and carbon savings. As illustrated in Figure 2(a), glass melting requires a very specific temperature profile to ensure proper elimination of gas bubbles and thermal homogenisation of glass properties. As a result, glass melting furnaces share common structural features, including a melting tank, refining zones, and delivery systems, but differ in energy supply, firing direction, and heat recovery mode, as shown in Figure 2(b). The most common furnace technologies—recuperative, regenerative, oxyfuel, and all-electric—differ in efficiency, scale, and operating costs, which make them more or less suitable for specific glass types.
Recuperative furnaces, used widely for smaller or cost-sensitive production, exchange heat continuously through metal or ceramic recuperators that preheat combustion air up to about 750 °C, allowing stable firing, fine tuning of temperature profiles, low investment cost, and relatively low NOx emissions, but at the expense of higher fuel consumption and lower overall thermal efficiency. In contrast, regenerative furnaces, either cross-fired or end-port, use paired checker-brick chambers that alternately store and release heat, preheating the combustion air to 1100–1300 °C for significantly higher efficiency. Cross-fired regenerative furnaces, predominant in float glass production, place burner ports on opposite sides to tailor temperature profiles for high-quality fining, though they are less energy-efficient and more expensive to build. End-port regenerative furnaces, the most common for container glass, use two ports on one side to form a long U-shaped flame, giving excellent energy utilization but limited longitudinal energy control, high investment cost, and high NOx emissions. Oxy-fuel furnaces fire eliminates nitrogen-heating losses, achieving very high specific loads, reduced fuel use, and drastically lower NOx emissions, with the drawback of costly oxygen generation and condensation issues in flue gases. All-electric furnaces melt batch exclusively by high-current molybdenum electrodes, enabling compact, low-emission operation ideal for high-purity glasses, though they require expensive uninterrupted power supply and are limited for melts with strong infrared absorption or strongly oxidizing conditions.
Figure 3 provides a schematic overview of typical input power and pull rates for different furnace types. While the figure is illustrative rather than exhaustive, it allows identification of plausible furnace sizes for various technological solutions. All-electric furnaces are generally limited to smaller scales (below 10 MW) and lower productivity (below 250 tonnes/day of production), whereas hybrid designs combine the high efficiency of electric and oxyfuel melting with the size advantages of regenerative furnaces.
Figure 4 illustrates representative changes in heat transfer modes associated with hybrid furnaces operating at substantially increased levels of electric boosting, as well as with hydrogen-fired configurations. While a limited electric contribution is already present in many conventional glass furnaces, further electrification alters the balance between radiative and convective heat transfer, modifying convection patterns within the glass melt. Similarly, hydrogen combustion introduces distinct flame characteristics. These changes can influence product quality, helping to explain the cautious uptake of technological innovations in the glass industry. High electric boosting reduces radiative heat transfer above the melt while enhancing convective heat transfer within the melt, effects that can be mitigated through appropriate furnace design [55]. Hydrogen combustion, by contrast, features longer, hotter flames with lower emissivity; however, numerical [56] and experimental studies [57] confirm the possible interchangeability with natural gas. From an infrastructure perspective, all major decarbonisation options entail a substantial increase in system power levels and in the input of renewable energy.
Electrification entails a substantial increase in the use of electricity within the plant, not necessarily through dedicated on-site generation, but by leveraging industrial facilities as flexible and large-scale consumers capable of valorising electricity produced by renewable power plants. This shift raises challenges related to power quality and grid integration. Hydrogen-based pathways follow a similar strategy, enabling the conversion of renewable electricity into a storable energy carrier that can be used to supply thermal demand when direct electrification is constrained. This approach, however, introduces additional energy losses due to electrolysis, currently operating at 65–70% efficiency, and requires compatible burners, adapted pipelines, and enhanced safety systems.
4. Methodological Framework for Assessing Renewable-Based Electrification and Hydrogen Pathways in the Glass Industry
As discussed in the previous section, the decarbonisation of hard-to-abate industrial sectors as glass sector ultimately relies on the use of renewable electricity to supply high-temperature thermal energy. This can be achieved either through direct electrification of industrial processes or indirectly through energy storage vectors such as hydrogen, which provides a clear link between renewable power generation and continuous thermal energy requirements.
In the glass industry, this challenge is compounded by the large scale of industrial furnaces, with thermal power requirements of several tens of megawatts, and by the fact that process modifications and additional plant components inevitably increase system complexity and costs. Under these conditions, assessing decarbonisation options requires not only a technical evaluation, but also a consistent economic comparison of alternative strategies. Taking into account these considerations, this section proposes a methodological framework to systematically assess renewable-based electrification and hydrogen pathways in the glass industry. Beyond identifying cost-optimal solutions for a single configuration, the proposed methodological approach is designed to explore the conditions under which different decarbonisation strategies become viable. By systematically varying key design, dimensional, and operating parameters, the framework enables the identification of the regimes in which direct electrification, hydrogen-based solutions, or hybrid configurations represent the most suitable option for glass furnace decarbonisation.
The framework is then applied to a representative case study to translate general decarbonisation concepts into a coherent quantitative analysis. Several plant configurations are examined in order to assess the respective margins and trade-offs associated with direct electrification, hydrogen use, and their combined application in hybrid solutions. The analysis explicitly acknowledges the complexity of the problem, given the large scale of industrial glass furnaces and the need to preserve strict product quality requirements. Accordingly, the modelling framework integrates system boundaries and energy balances with optimisation methods and performance indicators, supported by a detailed representation of the relevant process components.
4.1. System Layout and Energy Balances
Figure 5 illustrates three alternative integrated system layouts, selected as representative of the main renewable energy integration options for the glass industry: direct, battery-based, and hydrogen-based integration. In the direct integration configuration, Fig. 5(a) electricity generated by solar and/or wind plants is supplied directly to the furnace. In the battery-based configuration, Fig. 5(b), surplus electricity is stored in batteries and later used on-site to offset electricity demand. In the hydrogen-based configuration, Fig. 5(c) excess electricity is routed to an electrolyser, for example a Proton Exchange Membrane (PEM), where it is converted into hydrogen that is either supplied to the furnace burners or compressed and stored for later use, thereby reducing natural gas consumption.
The electric balance of the integrated system under different configurations is described by Eq. (1), where and are the hourly solar and wind power generation, and are the hourly electricity import from and export to the electricity grid, is the furnace electrical input (including oxygen generation requirements), and are the hourly charge and discharge of the battery storage, is the power consumption of the electrolyzer, and is the power consumption of the hydrogen compressor.
The thermal balance of the integrated system under different configurations is described by Eq. (2), where is the thermal energy input from the natural gas grid, and represents the furnace thermal input, is the energy content of hourly electrolyzer hydrogen generation, and and are the hourly charge and discharge of the hydrogen storage tank.
4.2. Optimisation Formulation and Key Performance Indicators
Among the possible optimisation criteria, cost minimisation is selected in this study to reflect the central role of economic feasibility in guiding investment and decisions in energy-intensive industrial processes. Optimal hourly energy supply for the hybrid glass furnace is determined using a Mixed Integer Linear Programming (MILP) optimisation, solved with an hourly time resolution over a 7-days horizon. The objective function, , is defined as the melting cost, calculated by accounting for the costs of natural gas and electricity, obtained by multiplying purchase volumes and by their specific prices and , the costs of direct carbon emissions obtained by multiplying the natural gas input by the CO2 emission factor and the price of CO2 , and the cost of water, obtained by multiplying water purchase volumes by its price , [58].
The economic performance is evaluated by calculating specific melting costs, , as the sum of natural gas, electricity, carbon, and water costs, , , , and , divided by the amount of glass produced, obtained by multiplying furnace size by the number of operative days
The environmental performance is assessed by calculating specific melting emissions, , as the sum of direct emissions from natural gas combustion, obtained by multiplying natural gas imports by an emission factor and indirect emissions from electricity consumption, obtained by multiplying electricity imports by a variable grid emission factor [59], divided by the amount of glass produced.
Beyond operational considerations, the costs of CO2 avoided, or levelised decarbonisation costs, , are defined as the sum of capital (CAPEX), annualised operational (OPEX), and replacement expenditures (REPEX) for the various components involved, , , and , minus the annualised operational energy cost savings compared to the conventional configuration, , divided by the overall carbon reductions compared to the conventional configuration, .
Obviously, the economic model proposed does not explicitly capture all scale- and implementation-related effects, but it remains useful for a first methodological analysis. The comparison between the decarbonisation costs of different design configurations can inform on the optimal decarbonisation pathways to be pursued.
5. Case Study and Results
To translate the general decarbonisation strategies discussed into a quantitative framework, this section focuses on a representative case. The analysis considers an oxyfuel furnace, with a size of 300 t/d, operating at constant pull rates throughout the entire year and a nominal SEC of 3.8 GJ/t (about 1 kWh/kg).
To investigate performance under varying system designs and constraints, a comprehensive sensitivity analysis is performed on furnace electric boosting levels, , renewable energy coverage, , renewable energy mix, , battery storage and hydrogen electrolyzer coverage, and , as well as electricity, natural gas, and CO2 price, , , and . The details are provided in Appendix A. The thermal and electric SEC of the glass furnace are assumed to be linear with boosting levels, as in [27]. Beyond the parameters detailed in Appendix A, additional assumptions include a water cost = 3.58 EUR/m3 and a natural gas emission factor equal to 0.2 tCO2/MWh.
The case study is parameterised using energy-system data representative of the European context, with a specific focus on Italy. For renewable plants, nation-wide solar and wind hourly load profiles, and , are obtained from ENTSO-E [60], while capacity factors and are derived from TERNA [59]. The electrolyzer load factor is assumed to range between 15–100% of nominal power, with efficiency varying linearly with the load factor, as in [61], and a standby power consumption of 1.5%, as in [58]. For battery and hydrogen storage components, constant charge and discharge efficiencies and , have been considered, with constraints from [62]. A discount rate of 4% is assumed, and the evaluation is conducted over a 20-year period.
5.1. Operational Behaviour
To capture the system behaviour under a range of design and operating conditions, multiple integration scenarios were simulated. As an illustrative example, Figure 6 shows the electric and thermal energy balances for a representative week of the year under direct, battery, and hydrogen integration scenarios, assuming 50% furnace electric boosting, 75% renewable energy coverage, a balanced renewable mix (50% solar–50% wind), and battery and electrolyzer coverage both set at 40%.
To ensure the practical relevance of the analysis, the operational simulations are complemented by the adoption of representative electricity, natural gas, and carbon price assumptions, enabling a consistent economic assessment of the different integration strategies. Reference prices are set equal to 150 EUR/MWh for electricity, 50 EUR/MWh for natural gas, and 75 EUR/t for CO2, reflecting current price levels in Italy [63,64].
In the direct integration scenario, excess renewable generation is entirely exported to the grid, necessitating electricity purchases during periods of low renewable output and natural gas purchases to meet thermal demand. Battery integration allows surplus electricity to be stored, minimising external electricity purchases. The concept of hydrogen integration is to convert excess electricity into hydrogen, which is used to reduce natural gas consumption.
In the battery integration scenario, only low levels of battery coverage appear beneficial across. At low boosting levels, the large electricity excess cannot be directed to the furnace given the minimal electric input required, whereas at high boosting levels, the direct use of electricity minimises the need for storage in batteries. In the hydrogen integration scenario, lower levels of electricity excess ratio are obtained across all furnace boosting levels. Low furnace boosting levels minimise electricity excess provided that minimum electrolyzer coverage levels are implemented.
5.2. Techno-Economic Assessment
This section presents the results of the techno-economic assessment of renewable energy integration in glass furnaces, focusing on the combined effects of furnace electrification, renewable energy coverage, and solar–wind generation mix. The analysis focuses on decarbonisation costs and cost-optimal decarbonisation pathways, supporting industrial decision-making with quantitative design criteria regarding renewable energy plants, furnace electrification levels, battery storage, and hydrogen infrastructure.
5.2.1. Direct Integration
The operational cost and emission reductions that can be achieved through the direct integration of solar and wind plants with the glass furnace. Figure 7 reports levelised decarbonisation cost maps for low, medium and high boosting levels. Each curve represents combinations of renewable energy coverage and furnace electrification that yield the same levelised cost of CO2 avoided, explicitly illustrating the trade-off between renewable availability and electric boosting in minimising decarbonisation costs. The achievement of negative values means that the required progress in terms of emissions reduction is profitable when contrasting the increased capital expenditures and the resulting operational cost savings. For electrification rates of 20%, the lowest cost of CO2 avoided is equal to −130 EUR/tCO2. At a level of 50%, the optimal value is −65 EUR/tCO2, whereas at boosting levels of 80%, the optimal value is −40 EUR/tCO2 for a renewable coverage of 75%. Higher electrification levels progressively shift the cost-optimal region towards higher renewable penetration, reflecting the increasing reliance on low-carbon electricity.
Figure 8 provides a graphical interpretation of the trade-off between emission reductions and decarbonisation costs for the different system configurations analysed. Each point in the figure represents a feasible system configuration, defined by a specific combination of furnace electric boosting, renewable energy coverage, and renewable mix. The horizontal axis quantifies the achieved CO2 emission reduction relative to the reference case (natural gas), while the vertical axis reports the levelised cost of CO2 avoided.
The distribution of points highlights how technological choices shift the balance between environmental and economic performance. Configurations characterised by higher furnace boosting and greater renewable coverage tend to cluster towards higher emission reductions, whereas cost-effective solutions are favoured by higher shares of wind energy in the renewable mix. This reflects the ability of wind generation to provide a more continuous low-carbon electricity supply, better aligned with the steady thermal demand of glass furnaces. Overall, the figure shows that deep decarbonisation of glass melting can be achieved without disproportionate cost penalties when electrification and renewable integration are coherently designed, and it visually identifies the regions where favourable compromises between cost and emission reduction are attained.
5.2.2. Advanced Integration
A realistic representation of the economic and environmental suitability of advanced integration scenarios for the case study can be obtained by referring to the current capacity addition mix of Italy. In 2023, this was correspondent to 10% wind and 90% solar [65].
More detailed maps of cost and emission reductions achieved by battery and hydrogen integration compared to the conventional furnace are discussed in Appendix B.
Battery integration achieves higher cost and emission reductions for large levels of renewable coverage and medium and large levels of furnace boosting. Conversely, hydrogen integration yields maximum cost and emission reductions for low boosting levels. The analysis reveals the importance of proper sizing since optimal values of battery coverage are around 30–40% while electrolyzer coverage around only 20–30%. Figure 9 shows maps of levelised decarbonisation costs for battery and hydrogen integration under varying furnace boosting, renewable coverage, and battery and electrolyzer coverage.
No negative values are obtained in these cases, highlighting cost increases compared to direct integration and conventional fired furnaces. In the battery integration scenario, minimum costs of CO2 avoided are in the range of 100–200 EUR/t. The higher the boosting levels, the higher the renewable coverage for which these optimal values are obtained. At 50% boosting, optimal renewable coverage is around 50% while it reaches 75% at 80% boosting. In the hydrogen integration scenario, optimal values of decarbonization costs are in the range of 200–300 EUR/t. Except for the region of low furnace boosting levels and renewable coverage in the range of 75–100%, the lower the electrolyzer coverage, the lower the decarbonization costs, highlighting how the costs of the technology significantly impact on its cost-effectiveness. The relationship between decarbonisation costs and emission reduction under realistic renewable capacity addition mix are shown in Figure 10(a) for direct, battery, and hydrogen integration. Both batteries and hydrogen extend maximum emission reductions from around 50% up to 80%. For battery integration, solutions that allow for emissions reduction higher than 55% correspond to boosting levels above 60% and renewable coverage above 75%, and yield minimum decarbonization costs of 140 EUR/t, with average values of 215 EUR/t. For hydrogen integration, these correspond to renewable coverage above 125% and boosting levels below 70%, yielding minimum decarbonization costs of 315 EUR/t, with average values of 385 EUR/t. This reveals that, at current energy and carbon prices, batteries represent a more cost-effective solution for the deep decarbonization of the glass industry.
5.3. Sensitivity Analysis
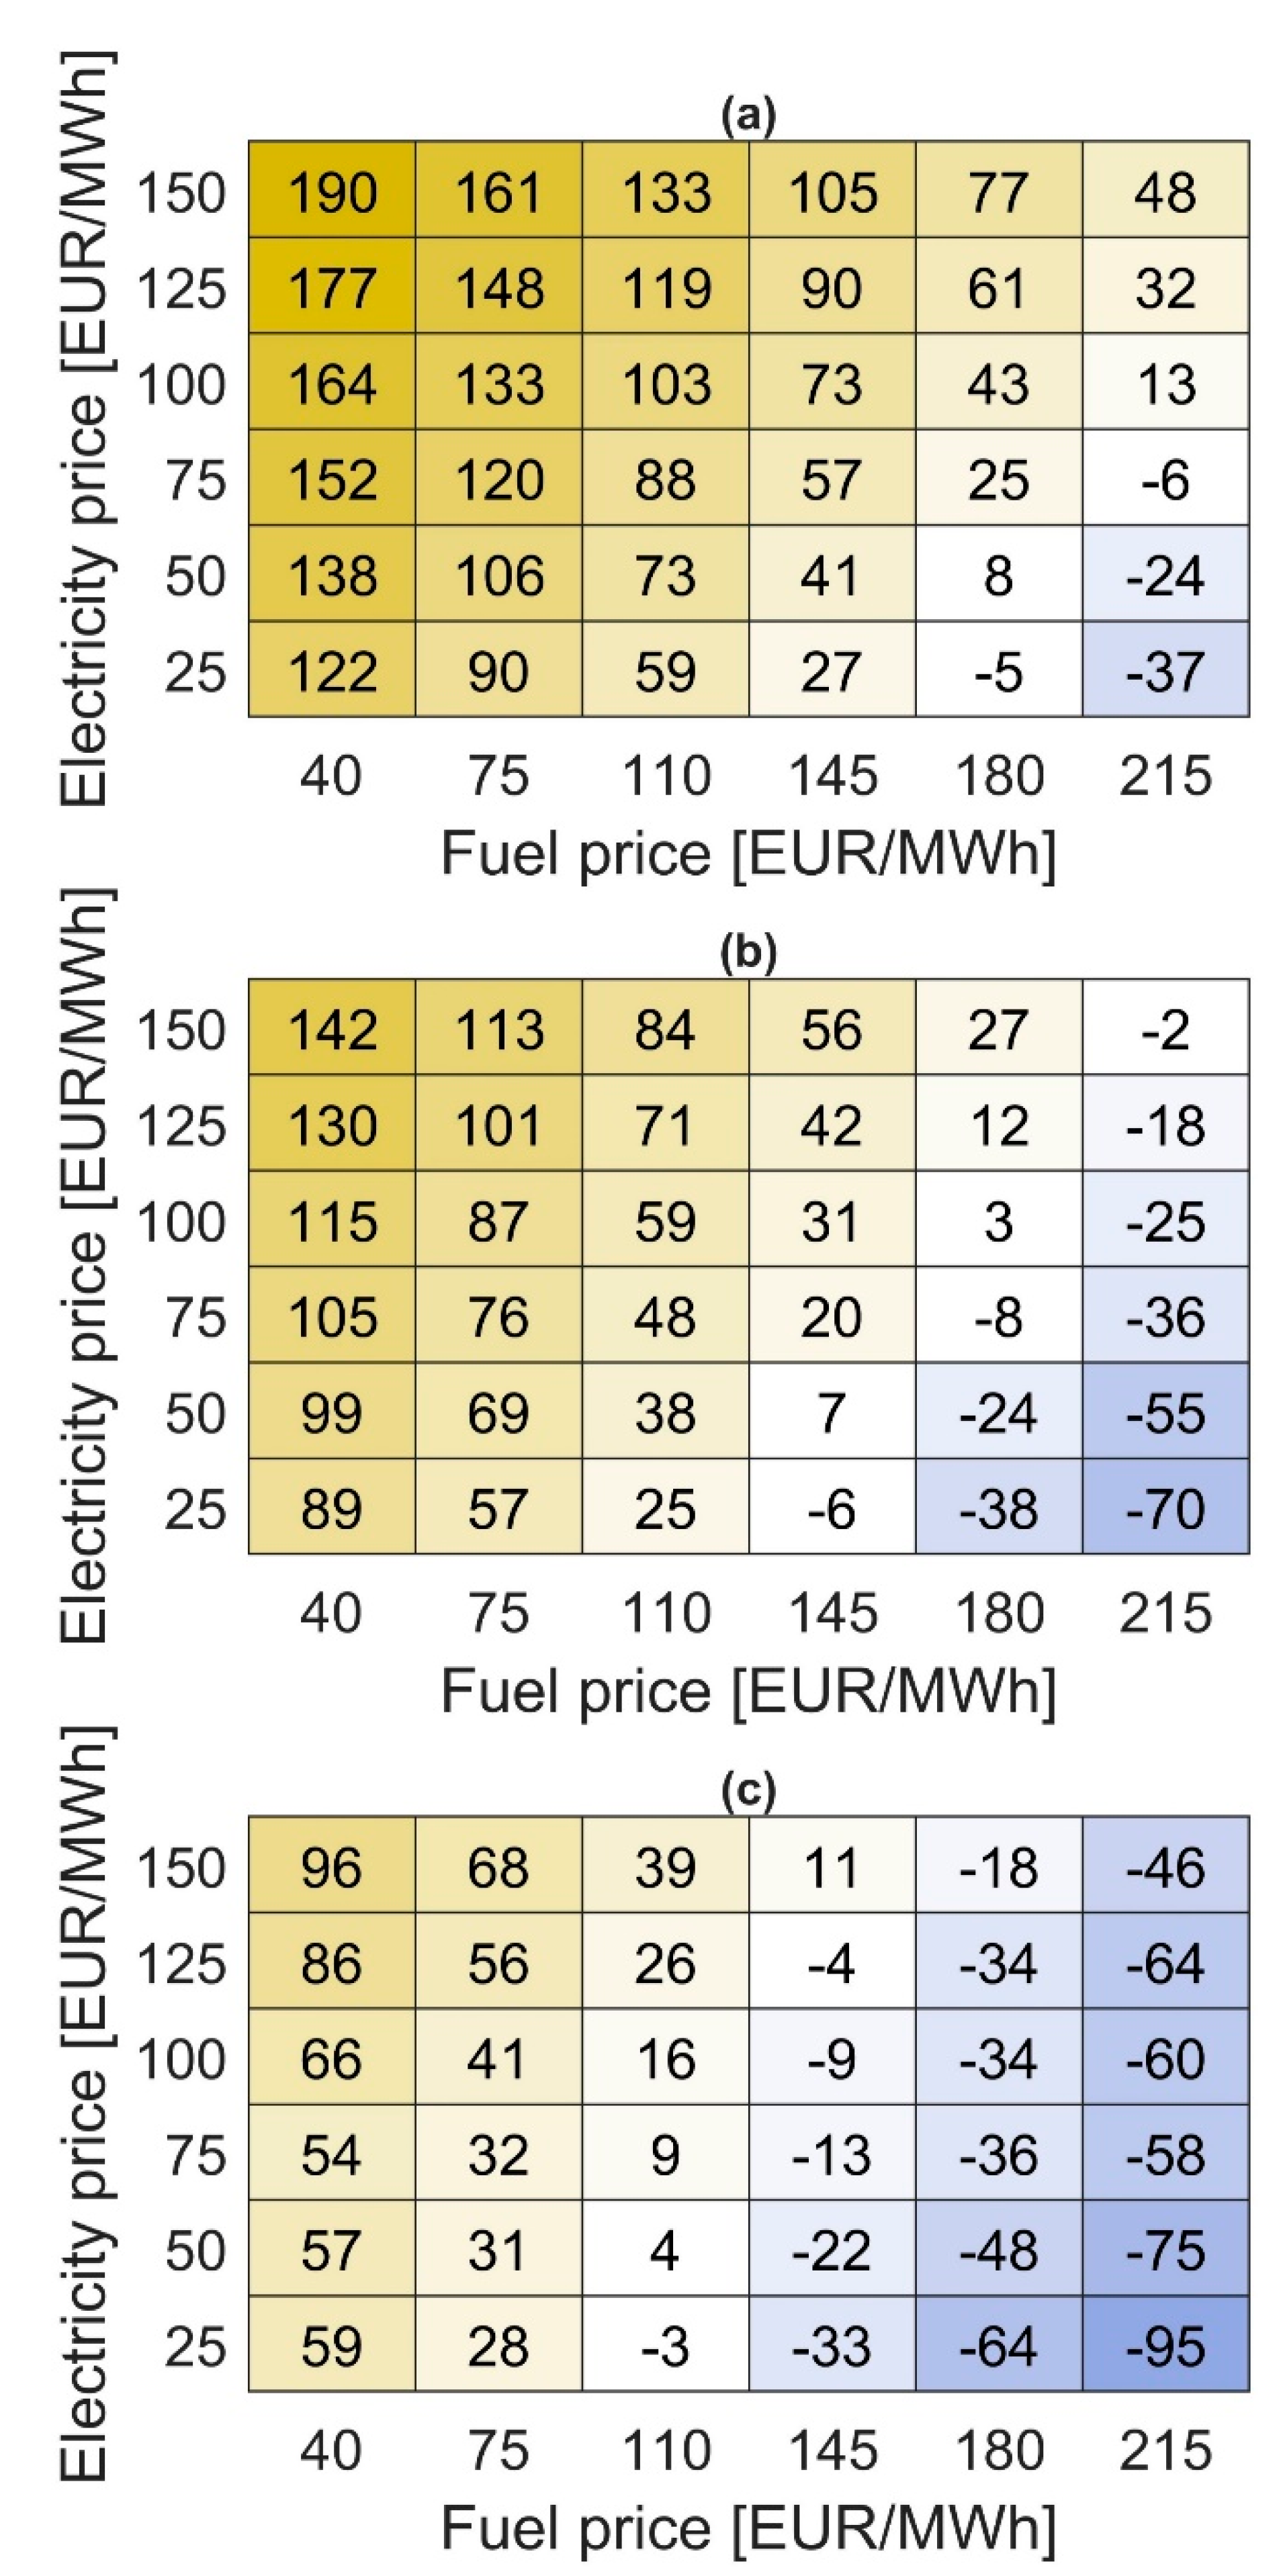
The sensitivity of deep decarbonisation cost options (>55% emission reduction) for battery and hydrogen integration was analysed under varying electricity, natural gas, and carbon prices, as shown in Figure 11. The comparison is performed on a consistent basis, with average emission reductions of about 60% for both configurations. Decarbonisation costs exhibit different sensitivities to energy prices depending on the integration strategy.
Battery integration costs are only weakly affected by electricity prices, as batteries primarily shift the timing of renewable electricity use rather than increasing overall electricity demand. Consequently, their economic performance is mainly driven by natural gas and carbon prices, which determine the value of avoided fuel consumption and emissions. Hydrogen integration, by contrast, shows a pronounced sensitivity to electricity prices, reflecting the additional electricity demand and conversion losses associated with electrolysis. In this case, electricity price variations directly affect the cost of hydrogen production and, therefore, the cost of CO2 avoided.
In both configurations, lower electricity prices combined with higher natural gas and carbon prices improve economic performance. Minimum decarbonisation costs range from −425 to 240 EUR/t for battery integration and from −445 to 420 EUR/t for hydrogen integration. Despite these differences, optimal design parameters remain largely stable across price regimes and consistently require high levels of electrification (≈80% boosting). Battery-based solutions are favoured at moderate renewable coverage (≈75%), whereas hydrogen integration requires higher renewable energy availability (≈125%), confirming large-scale electrification as a necessary condition for deep decarbonisation. Fig. 12 compares the cost-effectiveness of battery and hydrogen integration across combined fuel and electricity price regimes. At current electrolyser costs (1200 EUR/kW), battery integration is generally more cost-effective across a wide range of price conditions.
Figure 12.
Maps of battery and hydrogen decarbonisation cost differences: (a) electrolyzer price of 1200 EUR/kW, (b) electrolyzer price of 700 EUR/kW, (c) electrolyzer price of 300 EUR/kW.
Figure 12.
Maps of battery and hydrogen decarbonisation cost differences: (a) electrolyzer price of 1200 EUR/kW, (b) electrolyzer price of 700 EUR/kW, (c) electrolyzer price of 300 EUR/kW.
Hydrogen integration emerges as a competitive option under price regimes characterised by high fuel and carbon prices combined with low electricity prices, reflecting its ability to decouple renewable electricity availability from continuous thermal demand. As electrolyser costs decline, the set of price regimes in which hydrogen becomes economically attractive expands substantially. This trend highlights hydrogen not merely as an alternative to batteries, but as a complementary flexibility option that becomes increasingly relevant in systems with high renewable penetration, limited electrical storage, and stringent decarbonisation targets. In this context, hydrogen enables the temporal extension of renewable electricity use beyond direct electrification, supporting continuous furnace operation. It should be noted that the optimisation framework relies on linear cost assumptions, implicitly if energy prices and technology costs scale proportionally with system size and utilisation. In practice, price formation mechanisms, grid constraints, contractual arrangements, and economies of scale may introduce non-linear effects that are not captured by the model. Accordingly, the identified price thresholds should not be interpreted as strict competitiveness boundaries, but rather as indicative markers of the conditions under which hydrogen-based solutions begin to deliver system-level value. Nevertheless, the analysis remains valuable in consistently identifying relative trends, trade-offs, and boundary conditions under which electrification-, battery-, and hydrogen-based strategies contribute to cost-effective deep decarbonisation.
6. Conclusions
Deep decarbonisation of hard-to-abate industrial sectors ultimately hinges on the ability to supply large and continuous thermal energy demands with low-carbon energy sources. In energy-intensive industries such as glass manufacturing, this challenge is exacerbated by the scale of industrial furnaces, the stringent requirements on process stability and product quality, and the intermittency of renewable electricity generation.
Under these conditions, electrification, either direct or mediated through energy storage vectors such as hydrogen, emerges as an interesting opportunity, but its practical feasibility depends on the coordinated design of process technologies, energy systems, and economic boundary conditions.
In this context, the paper proposes a methodological approach to assess alternative decarbonisation strategies for hard-to-abate industrial sectors, and demonstrates its application through a case study in glass manufacturing.
A representative 300 t/d industrial glass furnace is used as a case study to exemplify how variable renewable electricity can be integrated into high-temperature processes through three alternative configurations: direct electrification, battery-supported electrification, and hydrogen-supported electrification via on-site electrolysis and storage.
The study quantifies both operational behaviour and system performance, focusing on energy use, emissions, and economic costs. Under current electricity, natural gas, and carbon prices (150 EUR/MWh, 50 EUR/MWh, and 75 EUR/t, respectively), results for the direct integration scenario show that high levels of furnace electrification combined with wind-dominated renewable supply achieve levelised decarbonisation costs of –40 EUR/t, demonstrating the practical viability of this approach.
Under renewable mix of wind and solar energy that are consistent with current typical capacity additions, battery- and hydrogen-based integration strategies enable a substantial increase in achievable decarbonisation levels minimising the burden on the energy system. When combined with high furnace electrification and sufficient renewable availability, both configurations extend achievable emission reduction targets from around 50% of direct renewable integration to values approaching 80%.
For solutions achieving deep decarbonisation targets (>55%), battery integration is associated with lower levelised decarbonisation costs under current cost and price assumptions, whereas hydrogen-based solutions require higher renewable overcapacity to compensate for electrolysis losses and therefore exhibit higher specific costs. However, these results should not be interpreted as prescriptive with respect to technology deployment or storage sizing. The comparison highlights structural differences between the two pathways rather than identifying a universally optimal solution. Battery storage favours short-term load balancing and high utilisation of directly electrified furnaces, while hydrogen provides a complementary flexibility option that decouples renewable electricity generation from continuous thermal demand, albeit at the cost of additional conversion losses. Sensitivity analyses across a wide range of electricity, fuel, and carbon price regimes confirm that large-scale furnace electrification is a necessary condition for deep decarbonisation in all configurations. Within this framework, hydrogen pathways become increasingly relevant in scenarios characterised by high renewable penetration, limited electrical flexibility, and rising carbon costs, especially when electrolyser costs decline.
An analysis such as the one proposed inevitably involves simplifications and does not explicitly capture all the dimensional, technical, and organisational aspects that may complicate the real-world deployment of the investigated solutions. Some technical constraints related to plant integration of battery and hydrogen, operational flexibility, and scale effects are treated implicitly or assumed to be manageable, whereas in practice they may play a decisive role. Nevertheless, the proposed framework represents a valuable first step, as it allows the systematic comparison of alternative decarbonisation pathways under consistent assumptions, highlighting relative trends, trade-offs, and boundary conditions. In this sense, the analysis should be interpreted as an exploratory tool rather than a prescriptive design exercise, providing guidance on where deeper, technology-specific investigations are most warranted.
Nomenclature
The following symbols are used in this manuscript:
Specific cost
[EUR/MWh], [EUR/t] or [EUR/m3]
Absolute cost
[EUR]
Capital expenditures
[EUR]
Capacity factor
[%]
Battery storage coverage
[%]
Hydrogen electrolyzer coverage
[%]
Renewable energy coverage
[%]
Discount rate
[%]
Emission
[tCO2]
Emission factor
[tCO2/MWh]
Electric boosting
[%]
Equivalent hours
[h]
Levelised decarbonisation costs
[EUR/t]
Load factor
[%]
Lower heating value
[MJ/kg]
Load profile
[%]
Renewable energy mix
[%]
Number
[d]
Operational expenditures
[EUR]
Hourly thermal power
[MWh/h]
Replacement expenditures
[EUR]
Specific melting costs
[EUR/t]
Specific melting emissions
[t/t]
Specific energy consumption
[MWh/t]
State of charge
[%]
Size
[MW] or [MWh] or [t/d]
Hourly electric power
[MWh/h]
Efficiency
[%]
Subscripts and superscripts
Battery storage
Components
Charge
Days
Decarbonisation
Discharge
Economic
Electric
Environmental
Furnace
Grid
Generic combination
Input
Hydrogen compressor
Hydrogen storage
Melting
Natural gas
Output
Oxygen
Proton exchange membrane
electrolyzer
Photovoltaic
Generic hour
Thermal
Wind
Years
Conventional configuration
Author Contributions
Conceptualization, L.M. and A.F.; methodology, L.M. and A.F.; software, L.M.; validation, L.M.; formal analysis, L.M. and A.F.; investigation, L.M.; resources, L.M. and A.F.; data curation, L.M.; writing—original draft preparation, L.M. and A.F.; writing—review and editing, L.M. and A.F.; visualization, L.M.; supervision, A.F.; project administration, A.F.; funding acquisition, A.F. All authors have read and agreed to the published version of the manuscript.
Funding
This work was supported by the National Recovery and Resilience Plan (NRRP), Mission 4 Component 2 Investment 1.3—Call for tender No. 1561 of 11.10.2022 of Ministero dell’Università e della Ricerca (MUR); project funded by the European Union—NextGenerationEU. Award Number: Project code PE0000021, Concession Decree No. 1561 of 11.10.2022 adopted by Ministero dell’Università e della Ri-cerca (MUR), CUP I53C22001450006, according to attachment E of Decree No. 1561/2022, Project title “Network 4 Energy Sustainable Transition—NEST”.
Data Availability Statement
Data will be made available upon reasonable request.
Acknowledgments
Computational resources provided by computing@unipi, a Computing Service provided by University of Pisa.
Conflicts of Interest
The authors declare no conflicts of interest.
Abbreviations
The following abbreviations are used in this manuscript:
CAPEX
Capital expenditures
OPEX
Operational
expenditures
PEM
Proton exchange
membrane
REPEX
Replacement
expenditures
SEC
Specific energy
consumption
Appendix A – Modelling Assumptions
This appendix collects the supplementary methodological details and input data referred to throughout the paper, summarizing the key modelling assumptions and parameters used in the optimisation framework. Table A1 reports the parameter ranges adopted for the sensitivity analysis. Table A2 and Table A3 present the governing equations and associated parameters for energy modelling, while Table A4 summarizes the economic assumptions applied in the analysis. The assumptions adopted to define the system model are consistently derived from the open literature. In particular, the cost parameters reported in Table A4 are taken from selected recent studies specifically addressing electrification, battery storage, and hydrogen systems. While this approach inevitably entails a degree of approximation, it allows the adoption of internally consistent and literature-based cost benchmarks for the comparative assessment.

Table A1.
Parameters for a sensitivity analysis.
| Parameter | Symbol | Minimum | Maximum | Step |
|---|---|---|---|---|
| Furnace electric boosting (%) | 10 | 80 | 10 | |
| Renewable coverage (%) | 25 | 150 | 25 | |
| Renewable mix (%) | 0 (Wind) | 100 (Solar) | 10 | |
| Battery coverage (%) | 0 | 100 | 10 | |
| Electrolyzer coverage (%) | 0 | 100 | 10 | |
| Electricity price (EUR/MWh) | 25 | 150 | 25 | |
| Natural gas price (EUR/MWh) | 25 | 150 | 25 | |
| CO2 price (EUR/tCO2) | 75 | 300 | 75 |
Table A2.
Equations for energy modelling of the components.
| Component | Parameter | Equation | Units |
|---|
Table A3.
Parameters for energy modelling of the components.
| Component | Parameter | Symbol | Value | Unit |
|---|---|---|---|---|
| PV plant | Capacity factor | 12.8 | [%] | |
| Wind plant | Capacity factor | 25.1 | [%] | |
| Battery storage | Storage capacity | 4 | (h) | |
| Operative range | 10–90 | (%) | ||
| Charge/discharge efficiency | 98 | (%) | ||
| Hydrogen compressor | Electric SEC | 4 | (MJ/kg) | |
| Hydrogen storage | Storage capacity | 72 | (h) | |
| Operative range | 10–90 | (%) | ||
| Charge/discharge efficiency | 100 | (%) |
Table A4.
Assumptions for defining the cost of the various components.
| Component | CAPEX | OPEX | Lifetime | REPEX |
|---|---|---|---|---|
| Unit of measure | (EUR/kW) or (EUR/kWh) | (%CAPEX/y) | (y) | (%CAPEX) |
| Furnace electrodes [66] | 350 | 2 | 10 | 100 |
| Furnace burners [67] | 100 | 2 | 10 | 100 |
| PV plant [68] | 820 | 2 | 20 | |
| Wind plant [68] | 1370 | 2 | 20 | |
| Battery storage [58] | 300 | 2.5 | 10 | 50 |
| PEM electrolyzer [58,69,70] | 1200 (700, 300) | 5 | 10 | 35 |
| Hydrogen storage [69] | 14 | 2 | 20 | |
| Hydrogen compressor [58,69] | 4500 | 2 | 20 |
Appendix B – Operational performance maps
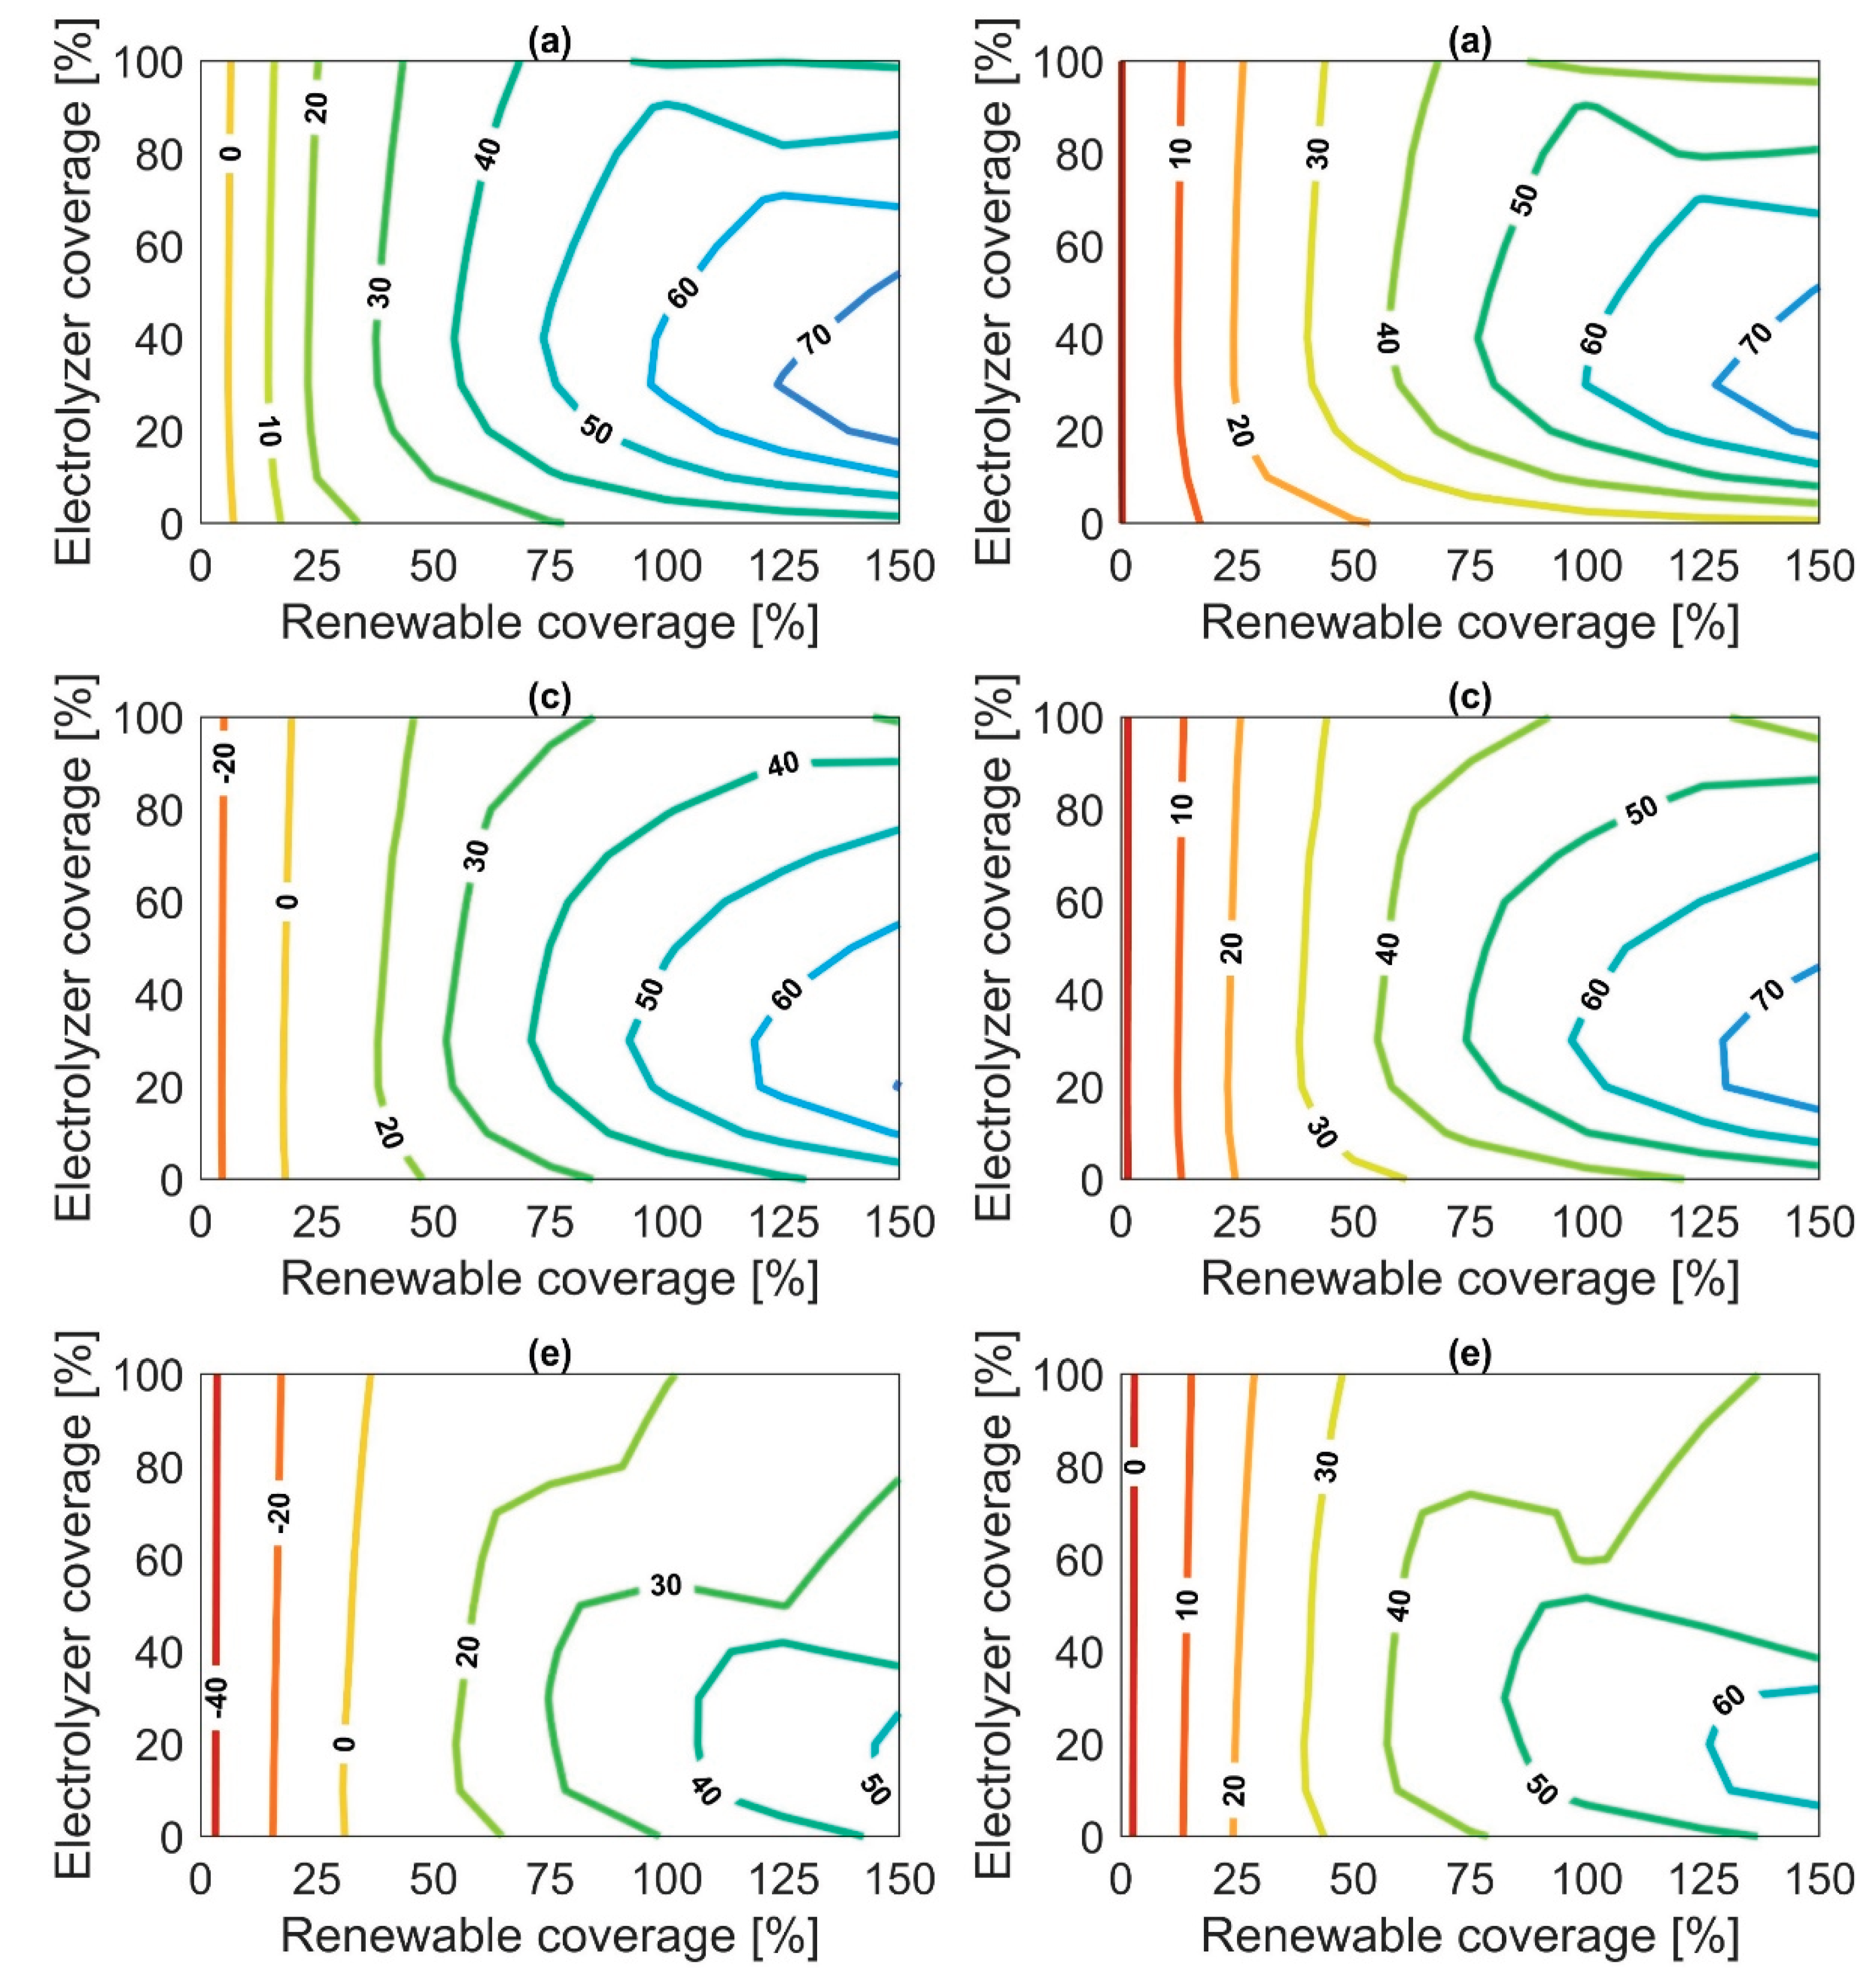
This appendix provides additional spatial maps of operational performance metrics that complement the results discussed in the main text. Figures B1–B3 illustrate cost and emission reduction patterns for direct, battery, and hydrogen integration scenarios, respectively, under increasing furnace electric boosting levels (20%, 50%, and 80%). These figures allow a more detailed comparison of the economic and environmental performance of the different integration strategies across the explored design space.
Figure A1.
Maps of operational performance for direct integration: (a) cost reductions and (b) emission reductions at 20% furnace boosting 20%, (c) cost reductions and (d) emission reductions at 50% furnace boosting, (e) cost reductions and (f) emission reductions at 80% furnace boosting.
Figure A1.
Maps of operational performance for direct integration: (a) cost reductions and (b) emission reductions at 20% furnace boosting 20%, (c) cost reductions and (d) emission reductions at 50% furnace boosting, (e) cost reductions and (f) emission reductions at 80% furnace boosting.
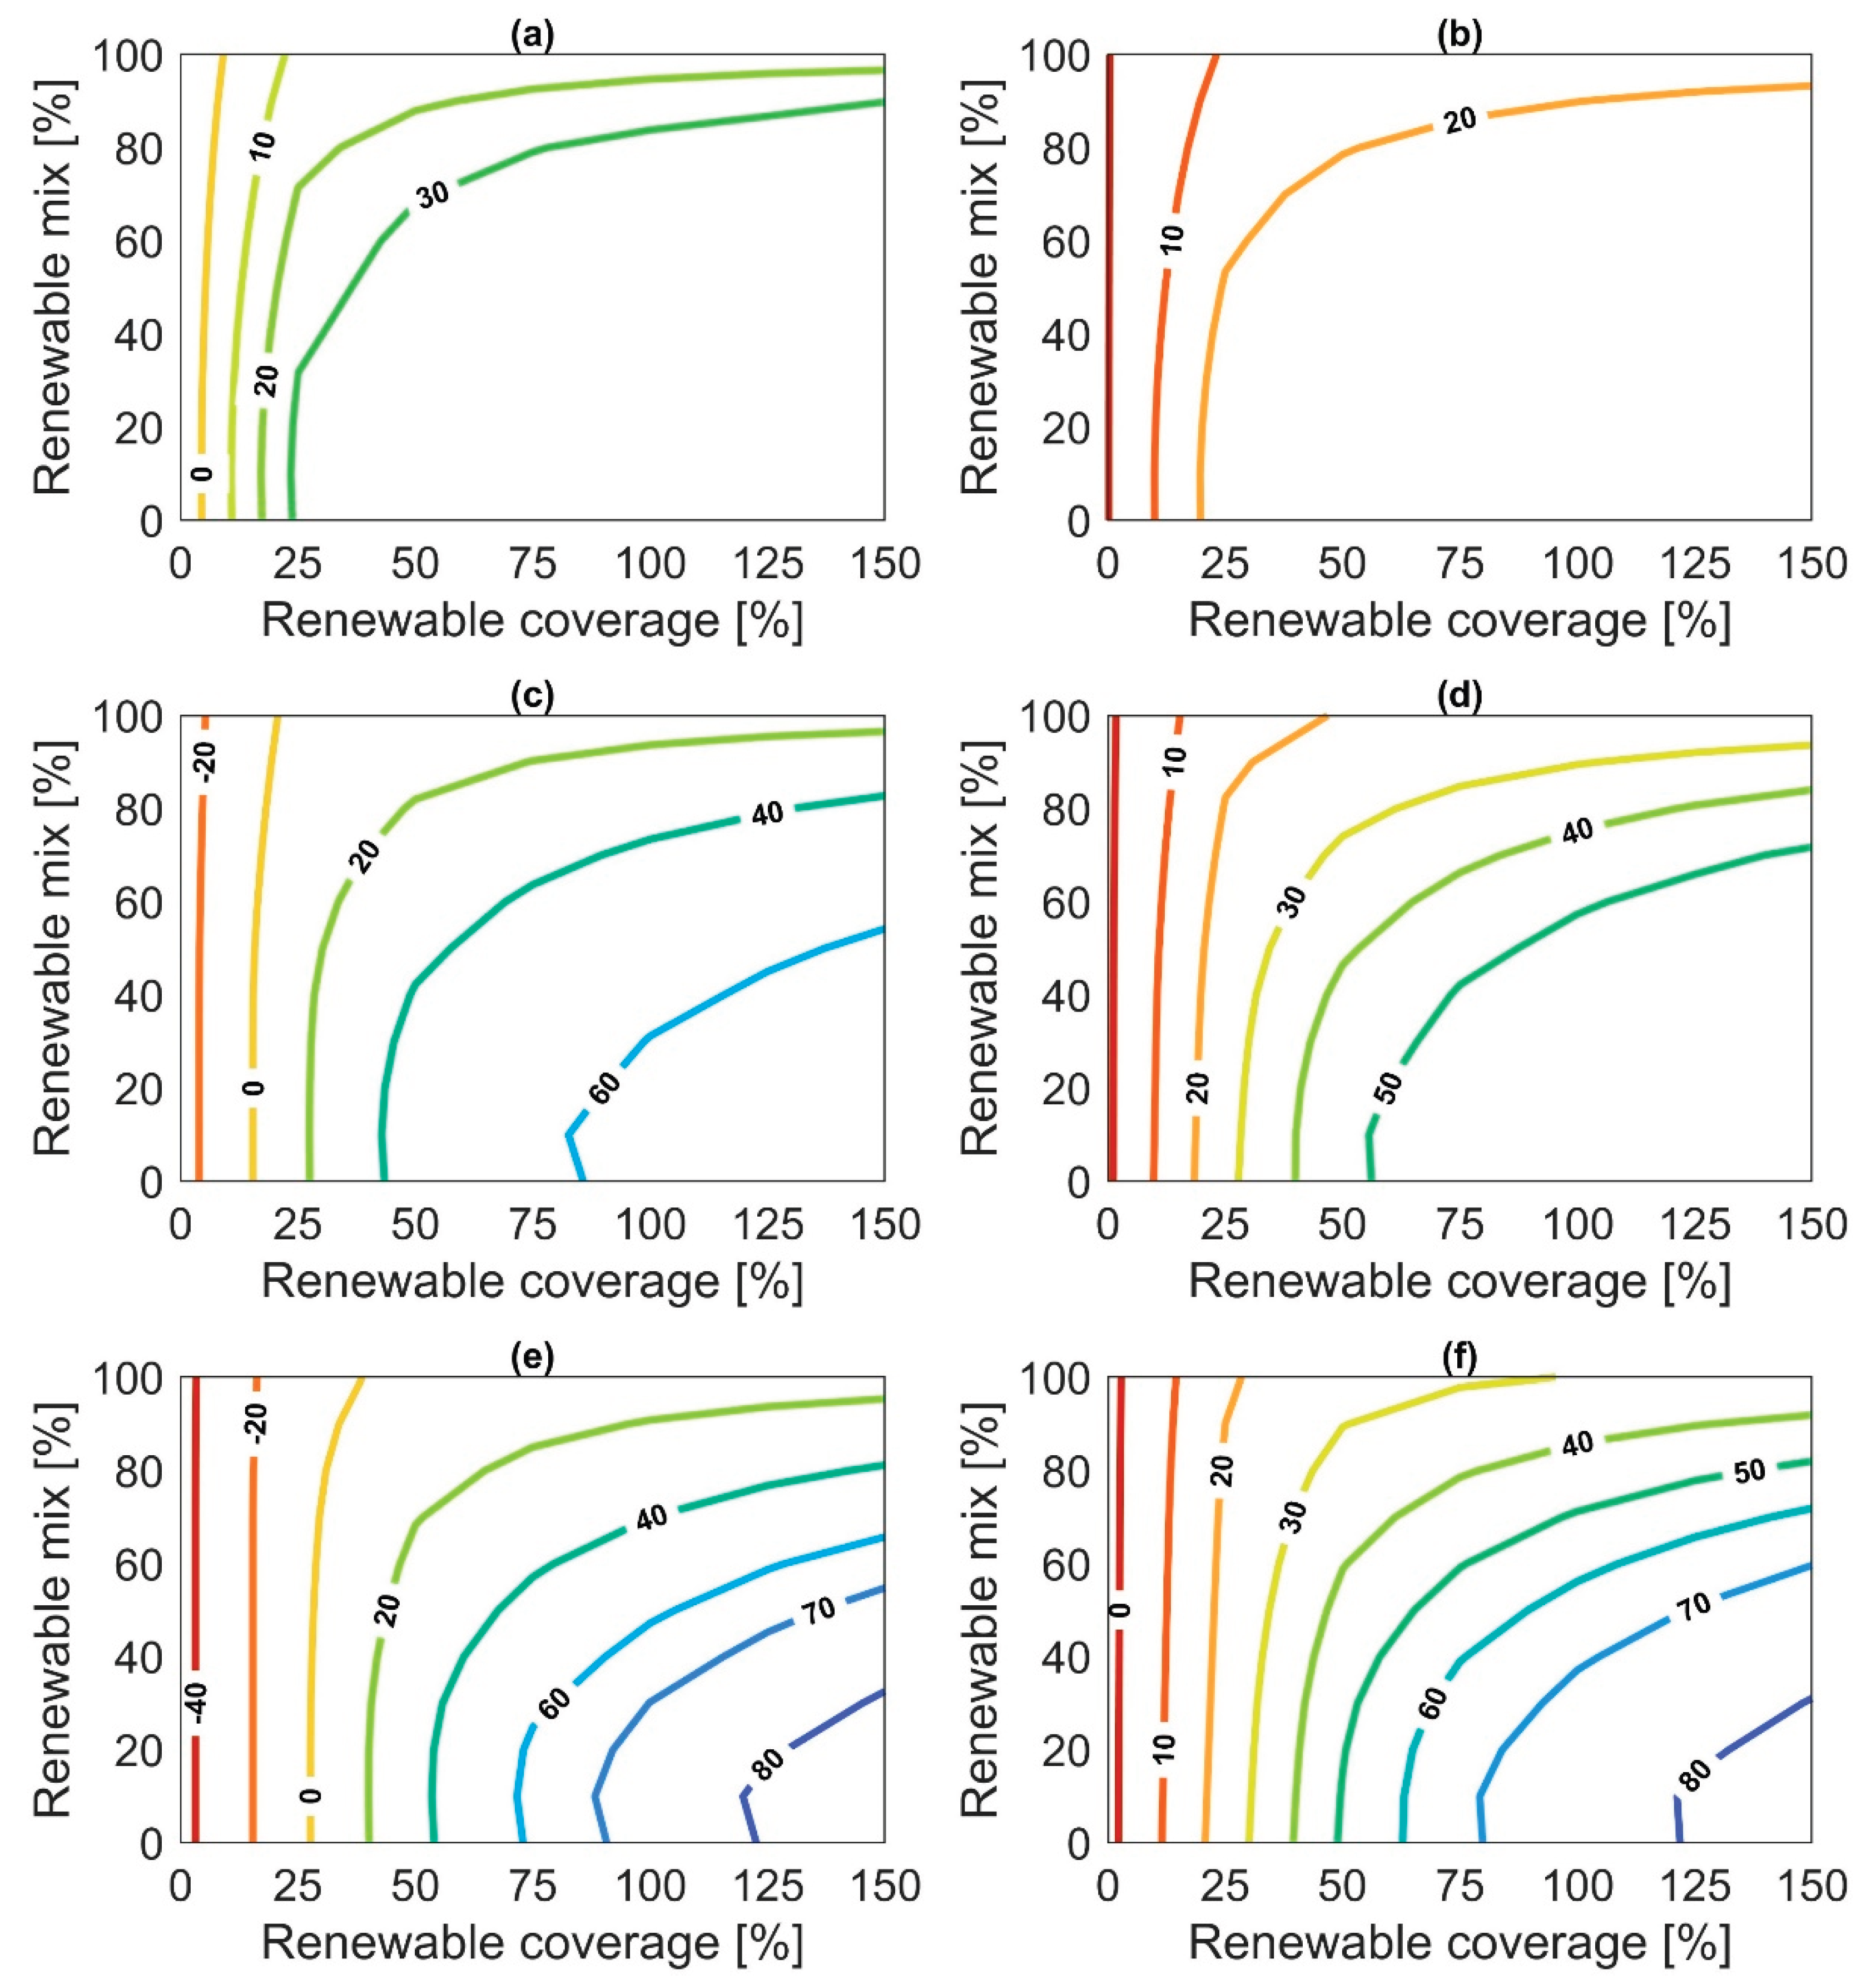
Figure A2.
Maps of operational performance for battery integration: (a) cost reductions and (b) emission reductions at 20% furnace boosting 20%, (c) cost reductions and (d) emission reductions at 50% furnace boosting, (e) cost reductions and (f) emission reductions at 80% furnace boosting.
Figure A2.
Maps of operational performance for battery integration: (a) cost reductions and (b) emission reductions at 20% furnace boosting 20%, (c) cost reductions and (d) emission reductions at 50% furnace boosting, (e) cost reductions and (f) emission reductions at 80% furnace boosting.
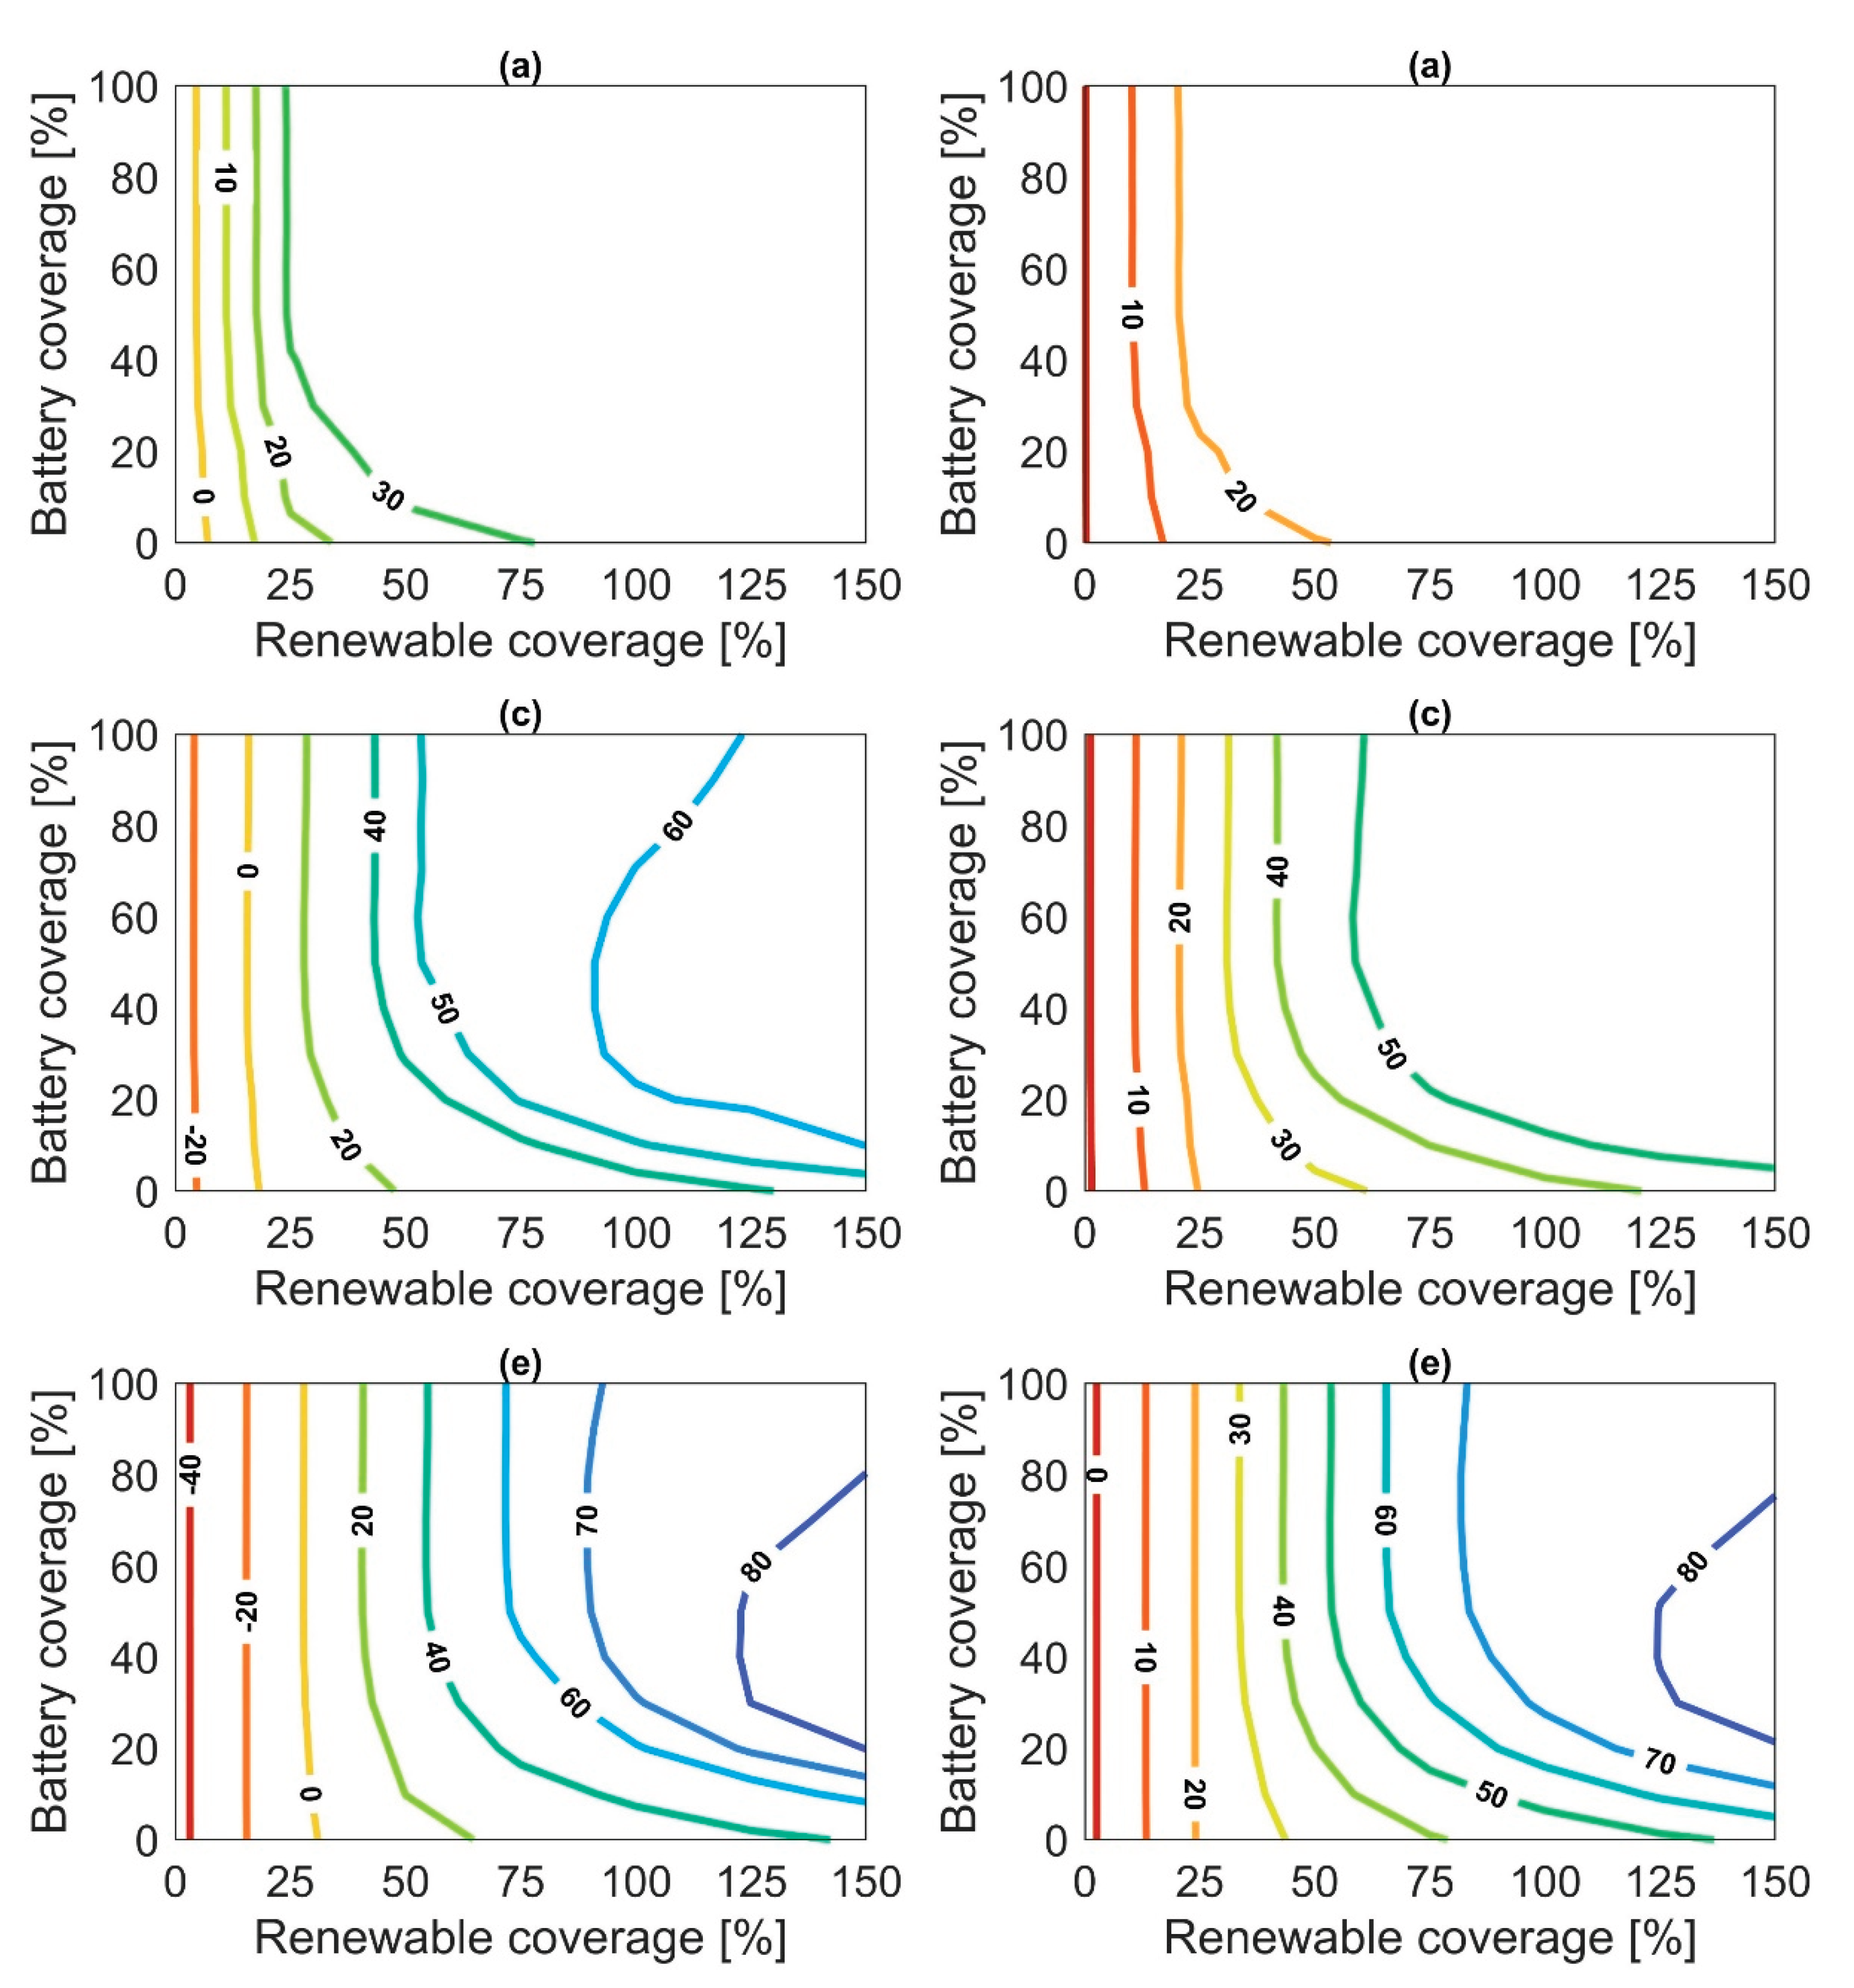
Figure A3.
Maps of operational performance for hydrogen integration under varying renewable and electrolyzer coverage: (a) cost reductions and (b) emission reductions at 20% furnace boosting 20%, (c) cost reductions and (d) emission reductions at 50% furnace boosting, (e) cost reductions and (f) emission reductions at 80% furnace boosting.
References
- International Energy Agency Achieving Net Zero Heavy Industry Sectors in G7 Members. 2022.
- Bataille, C.; Åhman, M.; Neuhoff, K.; Nilsson, L.J.; Fischedick, M.; Lechtenböhmer, S.; Solano-Rodriquez, B.; Denis-Ryan, A.; Stiebert, S.; Waisman, H.; et al. A Review of Technology and Policy Deep Decarbonization Pathway Options for Making Energy-Intensive Industry Production Consistent with the Paris Agreement. Journal of Cleaner Production 2018, 187, 960–973. [Google Scholar] [CrossRef]
- Rissman, J.; Bataille, C.; Masanet, E.; Aden, N.; Morrow, W.R.; Zhou, N.; Elliott, N.; Dell, R.; Heeren, N.; Huckestein, B.; et al. Technologies and Policies to Decarbonize Global Industry: Review and Assessment of Mitigation Drivers through 2070. Applied Energy 2020, 266, 114848. [Google Scholar] [CrossRef]
- World Steel Association Steel FACTS, 2022.
- Conradt, R. Prospects and Physical Limits of Processes and Technologies in Glass Melting. Journal of Asian Ceramic Societies 2019, 7, 377–396. [Google Scholar] [CrossRef]
- Gutowski, T.G.; Sahni, S.; Allwood, J.M.; Ashby, M.F.; Worrell, E. The Energy Required to Produce Materials: Constraints on Energy-Intensity Improvements, Parameters of Demand. Phil. Trans. R. Soc. A. 2013, 371, 20120003. [Google Scholar] [CrossRef]
- Philibert, C. Direct and Indirect Electrification of Industry and Beyond. Oxford Review of Economic Policy 2019, 35, 197–217. [Google Scholar] [CrossRef]
- Franco, A.; Giovannini, C. Recent and Future Advances in Water Electrolysis for Green Hydrogen Generation: Critical Analysis and Perspectives. Sustainability 2023, 15, 16917. [Google Scholar] [CrossRef]
- Franco, A.; Rocca, M. Renewable Electricity and Green Hydrogen Integration for Decarbonization of “Hard-to-Abate” Industrial Sectors. Electricity 2024, 5, 471–490. [Google Scholar] [CrossRef]
- Franco, A. Green Hydrogen and the Energy Transition: Hopes, Challenges, and Realistic Opportunities. Hydrogen 2025, 6, 28. [Google Scholar] [CrossRef]
- Lund, H.; Arler, F.; Østergaard, P.; Hvelplund, F.; Connolly, D.; Mathiesen, B.; Karnøe, P. Simulation versus Optimisation: Theoretical Positions in Energy System Modelling. Energies 2017, 10, 840. [Google Scholar] [CrossRef]
- Muijsenberg, H.P.H.; Mahrenholtz, H.; Jandacek, P.; Hakes, S.; Jatzwauk, C. Carbon Reduction with Super Boosting and Advanced Energy Management Using Renewable Resources. In 80th Conference on Glass Problems;Ceramic Transactions Series; Sundaram, S.K., Ed.; Wiley, 2021; pp. 71–93. ISBN 978-1-119-74490-0. [Google Scholar]
- Sun, Y.-Z.; Lin, J.; Song, Y.-H.; Xu, J.; Li, X.-M.; Dong, J.-X. An Industrial System Powered by Wind and Coal for Aluminum Production: A Case Study of Technical Demonstration and Economic Feasibility. Energies 2012, 5, 4844–4869. [Google Scholar] [CrossRef]
- Al-Ghussain, L.; Ahmed, H.; Haneef, F. Optimization of Hybrid PV-Wind System: Case Study Al-Tafilah Cement Factory, Jordan. Sustainable Energy Technologies and Assessments 2018, 30, 24–36. [Google Scholar] [CrossRef]
- Sgouridis, S.; Ali, M.; Sleptchenko, A.; Bouabid, A.; Ospina, G. Aluminum Smelters in the Energy Transition: Optimal Configuration and Operation for Renewable Energy Integration in High Insolation Regions. Renewable Energy 2021, 180, 937–953. [Google Scholar] [CrossRef]
- Gärtner, S.; Rank, D.; Heberl, M.; Gaderer, M.; Dawoud, B.; Haumer, A.; Sterner, M. Simulation and Techno-Economic Analysis of a Power-to-Hydrogen Process for Oxyfuel Glass Melting. Energies 2021, 14, 8603. [Google Scholar] [CrossRef]
- Elsheikh, H.; Eveloy, V. Assessment of Variable Solar- and Grid Electricity-Driven Power-to-Hydrogen Integration with Direct Iron Ore Reduction for Low-Carbon Steel Making. Fuel 2022, 324, 124758. [Google Scholar] [CrossRef]
- Superchi, F.; Mati, A.; Carcasci, C.; Bianchini, A. Techno-Economic Analysis of Wind-Powered Green Hydrogen Production to Facilitate the Decarbonization of Hard-to-Abate Sectors: A Case Study on Steelmaking. Applied Energy 2023, 342, 121198. [Google Scholar] [CrossRef]
- Devlin, A.; Kossen, J.; Goldie-Jones, H.; Yang, A. Global Green Hydrogen-Based Steel Opportunities Surrounding High Quality Renewable Energy and Iron Ore Deposits. Nat Commun 2023, 14, 2578. [Google Scholar] [CrossRef] [PubMed]
- Barigozzi, G.; Brumana, G.; Franchini, G.; Ghirardi, E.; Ravelli, S. Techno-Economic Assessment of Green Hydrogen Production for Steady Supply to Industrial Users. International Journal of Hydrogen Energy 2024, 59, 125–135. [Google Scholar] [CrossRef]
- Stolte, M.; Minuto, F.D.; Lanzini, A. Optimizing Green Hydrogen Production from Wind and Solar for Hard-to-Abate Industrial Sectors across Multiple Sites in Europe. International Journal of Hydrogen Energy 2024, 79, 1201–1214. [Google Scholar] [CrossRef]
- Sousa, J.; Azevedo, I.; Camus, C.; Mendes, L.; Viveiros, C.; Barata, F. Decarbonizing Hard-to-Abate Sectors with Renewable Hydrogen: A Real Case Application to the Ceramics Industry. Energies 2024, 17, 3661. [Google Scholar] [CrossRef]
- Ademollo, A.; Mati, A.; Pagliai, M.; Carcasci, C. Exploring the Role of Hydrogen in Decarbonizing Energy-Intensive Industries: A Techno-Economic Analysis of a Solid Oxide Fuel Cell Cogeneration System. Journal of Cleaner Production 2024, 469, 143254. [Google Scholar] [CrossRef]
- Weiss, R.; Ikäheimo, J. Flexible Industrial Power-to-X Production Enabling Large-Scale Wind Power Integration: A Case Study of Future Hydrogen Direct Reduction Iron Production in Finland. Applied Energy 2024, 365, 123230. [Google Scholar] [CrossRef]
- Reznicek, E.P.; Koleva, M.N.; King, J.; Kotarbinski, M.; Grant, E.; Vijayshankar, S.; Brunik, K.; Thomas, J.; Gupta, A.; Hammond, S.; et al. Techno-Economic Analysis of Low-Carbon Hydrogen Production Pathways for Decarbonizing Steel and Ammonia Production. Cell Reports Sustainability 2025, 2, 100338. [Google Scholar] [CrossRef]
- Miserocchi, L.; Franco, A. Solar-Powered Electrification and Hydrogen Integration for Decarbonising the Glass Industry. IJEPM 2025, 10, 645–655. [Google Scholar] [CrossRef]
- Miserocchi, L.; Franco, A. Techno-Economic Assessment of Electrification and Hydrogen Pathways for Optimal Solar Integration in the Glass Industry. Solar 2025, 5, 35. [Google Scholar] [CrossRef]
- Paudel, A.; Choi, J.-K. Techno-Economic Pathway for Green Hydrogen Adoption in Thermal Applications across US Small and Medium Manufacturing Sectors. International Journal of Hydrogen Energy 2025, 98, 295–307. [Google Scholar] [CrossRef]
- Griffin, P.W.; Hammond, G.P.; McKenna, R.C. Industrial Energy Use and Decarbonisation in the Glass Sector: A UK Perspective. Advances in Applied Energy 2021, 3, 100037. [Google Scholar] [CrossRef]
- Zier, M.; Pflugradt, N.; Stenzel, P.; Kotzur, L.; Stolten, D. Industrial Decarbonization Pathways: The Example of the German Glass Industry. Energy Conversion and Management: X 2023, 17, 100336. [Google Scholar] [CrossRef]
- Atzori, D.; Debidda, L.; Bassano, C.; Tiozzo, S.; Corasaniti, S.; Spena, A. The Italian Glass Sectors’ Decarbonization Pathway. Gases 2025, 5, 11. [Google Scholar] [CrossRef]
- Salman, M.; Flórez-Orrego, D.; Coppitters, D.; Mitraki, R.; Maréchal, F.; Léonard, G. Decarbonising the Glass Industry: A Comprehensive Techno-Economic Assessment of Low-Emission Pathways. Computers & Chemical Engineering 2025, 203, 109329. [Google Scholar] [CrossRef]
- Jatzwauk, C. Design and Operation of Glass Furnaces. In Encyclopedia of Glass Science, Technology, History, and Culture; Richet, P., Conradt, R., Takada, A., Dyon, J., Eds.; Wiley, 2021; pp. 1147–1164. ISBN 978-1-118-79942-0. [Google Scholar]
- Westbroek, C.D.; Bitting, J.; Craglia, M.; Azevedo, J.M.C.; Cullen, J.M. Global Material Flow Analysis of Glass: From Raw Materials to End of Life. J of Industrial Ecology 2021, 25, 333–343. [Google Scholar] [CrossRef]
- International Energy Agency Tracking Industrial Energy Efficiency and CO2 Emissions. 2007.
- Glass Is the Hidden Gem in a Carbon-Neutral Future. Nature 2021, 599, 7–8. [CrossRef]
- U.S. Department of Energy Manufacturing Energy and Carbon Footprints 2018.
- U.S. Department of Energy. Bandwidth Study on Energy Use and Potential Energy Savings Opportunities in U.S. Glass Manufacturing . 2017. [Google Scholar]
- European Climate, Infrastructure and Environment Executive Agency How LIFE Is Reducing Emissions from Glass Production; European Commission, 2022.
- Schmitz, A.; Kamiński, J.; Maria Scalet, B.; Soria, A. Energy Consumption and CO2 Emissions of the European Glass Industry. Energy Policy 2011, 39, 142–155. [Google Scholar] [CrossRef]
- Assovetro. LA TRANSIZIONE ECOLOGICA DEL VETRO - Sfide, ostacoli e proposte per un futuro sostenibile 2024.
- Directorate-General Climate Action Update of Benchmark Values for the Years 2021 – 2025 of Phase 4 of the EU ETS; European Commission, 2021.
- U.S. Environmental Protection Agency U.S. Container Glass Industry Carbon Intensities. U.S. Environmental Protection Agency (EPA); 2019.
- U.S. Environmental Protection Agency U.S. Flat Glass Industry Carbon Intensities. U.S. Environmental Protection Agency (EPA); 2019.
- Miserocchi, L.; Franco, A.; Testi, D. Status and Prospects of Energy Efficiency in the Glass Industry: Measuring, Assessing and Improving Energy Performance. Energy Conversion and Management: X 2024, 24, 100720. [Google Scholar] [CrossRef]
- Science Based Targets Initiative 2025.
- Worrell, E.; Price, L.; Neelis, M. Energy Efficiency Improvement and Cost Saving Opportunities for the Glass Industry; Lawrence Berkeley National Laboratory, 2008. [Google Scholar]
- Springer, C.; Hasanbeigi, A. Emerging Energy Efficiency and Carbon Dioxide Emissions-Reduction Technologies for the Glass Industry; Lawrence Berkeley National Laboratory, 2017. [Google Scholar]
- Papadogeorgos, I.; Schure, K. Decarbonisation Options for the Dutch Container and Tableware Glass Industry; PBL, 2019. [Google Scholar]
- Zier, M.; Stenzel, P.; Kotzur, L.; Stolten, D. A Review of Decarbonization Options for the Glass Industry. Energy Conversion and Management: X 2021, 10, 100083. [Google Scholar] [CrossRef]
- Cantini, A.; Leoni, L.; Ferraro, S.; De Carlo, F.; Martini, C.; Martini, F.; Salvio, M. Technological Energy Efficiency Improvements in Glass-Production Industries and Their Future Perspectives in Italy. Processes 2022, 10, 2653. [Google Scholar] [CrossRef]
- Furszyfer Del Rio, D.D.; Sovacool, B.K.; Foley, A.M.; Griffiths, S.; Bazilian, M.; Kim, J.; Rooney, D. Decarbonizing the Glass Industry: A Critical and Systematic Review of Developments, Sociotechnical Systems and Policy Options. Renewable and Sustainable Energy Reviews 2022, 155, 111885. [Google Scholar] [CrossRef]
- Atzori, D.; Tiozzo, S.; Vellini, M.; Gambini, M.; Mazzoni, S. Industrial Technologies for CO2 Reduction Applicable to Glass Furnaces. Thermo 2023, 3, 682–710. [Google Scholar] [CrossRef]
- Colangelo, S. Reducing the Environmental Footprint of Glass Manufacturing. Int J of Appl Glass Sci 2024, 15, 350–366. [Google Scholar] [CrossRef]
- Kuhn, W.; Reynolds, A.; Molcan, P.; Malphettes, B. Electric Boosting and Hybrid Furnaces (Practical Application of Higher Levels of Electric Heat Input). In 80th Conference on Glass Problems; Ceramic Transactions Series; Wiley, 2019; Vol. 268. [Google Scholar]
- Daurer, G.; Schwarz, S.; Demuth, M.; Gaber, C.; Hochenauer, C. On the Use of Hydrogen in Oxy-Fuel Glass Melting Furnaces: An Extensive Numerical Study of the Fuel Switching Effects Based on Coupled CFD Simulations. Fuel 2025, 380, 133576. [Google Scholar] [CrossRef]
- Schwarz, S.; Daurer, G.; Gaber, C.; Demuth, M.; Prieler, R.; Hochenauer, C. Experimental Investigation of the Combustion Characteristics in Oxy-Fuel Combustion of Hydrogen-Enriched Natural Gas on a Semi-Industrial Scale. International Journal of Hydrogen Energy 2024, 49, 323–337. [Google Scholar] [CrossRef]
- Franco, A.; Carcasci, C.; Ademollo, A.; Calabrese, M.; Giovannini, C. Integrated Plant Design for Green Hydrogen Production and Power Generation in Photovoltaic Systems: Balancing Electrolyzer Sizing and Storage. Hydrogen 2025, 6, 7. [Google Scholar] [CrossRef]
- TERNA Sistema Elettrico - Dati Statistici. 2024.
- ENTSO-E (European Network of Transmission System Operators for Electricity) Transparency Platform 2025.
- Hofrichter, A.; Rank, D.; Heberl, M.; Sterner, M. Determination of the Optimal Power Ratio between Electrolysis and Renewable Energy to Investigate the Effects on the Hydrogen Production Costs. International Journal of Hydrogen Energy 2023, 48, 1651–1663. [Google Scholar] [CrossRef]
- Ghilardi, A.; Frate, G.F.; Kyprianidis, K.; Tucci, M.; Ferrari, L. Brayton Pumped Thermal Energy Storage: Optimal Dispatchment in Multi-Energy Districts. Energy Conversion and Management 2024, 314, 118650. [Google Scholar] [CrossRef]
- Eurostat Gas Prices for Non-Household Consumers - Bi-Annual Data. 2025.
- Eurostat Electricity Prices for Non-Household Consumers - Bi-Annual Data. 2025.
- Gestore dei Servizi Energetici Energia Da Fonti Rinnovabili in Italia Nel 2023. GSE –Ufficio Statistiche e Monitoraggio Target 2025.
- Fuller, A.; González García, P.; Hulme, R.; Ireson, R. Alternative Fuel Switching Technologies for the Glass Sector: Phase 3; Department of Business, Energy and Industrial Strategy, 2022. [Google Scholar]
- Hy4Heat Conversion of Industrial Heating Equipment to Hydrogen; Department for Business, Energy & Industrial Strategy, 2019.
- IRENA Renewable Power Generation Costs in 2023; Anu Dhabi, 2024.
- Marocco, P.; Gandiglio, M.; Audisio, D.; Santarelli, M. Assessment of the Role of Hydrogen to Produce High-Temperature Heat in the Steel Industry. Journal of Cleaner Production 2023, 388, 135969. [Google Scholar] [CrossRef]
- Böhm, H.; Zauner, A.; Rosenfeld, D.C.; Tichler, R. Projecting Cost Development for Future Large-Scale Power-to-Gas Implementations by Scaling Effects. Applied Energy 2020, 264, 114780. [Google Scholar] [CrossRef]
Figure 1.
Schematic of the glass production process.
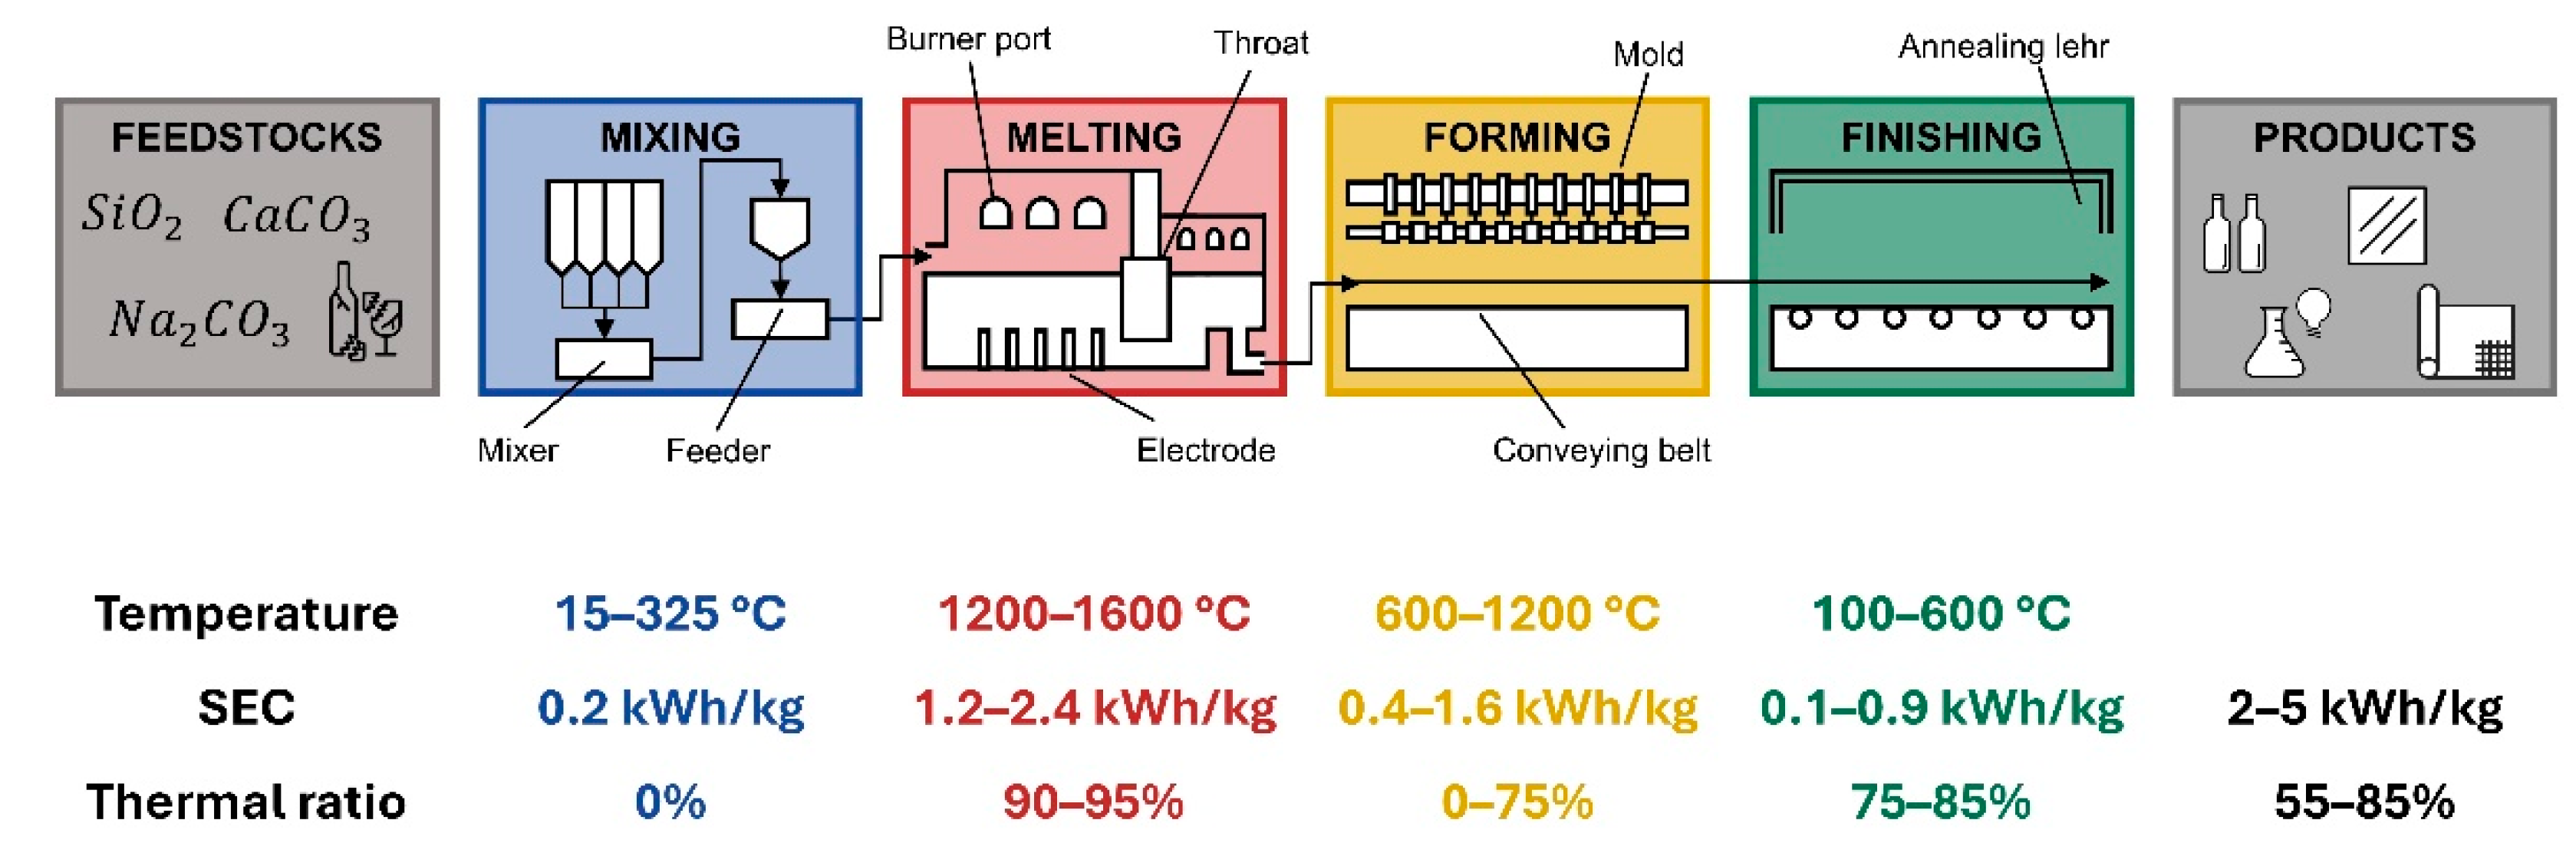
Figure 2.
Glass melting fundamentals: (a) melting phases and temperature profiles, (b) technical elements of glass furnace types. .
Figure 2.
Glass melting fundamentals: (a) melting phases and temperature profiles, (b) technical elements of glass furnace types. .
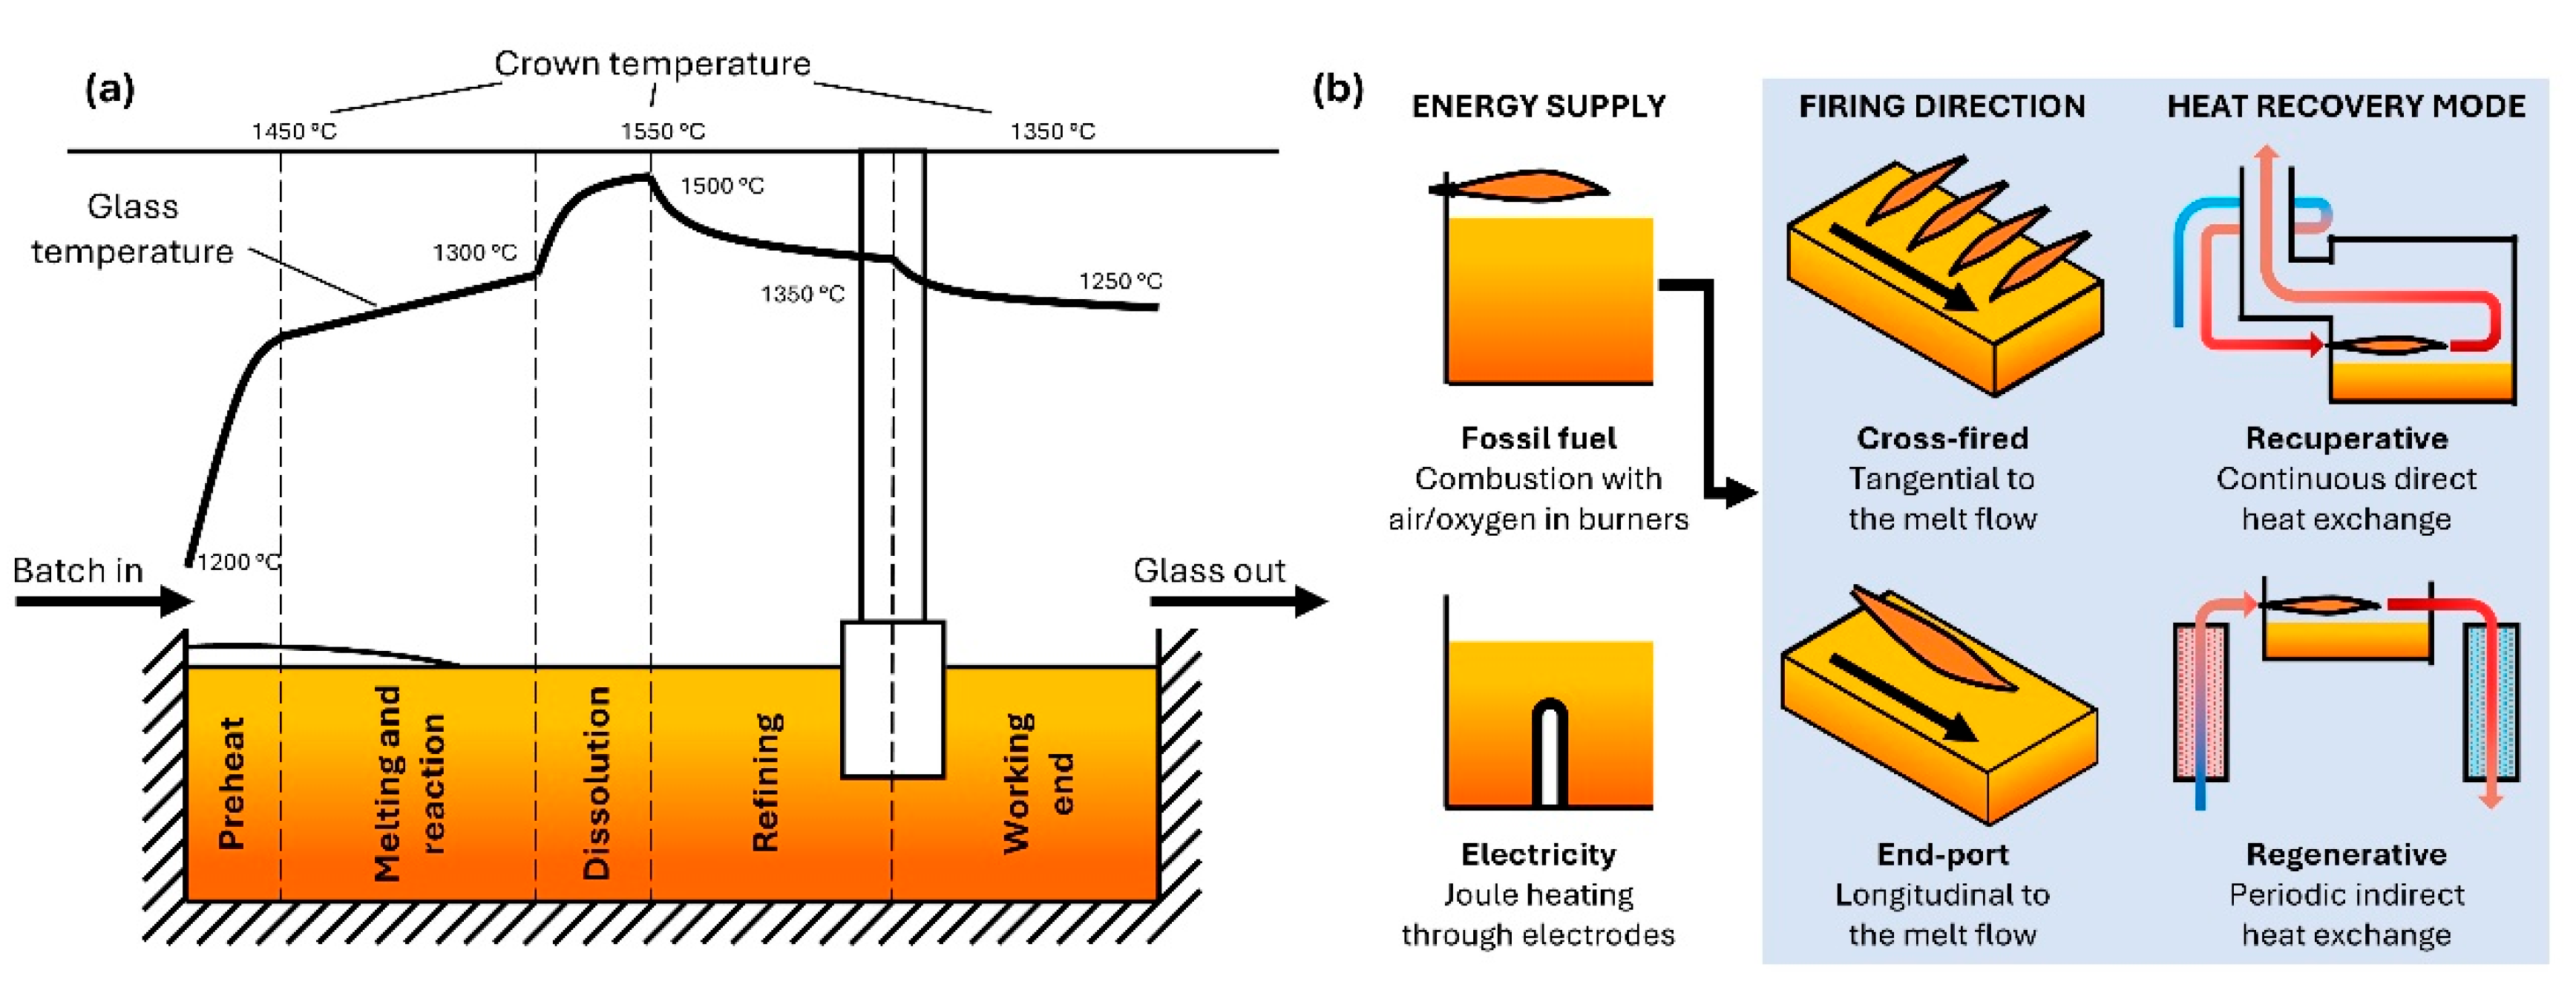
Figure 3.
Representative ranges of input power and pull rates for glass furnace types.
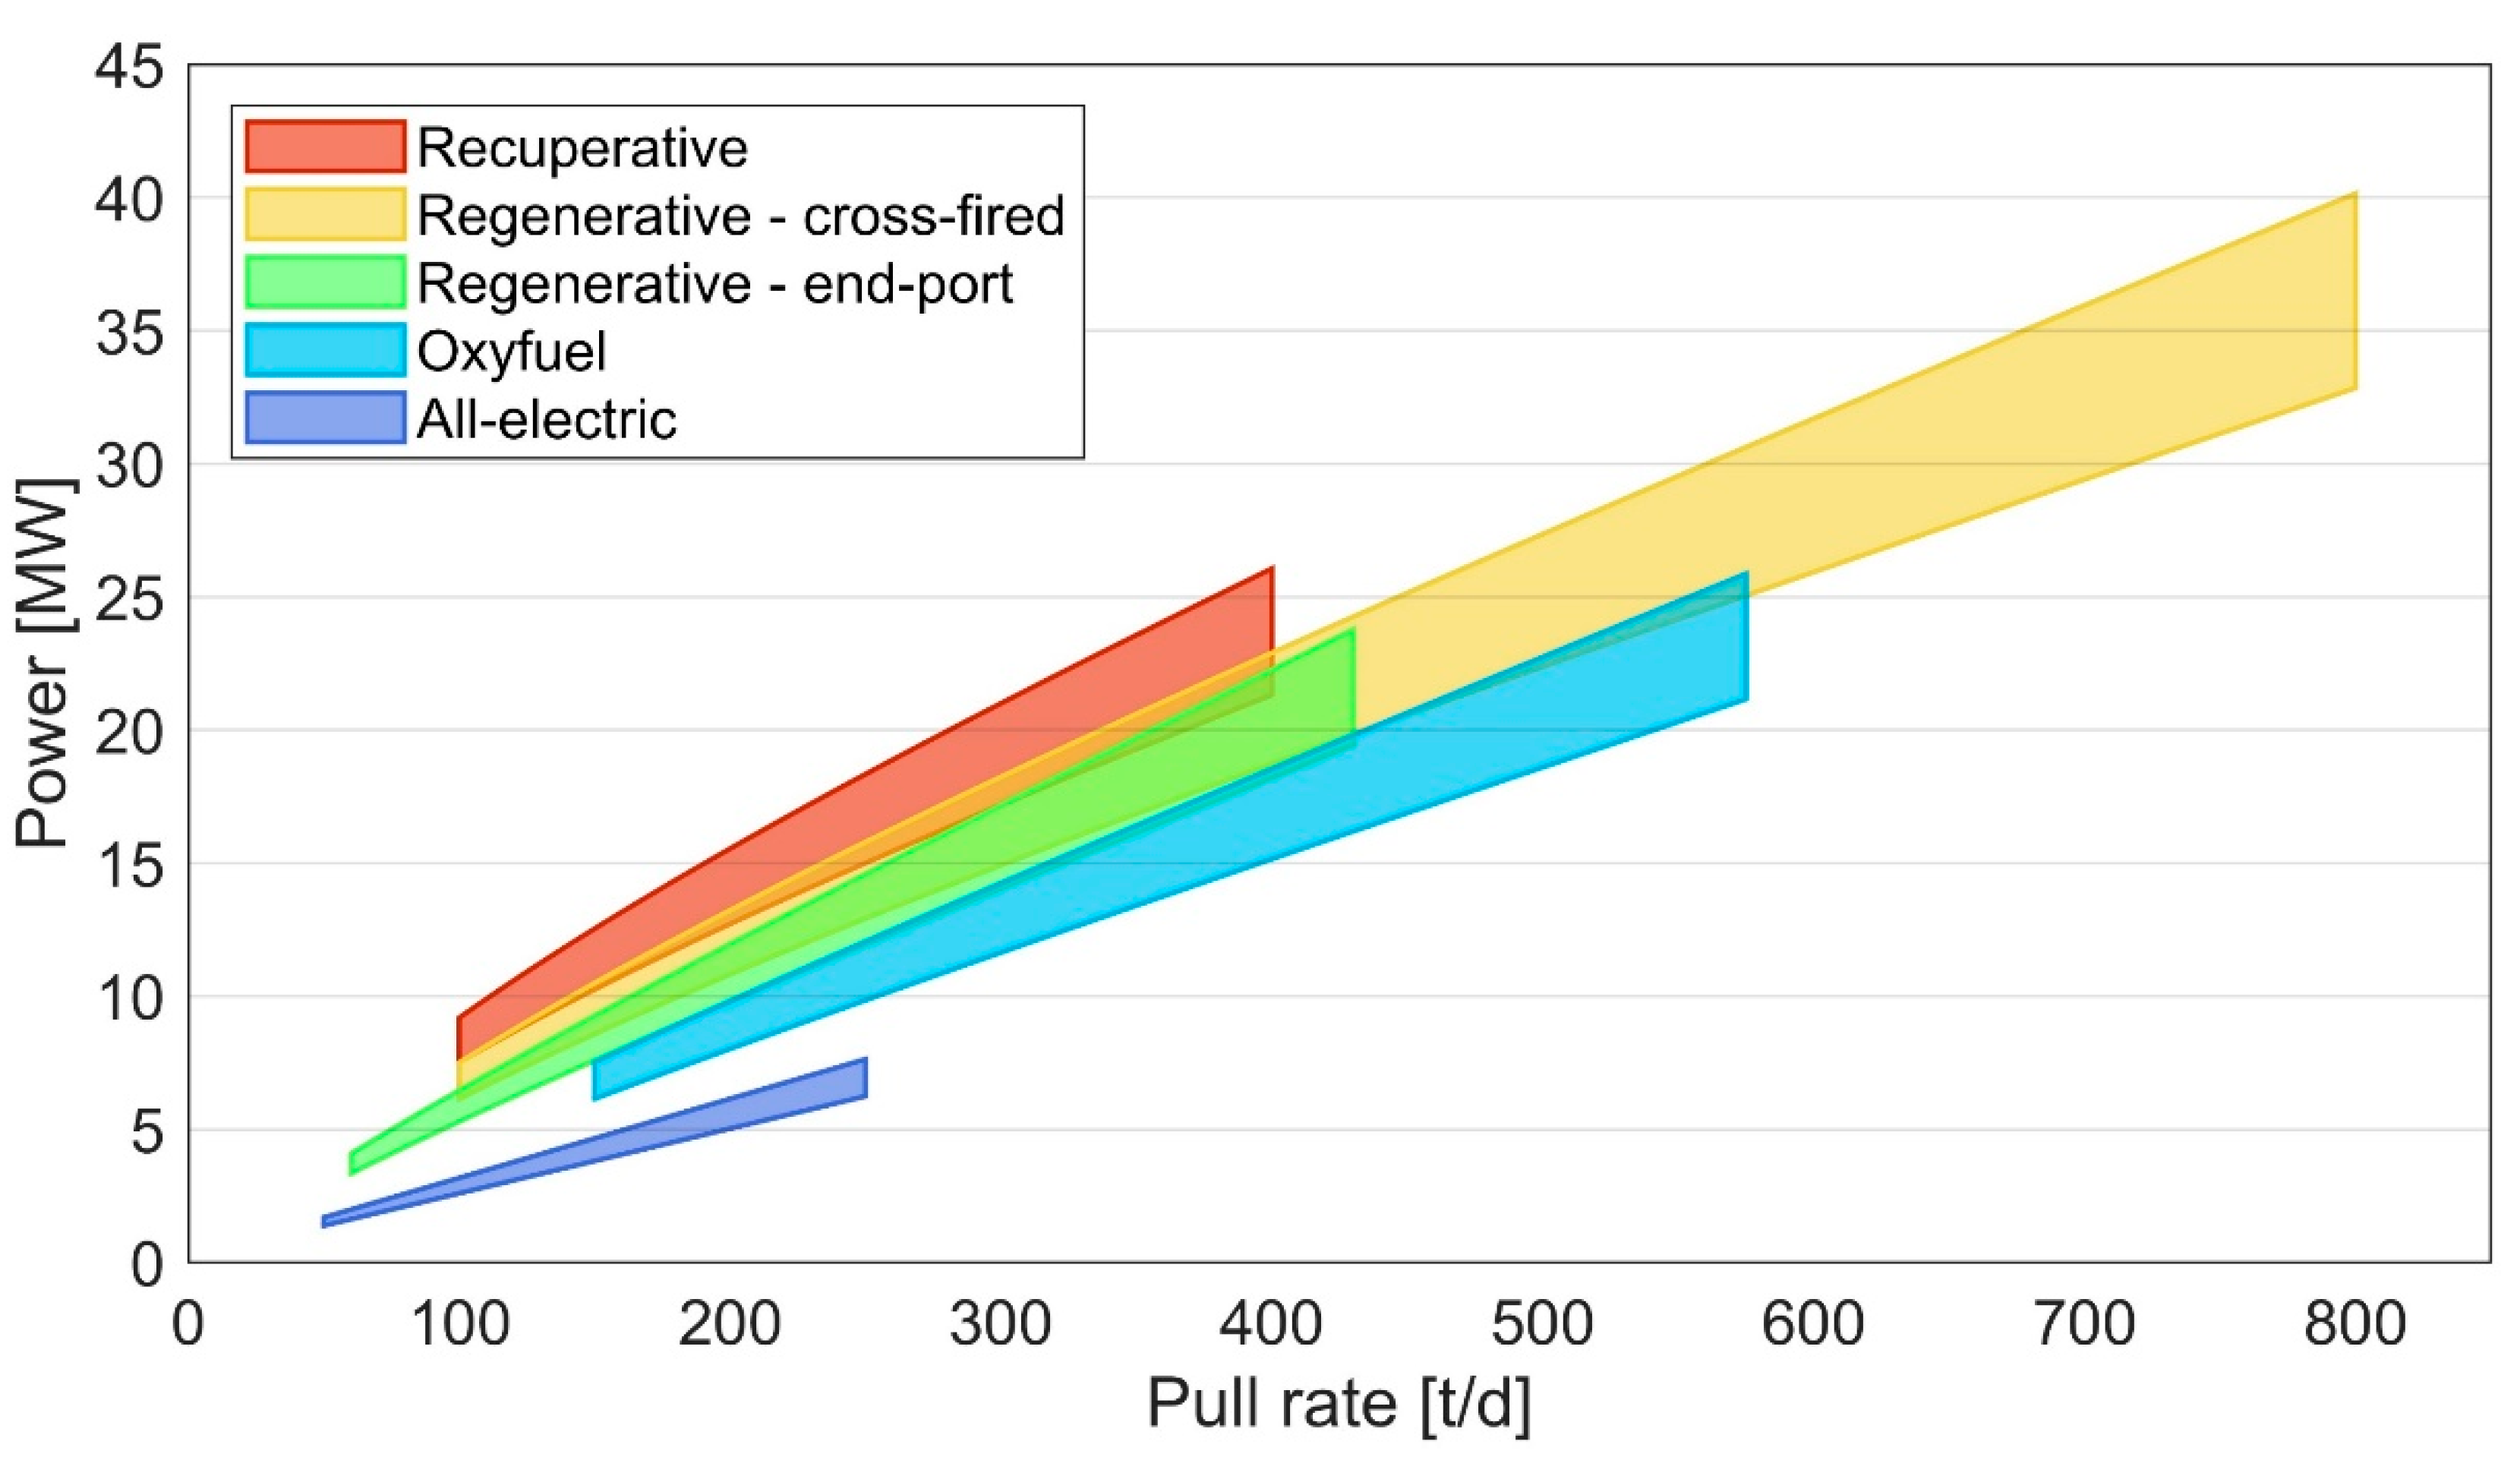
Figure 4.
Hybrid furnace design scheme and heat transfer modes: (a) conventional furnace, (b) highly electrified furnace, (c) hydrogen-fired furnace.
Figure 4.
Hybrid furnace design scheme and heat transfer modes: (a) conventional furnace, (b) highly electrified furnace, (c) hydrogen-fired furnace.
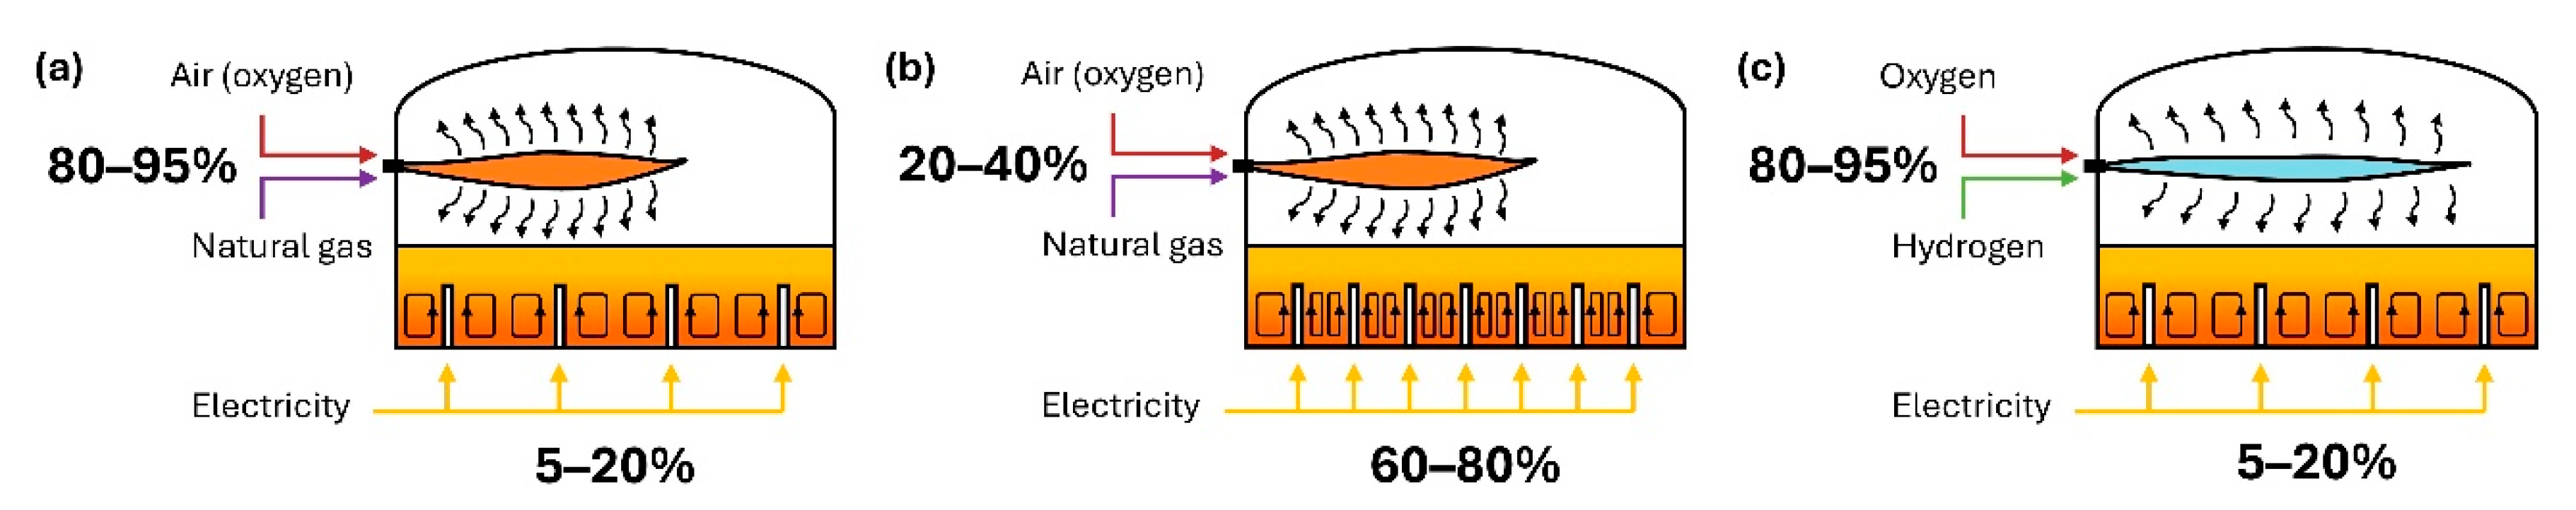
Figure 5.
Integrated system layout under different configurations: (a) direct integration, (b) battery integration, (c) hydrogen integration.
Figure 5.
Integrated system layout under different configurations: (a) direct integration, (b) battery integration, (c) hydrogen integration.
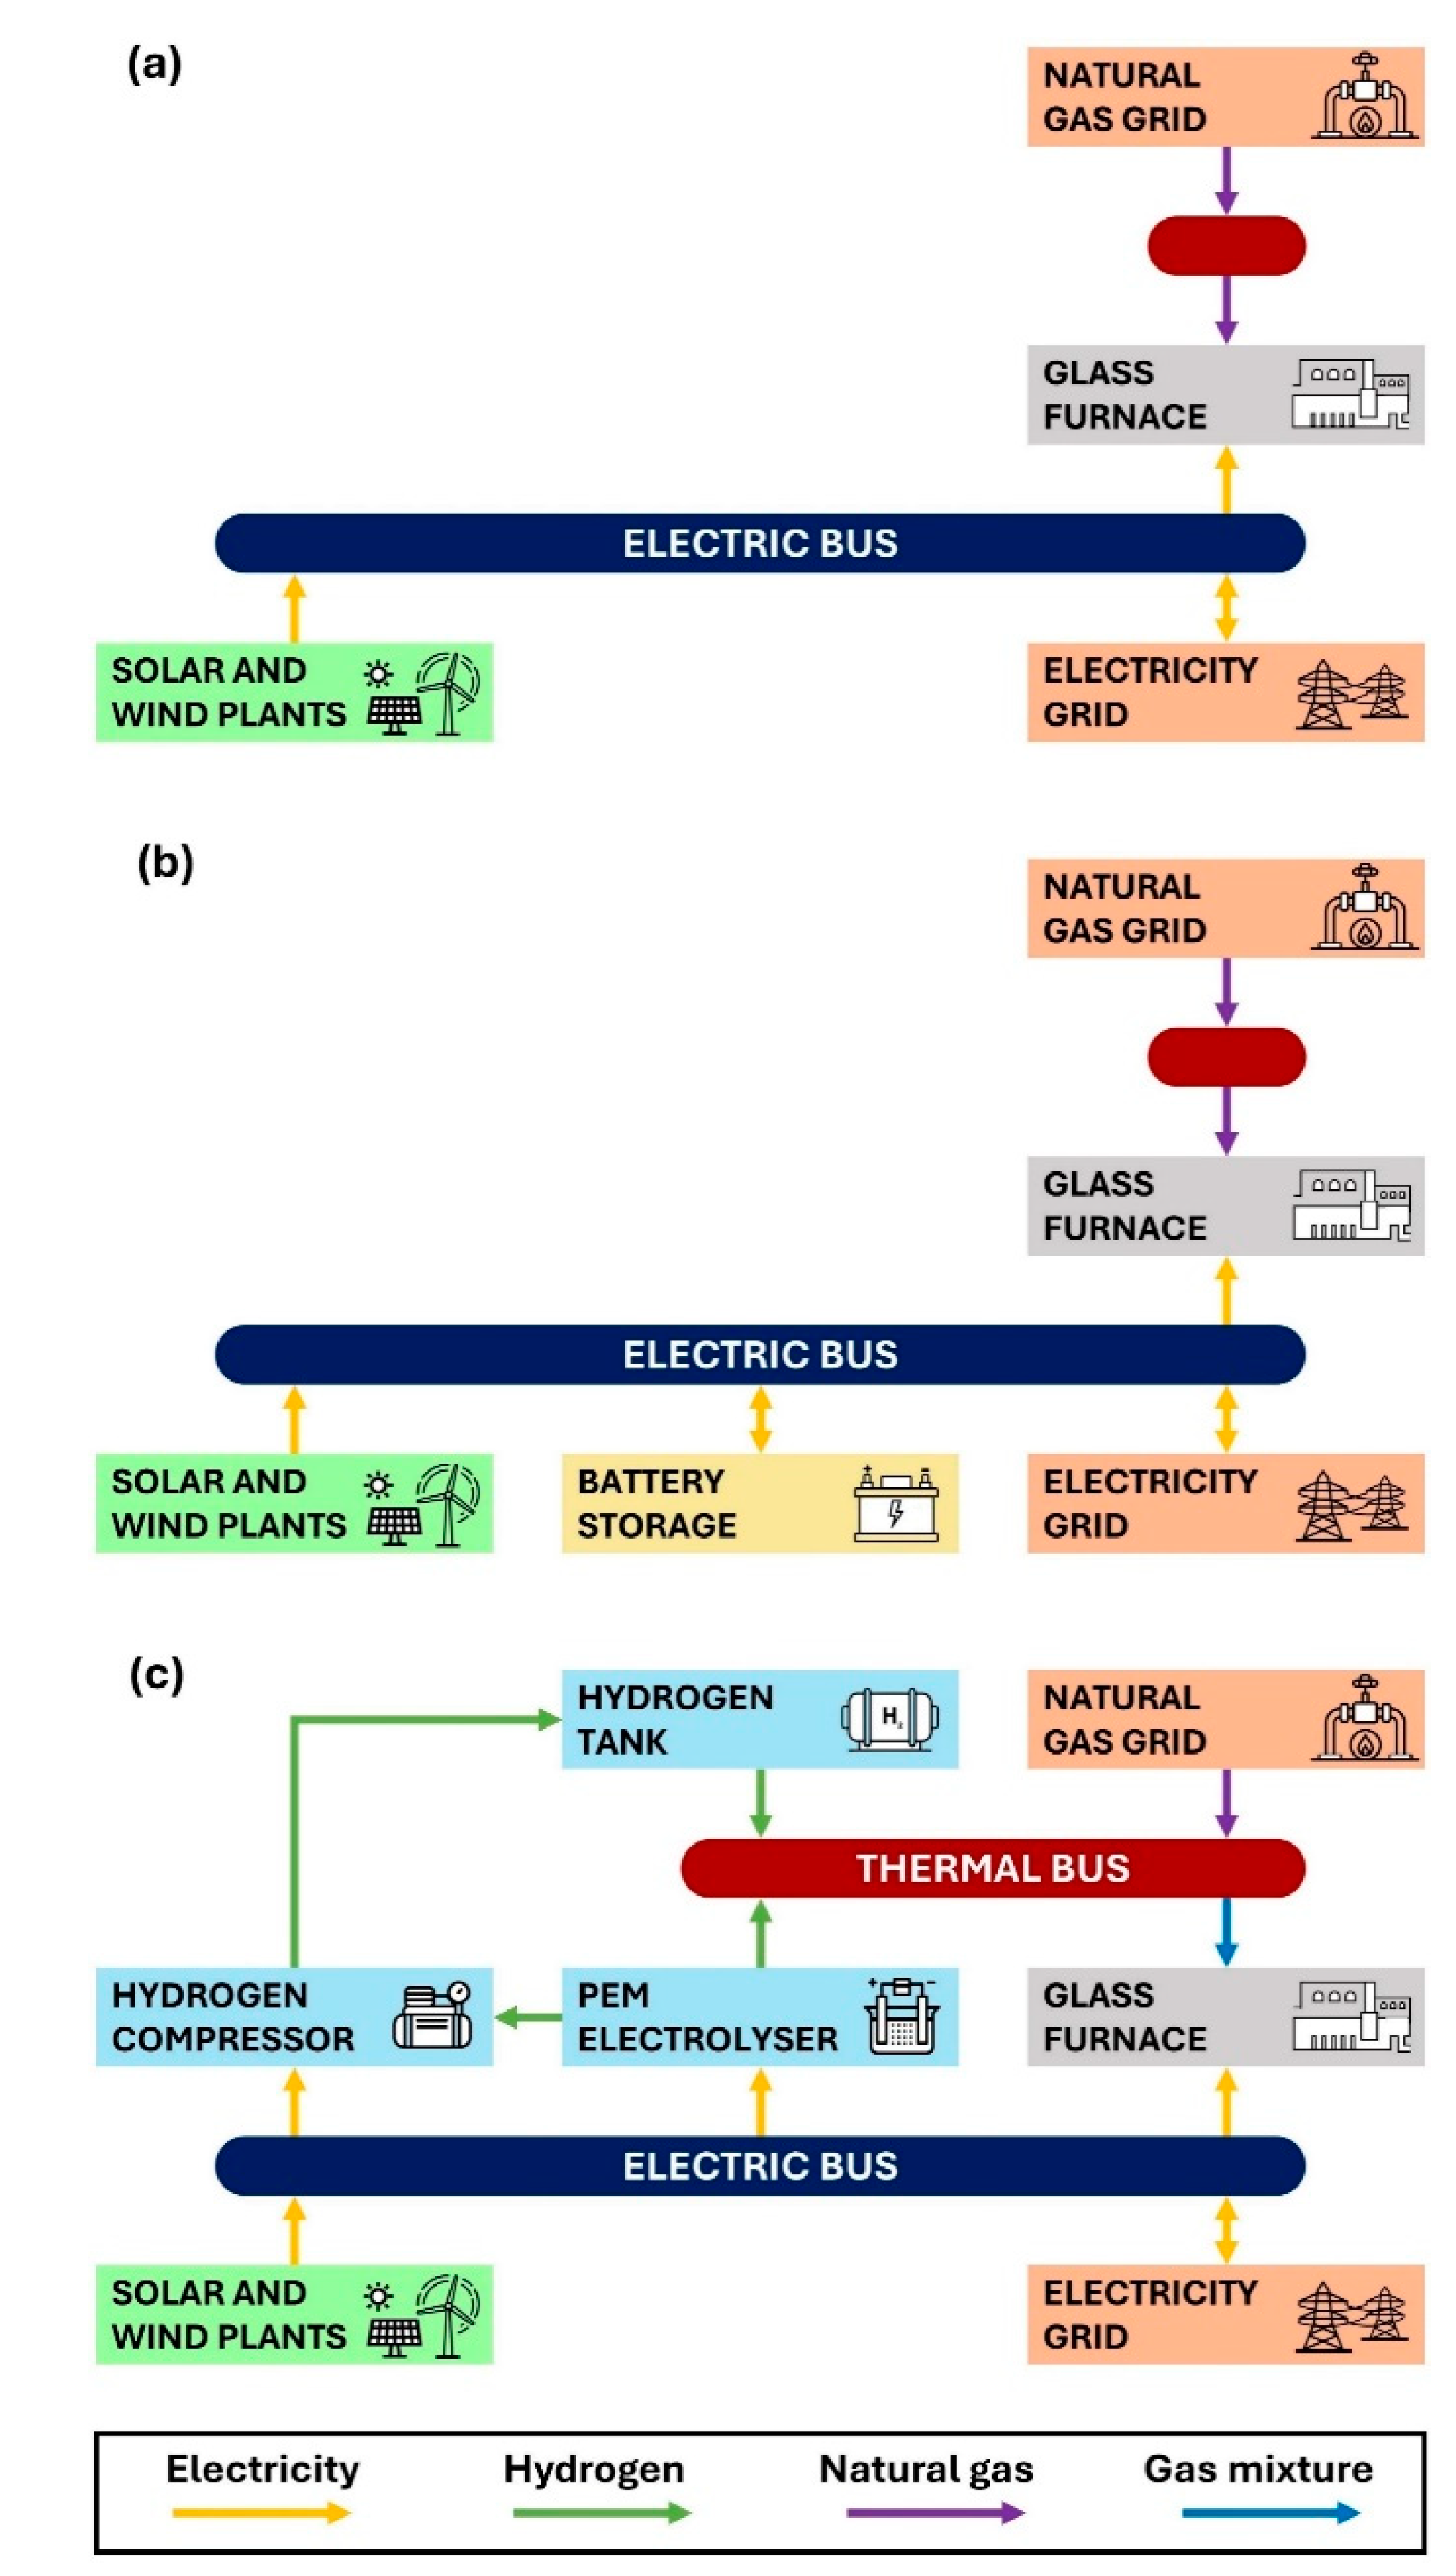
Figure 6.
Operational behaviour under different system configuration: (a) electric and (b) thermal balances for direct integration, (c) electric and (d) thermal balances for battery integration, (e) electric and (f) hydrogen integration.
Figure 6.
Operational behaviour under different system configuration: (a) electric and (b) thermal balances for direct integration, (c) electric and (d) thermal balances for battery integration, (e) electric and (f) hydrogen integration.
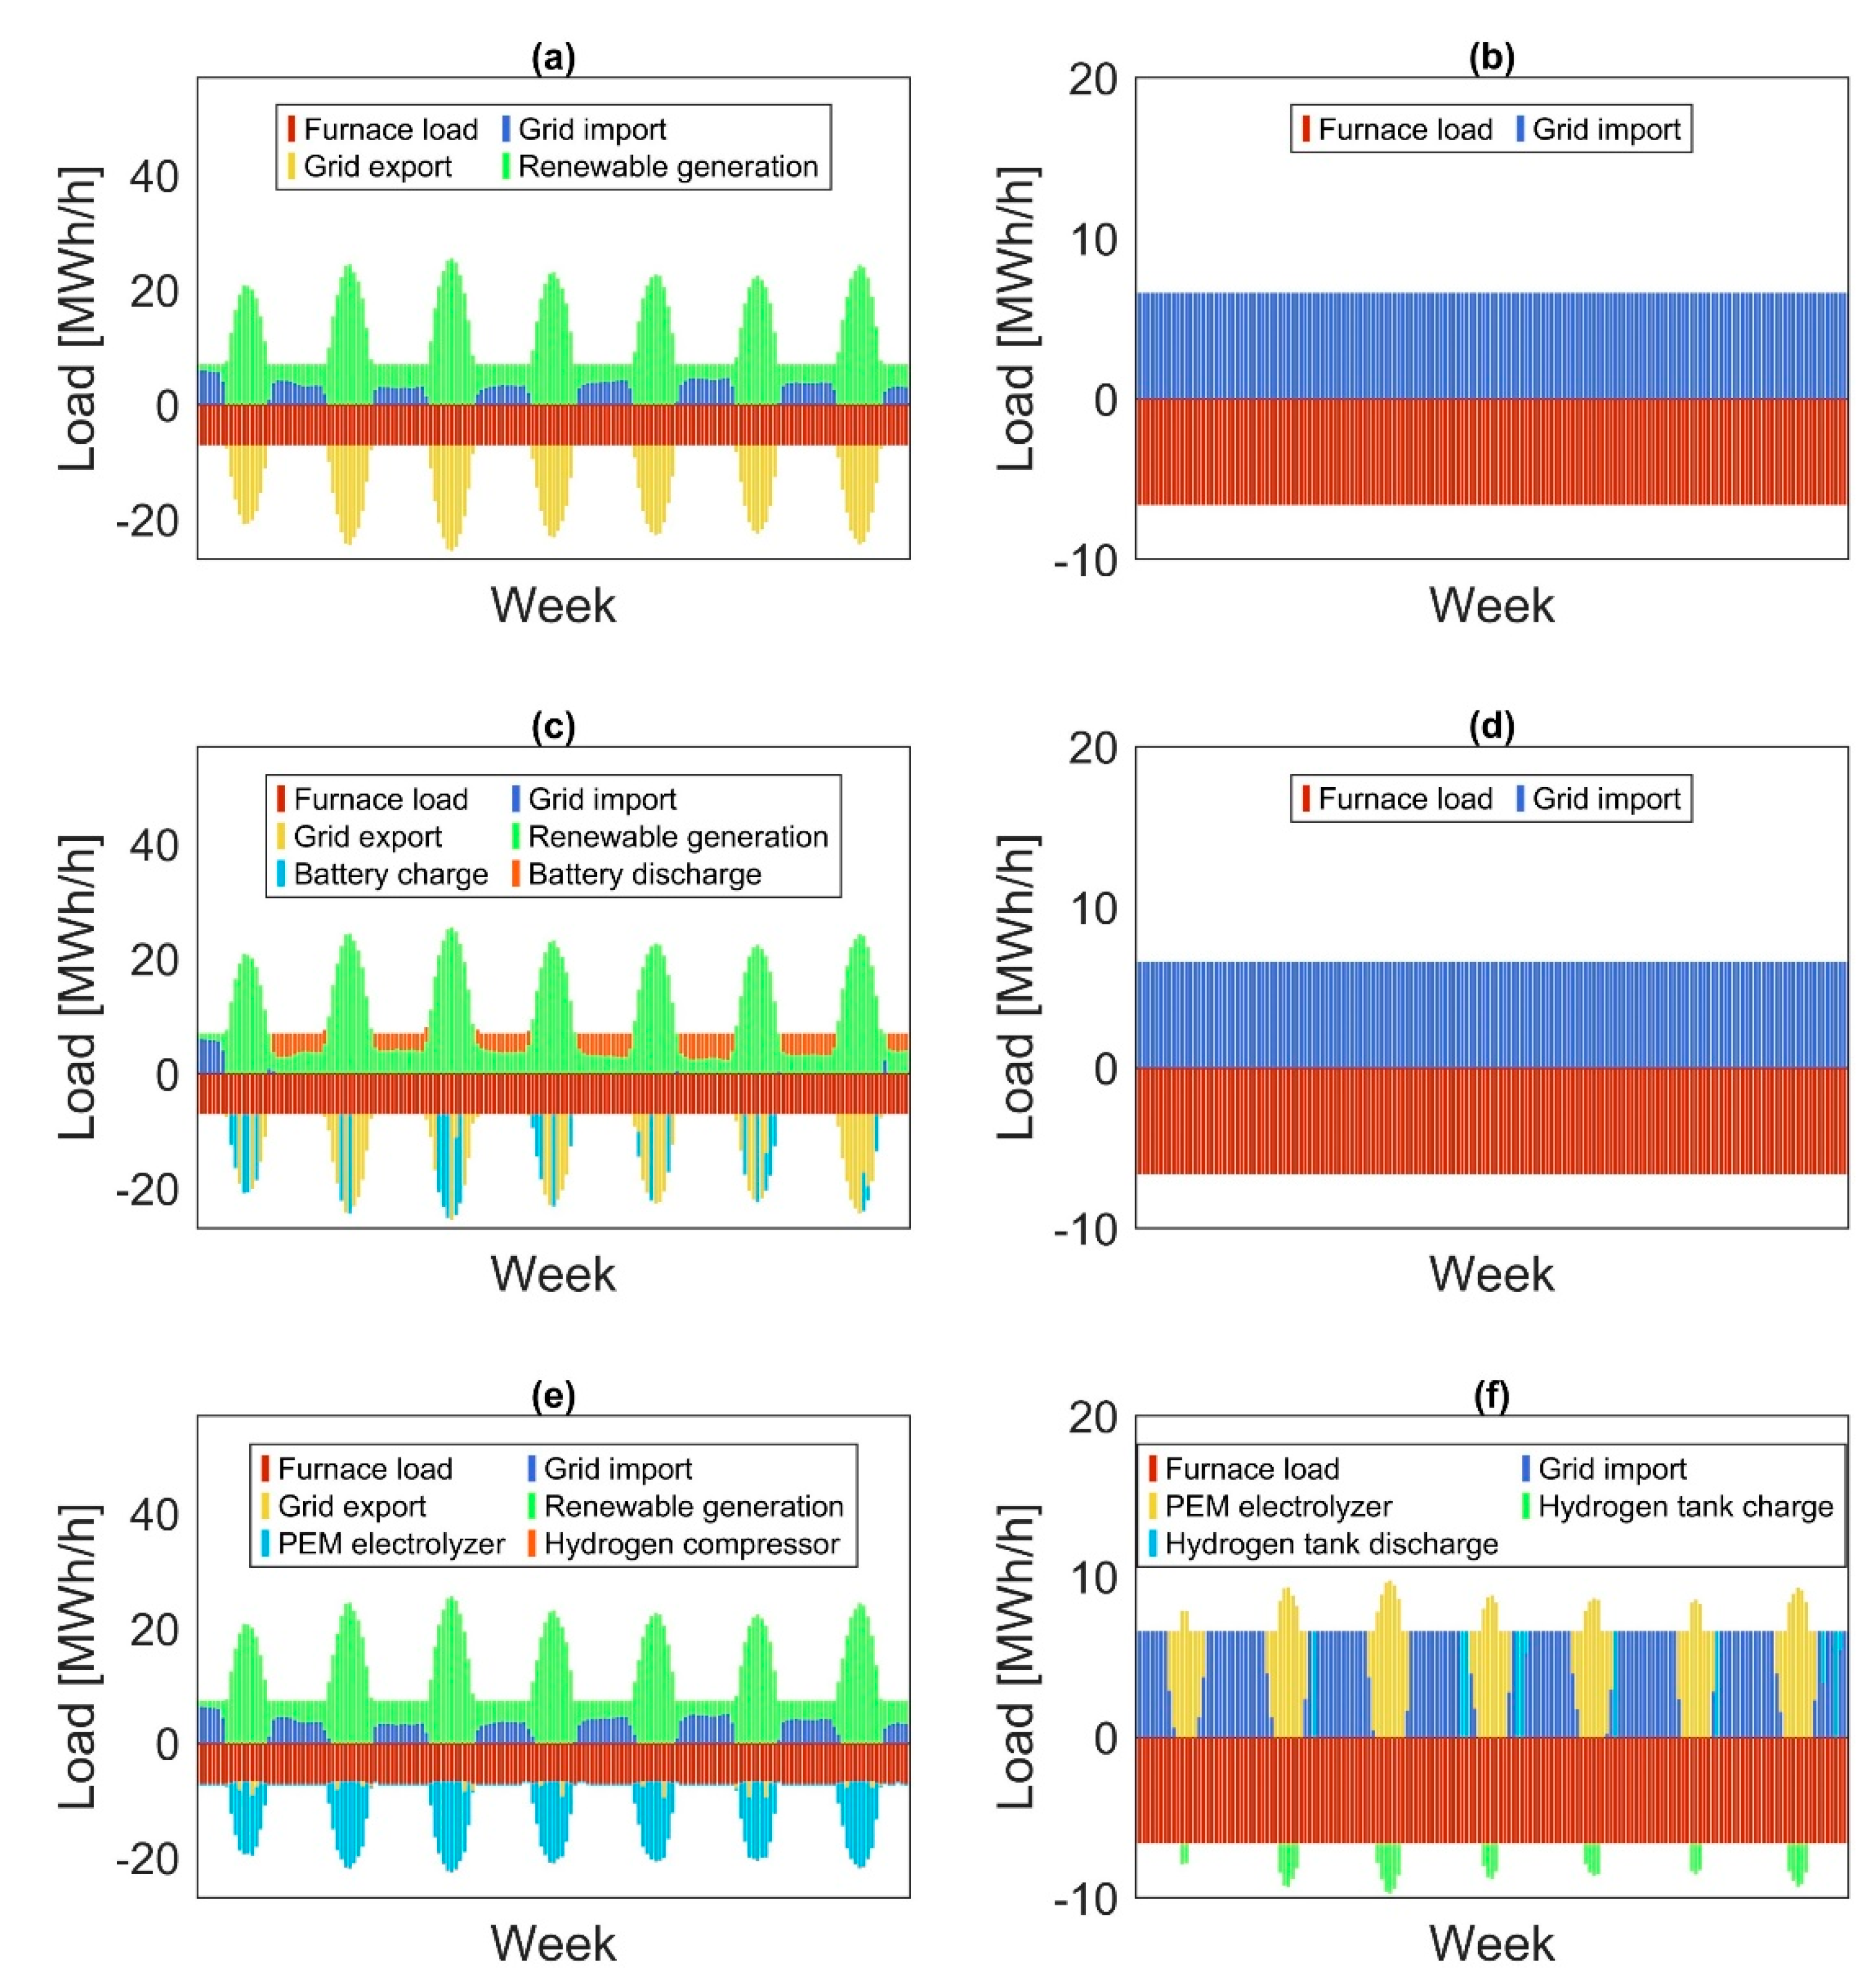
Figure 7.
Maps of decarbonisation costs for direct integration: (a) furnace boosting 20%, (b) furnace boosting 50%, (c) furnace boosting 80%.
Figure 7.
Maps of decarbonisation costs for direct integration: (a) furnace boosting 20%, (b) furnace boosting 50%, (c) furnace boosting 80%.
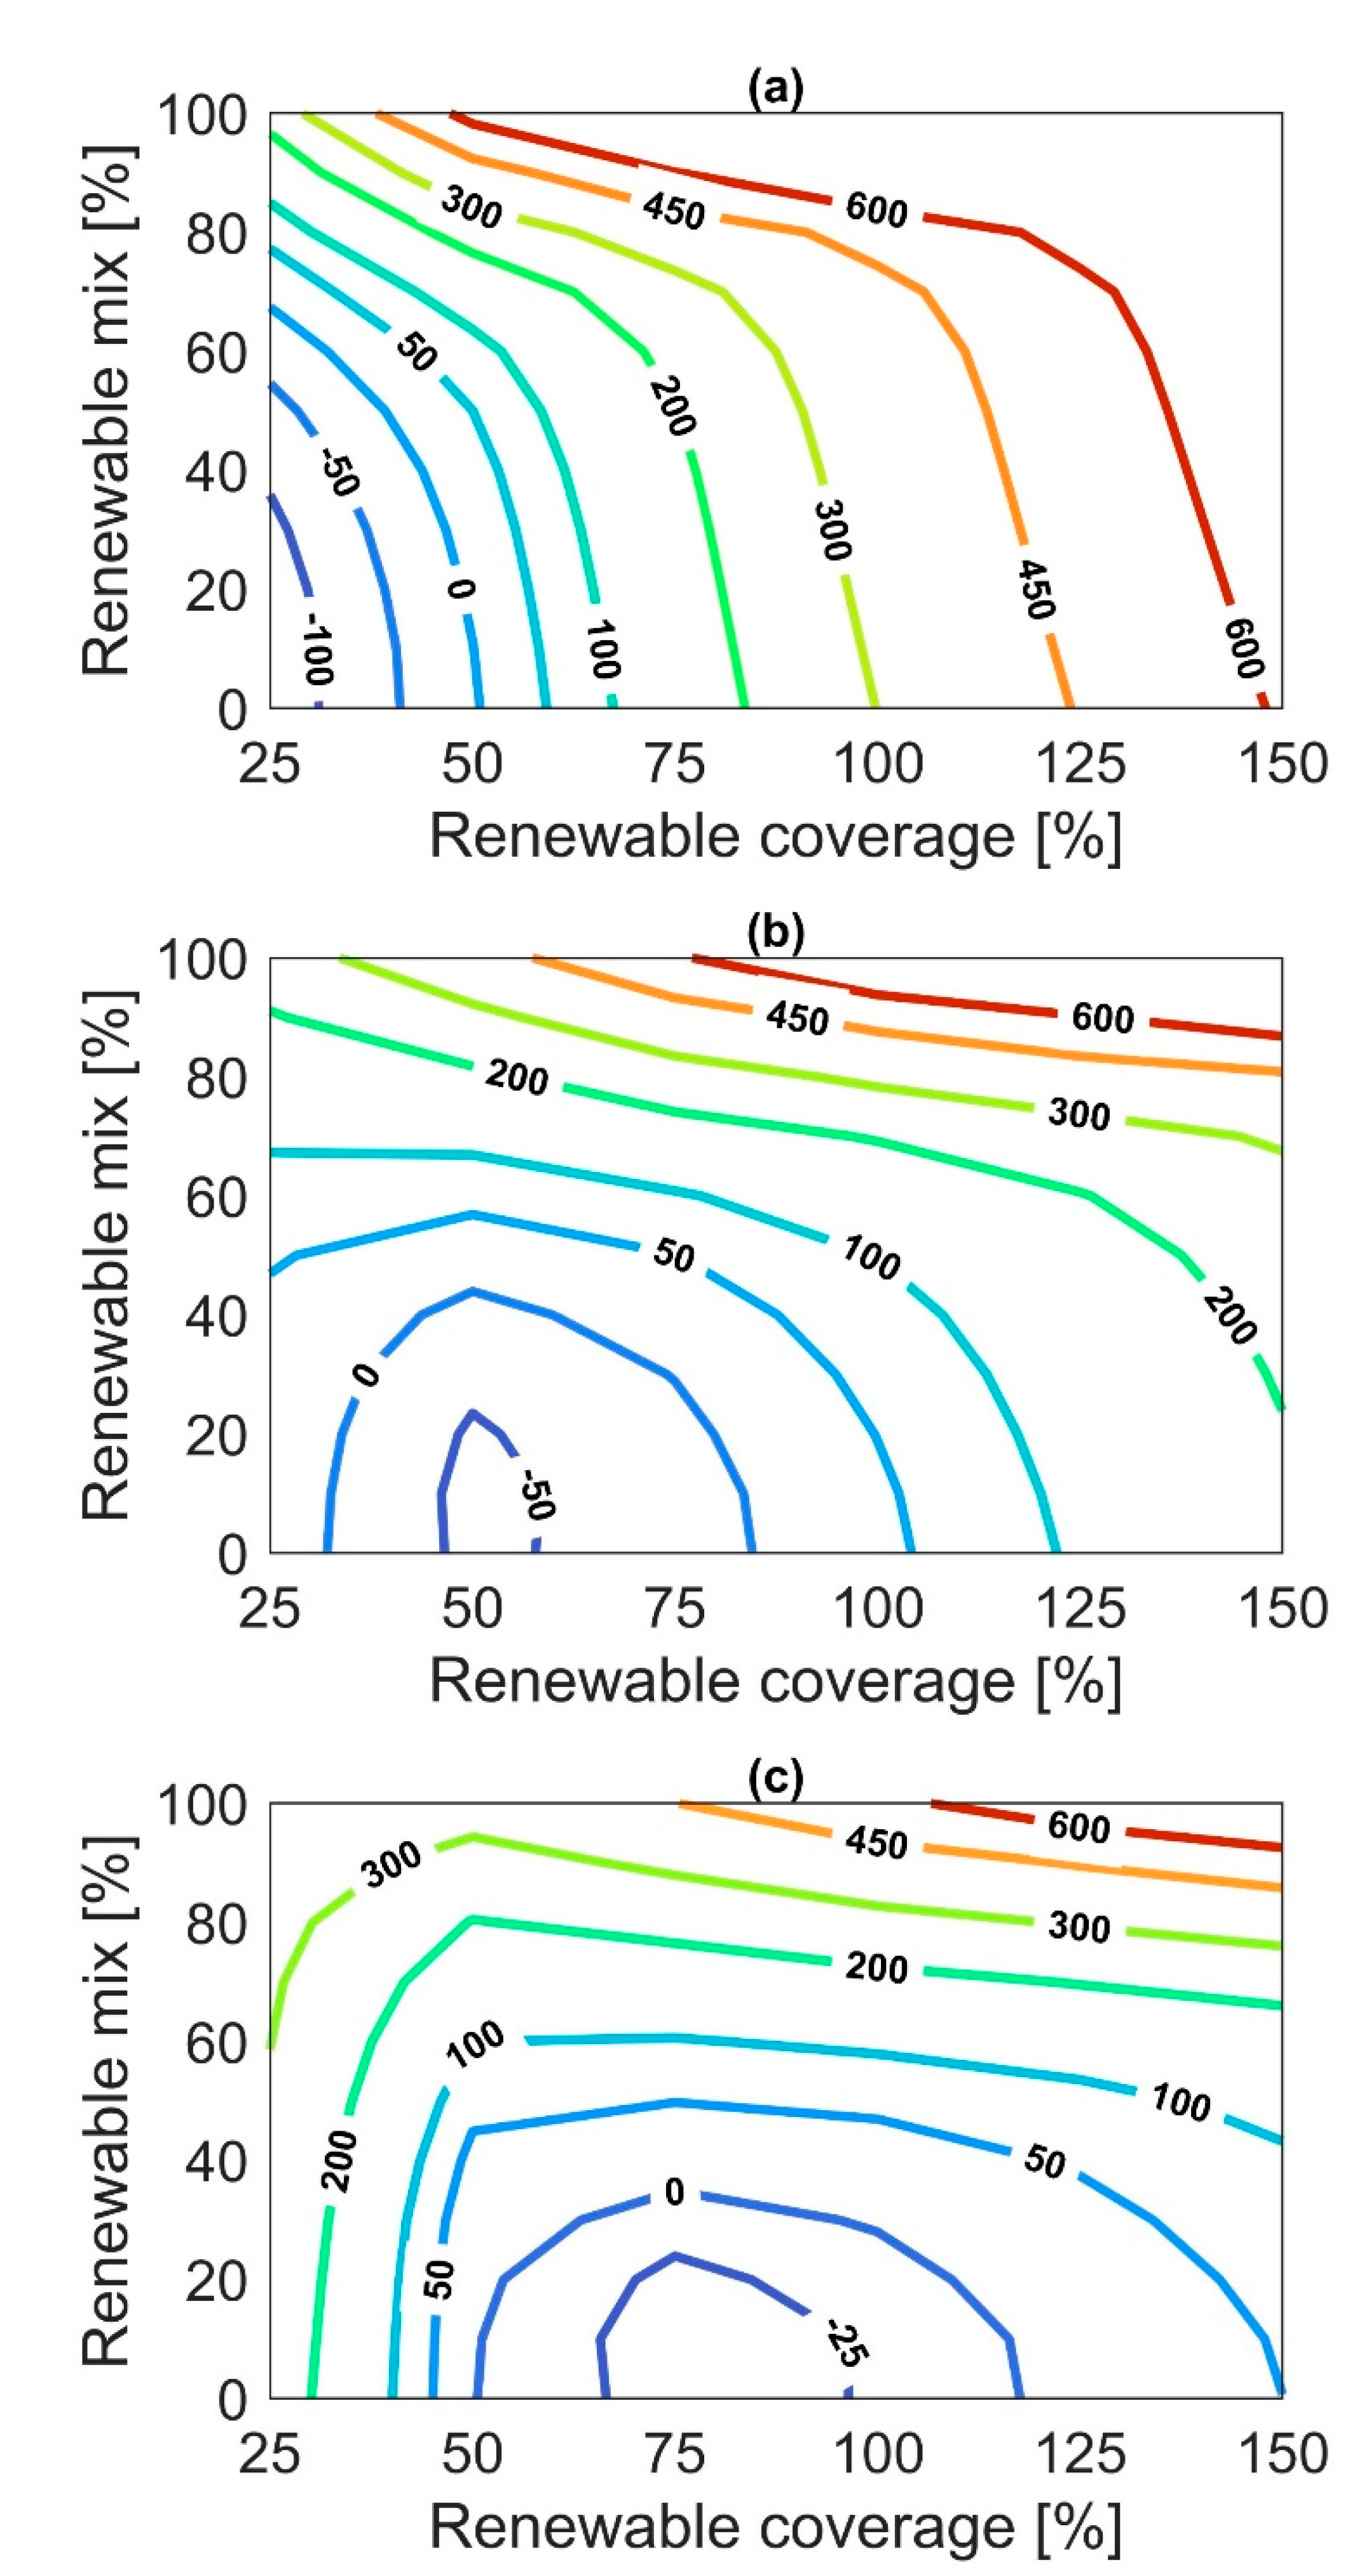
Figure 8.
Impact of design parameters on decarbonisation costs and emission reductions for direct integration: (a) furnace boosting, (b) renewable coverage, (c) renewable mix.
Figure 8.
Impact of design parameters on decarbonisation costs and emission reductions for direct integration: (a) furnace boosting, (b) renewable coverage, (c) renewable mix.
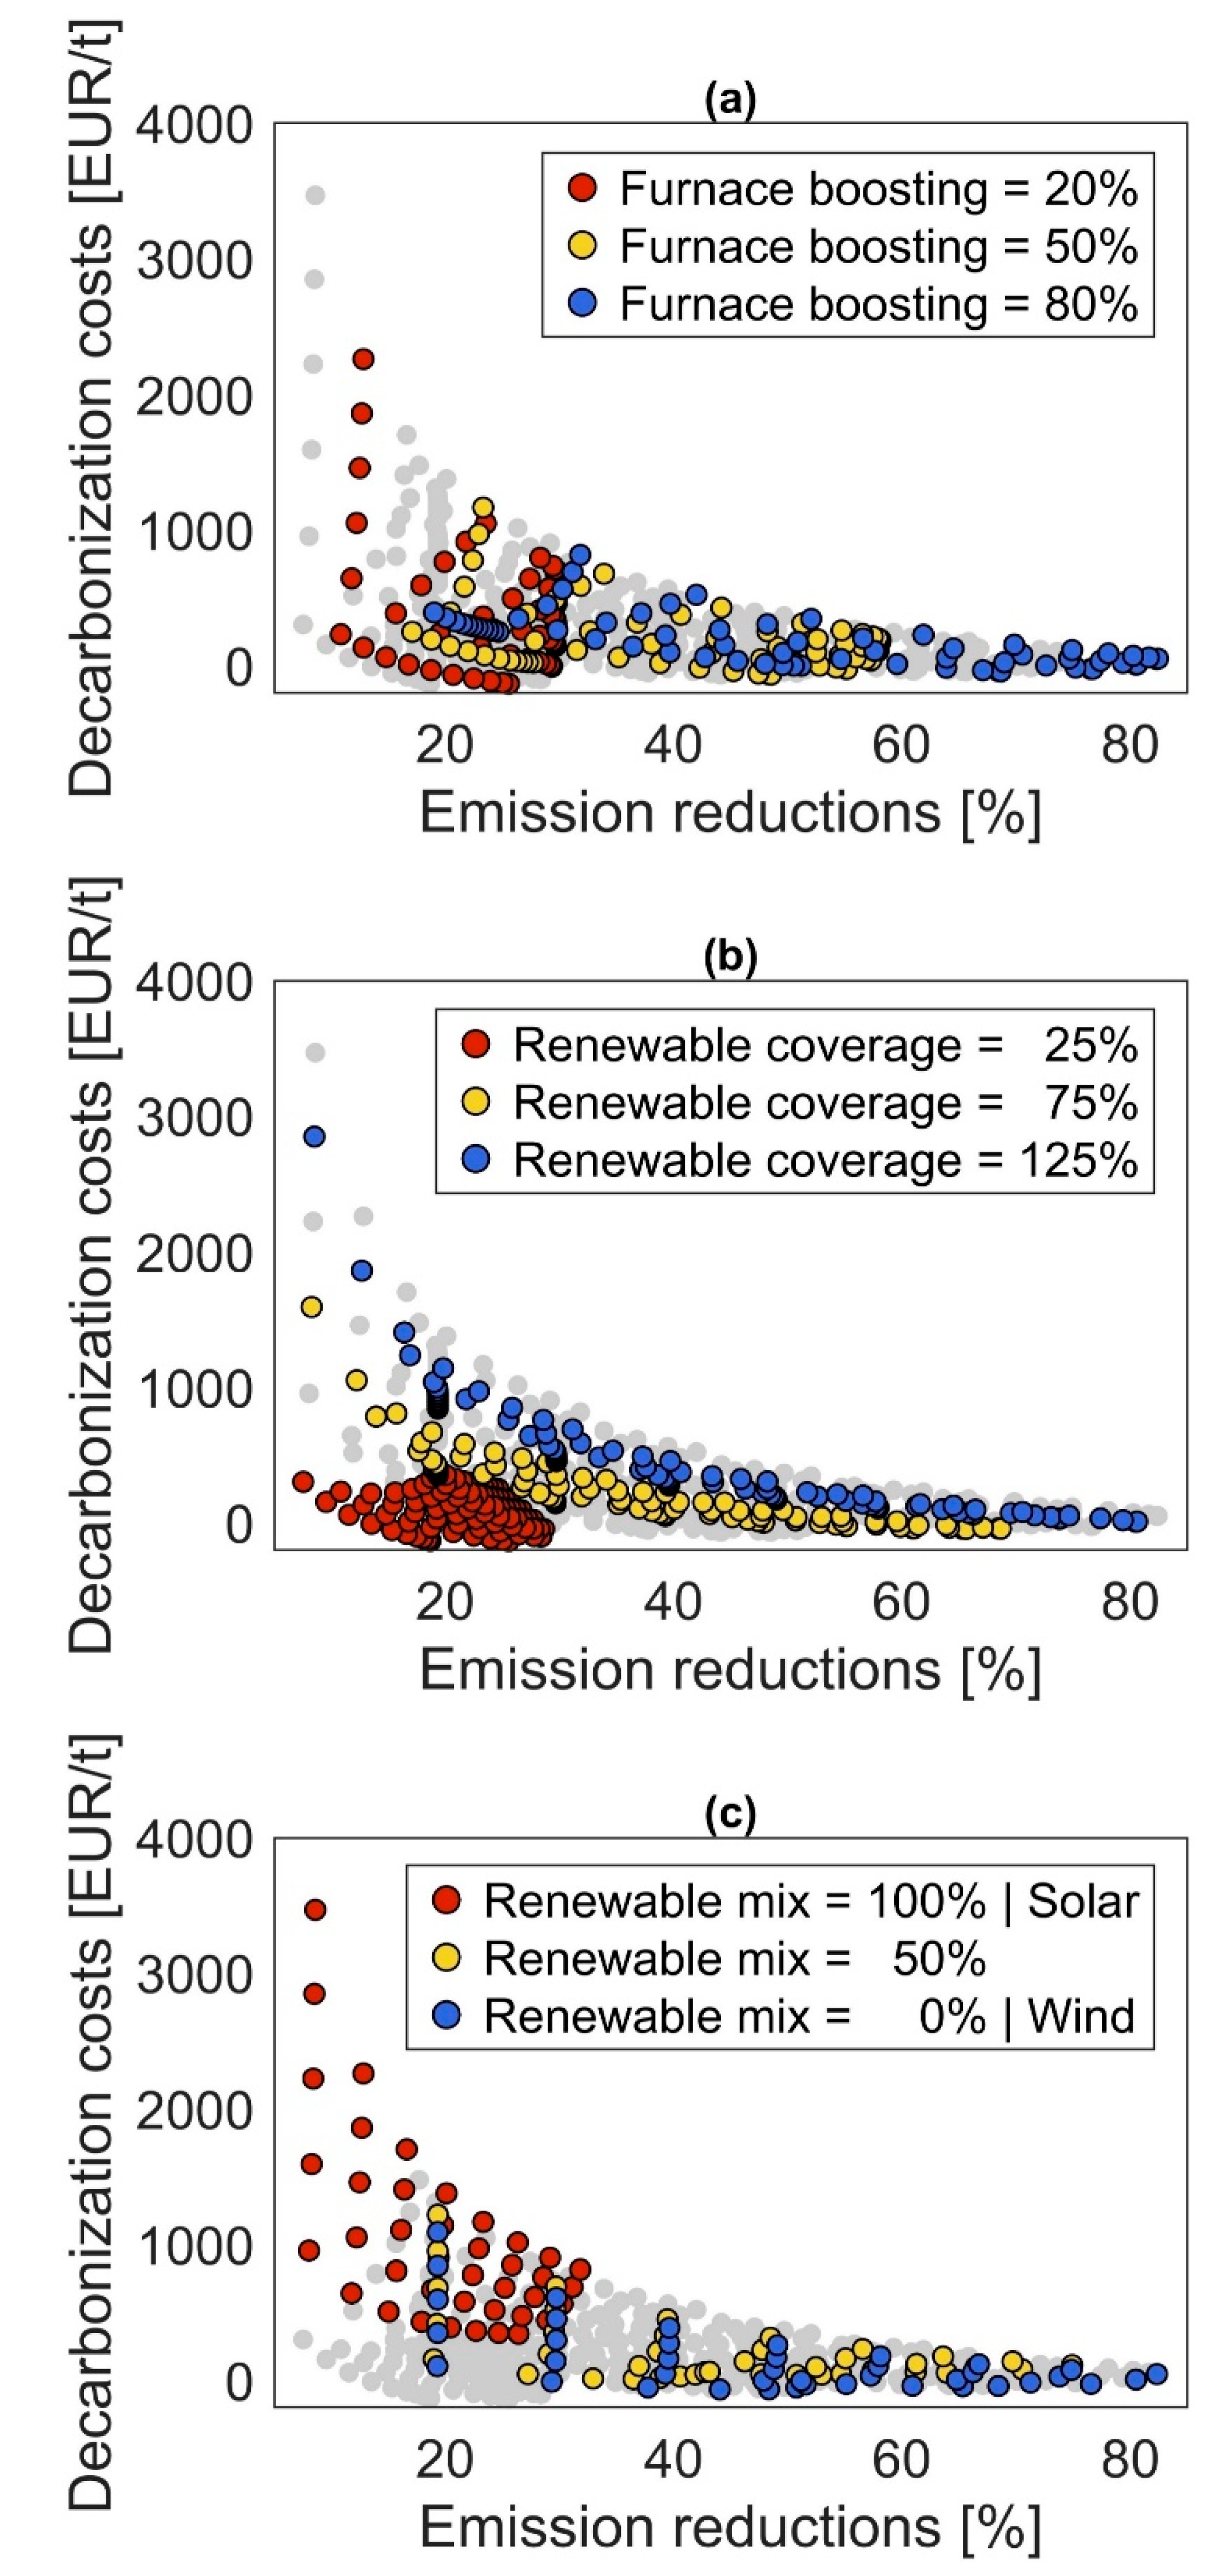
Figure 9.
Maps of decarbonisation costs for battery and hydrogen integration: (a) battery and (b) hydrogen integration for furnace boosting 20%, (c) battery and (d) hydrogen integration for furnace boosting 50%, (e) battery and (f) hydrogen integration for furnace boosting 80%.
Figure 9.
Maps of decarbonisation costs for battery and hydrogen integration: (a) battery and (b) hydrogen integration for furnace boosting 20%, (c) battery and (d) hydrogen integration for furnace boosting 50%, (e) battery and (f) hydrogen integration for furnace boosting 80%.
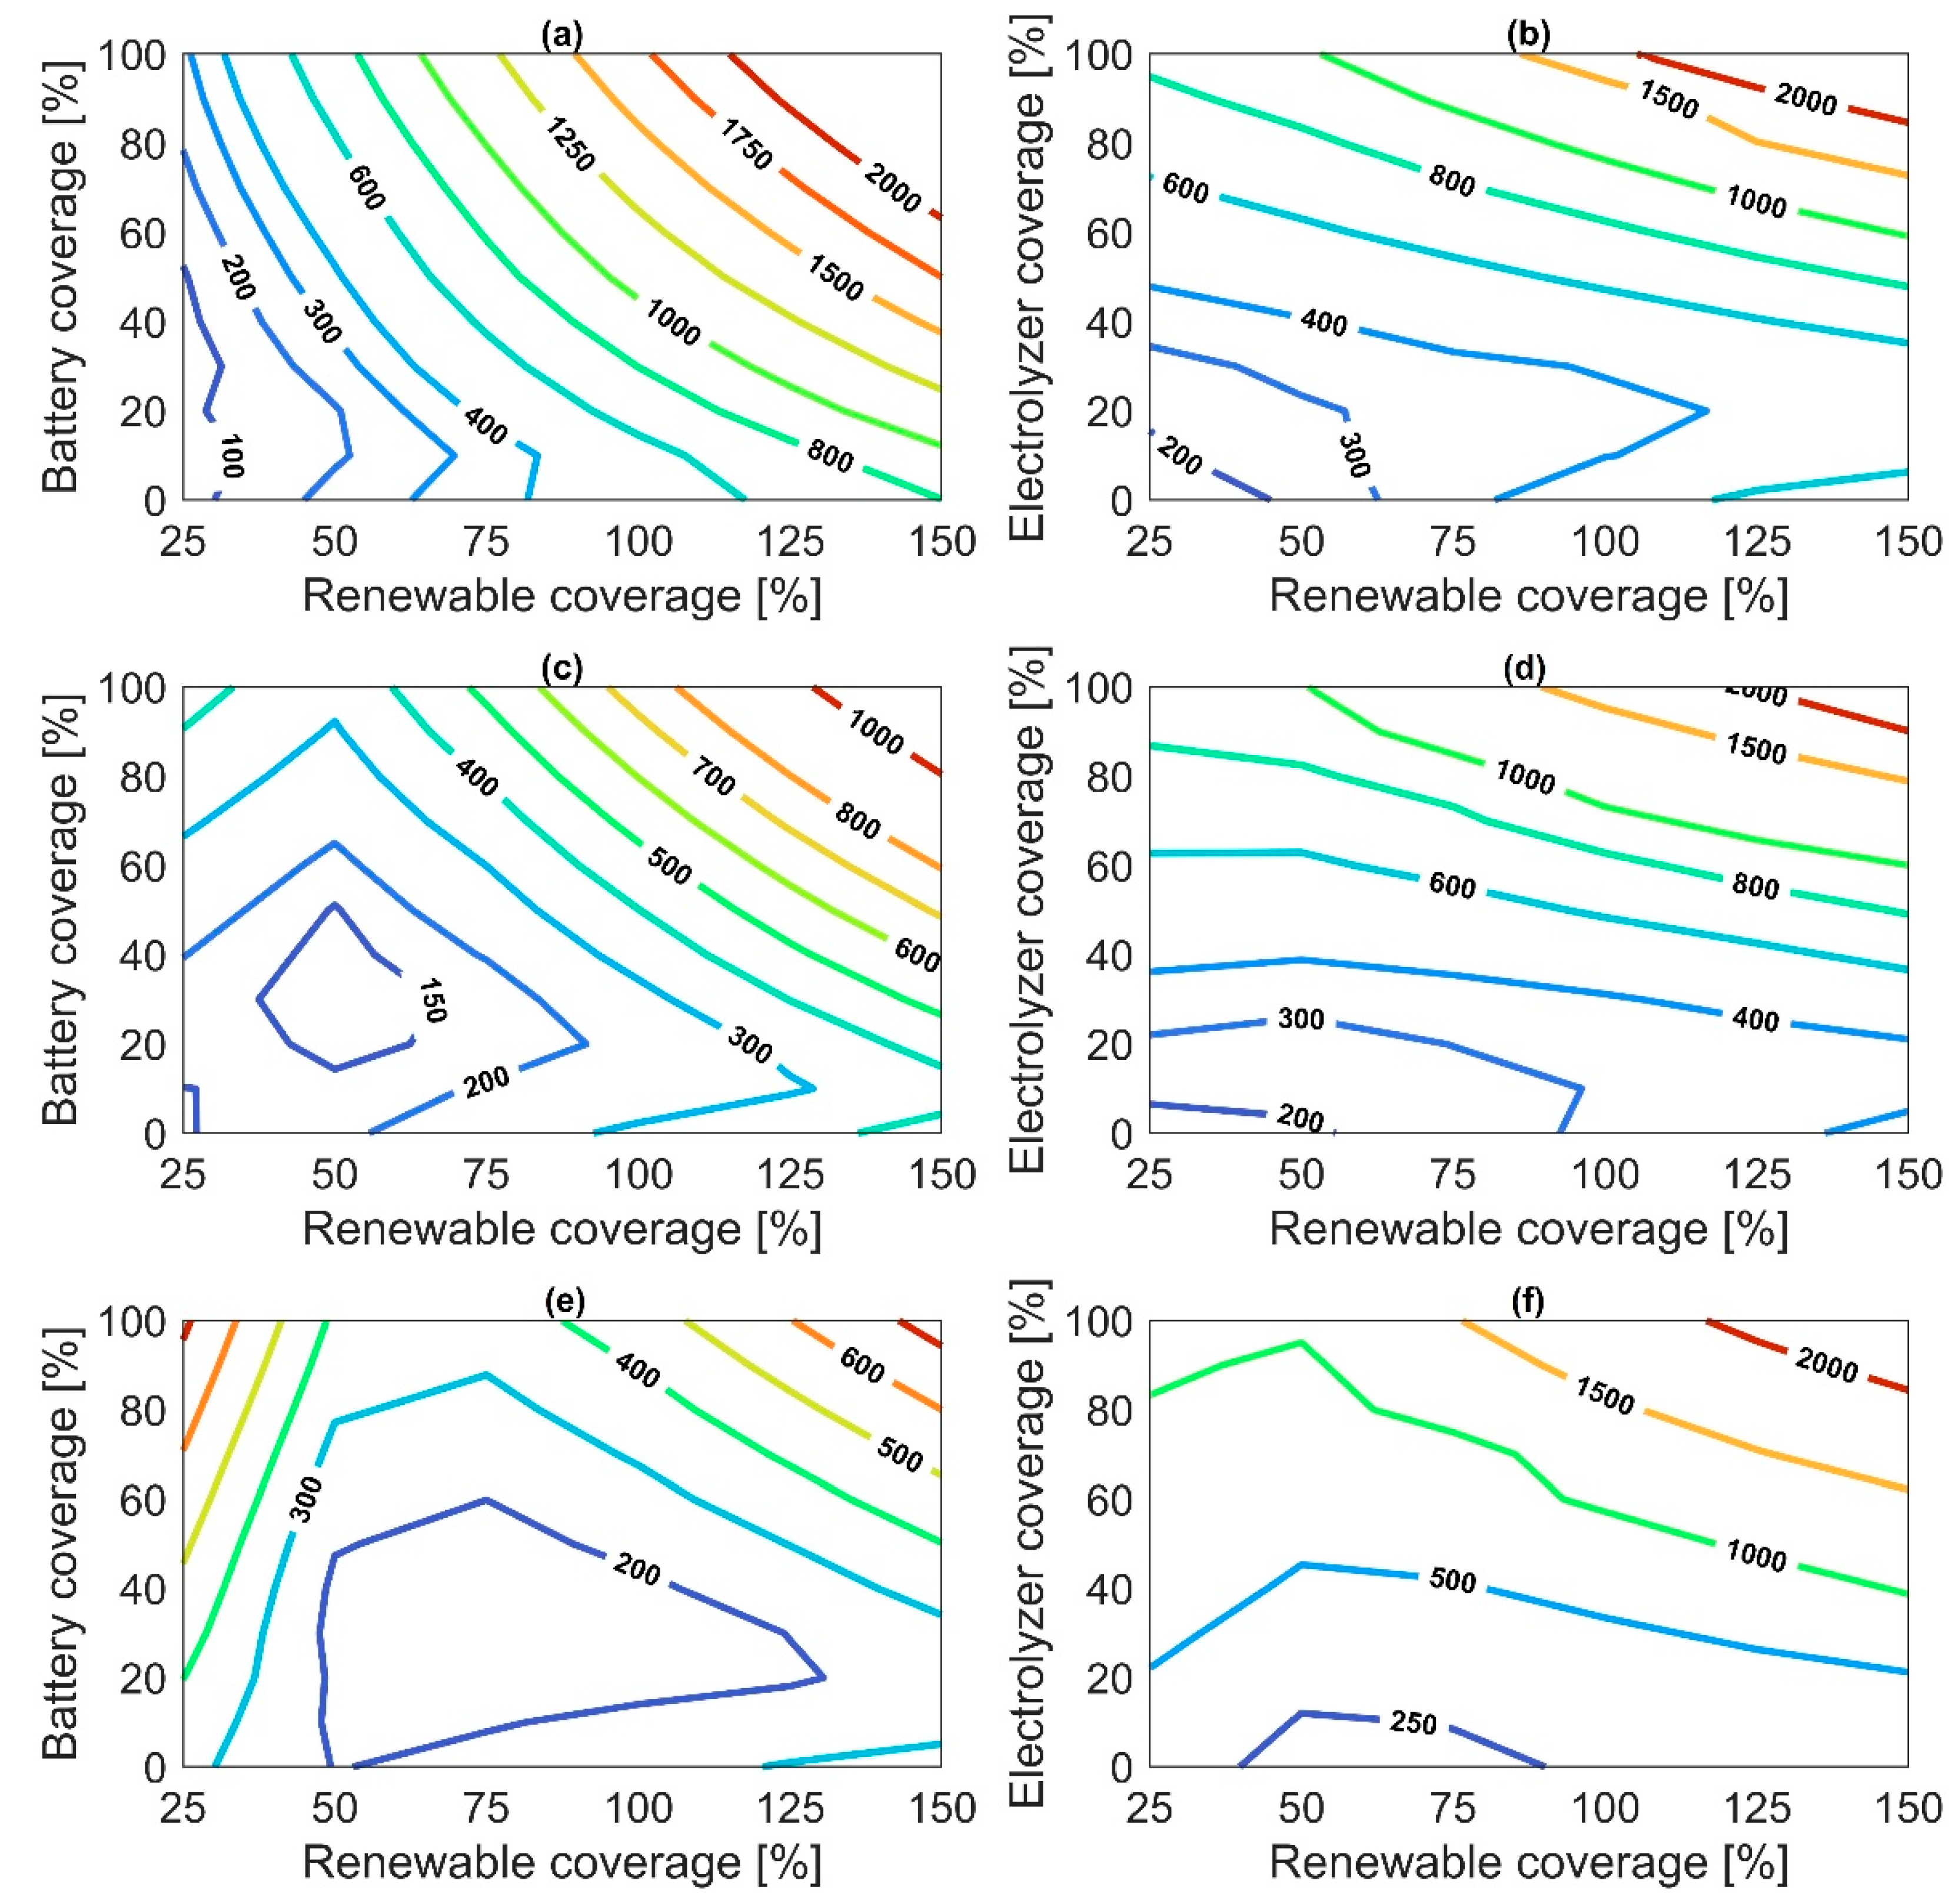
Figure 10.
Decarbonisation costs of renewable integration: (a) costs and emission reductions for direct, battery and hydrogen integration, (b) costs for emission reductions above 55%.
Figure 10.
Decarbonisation costs of renewable integration: (a) costs and emission reductions for direct, battery and hydrogen integration, (b) costs for emission reductions above 55%.
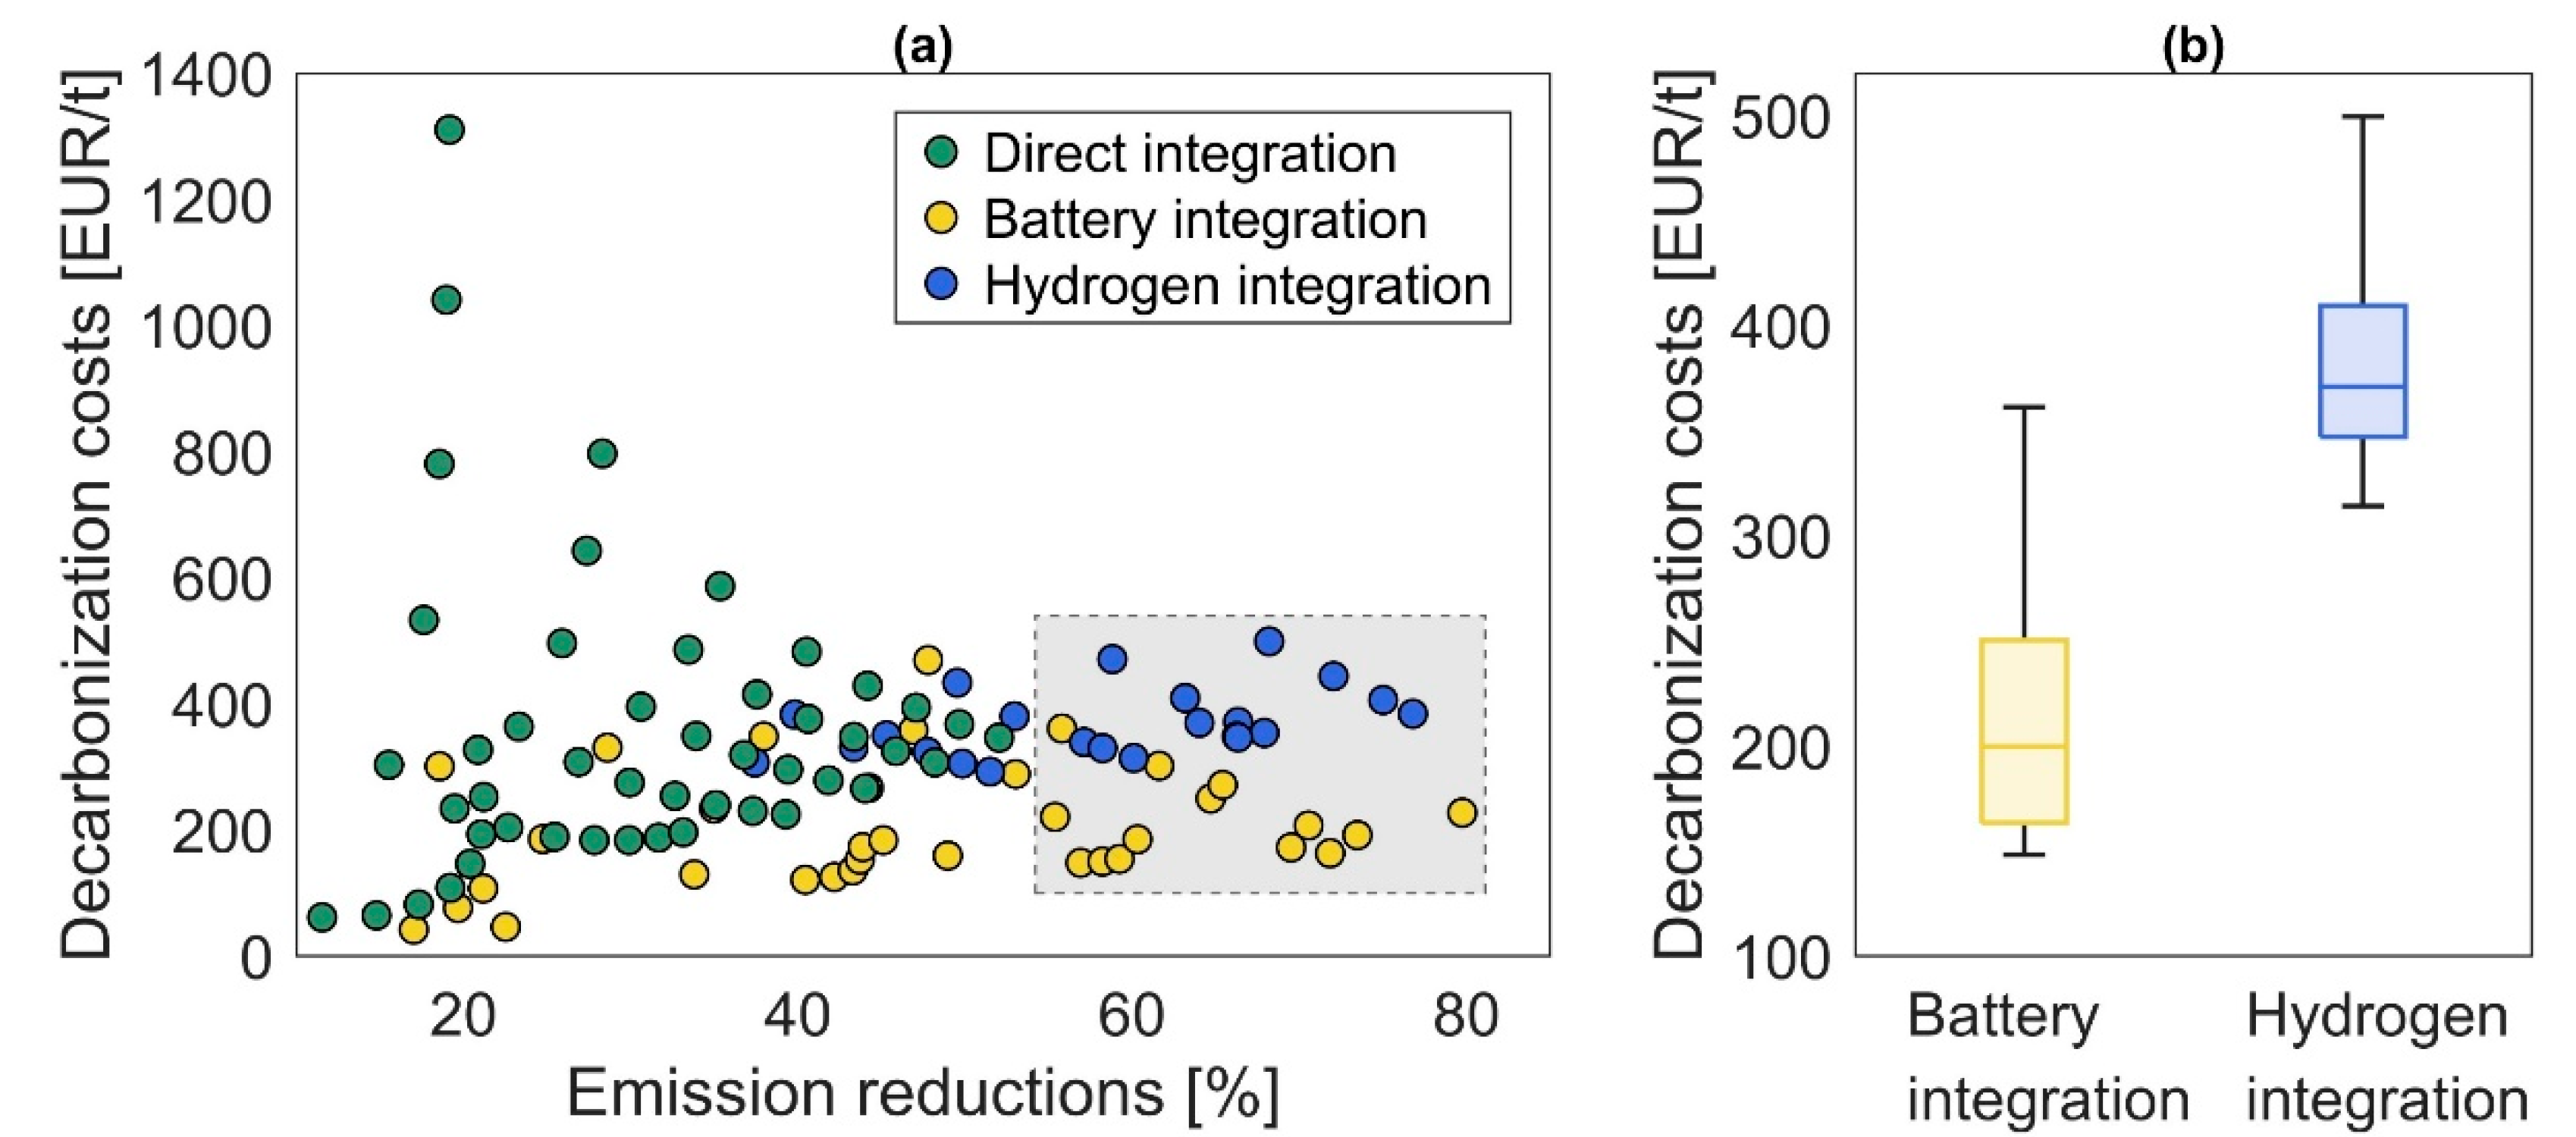
Figure 11.
Maps of minimum costs for decarbonisation strategies: (a) battery and (b) hydrogen integration for carbon price of 75 EUR/t, (c) battery and (d) hydrogen integration for carbon price of 150 EUR/t, (e) battery and (f) hydrogen integration for carbon price of 225 EUR/t, (g) battery and (h) hydrogen integration for carbon price of 300 EUR/t.
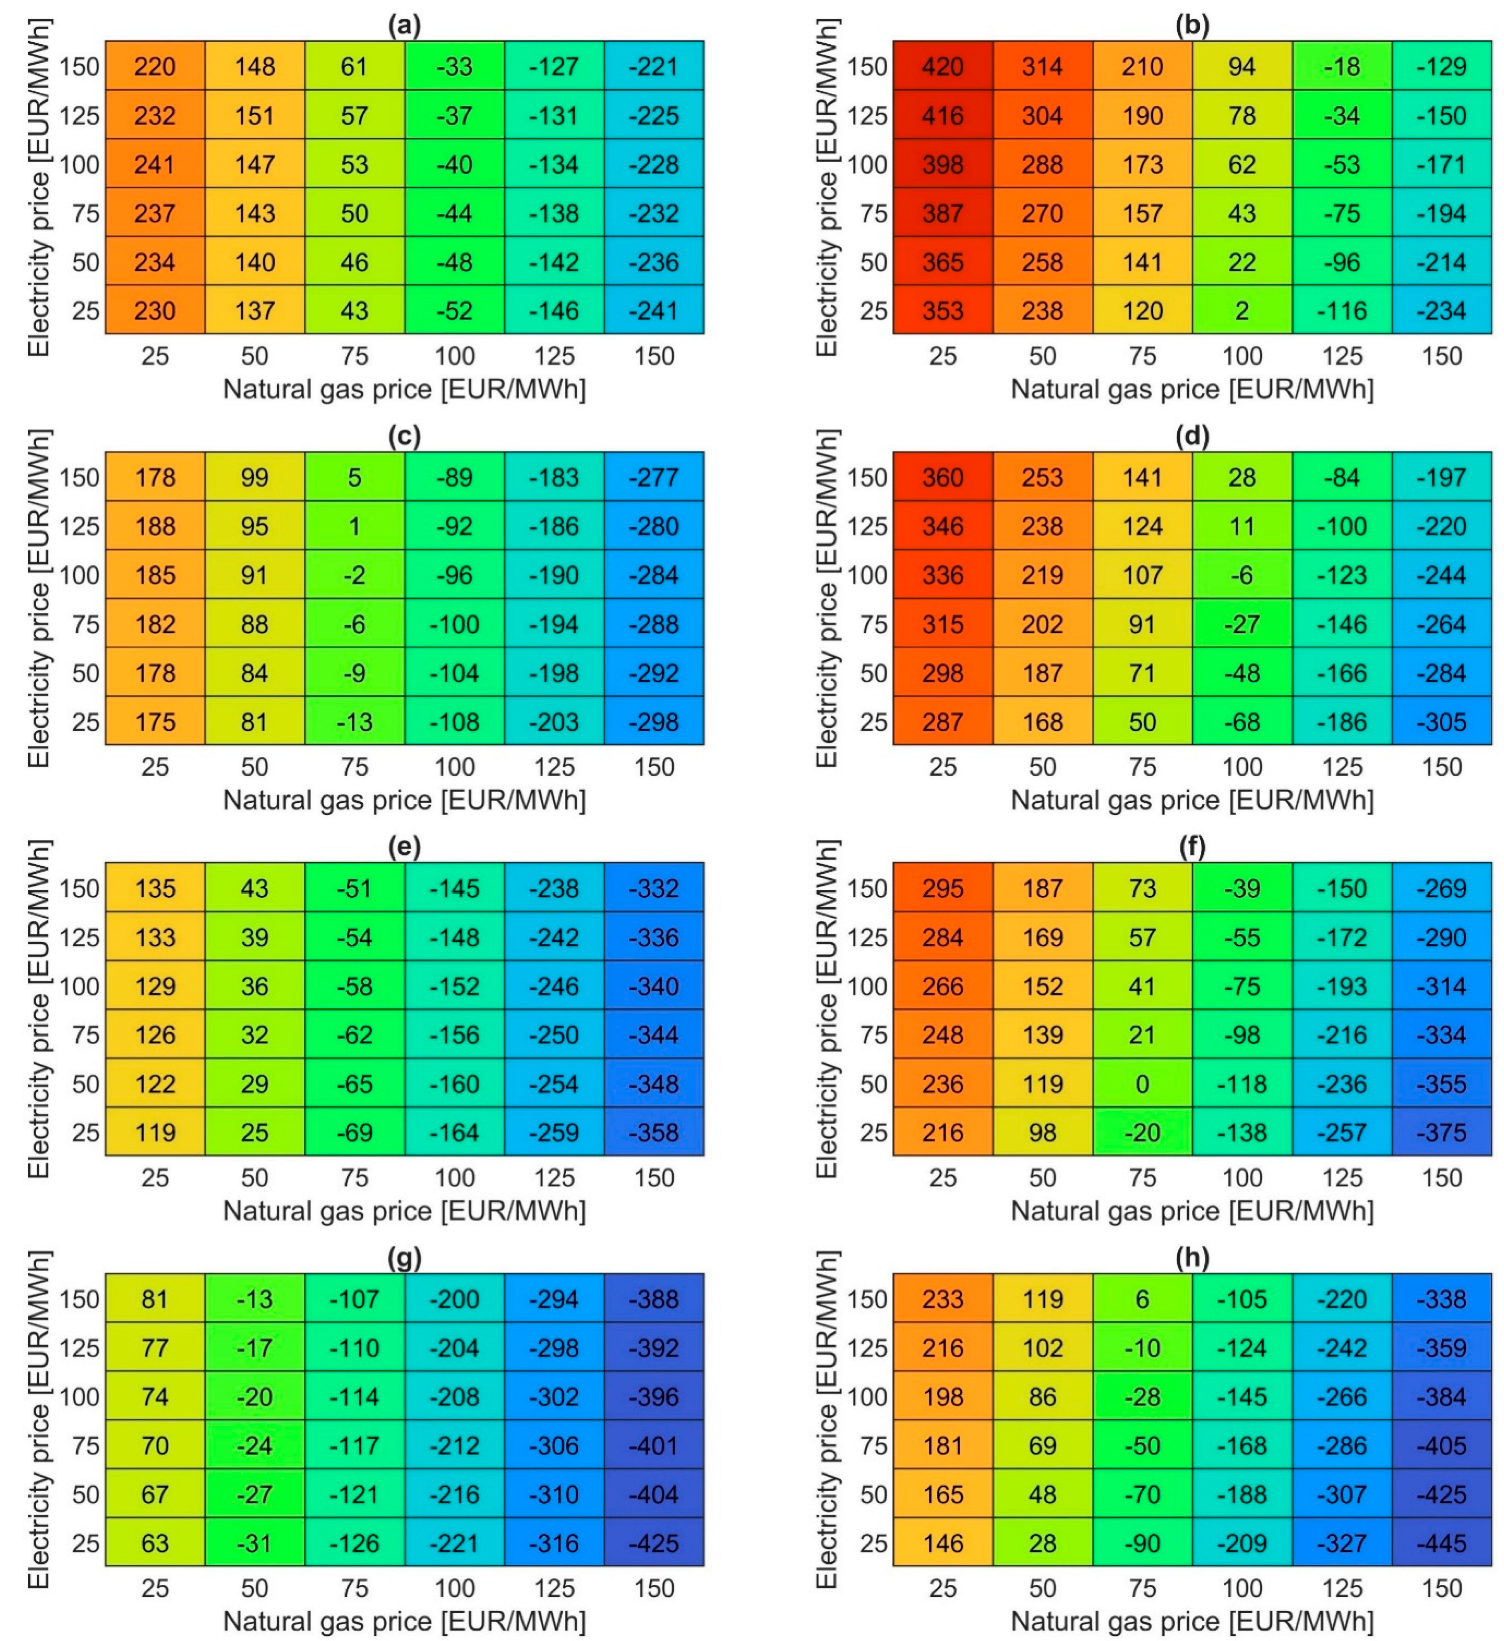
Table 1.
Key studies on renewable energy integration in hard-to-abate industrial sectors.
| Ref. | Year | Sector | Plant Size | Site location |
Modelling approacha | Sensitivity analysis | Renewable sourceb | Fuel switchingc | Load matchingd | |||
|---|---|---|---|---|---|---|---|---|---|---|---|---|
| S | W | HC | DE | HS | BS | |||||||
| [13] | 2012 | Aluminium | 780 kt/year | China | SIM | ● | ● | |||||
| [14] | 2018 | Cement | 2.3 Mt/year | Jordan | OPT | ● | ● | ● | ||||
| [15] | 2021 | Aluminium | 1 Mt/year | UAE | OPT | ● | ● | ● | ● | |||
| [16] | 2021 | Glass | 36.5 kt/year | Germany | OPT | ● | ● | ● | ● | |||
| [17] | 2022 | Steel | 1.5 Mt/year | Spain | SIM | ● | ● | ● | ● | |||
| [18] | 2023 | Steel | 100 kt/year | Italy | SIM | ● | ● | ● | ● | |||
| [19] | 2024 | Steel | 1 Mt/year | United States | OPT | ● | ● | ● | ● | ● | ||
| [20] | 2024 | General | - | Spain | OPT | ● | ● | ● | ||||
| [21] | 2024 | General | - | Five sites | OPT | ● | ● | ● | ● | ● | ||
| [22] | 2024 | Ceramics | - | - | OPT | ● | ● | ● | ● | ● | ||
| [23] | 2024 | Paper | - | Italy | SIM | ● | ● | ● | ● | |||
| [24] | 2024 | Steel | 1.5 Mt/year | Finland | OPT | ● | ● | ● | ● | |||
| [25] | 2025 | Steel, ammonia |
1 Mt/year, 300 kt/year |
US | OPT | ● | ● | ● | ● | ● | ● | |
| [26] | 2025 | Glass | 110 kt/year | Italy | OPT | ● | ● | ● | ● | |||
| [27] | 2025 | Glass | 110 kt/year | Italy | OPT | ● | ● | ● | ● | ● | ||
| [28] | 2025 | Multiple | - | US | OPT | ● | ● | ● | ● | |||
a OPT, Optimisation; SIM, Simulation; b S, Solar; W, Windl; c HC, Hydrogen Combustion; DE, Direct Electrification; d HS, Hydrogen Storage; BS, Battery Storage.
Table 2.
Environmental and energy profiles of the glass industry across regional scales.
| CO2 Emissions (Mt) |
Total Energy Consumption (PJ) | Natural Gas Share (%) | |
|---|---|---|---|
| World | 86 [34] | > 800 [35] | 75–85 [36] |
| US | 15 [37] | 200 [38] | 75 [37] |
| EU | 22 [39] | 350 [40] | 85 [40] |
| Italy | 4 [41] | 44 [41] | 81 [41] |
Table 3.
On-site SEC for glass production (expressed in kWh/kg).
| Stage | Flat Glass | Container Glass | Glass Wool | Glass Fiber Textiles | Other Pressed and Blown Glass |
|---|---|---|---|---|---|
| Batching | 0.2 | 0.2 | 0.2 | 0.2 | 0.2 |
| Melting/Refining | 1.8 | 1.6 | 1.25 | 1.9 | 2.4 |
| Forming | 0.45 | 0.05 | 1.3 | 0.45 | 1.6 |
| Finishing | 0.65 | 0.15 | 0.6 | 0.45 | 0.9 |
| Total | 3.1 | 2.0 | 3.35 | 3.0 | 5.1 |
Disclaimer/Publisher’s Note: The statements, opinions and data contained in all publications are solely those of the individual author(s) and contributor(s) and not of MDPI and/or the editor(s). MDPI and/or the editor(s) disclaim responsibility for any injury to people or property resulting from any ideas, methods, instructions or products referred to in the content. |
© 2026 by the authors. Licensee MDPI, Basel, Switzerland. This article is an open access article distributed under the terms and conditions of the Creative Commons Attribution (CC BY) license.
Copyright: This open access article is published under a Creative Commons CC BY 4.0 license, which permit the free download, distribution, and reuse, provided that the author and preprint are cited in any reuse.


