
Submitted:
02 February 2026
Posted:
03 February 2026
You are already at the latest version
Abstract
Fused Deposition Modelling (FDM) is widely employed in additive manufacturing (AM) of polymer components, where process parameters play a critical role in determining mechanical performance and resource efficiency. Although process parameters, such as layer height, build orientation and infill density, have been extensively studied with respect to tensile strength, the combined influence of infill pattern, density, and skin layer configuration remains insufficiently explored. In this research, six infill patterns, namely concentric, line, triangle, honeycomb, grid, and gyroid, are evaluated at three density levels (50%, 75%, and 90%) with multiple skin layer configurations using an L36 orthogonal experimental design. Tensile tests are analyzed using analysis of variance (ANOVA) to identify the significant factors and their interactions, supported by pattern-specific interaction plots. The results indicate that tensile strength increases by increasing infill density in a similar pattern; however, when comparing different patterns, the concentric infill consistently exhibits superior tensile strength along with reduced printing time, material consumption, and energy usage. This behavior can be primarily explained by the filament alignment parallel to the applied tensile load, which promotes load transfer through continuous material paths rather than interlayer bonding with implications for effective build orientation selection through controlled filament alignment. Overall, the findings demonstrate that concentric infill provides an effective strategy for optimizing the tensile strength while minimizing the environmental impact, offering practical guidance for sustainable FDM part design.
Keywords:
Fused Deposition Modelling
; infill pattern
; infill density
; tensile strength
; process optimization
; design of experiment
; sustainability
; resource efficiency
1. Introduction
Recent advances in Fused Deposition Modeling (FDM) have established that the mechanical performance of additive manufactured (AM) printed parts is governed by an interplay between material properties and process parameters rather than material selection alone. The choice of filament material is typically guided by mechanical strength requirements, loading conditions, environmental exposure, resource efficiency, and sustainability considerations. For example, polymers such as polylactic acid (PLA) and acrylonitrile butadiene styrene (ABS) exhibit distinct mechanical responses, with PLA generally showing higher stiffness and tensile modulus, while ABS offers greater ductility and impact resistance. These differences influence the suitability of the material for static or dynamic loading conditions, as well as its resistance to deformation and failure [1].
Material behavior is also strongly affected by environmental and processing constraints. PLA, for instance, is sensitive to humidity and exhibits a relatively low glass transition temperature (below ~60 °C), limiting its performance in elevated-temperature applications. Processing temperatures further differentiate materials, for instance, PLA is typically printed at nozzle temperatures around 200-210 °C and bed temperatures near 60 °C, while ABS requires higher nozzle (230-250 °C) and bed temperatures (90-110 °C), resulting in increased energy consumption. Additionally, material composition and end-of-life considerations play an increasingly important role, where PLA’s bio-based and biodegradable nature makes it attractive for environmentally conscious manufacturing [1,2].
Once the material is selected, FDM process parameters will determine the mechanical behavior and quality of printed parts [3]. Nozzle temperature directly influences interlayer bonding and dimensional accuracy: excessively high temperatures can cause material over-extrusion and loss of geometric precision, whereas insufficient temperatures can lead to under-extrusion and weak interlayer adhesion. Normally, the tensile strength increases with increasing temperature. Bed temperature affects part adhesion and warping behavior; inadequate bed temperatures may result in detachment and distortion, while excessive temperatures can soften the lower printed layers and degrade surface quality [4]. Printing speed introduces a trade-off between productivity and mechanical performance, as higher speeds reduce build time but limit the time available for material deposition and layer consolidation. Similarly, increasing layer height can significantly reduce printing time, but often results in reduced tensile strength due to fewer interlayer interfaces and increased stress concentrations [5].
Build orientation introduces an additional, often dominant, influence on both mechanical and sustainability outcomes. Certain orientations require extensive support structures, increasing material usage, printing time, and energy consumption [6]. More importantly, the build orientation governs external loads transmitted through the printed structure. For example, a vertically printed tensile specimen has loading primarily across interlayer bonds during testing, whereas a flat-printed specimen aligns the tensile load along the deposited layers. This distinction highlights the concept of load path alignment, in which mechanical performance depends on the applied stresses carried by continuous material filaments or by comparatively weaker interlayer adhesion.
This concept of load path alignment extends beyond build orientation and is strongly influenced by the internal infill architecture. Different infill patterns create distinct internal load-bearing networks, some of them align more effectively with applied forces than others. Infill patterns that promote continuous material paths in the direction of loading can enhance stress transfer and delay failure, whereas patterns that rely heavily on interlayer bonding may be more susceptible to delamination and premature fracture. In our previous work, infill density is shown to positively influence tensile strength; however, it is also noted that density alone does not fully explain performance variations across different configurations [5]. This observation motivated an investigation of the combined influence of infill density and infill pattern.
Building on this foundation, this research aims to systematically examine the role of infill patterns in governing load path alignment, mechanical performance, and sustainability metrics in FDM-printed PLA components. By analyzing mechanical responses alongside resource-based indicators such as printing time, energy consumption, and material usage, this work seeks to achieve a more comprehensive understanding of infill architecture optimization for both structural efficiency and sustainable manufacturing outcomes.
A substantial body of literature has investigated the influence of infill patterns on the mechanical behavior of FDM-printed components, with studies targeting different loading conditions and performance metrics. Several researchers have examined the role of infill architecture under compressive loading, reporting notable variations in strength and deformation behavior across patterns such as grid, honeycomb, and gyroid structures [7,8,9,10]. Other studies have focused on flexural performance, demonstrating the significant effects of infill geometry on bending stiffness and failure behavior [11,12]. In impact resistance, infill patterns alter the crack initiation and propagation mechanisms under dynamic loading [9,13], and impacting modulus of elasticity [14,15]. In addition to these loading modes, tensile behavior remains one of the most widely investigated properties due to its relevance to structural integrity and failure prediction. A review paper reported that a triangular infill pattern outperforms grid and honeycomb infill patterns for flexural and tensile loading, and that honeycomb outperforms triangular. These studies used different infill density levels, and the latter used recycled material. The study also reported that concentric infill pattern has superior performance under tensile loading for PLA and ABS [16].
Several tensile-focused studies have compared different infill patterns while examining yield strength, tensile modulus, and ultimate strength. One such investigation evaluated honeycomb, grid, triangular, and gyroid infill patterns, concluding that triangular infill exhibited superior tensile performance compared to the other configurations [17], while another study reported triangular being outperformed by the line infill pattern [7]. However, the primary emphasis of that study is on the effects of infill density and build orientation, with infill pattern serving as a secondary factor. As a result, the reported conclusions are strongly coupled to density and orientation effects rather than the intrinsic load-carrying behavior of the infill geometries themselves. Other studies reported zigzag and concentric [18] and tri-hexagonal infill patterns [19] concentric and gyroid [20] infill patterns outperforming other infill patterns under tensile loading.
A similar trend was observed in a study where an analysis of variance identified infill density as the most influential parameter governing tensile strength [21]. While the authors confirmed that increasing density improves tensile performance within a given infill pattern, they also reported an important observation: across different infill patterns, certain lower-density configurations outperformed higher-density counterparts. This finding, based on grid, triangular, and gyroid infill patterns, highlights that density alone does not fully explain tensile performance and suggests that infill architecture plays a critical role in stress transmission.
Other investigations have examined infill patterns from a structural design perspective. For example, studies comparing honeycomb and grid infill patterns analyzed the influence of strut thickness on tensile behavior, emphasizing localized structural features rather than global infill geometry [22]. Failure mode analysis has also received attention, particularly for triangular and honeycomb patterns, where tensile modulus is found to be higher for honeycomb infill. In these cases, failure was observed to initiate at nodal junctions following shell fracture, underscoring the importance of internal connectivity and stress concentration zones [23]. Comparable outcomes were reported in studies where honeycomb infill outperformed Hilbert curve, gyroid, and star-shaped patterns in tensile strength, with the authors attributing this behavior to the effective cross-sectional area aligned with the tensile loading direction [24].
Broader review studies have reinforced these findings by highlighting infill density [25] and build orientation as dominant factors influencing tensile strength, noting that complex geometries such as honeycomb infill can improve force distribution within the structure [26]. Despite differences in materials, printers, and testing protocols, several common themes emerge across these studies: (a) infill patterns are primarily treated as geometric shapes, and (b) mechanical enhancement is often achieved by increasing infill density, thereby increasing material usage.
However, this density-driven approach raises concerns from a sustainability and resource-efficiency perspective. Increasing material content to enhance strength directly affects printing time, energy consumption, and material waste, which contradicts the broader objectives of sustainable AM. Alternative strategies to enhance mechanical performance without simply increasing density remain underexplored. One such approach was demonstrated in flexural studies, where hexagonal, triangular, square, and square-diagonal infill patterns were investigated at lower densities. The study argued that certain geometries can accommodate deformation and redistribute stresses more effectively, reducing internal stress buildup while maintaining structural integrity [12].
More recent work has begun to explore infill patterns from a load-path perspective rather than purely geometric classification. For instance, the influence of load alignment on impact resistance was investigated using concentric, linear, and zigzag infill patterns, revealing that mesostructural continuity plays a critical role in crack propagation and energy absorption [13]. These findings suggest that infill patterns that align material deposition with the applied loading directions may outperform denser but poorly aligned structures.
Building on these insights, this research formulates the infill pattern selection as a multi-objective optimization problem, where mechanical performance and sustainability objectives are optimized simultaneously. While increasing infill density generally improves strength within a given pattern, it also increases material use, extends printing time, and increases energy consumption, creating inherent trade-offs between mechanical performance and resource efficiency.
This research, therefore, focuses on evaluating lightweight infill pattern alternatives that can outperform denser configurations under tensile loading while minimizing resource demand. The focus is on the role of load-path alignment within different infill architectures, contrasting geometrically complex patterns with those that provide more continuous and aligned material pathways. To enable systematic comparison across competing objectives, mechanical properties are normalized for material usage, energy consumption, and printing time, allowing the identification of infill patterns that offer optimal compromises rather than a single maximum response.
By integrating mechanical performance metrics with resource-based efficiency indicators, this work addresses a key gap in the existing literature and provides a multi-objective decision framework for selecting infill patterns that balance strength, durability, and sustainable manufacturing objectives in FDM processes.
2. Materials and Specimen Preparation
Black PLA filament is used to fabricate tensile specimens in accordance with ASTM D368 standards on an Ender 3 Pro 3D printer. Specimen designs are prepared in AutoCAD and sliced using PrusaSlicer 2.9.2. The CAD design and the corresponding printed samples are shown in Figure 1(a) and 1(b).
2.1. Infill Patterns and Process Parameters
This research considers six infill patterns shown in Figure 2 and three infill density levels: 50%, 75%, and 90%. A 90% density is chosen instead of 100% because certain patterns (Hexagon, Grid, Triangle, and Gyroid) inherently contain internal voids; a fully solid infill would eliminate their structural advantages, and most slicing software does not support 100% for these patterns. The selection of these infill patterns is based on literature findings that they outperform other infill patterns. This research presents a comparison among the best-performing infill patterns under tensile loading. Additionally, three skin layer levels (0, 1, and 2) are investigated. All other printing parameters are held constant based on literature recommendations for PLA FDM printing, as summarized in Table 1. To systematically study the effect of these parameters and their interactions, a 2L36 orthogonal array is employed, with factor levels illustrated in Figure 3.
2.2. Mechanical and Sustainability Metrics
Key mechanical properties evaluated include Peak Stress, Peak Load, Modulus, Yield Stress, Break Strain, and Break Energy. These metrics provide a comprehensive assessment of tensile strength, stiffness, ductility, and toughness of printed parts. Sustainability metrics included Printing Time, Energy Consumption, and Material Usage, reflecting resource efficiency. All properties and metrics with standard units are presented in Table 2.
2.3. Experimental Setup and Measurements
Specimens are printed and tested under controlled laboratory conditions at 21°C. The Ender 3 Pro printer (Figure 4a) and a universal testing machine (UTM) (Figure 4b) are used. Both machines operate in an open environment. Specimen dimensions, including width and thickness, are measured using a vernier caliper, with zero error adjustments applied. Accurate measurement of these dimensions is critical for calculating stress and strain correctly during mechanical testing. All the tested samples are shown in Figure 3c.
2.4. Statistical Analysis and Visualization
For statistical analysis, two-way ANOVA is performed to evaluate the effect of Pattern and Density on each mechanical property. The Python dictionary “anova_results” is used to store ANOVA tables for each metric, while “tukey_results” holds post-hoc Tukey’s HSD comparisons. Normalized performance scores and resource-based efficiencies are calculated and organized in dictionaries such as “avg_metric_scores”, along with temporary dictionaries for per-gram, per-kWh, and per-minute efficiencies. Data visualization, including bar plots and composite figures, is performed using “matplotlib.pyplot” and “seaborn”. These structured data containers and plotting tools allow systematic storage, access, and visualization of mechanical and sustainability performance metrics across all infill patterns.
The systematically prepared specimens and carefully controlled process parameters allow for precise evaluation of mechanical performance and sustainability metrics. Using the ANOVA and normalized efficiency analyses described above, the subsequent results section presents both metric-by-metric performance and resource-normalized efficiencies, highlighting the relative advantages of different infill patterns in terms of strength, stiffness, toughness, and sustainable resource utilization.
3. Results
In this section, we discuss ANOVA analysis, interaction plots, resource-mechanical efficiency, comparative performance of infill patterns and effects of skin layers.
3.1. ANOVA Analysis
A two-way ANOVA is conducted to assess the effects of infill pattern and density on the mechanical properties of PLA parts, including Peak Load, Peak Stress, Strain at Break, Modulus, Energy to Break, and Stress at Yield (Table 3). The analysis reveals that density is the most significant factor for Peak Load (F = 37.89, p < 0.001), Modulus (F = 44.46, p < 0.001), and Stress at Yield (F = 24.53, p < 0.001), while Infill Pattern strongly influences Peak Stress (F = 11.52, p < 0.001), Strain at Break (F = 10.99, p < 0.001), and Energy to Break (F = 12.51, p < 0.001). Interaction effects between pattern and density are not statistically significant (η² < 0.11), indicating that the effect of pattern is largely independent of density.
Effect size analysis (η²) quantifies the relative contribution of each factor (Figure 5), confirming that density dominates strength and stiffness-related properties (η² = 0.46-0.56), whereas pattern primarily controls ductility and energy absorption (η² = 0.40-0.65). Post-hoc Tukey HSD comparisons further demonstrate statistically significant differences between specific density levels and pattern types, such as concentric differing from grid or triangle patterns (p < 0.05). Table 3 summarizes the effect sizes for all mechanical metrics, providing a comprehensive overview of the statistical influence of each process parameter.
These results suggest that, in FDM PLA printing, adjusting density is the most effective strategy to enhance part strength and stiffness, while pattern selection is more relevant for tuning ductility and energy absorption, highlighting the importance of considering both parameters for optimized mechanical performance.
3.2. Interaction Plots for Different Infill Patterns Across Various Metrics
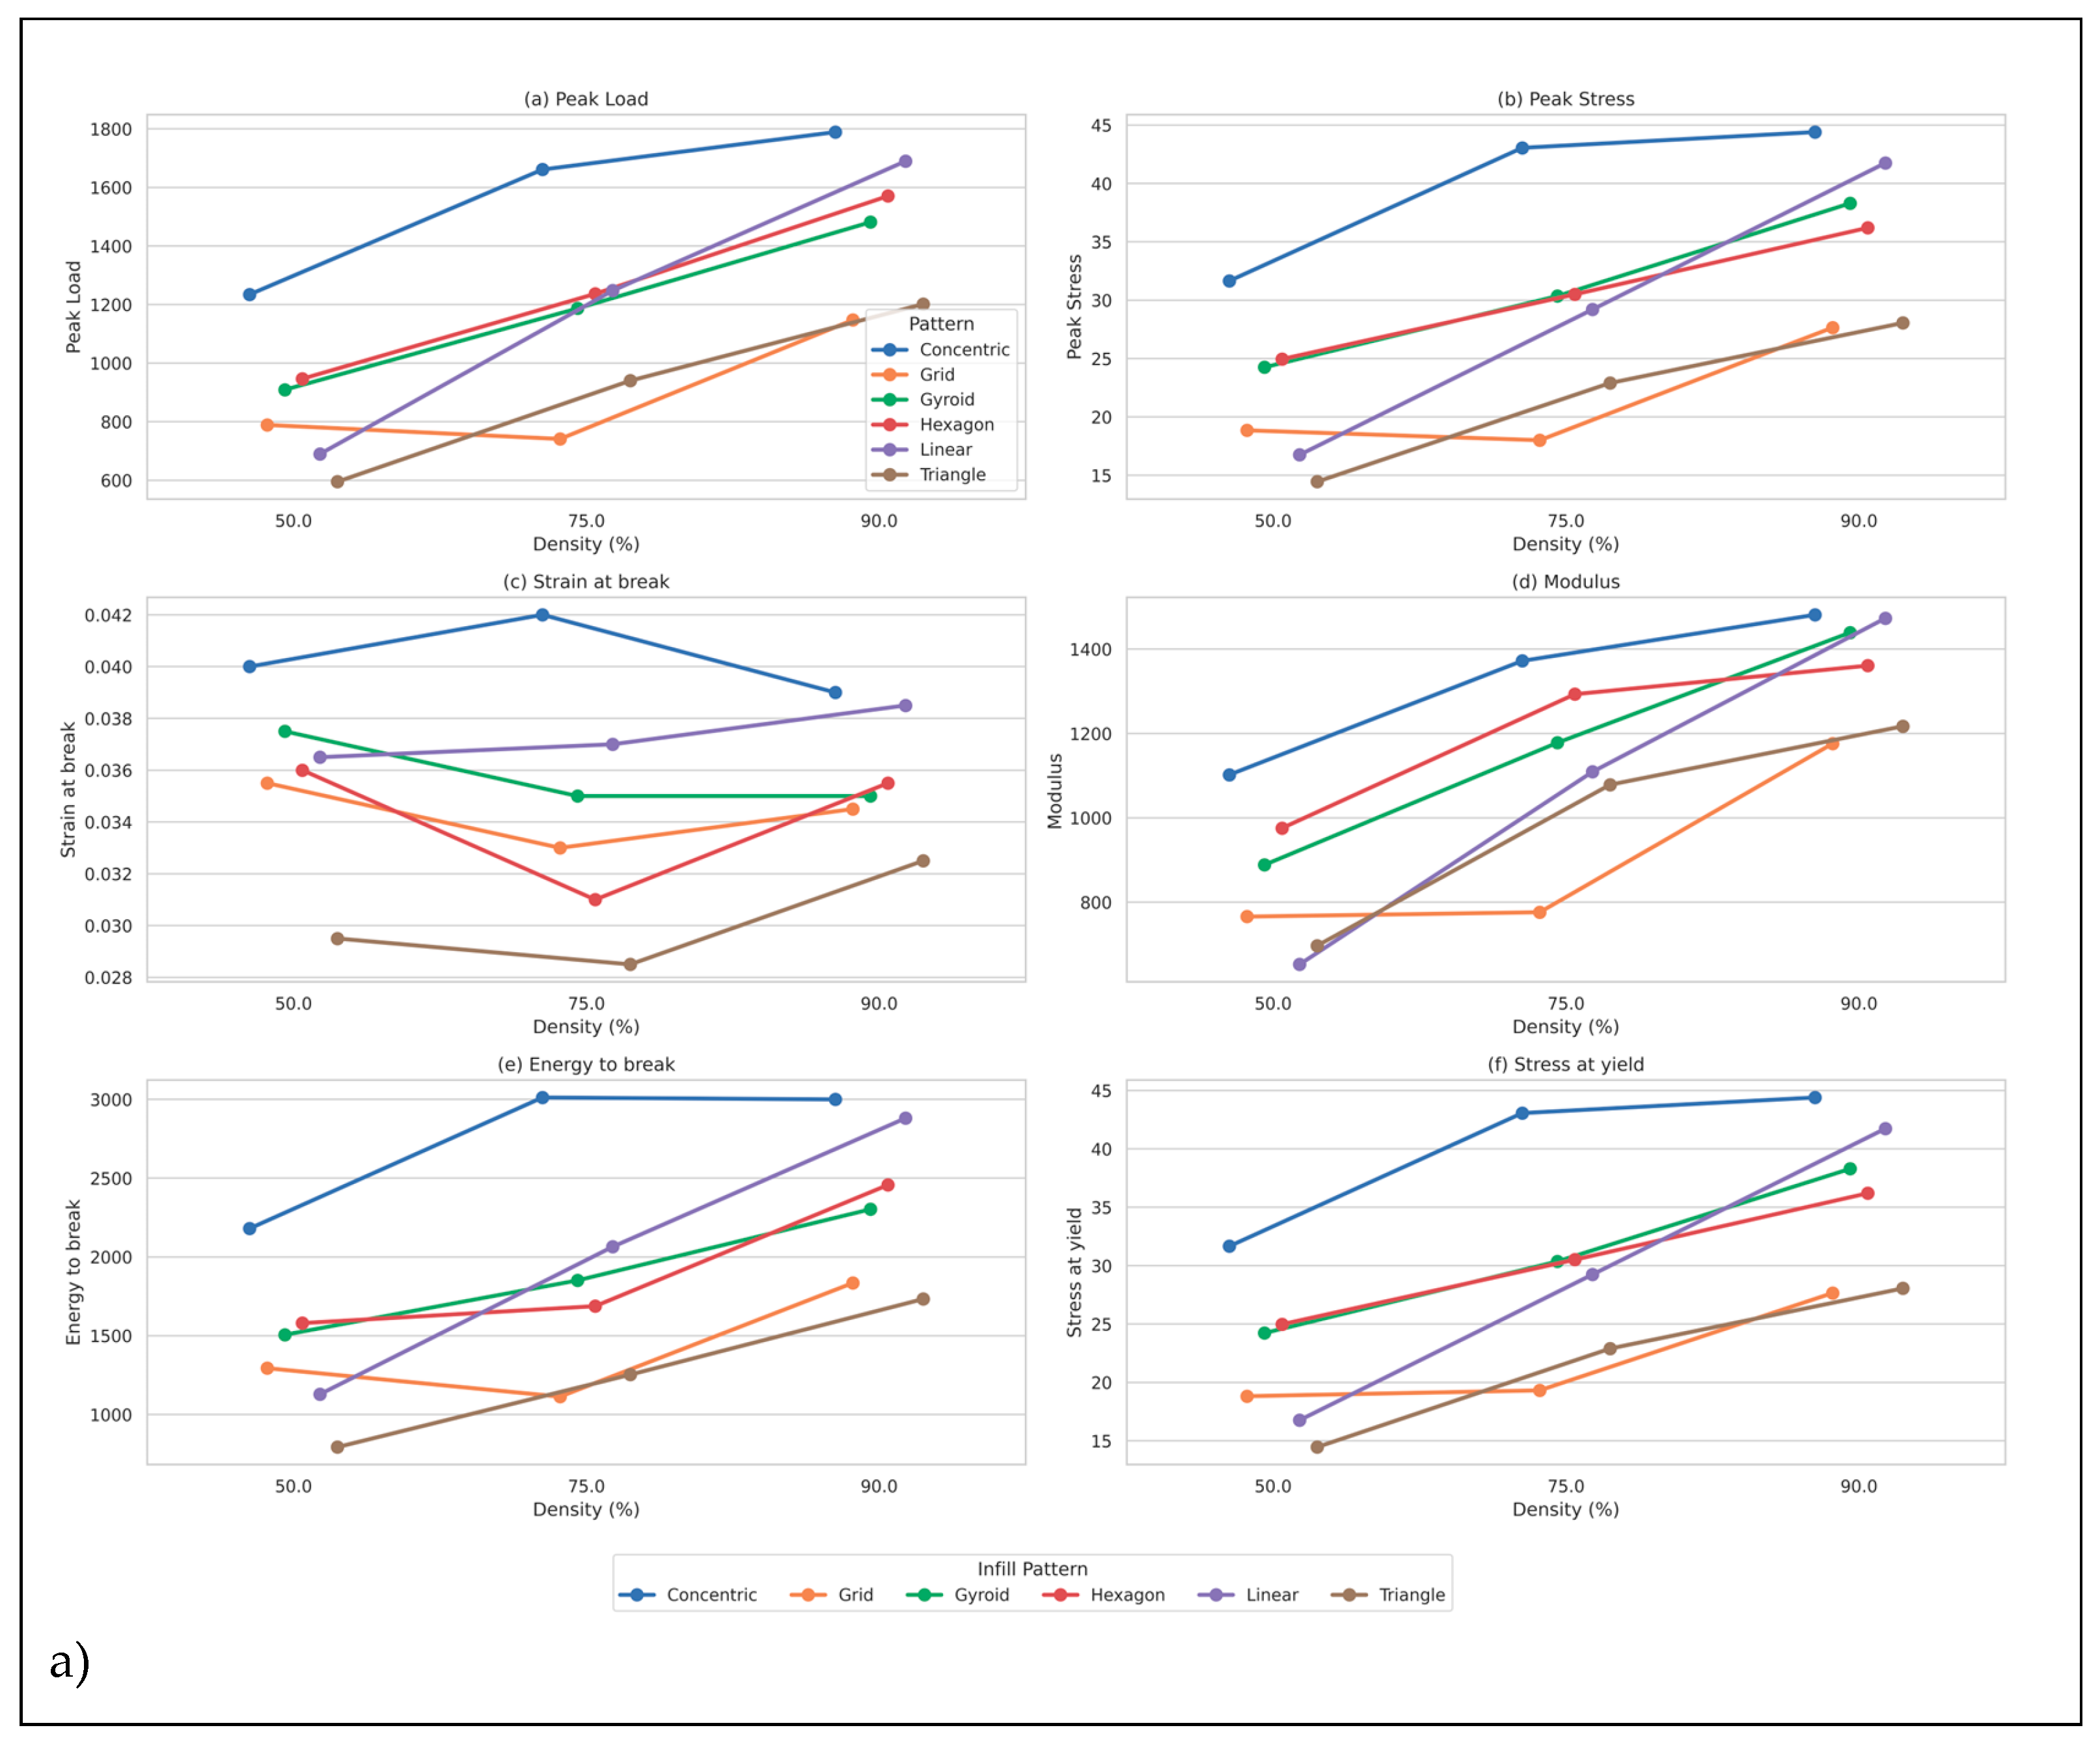
While the ANOVA results highlight density as the most statistically significant factor, the interaction plots in Figure 6a provide deeper practical insights into how density and infill pattern together influence mechanical performance. Each subplot shows a clear trend that increasing density generally improves strength-related metrics, but the degree of improvement varies substantially across patterns. Concentric stands out as the most efficient pattern across all densities, consistently achieving the highest peak load, peak stress, modulus, and yield stress. This indicates that concentric not only benefits from higher density but also leverages its geometry to distribute loads more effectively, resulting in superior structural integrity. Linear follows as the second-best performer, showing steady improvement with density, but it never reaches the performance level of concentric. Patterns such as grid, gyroid, and hexagon exhibit moderate gains with increasing density, yet their overall performance remains lower, suggesting that their internal geometry does not translate density into strength as effectively. Triangle performs worst across most metrics, with minimal improvement even at the highest density, making it unsuitable for tensile strength-critical applications.
Interestingly, break strain does not follow the same linear trend as other metrics. For several patterns, including grid and triangle, strain decreases at mid-density before recovering slightly at high density, indicating that higher density does not always enhance ductility. Energy to break mirrors the strength trends, with concentric again leading by a wide margin, reinforcing its ability to absorb energy and resist failure. These observations demonstrate that while density is important, pattern selection is equally critical. Simply increasing density cannot compensate for an inefficient pattern. Choosing an optimized pattern, such as a concentric pattern, can deliver superior strength and energy absorption even at moderate densities, reducing material usage and print time while maintaining mechanical reliability.
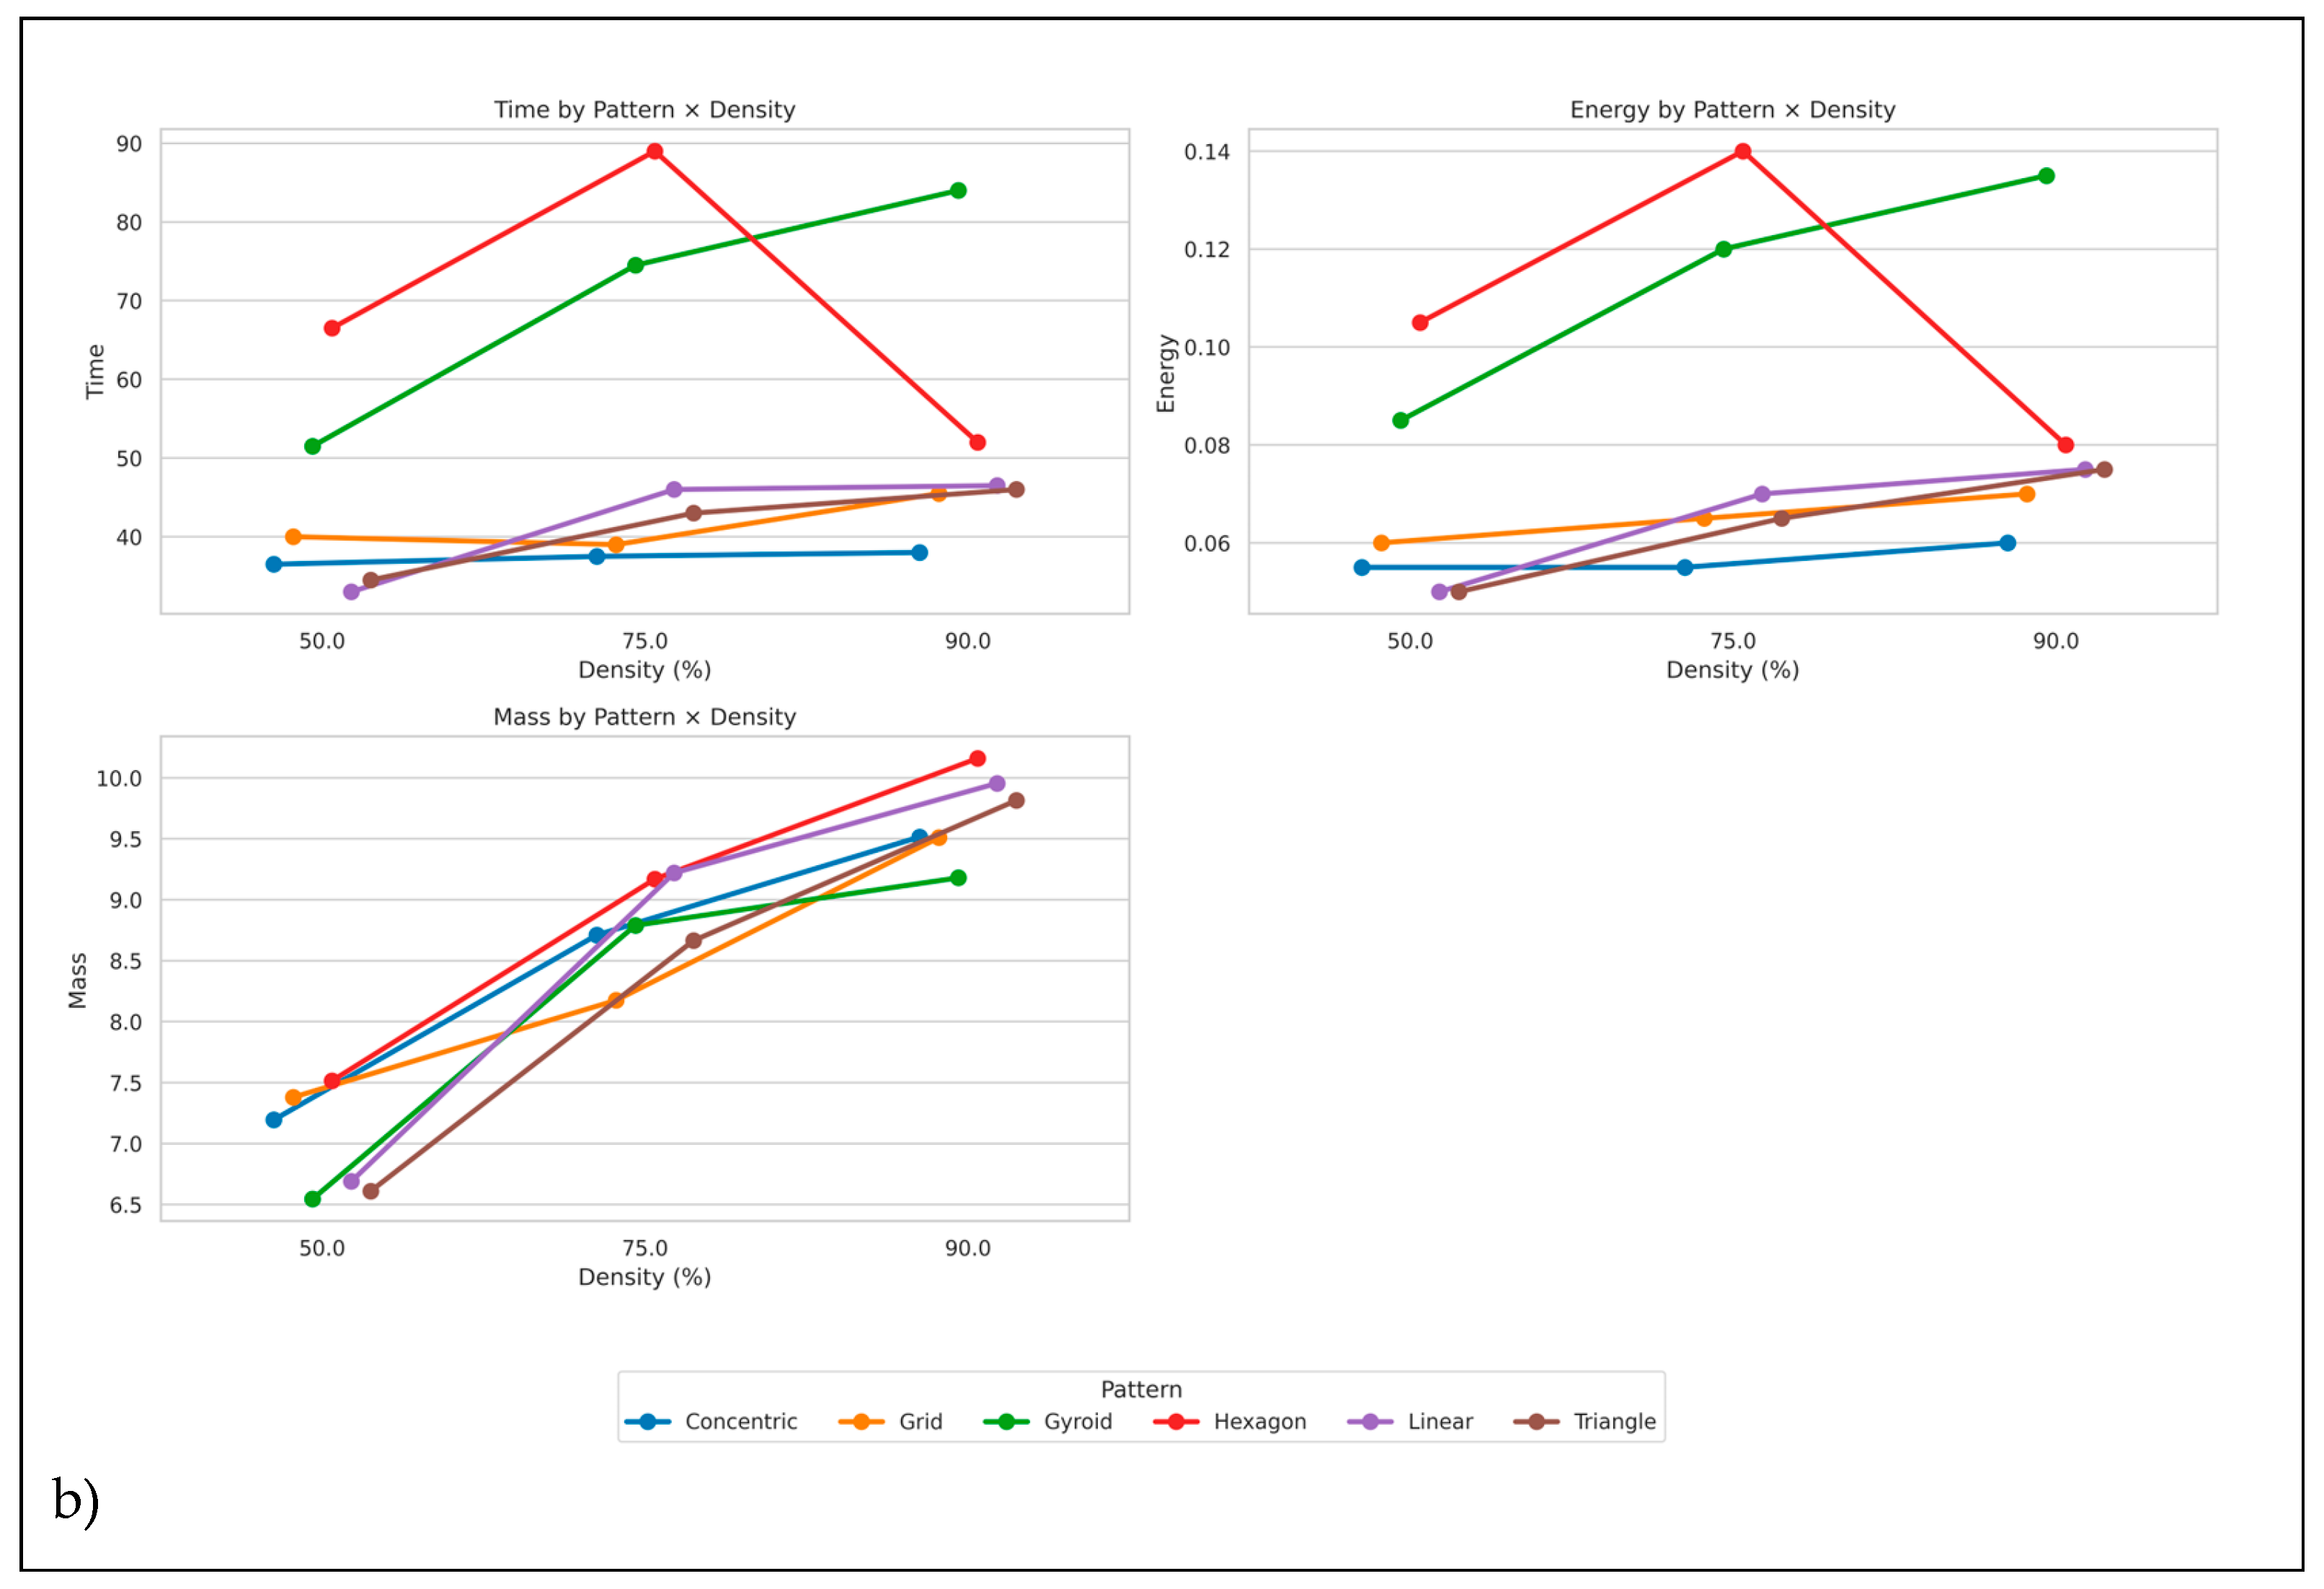
A similar trend is observed for the sustainability metrics in Figure 6b. Concentric at 75% density again outperforms most patterns at 90% density in mechanical performance, while maintaining lower printing time, energy consumption, and mass. Tukey post-hoc tests confirm that at 90% density, concentric is significantly stronger than grid and triangle, reinforcing its advantage. Patterns such as hexagons and gyroids tend to be more time and energy-intensive, particularly at mid densities, whereas concentric, linear, and grid remain more efficient. These observations highlight that while statistical analysis identifies density as a key factor, the choice of infill pattern can have a more substantial practical impact across multiple performance metrics.
In summary, a concentric configuration at 75% density emerges as optimal, delivering high mechanical strength with reduced time, energy, and material use compared to higher-density alternatives. This underscores the importance of considering individual pattern-density interactions rather than relying solely on collective significance tests when optimizing for strength, efficiency, and sustainability in AM.
Figure 6.
Interaction plots for PLA showing the effect of infill pattern and density on the a). Mechanical metrics, b). Sustainability metrics.
Figure 6.
Interaction plots for PLA showing the effect of infill pattern and density on the a). Mechanical metrics, b). Sustainability metrics.
3.3. Resource Mechanical Efficiency of Different Infill Patterns
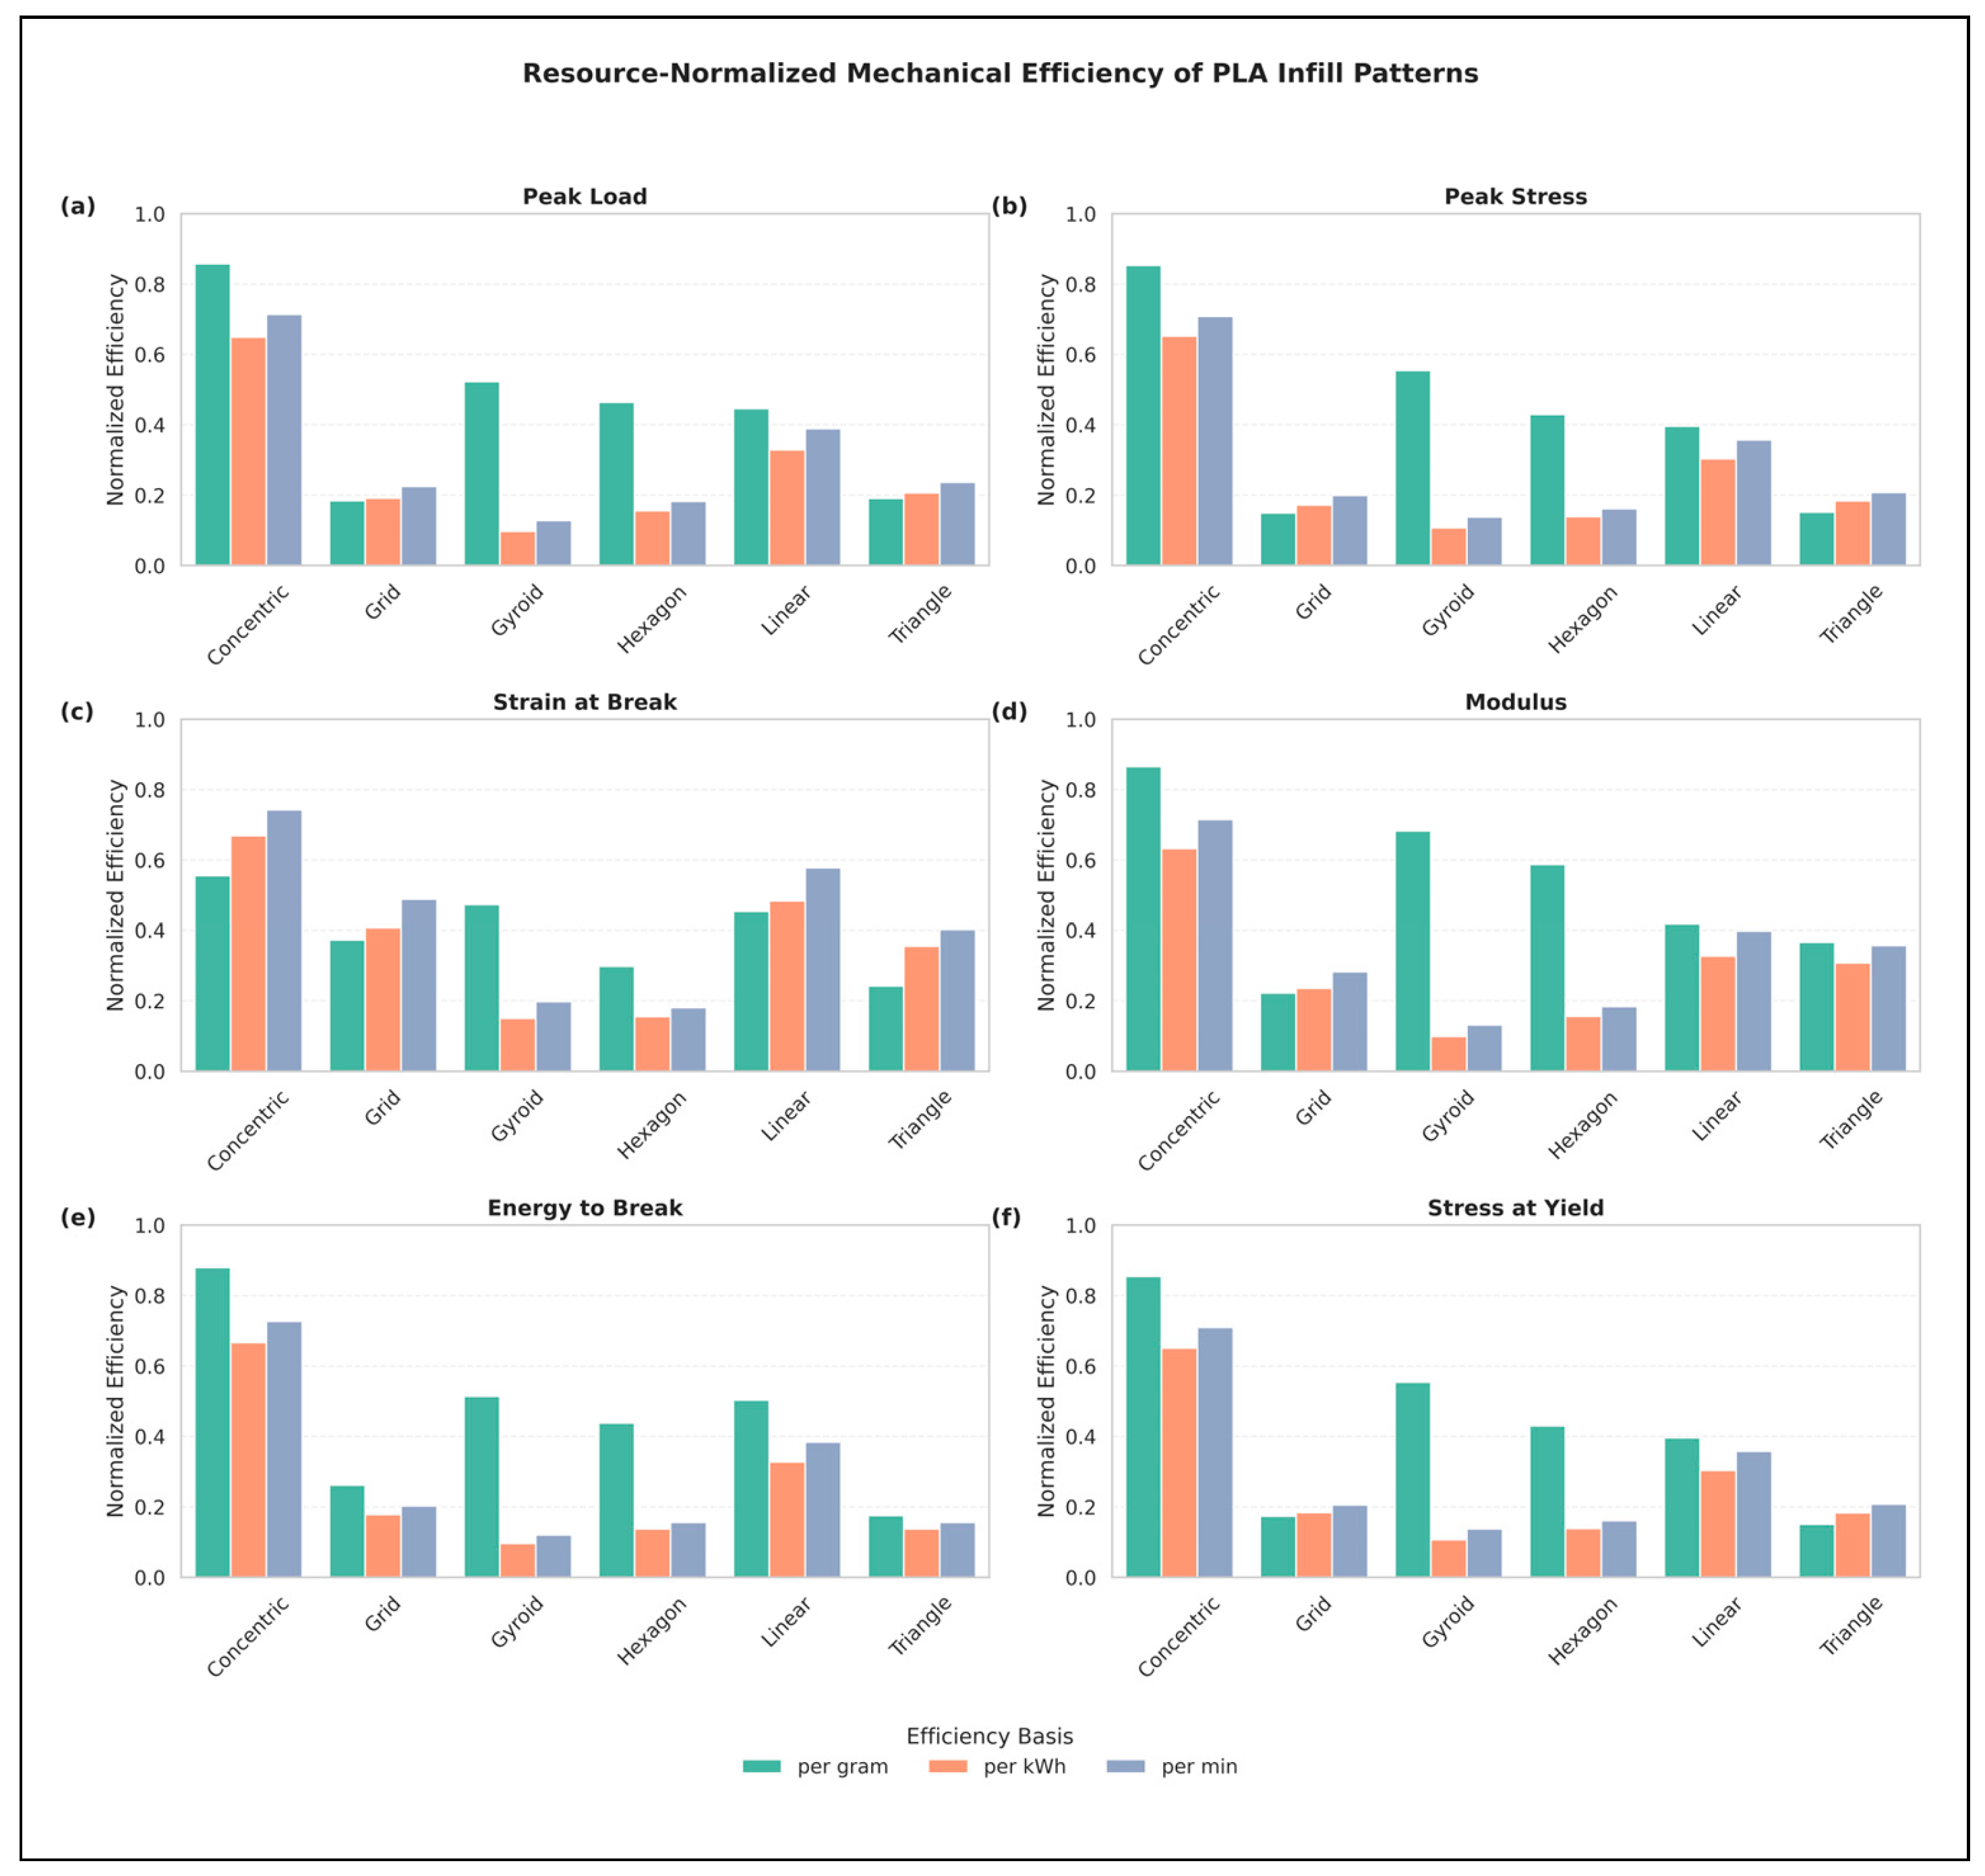
Figure 7 illustrates the resource-normalized mechanical efficiency of six different infill patterns across six key mechanical metrics: Peak Load, Peak Stress, Break Strain, Modulus, Break Energy, and Yield Stress. These metrics collectively describe the mechanical behavior of FDM-printed PLA parts. Peak Load and Peak Stress indicate the maximum load the part can withstand before failure, Modulus reflects stiffness and resistance to elastic deformation, Break Strain quantifies the ductility and flexibility, Break Energy measures the energy absorbed before fracture, and Yield Stress represents the stress level at which the material begins to deform plastically. Together, these metrics provide a comprehensive view of strength, stiffness, toughness, and ductility.
To enable fair comparison across different units and scales, all efficiency values are normalized to a 0-1 range using min-max normalization:
For resource-based metrics where lower values are preferable (Mass, Energy consumption, and Printing Time), an inverted normalization is applied:
Each bar in Figure 6 represents the normalized mechanical efficiency per unit resource, specifically per gram of material (g-1), per kWh of energy (kWh-1), and per minute of manufacturing time (min-1). This approach quantifies how efficiently each infill pattern converts resources into mechanical performance, linking structural behavior to sustainability considerations.
Among all infill patterns, the concentric pattern consistently achieves the highest normalized efficiency for all six mechanical metrics. For Peak Stress shown in Figure 7a, the concentric infill shows efficiency values of 0.85 per gram, 0.65 per kWh, and 0.71 per minute, indicating that it delivers more stress per unit resource than any other pattern. For Modulus in Figure 7d, concentric achieves 0.87 per gram, 0.63 per kWh, and 0.72 per minute, demonstrating its ability to produce stiffer parts efficiently. For Break Energy in Figure 6e for toughness, the concentric pattern reaches 0.88 per gram, 0.67 per kWh, and 0.73 per minute, highlighting superior energy absorption relative to the resources consumed.
Other patterns perform differently depending on the metric and resource. Gyroid exhibits moderate efficiency per gram, ranging from 0.47 to 0.68 across different metrics, but its efficiency per kWh and per minute is low, often below 0.15, indicating that it requires more energy and time related to its mechanical performance. Hexagon shows intermediate performance, with per-gram efficiency between 0.30 and 0.59 and lower per-kWh and per-minute efficiency. Linear achieves moderate efficiency for some metrics, particularly per-gram and per-minute, but remains lower than concentric overall. Triangle and grid consistently show the lowest efficiency scores, often between 0.10 and 0.38, demonstrating that these patterns are less resource effective, despite occasionally achieving moderate absolute mechanical values.
The Break Strain in Figure 7c indicates that ductility is highest for concentric (0.56 per gram, 0.67 per kWh, 0.74 per minute), closely followed by linear, highlighting their superior ability to absorb deformation efficiently. Yield Stress also favors concentric (0.85 per gram, 0.65 per kWh, 0.71 per minute), reflecting efficient early resistance to plastic deformation. For Peak Load, concentric achieves 0.86 per gram, 0.65 per kWh, and 0.72 per minute, demonstrating the highest load-bearing efficiency.
Overall, Figure 7 demonstrates that concentric infill provides the most favorable balance between mechanical performance and resource utilization across all six key metrics. By consistently maximizing mechanical efficiency per unit material, energy, and time, concentric emerges as the most efficient and sustainable choice among the investigated infill patterns. Evaluating mechanical performance in relation to resource consumption enables informed decisions when optimizing FDM printing parameters, supporting both structural reliability and sustainability goals.
Figure 7.
Resource-normalized mechanical efficiency of PLA infill patterns for all mechanical metrics: Each bar represents the normalized efficiency per unit resource, per gram of material (g-1), per unit energy consumption (kWh-1), and per unit manufacturing time (min-1), computed from min-max normalization across all patterns. Higher values indicate more effective conversion of material, energy, and time into mechanical performance.
3.4. Comparative Performance of Different Infill Patterns Across Various Metrics
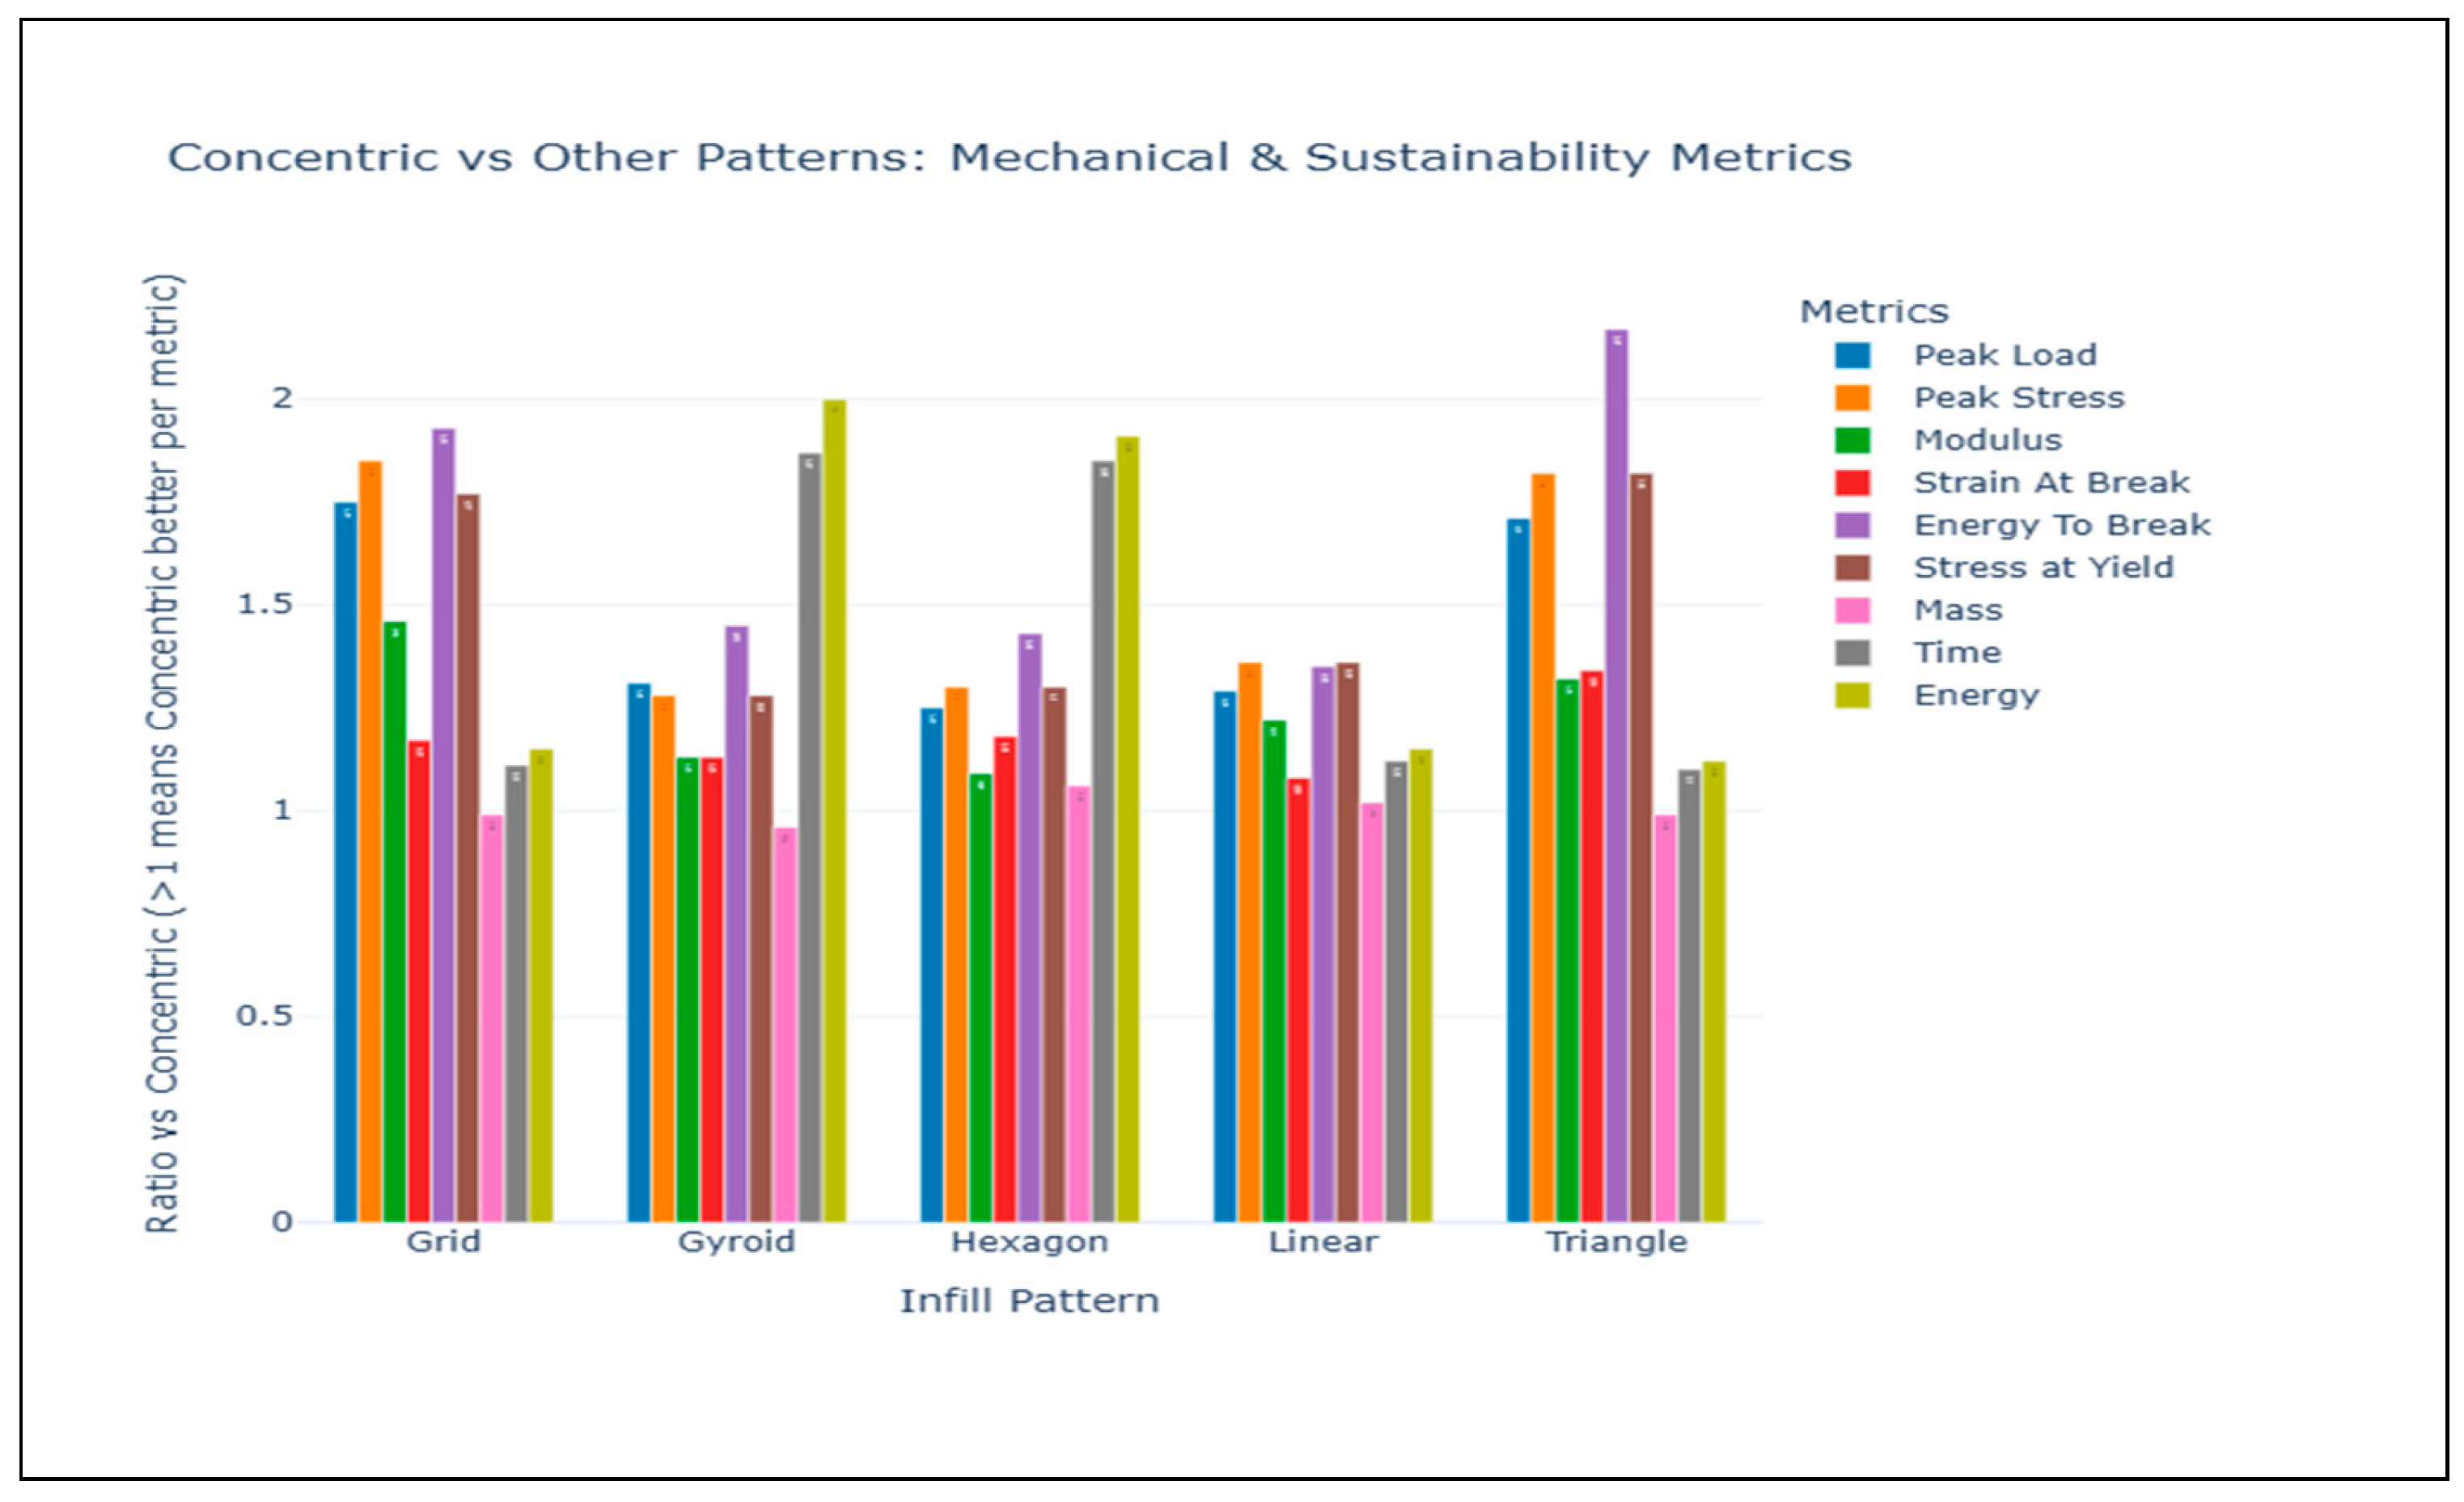
Figure 8 and Table 4 summarize the comparative performance of different infill patterns relative to concentric, which is used as the baseline (ratio = 1). In this analysis, a ratio greater than 1 indicates that concentric outperforms the other pattern for that metric. Overall, concentric demonstrates clear advantages in mechanical performance, printing time, and energy efficiency. Specifically, concentric achieves higher Peak Load, Peak Stress, Modulus, Break Strain, Break Energy, and Yield Stress compared to all other infill patterns, indicating superior strength, stiffness, and ductility. Among the alternatives, grid and triangle patterns are closest to concentric in mechanical performance, with ratios ranging from ~1.17-1.93, while Gyroid and Hexagon show more moderate performance (ratios ~1.13-1.45). In terms of printing efficiency, concentric prints are faster than all other patterns, as shown by time ratios greater than 1; the gyroid and hexagon take the longest, highlighting their lower productivity. Similarly, concentric is more energy-efficient, with all other patterns consuming more energy (Energy ratios >1), again with gyroid and hexagon showing the largest disadvantages. Mass ratios indicate minor trade-offs: while the gyroid slightly reduces mass (ratio <1), other patterns are comparable or slightly heavier than concentric. Taken together, these results suggest that concentric is the optimal pattern for maximizing mechanical properties while maintaining speed and energy efficiency. Other patterns can offer minor advantages in mass reduction but at the cost of longer print times and higher energy consumption. Figure 7 and Table 4 together provide a comprehensive view of how infill pattern selection influences performance, enabling informed trade-offs in FDM PLA printing.

Table 4.
Ratio-based comparison of mechanical and printing performance metrics for PLA parts using different infill patterns, with concentric as the baseline.
Table 4.
Ratio-based comparison of mechanical and printing performance metrics for PLA parts using different infill patterns, with concentric as the baseline.
| Pattern | Peak Load | Peak Stress | Modulus | Strain At Break | Energy To Break | Stress at Yield | Mass | Time | Energy |
|---|---|---|---|---|---|---|---|---|---|
| Grid | 1.75 | 1.85 | 1.46 | 1.17 | 1.93 | 1.77 | 0.99 | 1.11 | 1.15 |
| Gyroid | 1.31 | 1.28 | 1.13 | 1.13 | 1.45 | 1.28 | 0.96 | 1.87 | 2.00 |
| Hexagon | 1.25 | 1.30 | 1.09 | 1.18 | 1.43 | 1.30 | 1.06 | 1.85 | 1.91 |
| Linear | 1.29 | 1.36 | 1.22 | 1.08 | 1.35 | 1.36 | 1.02 | 1.12 | 1.15 |
| Triangle | 1.71 | 1.82 | 1.32 | 1.34 | 2.17 | 1.82 | 0.99 | 1.10 | 1.12 |
Figure 8.
Ratio comparison of concentric versus other infill patterns, for mechanical properties and sustainability metrics; ratios > 1 indicate concentric is better per metric.
Figure 8.
Ratio comparison of concentric versus other infill patterns, for mechanical properties and sustainability metrics; ratios > 1 indicate concentric is better per metric.
To systematically evaluate the influence of infill pattern on both mechanical and sustainability-related performance, Figure 9 presents the normalized performance scores for all considered metrics, where values closer to unity indicate superior relative performance within the experimental dataset. This normalization enables direct comparison across metrics with different physical units while avoiding bias toward any single property.
Across most mechanical metrics, the concentric infill pattern consistently yields higher normalized scores than the other patterns. In particular, the Yield Stress score for concentric is approximately 1.2-1.5 times higher than those for gyroid and hexagon, while its Peak Load and Peak Stress scores exceed the lowest-performing patterns by approximately 1.3-1.8 times. These trends indicate that, within the investigated parameter space, the concentric deposition strategy is associated with improved load-bearing capability and stiffness. While the exact micromechanical mechanisms are not directly resolved in this study, the observed behavior is consistent with improved stress distribution arising from continuous, closed-loop filament paths.
For deformation and toughness-related properties, including Break Strain and Break Energy, concentric infill again demonstrates favorable performance. As shown in Figure 8, its normalized scores exceed those of grid and linear patterns by approximately 1.1-1.3 times for Break Strain and by 1.2-2.1 times for Break Energy. Triangle infill also shows relatively high performance in these metrics, suggesting that geometries promoting directional continuity may enhance energy absorption prior to failure. These results suggest that concentric infill does not merely maximize stiffness or strength but maintains a balanced response between strength and ductility.
Sustainability metrics further support this observation. For Mass, Printing Time, and Energy Consumption, the concentric pattern achieves normalized scores that are generally 10-15% higher than those of the gyroid and hexagon. This indicates that the mechanical advantages of concentric infill are achieved without increased material use or processing inefficiency. In contrast, gyroid and hexagon patterns, while exhibiting moderate mechanical performance, tend to require higher material input and longer printing durations, which lowers their relative sustainability scores. Grid infill shows intermediate behavior, achieving acceptable strength but comparatively lower energy efficiency.
The cumulative effect of these metric-level trends is quantified in Table 5, which reports the average performance score across all metrics for each infill pattern. Concentric infill achieves the highest overall score (~ 0.8), confirming that its superior performance is consistent across both mechanical and sustainability dimensions rather than driven by a single dominant metric. Other patterns exhibit notably lower average scores, reflecting inherent trade-offs among strength, ductility, and resource efficiency.
Figure 9.
Comparison of normalized performance scores for different infill patterns across mechanical and sustainability metrics. All scores are normalized to a 0-1 range, enabling direct comparison between metrics with different units; higher values indicate better relative performance.
Figure 9.
Comparison of normalized performance scores for different infill patterns across mechanical and sustainability metrics. All scores are normalized to a 0-1 range, enabling direct comparison between metrics with different units; higher values indicate better relative performance.
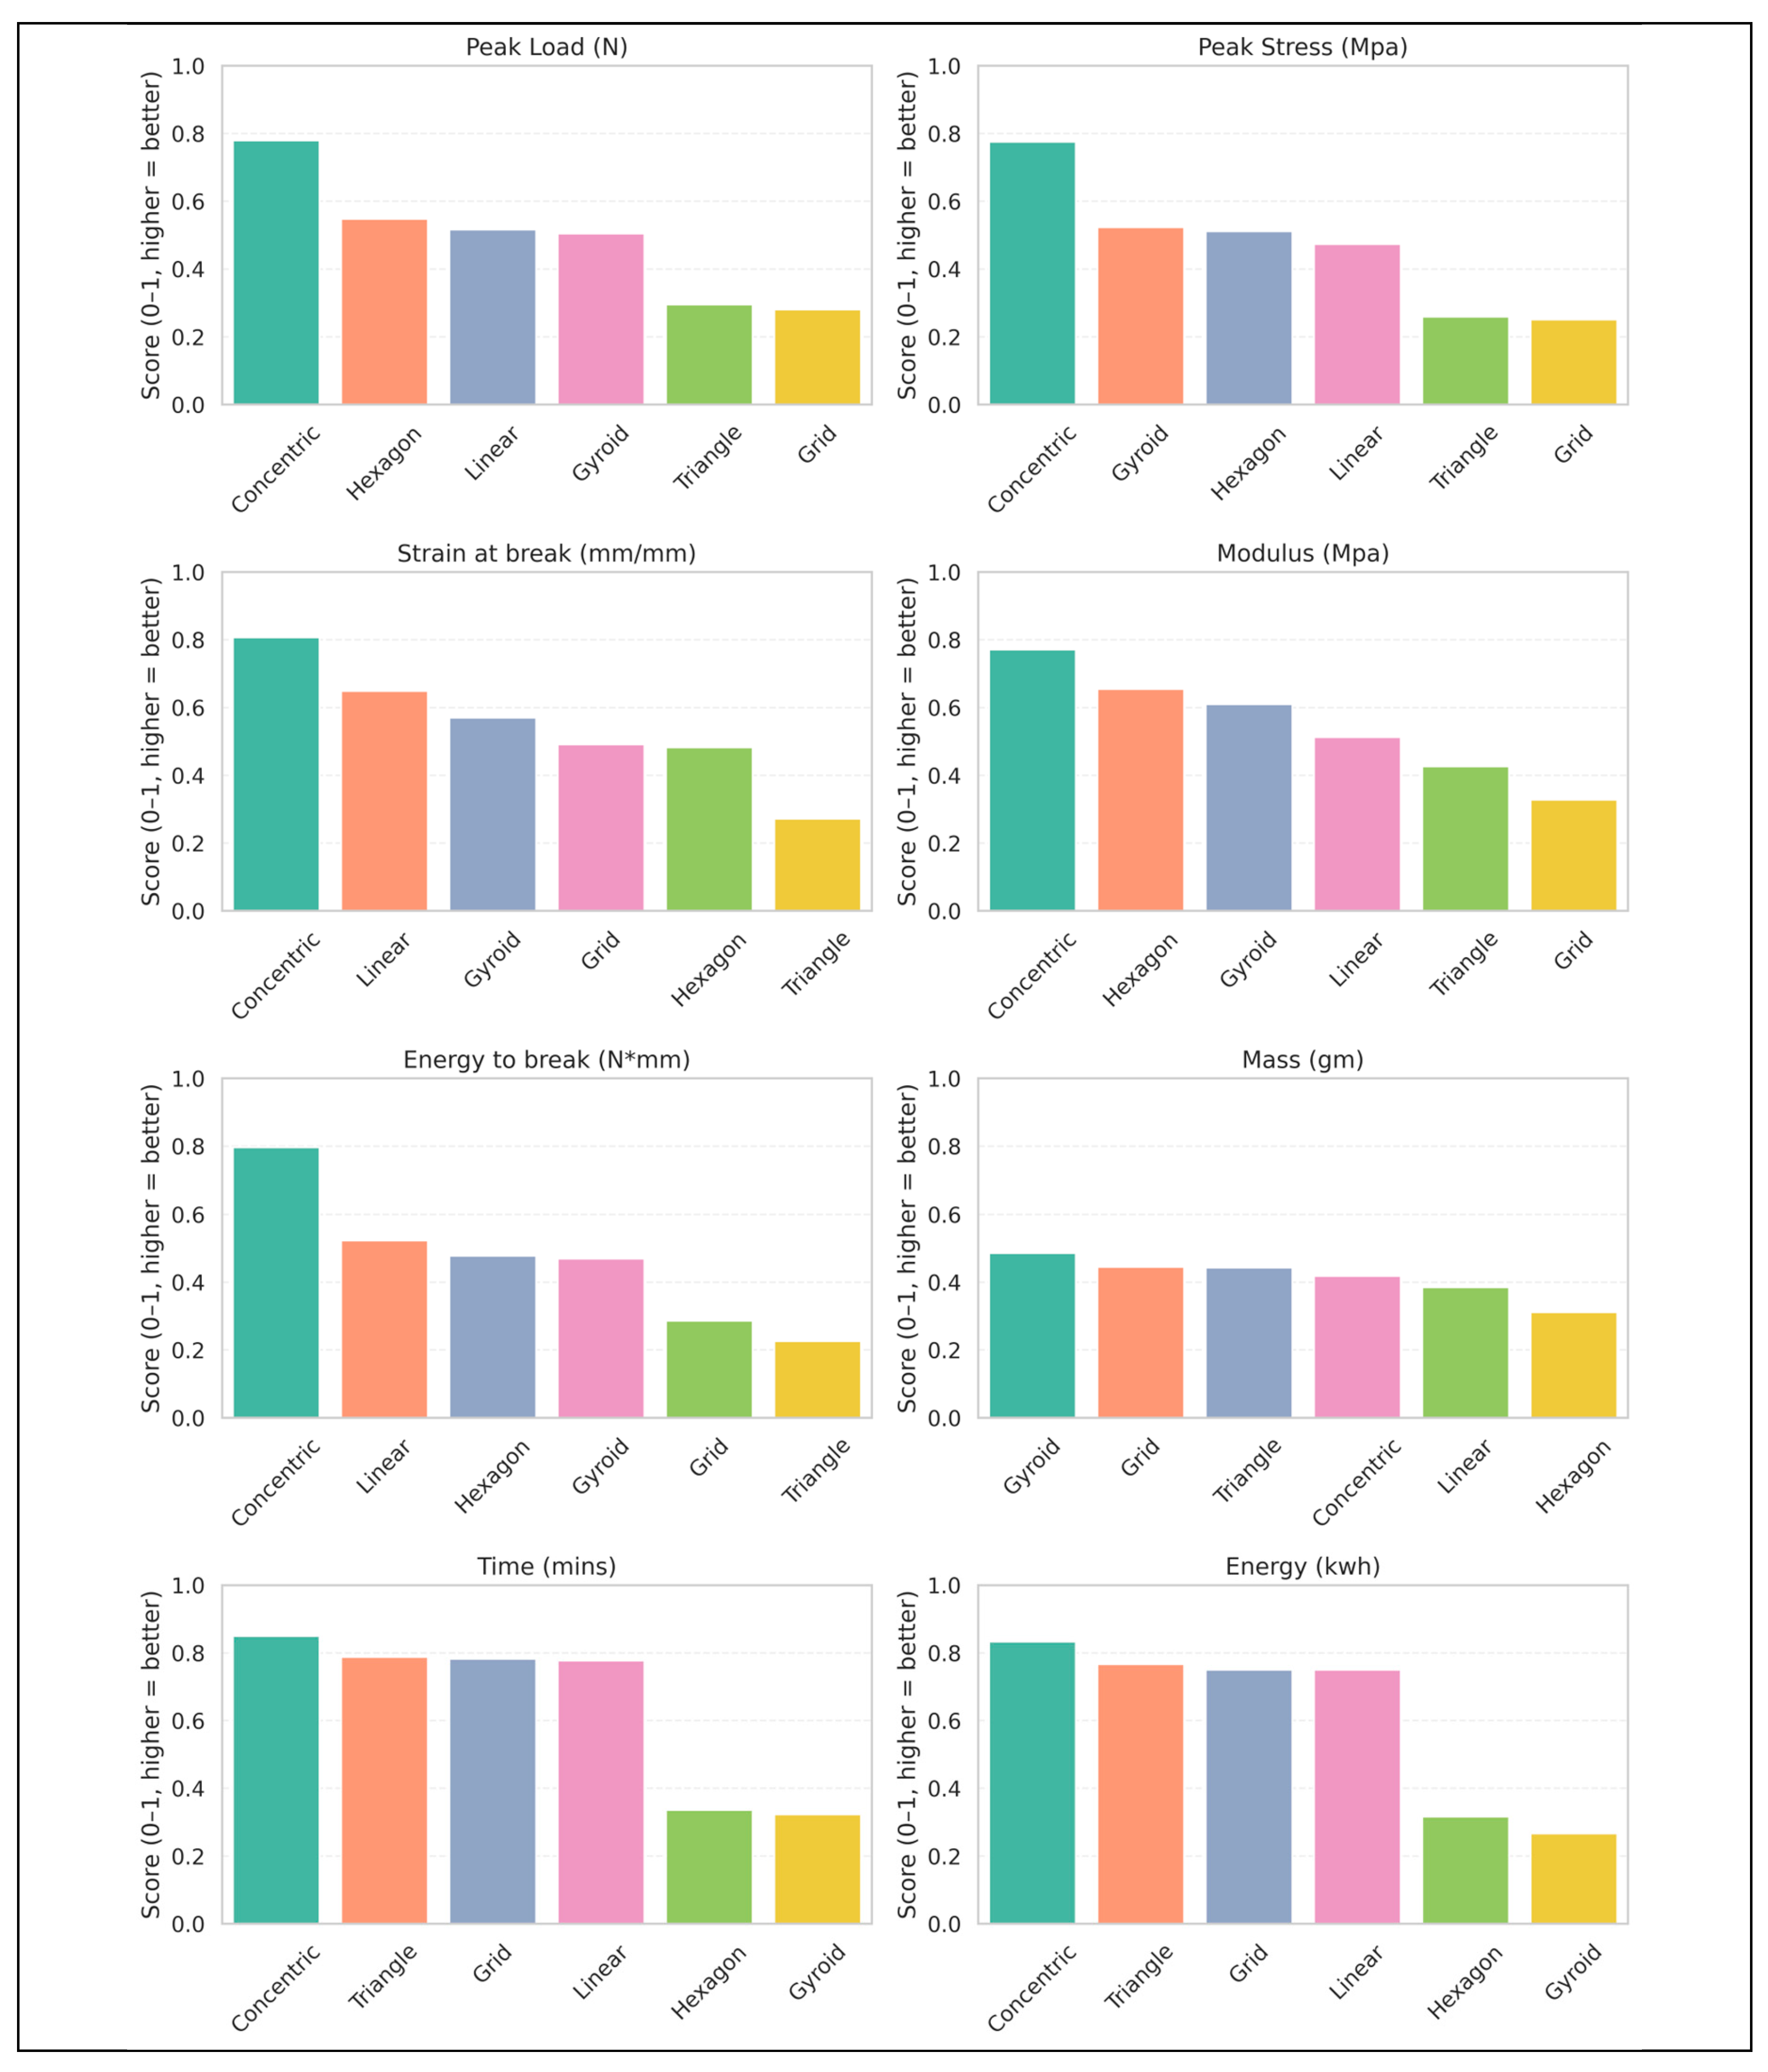
Table 5.
Average performance score of different infill patterns calculated as the mean of normalized mechanical and sustainability metrics. Mechanical properties are normalized directly, while sustainability metrics (mass, printing time, and energy consumption) are inversely normalized so that higher scores consistently represent better overall performance.
| Infill Pattern | Average Performance Score |
|---|---|
| Concentric | 0.80 |
| Triangle | 0.75 |
| Grid | 0.73 |
| Linear | 0.71 |
| Hexagon | 0.69 |
| Gyroid | 0.66 |
Overall, the combined analysis of metric-specific normalized scores (Figure 9) and aggregate performance scores (Table 5) demonstrates that, within the scope of the present dataset, concentric infill provides the most balanced and robust performance profile, frequently exceeding alternative infill patterns by factors of 1.1-2.1 depending on the metric considered. This integrated evaluation framework reduces the risk of misleading conclusions based on isolated properties and provides a more comprehensive basis for infill selection in FDM-printed PLA components, particularly when both mechanical performance and sustainability considerations are of interest.
3.5. Effect of Skin Layers on Peak Stress
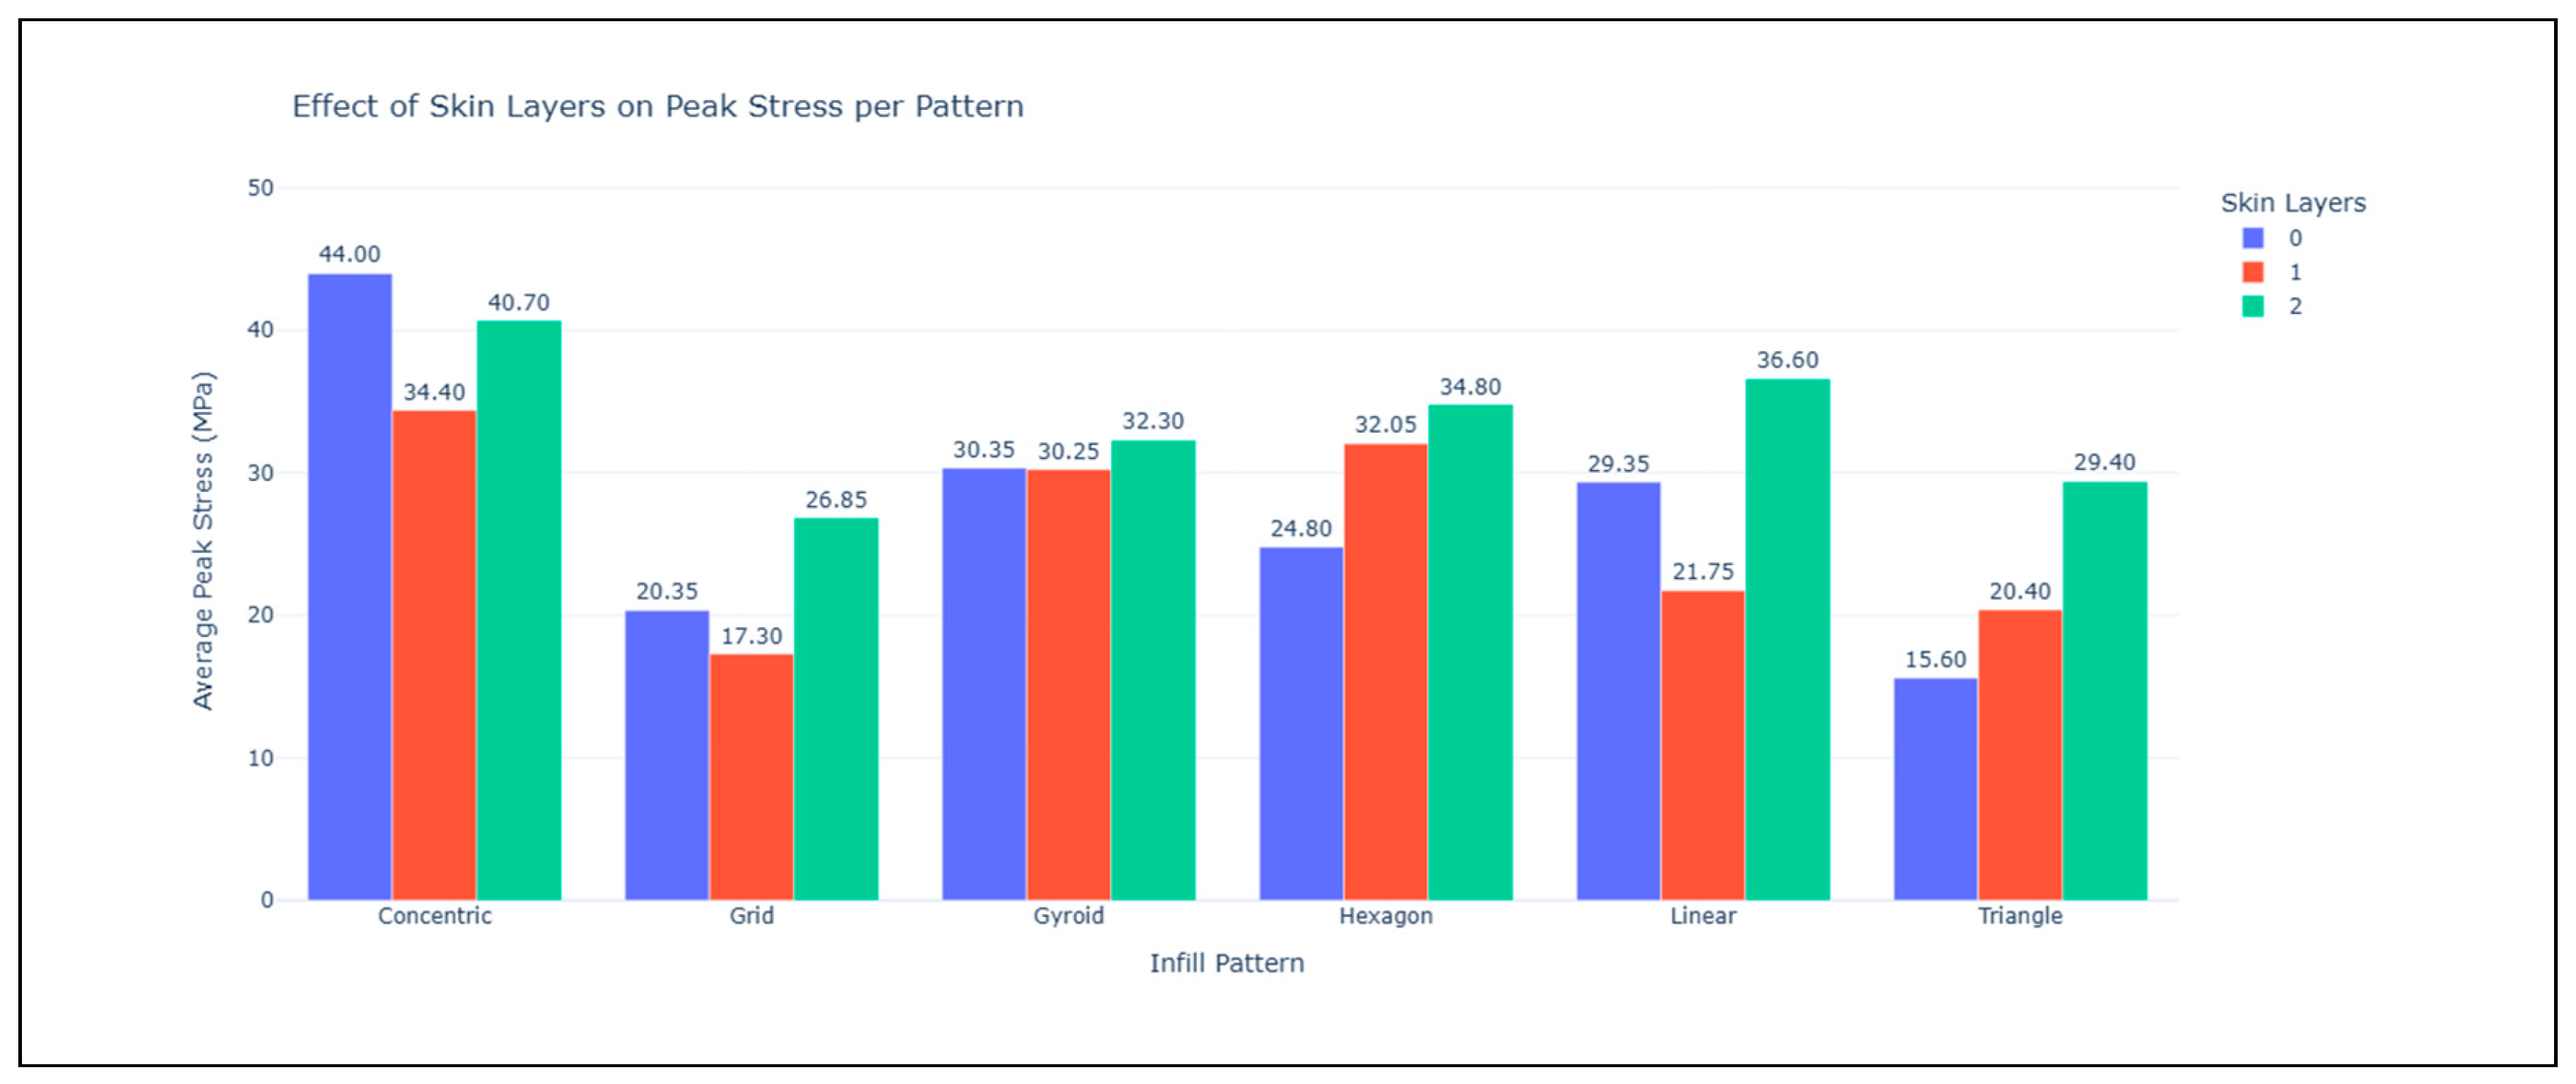
The effect of skin layers on peak stress across different infill patterns is illustrated in Figure 10. Since skin layers are required in functional parts to provide surface integrity and structural continuity, particularly for infill patterns with inherent internal gaps such as gyroid, hexagon, triangle, grid, and concentric, understanding their influence on mechanical performance is important. When skin layers are introduced, they are accommodated within the same overall specimen thickness, which results in a redistribution of material from the infill region to the outer skins rather than an increase in total material volume. Consequently, the infill height and contribution are reduced while the continuous outer layers become more dominant in load transfer.
The results reveal that the influence of skin layers is strongly dependent on the infill pattern and its load-path alignment. For concentric infill, which is inherently well aligned with the tensile loading direction, adding skin layers reduces peak stress. This can be attributed to the disruption of the optimal load-aligned concentric paths by the monotonic skin layers, which alters stress distribution and reduces the effectiveness of the aligned material layers. In contrast, for geometric infill patterns such as grids, hexagons, and triangles, the addition of skin layers generally increases peak stress. In these cases, the skin layers provide more continuous load-bearing paths than the underlying geometric infill, thereby improving load transfer and enhancing tensile performance. The gyroid pattern shows comparatively moderate sensitivity to skin layers, reflecting its three-dimensional continuous architecture and more isotropic load distribution.
Overall, our results demonstrate that the mechanical impact of skin layers is governed not by increased material usage but by the redistribution of material and the resulting changes in load-path alignment. This highlights that tensile performance in FDM-printed PLA components can be optimized through strategic material placement and infill-skin interaction rather than by simply increasing infill density or material consumption. From a sustainability perspective, this finding reinforces that improved mechanical efficiency can be achieved without additional material, time, or energy input, provided that the infill pattern and skin configuration are appropriately selected.
Figure 10.
Effect of skin layers (0, 1, and 2) on average peak stress across different infill patterns in FDM-printed PLA specimens, illustrating the role of material redistribution and load-path alignment on tensile performance.
Figure 10.
Effect of skin layers (0, 1, and 2) on average peak stress across different infill patterns in FDM-printed PLA specimens, illustrating the role of material redistribution and load-path alignment on tensile performance.
4. Discussion
The present study demonstrates that both infill pattern and density significantly influence the mechanical performance and sustainability of FDM-printed PLA components. While increasing infill density generally enhances strength within the same infill pattern, the choice of infill pattern can outweigh the effect of density. For example, concentric infill at 75% density consistently outperforms other patterns printed at 90% density. Similarly, gyroid and linear patterns at intermediate densities achieve higher efficiency than hexagon, grid, or triangle patterns at maximum density. This superior performance is primarily due to load-path alignment: continuous material layers in concentric, gyroid, and linear patterns effectively carry stress along the aligned layers, whereas other patterns rely on interlayer adhesion. The superior performance of concentric, linear, and gyroid infill patterns under tensile loading is also reported [7,16,18,19,20].
The two-way ANOVA results support this observation: pattern effects are statistically significant (p < 0.05) across all major mechanical properties, including Peak Stress, Modulus, and Break Energy. Interaction effects between pattern and density are also evident, emphasizing that the optimal combination of infill and density must be considered to achieve peak performance.
This insight aligns with known failure mechanisms in 3D-printed parts. Over long-term or repeated loads, delamination or interlayer separation is the dominant failure mode. Load is primarily borne by the infill. Thus, a suboptimal infill pattern at high density may be more vulnerable to failure than a lower-density infill with aligned load paths. For instance, concentric infill exhibits normalized efficiency scores of 0.85-0.88 per gram, 0.65-0.67 per kWh, and 0.71-0.73 per min for Peak Stress, Modulus, and Energy to Break. In comparison, grid and triangle patterns achieve only 0.15-0.28 efficiency across the same metrics, representing a 1.2-6x improvement for concentric, highlighting its superior material, energy, and time utilization.
Load-path alignment is also crucial in relation to build orientation. When loads align with continuous material layers, the full material strength is exploited. Misaligned loads are primarily resisted by interlayer adhesion, which is weaker and more prone to delamination. This explains why some orientations consistently outperform others and reinforces the need to consider orientation effects alongside infill selection.
Sustainability metrics further inform infill selection. Hexagon and gyroid patterns, due to their complex geometry, require more intricate nozzle movements, leading to longer printing times and higher energy consumption, whereas mass differences are relatively minor due to small part sizes. Concentric infill achieves high resource-based efficiency, maximizing mechanical performance per unit mass, energy, and time, making it a balanced choice for both performance and sustainability.
The role of skin layers is also evident. At lower densities, additional skin layers improve peak stress by better load distribution. At higher densities (e.g., 90%), skin layers slightly reduce peak stress for concentric, gyroid, and linear patterns, whereas they improve peak stress for hexagon, grid, and triangle patterns. This can be attributed to the alignment between skin layers and the internal infill geometry: for certain infills, skin layers reinforce the load path, whereas in others they constrain the structure in non-optimal directions.
Overall, concentric infill emerges as the optimal choice for uniaxial tensile loading, achieving the highest mechanical efficiency and the most favorable material, energy, and time utilization. However, real-world functional components are rarely subjected to purely uniaxial loading. Based on the insights from the resource-normalized mechanical efficiency analysis and the discussion on load-path alignment, a gyroid infill pattern was selected for printing a representative functional component, namely a VR controller holder (Figure 11).
Although gyroid infill exhibits lower tensile efficiency compared to concentric infill (normalized values of 0.51-0.68 per gram and 0.10-0.14 per kWh), its continuous, three- dimensional and curvature-based architecture provides an isotropic load-bearing behavior. This makes gyroid infill better suited for components experiencing combined tensile, bending, torsional, and shear loads, such as the arm and curved sections of the VR controller holder. The increased printing time and energy consumption associated with gyroid infill are therefore a deliberate trade-off to improve mechanical resilience under multidirectional loading conditions.
The above solution demonstrates a key contribution of this research: rather than identifying a single “best” infill pattern, this research establishes a decision framework that links infill pattern selection to load-path alignment, mechanical efficiency, and sustainability metrics. The practical case study demonstrates how the findings can be translated from standardized tensile specimens to real functional parts, enabling informed infill selection based on application-specific loading requirements rather than solely on density-driven strengthening.
For future work, considering the variability in mechanical response under different load conditions, load-specific infill design will be considered. Multiple infill patterns could be applied in a single part using mesh modifiers or custom G-code generation. Currently, no systematic studies have evaluated interactions between adjacent infill patterns within the same layer. Investigating these interactions could enable optimization of both strength and sustainability, particularly for parts subjected to multidirectional forces.
5. Conclusions
This study demonstrates that while infill density plays an important role in improving tensile strength within the same infill pattern, the infill pattern itself is the dominant factor governing mechanical performance across different patterns. Load-aligned architectures such as concentric, linear, and gyroid consistently outperform more geometrically segmented patterns, even at lower densities, by enabling stresses to be carried through continuous material paths rather than relying primarily on interlayer adhesion. As a result, these patterns exhibit higher tensile strength, stiffness, and toughness.
When mechanical performance is evaluated together with sustainability metrics, the advantages of load-aligned infill patterns become more pronounced. Resource-normalized results show that concentric, linear, and gyroid infills deliver superior mechanical efficiency per unit material, energy, and printing time. This indicates that increasing infill density is not always the most effective strategy for improving part performance and often leads to unnecessary increases in weight, energy consumption, and manufacturing time.
Overall, the findings suggest that for tensile-loaded FDM PLA components, informed infill pattern selection offers a more efficient and sustainable design approach than simply increasing infill density. By prioritizing load-aligned infill architectures, it is possible to achieve higher mechanical performance while simultaneously reducing resource usage, providing a practical pathway toward stronger, lighter, and more sustainable additively manufactured parts.
Author Contributions
Conceptualization, Q.P. and W.S.; methodology, W.S.; software, W.S.; validation, Q.P. and W.S.; formal analysis W.S.; investigation, W.S.; resources, Q.P.; data curation, Q.P. and W.S.; writing—original draft preparation, W.S.; writing—review and editing, Q.P.; visualization, W.S.; supervision, Q.P.; project administration, Q.P.; funding acquisition, Q.P. All authors have read and agreed to the published version of the manuscript.
Funding
This research was supported by Discovery Grants from the Natural Sciences and Engineering Research Council (NSERC) of Canada.
Data Availability Statement
Conflicts of Interest
The authors declare that there is no conflict of interest.
References
- Anis, N.; Latib, N.A.; Sa’ude, N.; Latib, A.; Ude, S.’ N. Study on the Mechanical Properties of Pla, Abs and Petg Filament Printed by Various Type of Infill Design Using 3d Printing Machine. Research Progress in Mechanical and Manufacturing Engineering 2023, 4, 162–167. [CrossRef]
- Mou, L.; Li, J.; Lu, Y.; Li, G.; Li, J. Polylactic Acid: A Future Universal Biobased Polymer with Multifunctional Performance—from Monomer Synthesis, and Processing to Applications: A Review. Journal of Hazardous Materials Advances 2025, 18, 100757. [CrossRef]
- Shehbaz, W. Selection and Optimization of Additive Manufacturing Process Parameters Using Machine Learning: A Review. Comput. Aided. Des. Appl. 2025, 893–911. [CrossRef]
- Ziadia, A.; Mohamed, H.; Kelouwani, S. Machine Learning Study of the Effect of Process Parameters on Tensile Strength of FFF PLA and PLA-CF. Eng 2023, 4, 2741–2763. [CrossRef]
- Shehbaz, W.; Peng, Q. Evaluation of Machine Learning Models in Predicting Mechanical Properties of Additive Manufactured Parts. Transactions of the Canadian Society for Mechanical Engineering 0, null. [CrossRef]
- Shehbaz, W.; Peng, Q. Evaluation of Machine Learning Models for Enhancing Sustainability in Additive Manufacturing. Technologies (Basel). 2025, 13. [CrossRef]
- Pop, M.A.; Zaharia, S.M.; Chicos, L.A.; Lancea, C.; Stamate, V.M.; Buican, G.R.; Pascariu, I.S. Effect of the Infill Patterns on the Mechanical Properties of the Carbon Fiber 3D Printed Parts. IOP Conf. Ser. Mater. Sci. Eng. 2022, 1235, 012006. [CrossRef]
- Zaman, U.K.U.; Boesch, E.; Siadat, A.; Rivette, M.; Baqai, A.A. Impact of Fused Deposition Modeling (FDM) Process Parameters on Strength of Built Parts Using Taguchi’s Design of Experiments. International Journal of Advanced Manufacturing Technology 2019, 101, 1215–1226. [CrossRef]
- Aloyaydi, B.; Sivasankaran, S.; Mustafa, A. Investigation of Infill-Patterns on Mechanical Response of 3D Printed Poly-Lactic-Acid. Polym. Test. 2020, 87, 106557.
- Pernet, B.; Nagel, J.K.; Zhang, H. Compressive Strength Assessment of 3D Printing Infill Patterns. In Proceedings of the Procedia CIRP; Elsevier B.V., 2022; Vol. 105, pp. 682–687.
- Nur Farhan Saniman, M.; Reshid, M.; mohd shariff, J.; Azhar Harimon, M.; Fadhli Bidin, M.; Meseret Nasir, R.; Mohd Shariff, J. Flexural Properties Evaluation of Additively Manufactured Components with Various Infill Patterns. International Journal of Advanced Science and Technology 2020, 29, 4646–4657.
- Lubombo, C.; Huneault, M.A. Effect of Infill Patterns on the Mechanical Performance of Lightweight 3D-Printed Cellular PLA Parts. Mater. Today Commun. 2018, 17, 214–228. [CrossRef]
- Mishra, P.K.; Senthil, P.; Adarsh, S.; Anoop, M.S. An Investigation to Study the Combined Effect of Different Infill Pattern and Infill Density on the Impact Strength of 3D Printed Polylactic Acid Parts. Composites Communications 2021, 24. [CrossRef]
- Rajkumar, Santosh. Effect of infill pattern and build orientation on mechanical properties of FDM printed parts: An experimental modal analysis approach. arXiv preprint (2022), arXiv:2202,. [CrossRef]
- Khan, S.F.; Zakaria, H.; Chong, Y.L.; Saad, M.A.M.; Basaruddin, K. Effect of Infill on Tensile and Flexural Strength of 3D Printed PLA Parts. In Proceedings of the IOP Conference Series: Materials Science and Engineering; Institute of Physics Publishing, November 9 2018; Vol. 429.
- El Omari, A.; Ouballouch, A.; Nassraoui, M. Impact of Infill Pattern and Infill Density on Mechanical Properties of FDM 3D Printed Parts: A Review Impact Du Motif de Remplissage et de La Densité de Remplissage Sur Les Propriétés Mécaniques Des Pièces 3D Imprimées Par FDM : Une Revue; 2024;
- Hadj Hassine, S.; Chatti, S.; Louhichi, B.; Seibi, A. Experimental Study of the Tensile Behavior of Structures Obtained by FDM 3D Printing Process. Polymers (Basel). 2024, 16. [CrossRef]
- Yeoh, C.K.; Cheah, C.S.; Pushpanathan, R.; Song, C.C.; Tan, M.A.; Teh, P.L. Effect of Infill Pattern on Mechanical Properties of 3D Printed PLA and CPLA. In Proceedings of the IOP Conference Series: Materials Science and Engineering; IOP Publishing Ltd, November 24 2020; Vol. 957.
- Patel, S.; Gupta, S.; Saket, H.; Bakna, K.; Patel, S.S.; Kumar, S.; Ramakoteswara Rao, V.; Mandava, R.K. Effect of Infill Pattern on the Mechanical Properties of PLA and ABS Specimens Prepared by FDM 3D Printing. Proceedings of the Institution of Mechanical Engineers, Part E: Journal of Process Mechanical Engineering 2024. [CrossRef]
- Kadhum, A.H.; Al-Zubaidi, S.; Abdulkareem, S.S. Effect of the Infill Patterns on the Mechanical and Surface Characteristics of 3D Printing of PLA, PLA+ and PETG Materials. ChemEngineering 2023, 7. [CrossRef]
- Sriya Ambati, S.; Ambatipudi, R. Effect of Infill Density and Infill Pattern on the Mechanical Properties of 3D Printed PLA Parts. In Proceedings of the Materials Today: Proceedings; Elsevier Ltd, January 1 2022; Vol. 64, pp. 804–807.
- Birosz, M.T.; Andó, M. Effect of Infill Pattern Scaling on Mechanical Properties of FDM-Printed PLA Specimens. Progress in Additive Manufacturing 2024, 9, 875–883. [CrossRef]
- Wang, K.; Xie, X.; Wang, J.; Zhao, A.; Peng, Y.; Rao, Y. Effects of Infill Characteristics and Strain Rate on the Deformation and Failure Properties of Additively Manufactured Polyamide-Based Composite Structures. Results Phys. 2020, 18, 103346. [CrossRef]
- Eryildiz, M. The Effects of Infill Patterns on the Mechanical Properties of 3D Printed PLA Parts Fabricated by FDM. Ukrainian Journal of Mechanical Engineering and Materials Science 2021, 7, 1–8. [CrossRef]
- Fernandez-Vicente, M.; Calle, W.; Ferrandiz, S.; Conejero, A. Effect of Infill Parameters on Tensile Mechanical Behavior in Desktop 3D Printing. 3D Print. Addit. Manuf. 2016, 3, 183–192. [CrossRef]
- Qamar Tanveer, M.; Mishra, G.; Mishra, S.; Sharma, R. Effect of Infill Pattern and Infill Density on Mechanical Behaviour of FDM 3D Printed Parts- a Current Review. Mater. Today Proc. 2022, 62, 100–108. [CrossRef]
Figure 1.
a). The CAD design, b). a printed sample of the specimen. All units are in mm.
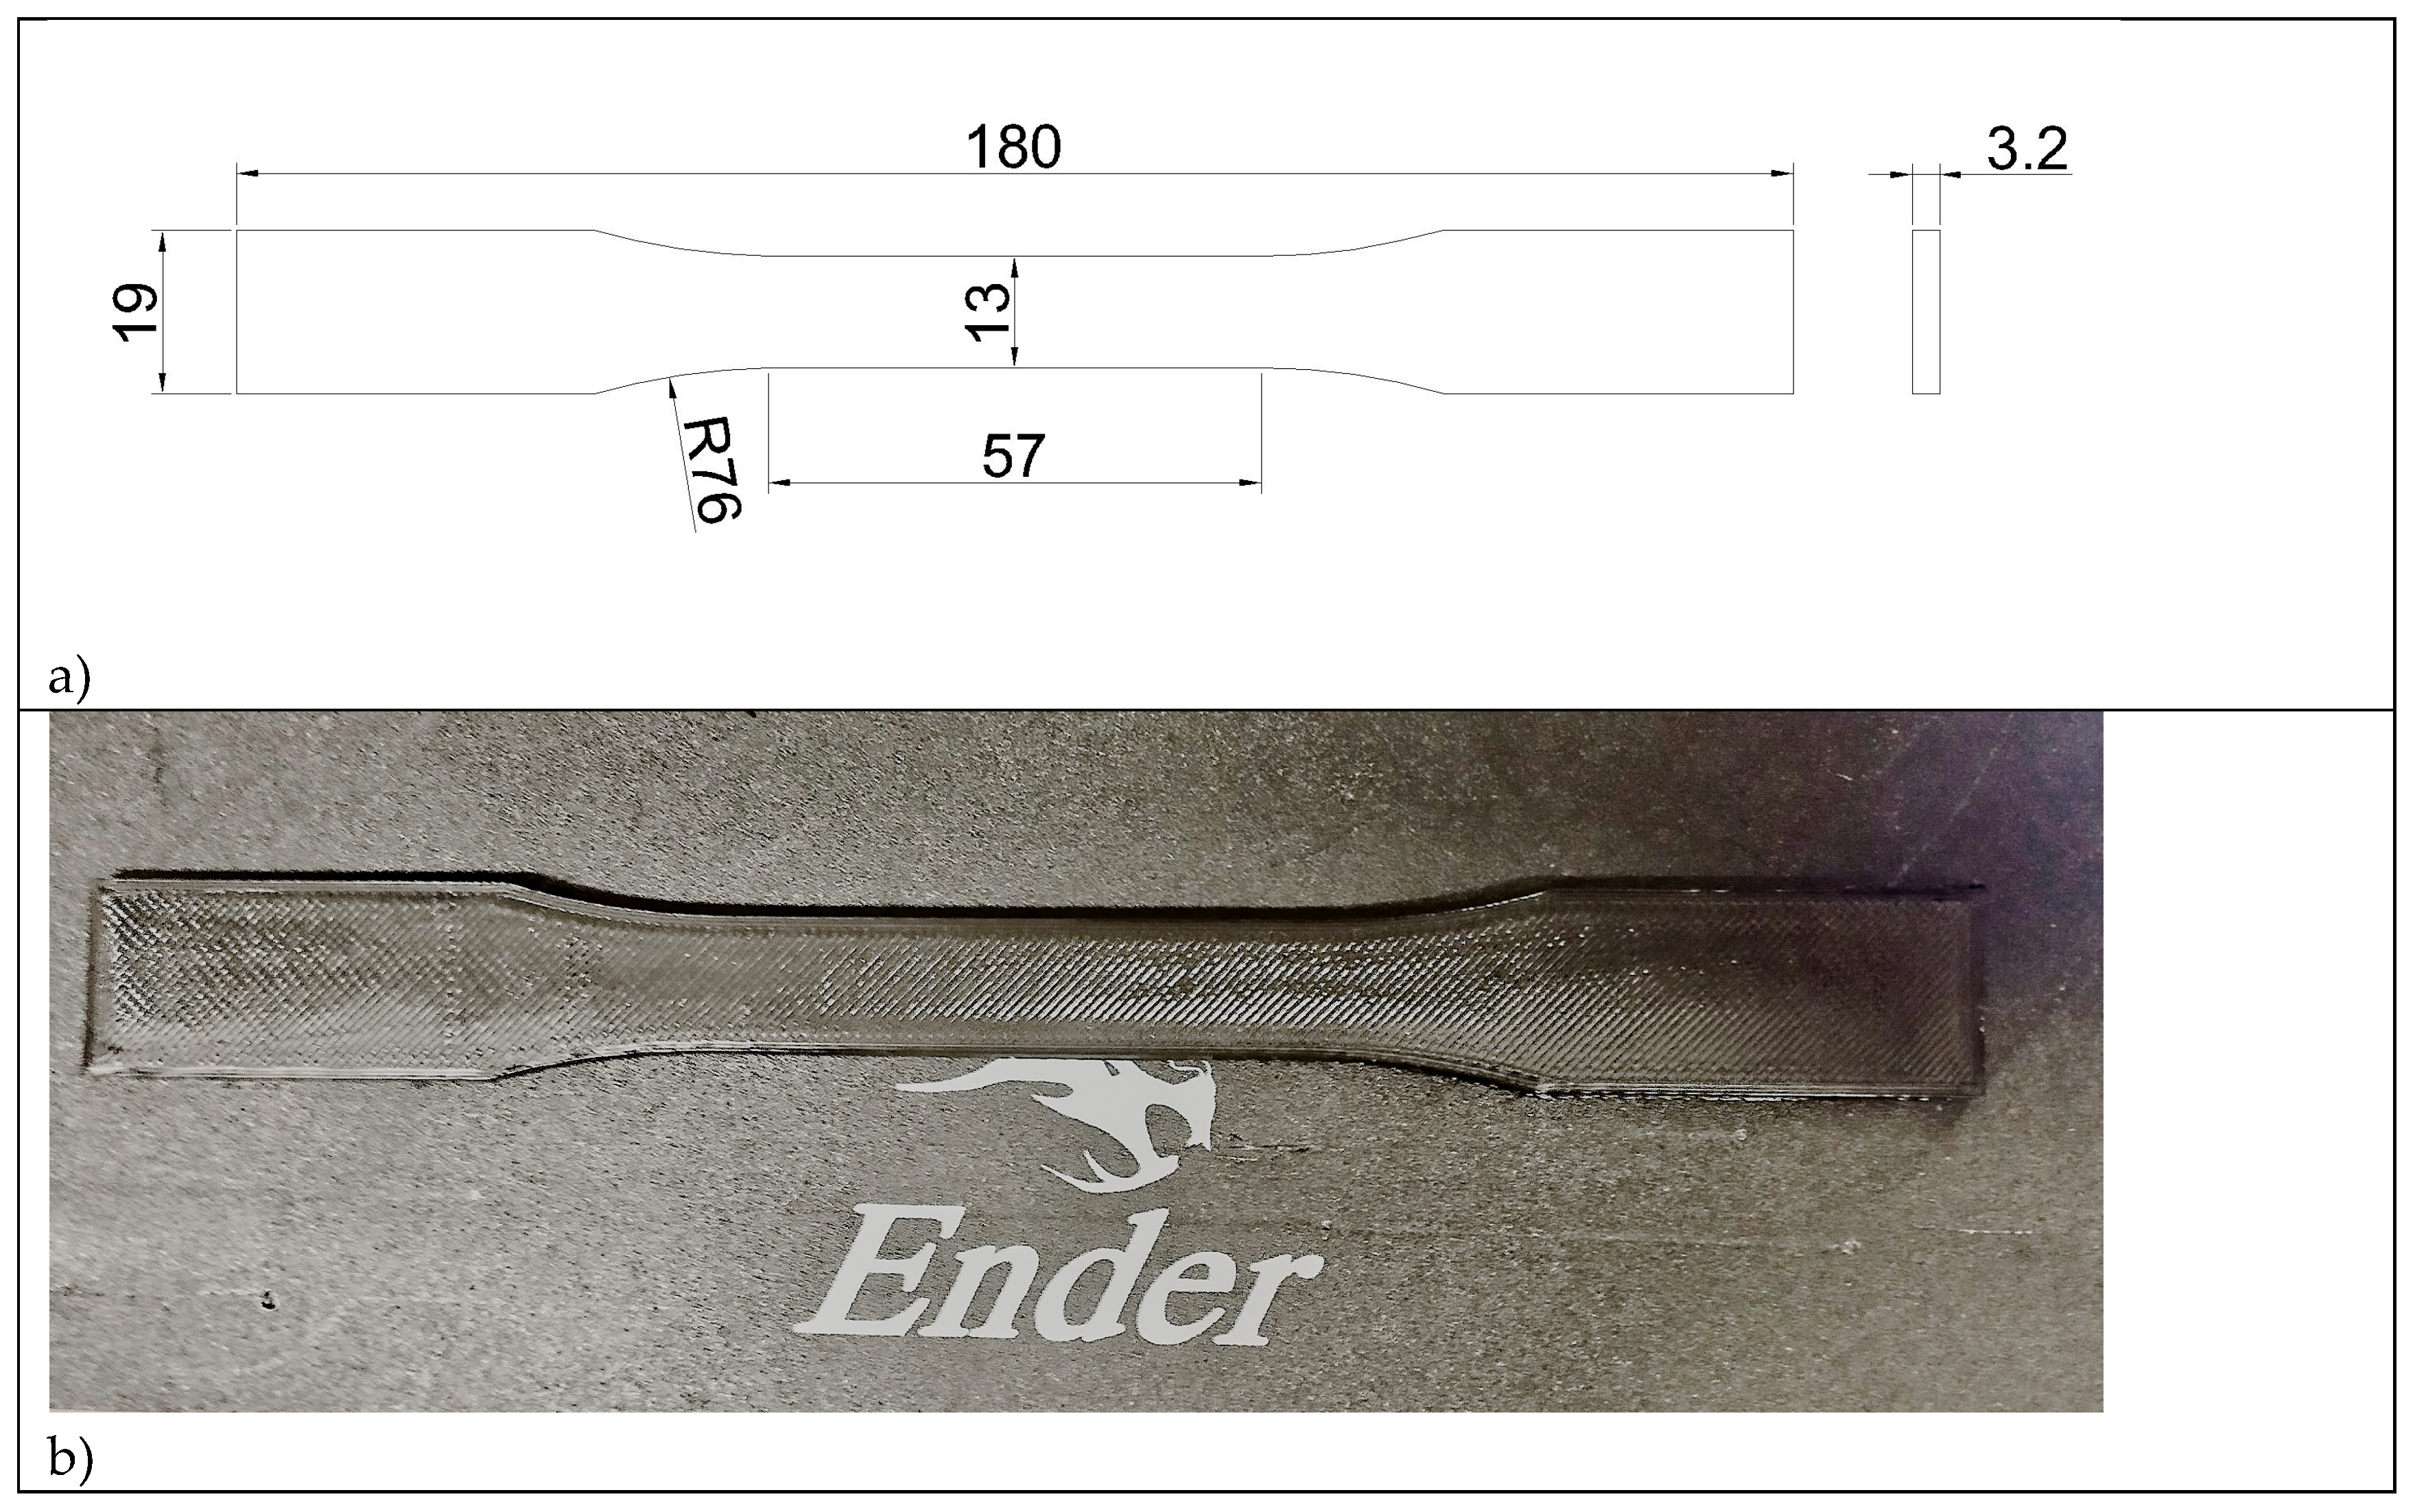
Figure 2.
The six infill patterns; a). Concentric, b). Line, c). Gyroid, d). Hexagon, e). grid, f). Triangle.
Figure 2.
The six infill patterns; a). Concentric, b). Line, c). Gyroid, d). Hexagon, e). grid, f). Triangle.
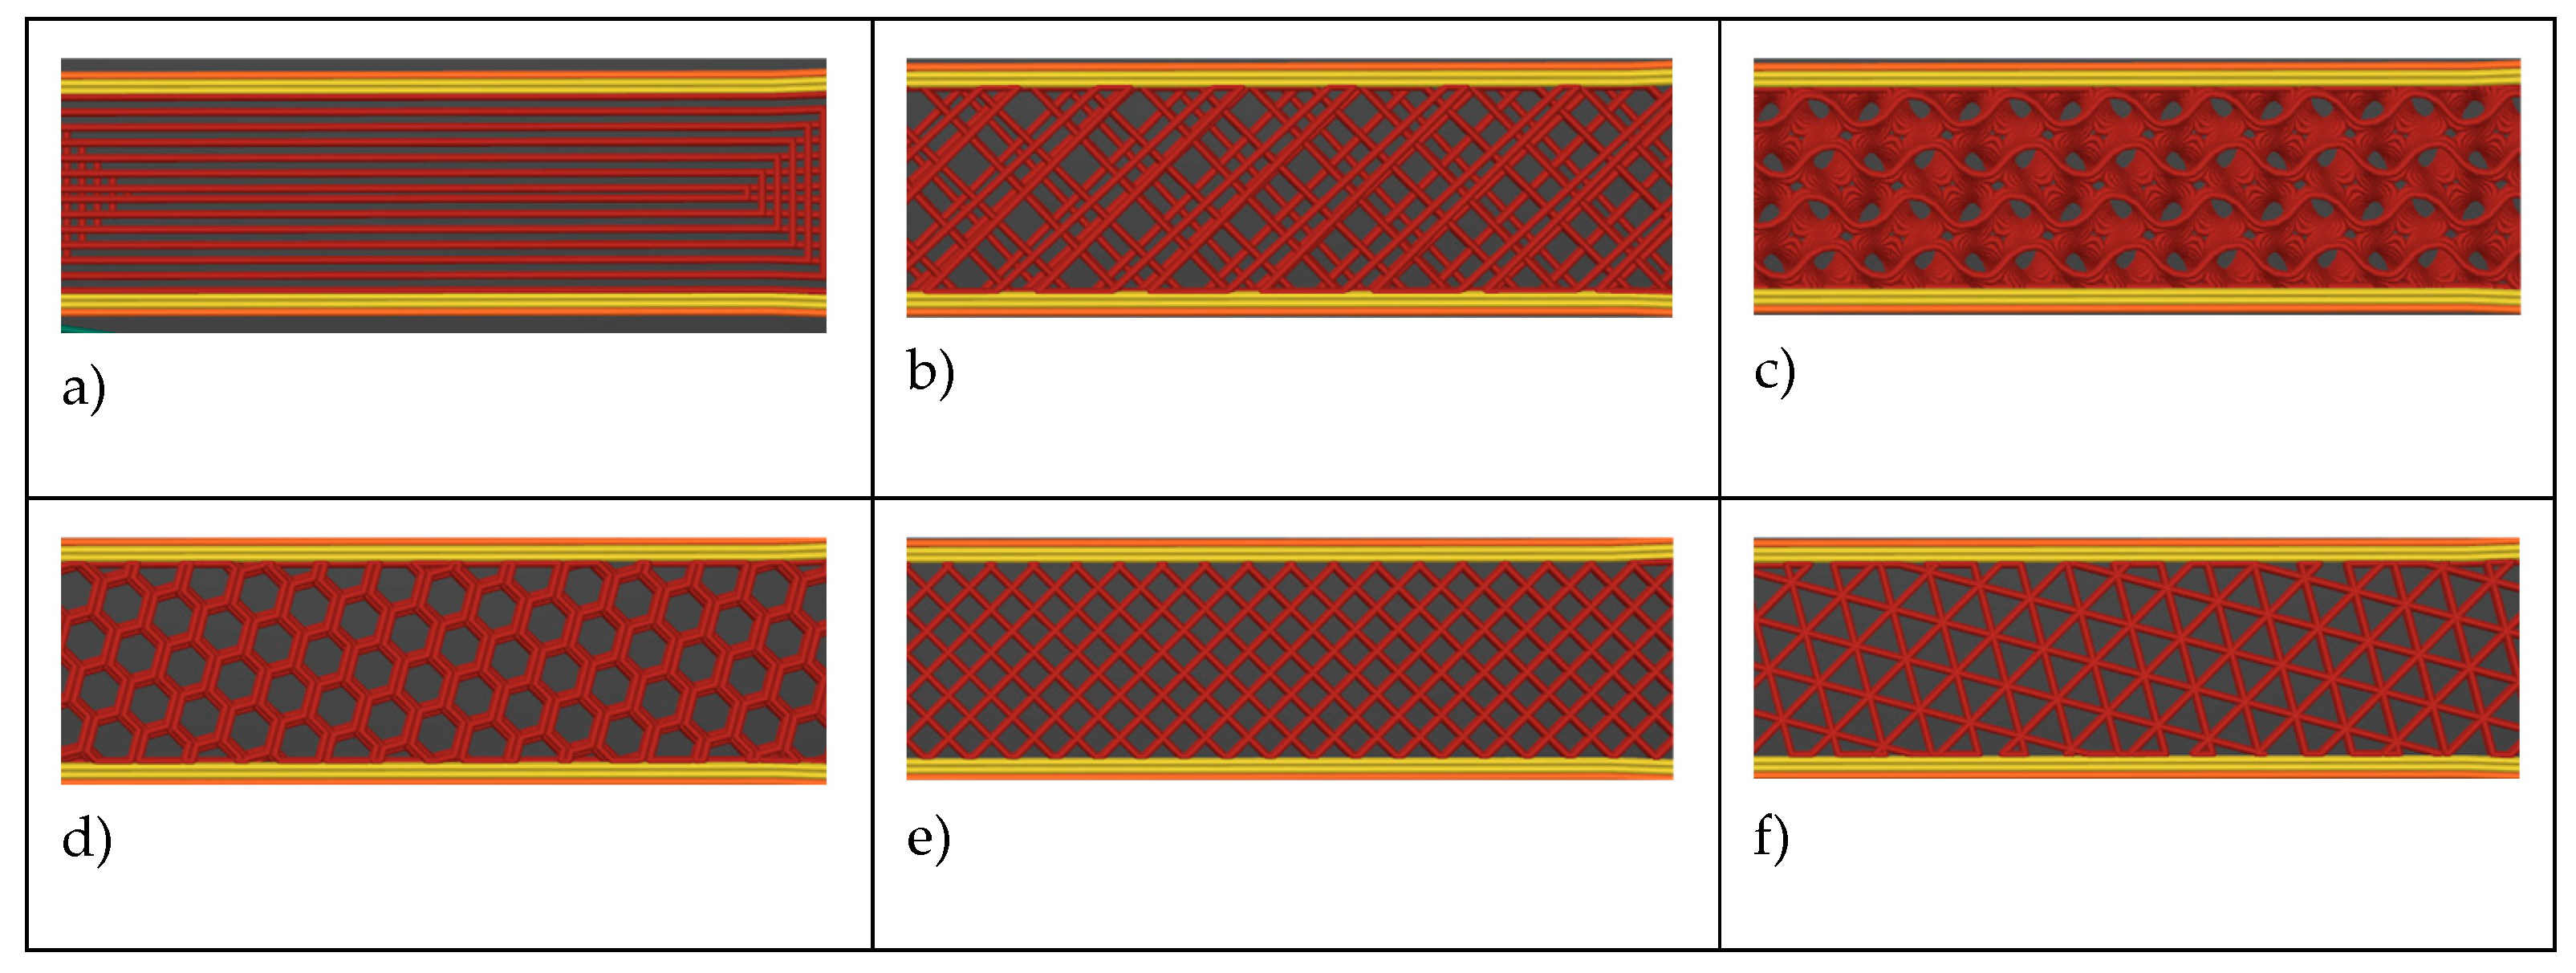
Figure 3.
The different factors, levels and the level counts of each factor.
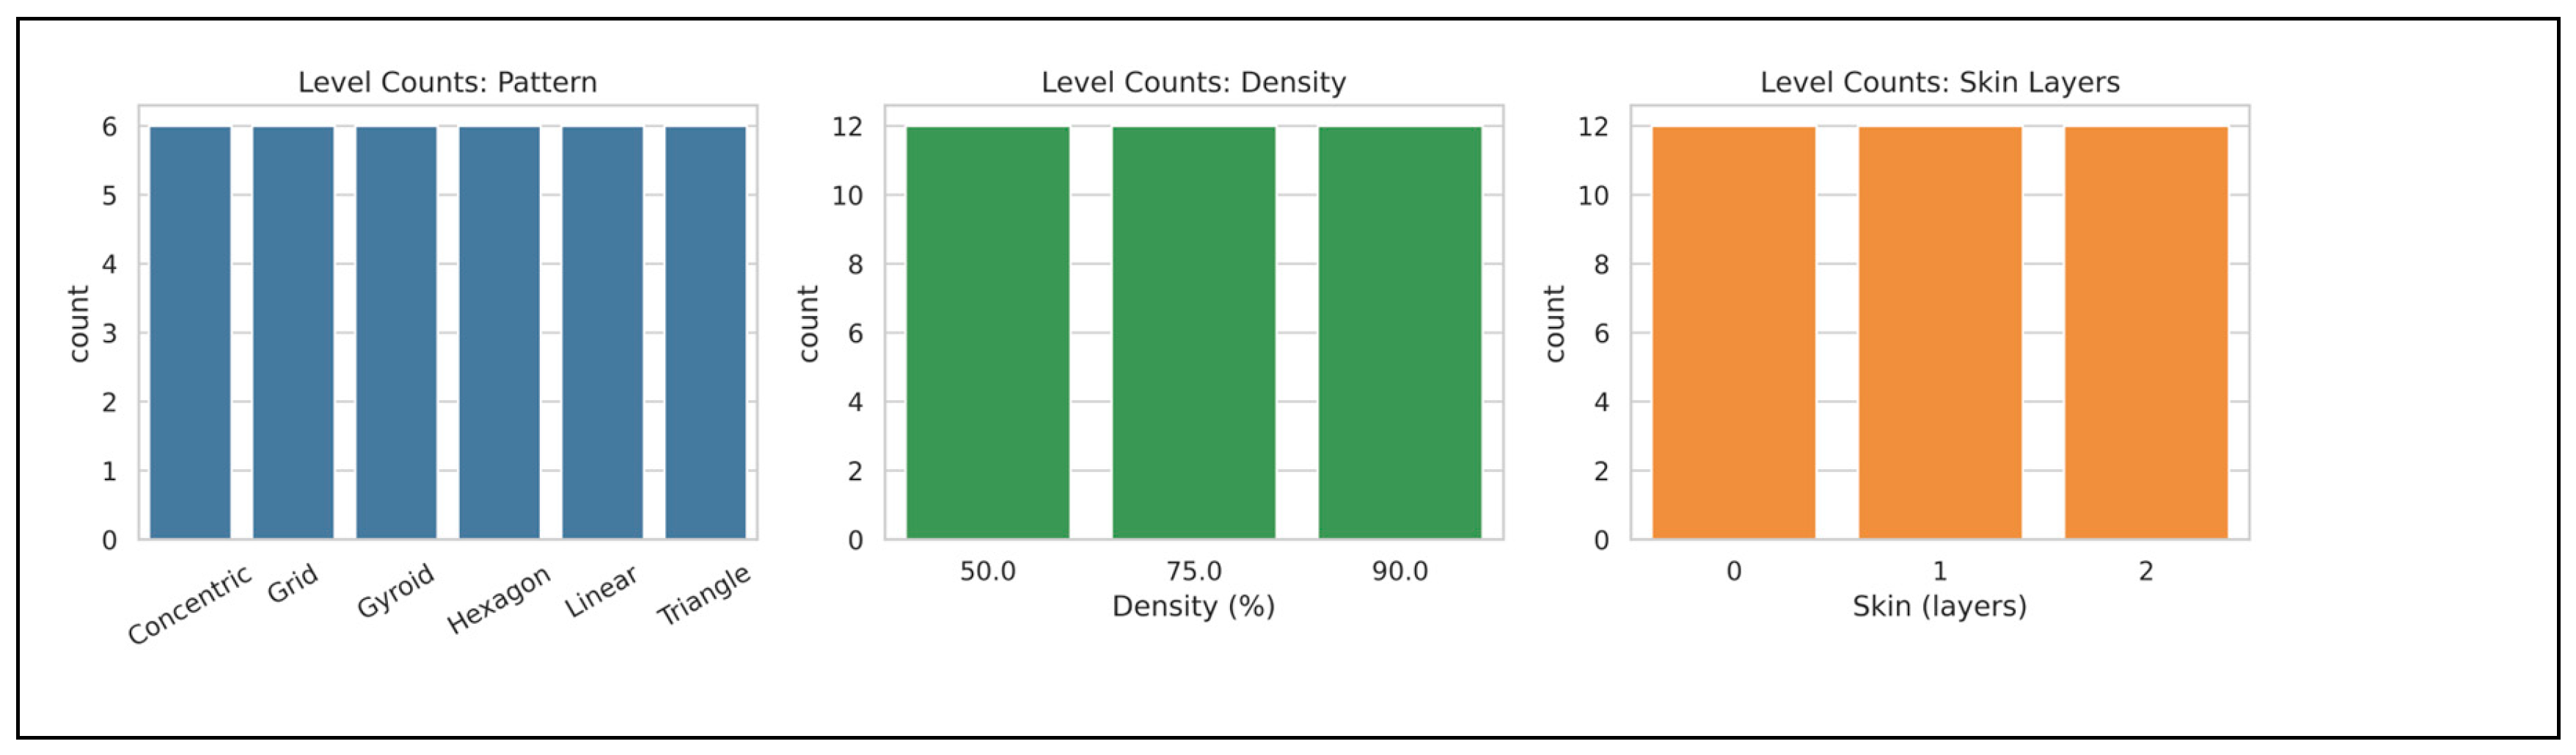
Figure 4.
a). The Ender 3 Pro printer, b). UTM tensile testing, c). tested samples.
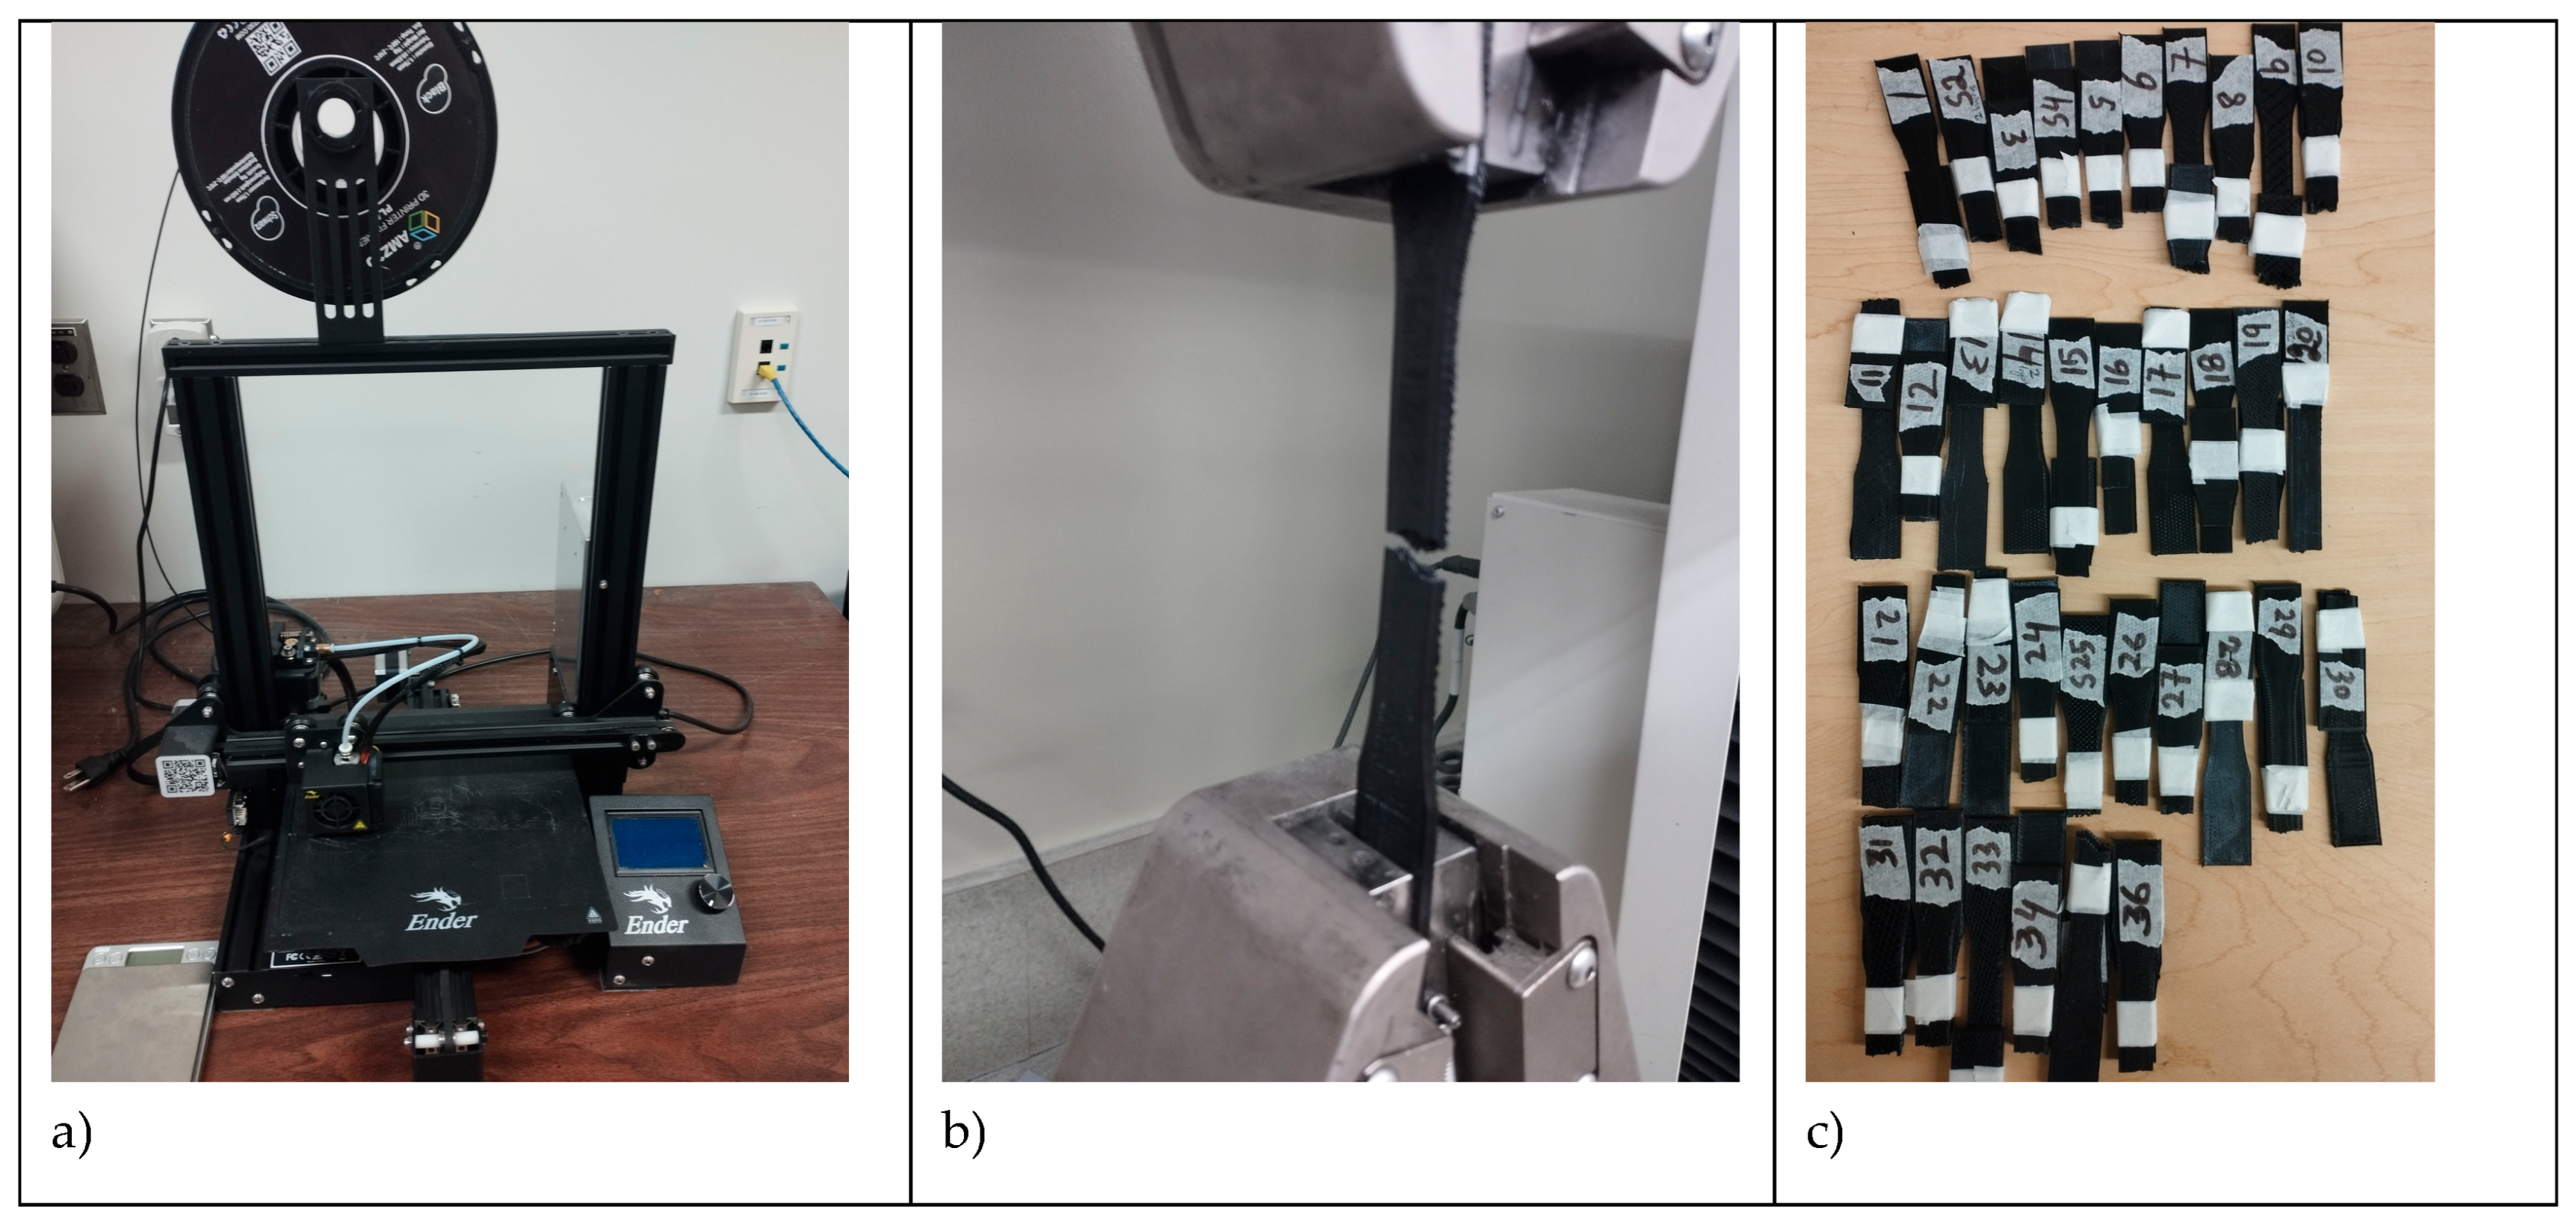
Figure 5.
Effect sizes (η²) of infill pattern, density, and pattern-density interaction on mechanical properties of PLA parts. Bar plot showing η² values for each mechanical property and factor. Density generally dominates Peak Load, Modulus, and Yield Stress, while Pattern strongly affects Break Strain, Peak Stress, and Break Energy. Interaction effects are small across all properties.
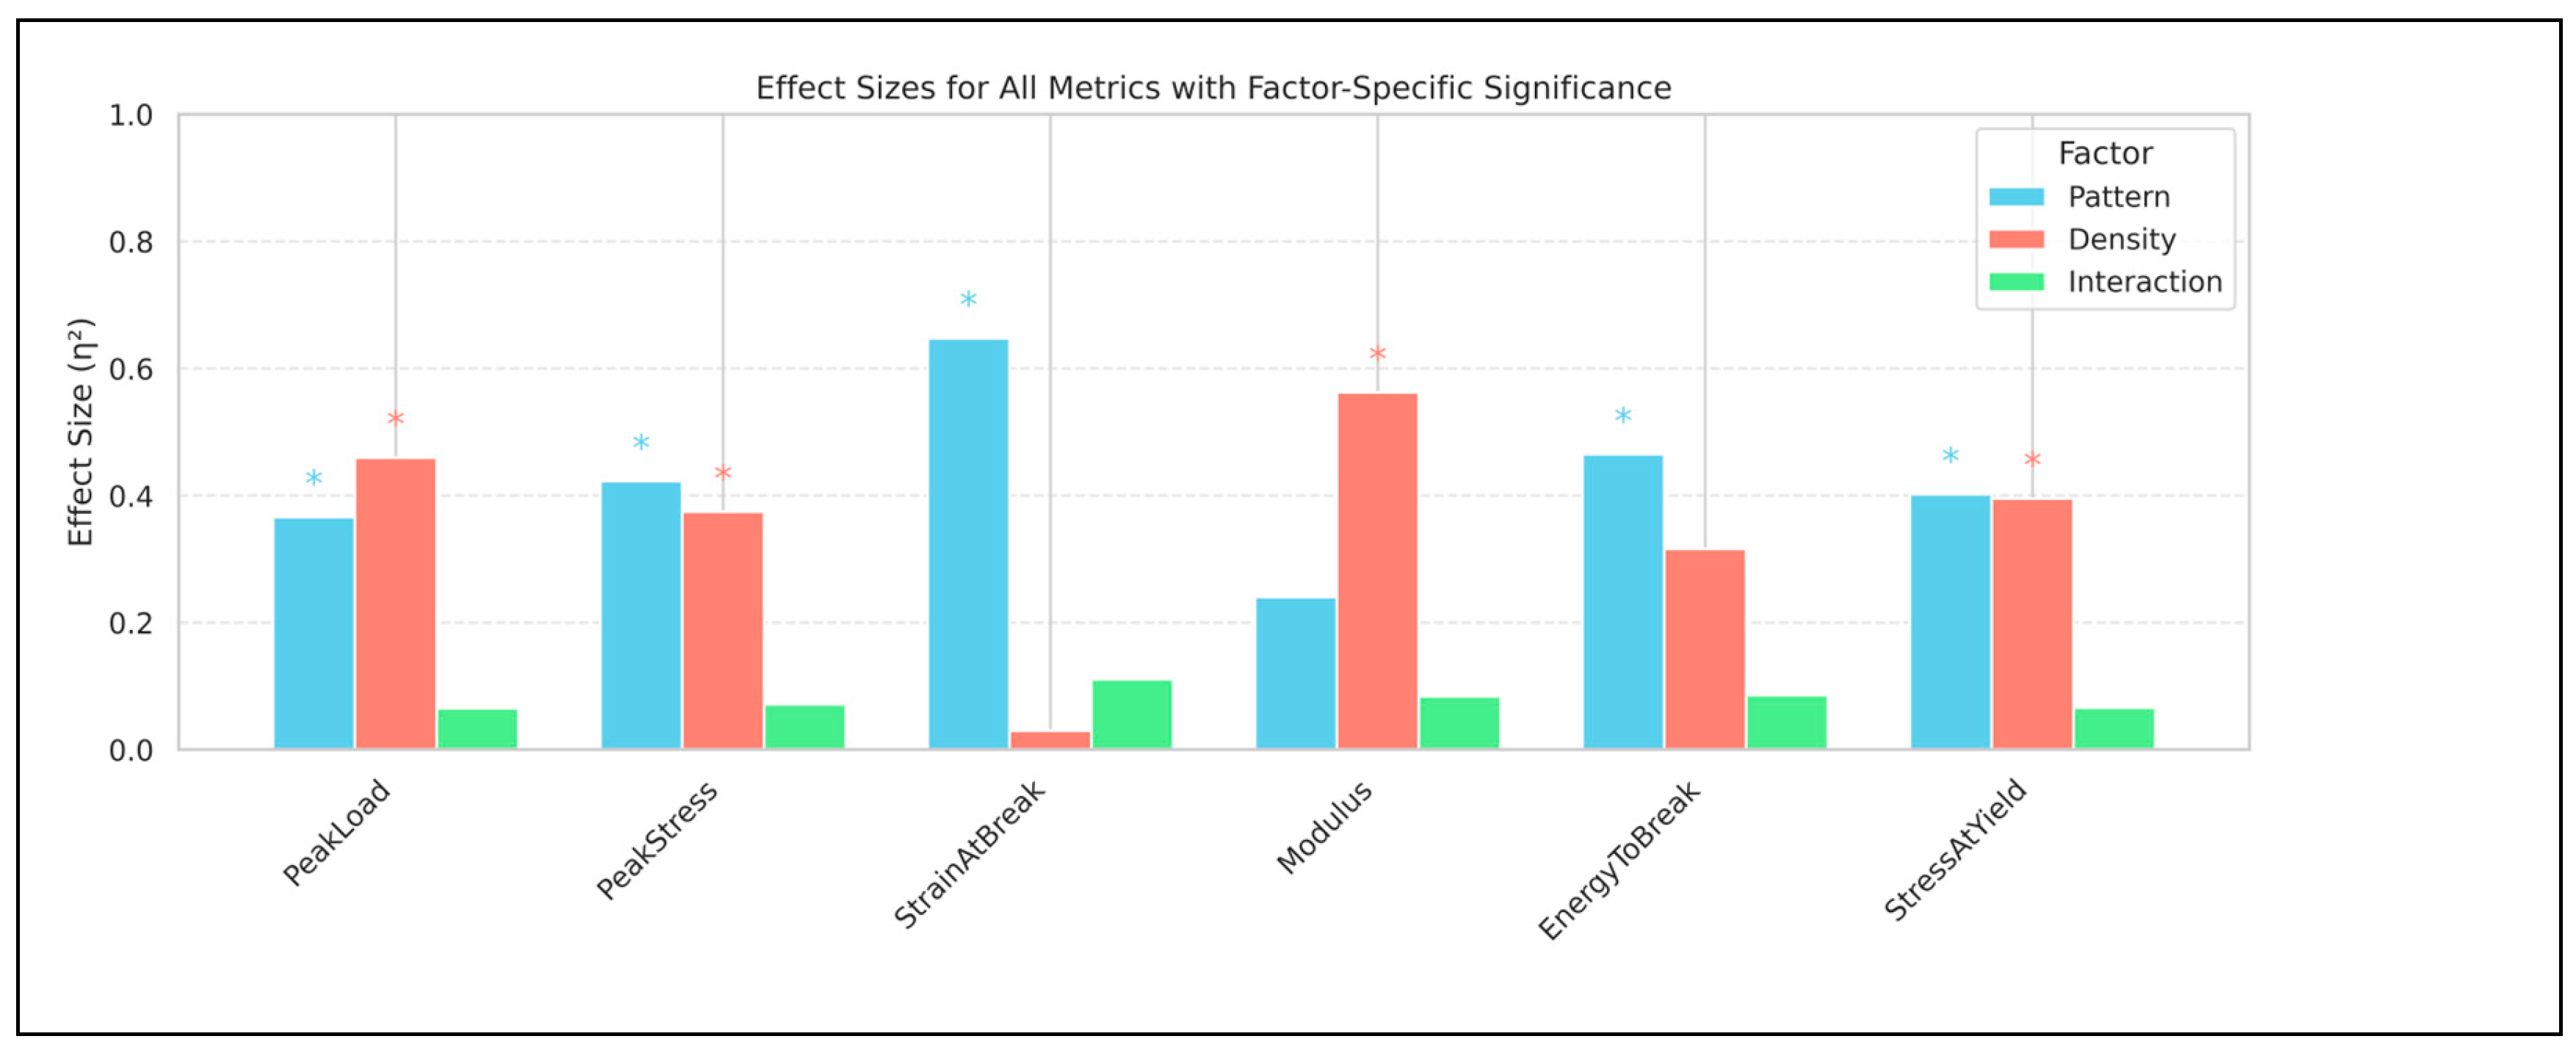
Figure 11.
A 3D printed VR controller holder arm.
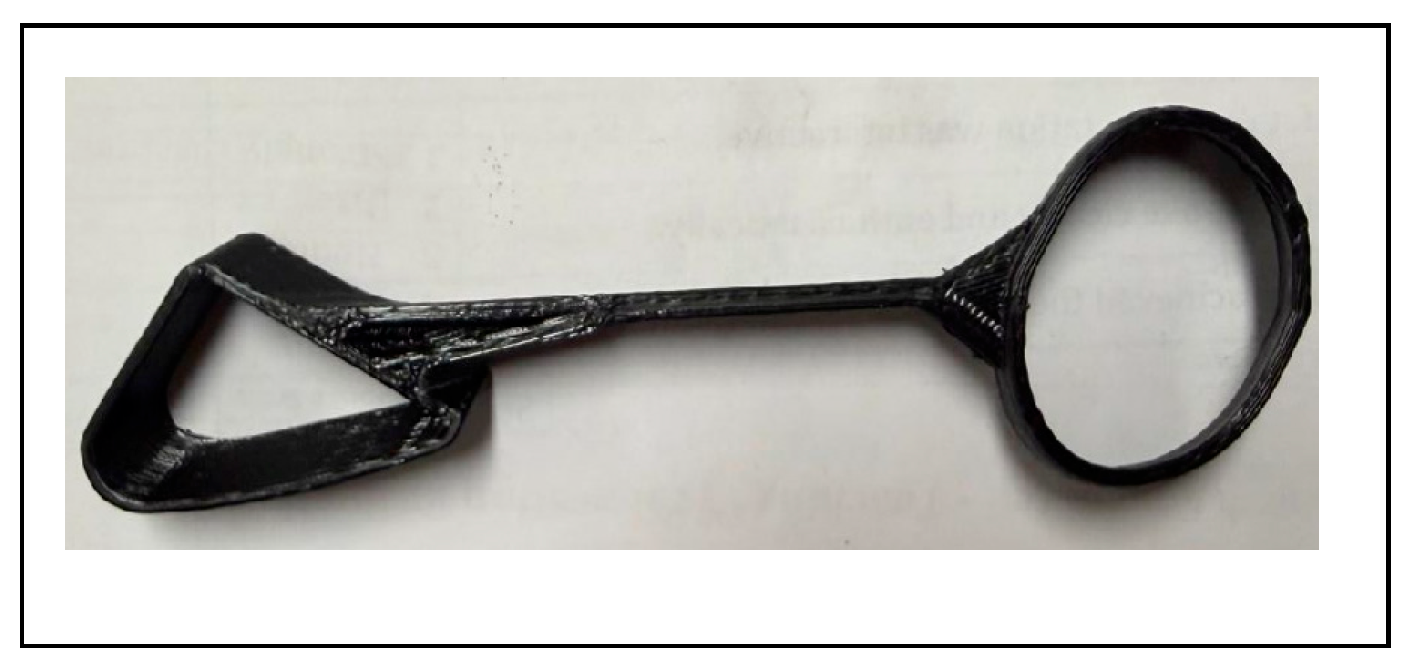
Table 1.
The process parameters used in all experiments.
| Parameter | Value |
|---|---|
| Layer height | 0.2 mm |
| Nozzle temperature | 200 °C |
| Bed temperature | 60 °C |
| Number of perimeter walls | 3 |
| Infill speed | 80 mm/s |
Table 2.
Mechanical Properties and Sustainability Metrics of FDM-Printed PLA Specimens.
| Metric / Property | Unit | |
| Mechanical Properties | Peak Load | N |
| Peak Stress | MPa | |
| Modulus | MPa | |
| Yield Stress | MPa | |
| Break Strain | mm/mm | |
| Break Energy | N-mm | |
| Mass | g | |
| Sustainability Metrics | Printing Time | mins |
| Energy Consumption | kWh |
Table 3.
Two-Way ANOVA Results-PLA (Infill Pattern and Density).
| Metric | Factor | η² | p-value | Significance |
|---|---|---|---|---|
|
Peak Load |
Infill Pattern | 0.366 | 0.0000 | Yes |
| Density | 0.460 | 0.0000 | Yes | |
| Pattern x Density | 0.065 | 0.4293 | No | |
|
Peak Stress |
Infill Pattern | 0.422 | 0.0000 | Yes |
| Density | 0.374 | 0.0000 | Yes | |
| Pattern x Density | 0.071 | 0.4974 | No | |
|
Strain at Break |
Infill Pattern | 0.647 | 0.0001 | Yes |
| Density | 0.030 | 0.3070 | No | |
| Pattern x Density | 0.111 | 0.5201 | No | |
|
Modulus |
Infill Pattern | 0.240 | 0.0005 | Yes |
| Density | 0.562 | 0.0000 | Yes | |
| Pattern x Density | 0.084 | 0.2876 | No | |
| Energy to Break | Infill Pattern | 0.465 | 0.0000 | Yes |
| Density | 0.316 | 0.0000 | Yes | |
| Pattern × Density | 0.086 | 0.3796 | No | |
|
Stress at Yield |
Infill Pattern | 0.402 | 0.0001 | Yes |
| Density | 0.395 | 0.0000 | Yes | |
| Pattern × Density | 0.066 | 0.6139 | No |
Disclaimer/Publisher’s Note: The statements, opinions and data contained in all publications are solely those of the individual author(s) and contributor(s) and not of MDPI and/or the editor(s). MDPI and/or the editor(s) disclaim responsibility for any injury to people or property resulting from any ideas, methods, instructions or products referred to in the content. |
© 2026 by the authors. Licensee MDPI, Basel, Switzerland. This article is an open access article distributed under the terms and conditions of the Creative Commons Attribution (CC BY) license (http://creativecommons.org/licenses/by/4.0/).
Copyright: This open access article is published under a Creative Commons CC BY 4.0 license, which permit the free download, distribution, and reuse, provided that the author and preprint are cited in any reuse.


