1. Introduction
Additive Manufacturing (AM) methods are rapidly establishing themselves as an alternative for mass production in the industry. The need to develop that align with swiftly changing market conditions, along with continuous revision demands due to ongoing product improvements and the concept of free design thinking, has driven she shift towards additive manufacturing due to lower mold costs and mold revision expenses. Among additive manufacturing methods, Fused Deposition Modelign (FDM) technology has gained significant popularity due to the cost-effectiveness of production machines and the widespread use of polymers in the industry. As this technology becomes more prevalent, ensuring that industrial products meet the expected quality characteristics has become a critical research and development topic. Although many studies have been conducted on production parameters, material compositions, and design parameters, there is a notable gap in research focused on the dynamic behaviour of products under load. Specially, there is a lack of studies on optimization the impact strength of the layer interface, which is the most critical area for products requiring high impact strength. Additionally, considering that existing engineering polymers like PLA, PP, ABS and PETG may fall sort in providing enough strength on their own, there has been a rapid increase for developing composite polymers. For example, engineering materials serve as the main matrix, and additives such as carbon fiber, glass fiber and kevlar fiber are incorporated to enhance quality of characteristics [
1,
2,
3,
4,
5,
6,
7,
8,
9,
10,
11,
12,
13,
14,
15,
16,
17,
18].
In this study, scientific research conducted to date has been thoroughly examined and detailed. The selected articles were reviewed based on their direct relevance and similarities in materials and methods. The study conducted by C. Wang et al. in 2024, samples were produced using PA filament at nozzle temperatures of 240, 245, 250, 255 and 260 C, as well as layer thickness of 0.1, 0.2 and 0.3 mm. The study examined wear resistance, tensile strength, and impact strength as well [
1]. In other study conducted by P.K. Mishra et al in 2024, impact, bending, and tensile behaviors of polyamide samples produced through 3D printing were investigated using experimental methods and finite element analyis. In this study, layer thicknesses of 0.1, 0.15, and 0.2 mm were used, and the samples were validated through finite element analysis after experimental production and testing procedures [
2]. B.A. Moreno-Nunez et al conducted a different study about FDM in 2024. In this study, the production of Onyx/aramid-based polymeric composites containing continuous carbon fiber was carried out, and the impact strength was investigated. The fiber angles were set at 0°, 45°, 90°, and 135° as production parameters, while the printing orientations were chosen as XY, XZ, XY45, and XZ45. The layer thickness was 0.1mm, and the infill pattern used was Gyroid [
3].
Another study was conducted by W. A. Khan e al. In the study, a comprehensive literature review was performed on the bending and impact strength of products produced using the FDM technique. The effect of different production parameters and materials on bending and impact strength were investigated and reported. The properties of the materials were listed and evaluated according to the literature [
4]. The production parameters for impact strength of carbon fiber (CF) reinforced PA6 material were investigated by P.K. Misra et al in 2023. Layer thicknesses of 0.1, 0.15 and 0.2 mm, as well as infill density of 80%, 85%, 90% and 95%, were considered as input variables, while the nozzle temperature was kept constant at 270 C° and the printing speed at 40mm/s [
5]. F. Calignano et al. produced and tested impacts samples using filament made from nylon 612 with %20 carbon fiber added. Linear filling (%100 density) and honeycomb filling (15 % density) were considered as variables, and the printing orientations used were XY and XZ. The nozzle temperature was set at 230 C°, the printing speed at 35 mm/s, and the layer thickness at 0.2 mm [
6]. Another study involving carbon fiber-reinforced nylon materials was conducted by M. Abas et al. Surface roughness analyis were performed on carbon fiber-reinforced nylon composite products. The test samples were produced using PA12 material, and the variables considered included layer thickness, printing speed, number of walls, infill density, printing orientation, infill angel, nozzle temperature, and bed temperature. Notched impact test samples were produced, and the surface roughness parameters were measured [
7].
The thermal and mechanical properties of multi-layer coated products made from carbon fiber-based nylon composites produced with a 3D printer were investigated by H. Chen et al. In the study, Nylon 12 – CF composite filament containing 25% fiber was used. After production, a copper mesh layer was applied to the sample as the base material, followed by the addition of a carbon fiber layer [
8]. In another study examining the mechanical properties of samples produced using injection molding method, PA-CF composite was investigated X. Wang et al. The mechanical properties of samples produced using the injection molding technique with PA-CF composite materials were examined. Injection temperature and pressure were determined as variables in the study. Additionally, pure PA, PA-10CF, PA-20CF and PA-30CF reinforced products were produced [
9]. In the literature, numerous studies have been conducted using various commercial filament brands. In this context, H.R. Vanaei et al examined the strain ratio, mechanical properties, and damage analysis of the fracture surfaces in products produced with short carbon fiber-reinforced nylon filament using a 3D printer. Onyx filament was used in the study, and the samples were produced. The platform temperature and printing speed were considered as variables in the study [
10].
In another study, I.M. Alafiri et al worked-on nylon material with added carbon/glass fibers. The study involved a performance analysis of nylon/glass fiber and nylon/carbon fiber products produced with a 3D printer. The printing angle was considered as a variable, while other properties were kept constant and evaluated in terms of mechanical characteristics [
11]. In their study, L. Tavara et al. investigated the effects of anisotropy and aging processes on the mechanical properties of short carbon fiber-reinforced nylon composite structures. Experimental procedures were carried out using two different infill configurations and four separate aging periods [
12]. A study on effects of continuous carbon fiber and kevlar fiber was conducted by M.A. Caminero et al. Continuous carbon and kevlar fiber-reinforced nylon composites were produced using the FDM technique, and their impact strength was investigated. In the study, reinforced type, layer thickness, build orientation were considered as variable [
13]. The study on impact resistance and fracture analysis was conducted by I. Yusuf et al. In the study, glass fiber and carbon fiber-reinforced samples were produced under fixed topology and production parameters. The nozzle temperature was considered as a variable, with PA6 material produced at a nozzle temperature of 275 C° and PA6-GF produced at 265 C°. The sample were printed in the XY orientation [
14].
The literature review revealed that most studies focused on the XY and XZ orientation, with no direct studies specially addressing the ZX direction, which provides anisotropic properties. Additionally, the parameter concerning the number of outer walls used in the study is an area that is lacking in the literature. Based on this, the research focused on critical orientation and specific parameters. In the additive manufacturing process, particularly in the ZX orientation, which is considered the critical printing orientation, exhibit significantly lower mechanical properties compared to those produced in other orientations. For example, in the 30% carbon fiber-reinforced PA6 material provided by BASF Coorp., the tensile strength value in the XY printing orientation is reported as 46.4 MPa, while the sample produced in the ZX orientation under the same conditions is reported as 12.2 MPa. Similarly, regarding impact strength, the impact strength for samples produced in the XY direction without notches is 39.6 kJ/m
2, whereas for samples produced in the ZX direction, this value is only 3.8 kJ/m
2. The same situation exists for PA and PA CF15 materials as well as [
15,
16,
17].
While the printing orientation can be determined based on load for industrial products, this poses significant problems for products subjected to multi-directional forces. It is essential to enhance the mechanical properties of products in the critical ZX printing orientation through production parameters, thermal processing, and other geometric factors. In this research study, impact strength testing was conducted on test samples produced using commercial filaments, where PA6 serves as the primary matrix material, reinforced with carbon fiber and glass fiber. Parallel impact forces were applied to the layers, which is the most critical situation for impact strength, and the layer adhesion performance was detailed. The production parameters, including layer thickness, nozzle temperature, and the number of outer walls, were considered as variables, while the duration of post-processing heat treatment was also treated as an independent variable. The dependent variable was defined as impact strength. Furthermore, the products were examined and detailed from the perspective of fracture mechanics by SEM. The results were optimized using the Taguchi analysis, a statistical experimental design method, and the performance of the method was investigated through validation experiments. Subsequently, full factorial experiments were predicted and validated.
2. Materials and Methods
The study utilizes products from the industrial filament manufacturer BASF Coorp. The materials used include BASF’s Ultrafuse PA6 as the base material, Ultrafuse PA GF30 for glass fiber-reinforced PA, and Ultrafuse PA6 CF15 for carbon fiber-reinforced PA. The technical properties for the product produced in the ZX orientation are provided
Table 1 below.
The study utilized a statistical experimental design method. Initially, a factor analysis was conducted, leading to a detailed evaluation of all parameters in the production system. Based on the literature review and scientific research, effective parameters were identified [
1,
2,
3,
4,
5,
6,
7,
8,
9,
10,
11,
12,
13,
14,
15,
16,
17,
18]. The level values for these parameters were determined, and an experimental table was created. The table include 4 factors, each with 3 levels. Under normal conditions, 3^4=81 experiments would be required; however, by using the Taguchi optimization method, an L9 orthogonal array was selected, resulting in a total of 9 planned experiments. To account for variations due to uncontrollable factors in the production system, each experiment was repeated 3 times, and average values were used. There control groups were established in the study: pure PA6, PA6 with %30 carbon fiber reinforcement, and PA6 with 15% glass fiber reinforcement. For each control group, 27 experiments and their levels are presented
Table 2, while the experimental table created using the statistical experimental design method is shown in
Table 3.
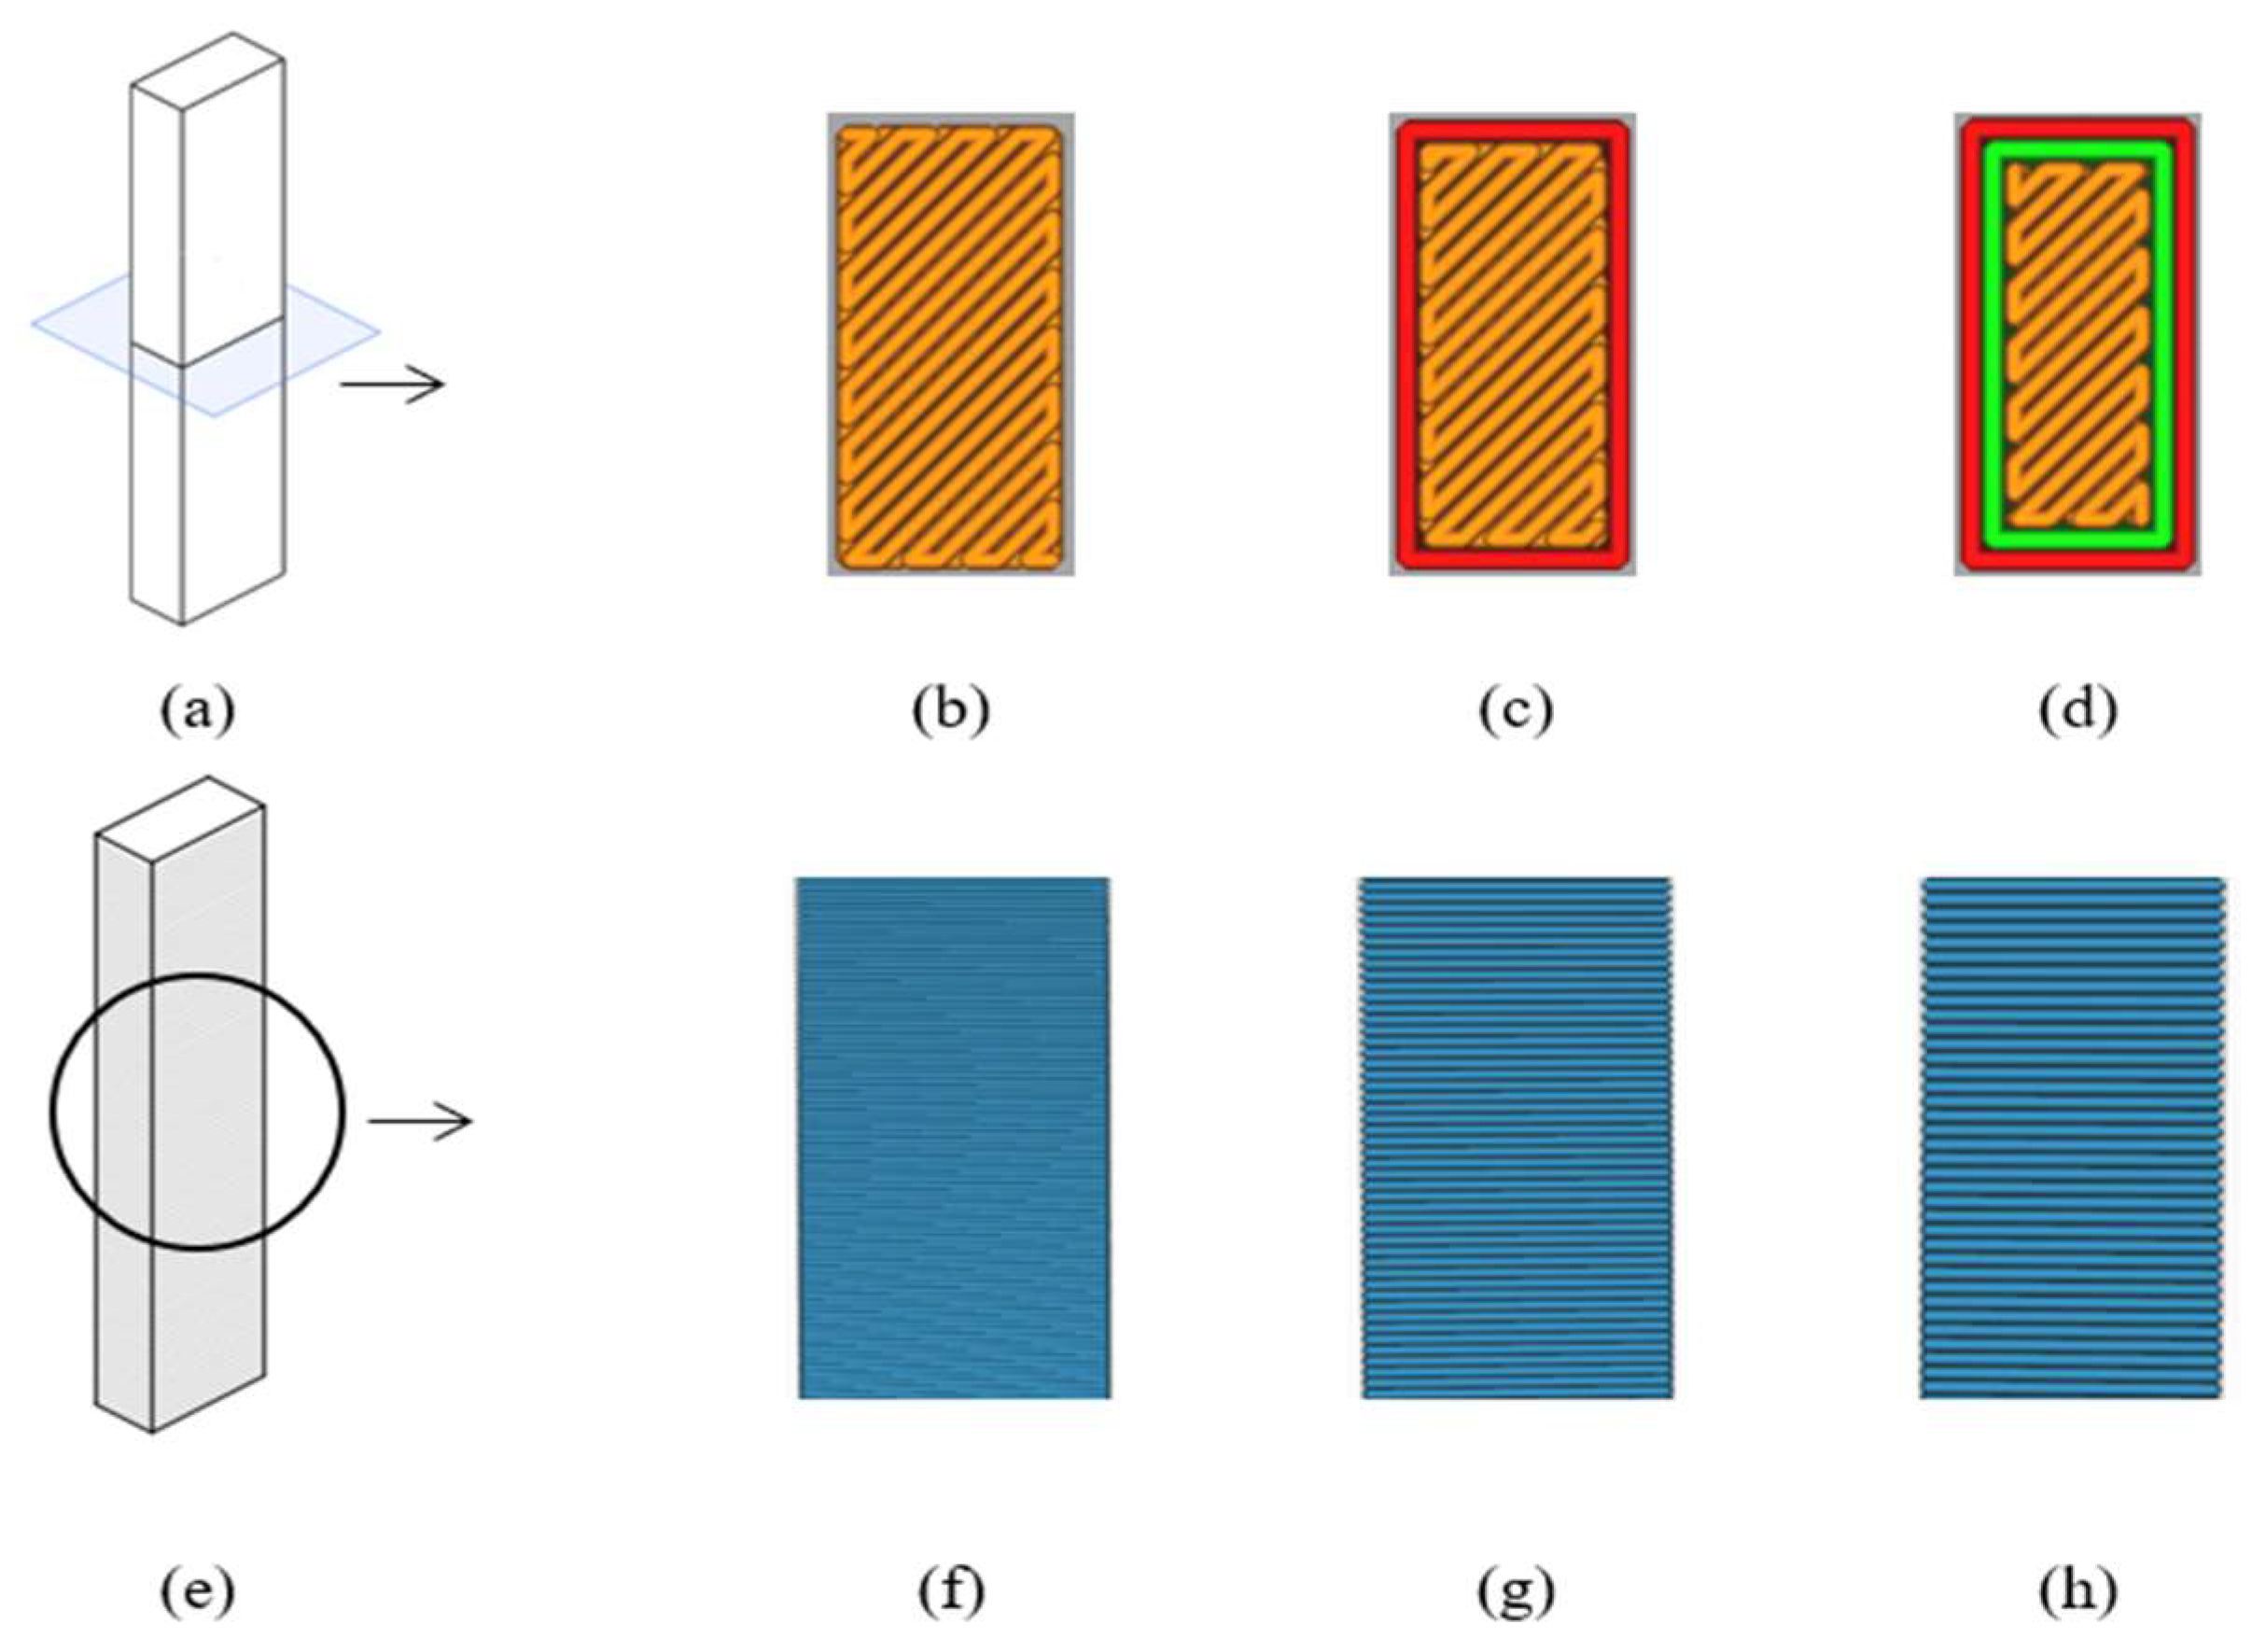
The test samples were produced according to ASTM 5256-10 standards. The dimensions of samples were set at 12.7x63.5x6.35 mm. To obtained for parameters such as wall thickness during the testing process, unnotched samples were prepared. The figures of prepared samples along with the production parameters of layer height and wall number are presented
Figure 1 and
Figure 2.
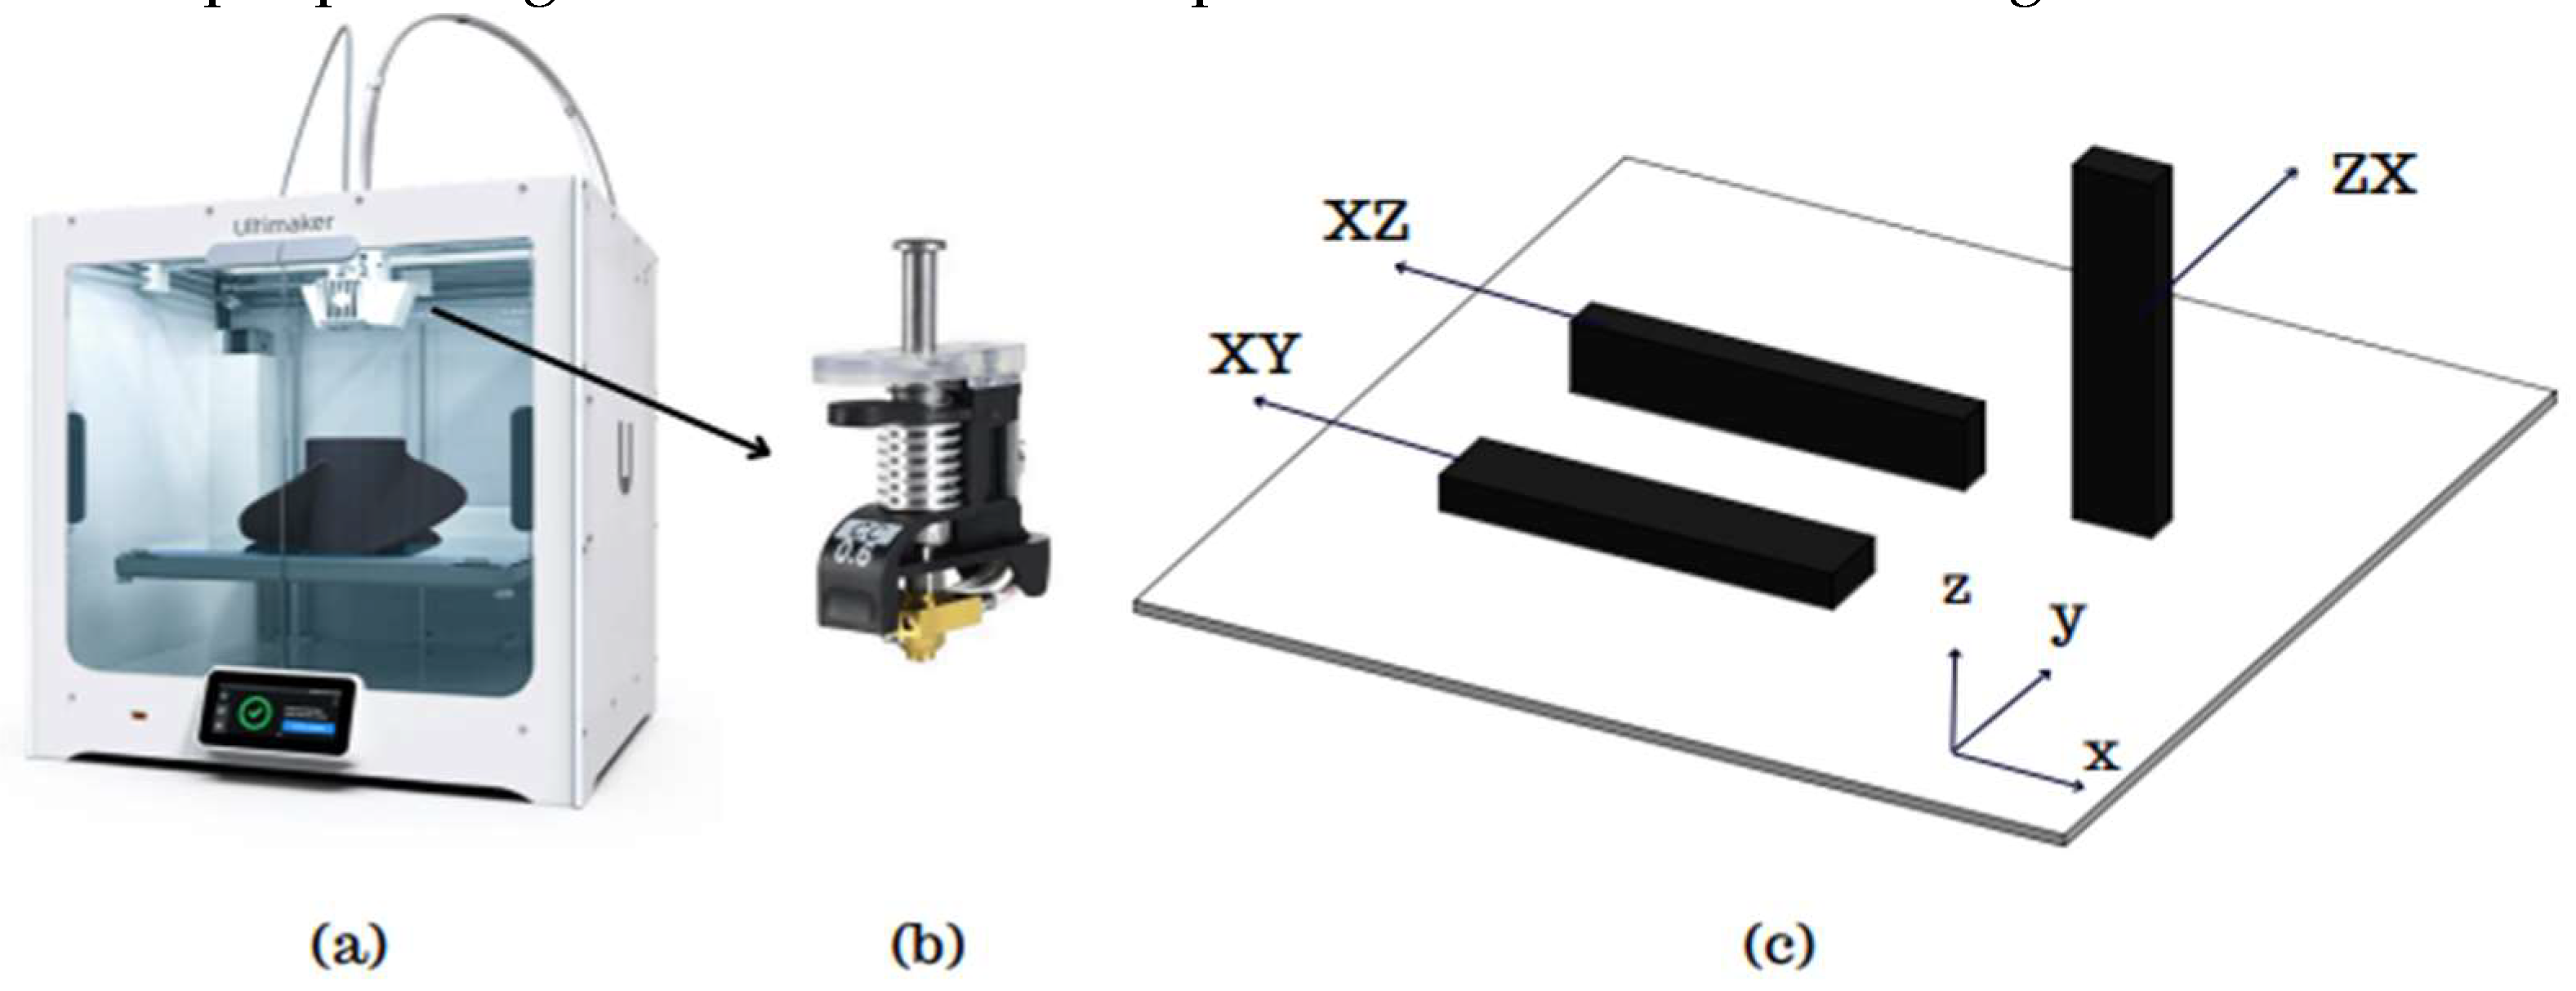
The test samples were produced using the Ultimaker S5 printer, which has a printing volume of 330 x 254 x 300 mm and features a dual extruder capable of composite production. A 0.6 CC nozzle was used for printing the composite products. Prior to production, the filament was dried in for 12 hours. During the printing, only the upper cover of the printer was left open while the cover was kept close. To ensure consistent flow before each sample’s printing, a specific period of priming was conducted.
The design of the samples was created using SolidWorks 2020, and the production planning was carried out using Ultimaker Cura 5.3.0. In addition, to the variables set during production planning, several production parameters were kept constant. The constant value of initial layer height, infill density, infill pattern, build plate temperature, flow rate, print speed, regular fan speed was set to 0.25 mm, 100%, lines, 70 °C, 100%, 40 mm/s and 50%, respectively. The 3D printer, nozzle, and standard sample printing orientation used for production are shown in
Figure 2.
For each experimental condition, production was repeated three times and numbered. After a general examination of the samples, they were subjected to heat treatment according to the experimental conditions. The post-processing heat treatment was applied at temperature of 80 °C with holding times of 0, 80, and 160 minutes. Each samples group was then numbered and prepared for testing and other analysis.
The Izod Impact Test was conducted using samples prepared according to ASTM D256-10 standards on an Alarge Brand pendulum impact testing machine. The samples were tested using a 7.5 J hammer, and the energy absorbed by each sample was recorded via the device. In the impact testing machine, the hammer’s position at the highest point and the energy at the final point were calculated, allowing for the total energy expenditure, E
T, to be determined using Equation 1. The amount of total energy per unit cross-sectional area, or impact strength value, E
C, was calculated using Equation 2 [
13].
where, E
T represents the total energy (J), m denotes mass, g is the standard gravitational acceleration, h0 is the initial height, hf is the final height, E
C indicates impact strength [kJ/m
2], w is the sample width, and t is the sample thickness. Initially, in the impact testing machine, energy losses due to bearing friction and air resistance were measured and included in the calculations.
Impact strength calculations were repeated three times for each experimental condition, and the average results were taken. The next step involves applying the Taguchi optimization method. In this optimization method, the first step is to calculate the Signal to Noise (S/N) ratios for each experiment. There are three different methods for calculating the S/N ratio: 1. ‘Larger is Better’, 2. ‘Smaller is Better’, and 3. ‘Target Value is Best’. In this study, since the highest value is preferable for impact strength, the S/N ratios were calculated using the ‘Larger is Better’ approach with Equation 3 and presented Table. During the evaluation phase, the value with the highest S/N ratio is the desired value and will be considered in the ranking. Additionally, predicted results for other experimental conditions are obtained using Equation 4 based on the values obtained.
where i=1,2,3…...n, Y is output values of response.
where ƞ
m = the overall mean of signal-to-noise ratio, f=the number of factors, ƞ
i = the mean of signal-to-noise ratios at the optimal level of each factor i.
To analyze the factor effects, S/N impact graphs, S/N effect graph, prediction graph for the 81 experiments, and 3D surface plots to visualize interaction effects were created and detailed Optimal values were found for each material composition, and the results were examined through validation experiments.
In the final section of the study, a fracture analyis was conducted. Initially, the fracture surface of the samples was examined in their entirely using a Keyence VHX-900F optical microscope. Subsequently, a Hitachi SU-1510 Scanning Electron Microscope (SEM) was used for the damage analysis. Detailed images were taken post-coating, and discussion were held regarding the fracture surfaces, defects, and their causes.
3. Results and Discussion
In the tests, fracture energies were first obtained, from which fracture values were derived. Both pure and composite samples were assessed for impact energy and impact strength values. Overall, examining the results table show that the highest impact energy was obtained from the pure PA6 sample, followed by the PA6 GF30 sample, while the lowest was observed in the PA CF15 sample. Literature reviews indicated that the sample were generally produced in orientation other than the critical ZX orientaiton. Each experiment was repeated three times under the same conditions, and the results were calculated as the arithmetic mean. To obtain impact energy values are listed in
Table 5.
At this step, the impact strength values for each sample and experimental condition have been calculated using Equation 2. And the results of impact strength are listed in
Table 6. It was observed that the highest impact strength value was achieved in the pure PA6 sample in experiment 8, with a value of 8.990 kJ/m
2. In the experimental condition, the parameters are A3B2C1D3, where these values correspond to a nozzle temperature of 275 °C, a layer thickness of 0.3mm, an outer wall count of 0, and a post heat treatment application duration of 160 minutes. It is noted in the manufacturer’s product datasheet that the impact strength in the ZX orientation printing during production is 3.2 kJ/m
2 in the notched impact test [
15]. The manufacturer has set the nozzle temperature at 245 °C for the produced samples in the testing process. In this study, a higher nozzle temperature and additional heat treatment process were applied. In another study, it was observed that the impact strength in the XY printing orientaiton, depending on nozzle temperature, is approximately around 6 kJ/m
2 [
1]. The reason for the effect of the printing orientation on mechanical properties is related to layer adhesion. In the ZX orientation, the load on the woven layers is applied parallel to the layers, resulting in lower mechanical properties. For example, a study conducted by F. Calignano et al. has shown significant differences in impact strength between the XY and ZX orientation [
6].
The highest second impact strength value in this study was obtained in the forth experiment produced with PA6 GF30 material, measuring 8.101 kJ/m
2. The sample was produced under the parameters of 260 C nozzle temperature, 0.15mm layer thickness, 1 outer wall count, and a post heat treatment duration of 160 minutes, labeled as A2B1C2D3. According to the product’s datasheet, a notched izod impact test in the ZX orientaiton yielded an impact strength of 2.6 kJ/m
2. In contrast, the same sample produced in the XY orientation under identical conditions had an impact strength of 38.4 kJ/m
2. The manufacturer’s datasheet also indicates that mechanical properties are orientation-dependent; for instance, while the tensile strength in the XY production direction is 78.3 MPa, it drops to 14.9 MPa in the ZX direction. When compared to pure PA6, these values are approximately 10% lower. However, literature studies show that the results for GF- reinforced PA materials in XY and XZ orientations are significantly higher than those for pure PA6. For example, in a study conducted by B.A. Moreno-Nunez et al., it was reported that in PA/CF materials, different production parameters and conditions achieved impact value of 113.4 kJ/m
2 in the XY orientaiton [
3].
In the carbon fiber (CF) reinforced PA6 material, the lowest impact strength value was obtained under the conditions of the seventh experiment, measuring 6.258 kJ/m
2. This value was achieved with a nozzle temperature of 275 °C, a layer thickness of 0.15 mm, 2 outer wall count, and an 80-minute post-heat treatment duration. When compared to pure PA6 material, this value is approximately 30% lower, while it is about 22% lower compared to PA6 GF30 material. However, according to the datasheet provided by the manufacturer, this value was initially 2.6 kJ/m
2, but experimental results reached 6.258 kJ/m
2, representing an increase of approximately 2.4 times [
17].
Mechanical properties indicate that if the products had been printed in the XY orientaiton, the expected ranking would be PA CF15 > PA6 GF30 > PA6. However, in the ZX orientaiton, which is the critical printing orientation, the ranking observed was PA6>PA6 GF30>PA6 CF15. The reason for this situation is explained in detail in the damage analysis section. For example, a study in the literature evaluated these three materials in term of the impact energy they absorbed. It was reported that the PA/GF composite stored 18.6% more energy than the PA/CF material and 210.56% more energy than the PA6 material. Thus, in this study, the ranking was also stated as PA6/GF>PA6/CF>PA6 [
14]. Mechanical properties vary depending on different production methods and the parameters associated with each method. For example, in a study conducted by Wang et al., PA-CF materials were produced using injection molding techniques varying additive ratios, and combinations of PA-30CF, PA-20CF, PA-10CF, and PA were tested. The PA-30CF material achieved a tensile strength of approximately 230 MPa, while the PA-20CF material reached around 200 MPa. In contrast, the PA-10CF material had a tensile strength of about 125 MPA. Pure PA material, on the other hand, exhibited a tensile strength of approximately 50 MPa [
9]. These values are significantly higher than those of samples produced with 3D printing techniques, especially for PA/CF combinations. However, the value for pure PA material is approximately similar when produced using 3D printing. In the literature, for example, a study reported that the tensile strength of PA/CF material produced via 3D printing reached values of 89.3 MPa [
10]. In at study focused on the production of PA6 material using a different manufacturing technique, Selecting Laser Sintering (SLS), materials with 30% glass bead and 10% glass fiber were produced. The highest tensile strength obtained was approximately 85 MPa [
18]. This indicates that comprehensive research and development efforts are necessary for products produced with 3D printing technology.
In the study, after obtaining the results, an analysis was conducted using the Taguchi method, which is one of the statistical experimental design methods widely used in engineering applications. Through the Taguchi analyis, the signal-to-noise (S/N) ratios for each experimental condition with different materials were calculated and graphed. The analyis was initially performed for the pure PA6 material. In the optimization of impact strength, the ‘Larger is better’ technique was used. In terms of S/N ratios, the experiment with the highest S/N ratio is considered the most significant. The S/N ratios obtained from the experimental results for the PA6 materials are presented in
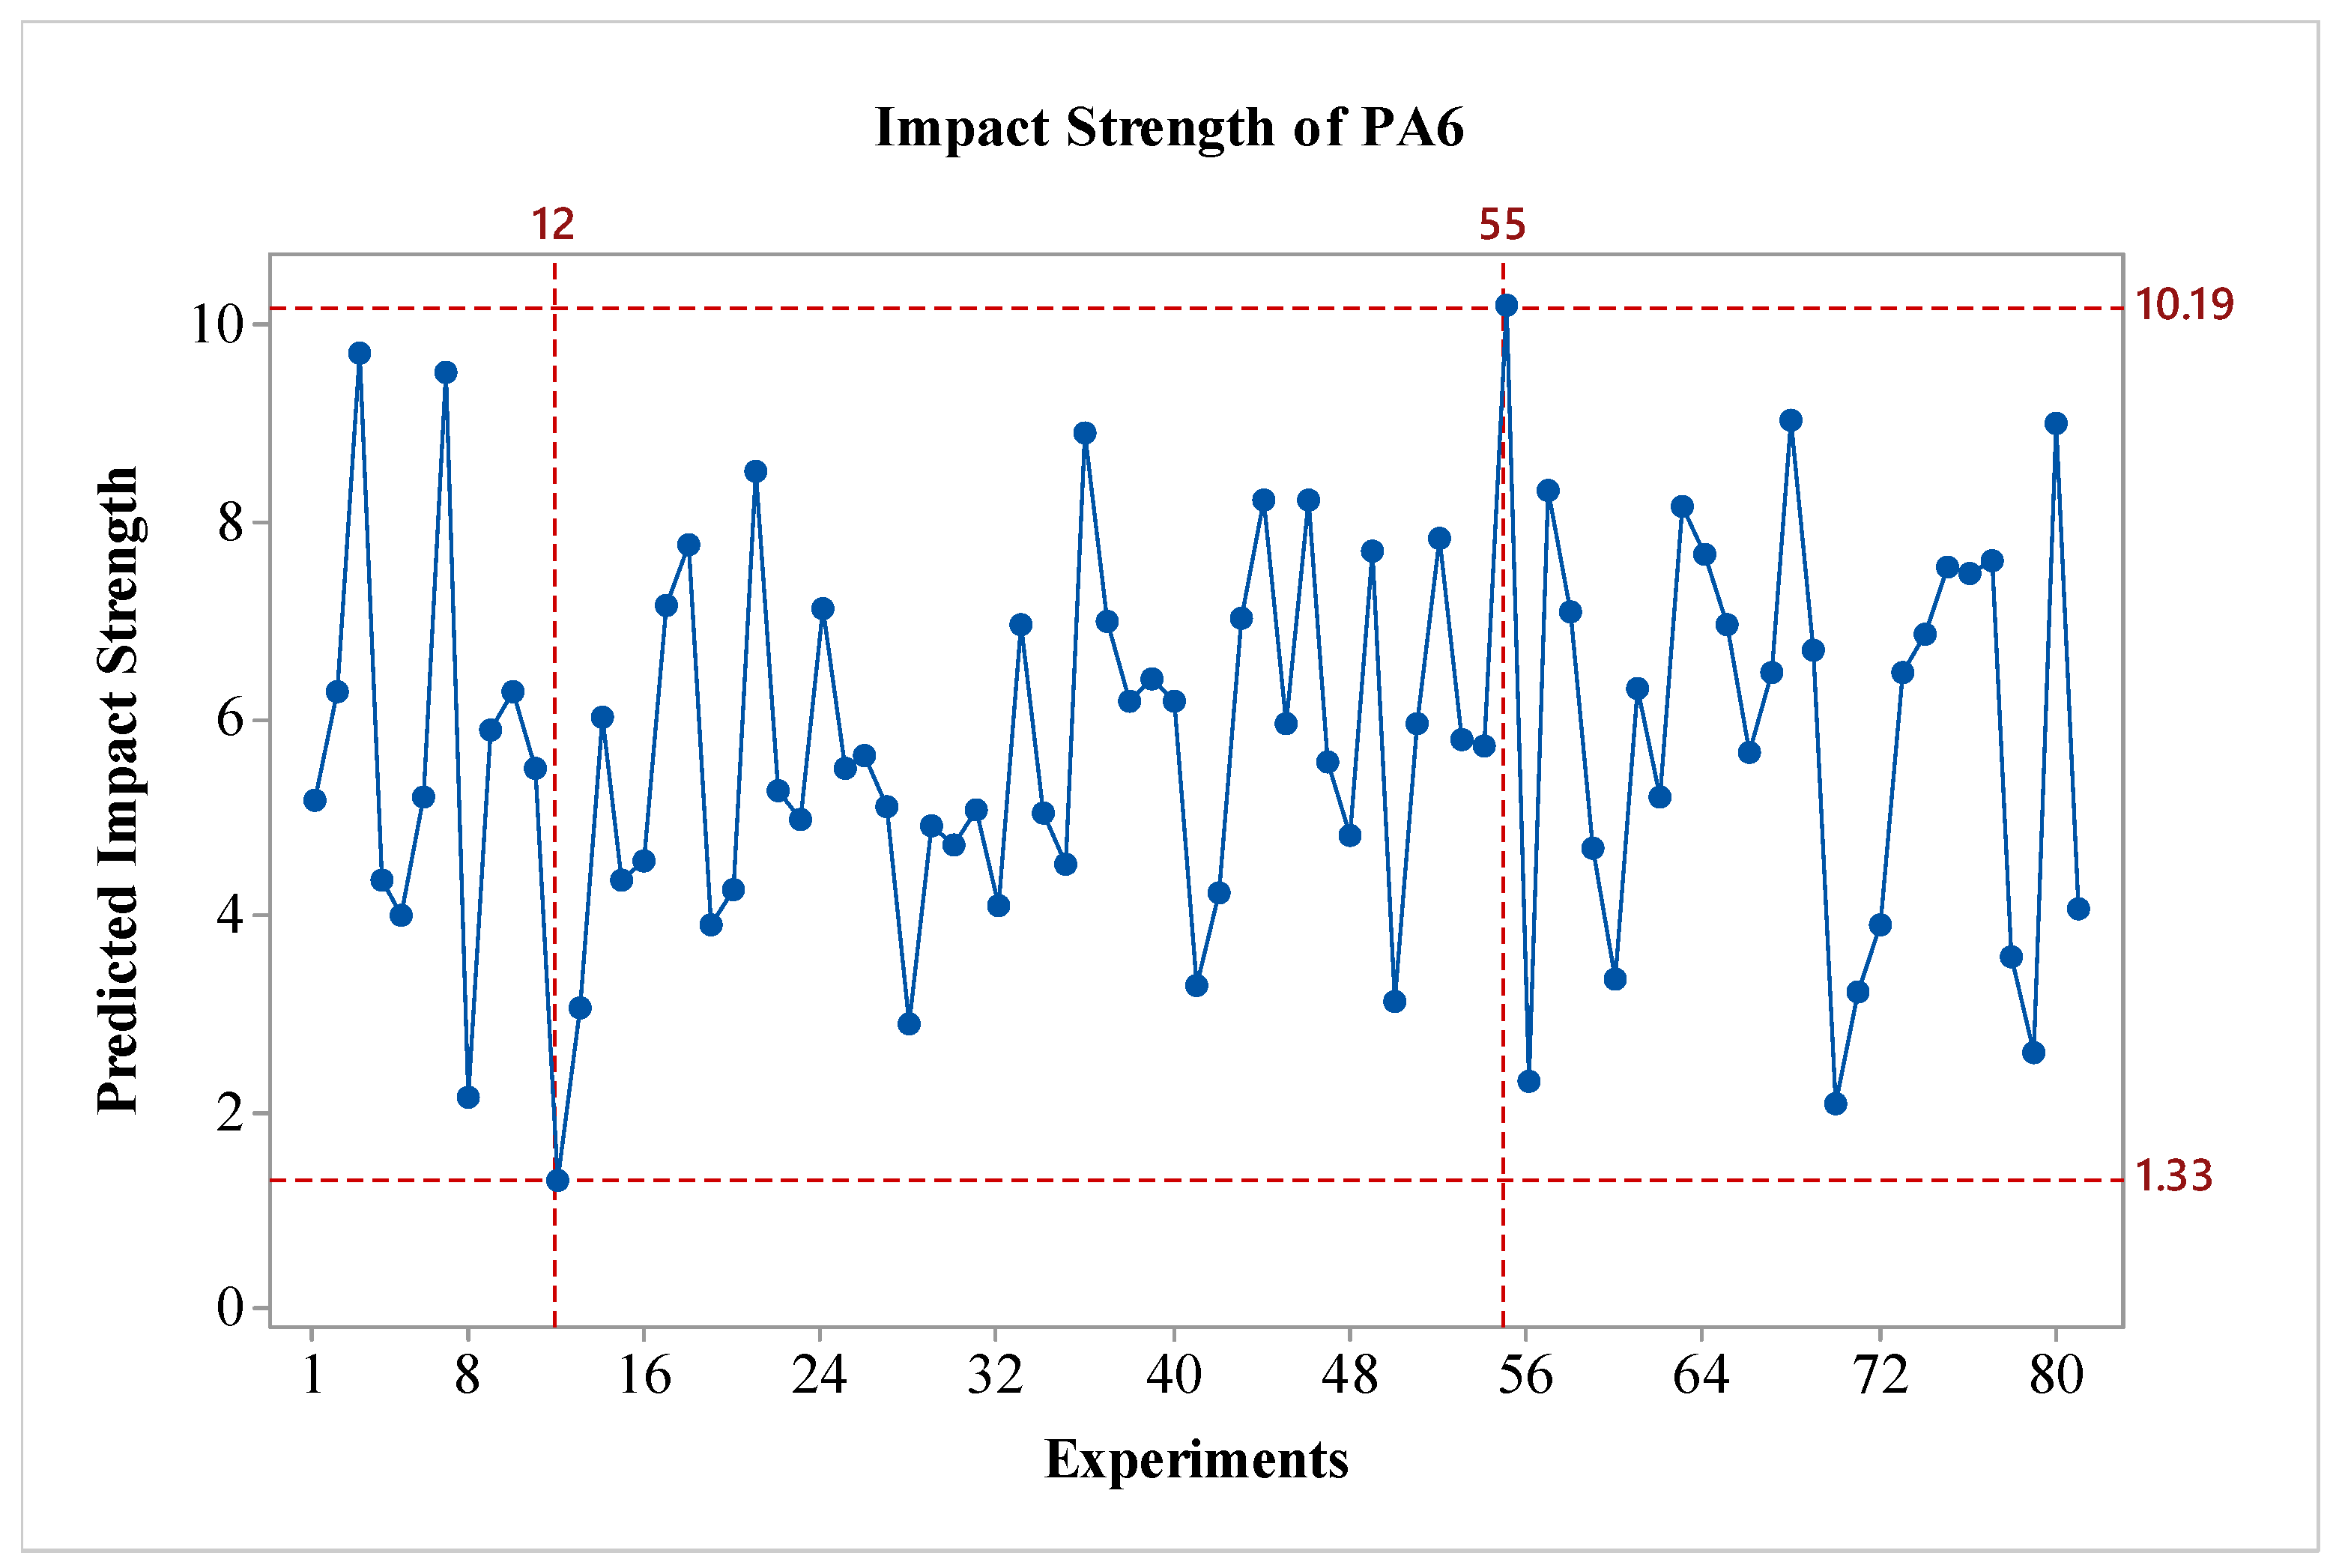
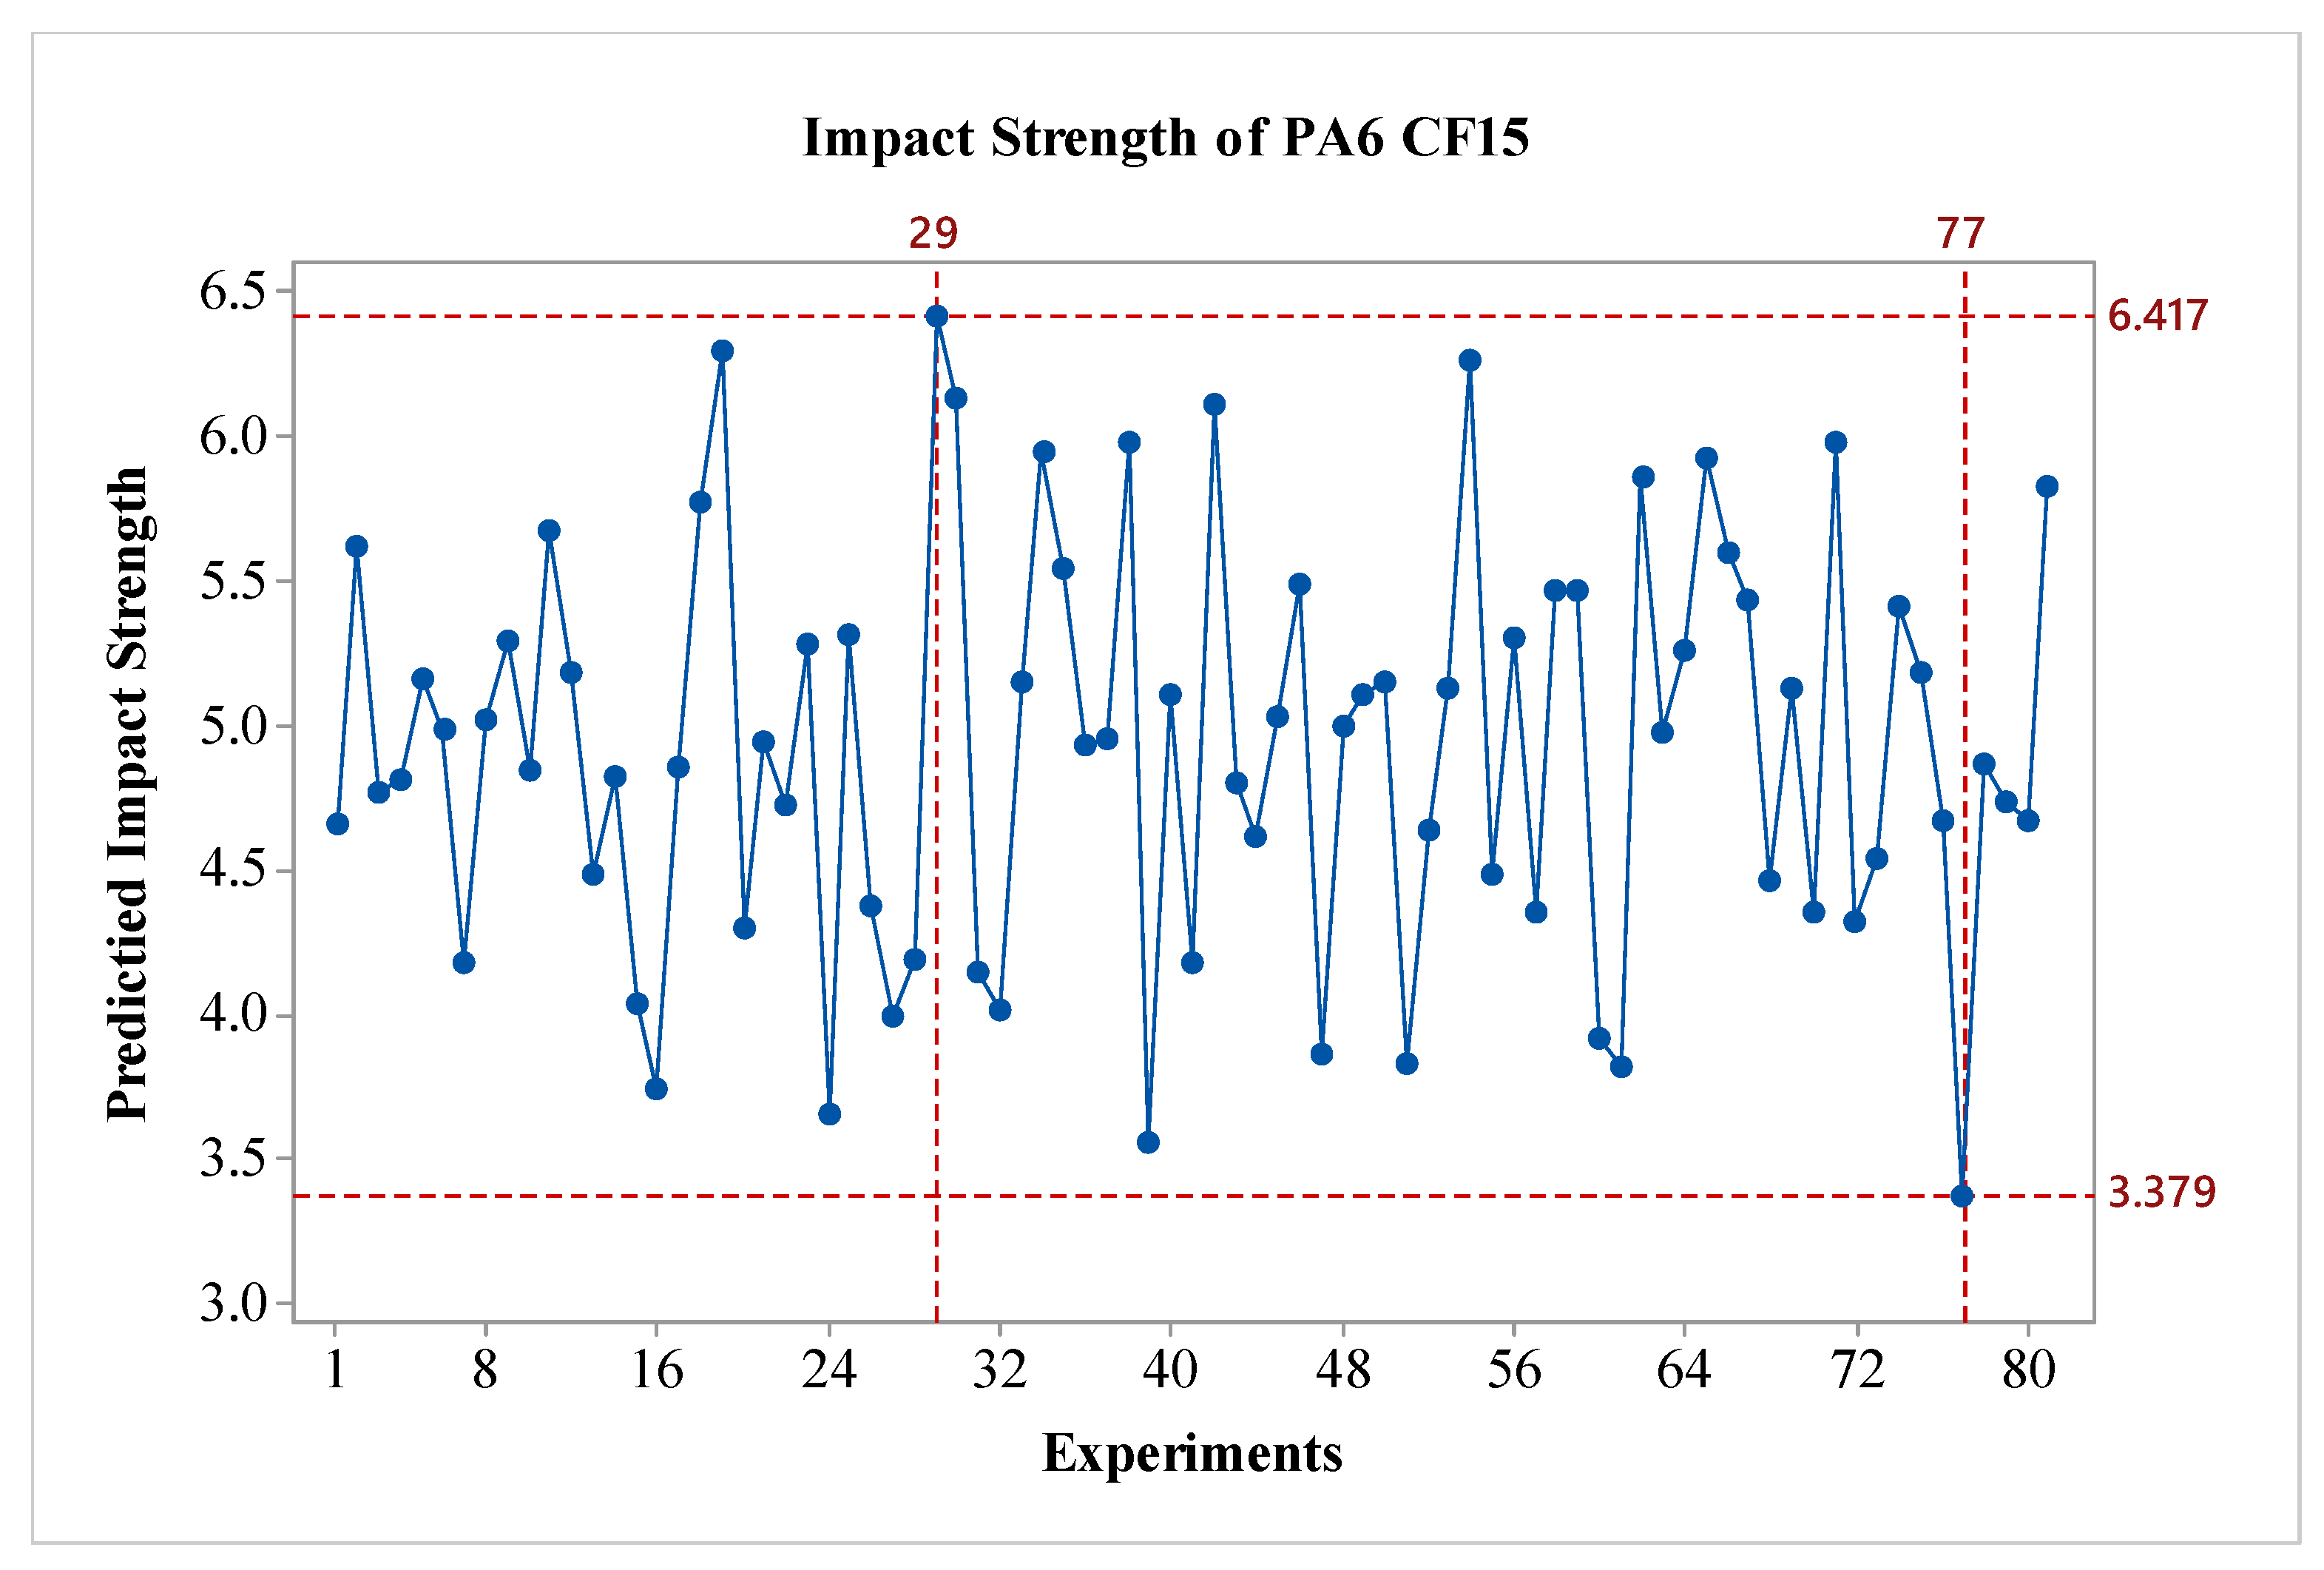
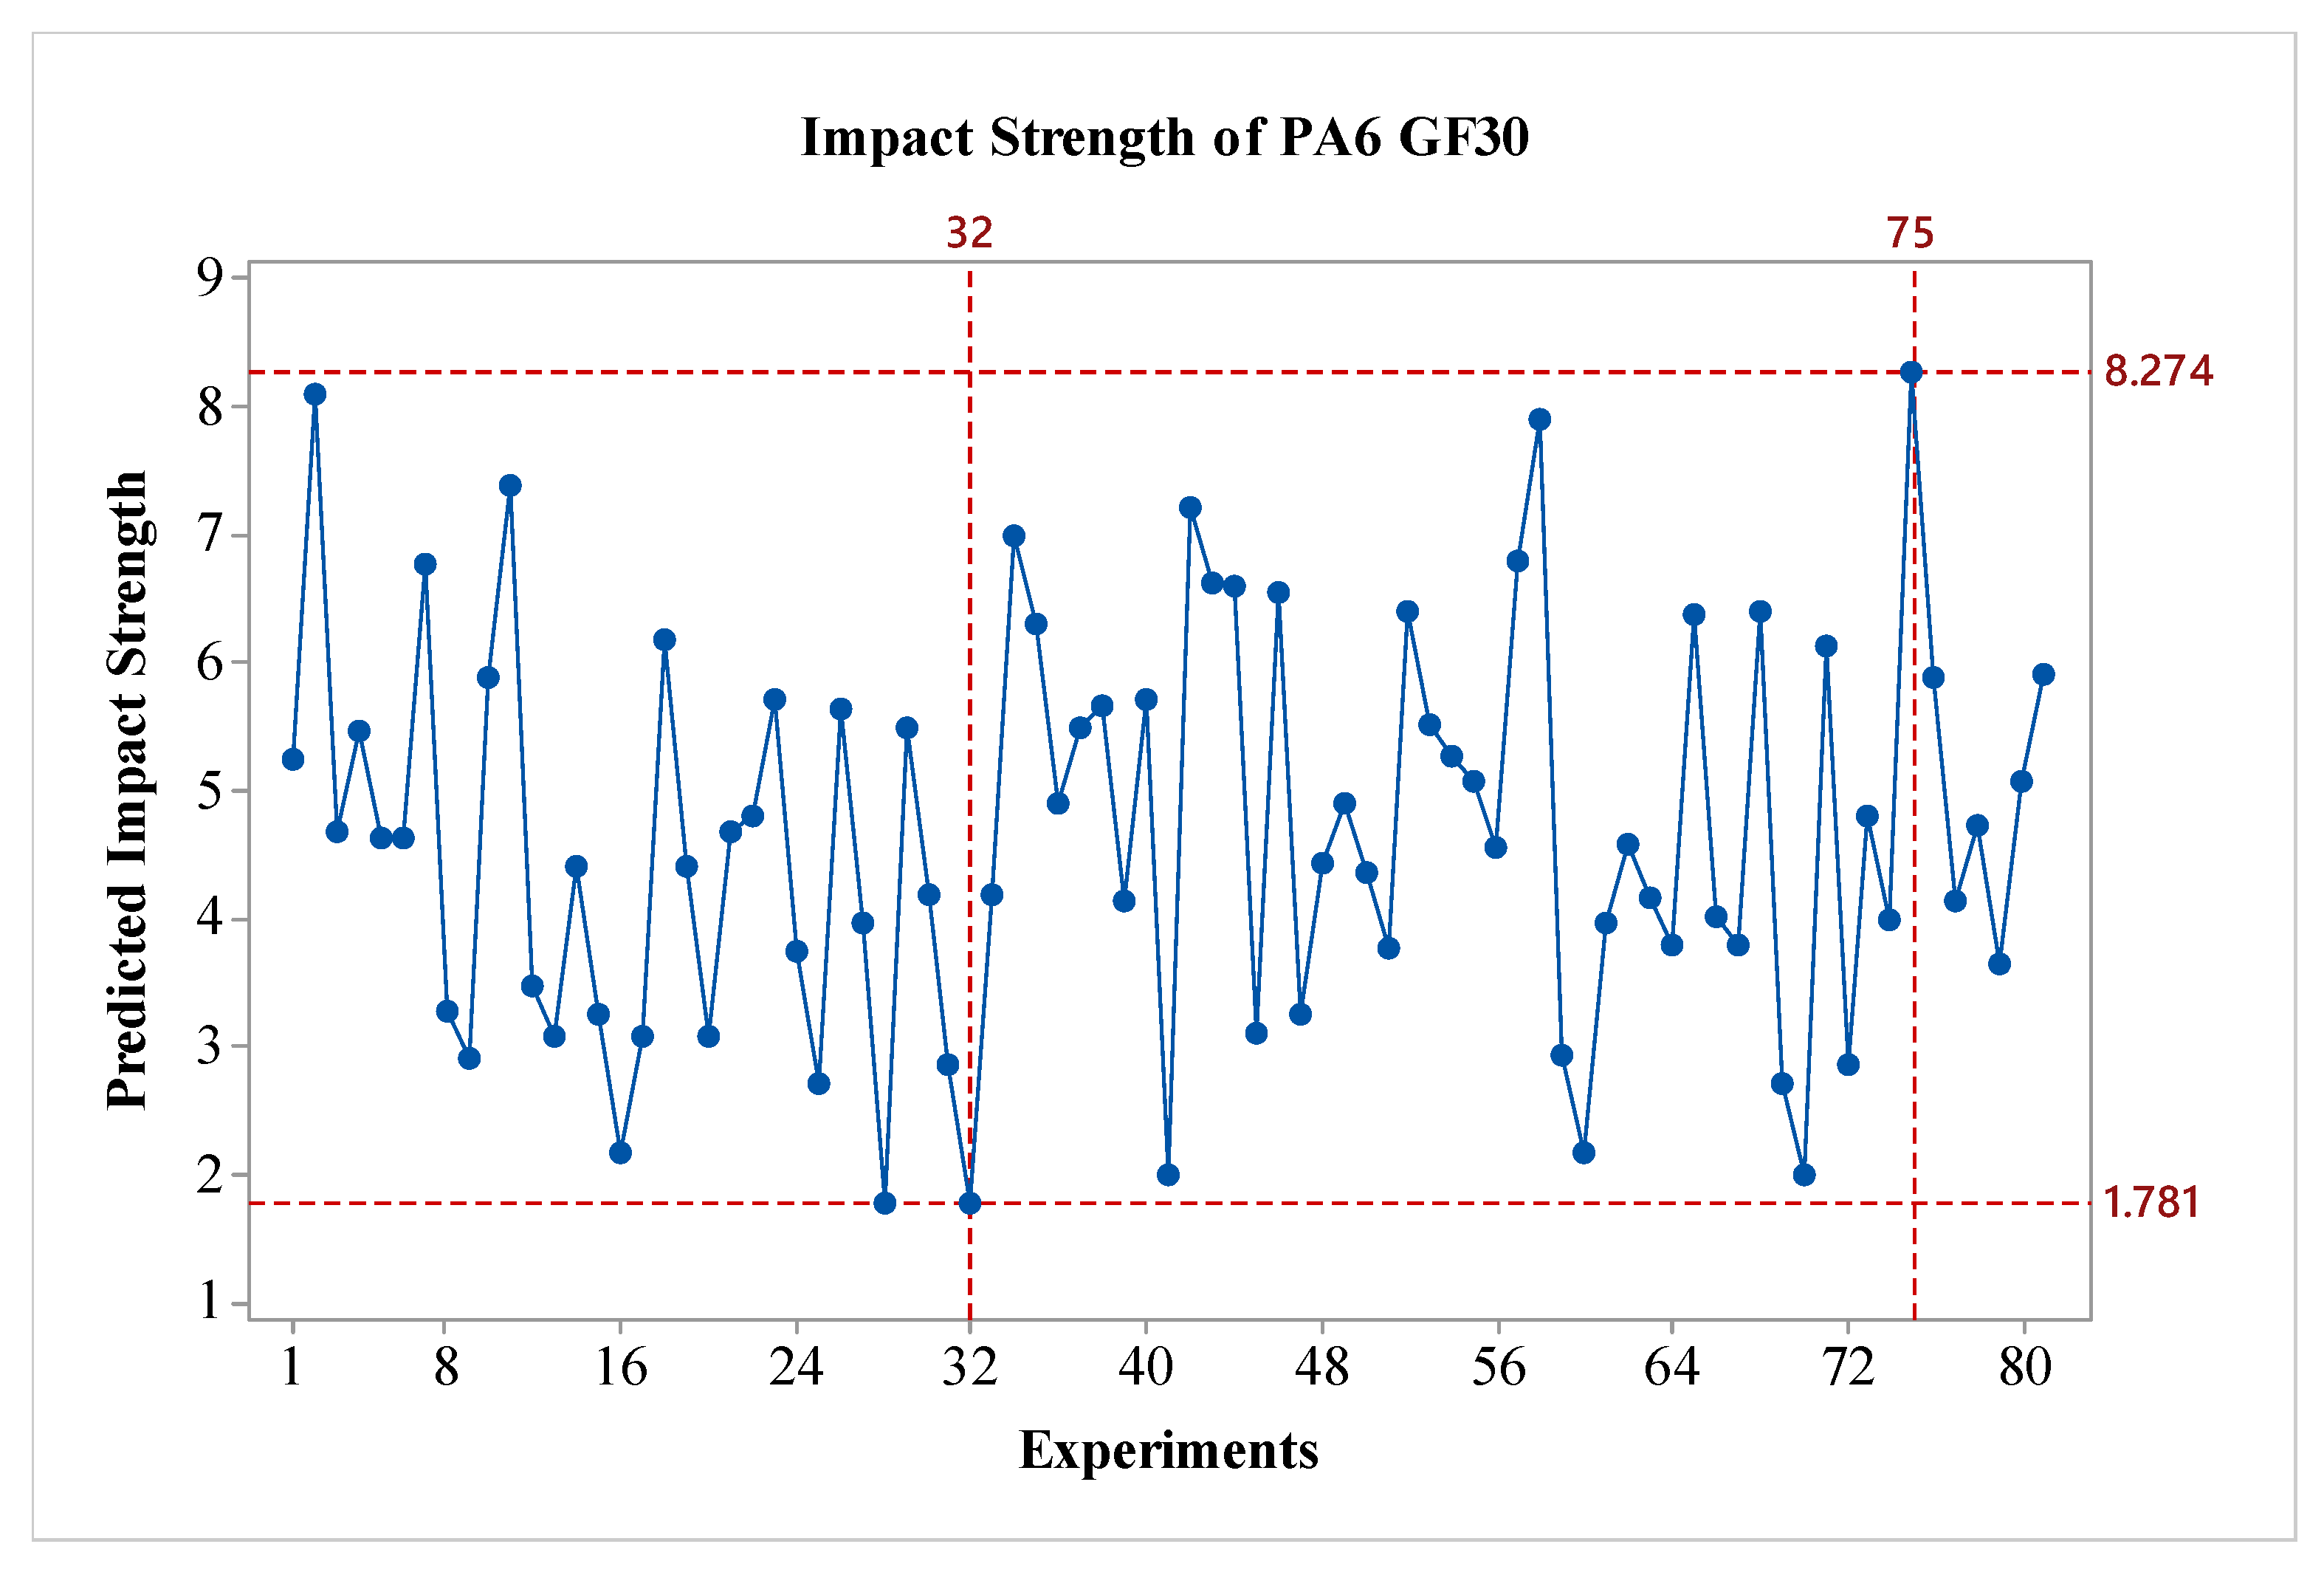
Figure 3. As shown in the figure, for all factors expected parameter C, the impact strength values increase as a factor level are raised. When considering the effects, it is observed that factor A, and D are the most influential, while factor B is also effective, albeit to a lesser extent compared to A and D. Factor C shows minimal effect on the results. Regarding the outer wall count, it is evident that it has a weak effect on the impact strength of PA6 materials. In terms of S/N ratios, the optimal parameters for PA6 material are identified as A3B3C2D3, which correspond to a nozzle temperature of 275 °C, a layer thickness of 0.45 mm, 2 outer wall counts, and post-heat treatment duration of 160 minutes. For the worst-case scenario, it is observed that the A1B1C1D1 experiment corresponds to the lowest performance. Since a fractional factorial design method was used, 81 experiments were estimated using the Taguchi method's prediction technique. The predicted results are shown in
Figure 4. As seen in the figure, the difference between the highest and lowest value in the experimental design is 8.86 kJ/m
2, indicating the effect of the factors and levels used in the experiment. The values for the best and worst case are presented in
Table 7.
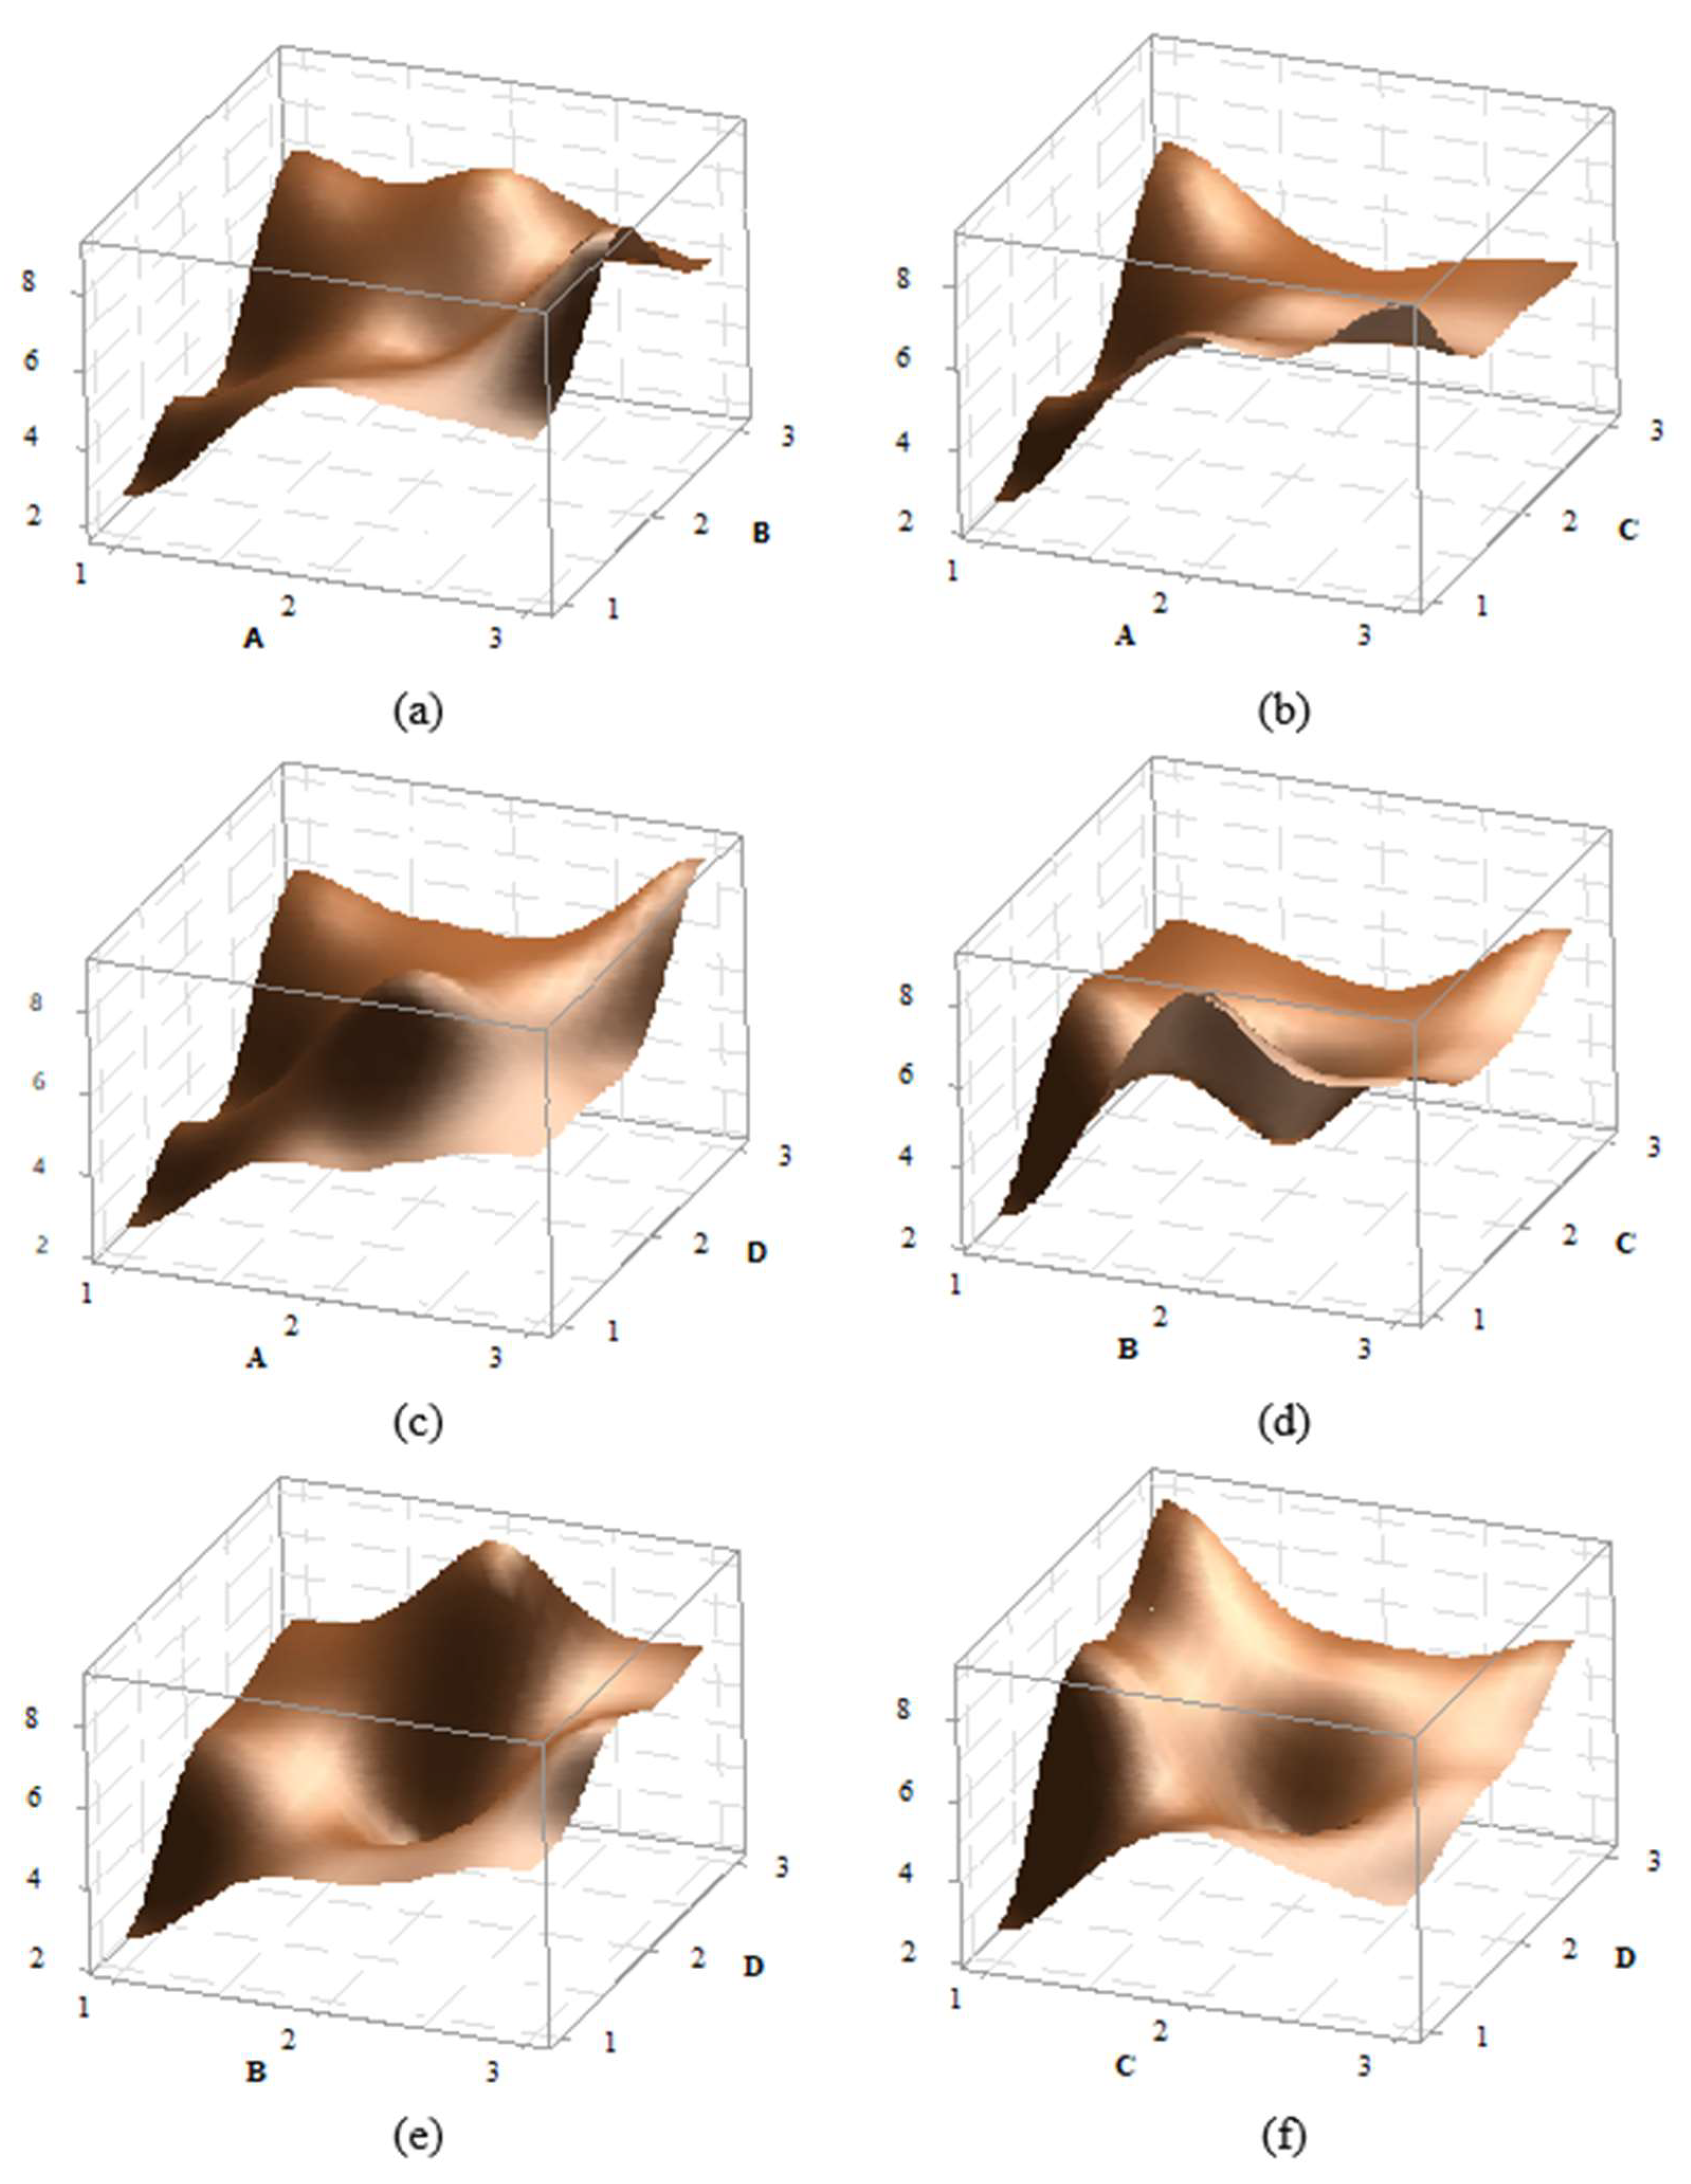
In the statistical experimental design, the 3D graphs of factor effects are crucial for interpreting results. For the impact strength of PA6 material, 3D effect graphs for A-B, A-C, B-C, B-D, and C-D were created and are presented in
Figure 5. Upon detailed examination of the graphs, it is observed that the peak point in the A-B effect graph occurs at the A3B2 level, while the peak in the A-C graph is at the A3C1 level, in the A-D graph at A3D3, in the B-C graph at B2C1, in the B-D graph at B2D3, and in the C-D graph at C1D3. For instance, in the AB graph, it can be seen that as a A parameter increases, the impact strength also increases. Additionally, in most graphs, an increase in the D parameter also leads to an increase in the impact strength. Overall, the graphs indicate that the effects of factors and their levels are significant.
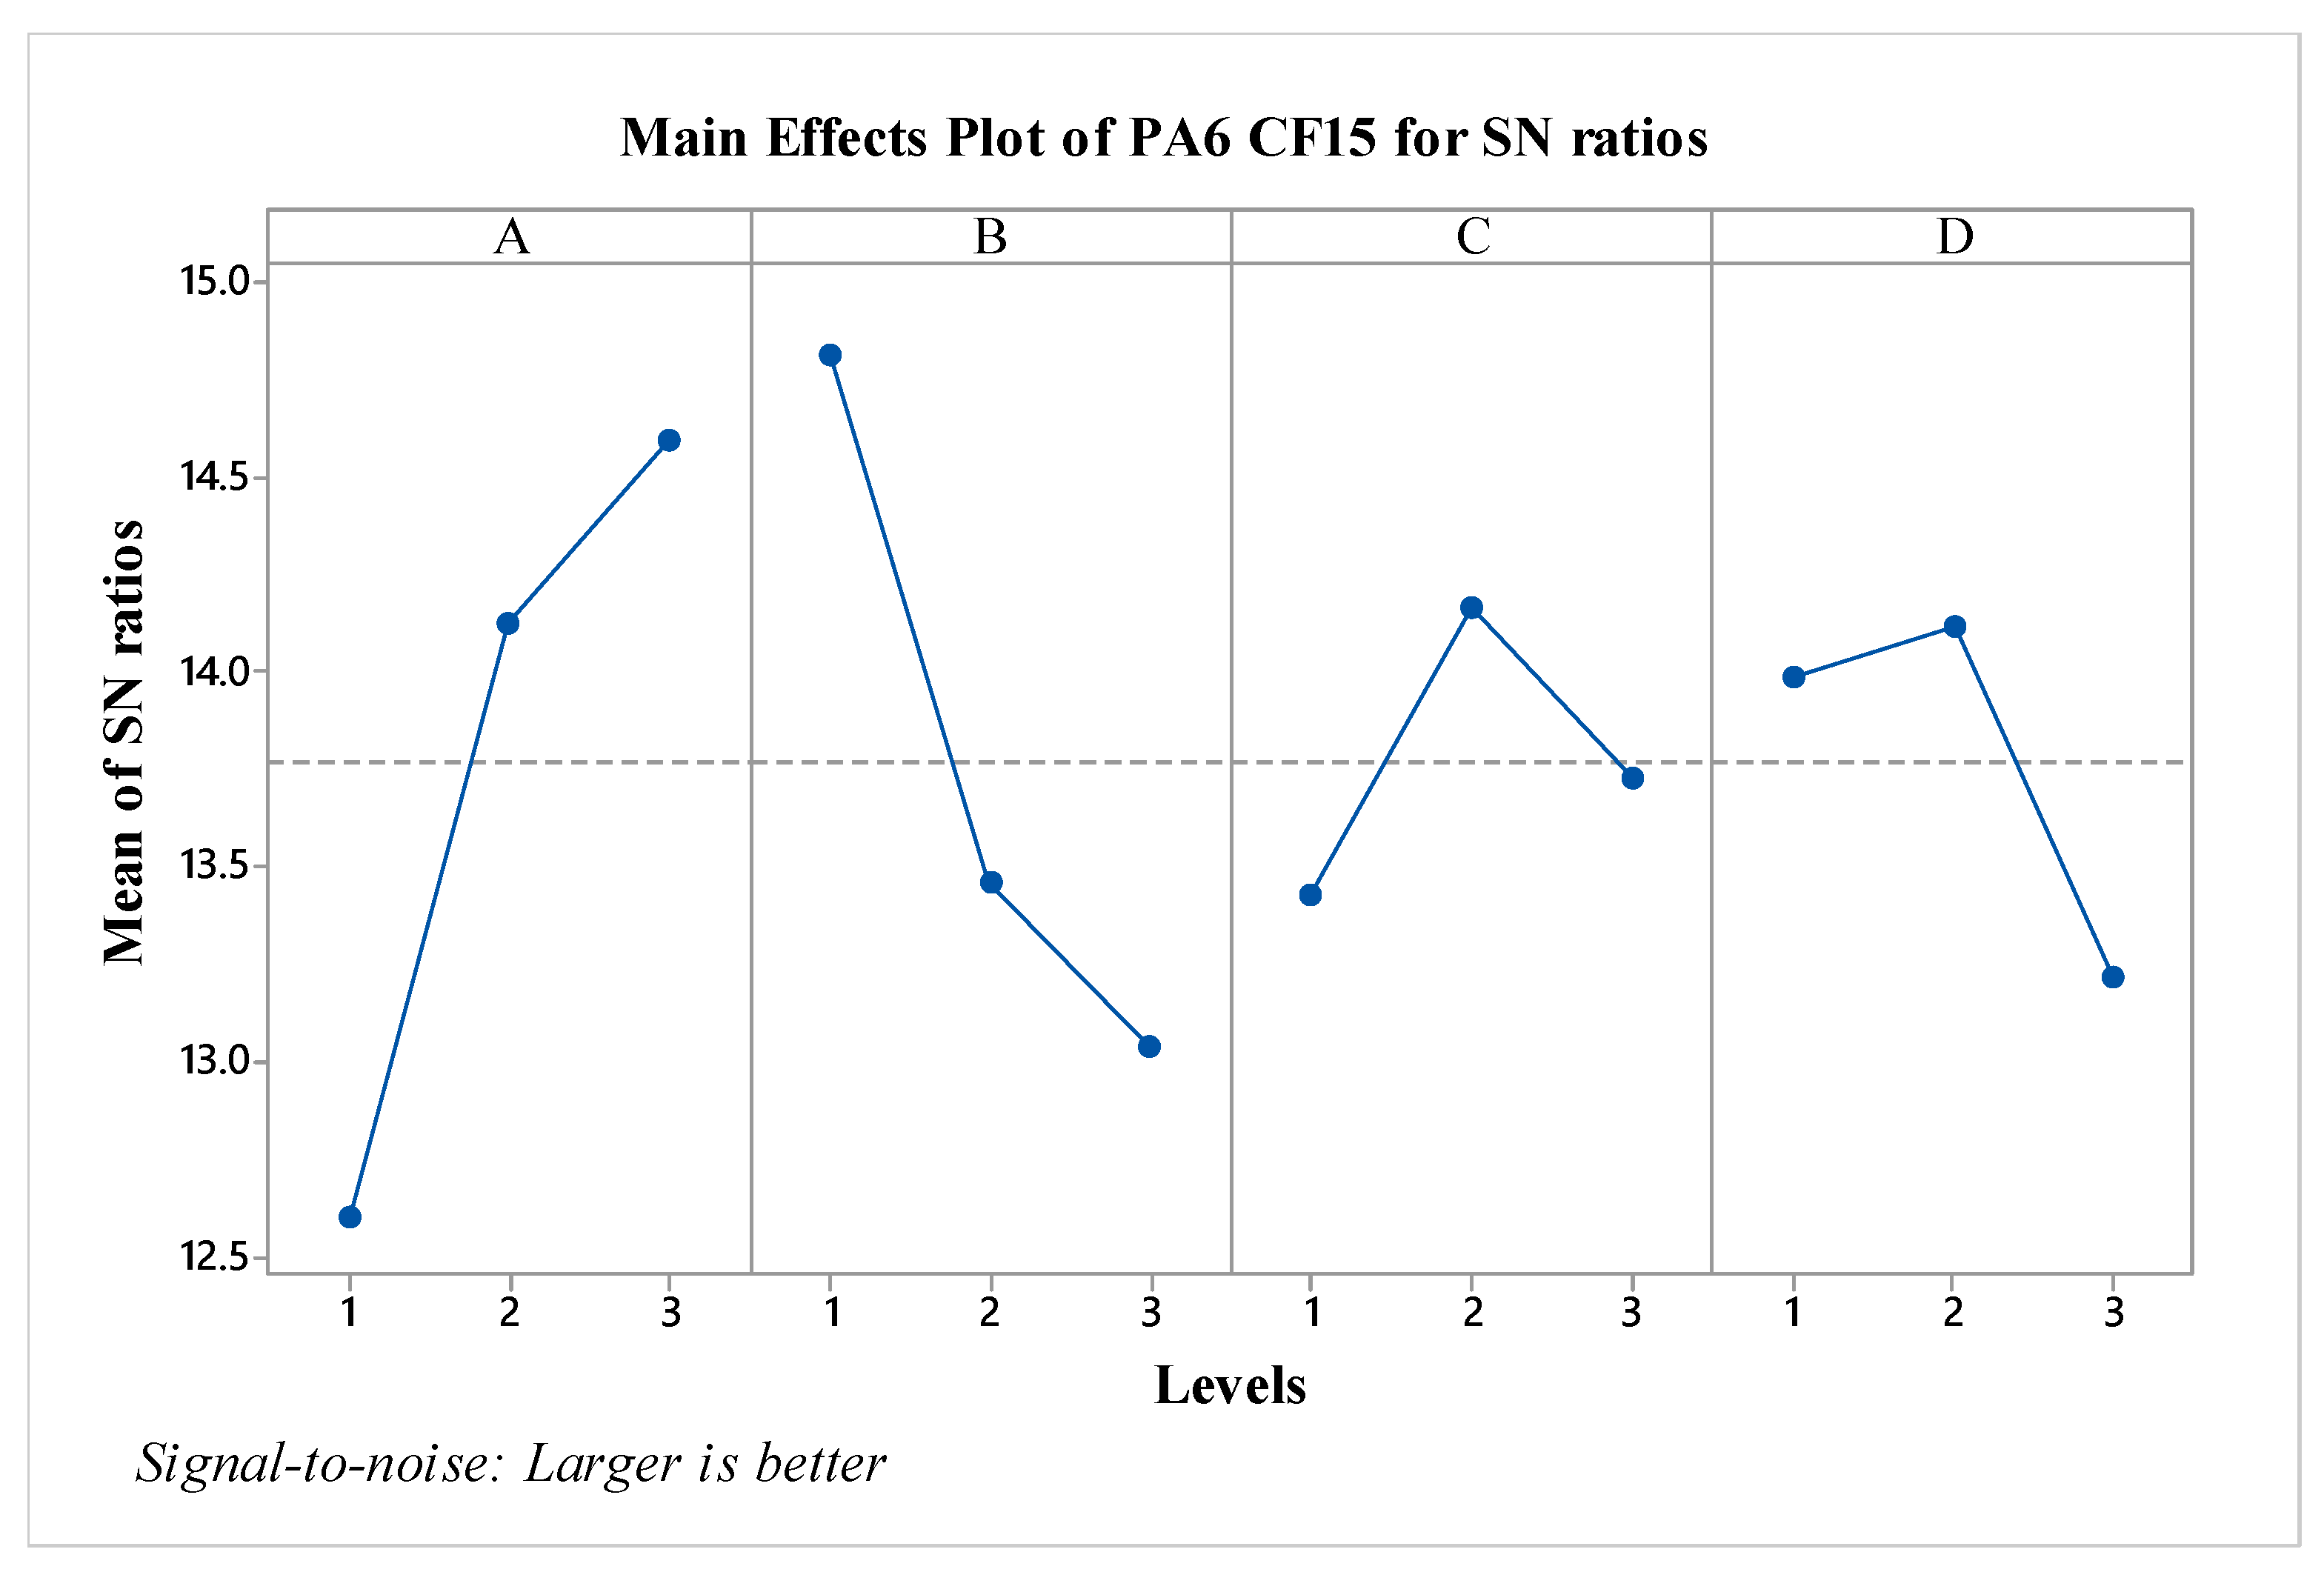
S/N ratios for the PA CF15 material have been calculated and presented in
Figure 6. When evaluating the factors based on S/N ratios, it is observed that factor A is the most effective, followed by factor B. In the contrast to pure PA6 material, the C and D factors are seen to have minimal effect according to graph. When assessed in terms of optimal parameters, the configuration A3B1C2D2 has been identified. Particularly, compared to pure PA6, it is noted that increasing the layer thickness results in a decrease in impact strength values for PA CF15. Additionally, looking at the effect of post-heat treatment, it is observed that the impact strength level decreases after an 80-minute process.
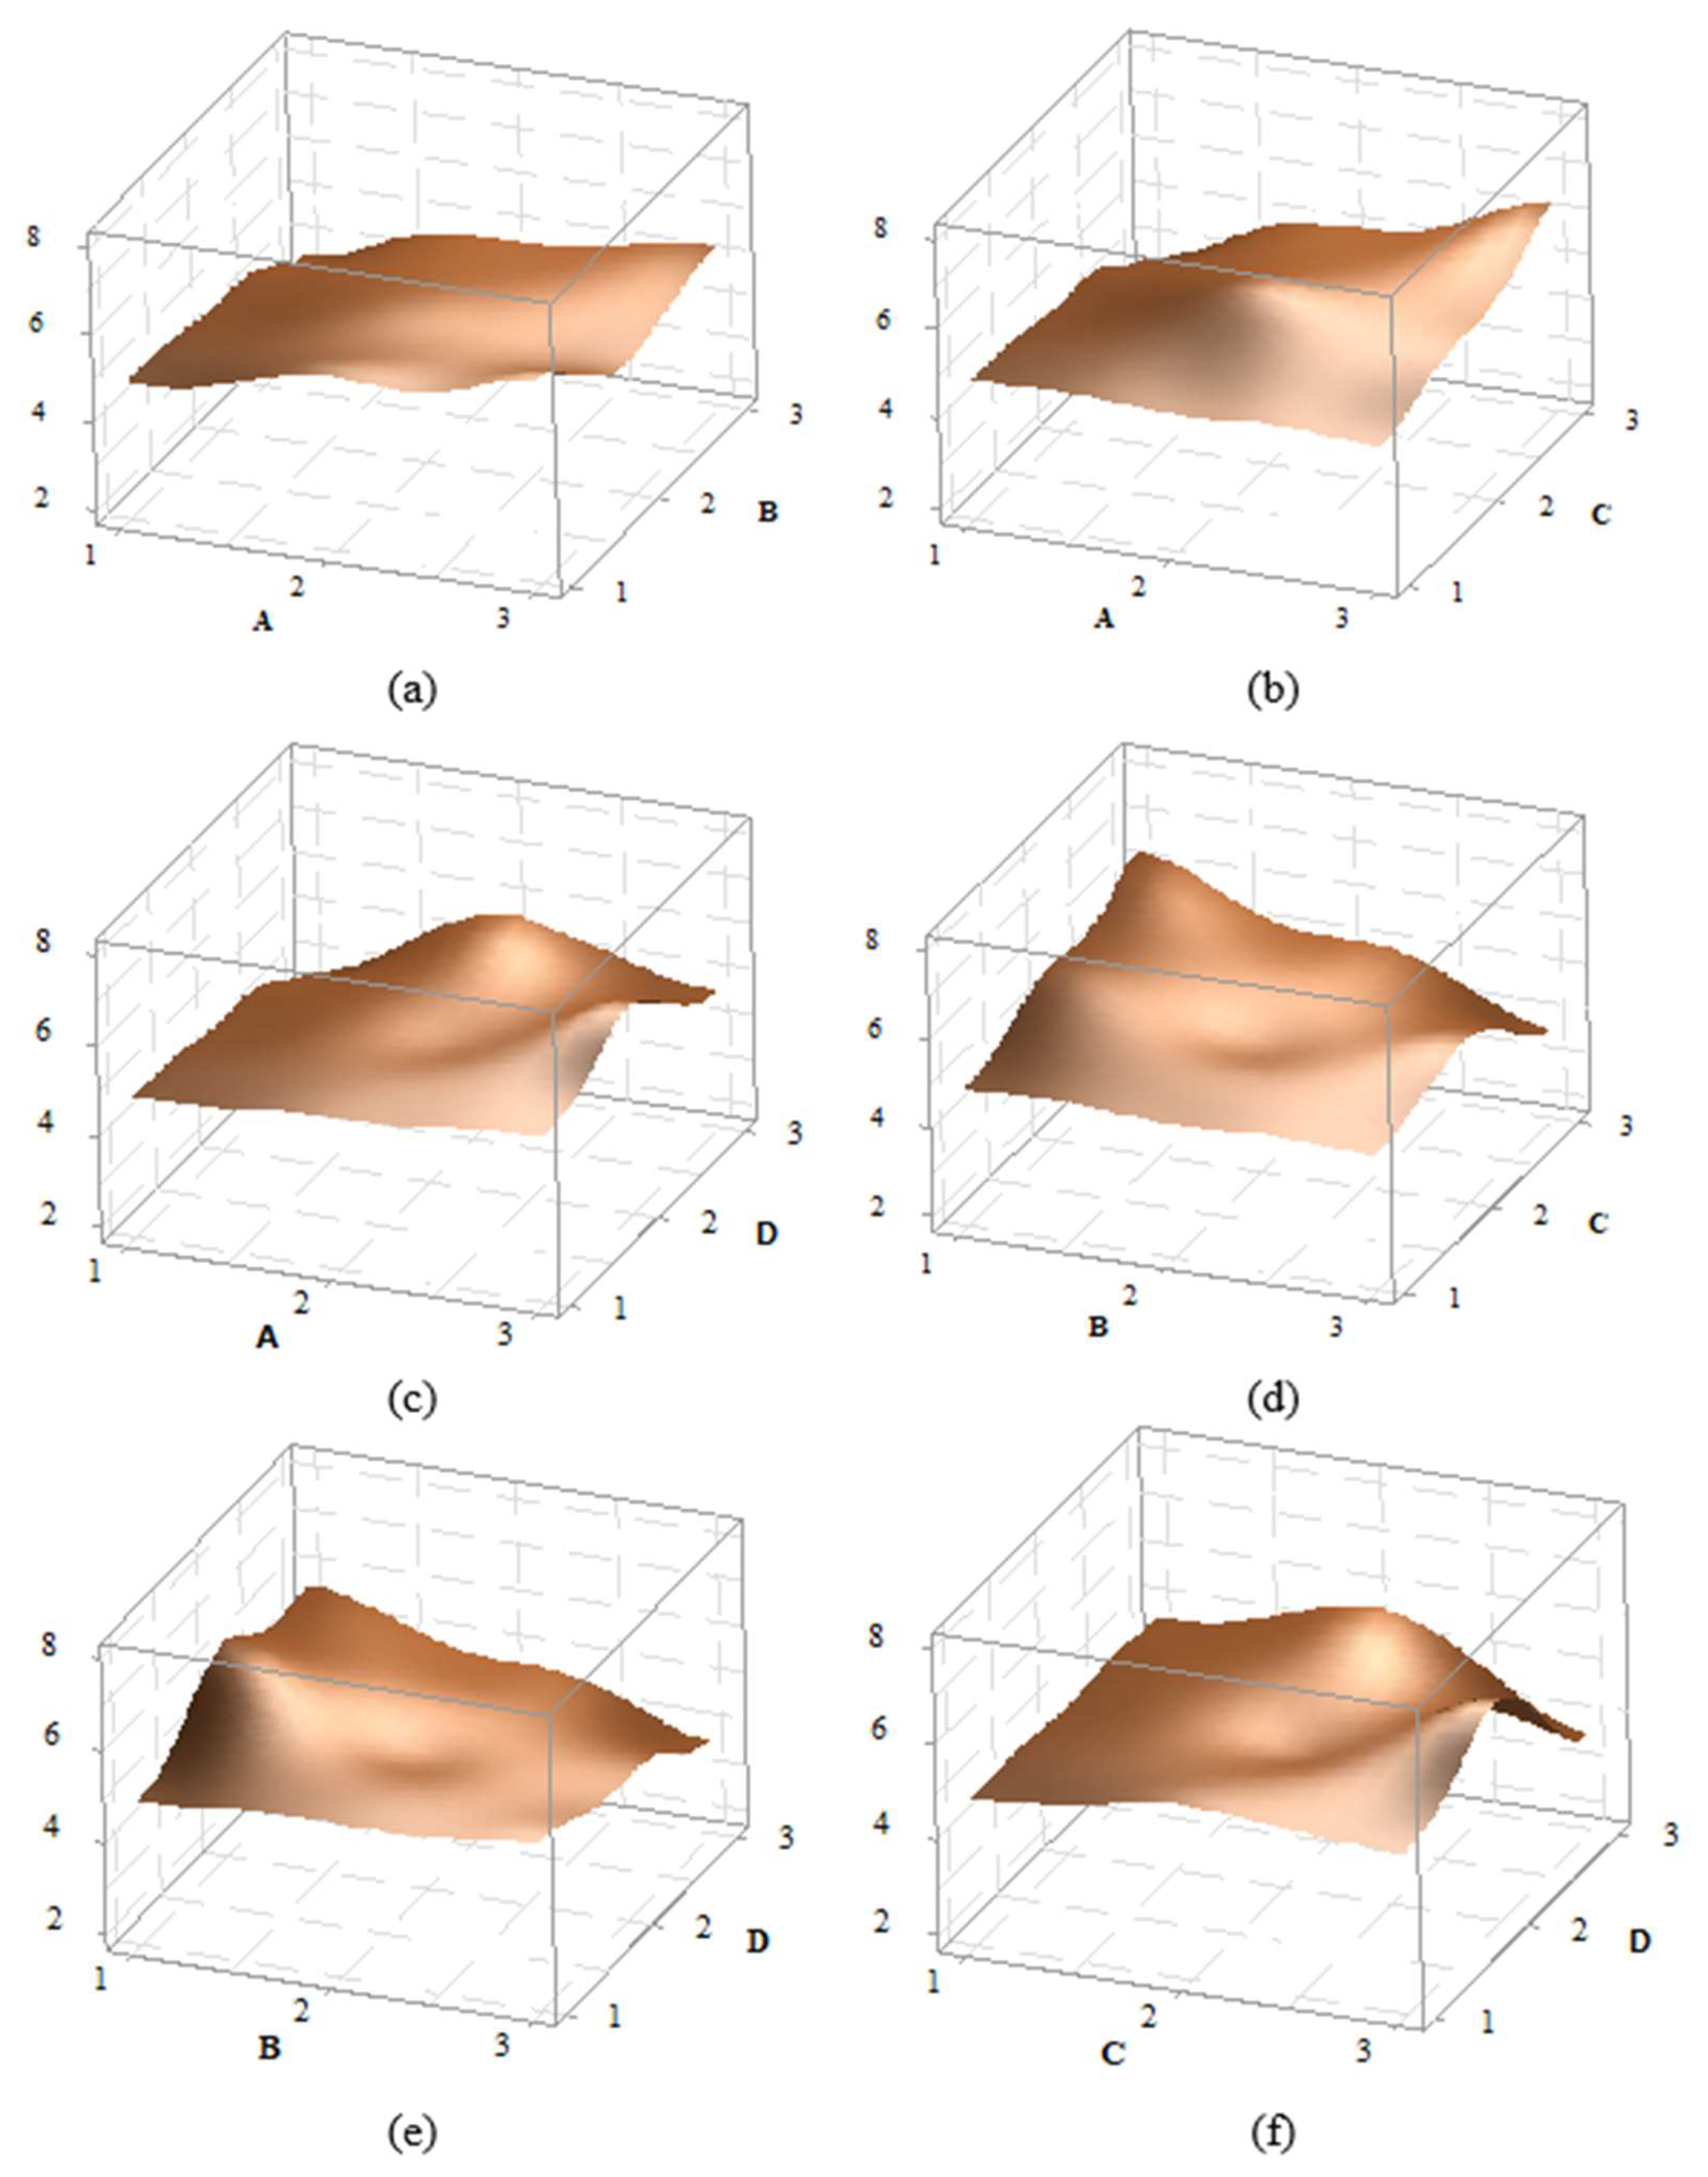
3D effect graphs for the impact strength value of PA6 CF15 material have been created for A-B, A-C, A-D, B-C, B-D, and C-D, and are presented in
Figure 7. A detailed examination of the graphs shows that the peak point in the A-B effect graph occurs at the A3B1 level, while in the A-C graph, the peak is at the A3C3 level. In the A-D graph, the peak is at A3D2, in the B-C graph at B1C3, in the B-D graph at B1D2. And in the C-D graph at C3D2. For example, when looking at the AB graph, it is observed that as the A parameter increases, the impact strength value also increases. The factor D, however, shows an increase at level 1 and 2, while it decreases at level 3. Overall, the graphs indicate that the effects of the factor are significant.
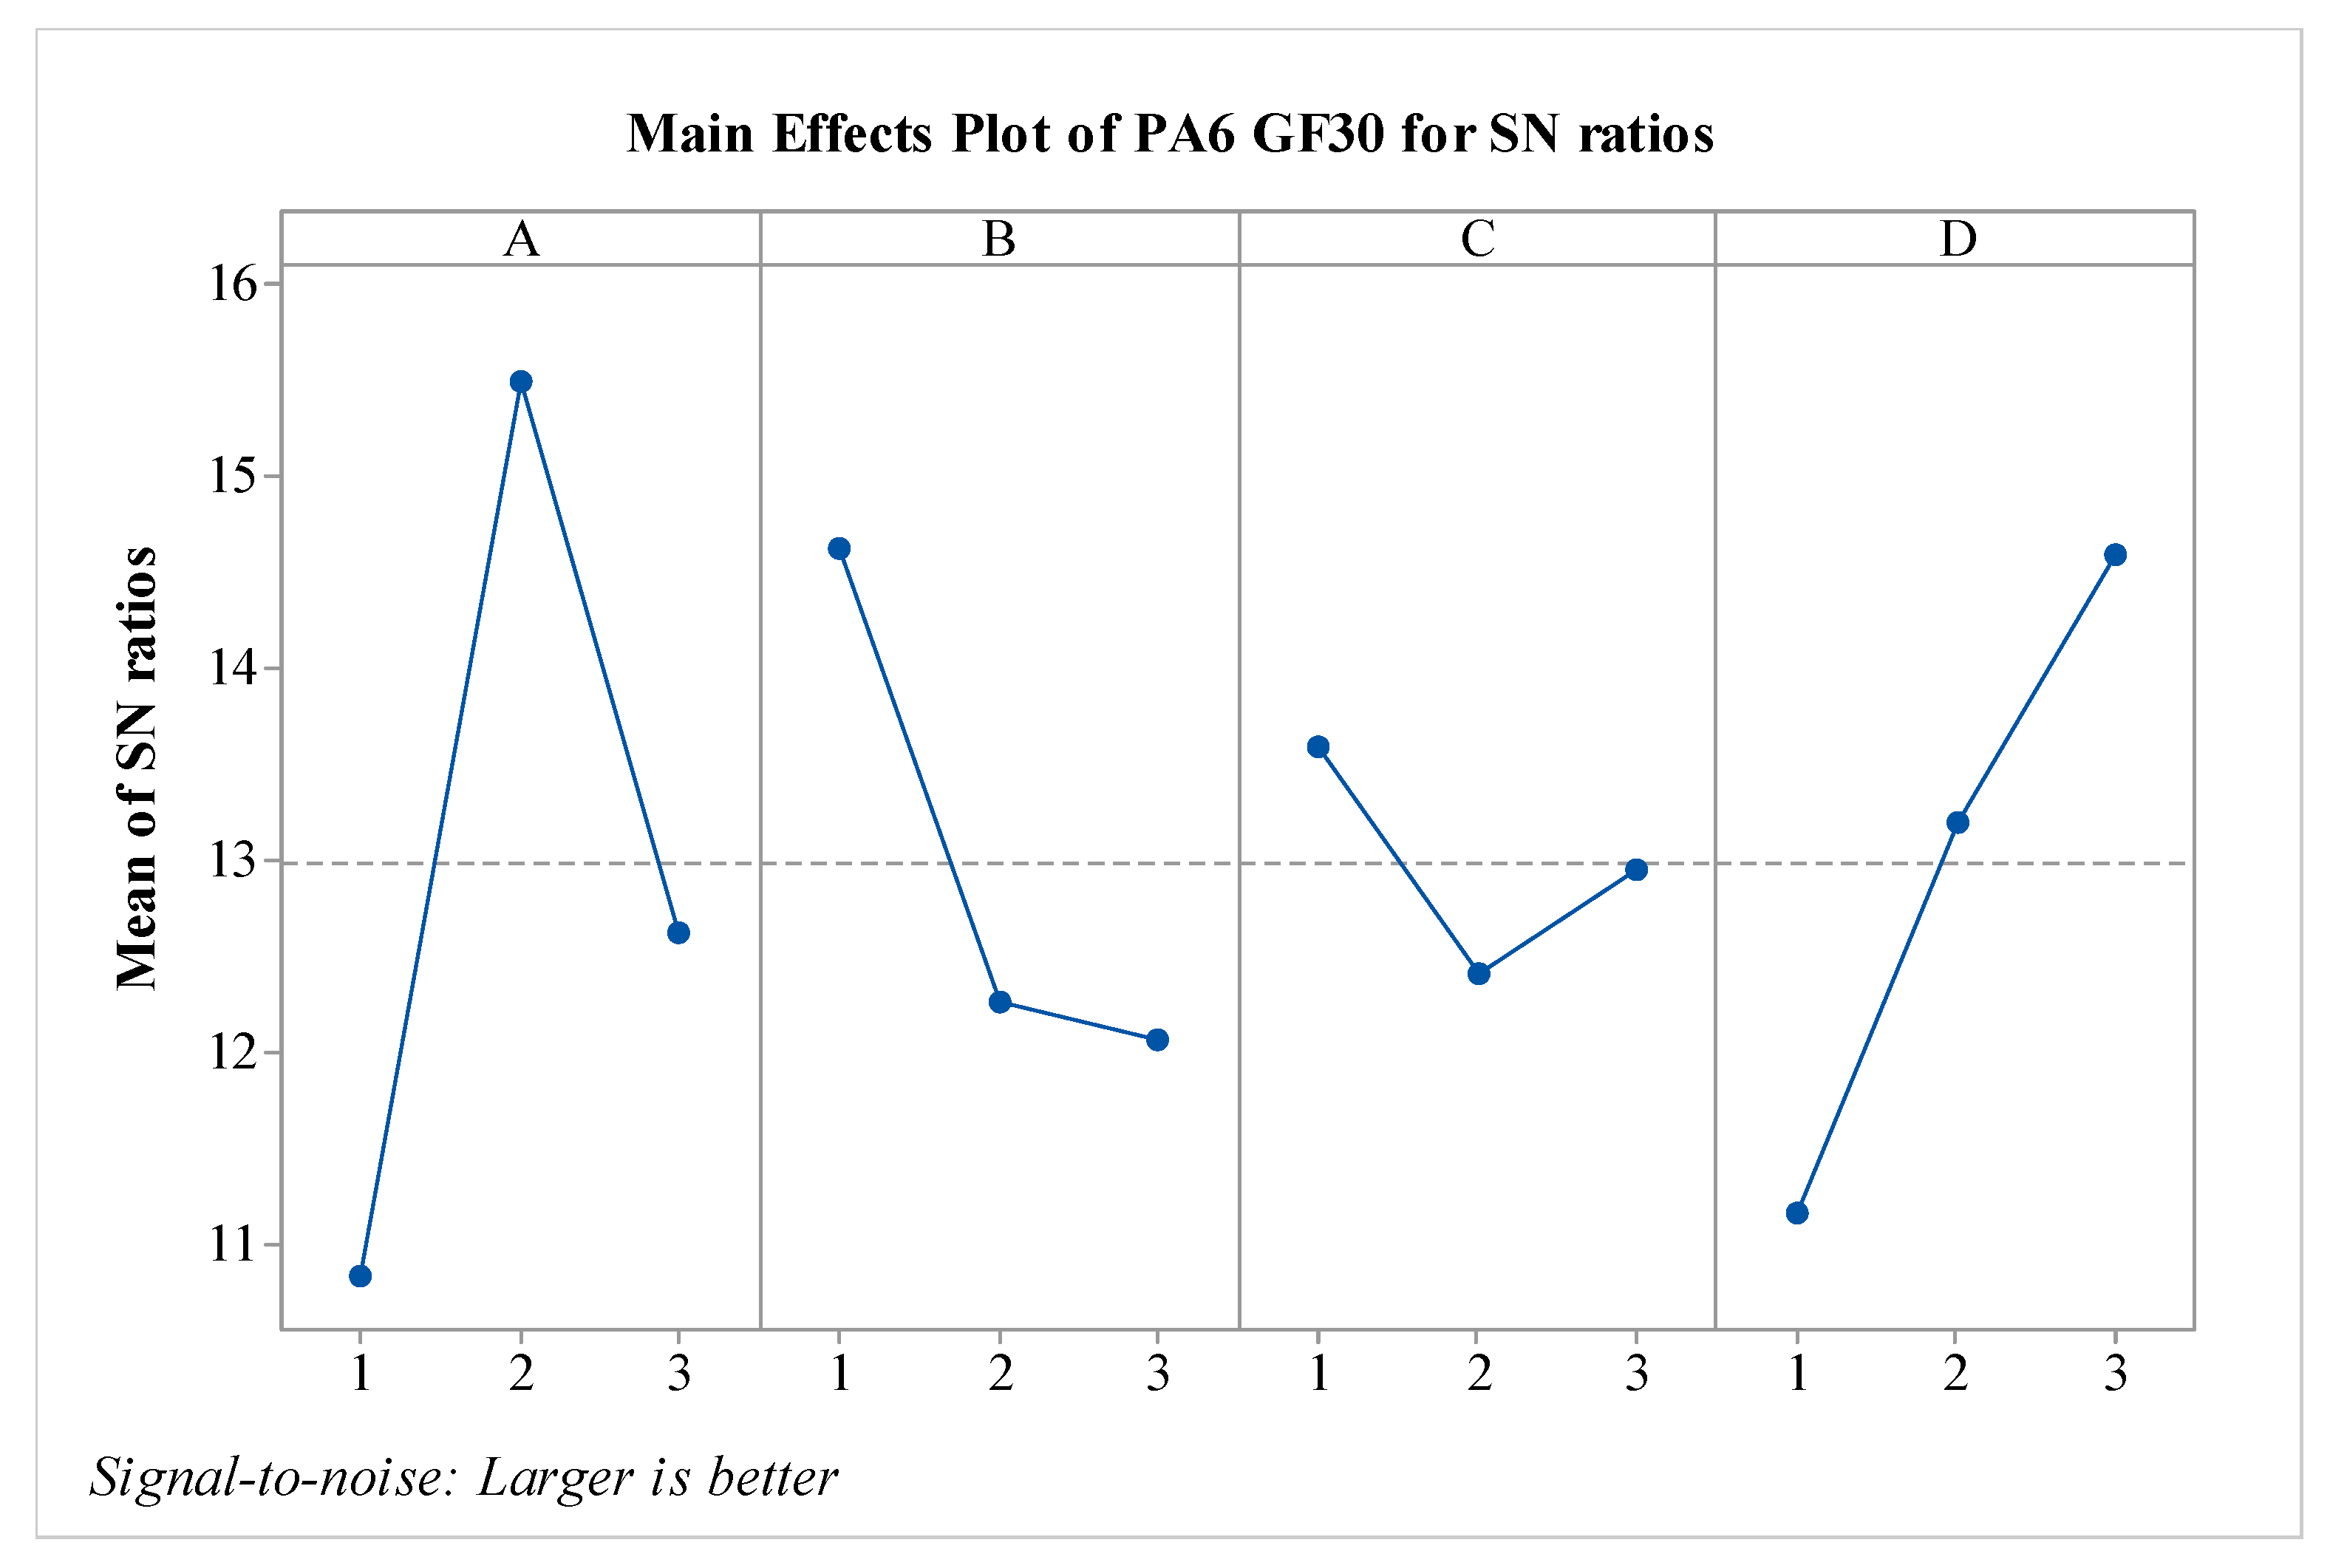
S/N ratios for PA6 GF30 material have been calculated and are presented in
Figure 9. To determine the optimal parameters, the S/N ratios were considered. It is observed that factors A, B, and D are effective, while the effect of factor C is relatively low. Additionally, compared to pure PA6 material, the effect of the B parameter is the opposite; that is, as the value of the B parameter increases, the impact strength decreases, like the behavior observed in PA6 GF30 material. The A parameter shows variation when compared to PA6 CF15 material. It is anticipated that when the nozzle temperature exceeds 260 °C, the impact strength value decreases due to the embrittlement of the matrix. When evaluating the results in terms of optimal parameters, it is seen that the optimal configuration is A2B1C1D3. From the perspective of post-heat treatment, it is noted that the heat treatment duration of 160 minutes is effective for PA6 GF30 materials.
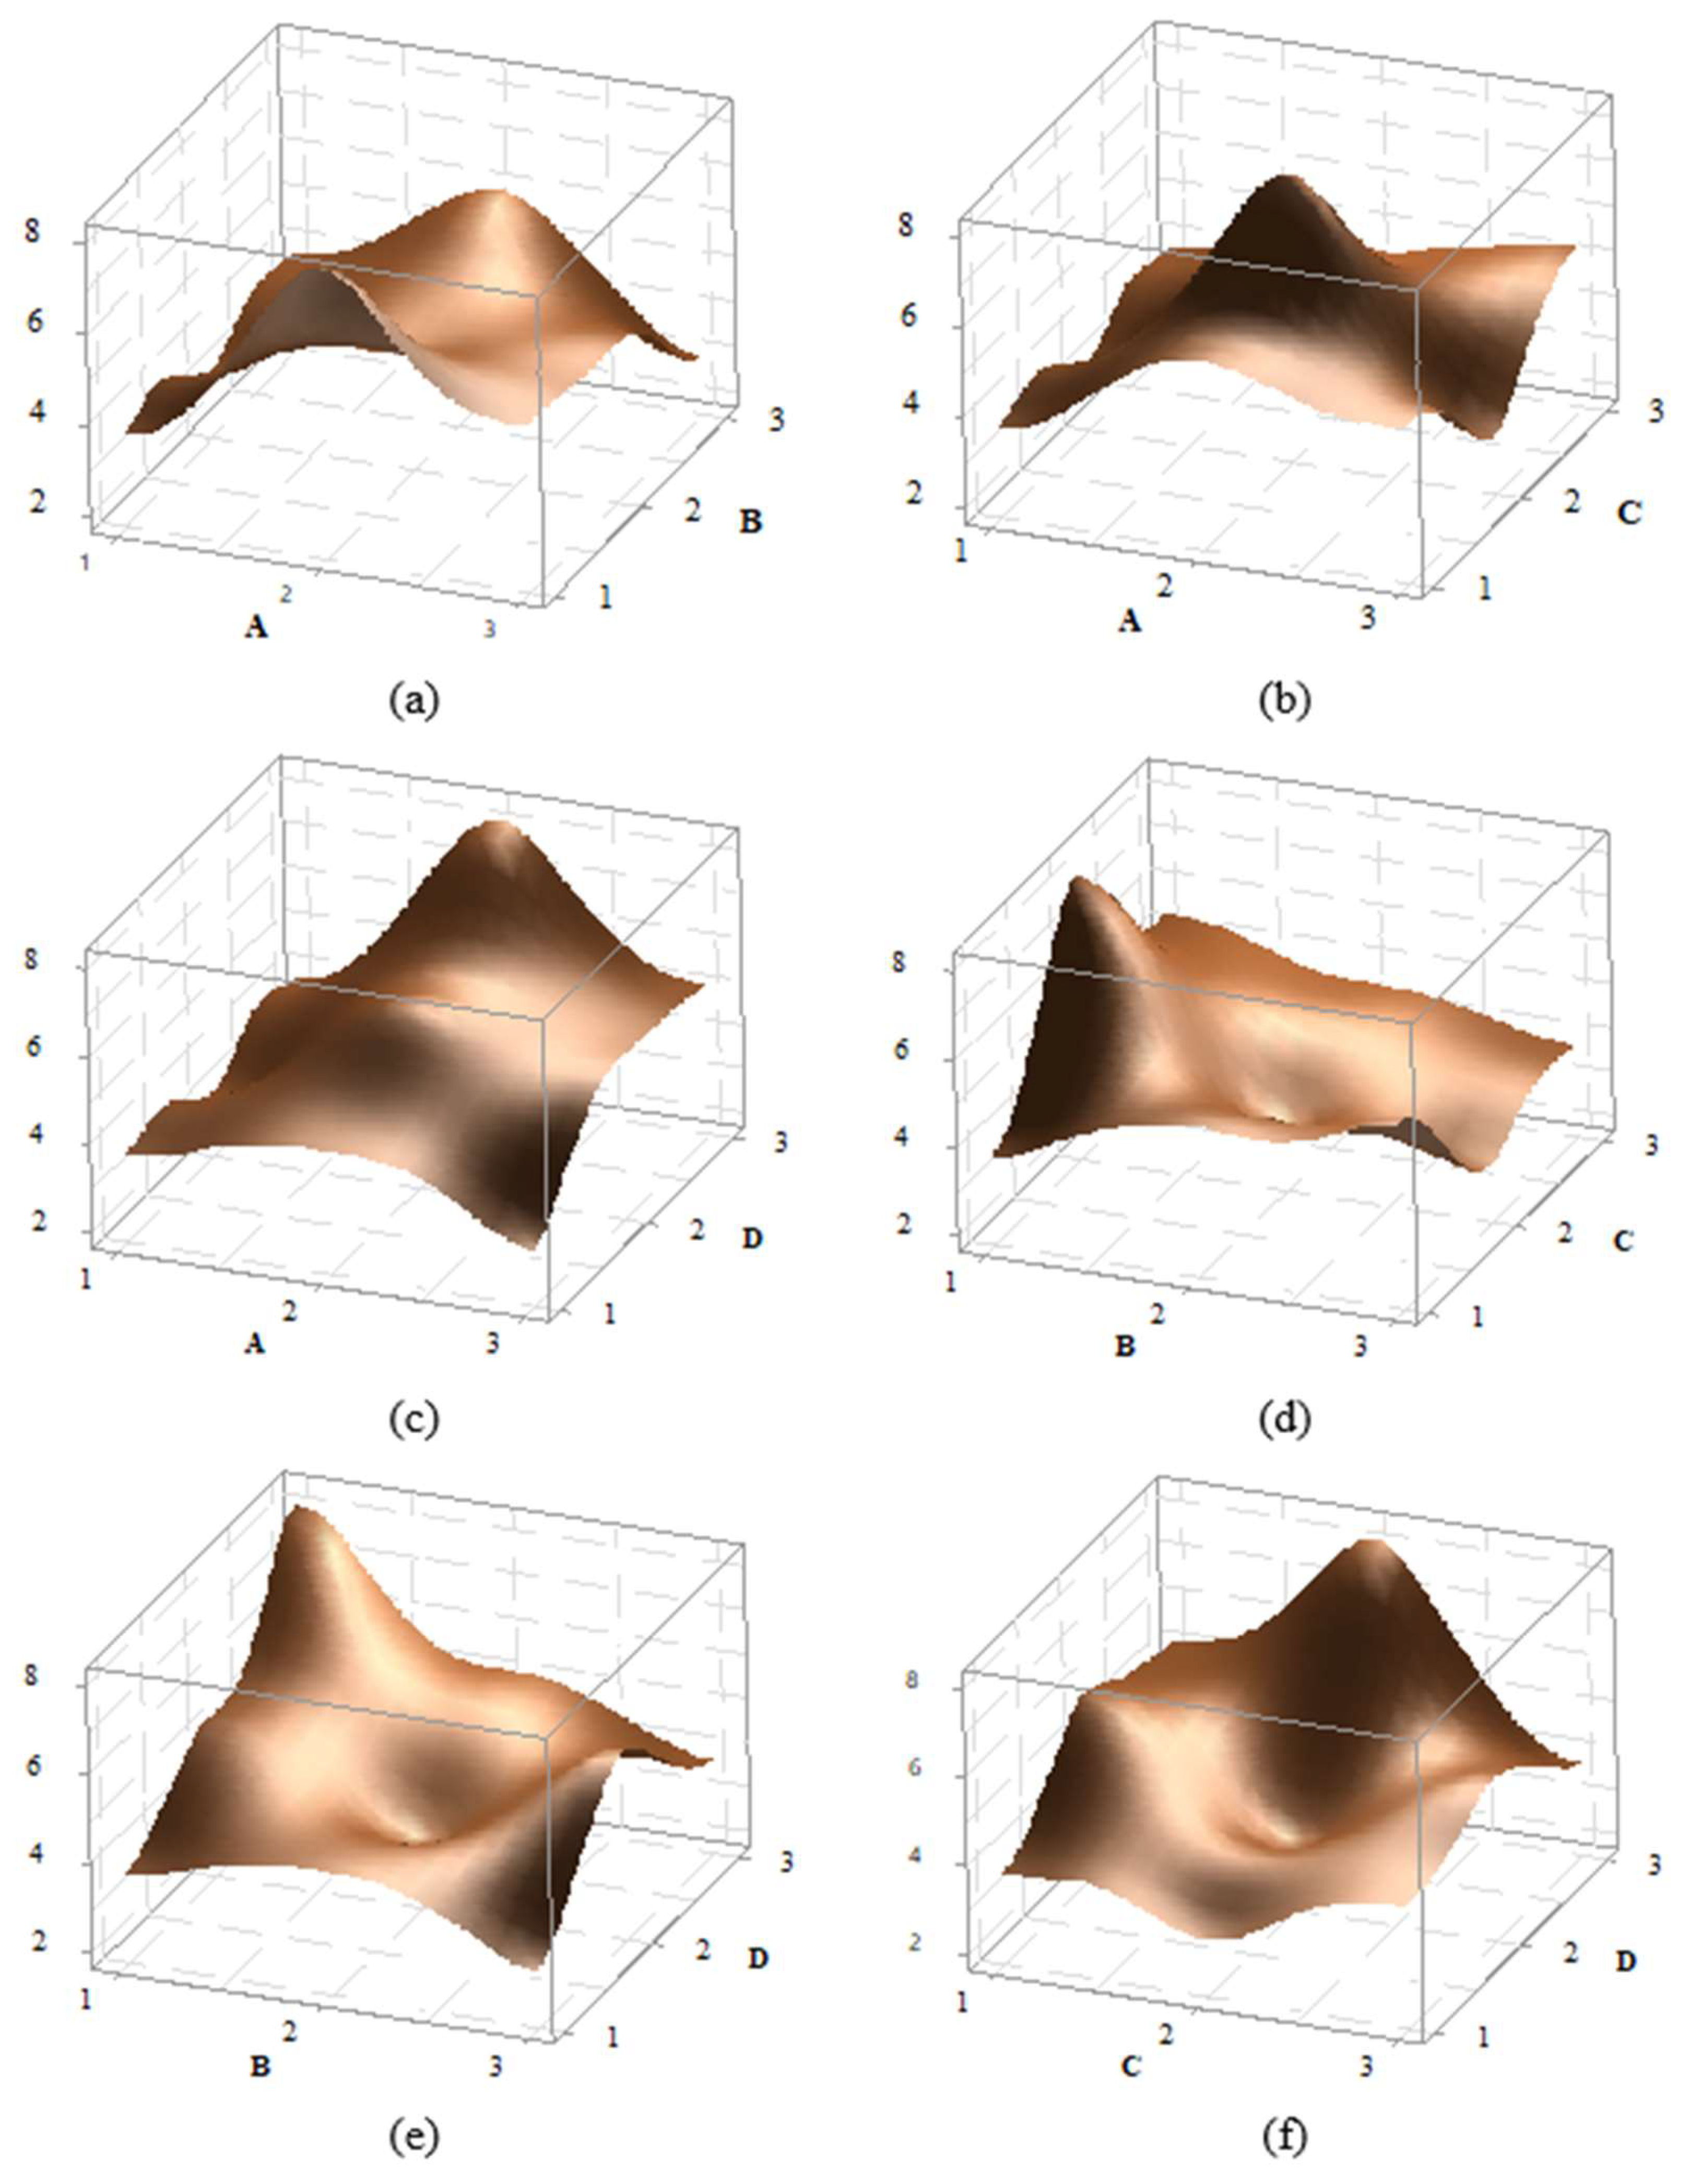
3D effect graphs for the impact strength value of PA6 GF30 material have been created for A-B, A-C, A-D, B-D, and C-D, and presented in
Figure 11. A detailed examination of the graphs reveals that the peak point in the A-B effect graph occur at the A2b1 level, while the peak in the A-C graph is at the A2C2 level. In the A-D graph, the peak is at A2D3, in the B-C graph at B2C2, in the B-D graph at B1D3, and in the C-D graph at C3D3. When comparing the factor effects with the S/N ratios, it is evident that they are suitable in terms of optimal values.
When examining the effects of factors on mechanical properties, it has been observed in the literature that, depending on different parameters in XY orientation weaving, the impact strength values are highest in PA/GF materials, followed by PA/CF materials. The effect of continuous carbon fiber allows the PA/CF value to reach 100 kJ/m
2, while the effect continuous glass fiber enables the PA/GF value to reach approximately 290 kJ/m
2. These results indicate that the type of fiber used has a significant effect on the mechanical properties [
13]. Although the continuous carbon fiber 3D printing technique provides values closest to those of PA/CF and PA/GF composites produced by the pressure injection technique, issues arise due to printing difficulties and the inability to produce desired complex surface geometries. However, with the FDM technique, it is possible to manufacture complex-shaped part using short fiber materials, indicating a need for R&D effort in this area.
In the final step of the optimization phase of the study, the best and worst experimental conditions were identified for each material group. To determine the accuracy of the technique used, these values were additionally produced a tested, and percentage error values were calculated. The values are presented in
Table 7. As seen in the table, the highest error value is 11%, while the lowest error value is 6%. The average error has been calculated as 9.51%. When considering the overall success of the prediction model, this high prediction rate is acceptable for such a complex model.
When evaluating the results overall, although the best conditions for nozzle temperature (A) are at level 3, specifically 275 °C, it is observed that for the PA6 GF30, this temperature is 260 °C. For the worst conditions, the lowest nozzle temperature is at level 1, which is 245 °C. In terms of layer thickness, it is noted that, expect for pure PA6, the best value in other material groups is provided by the lowest layer thickness of 0.15mm. However, pure PA6, the highest layer thickness yields the best results. When evaluating the number of outer walls (C), it is found that in optimal conditions, the wall-less structure performs best pure PA6 and PA6/GF, whereas for PA6/CF, the structure with 2 walls is the best. Regarding the post-heat treatment process time (D), it has determined that a duration of 160 minutes is optimal for pure PA6 and PA6 GF30 materials., while 80 minutes is optimal for PA6 CF156. The literature indicates that applying heat treatment as a post-processing step leads to a significant increase in mechanical properties. In a study by Xu et al, post-processing heat treatment was applied to carbon and nylon materials in various layered products. It was reported that the optimal effect of thermal treatment on the tensile strength in a 3D-printed layered composite structure occurs at a temperature of 140 -150 °C with a waiting period of 4 hours, which is also optimal for interlaminar shear strength at the same temperature [
18]. In this study, a post-processing heat treatment temperature of 80 °C was applied, and the result were examined. The lower temperature was chosen particularly due to reasons such as dimensional distortions and stability. In future studies, different temperatures and waiting times can be optimized based on dimensional distortions and stability characteristics.
Micro and Macro Damage Analyis
The fracture surfaces of samples are thoroughly examined using SEM for the damage analysis of composite products. In this context, various aspects such as the main matrix of the composite structure, fibers, fracture lines, fiber breakages, fiber structures, and matrix damages are analyzed in detail [
20,
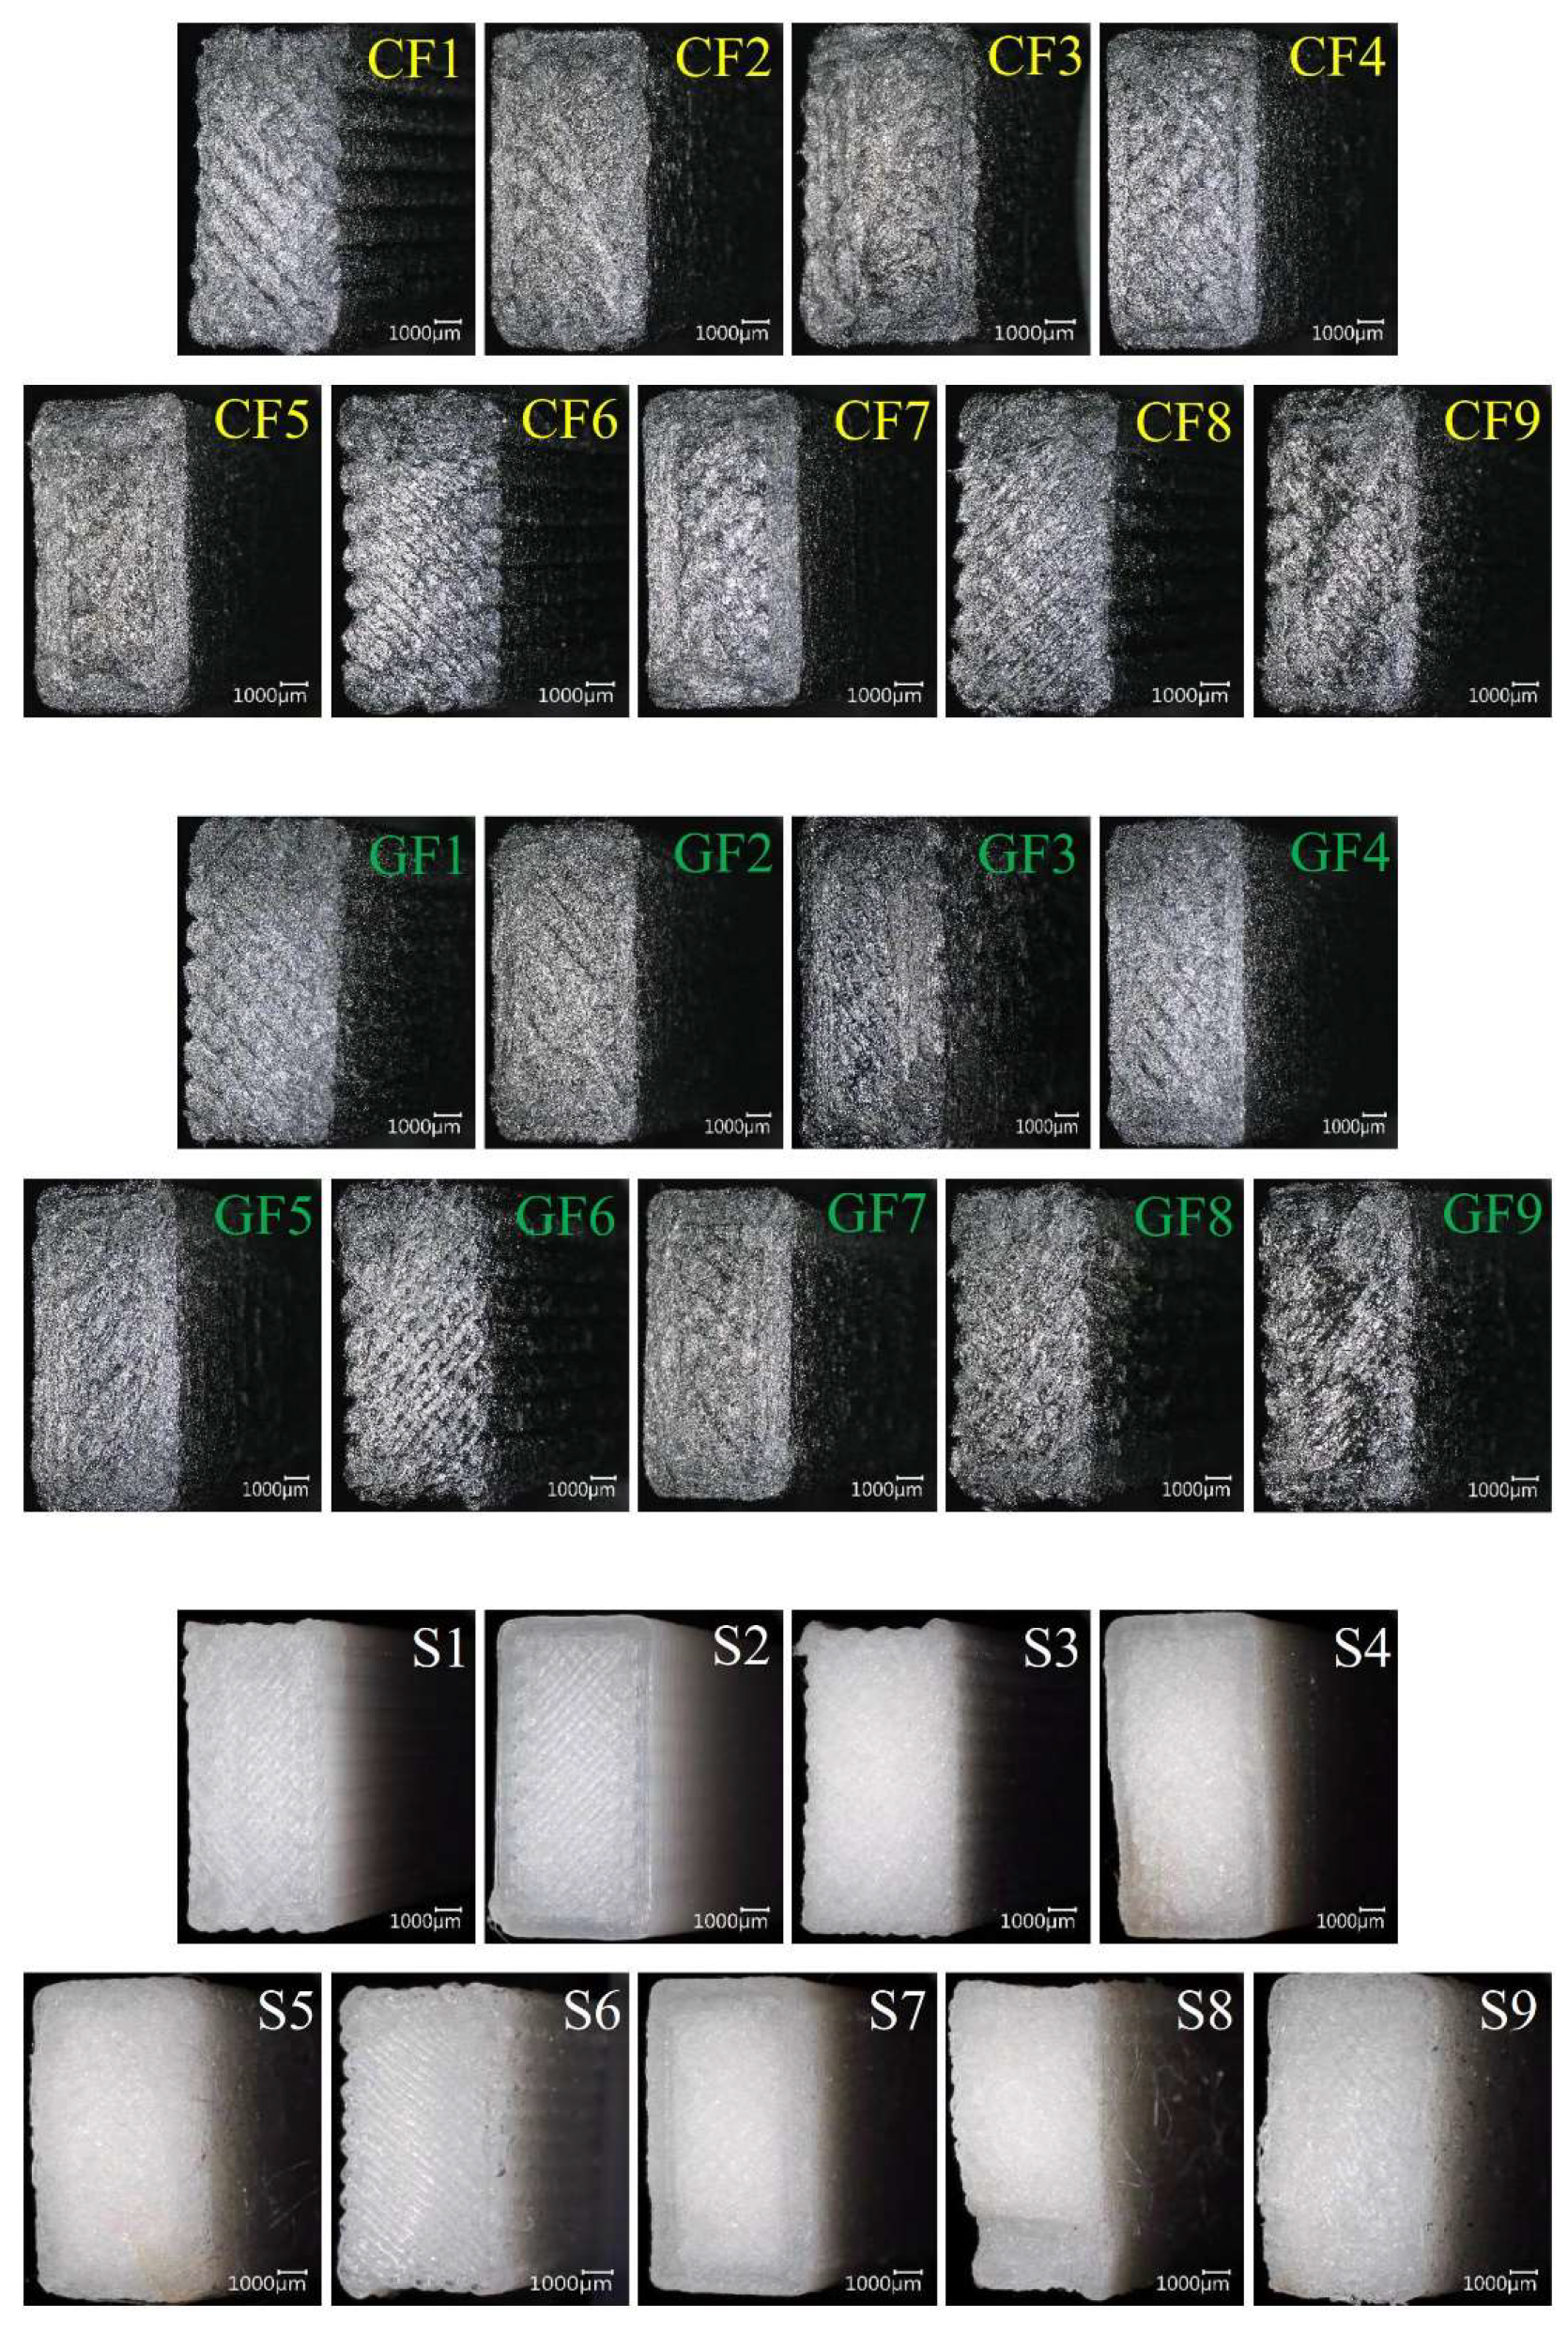
21]. The macro damage images of the samples after impact are presented collectively in
Figure 12. When examining the fracture surfaces of the samples, it is observed that pure PA6 samples exhibit a brittle fracture surface, while fiber-reinforced samples show more ductile and rougher surface.
The SEM images of the damaged surfaces of the samples obtained from the impact tests are presented in detail and comparatively in
Figure 13,
Figure 14 and
Figure 15 for micro damage analyses. Upon examining
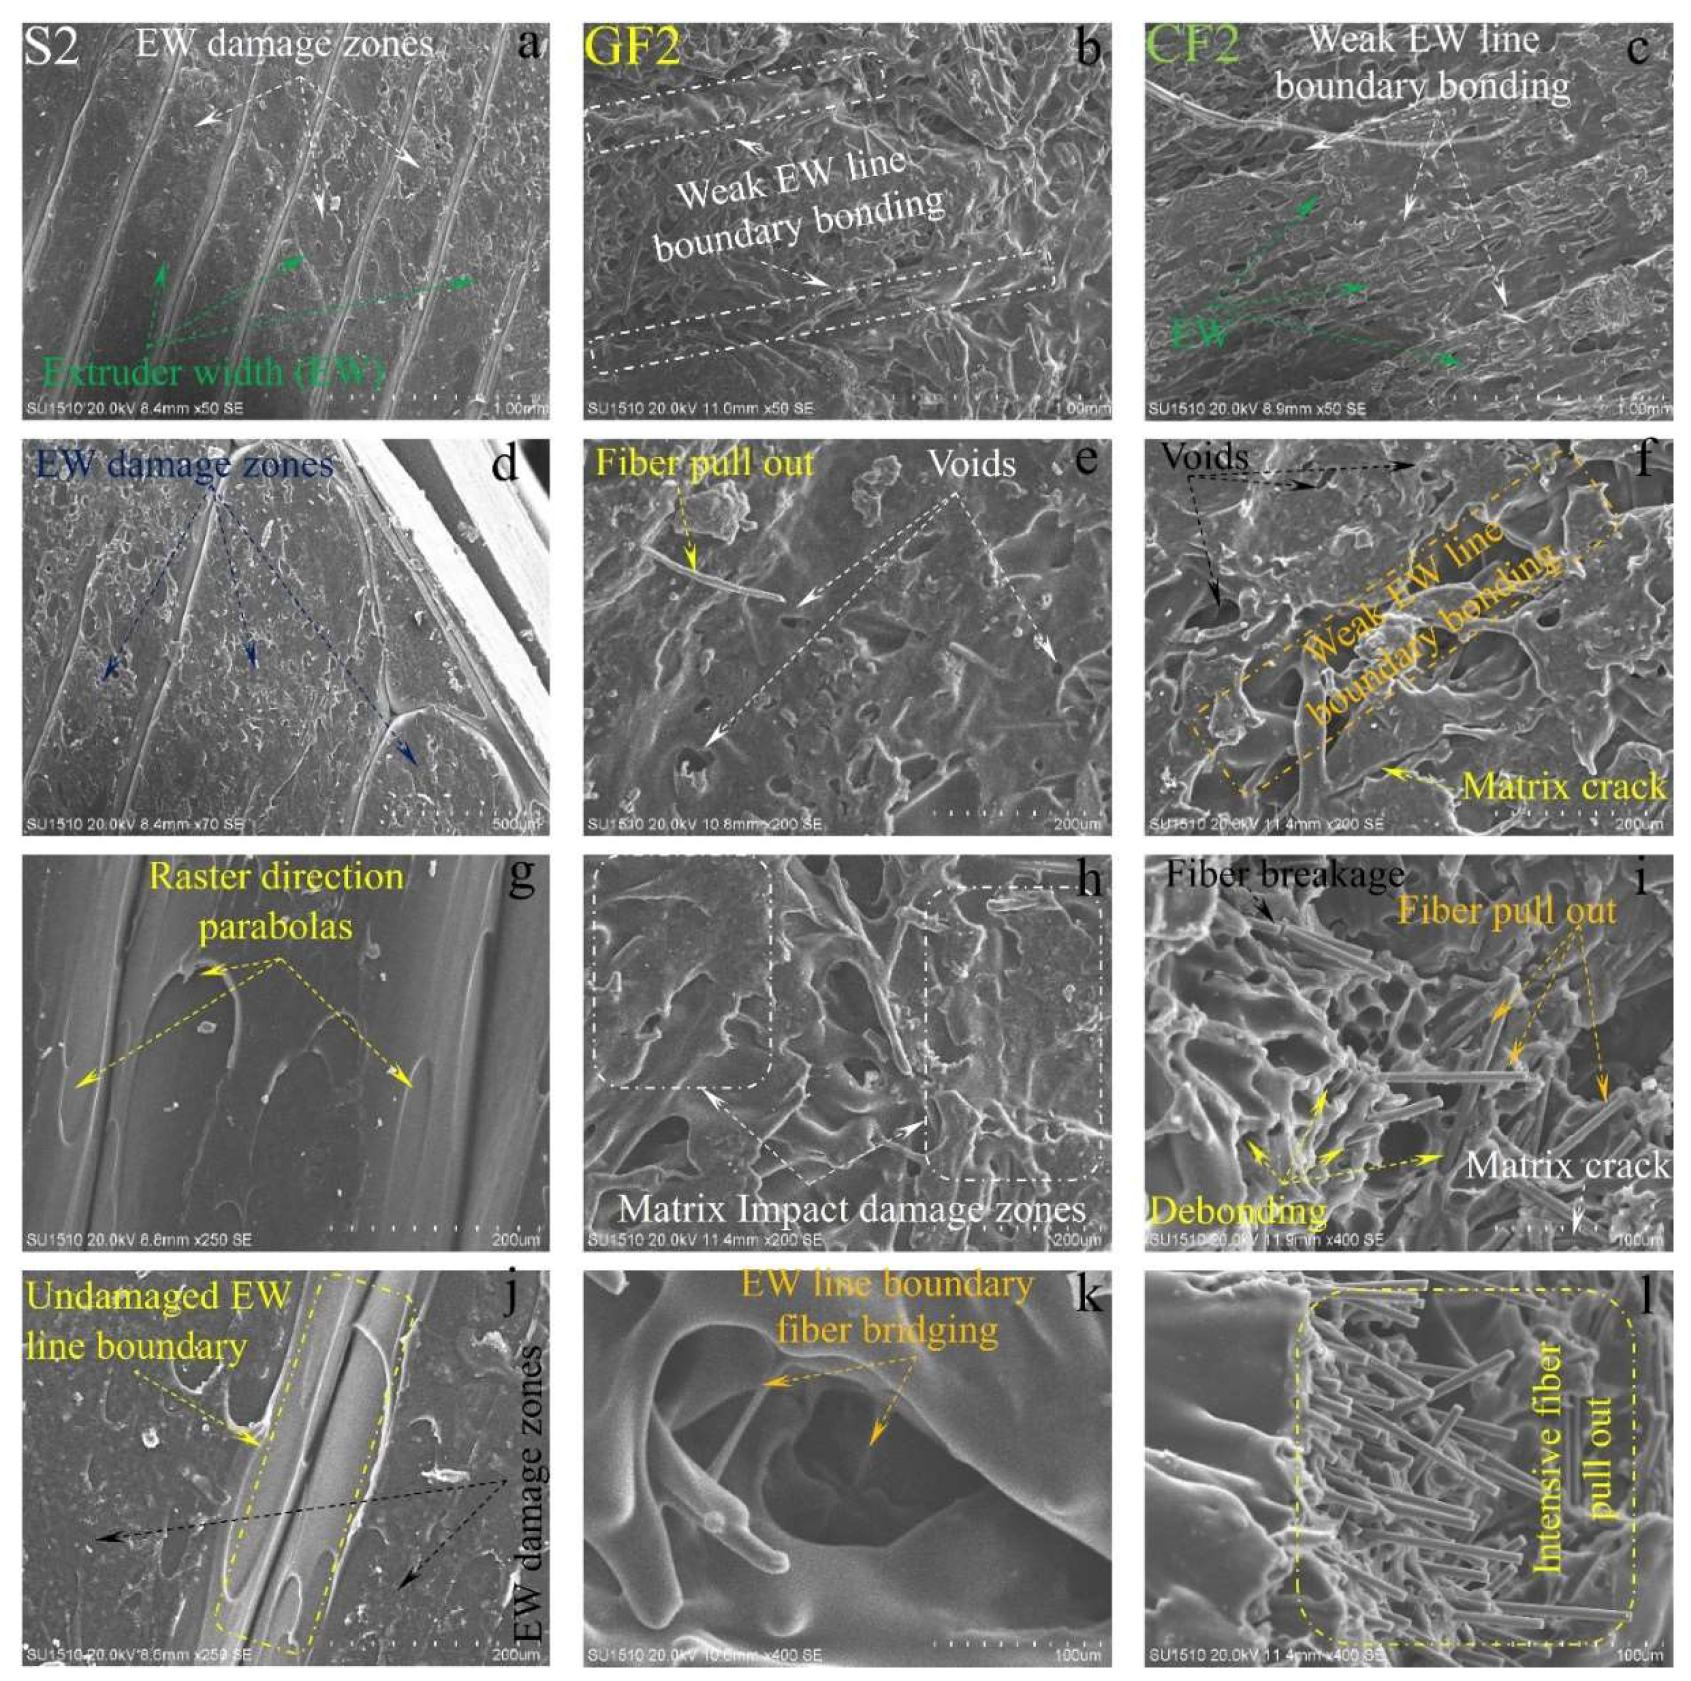
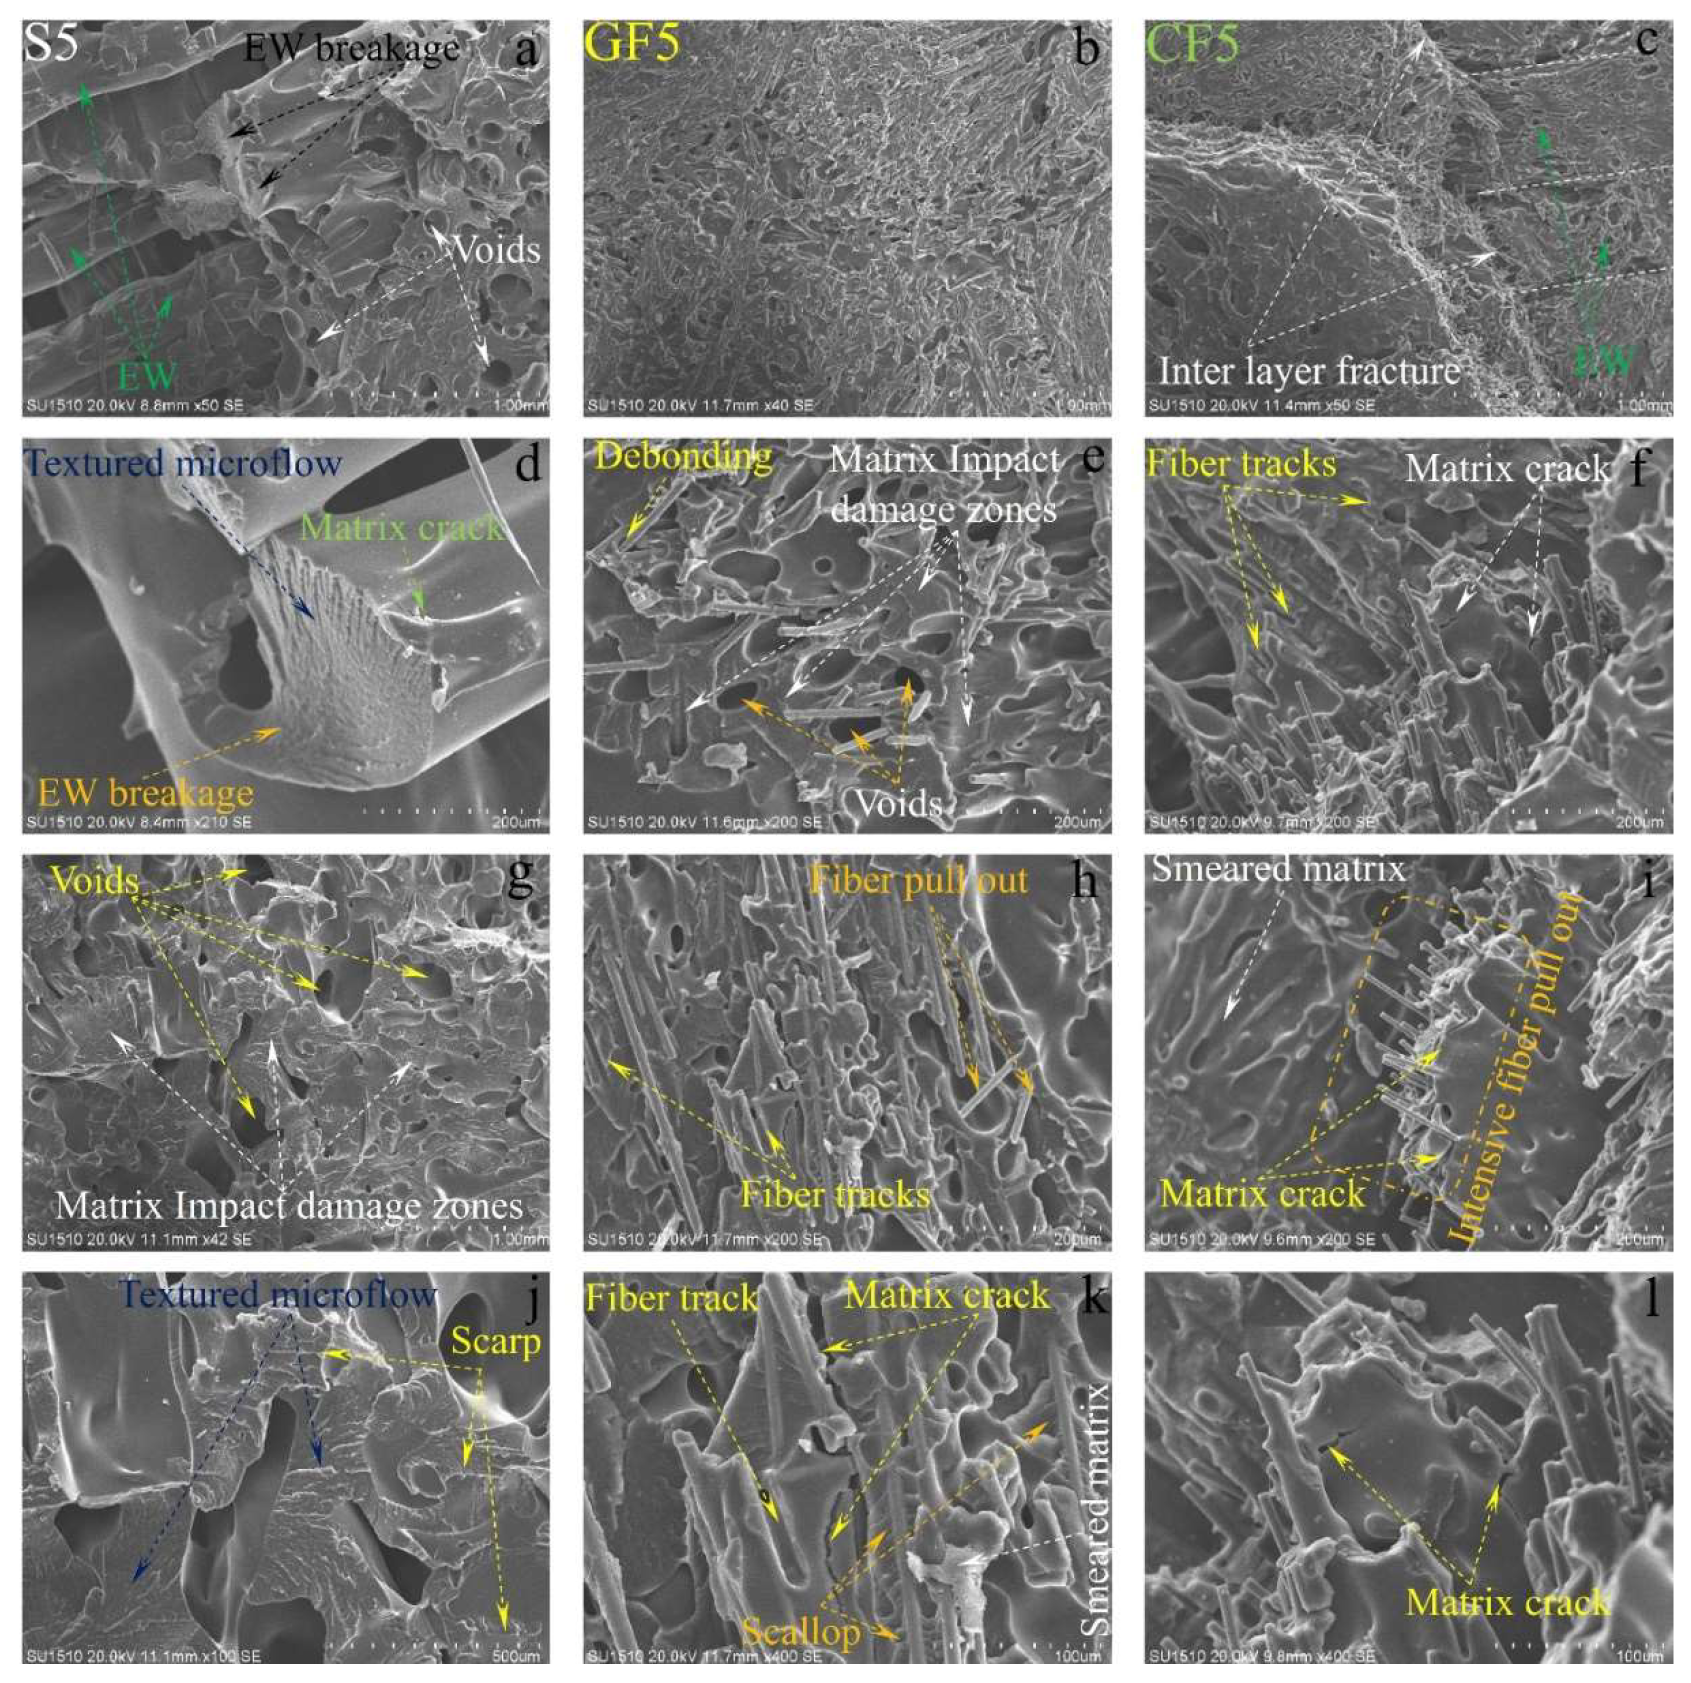
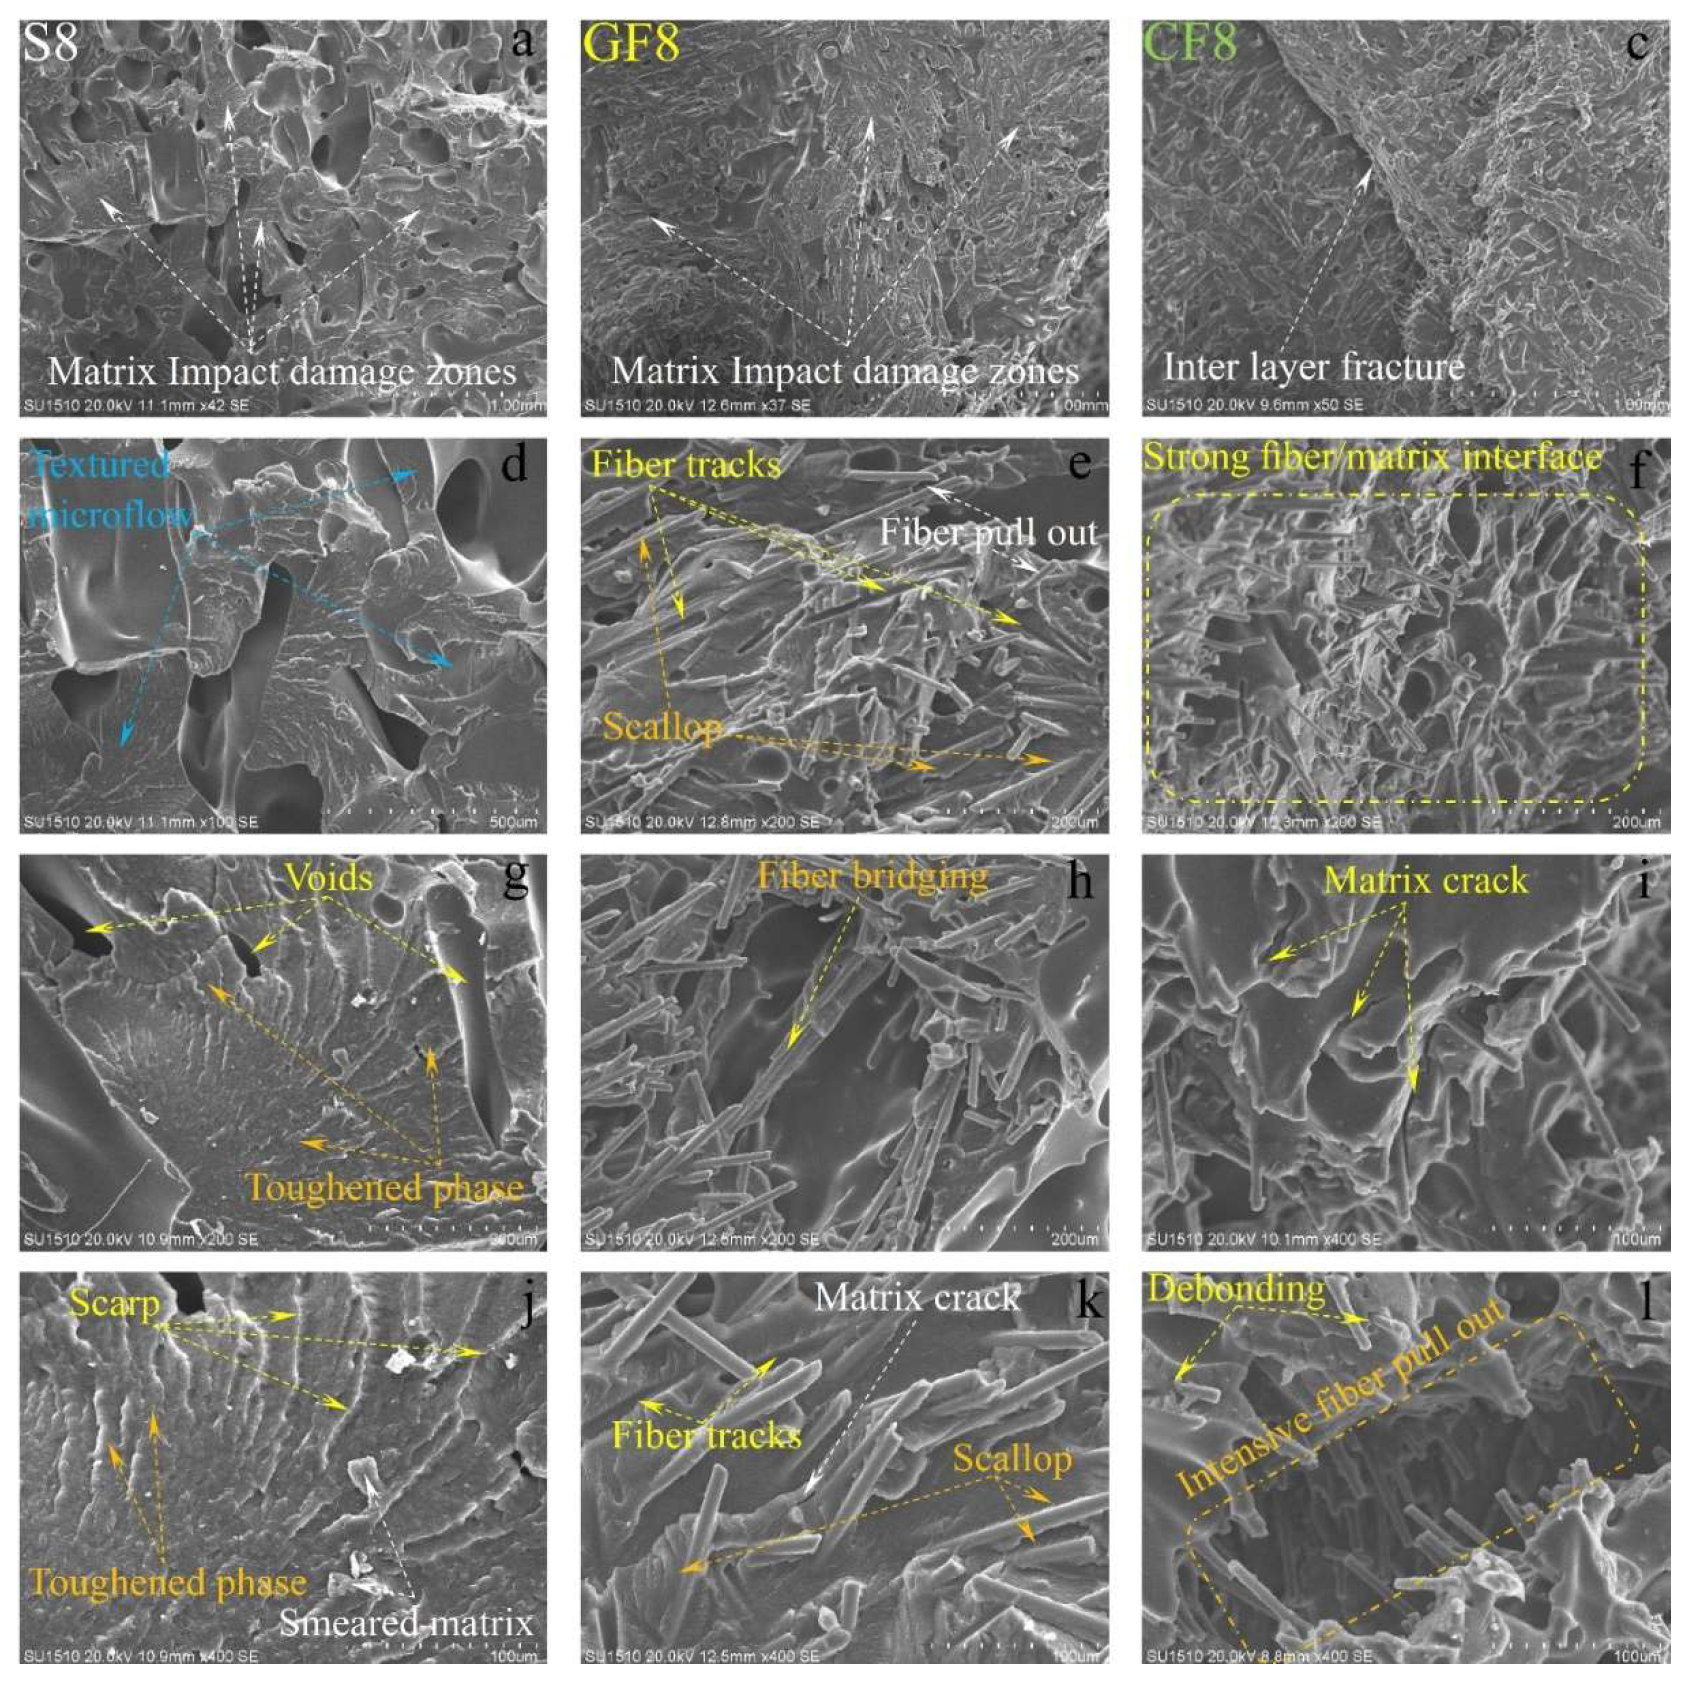
Figure 13, it can be clearly observed that the extruder width (EW)’s is evident in pure samples, especially at low temperatures. As the temperature increases, the formation of gaps between the EWs in pure samples is noteworthy (
Figure 2.a.). At is believed that this may due to contraction caused by rapid cooling during the printing of the first layer. In samples reinforced with glass and carbon fibers, although there are partially weak interfacial bonds between EWs at low temperatures (
Figure 13. b and c), it is observed that as the temperature increases, the fibers form bridging at the boundaries between the EWs (
Figure 13. k). During the production phase, it is believed that the flow of the liquid matrix facilitates the flow between the EWs, helping the structure to form more homogenously (
Figure 15. b, and c). Upon examining the facture surfaces, it is noted that in sample pure PA6 with 2th experiment, impact damages occur at the overlap surfaces of the EWs, while damage-free regions are identified at the boundary areas due to geometry (
Figure 13.j).
In fiber-reinforced samples (GF2, CF2), fiber pull-out, debonding, and matrix cracks have been observed (
Figure 13). Notably, intensive fiber pull-out damages have been identified in carbon fiber-reinforced samples. With the increase in temperature (
Figure 14 and
Figure 15), the changes in fracture surface morphology, particularly in pure PA6 samples, are striking.
On the damage surfaces of pure PA6 samples, damage such as textured microflow, toughened phase, and scarp have been particularly observed. It is believed that the changes in damage modes and fracture surface morphology are due to heat processing. In fiber-reinforced samples, particularly those reinforced with carbon fibers, a strong fiber-matrix interfacial bond has been observed. The smaller diameter and higher surface area of carbon fiber compared to glass fibers have contributed to the formation of a stronger fiber-matrix interfacial bond. In fiber-reinforced samples, toughness mechanisms such as debonding, pull-out, matrix cracks, and fiber bridging (
Figure 13,
Figure 14 and
Figure 15) have had a positive effect on the impact toughness of the samples.
When examining the SEM images in terms of voids, it was observed that in pure samples, large and non-homogeneous air voids formed between /in the EWs. In fiber-reinforced samples, voids appeared in certain shapes and more homogenous structures. Additionally, it was noted that in the fiber-reinforced samples, the EW line boundaries became less distinct due to fiber reinforcements, resulting in stronger boundaries compared to pure samples. This phenomenon was attributed to fibers remaining as protrusions outside the layer during the solidification of a lower layer, which became trapped in the melt during the formation of an upper layer. This situation facilitated the formation of a good interface between the layers, thereby improving the mechanical properties of the fiber-reinforced samples.
5. Conclusions
In this study, the impact strength of samples produced with PA6, PA6 GF30, and PA6 CF15 materials in the ZX critical orientation was investigated, and optimization was performed. The production parameters considered were nozzle temperature, layer thickness, number of outer walls, and post-processing heat treatment duration. Levels were determined for each factor, and an L9 orthogonal array experimental table was created using the Taguchi experimental design method. Based on the experimental table, tests were conducted for impact strength after producing samples for each material group in triplicate, and the average values were obtained. The S/N ratios were calculated using the Taguchi method, and effect and S/N graphs were generated. The remaining experiments were predicted using a prediction formulation, and the best and worst conditions were identified and listed. Experiments corresponding to the best and worst condition were produced and tested, and percentage error values were calculated. Subsequently, microscopic and SEM images of the fracture surfaces were obtained, and fracture analyses were conducted. The highest impact strength value was obtained from pure PA6 material, followed by PA6 GF30, while the lowest was from PA6 CF15 material. It was determined that the nozzle temperature of the 3D printer was the most significant parameters, and the post-processing heat treatment duration was also influential. The effect of layer thickness varied between pure and fiber-reinforced samples: as a layer thickness increased in pure PA6, the impact strength improved, while it decreased in others. The number of outer walls was 0 for pure PA6 samples, whereas one and two wall counts were effective for other materials. According to the fracture analyses results, it was observed that as temperature increased, the layer adhesion strength improved: however, due to the ZX critical direction of printing, fiber bonding did not occur between layers, resulting in lower properties compared to those obtained in the XY orientation. Nevertheless, an impact strength value approximately three times greater than that indicated in the literature and by the manufacturer’s datasheet was achieved.
This study indicates the need for comprehensive research and development efforts regarding the reduction in mechanical properties observed in samples produced in the ZX critical orientation. Although production planning for industrial products is typically in the XY orientation, there may still be areas where printing occurs in the ZX orientation. In such cases, regional differences in mechanical properties can arise, potentially leading to fracture before the part meets its expected life. Therefore, it is important for future studies to focus on developing new techniques that enable fibers to bond between layers, or to address these differences through hybrid printing techniques and homogenization methods.