
Submitted:
02 February 2026
Posted:
03 February 2026
You are already at the latest version
Abstract
The management of specialty coffee production represents a complex dynamical process characterized by highly nonlinear interconnections between environmental variables, agronomic practices, and chemical compositions. Traditionally, the classification of specialty coffee relies on sensory evaluations conducted by highly certified coffee experts Q-Graders, using a strict, standardized Specialty Coffee Association (SCA) protocol. However, scientific methods that generate spectral fingerprints provide a more reliable guarantee of quality while also ensuring traceability to the farm of origin. Panamanian Geisha coffee is one of the world's most expensive, award-winning microlots frequently exceeding $1,000 per pound, with a 2025 record-breaking price of over 30,000 American dollars per kilogram. This research introduces an integrated framework that combines Precision Agriculture Management Systems (PAMS) to support the identification of the spectral fingerprint using Near-Infrared (NIR) and Fourier Transform Infrared (FTIR) spectroscopy, enabling the objective characterization of chemical processes. A mathematical model is introduced to formally characterize the mobile application's behavior, distributed structure, and inherent constraints. Serving as a mathematical blueprint, this model identifies critical influencing factors and establishes strategic assumptions to distill complex real-world variables into a rigorous, manageable framework. Large-scale experiments conducted across more than 820 coffee farms in Chiriquí, Panama, demonstrate that the proposed decentralized architecture effectively coordinates the acquisition and synchronization of georeferenced chemical data. The decentralized architecture of the application utilizes private blockchain technology to facilitate autonomous operations, effectively decoupling the system from central authorities to ensure functional continuity in environments characterized by intermittent connectivity.
Keywords:
specialty coffee
; spectral fingerprint
; near-Infrared (NIR)
; traceability
; mobile application
; data-driven decision-making
1. Introduction
Specialty coffee refers to the highest grade of coffee available, distinguished by its exceptional flavor complexity. It offers a refined sensory experience, often featuring distinct notes of citrus, berry, chocolate, and caramel. In addition to unique flavor profiles and consistency this coffee must have a score 80 points or higher on the Specialty Coffee Association (SCA) scale [1], indicating superior quality. Because of its superior quality and traceable origins, specialty coffee consistently fetches a higher value than standard commodity beans.
The distinctive flavor of specialty coffee is generally found in the Arabica species (Coffea arabica). This variety is highly regarded for its organoleptic characteristics, which include a fragrant and complex aroma with flavors that can be sweet, fruity, caramel, or chocolate [2] among others. It also has the potential to possess pleasant acidity and a silky, balanced body. The Arabica species is most productive at elevations above 1,000 meters (m.a.s.l.), requiring a temperate climate with an annual mean of 17°C to 21°C for optimal development [3]. The quality of the coffee is associated with the altitude, in [4] shows how the quality exhibited in the cup by these coffees exceeds 88 points.
In recent years, Panama has stood out for the specialty coffee it produces, with the Geisha variety being the most awarded [5] of the world, consistently setting new standards for excellence. However, other varieties are grown in the country that obtain high scores on the SCA scale and are categorized as specialty coffees. Of these, over 60% of the coffee grown is Arabica. The main Arabica coffee plantations are located in the province of Chiriquí, especially in highland areas such as Boquete, Tierras Altas, and Renacimiento frontier with Costa Rica. These areas have the ideal altitude, climate, and soil for growing Arabica coffee plants. Growers in these areas lack the spectral fingerprint of the coffee they produce, [6] moreover as a food product highly susceptible to adulteration, therefore coffee requires scientific methodologies to authenticate its quality. Such measures are essential to prevent fraudulent practices and guarantee both the geographic origin and variety of the beans. Furthermore, they have little recorded information on the coffee varieties cultivated, which prevents them from conducting traceability studies [7], [8], [9]. According to ISO 22005:2007 [10], traceability is defined as “the ability to trace the history, application, or location of what is being considered”; however, to strengthen traceability, blockchain is used because, together with traceability, it offers security, full transparency and efficiency. ISO 23635:2022 [11] defines blockchain as a distributed database for immutable, shared records, secured by cryptography, which is a natural way to strengthen the system.
Records are mostly kept manually without the use of Information and Communication Technologies (ICTs) or Geographic Information Systems (GIS) [12]. This prevents growers from maintaining the quality of the coffee produced, and to make quick and even assertive decisions regarding improvements in coffee quality that would allow them to obtain maximum profits at the time of sale, make data-driven decisions [13], [14], [15], and even use smart technologies to improve farm management [16], [17], [18], [19].
The use of automated systems as the proposed apps provides multiple benefits to producers in the region [20], [21], [22]. Good information management can improve agricultural productivity [23], it allows for studies related to the coffee produced by each farm [24], [25], [26], encourages sustainable practices [27] and the adoption of smart practices on farms [28], [29].
Panamanian Geisha coffee is one of the world's most expensive, award-winning microlots frequently exceeding $1,000 per pound, with a 2025 record-breaking price of over 30,000 American dollars per kilogram. Warranty the coffee quality generally falls into two categories; product satisfaction and the coffee beans themselves.
However, only scientific methods could certify the chemometric of the coffee to ensure that the lots belong to a specific region [30]. To achieve this objective, it is necessary to integrate agronomic processes, technological infrastructure, and scientific data analysis, as illustrated in Figure 1. Utilizing a mobile support system via a dedicated app streamlines spectroscopic analysis for specialty coffee farms. By implementing traceability from the farm source to the laboratory, this system accelerates the evaluation process, helping growers that work in complex geography and diverse climatic conditions.
Traceability underpins the entire workflow, integrating it into a Precision Agriculture Management System (PAMS) by automatically recording using a cellphone the geospatial data associated with all photographic and video documentation. Data registered through the application is linked to grower-provided samples via a unique identification code. This information is synced to a centralized system to eliminate redundancy and provide robust support for the decision-making process
This research introduces a mobile application that enables growers to submit georeferenced 500 grams coffee bean samples to establish a unique coffee fingerprint. The process utilizes spectroscopic analysis, a chemical-free alternative for identifying the sample's distinct chemical profile. This chemical data is compiled to construct a comprehensive chemometric map of the region's farms.
To maximize the map's efficacy, broad participation from diverse producers is essential; a robust variety of samples enables the algorithms to cross-reference spectra and isolate the distinct characteristics necessary for classifying different regions and coffee varieties. It should be emphasized that we were entrusted with detailed information on each producer participating in the study, a responsibility that rests on the confidence placed in us by the coffee sector.
2. Materials and Methods
2.1. Farm Locations
The study area, illustrated in Figure 2, identifies over 820 coffee farms within the Chiriquí province. A significant number of these producers utilize the mobile application, facilitating the collection of samples required for this research. It highlights that there are registered farms with Arabica coffee located at altitudes below 1000 meters. Although these coffees do not achieve specialty coffee scores, the producers are interested in obtaining the spectral fingerprint of their coffee to conduct future analyses that will allow them to improve product quality and origin certification.
The coffee farms under study are in Boquete, Tierras Altas, and Renacimiento in the province of Chiriquí. These farms are situated at altitudes ranging from 1300 to 2300 meters above sea level with temperatures ranging from 10°C to 21°C. The mountainous terrain of these regions provides the ideal elevation and perfect conditions for growing Arabica coffee. This map highlights the geographic distribution of over 820 coffee farms where each data point represents a specific farm, color-coded by an altitude legend ranging from 122 m (blue) to over 2100 m (red).
This spatial data is a core component of the application, as it provides traceability by linking the spectral fingerprint of the coffee to its exact coordinates and elevation. Additionally, the interactive interface allows for detailed data management, as shown in the pop-up for the on grower. This digital map includes georeference critical agronomic information such as: coffee species, scale of the farm in hectares, topography ( altitude in m.a.s.l.). By centralizing this information into a cloud, the system eliminates duplicate records and provides the scientific data necessary to support informed decision-making across the region. As Spanish is the official language of Panama, both the regional map and the application interface are provided in Spanish.
This region has volcanic soil, is rich in nutrients and very fertile, and the climate is also conducive to coffee cultivation [31]. All these characteristics allow for the harvesting of high-quality varieties. Each region is distinguished by its unique coffee profile, where the microclimates on farms can vary considerably depending on factors such as altitude, rainfall, and humidity among others.
It is estimated that the highest top quality specialty coffees, with a score above 90, have grown between 1,600 and 1,900 meters above sea level with an average temperature between 16°C and 18°C. The mainly volcanic heritage of the Barú Volcano creates a nutrient-rich terroir, providing the essential conditions for the Geisha variety to reach its peak quality and expression. Table 1 presents the altitude and temperature range of Specialty Coffee for each region.
2.2. Spectroscopy Analytical Techniques
Determination of chemical compounds of roasted coffee by Near-Infrared Spectroscopy (NIR) or by Fourier Transform Infrared (FTIR) has been consolidated as a reliable, objective, reproducible, verifiable, inexpensive and low-environmental impact secondary analytical technique [32]. These analytical methods effectively differentiate between diverse coffee varieties and geographical origins, while detecting potential adulterants. By analyzing specific molecular vibrations, these techniques evaluate quality with high precision, serving as a fundamental tool for quality assurance.
The workflow is divided into two main phases called the coffee grower's processes and the scientific analysis processes, as shown in Figure 3. During the initial stage (1), coffee growers use a mobile application to capture georeferenced photos and videos on-site. This data is then transmitted to a central cloud server, secured by a unique, immutable key. Each sample shall consist of 500 g of parchment coffee. To ensure a comprehensive characterization, three distinct evaluations will be conducted: sensory analysis, chemical profiling, and spectral analysis. Subsequent stages are performed in a laboratory setting by scientific or data engineers, who apply various analytical methods to generate the insights necessary for decision-making.
The grinding (2) is a critical step because spectroscopy is highly sensitive to physical factors such as particle size, compaction, and light scattering. Therefore, the following are recommended:
- Use a grinder that produces a homogeneous particle size distribution.
- Avoid overheating during grinding to prevent the modification of volatile compounds.
- Sieve if necessary to standardize particle size.
- Store samples in airtight containers to prevent moisture absorption.
- Homogeneity reduces non-chemical spectral variability and improves the robustness of the models.
The following steps (3 and 4) are critical for transforming noisy, raw spectral signals with physical interference into actionable intelligence. This rigorous process ensures the model transcends mere correlation to achieve true predictive reliability. By systematically isolating chemical data from physical noise, you guarantee a calibration that is both robust and legally defensible for industrial applications such as coffee fingerprint certification.
- Spectral preprocessing: This step involves applying mathematical transformations to the spectra such as Standard Normal Variate (SNV), Multiplicative Scatter Correction (MSC), Savitzky–Golay (SG) smoothing, and derivatives. These transformations reduce physical effects such as light scattering, particle size variability, and baseline shifts, while enhancing relevant chemical information.
- Dataset splitting: The data are divided into calibration and validation sets in order to objectively assess the model. Generally, calibration (≈70–80 %) and validation (≈20–30 %).
- Chemometric model construction: Models are developed to relate spectral information to the variables of interest, using Principal Component Analysis (PLS) for quantitative prediction and Partial Least Squares Discriminant Analysis (PLS-DA) for classification. The optimal number of latent variables is determined by cross-validation to balance model fit and robustness.
- Model validation: Testing the model against independent data to ensure it isn't overfitted. A suitable model shows consistent performance between calibration and validation.
- Performance evaluation: Model performance is assessed using appropriate statistical metrics. For prediction models, Coefficient of Determination (R²), Root Mean Square Error of Calibration (RMSEC), Root Mean Square Error of Prediction (RMSEP), and Residual Predictive Deviation (RPD). For classification models are evaluated using accuracy, sensitivity, specificity, and confusion matrices.
- Interpretation and application: Finally, the model is chemically interpreted to identify relevant spectral regions and ensure consistency with coffee composition, enabling its practical application in quality control and authenticity assessment.
It's important to mention that the performance and robustness of NIR/FTIR-based chemometric models for coffee analysis are governed primarily by the quality of the experimental design and spectral preprocessing strategies rather than by the choice of the modeling algorithm.
2.3. Methodology Used for the Project
The Agile Scrum methodology was used during the project because it facilitates collaboration among highly competitive teams and results in high-impact work [33], [34], [35]. Furthermore, it incorporates best practices. It is recommended for use in projects with complex and innovative environments, such as the one that will be carried out with specialty coffee.
The process is divided into three logical phases that occur within each work cycle:
- Planning and Estimation: This stage involves identifying requirements, establishing project objectives, and creating the product backlog.
- a.
- Product Backlog: This constitutes the master list of all the project's features, fixes, and requirements, such as Blockchain integration or a QR code scanning module. The producers are responsible for managing it.
- Implementation: The team begins developing the project in sprints, or development cycles, that last two to four weeks. Each sprint starts with a daily Scrum meeting to review task progress and adjust the work plan as needed. During each sprint, the team focuses on developing the most important features in the backlog. The result of this phase is the Sprint Backlog.
- Review and Retrospective: Results are evaluated at the end of each sprint. A sprint review is conducted, in which the working software is presented to the team for direct feedback. This feedback is used to adjust the product backlog and plan the next sprint. Sprint retrospective is also held, in which the team meets privately to analyze their process and identify areas for improvement for the next sprint.
The Scrum methodology begins with sprint planning and the development of the product backlog. The project lifecycle concludes with the final delivery sprint. The complete final product, fulfilling the functionalities and requirements defined at the project's outset, is delivered. Figure 4 illustrates the process of the scrum methodology.
2.4. Mathematical Model Representation
A model is a simplification of a complicated phenomenon with the help of mathematical terms and symbols [36], by abstracting a complex real-world application into symbols and relations. It provides several critical benefits for engineering and system design to create a real model of the real-world situation; the real-world problem should be simplified.
Therefore, the mathematical model of this app acts as a blueprint that uses the language of mathematics to define a system's behavior, structure, and constraints. To do this, multiple assumptions can be made, and key influencing elements must be identified. The System S (1) as a tuple means a set of components (states, inputs, outputs, and functions) that fully describe how the system behaves. We model the application as a labeled transition system with data and synchronization:
The system is defined as an ordered collection of components as a tuple in Equation 1; the individual components are detailed in Table 2.
This system’s entity application sets define the fundamental building blocks of the domain and provides the structural basis for all states and operations detailed in Table 3.
Core Functions define the derived structure and semantics over the domain entities E of the static domain universe. They are not transitions; instead, they are interpretive mappings that give meaning to data.
The location function (2) establishes the organizational structure of agricultural data. It maps each farm to its specific zone, effectively representing the spatial relationship between entities.
Provenance function (3) assigns each piece of coffee farm or coffee process to the user who created it. Conceptually answering the questions of who recorded the data, where, and when, this function plays an important role in the system by providing traceability and accountability.
The Farm evidence set function (4), denoted as , represents the complete collection of all evidence items associated with a specific farm . By utilizing the projection function , the system extracts the farm component from the provenance tuple to aggregate all relevant observations belonging to that entity
The Edge–Cloud Architecture , represented in function (5) in this application model is designed to manage data across two distinct layers: the local field environment and the centralized server . This dual-layer approach allows the system to remain operational in remote farm locations where connectivity might be intermittent.
Data is generated and processed locally at the edge and later consolidated in the cloud, where the use of blockchain is a very important technology to avoid modifications of coffee samples.
Each stored object is associated with a pair of versions. Every stored object uses a version vector pairing local and cloud versions. This mechanism allows the system to tolerate temporary divergence during intermittent connectivity, ensuring data integrity by identifying deltas for synchronization.
The system’s tolerance for temporary divergence under intermittent connectivity it’s an important feature, because the estimated population of Panama is approximately 4.5 million to 4.58 million inhabitants as of 2025-2026, however 80% of urban households have internet access, this drops to around 46% in rural areas where the coffee farms are located. The global application state at time is defined formally by the function (7).
where represents authentication and authorization state, represents user interface state, denotes the logical database, and is the queue of pending operations or synchronization tasks. Together, these components provide a complete snapshot of the system at any moment.
Synchronization is expressed formally in function (8) is the mechanism by which divergent edge and cloud states are reconciled to ensure eventual consistency. At each time , the system identifies the divergence set, which contains all stored objects whose edge versions are more recent than their cloud counterparts.
This synchronization strategy guarantees monotonic progress, avoids data loss, and supports eventual convergence between edge and cloud replicas despite asynchronous execution and intermittent connectivity.
There exists a Relationship Between Core Functions and Synchronization, where core functions define data's semantic meaning and provenance, remaining timeless and independent of synchronization. Conversely, synchronization manages the operational propagation of state across distributed components. Combined, they ensure data consistency and correctness, enabling reliable predictive insights and supporting offline operations through a clear formal separation of concerns. This separation of concerns enables scalability and system behavior over time while remaining faithful to farm local constraints such as offline operation and delayed connectivity.
2.5. Spectral Traceability of the Specialty Coffee
Traceability through spectral fingerprinting in specialty coffee allows the identity of the bean to be protected against fraud, ensuring its terroir, variety and quality.
The French concept of terroir describes the unique combination of environmental and human factors that give coffee a flavor and personality that cannot be replicated anywhere else in the world. It consists of four fundamental pillars:
- Climate and Microclimate: This includes average temperatures, rainfall patterns, humidity, and sun exposure. In specialty coffee, the temperature range—a term referring to the sharp temperature changes between day and night—forces the bean to mature more slowly, concentrating more sugars and complex acids. The study areas exhibit diverse microclimates with a marked temperature range.
- Geography and Altitude: Altitude also influences coffee quality, as higher altitudes mean less oxygen and lower temperatures. This slows down plant growth and increases plant density. Other influencing factors include the slope of the land and its orientation relative to the sun.
- The Soil: The chemical composition of the soil, such as pH, minerals, and drainage capacity, nourishes the plant in a specific way. Volcanic soils are notable for their acidity and mineral notes, which are highly valued in the market. The areas studied are characterized by volcanic soil.
- Human Factor and Tradition: which include producer decisions such as the variety planted, the cultivation techniques used, and the processing methods employed, such as fermentation and drying.
Terroir defines the exact chemical composition of the coffee bean, which can be read through its spectral fingerprint. This is equivalent to possessing the environmental DNA that allows us to confirm whether a specialty coffee truly comes from the place indicated on its label.
Spectral traceability is based on the intrinsic chemistry of coffee. This is carried out through the following steps:
- 1.
- Origin Characterization: This involves mapping the production areas. To do this, coffee samples are collected from farms to create a reference database. Each sample is analyzed using near-infrared (NIR will be used in this study) spectroscopy to capture the chemical signature of the soil and the plant. Values are also obtained, which are "recorded" in the hydrogen and oxygen isotopes of the bean, for various variables such as altitude, rainfall cycle, and soil nutrients.
- 2.
- Sampling of Green Grain: Before export, green coffee is analyzed to verify that its fingerprint matches that of the declared origin. This involves scanning the unroasted beans, whole or ground, with a spectrophotometer to detect if the batch has been mixed with lower-quality beans or beans from another region.
- 3.
- Monitoring during the Roasting: Roasting alters the chemical composition of coffee, creating a new "fingerprint" of the process. Spectroscopy is used to maintain the roast profile. It validates two key factors for this category: whether the uniformity of the color has been maintained and whether the roasting level is appropriate to highlight the notes of specialty coffee.
- 4.
- Sensory Quality Analysis: The sensory quality of coffee can also be validated by comparing spectral curves with cupping scores (SCA). This is possible because certain spectral signatures are linked to specific high levels of acidity or sweetness, allowing for a quick and objective prediction of cup quality (above 80 points).
- 5.
- Verification at the Point of Sale: To confirm authenticity, the importer or final roaster can scan the package to see the "fingerprint" that guarantees the coffee is indeed from the specified farm. Spectral data is typically linked to this "fingerprint" via a QR code or blockchain system as in this study.
3. Results
The mobile app includes several features that will allow producers to obtain a spectral fingerprint of the coffee they produce and improve traceability using blockchain technology. It will also help them maintain productivity and coffee quality. Figure 5 presents a general outline of the main features of the app. This was designed to be easy and intuitive to use for producers.
Its development used best practices and technologies recommended by Google to create native, robust, and scalable Android applications.
- •
- Kotlin Programming Language: selected as the official language for Android development due to its null-safety, conciseness, and complete interoperability with the Java ecosystem.
- •
- The application architecture: implements the MVVM (Model-View-ViewModel) pattern with the following layers:
- ○
- Interface Layer (UI Layer): Built with Jetpack Compose, a declarative framework for user interfaces. This layer is limited to displaying the state provided by the ViewModel and notifying user interactions, without containing business logic.
- ○
- ViewModel: manages interface logic and state, using StateFlows to expose data to the UI. It is designed to survive configuration changes, such as screen rotations.
- ○
- Data Layer: Manages all data sources using the Repository pattern, isolating the ViewModels from the source of the data (local database or web services).
- •
- User Interface Framework: Jetpack Compose, which allows for the development of complex interfaces with less code, in an intuitive way, and with reusable components. The visual design strictly adheres to the Material Design 3 (M3) guidelines.
- •
- Local Storage:
- ○
- Structured and Relational Data: Room, an abstraction layer on top of SQLite, is used to simplify database access and perform compile-time query verification for managing batches, farms, and processes.
- ○
- Key-Value Data: Jetpack DataStore is used to store user preferences and session tokens.
- •
- Backend Communication:
- ○
- The application connects to a server using a RESTful API.
- ○
- Retrofit is used to define API calls declaratively, along with OkHttp as the HTTP client.
- ○
- JSON object serialization and deserialization are performed with Moshi, optimized for Kotlin.
- •
- Asynchronous Management: Background operations, such as network calls or database access, are handled with Kotlin coroutines, ensuring a smooth, non-blocking interface.
- •
- Dependency Injection: Hilt is used to manage dependencies throughout the application, simplifying the architecture, facilitating testing, and reducing repetitive code.
To use the application, each producer must create a username and password to register, as shown in Figure 6A. This will allow them to log in to the application. Formally, it is represented in the model as: .
The following describes the registration process using the application that characterizes the origin of the coffee in the spectral traceability system.
The user must register the farm by completing the corresponding information about the owner. Figure 6B shows the personal information that the coffee farm owner must provide.
When a property is registered, a unique code is generated, which is the ID that allows access to its information in the database. Additionally, the name by which the property is known in the sector, the zone, the total area, the cultivated area, and the altitude must be entered; this screen can be seen in Figure 7A. Figure 7B shows the screen displaying the areas where property registrations are being carried out. This information establishes a relationship of belonging of the property to one or more zones. Represented in the model as , where . This relation is used by the Loc location function to locate the specific zone Z in the farm F.
To register the coffee variety planted on the farm, Figure 8A shows the screen with the different varieties that the user can select. A farm can have several coffee varieties planted; in this case, the coffee variety planted on the plot is indicated. Also, the processing method used for the coffee and the certifications held by the farm must be recorded, very important information for specialty coffees, see Figure 8B.
Before the harvest begins, coffee samples are collected from the farms. This involves recording videos and taking photos of the samples by batch, including georeferenced data with the encrypted key to generate the blockchain of this process, as shown in Figure 9A. This data is used for the provenance function (Prov) and farm evidence functions (Hf). Finally, the synchronization function δ (t), ensures that data is sent correctly and stored in the database DB(t).
The samples are sent for analysis using near-infrared technology. Additionally, a record of the activities performed each day is kept, as shown in Figure 9B.
4. Discussion
The results of this study constitute a viable and scalable solution for improving traceability, quality assurance, and decision-making in specialty coffee production through the integration of a mobile Precision Agriculture Management System (PAMS) with spectroscopic and chemometric analyses. The proposal introduces a data-driven methodology capable of supporting producers [13], [15], distinct from the traditional method based on expert sensory evaluation, which is subjective and costly. Table 4 shows the comparison between the two approaches.
The incorporation of near-infrared (NIR) spectroscopy as a fundamental analytical technique provides a solid foundation for chemical identification and quality discrimination. This is because the effectiveness of chemometric models depends primarily on experimental design and spectral preprocessing strategies. This observation is consistent with findings in coffee authentication and analysis, which indicate that preprocessing techniques play a decisive role in reducing physical variability and enhancing chemically relevant information [32].
The association of spectral fingerprints with precise geospatial, environmental, and management data significantly improves coffee traceability and differentiation. The system allows for the measurement and verification of terroir by linking chemical composition with altitude, microclimate, soil characteristics, and post-harvest practices. This capability is fundamental for high-value Panamanian specialty coffees, especially the Geisha variety, where origin authentication and fraud prevention are essential for maintaining market confidence and premium pricing [5], [24], [25].
The proposed system provides a more comprehensive traceability model compared to existing traceability approaches that are primarily based on manual digital records or QR codes. Although QR code-based systems improve access to information, their ability to guarantee authenticity or prevent data manipulation is limited [7], [8]. In contrast, the integration of spectral fingerprinting with immutable blockchain records and georeferenced evidence in the proposed system offers a higher level of security throughout the coffee value chain, from the farm to the point of sale [9].
The system facilitates data-driven decision-making by enabling producers to correlate spectral, agronomic, and sensory data over time, helping to bridge the technological gap between coffee producers and quality certification processes. This supports incorporating smart farming and precision agriculture technologies to improve productivity, sustainability, and quality consistency in coffee production systems [16], [19], [28].
The mobile application effectively addresses the problem of internet connectivity, one of the most critical limitations faced by coffee producers in rural regions, by implementing an edge-cloud architecture combined with blockchain-based version control and immutability. This ensures data integrity and enables offline operation.
This approach is consistent with previous research on cloud and edge computing applied to agricultural systems, which identified resilience, consistency, and fault tolerance as essential properties for rural implementations [17], [18]. Furthermore, the formal mathematical model presented in this work provides a rigorous abstraction of the traceability, provenance, and synchronization processes, reinforcing the system's transparency and reproducibility, an aspect often lacking in comparable agricultural traceability solutions [8], [9].
Despite the advantages presented above, future studies should address the validation of differences between processing methods and roasting profiles because they may introduce additional sources of variability.
5. Conclusions
This research presents an innovative system for specialty coffee traceability that integrates mobile computing, edge-cloud architectures, blockchain technology, and spectroscopic chemometrics. The system proposes a scientifically based method for characterizing coffee quality and authenticating its origin.
The mobile application enables on-farm data collection, capturing georeferenced evidence, videos, and agronomic data. All of this is achieved without compromising functionality, even under limited connectivity conditions. Furthermore, the formal mathematical model ensures consistency, provenance, and traceability among the distributed components, providing a solid foundation for scalability. Finally, the use of near-infrared spectroscopy allows for the creation of reliable spectral fingerprints that reflect the intrinsic chemistry of specialty coffee and its terroir.
The system supports producers in improving the quality, productivity, and market position of their coffee by providing them with spectral data on their coffee production, facilitating data-driven decision-making. Furthermore, it enhances transparency, reduces the risk of coffee adulteration, and strengthens consumer confidence, all crucial aspects for specialty coffees like those produced in Boquete, Tierras Altas and Renacimiento.
The proposed system represents a significant step toward the digital transformation of specialty coffee production through the use of science-based, scalable technologies focused on the producer's needs. Future plans include expanding the system to work with other regions and non-specialty coffee varieties. Additionally, predictive models will be developed and validated under diverse environmental conditions to identify various factors that can contribute to improving coffee quality.
Supplementary Materials
The free version of the apps can be downloaded at: Preprints.org.
Author Contributions
Conceptualization, E.E.C., M.J., and C.R.; methodology, M.V., and A.V; validation, M.V., J.C., and M.J.; formal analysis, C.R., D.C., and A.V.; investigation, A.V., and M.J.; data curation, C.R., J.C., and E.E.C.; writing—original draft preparation C.R.; writing—review and editing, E.E.C.., and M.J.; supervision, A.V., and E.E.C.. All authors have read and agreed to the published version of the manuscript.
Funding
This research received no external funding.
Institutional Review Board Statement
Not applicable.
Informed Consent Statement
Not applicable.
Data Availability Statement
The data presented in this study are available upon request from the corresponding author.
Acknowledgments
The authors would like to thank Best of Panama (BOP) for providing access to Q-Grader data standards, as well as the Ministry of Agricultural Development (MIDA) for their data regarding coffee producers. We also extend our gratitude to the staff at the Center for Research on Natural Resources (CIRN) at the Autonomous University of Chiriquí (UNACHI). Finally, we would like to recognize the National Research System of Panama (SNI) for their invaluable support and collaboration throughout this research project.
Conflicts of Interest
The authors declare that there is no conflict of interest regarding the publication of this paper.
References
- Fadli, F.; Baidhawi, B.; Adhiana, A. ANALYSIS OF COFFEE QUALITY CONTROL BASED ON SCA (SPECIALTY COFFEE ASSOCIATION) STANDARDS ON ARABICA COFFEE AT DEPUTROE COFFE. Int. J. Econ. Agribisnis Dev. Stud. 2024, vol. 1(n.o 2), 62–69. [Google Scholar]
- Assa. , «Chemical compounds and sensory characteristics of Arabica coffee (Coffeaarabica) as a novel specialty coffee from Sinjai Regency, Indonesia. Food Res. 2021, vol. 5(n.o S2), 107–112. [Google Scholar] [CrossRef]
- Loppies, J. E. , «Physical quality and flavor profile of arabica coffee beans (Coffea arabica) from Seko, South Sulawesi as a specialty coffee». IOP Conf. Ser. Earth Environ. Sci. 2024, vol. 1338(n.o 1), 012048. [Google Scholar] [CrossRef]
- Ramos, M. F.; Ribeiro, D. E.; Cirillo, M. Â.; Borém, y F. M. Discrimination of the sensory quality of the Coffea arabica L. (cv. Yellow Bourbon) produced in different altitudes using decision trees obtained by the CHAID method. J. Sci. Food Agric. 2016, vol. 96(n.o 10), 3543–3551. [Google Scholar] [CrossRef] [PubMed]
- «Best of Panama Eauction—Specialty Coffee. 2025. Available online: https://bestofpanama.auction/.
- Núñez, N.; Saurina, J.; Núñez, y O. Liquid Chromatography–High-Resolution Mass Spectrometry (LC-HRMS) Fingerprinting and Chemometrics for Coffee Classification and Authentication. Molecules 2023, vol. 29(n.o 1), 232. [Google Scholar] [CrossRef]
- Querme, M. Eduarda Terra; Lima, D. Araújo. Traceability Automation in Coffee Production: A Case Study on QR Code Integration to Optimize Manual Steps. Arch. Adv. Eng. Sci. 2023, vol. 2(n.o 3), 170–180. [Google Scholar] [CrossRef]
- Camacho, J. J. A.; Gómez, A. M. M.; Riaño, L. N. A. TRACEABILITY ARCHITECTURE TECHNOLOGY FOR SHORT COMMERCIAL EXCHANGE». In Proceedings of the International Conference on Industrial Engineering and Operations Management; IEOM Society International: Sao Paulo, Brazil, 2021; pp. 2695–2708. [Google Scholar] [CrossRef]
- Tadesse, M. D.; Gebresenbet, G.; Ljungberg, D.; Tavasszy, y L. Digital Traceability Capabilities: The Case of the Ethiopian Coffee Supply Chain. Future Transp. 2024, vol. 4(n.o 3), 780–794. [Google Scholar] [CrossRef]
- Available online: https://www.iso.org/obp/ui#iso:std:iso:22005:ed-1:v1:en.
- Available online: https://www.iso.org/obp/ui/es/#iso:std:iso:ts:23635:ed-1:v1:en.
- Katya Kule, E.; Kyohangirwe, A.; Midamba, D. C.; Byakatonda, y J. Determinants of adoption of climate-smart agricultural technologies among smallholder coffee farmers in Western Uganda. Cogent Soc. Sci. 2025, vol. 11(n.o 1), 2588856. [Google Scholar] [CrossRef]
- Jakkaew, P.; Yingchutrakul, Y.; Aunsri, y N. A data-driven approach to improve coffee drying: Combining environmental sensors and chemical analysis. PLOS ONE 2024, vol. 19(n.o 2), e0296526. [Google Scholar] [CrossRef]
- Chiang, W.-Y. Using a data-driven marketing strategy on customer relationship management: an empirical case of urban coffee shops in Taiwan. Br. Food J. 2021, vol. 123(n.o 4), 1610–1625. [Google Scholar] [CrossRef]
- Tolulope Joel y Vincent, Oloruntosin; Oguanobi, Ugochukwu. Data-driven strategies for business expansion: Utilizing predictive analytics for enhanced profitability and opportunity identification. Int. J. Front. Eng. Technol. Res. 2024, vol. 6(n.o 2), 071–081. [Google Scholar] [CrossRef]
- Sott, M. K. Precision Techniques and Agriculture 4.0 Technologies to Promote Sustainability in the Coffee Sector: State of the Art, Challenges and Future Trends. IEEE Access 2020, vol. 8, 149854–149867. [Google Scholar] [CrossRef]
- Montoya-Munoz y, I.; Rendon, O. M. C. An Approach Based on Fog Computing for Providing Reliability in IoT Data Collection: A Case Study in a Colombian Coffee Smart Farm. Appl. Sci. 2020, vol. 10(n.o 24), 8904. [Google Scholar] [CrossRef]
- Hong, S.; Park, S.; Youn, H.; Lee, J.; Kwon, y S. Implementation of Smart Farm Systems Based on Fog Computing in Artificial Intelligence of Things Environments. Sensors 2024, vol. 24(n.o 20), 6689. [Google Scholar] [CrossRef]
- Bahri, T. S.; Manyamsari, I.; Putri, R. J.; Iskandar, y E. Technology needs assessment for the development of smart coffee production in Aceh, Indonesia. IOP Conf. Ser. Earth Environ. Sci. 2024, vol. 1290(n.o 1), 012053. [Google Scholar] [CrossRef]
- Muñoz-Belalcazar, J. A.; Benavides-Cardona, C. A.; Lagos-Burbano, T. C.; Criollo-Velázquez, C. P. Manejo agronómico sobre el rendimiento y la calidad de café (Coffea arabica) variedad Castillo en Nariño, Colombia. Agron. Mesoam. 2021, vol. 32(n.o 3), 750–763. [Google Scholar] [CrossRef]
- Hernández-Salazar, C. A.; González-Estrada, O. A.; González-Silva, G. Integración de la inteligencia artificial y la agricultura de precisión en cultivos de café. Rev. UIS Ing. 2024, vol. 23(n.o 4). [Google Scholar] [CrossRef]
- Rojas-Ruiz, R.; Alvarado-Huamán, L.; Borjas-Ventura, R.; Torres, E. C.; Castro-Cepero, V.; Julca-Otiniano, A. CARACTERIZACIÓN DE FINCAS PRODUCTORAS DE CAFÉ CONVENCIONAL Y ORGÁNICO EN EL VALLE DEL ALTO MAYO, REGIÓN SAN MARTÍN, PERÚ. ISSN.
- Wulandari y, S.; Ferry, Y. Strategies on technology management for coffee smallholder to promote the smart farming implementation. IOP Conf. Ser. Earth Environ. Sci. 2021, vol. 759(n.o 1), 012057. [Google Scholar] [CrossRef]
- Vega, J. A. D.; León; Reyes, S. M.; Gallardo, J. M. Modelo matemático para determinar la correlación entre parámetros fisicoquímicos y la calidad sensorial de café Geisha y Pacamara de Panamá. Inf. Tecnológica 2021, vol. 32(n.o 1), 89–100. [Google Scholar] [CrossRef]
- Vega; Reyes, S. M.; Troestch, y J. Physicochemical Parameters and Multivariate Analysis to Predict the Sensory Quality in Specialty Coffee from Panama. ACS Omega 2025, vol. 10(n.o 13), 13251–13259. [Google Scholar] [CrossRef]
- Vega; Reyes, S.; León, J. D.; Bonilla, A. CUANTIFICACIÓN DE CAFEÍNA EN CAFÉS COMERCIALES DE PANAMÁ. Cienc. Tecnol. 2014. [Google Scholar]
- Trigoso, J.-A. C.; Valderrama, N. L. M.; Trujillo, P.-A. R.; Rosero, L. M. G. Sostenibilidad del café: revisión sistemática de la literatura. Rev. Venez. Gerenc. 2021, vol. 26(n.o 95), 943–961. [Google Scholar] [CrossRef]
- Saiful Bahri, T.; Sakti Nasution, I.; Iskandar, y E. The study of smart farming for the sustainable coffee plantation. IOP Conf. Ser. Earth Environ. Sci. 2025, vol. 1510(n.o 1), 012051. [Google Scholar] [CrossRef]
- Pradhana y, A. S.; Kotama, I. N. D. Mobile Application Development for Robusta Coffee Planting Cycle Mapping and Recording as Part of an Initiative to Revitalize Smart-Agriculture Technology. 2023, vol. 13(n.o 02). [Google Scholar]
- Abreu, M. B.; Marcheafave, G. G.; Bruns, R. E.; Scarminio, I. S.; Zeraik, M. L. Spectroscopic and Chromatographic Fingerprints for Discrimination of Specialty and Traditional Coffees by Integrated Chemometric Methods. Food Anal. Methods 2020, vol. 13(n.o 12), 2204–2212. [Google Scholar] [CrossRef]
- Specialty Coffee Panama. Available online: https://scap-panama.com.
- Gómez, R. Determination of chemical compounds of roasted coffee by Near-Infrared Spectroscopy (NIRS); Cenicafé, 2023. Available online: https://publicaciones.cenicafe.org/index.php/cenicafe/article/view/361.
- Gamboa, J. P. Z.; Arreaga, C. A. L. Evolución de las Metodologías y Modelos utilizados en el Desarrollo de Software. Evolution of the Methodologies and Models used in Software Development. 2018, vol. 3(n.o 10). [Google Scholar]
- Hema, V.; Thota, S.; Naresh Kumar, S.; Padmaja, C.; Rama Krishna, C. B.; Mahender, y K. Scrum: An Effective Software Development Agile Tool. IOP Conf. Ser. Mater. Sci. Eng. 2020, vol. 981(n.o 2), 022060. [Google Scholar] [CrossRef]
- Pargaonkar, S. A Comprehensive Research Analysis of Software Development Life Cycle (SDLC) Agile & Waterfall Model Advantages, Disadvantages, and Application Suitability in Software Quality Engineering. Int. J. Sci. Res. Publ. 2023, vol. 13(n.o 8), 120–124. [Google Scholar] [CrossRef]
- Pohjolainen, S. (Ed.) Mathematical Modelling; Springer: Cham, 2016. [Google Scholar] [CrossRef]
Figure 1.
Areas, technologies and actors related to the study.
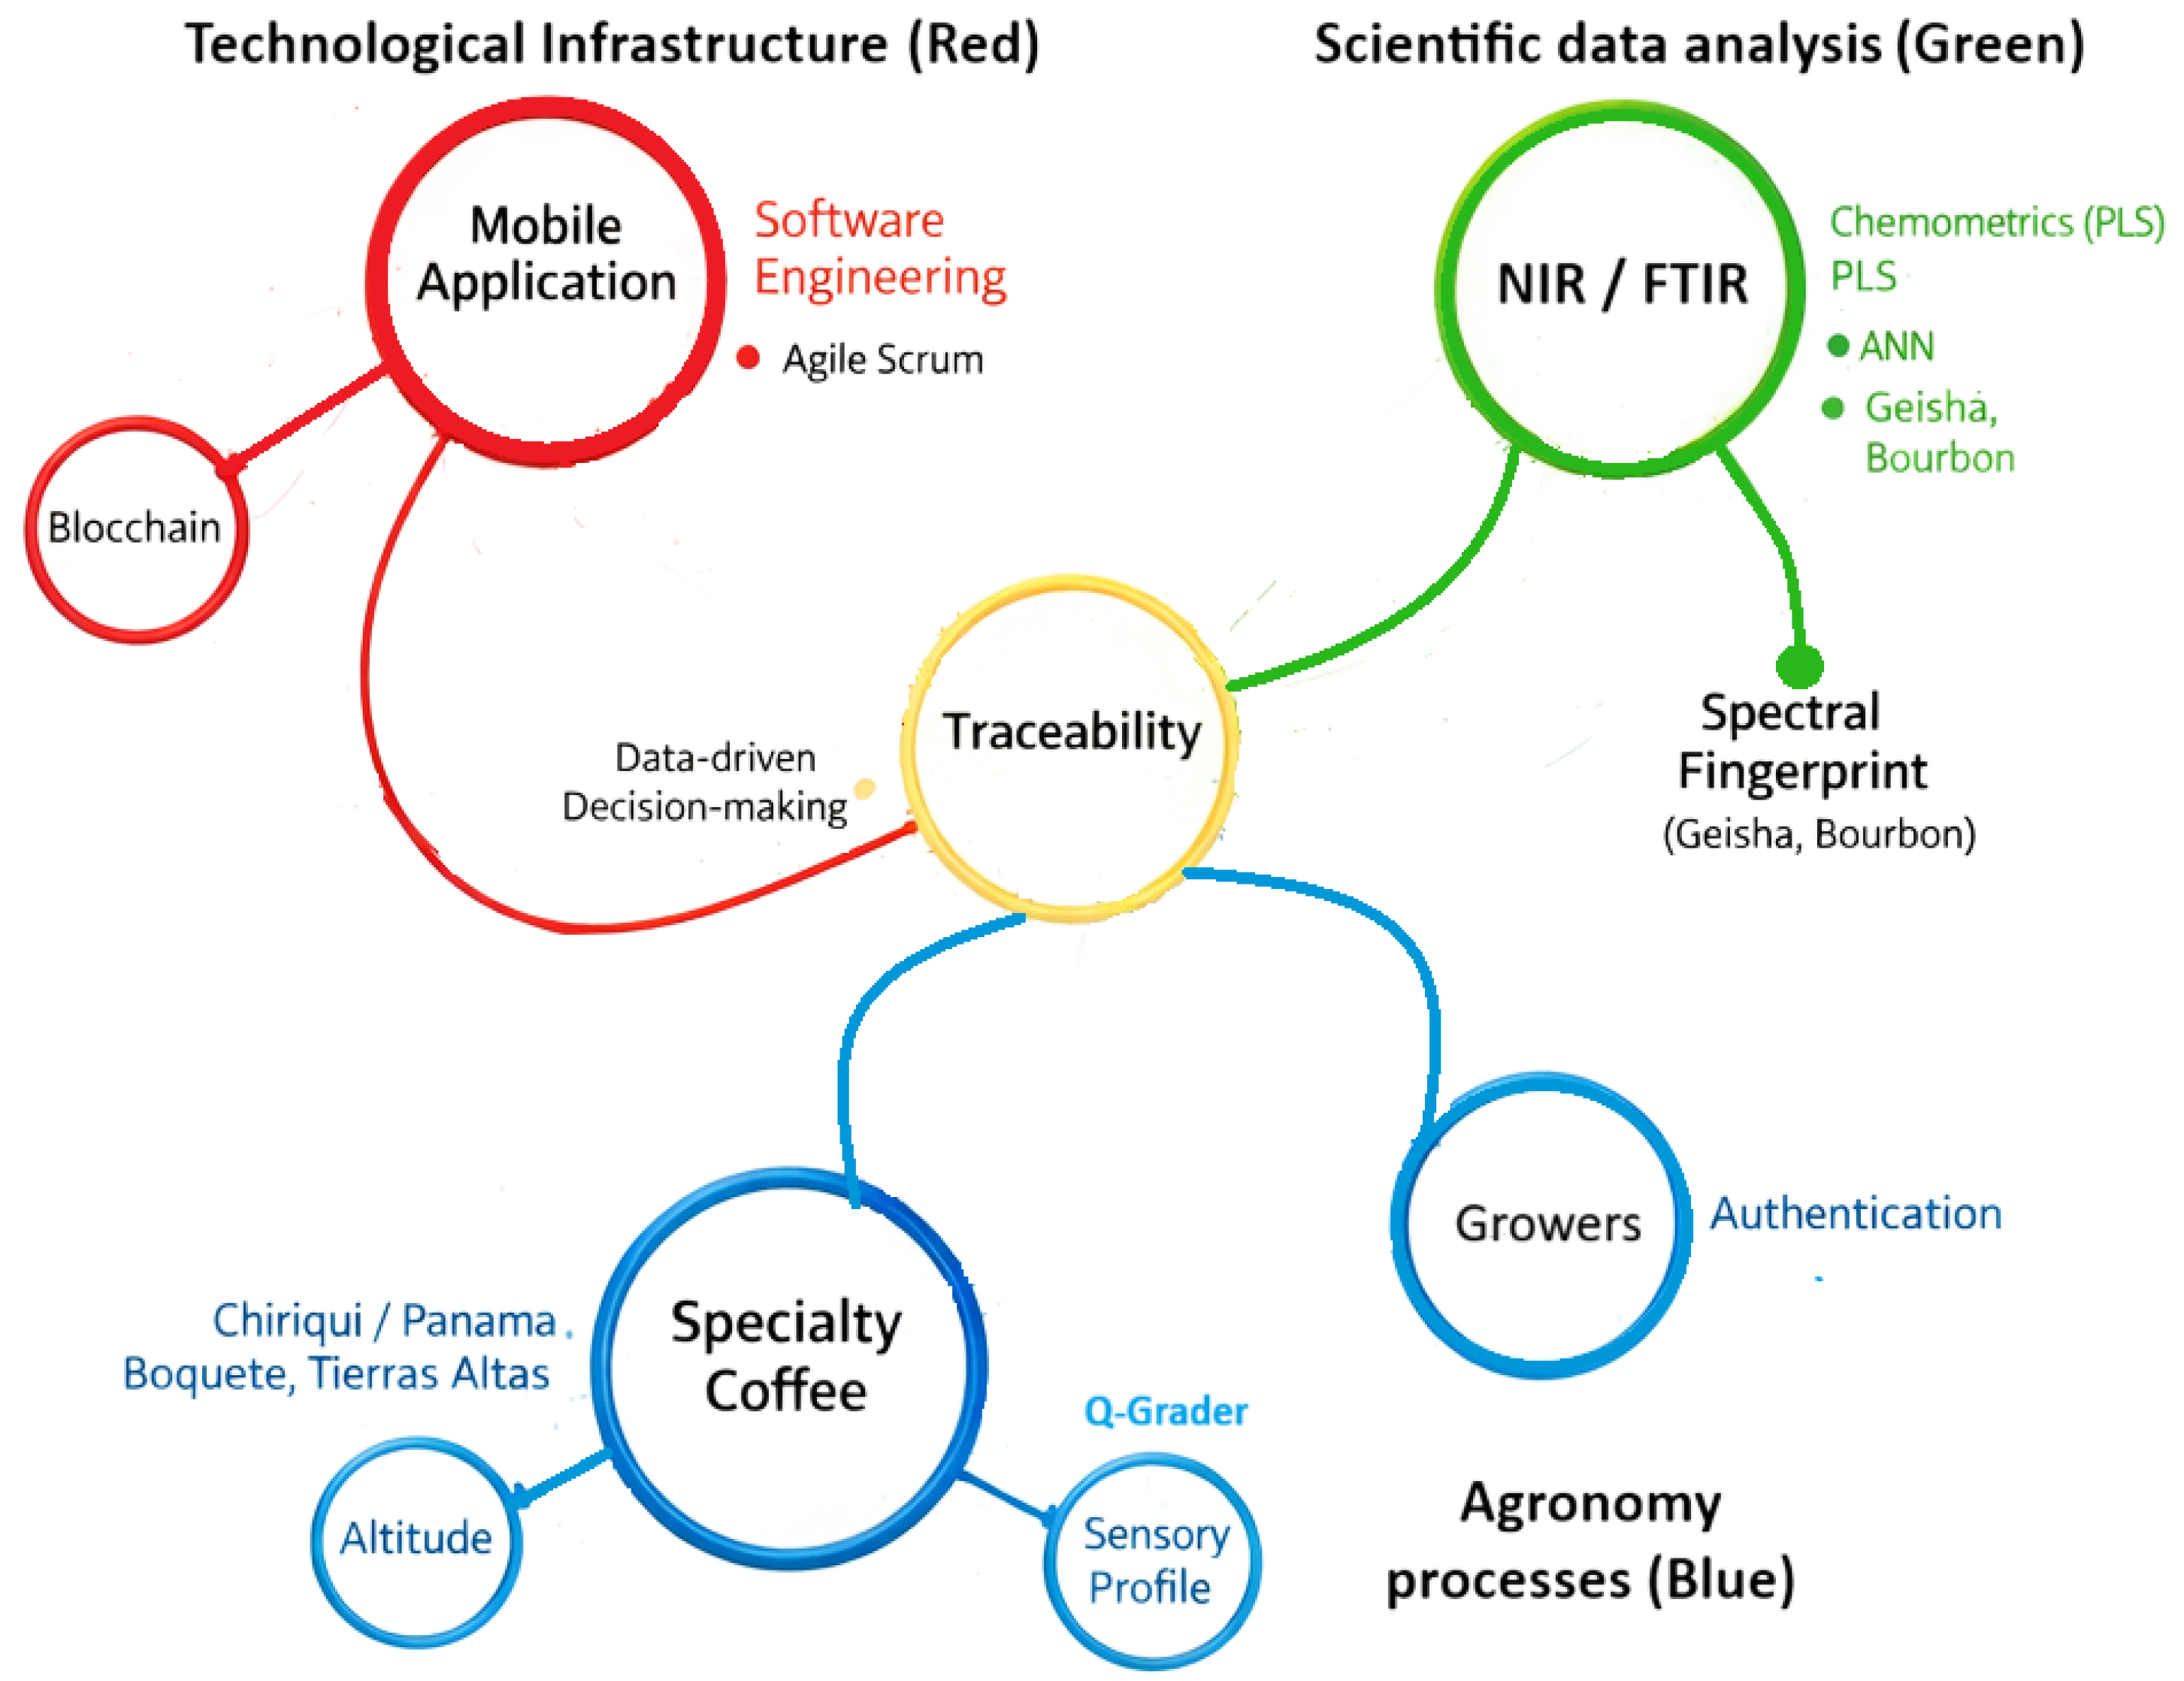
Figure 2.
Topographic map of the coffee producers in the province of Chiriquí.
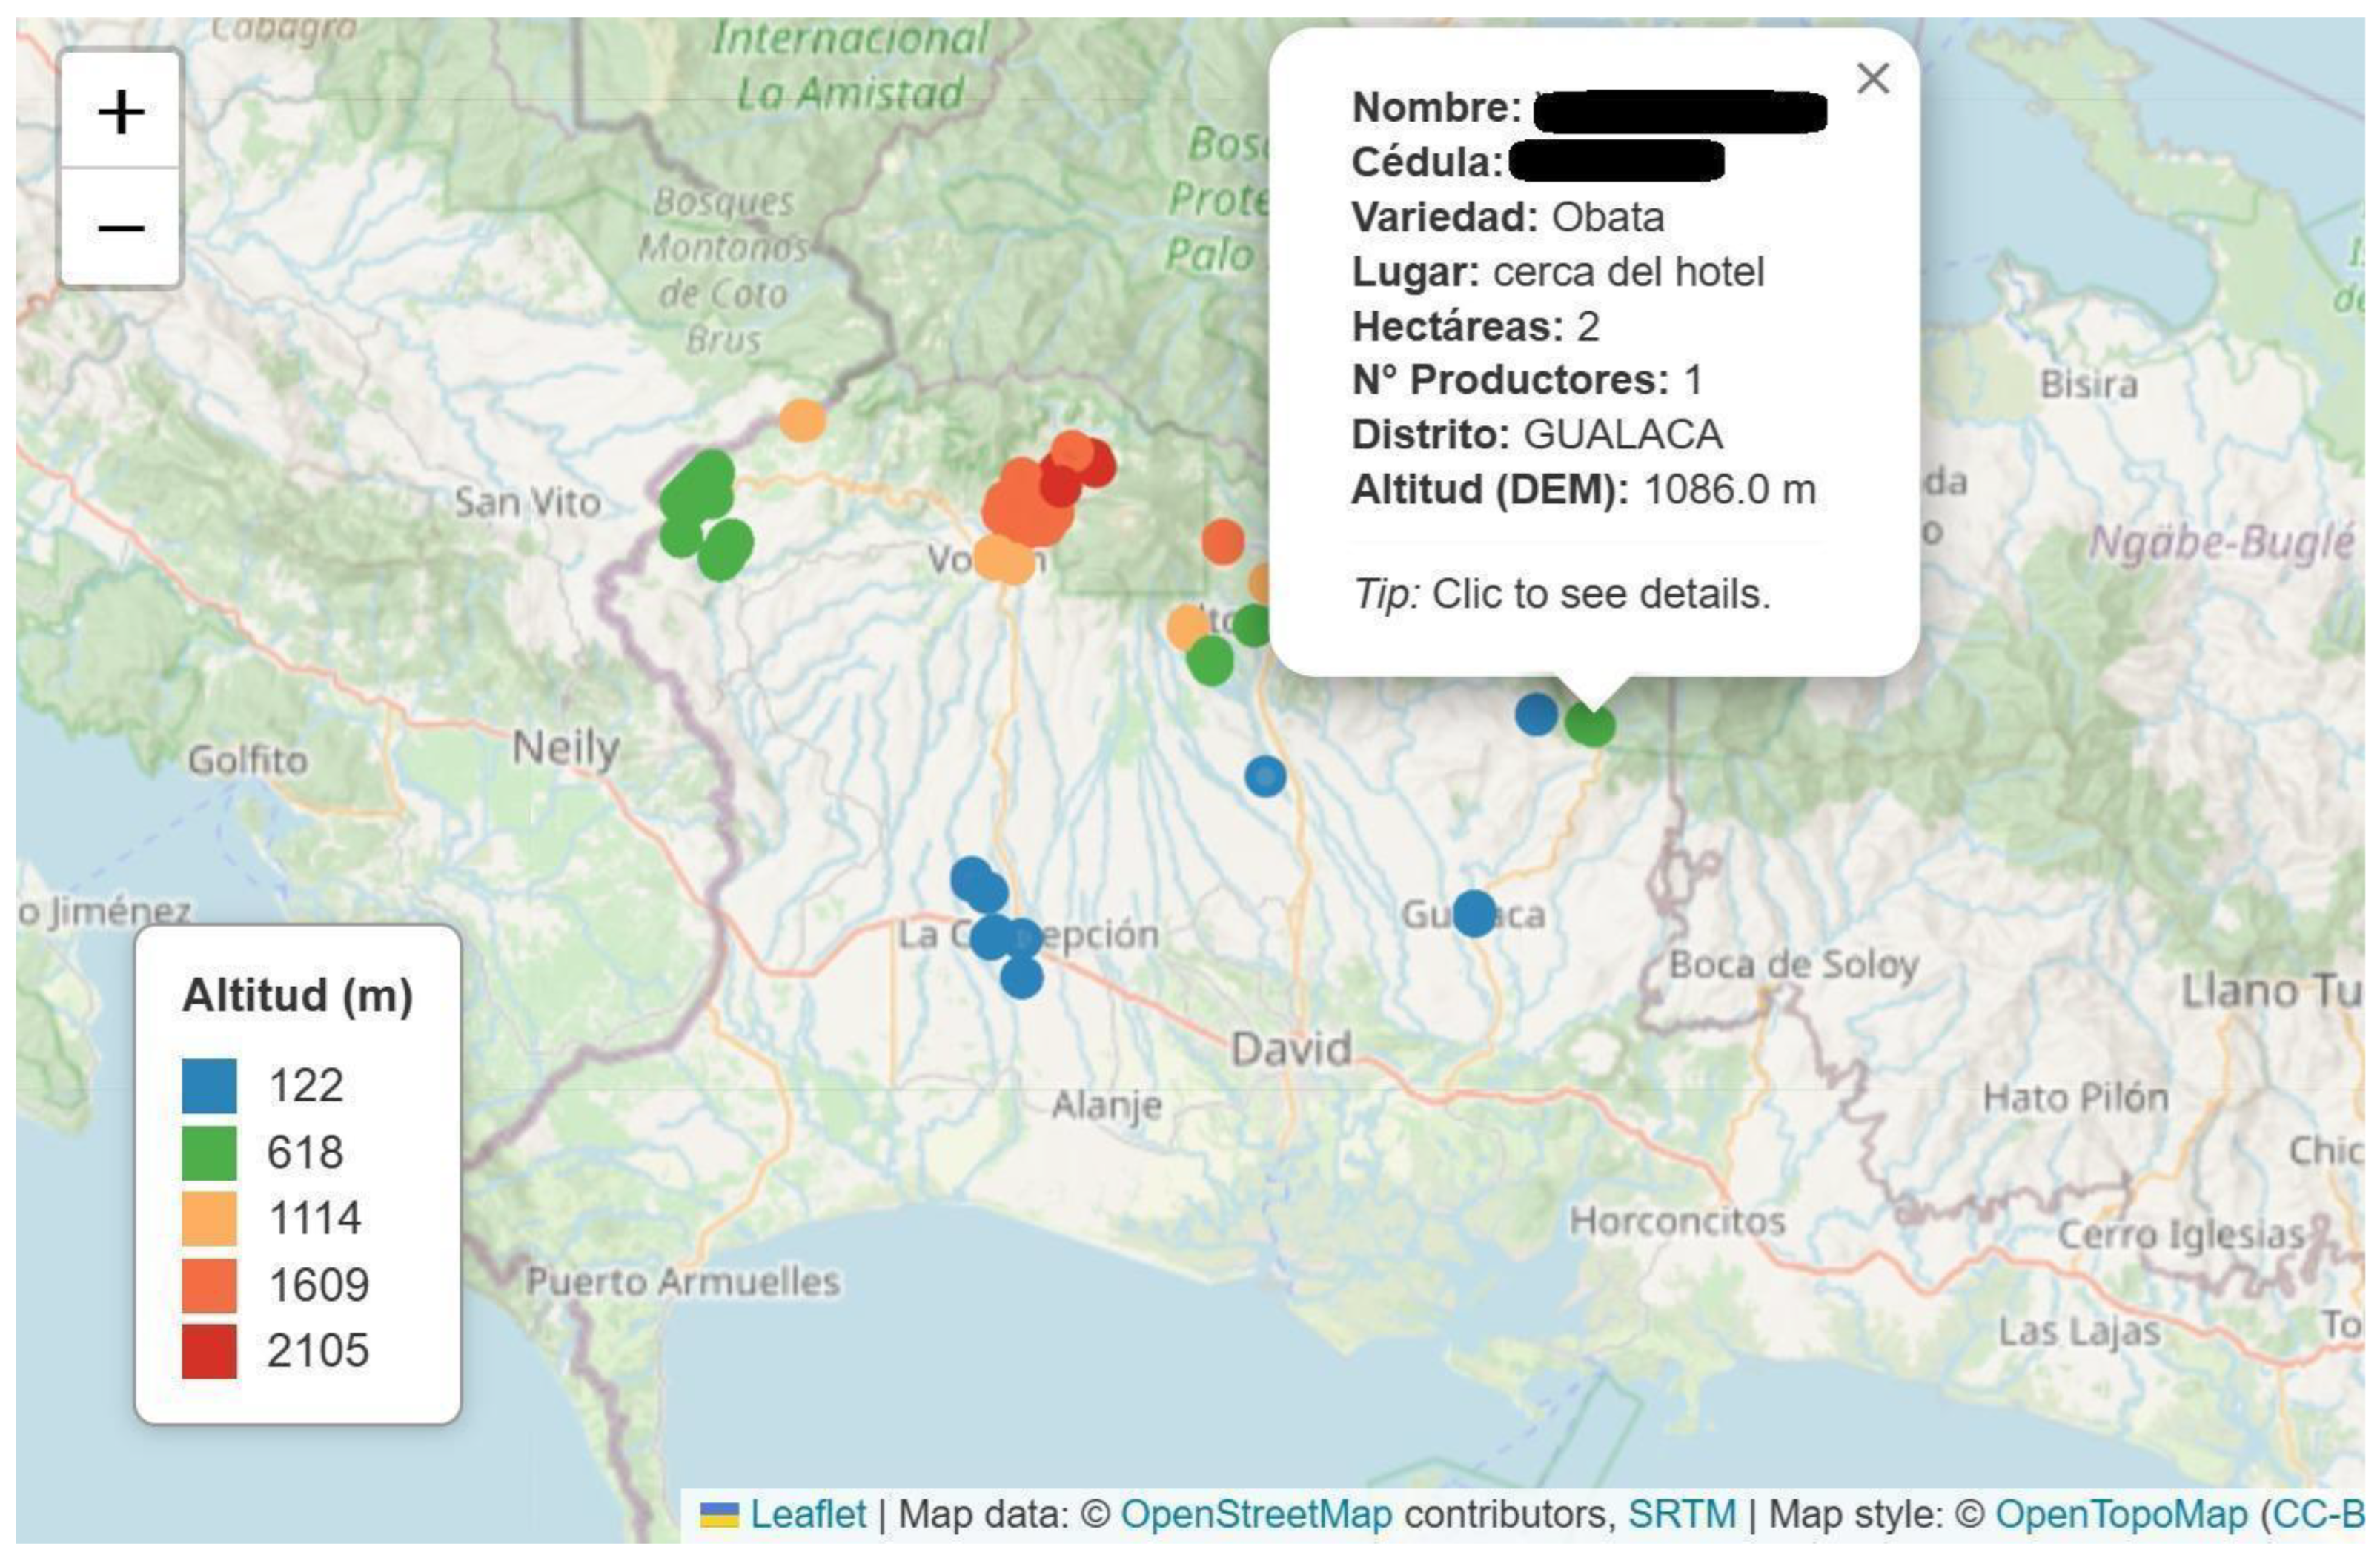
Figure 3.
Workflow of sample stages.
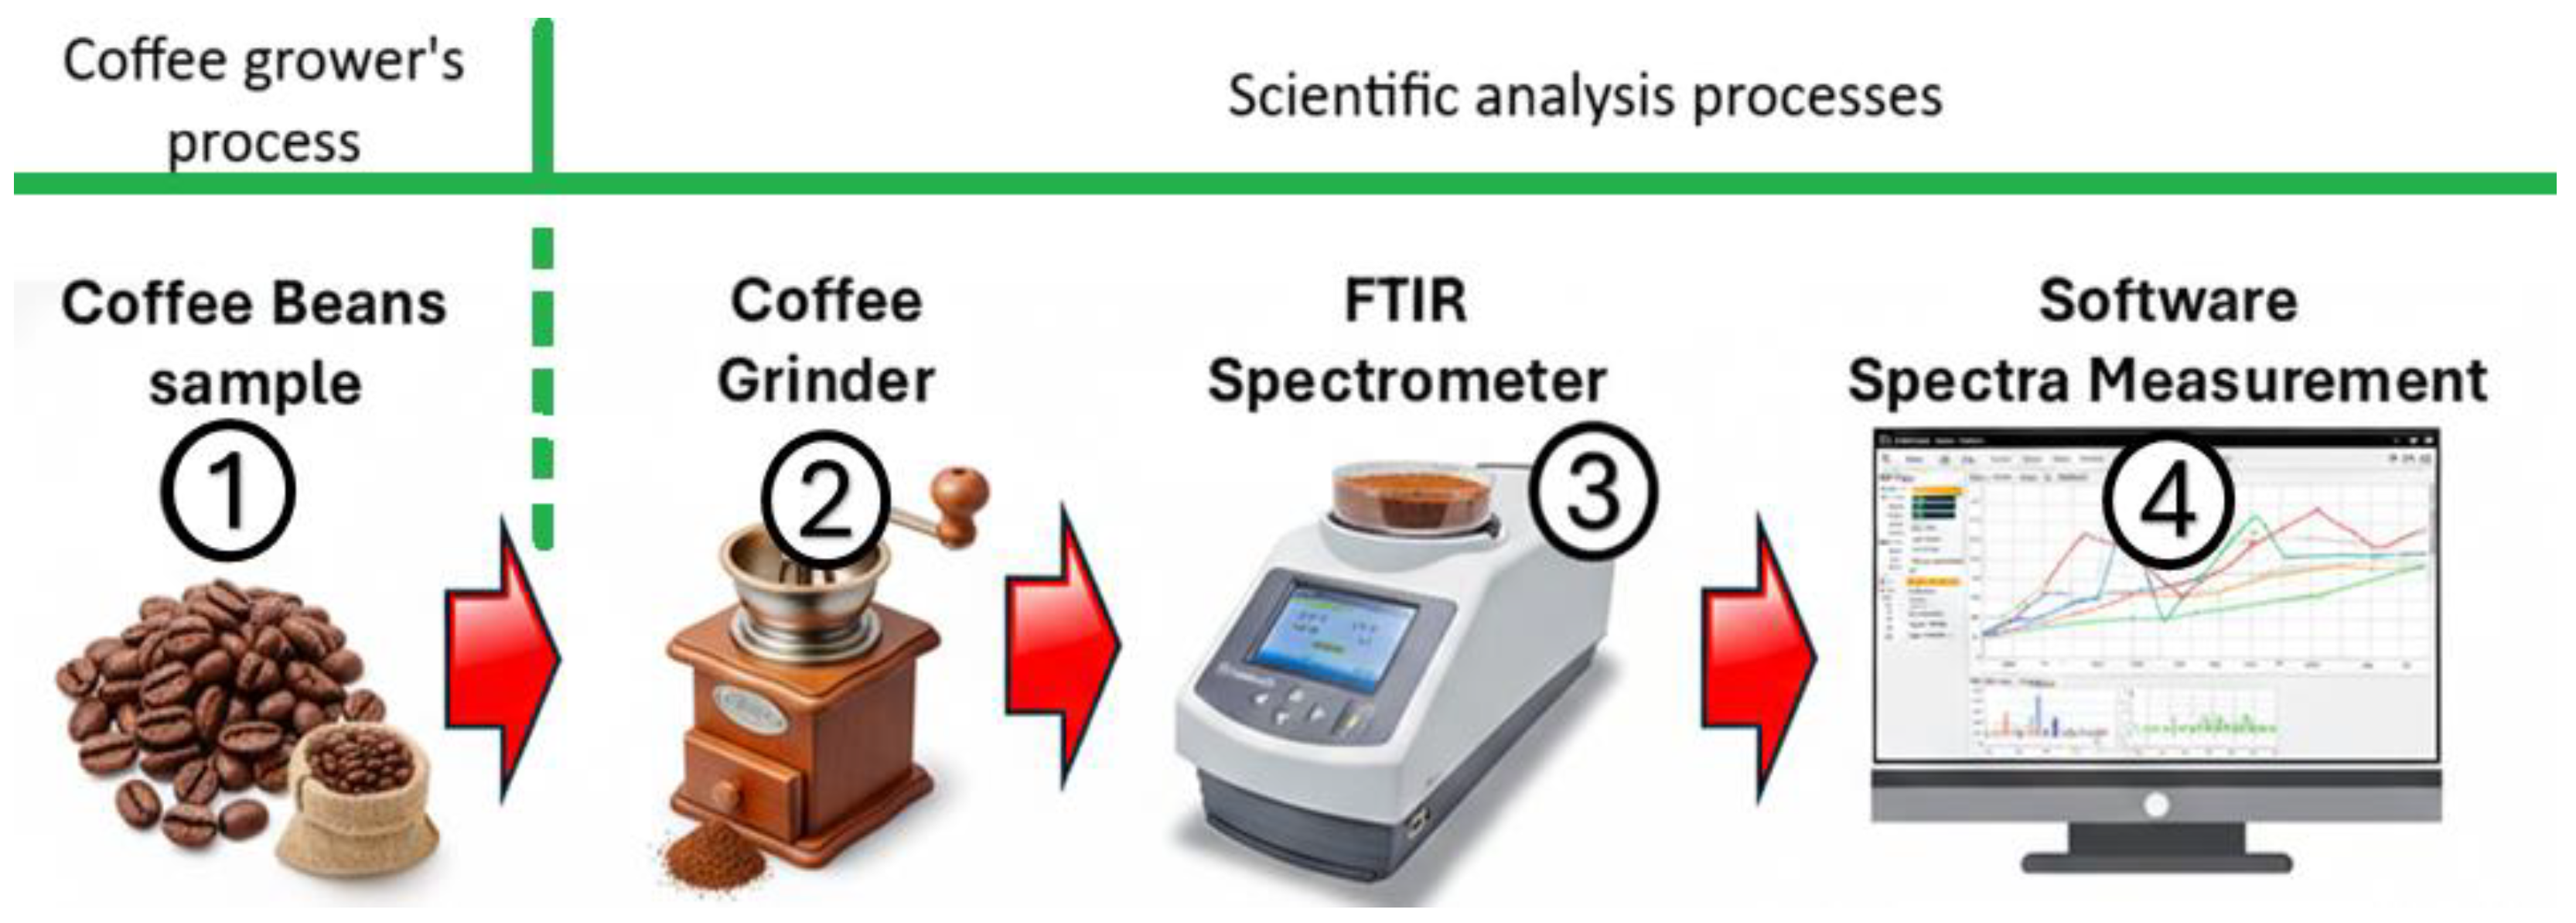
Figure 4.
Scrum Methodology.
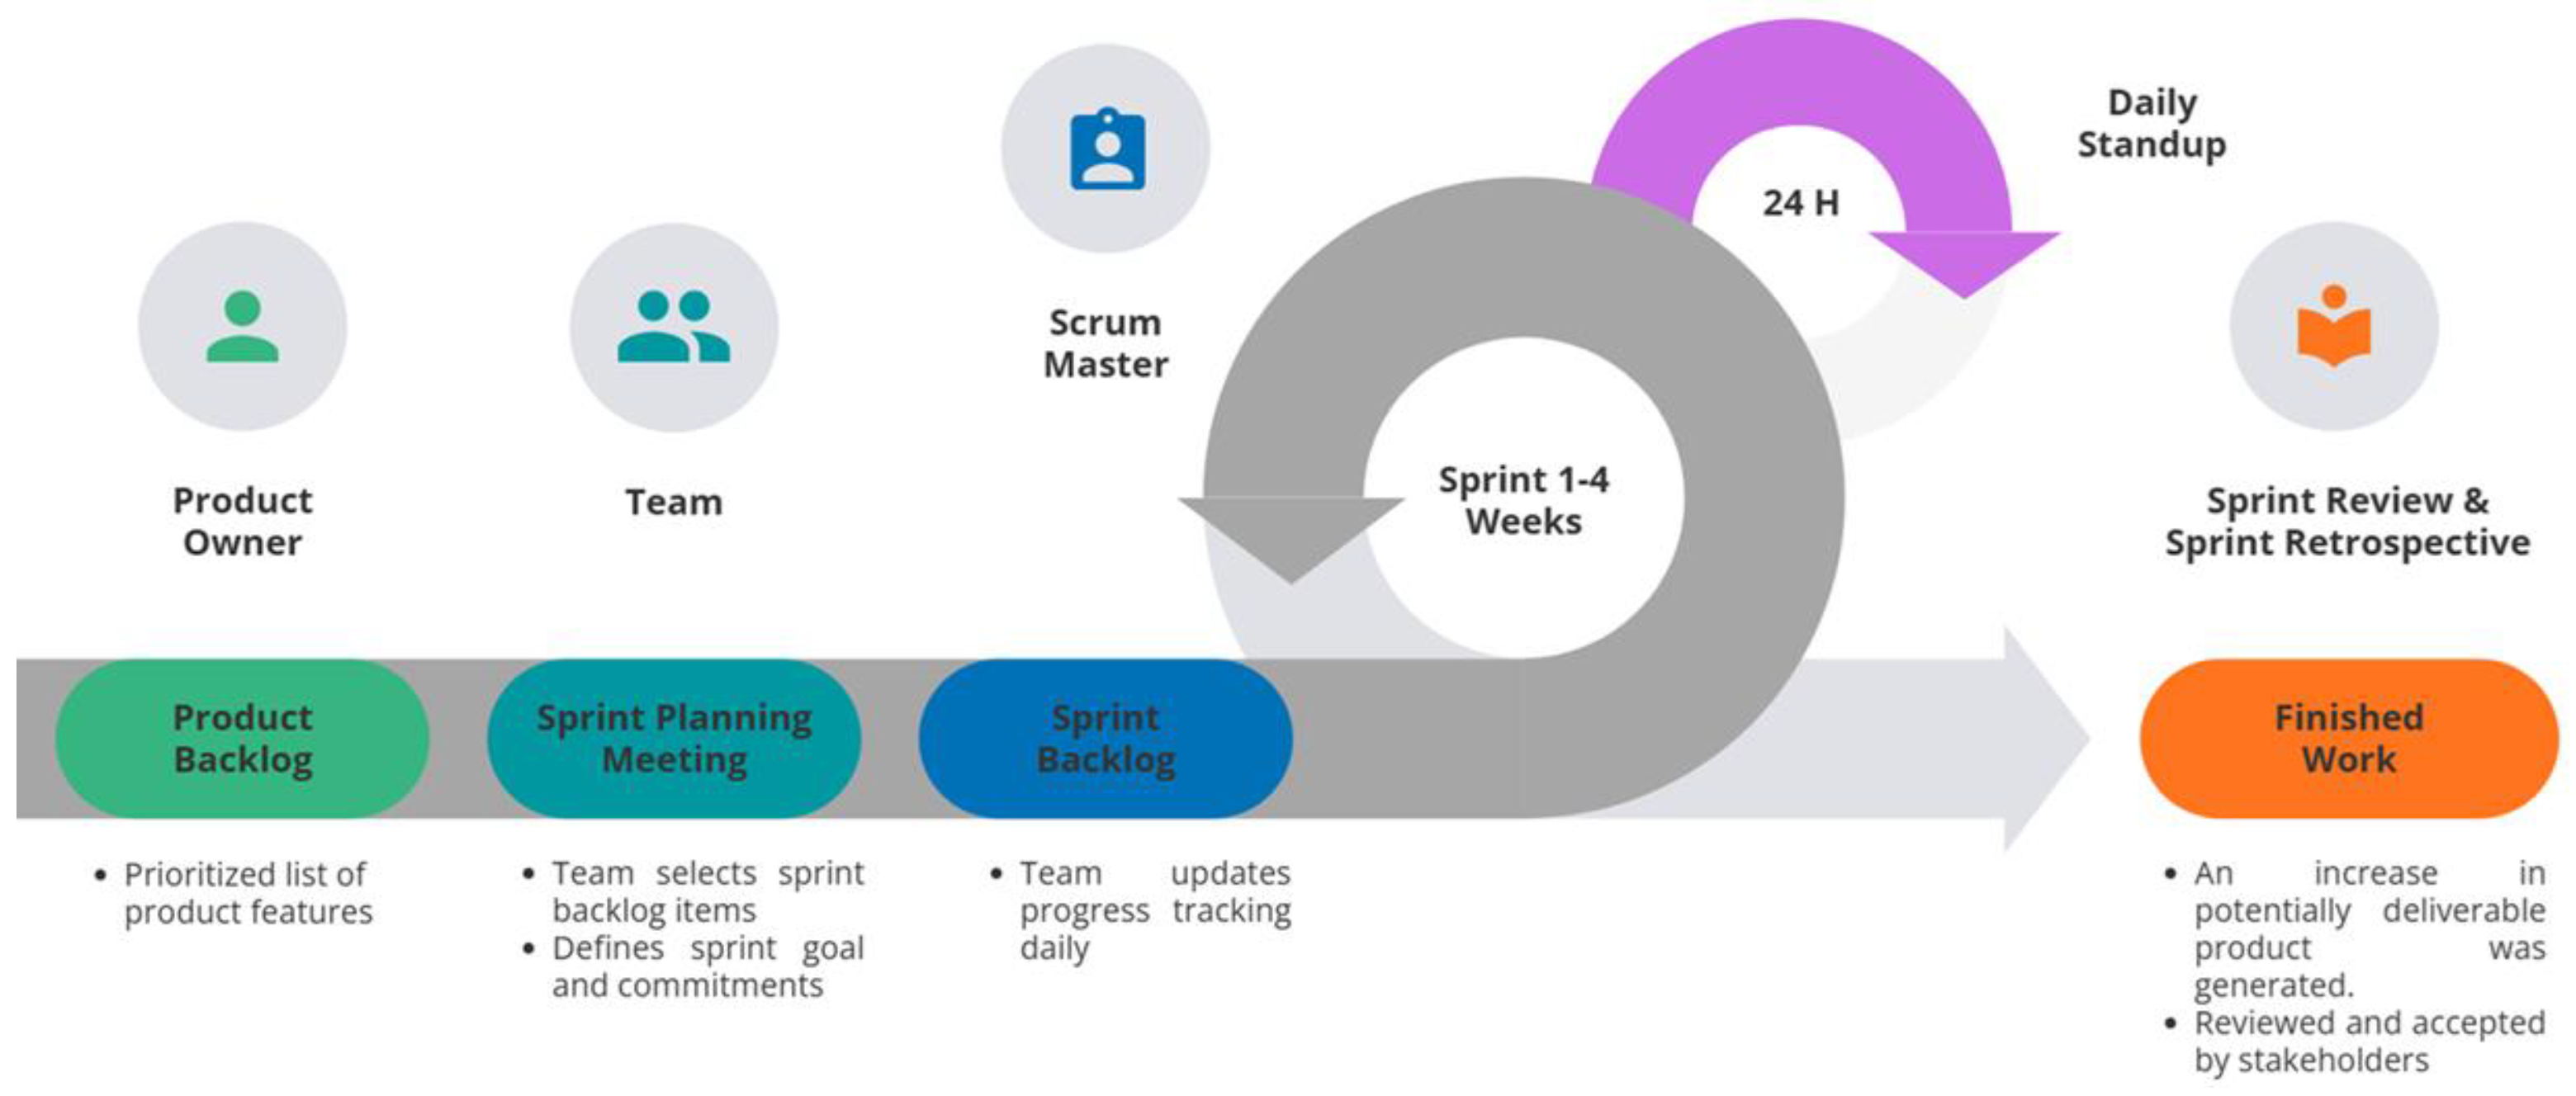
Figure 5.
Main features of the application.
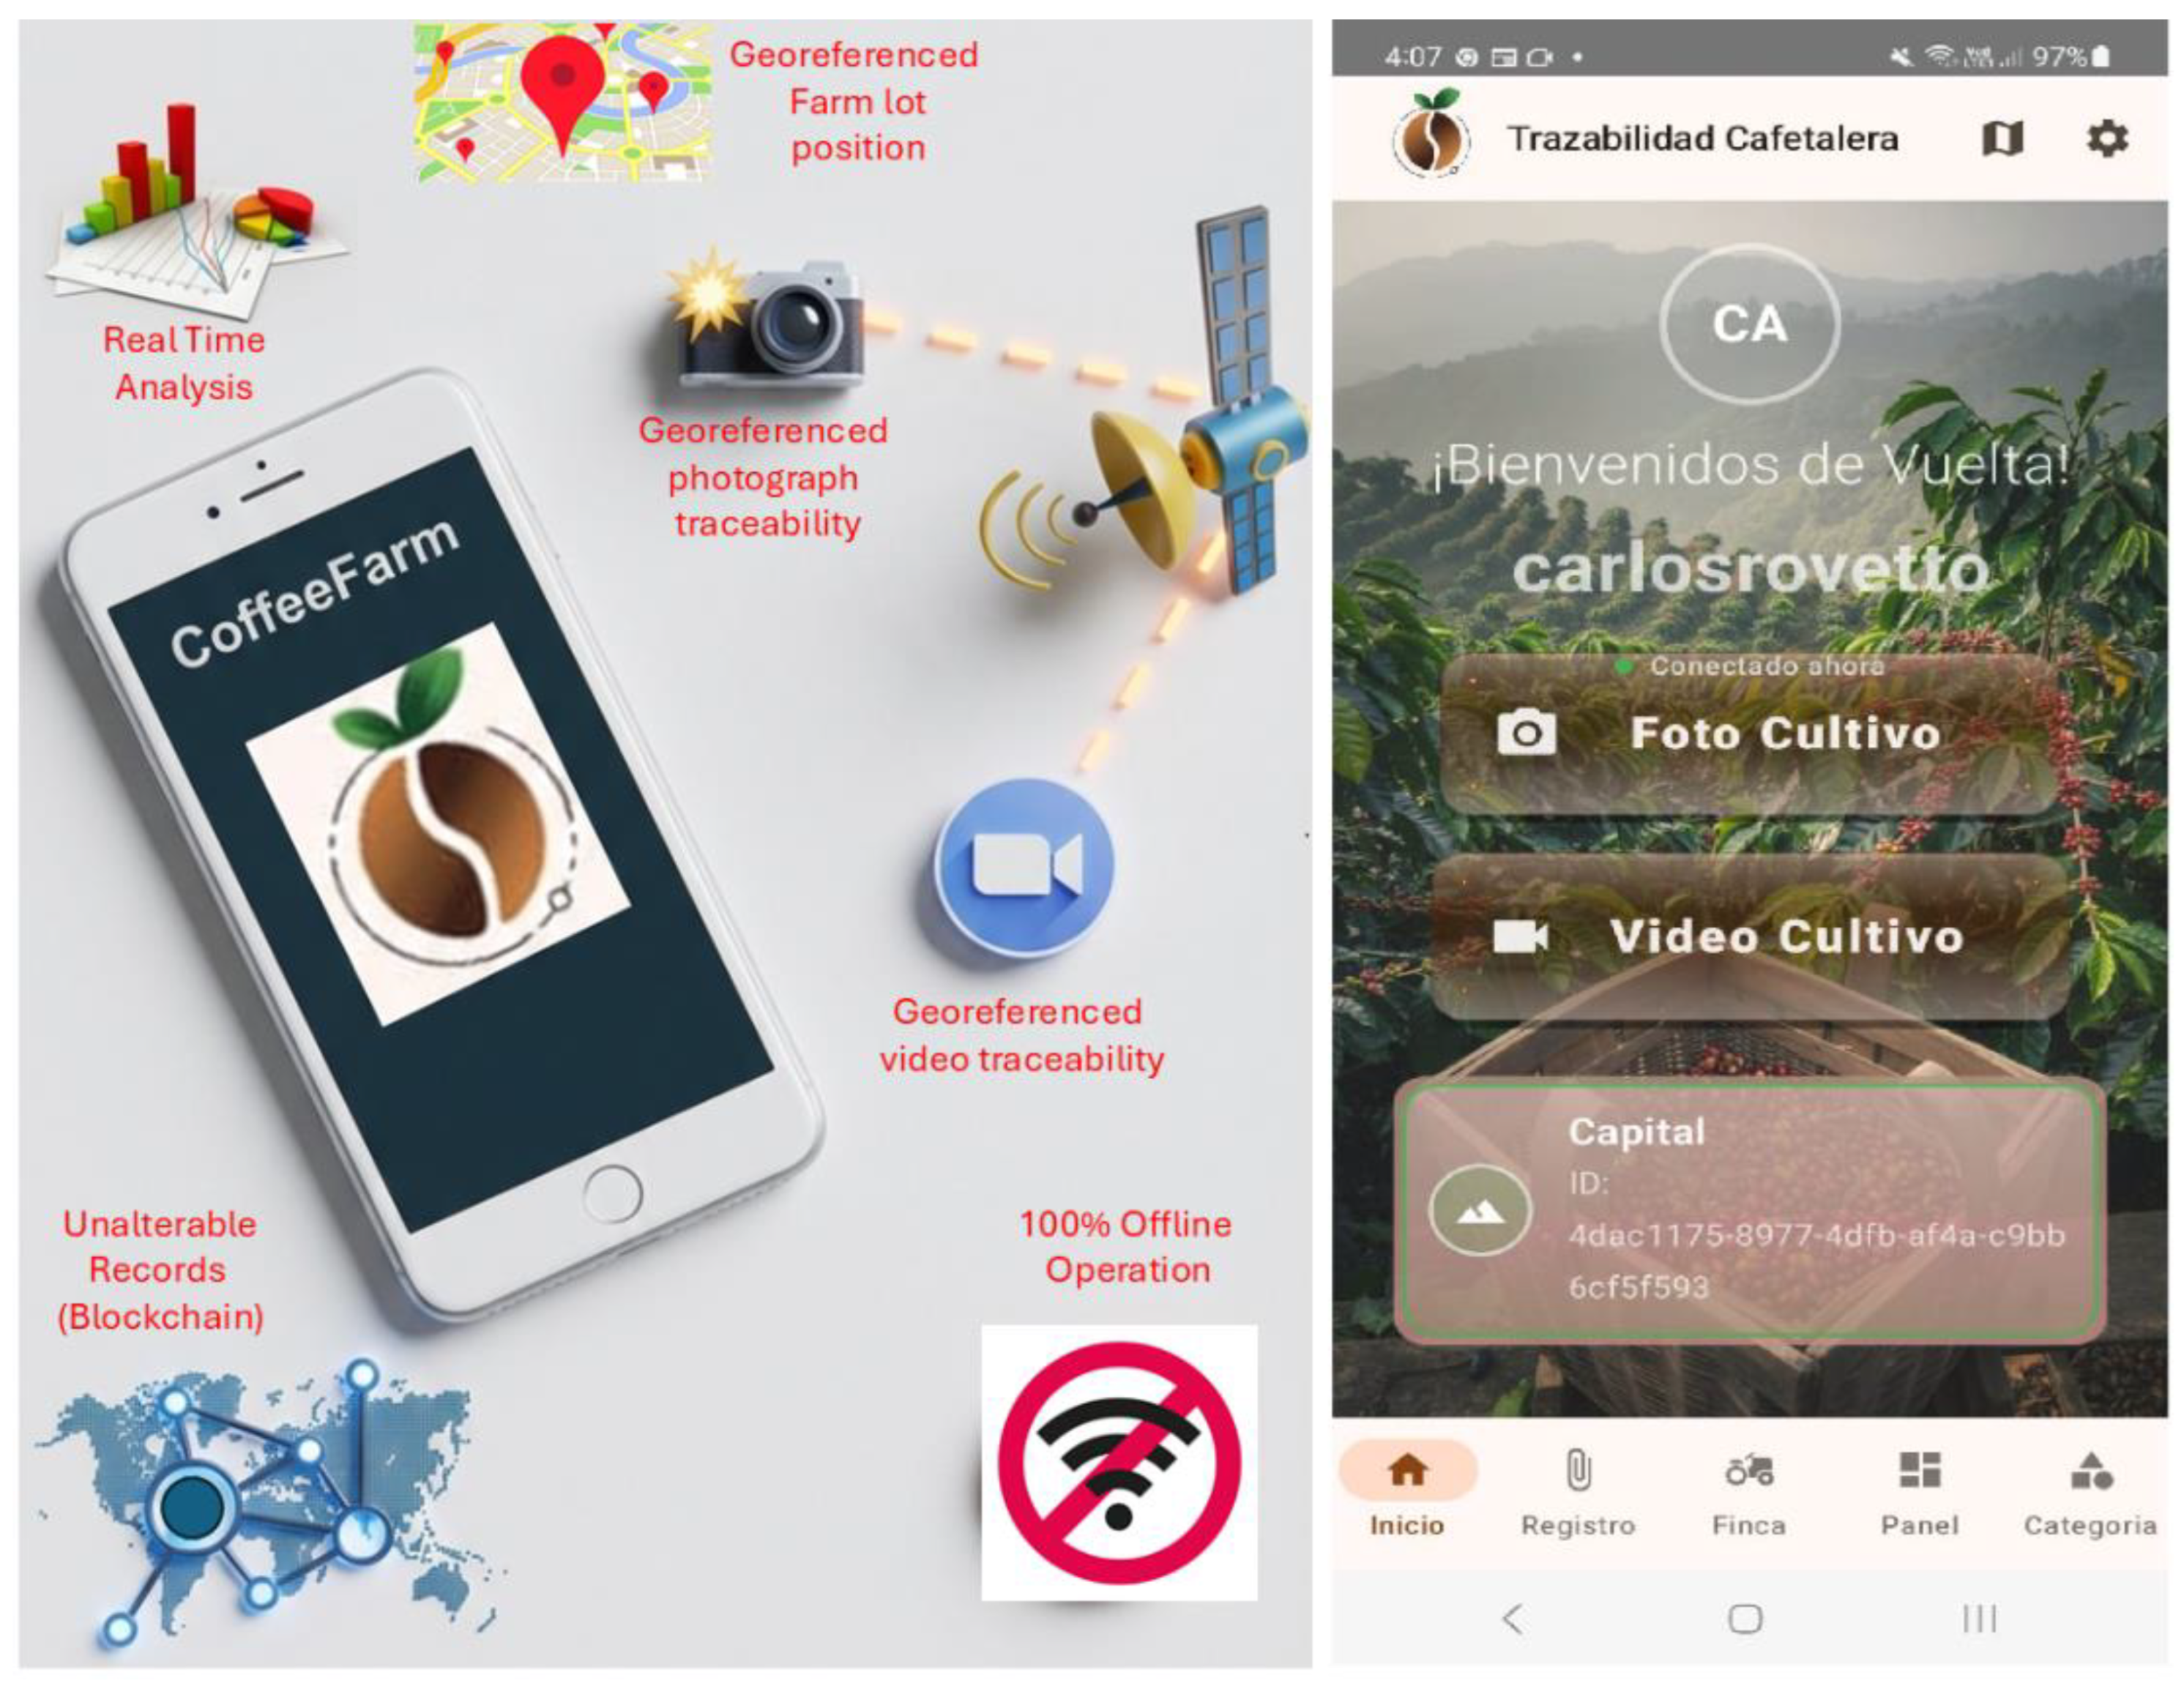
Figure 6.
Login screen (A) and property registration screen (B).
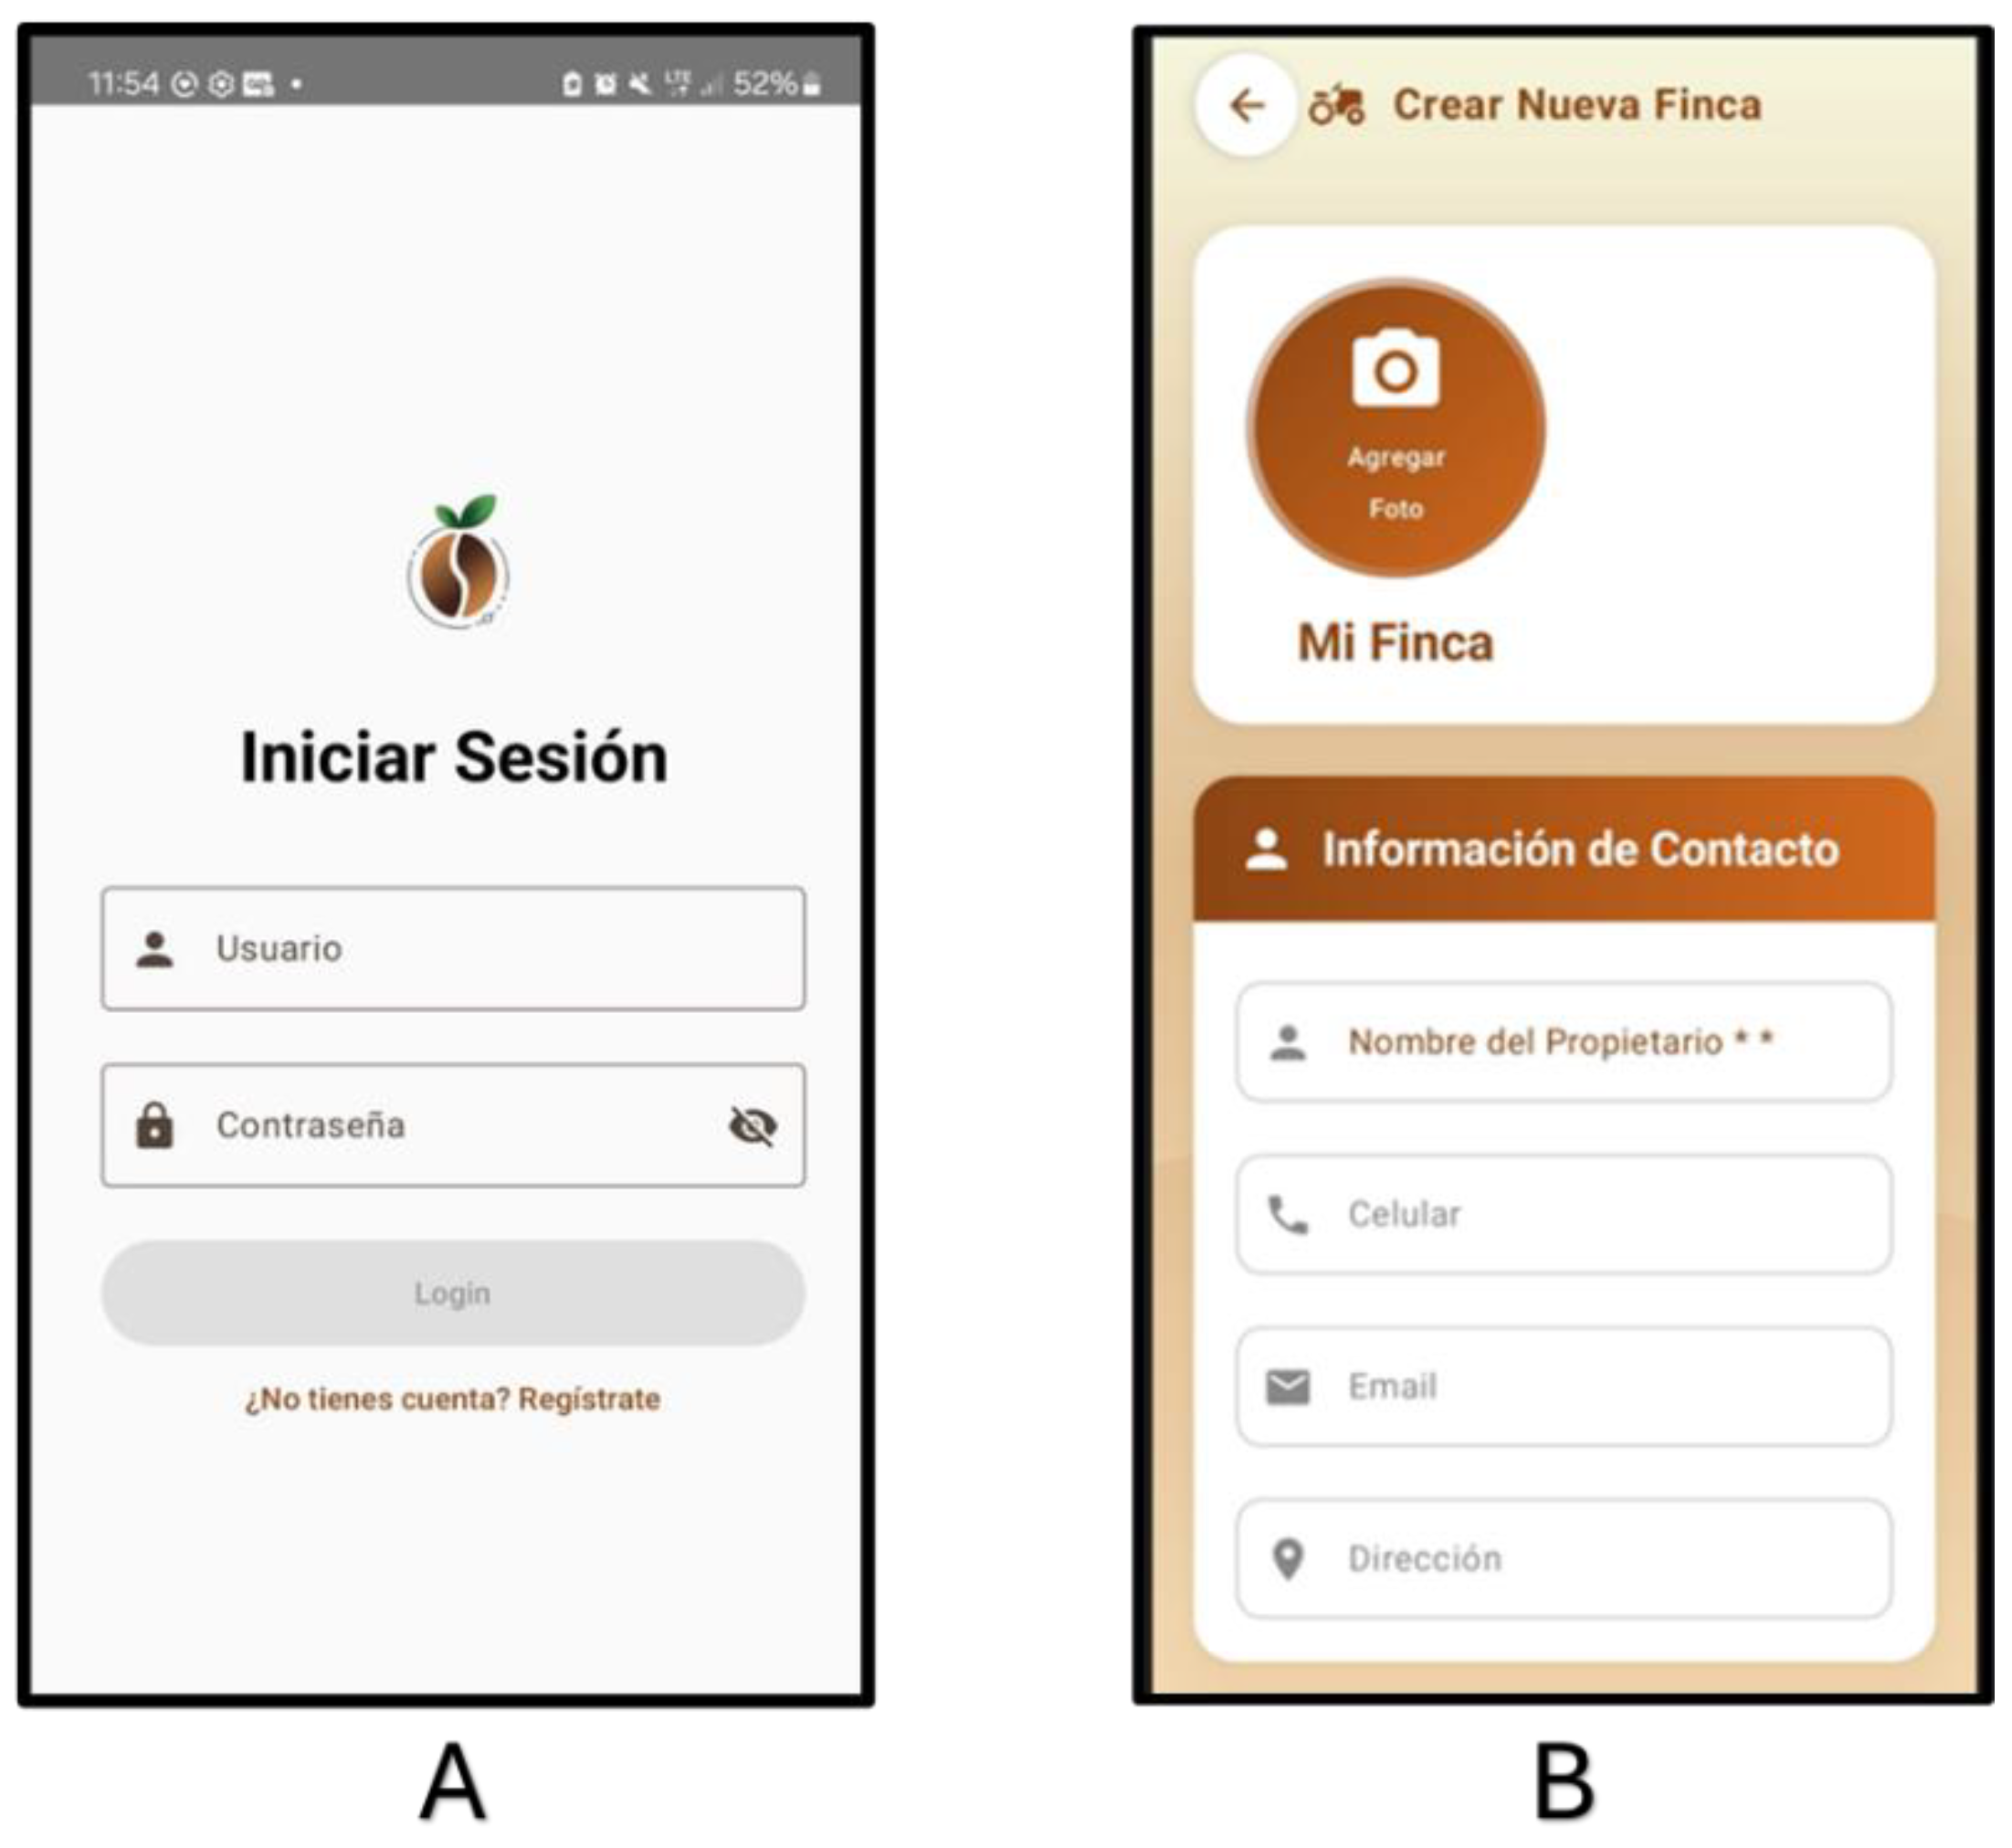
Figure 7.
Property registration screens.
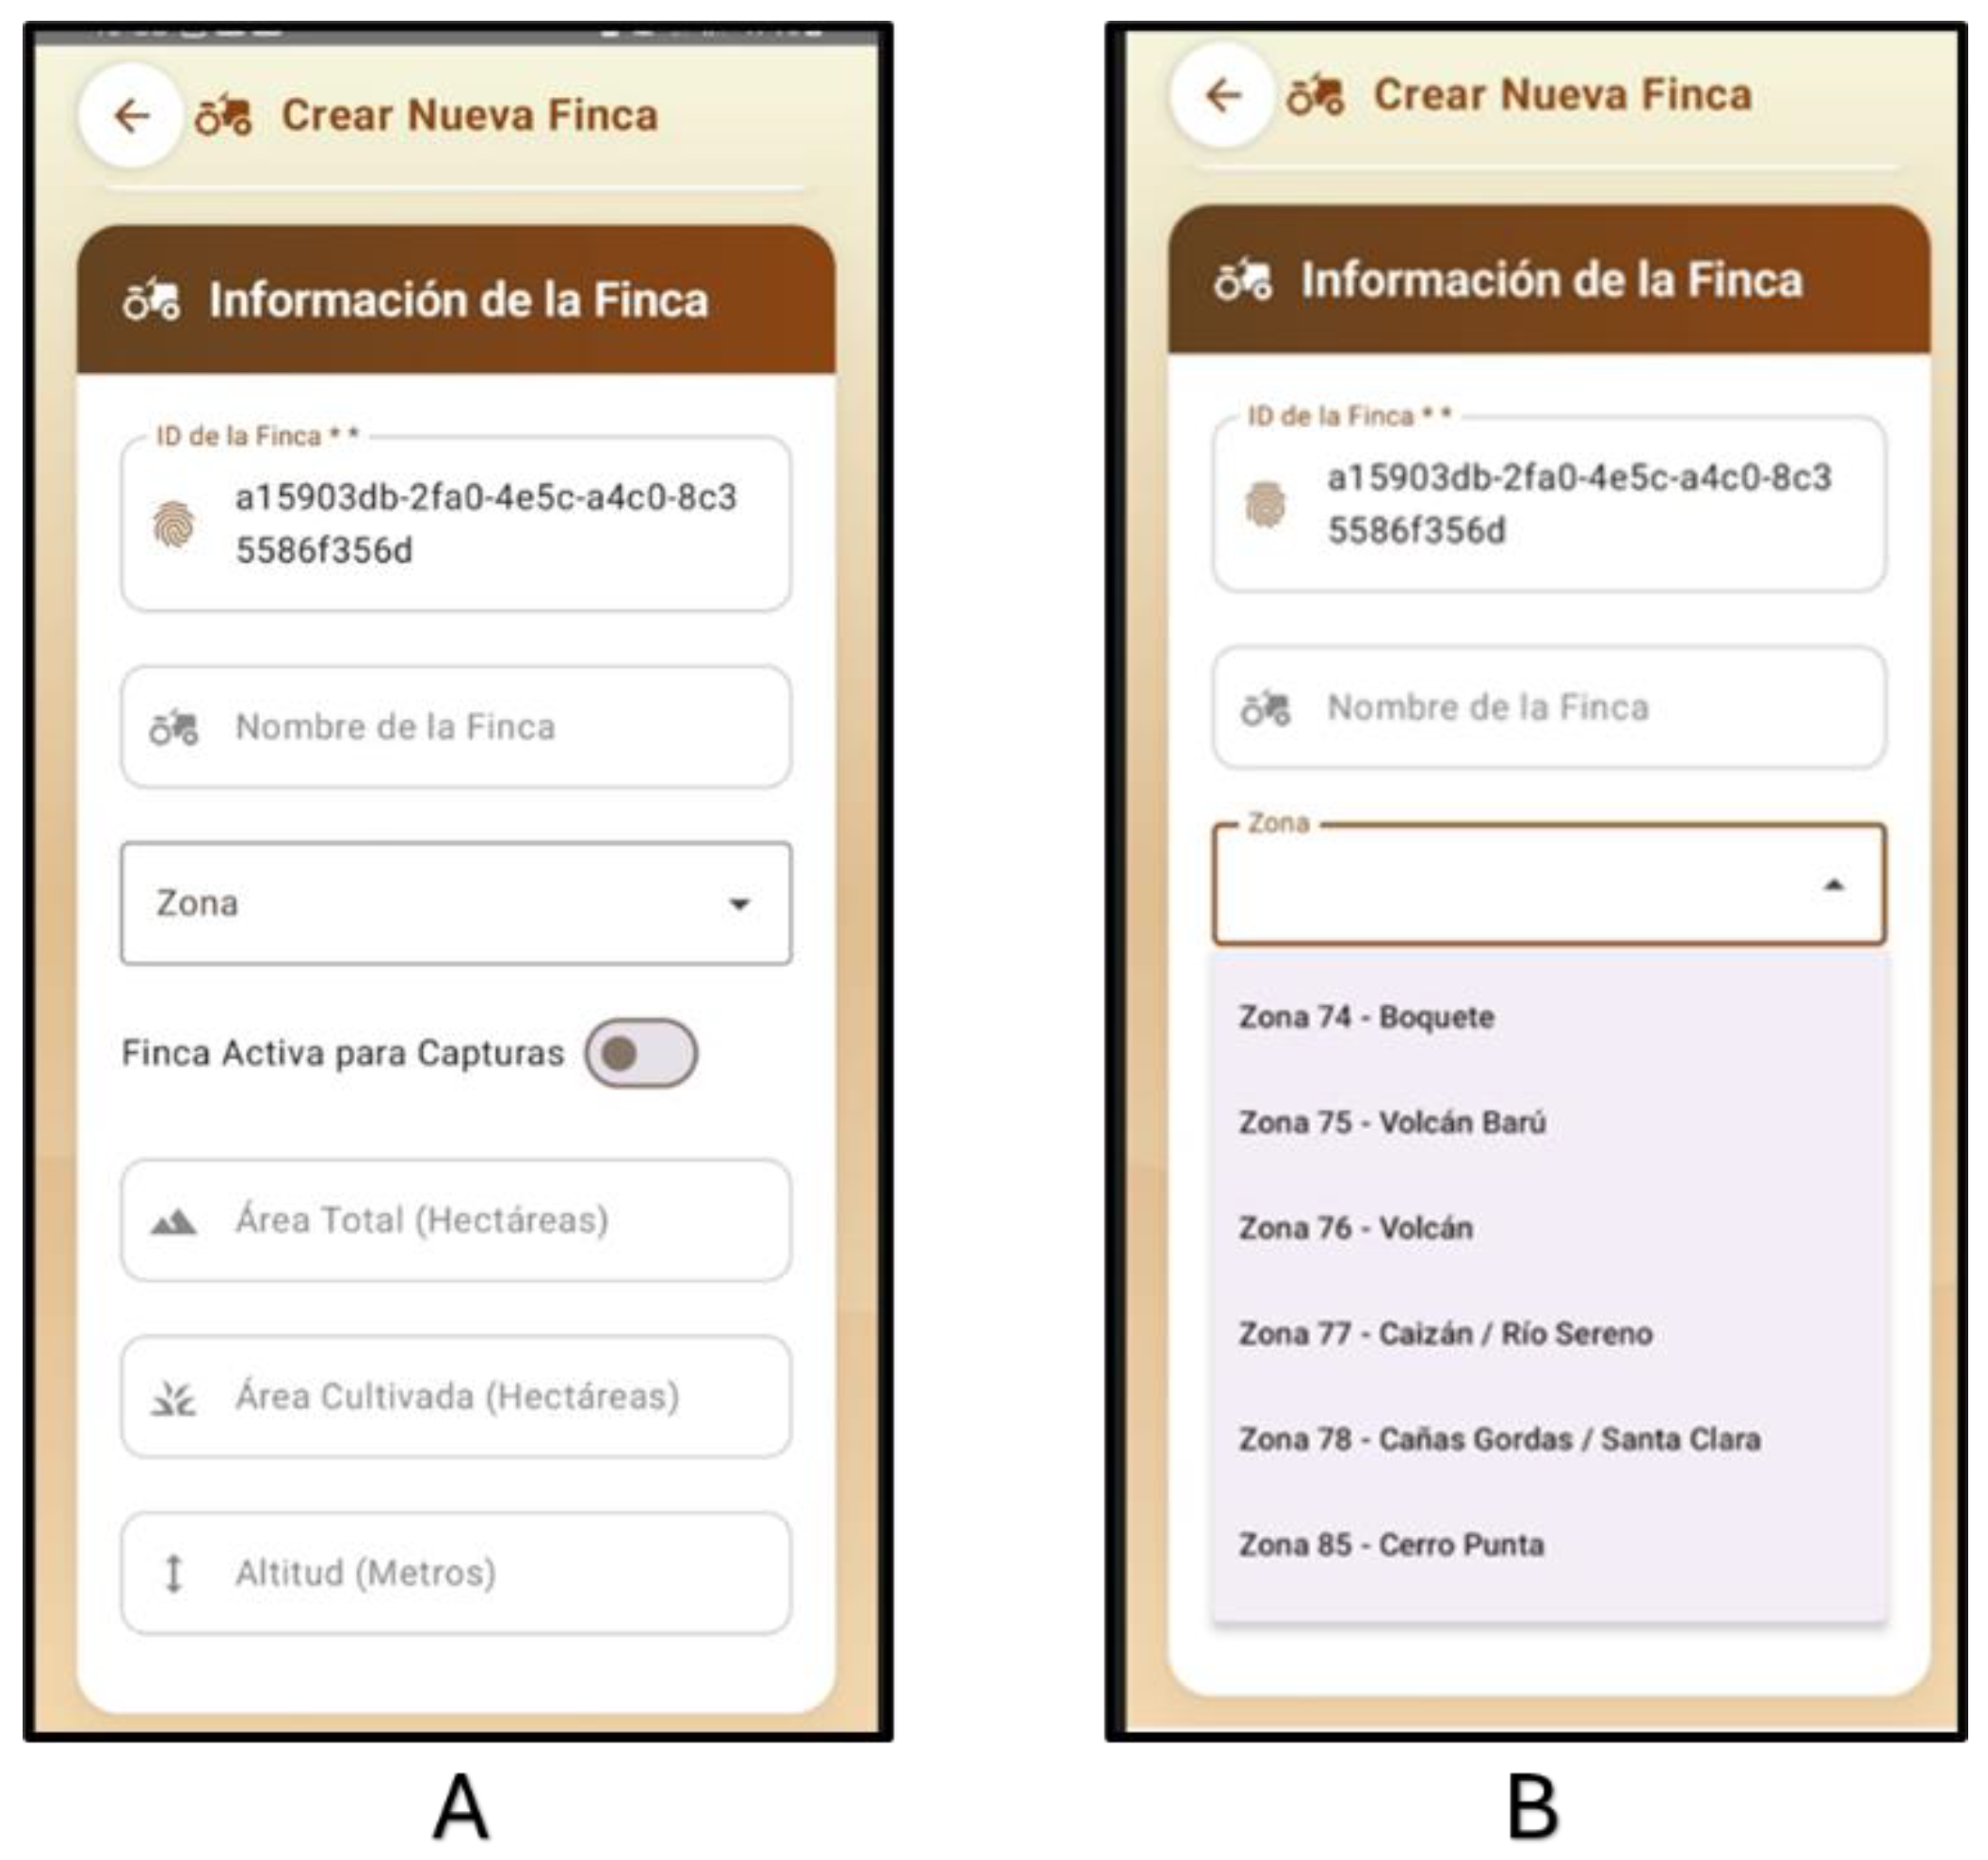
Figure 8.
Screens for recording production and harvesting and certifications.
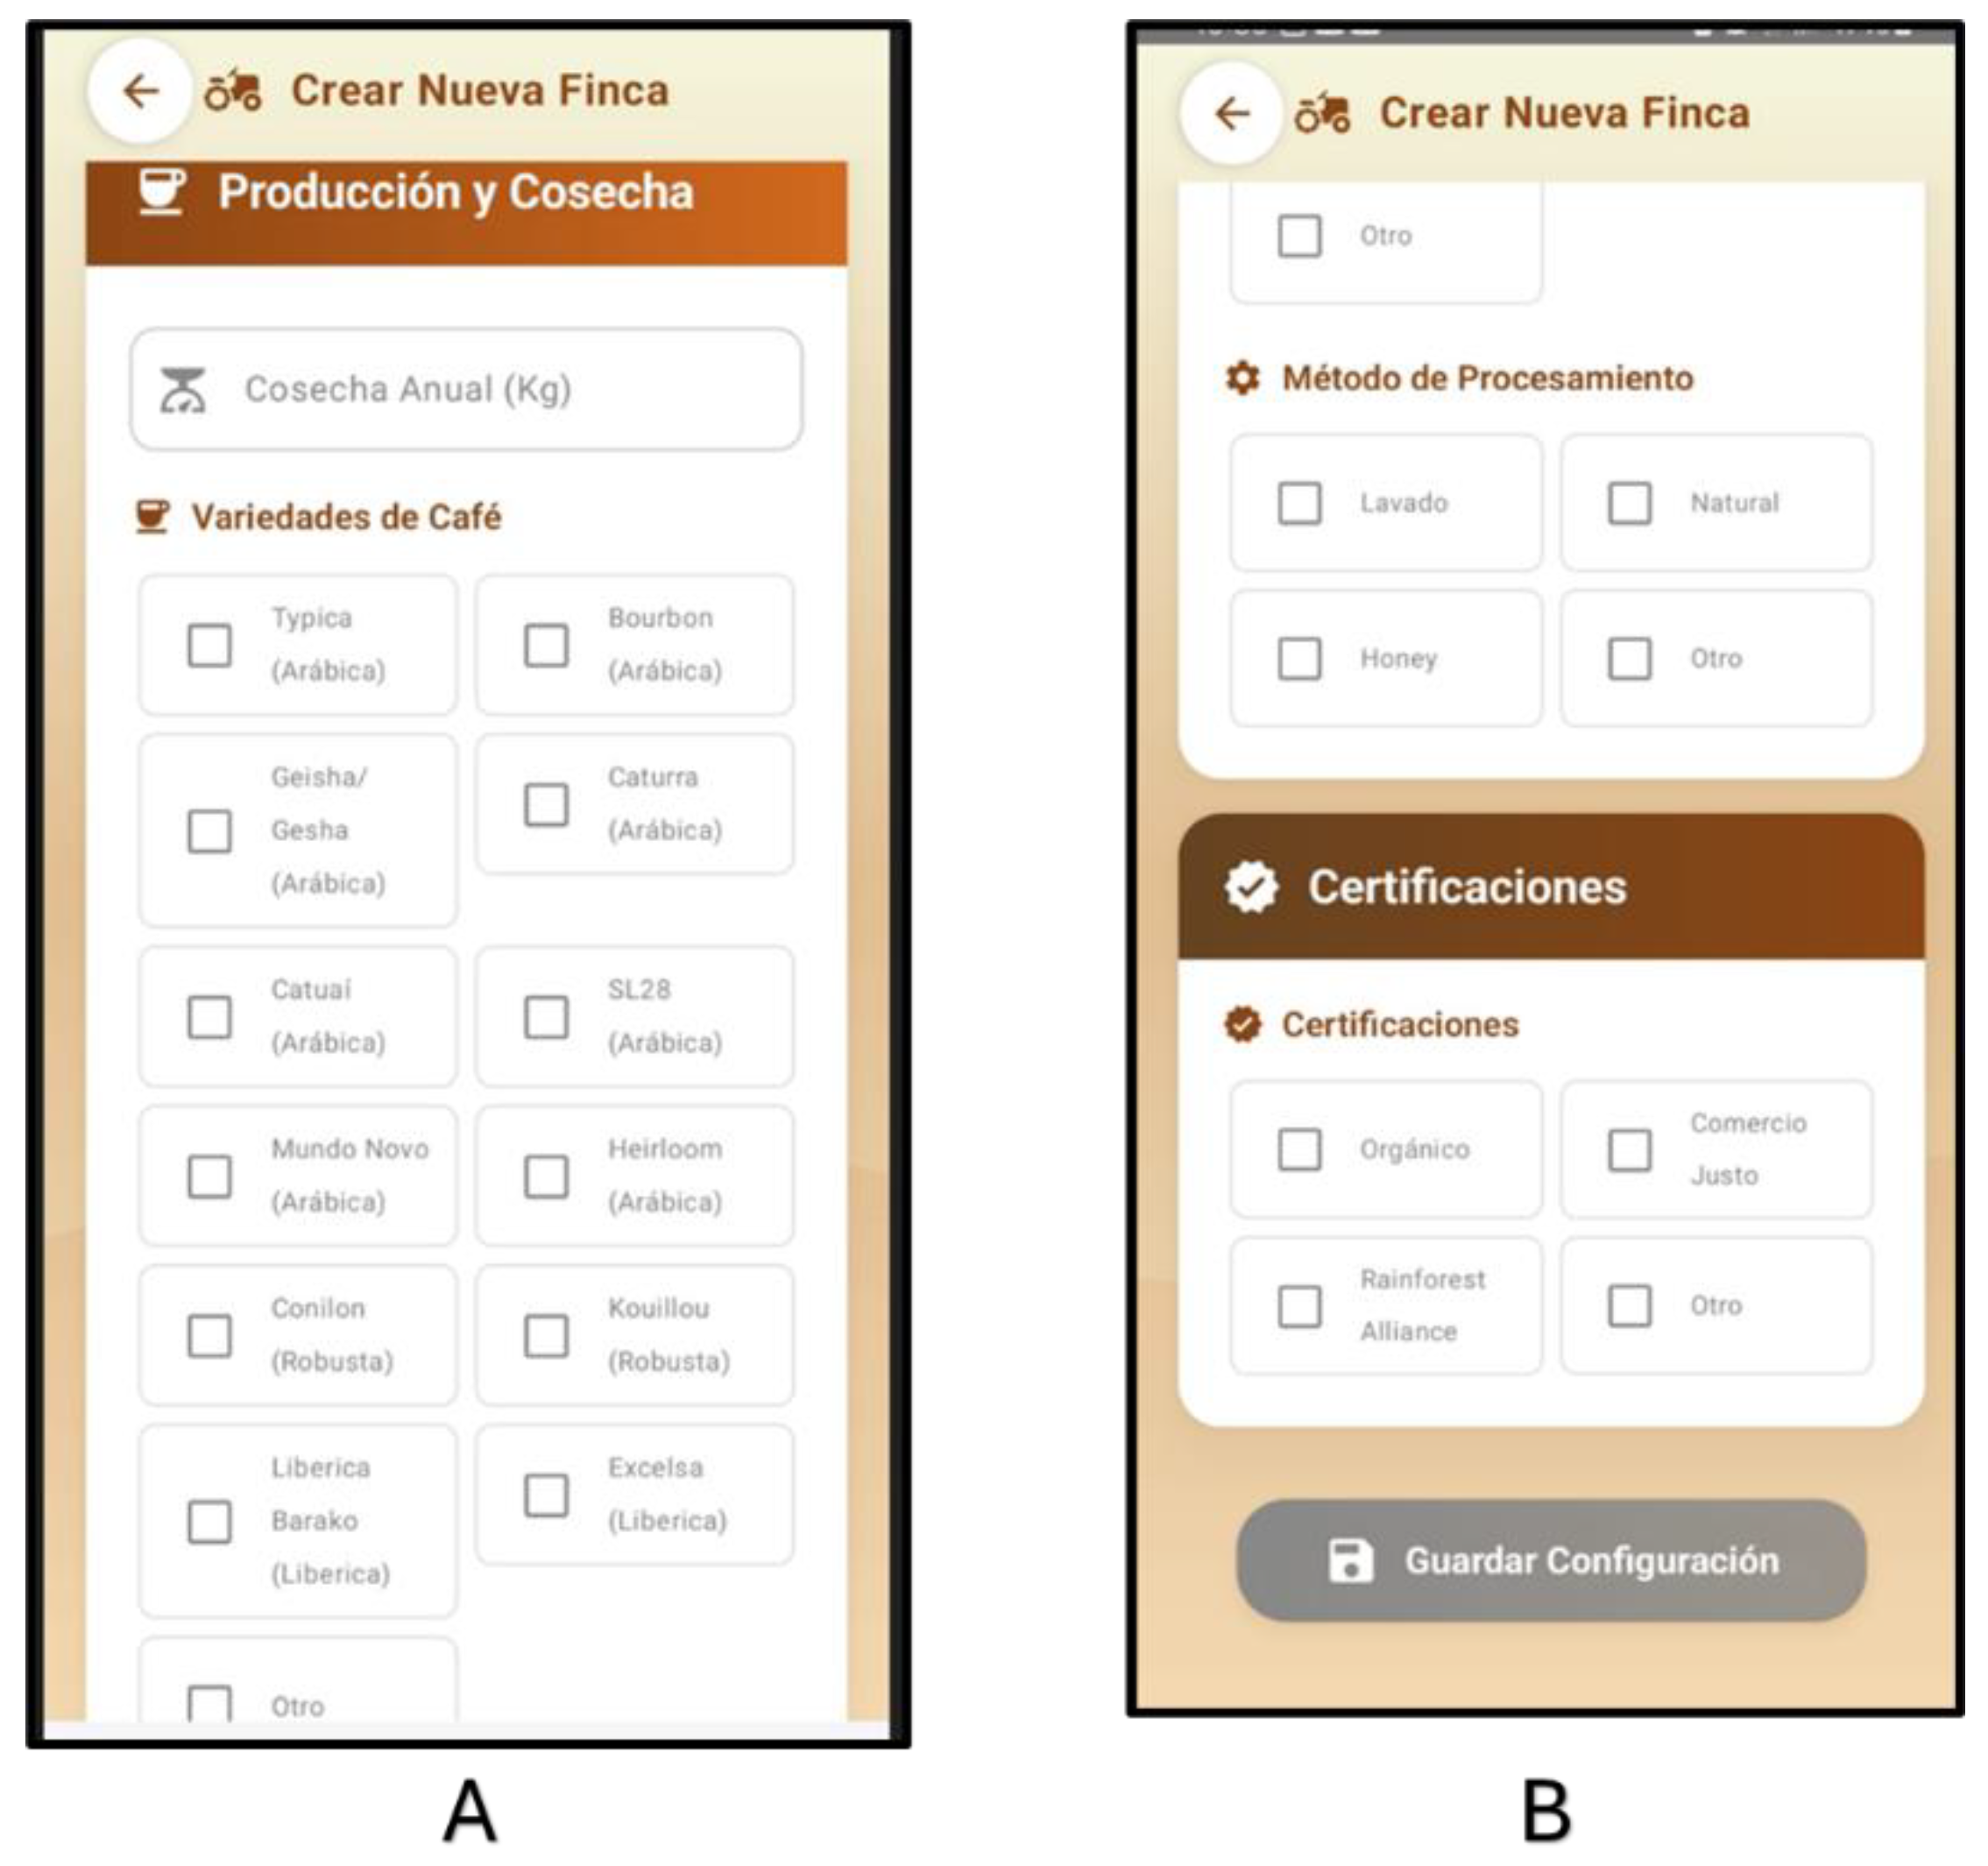
Figure 9.
Control of the collection of samples from the farm.
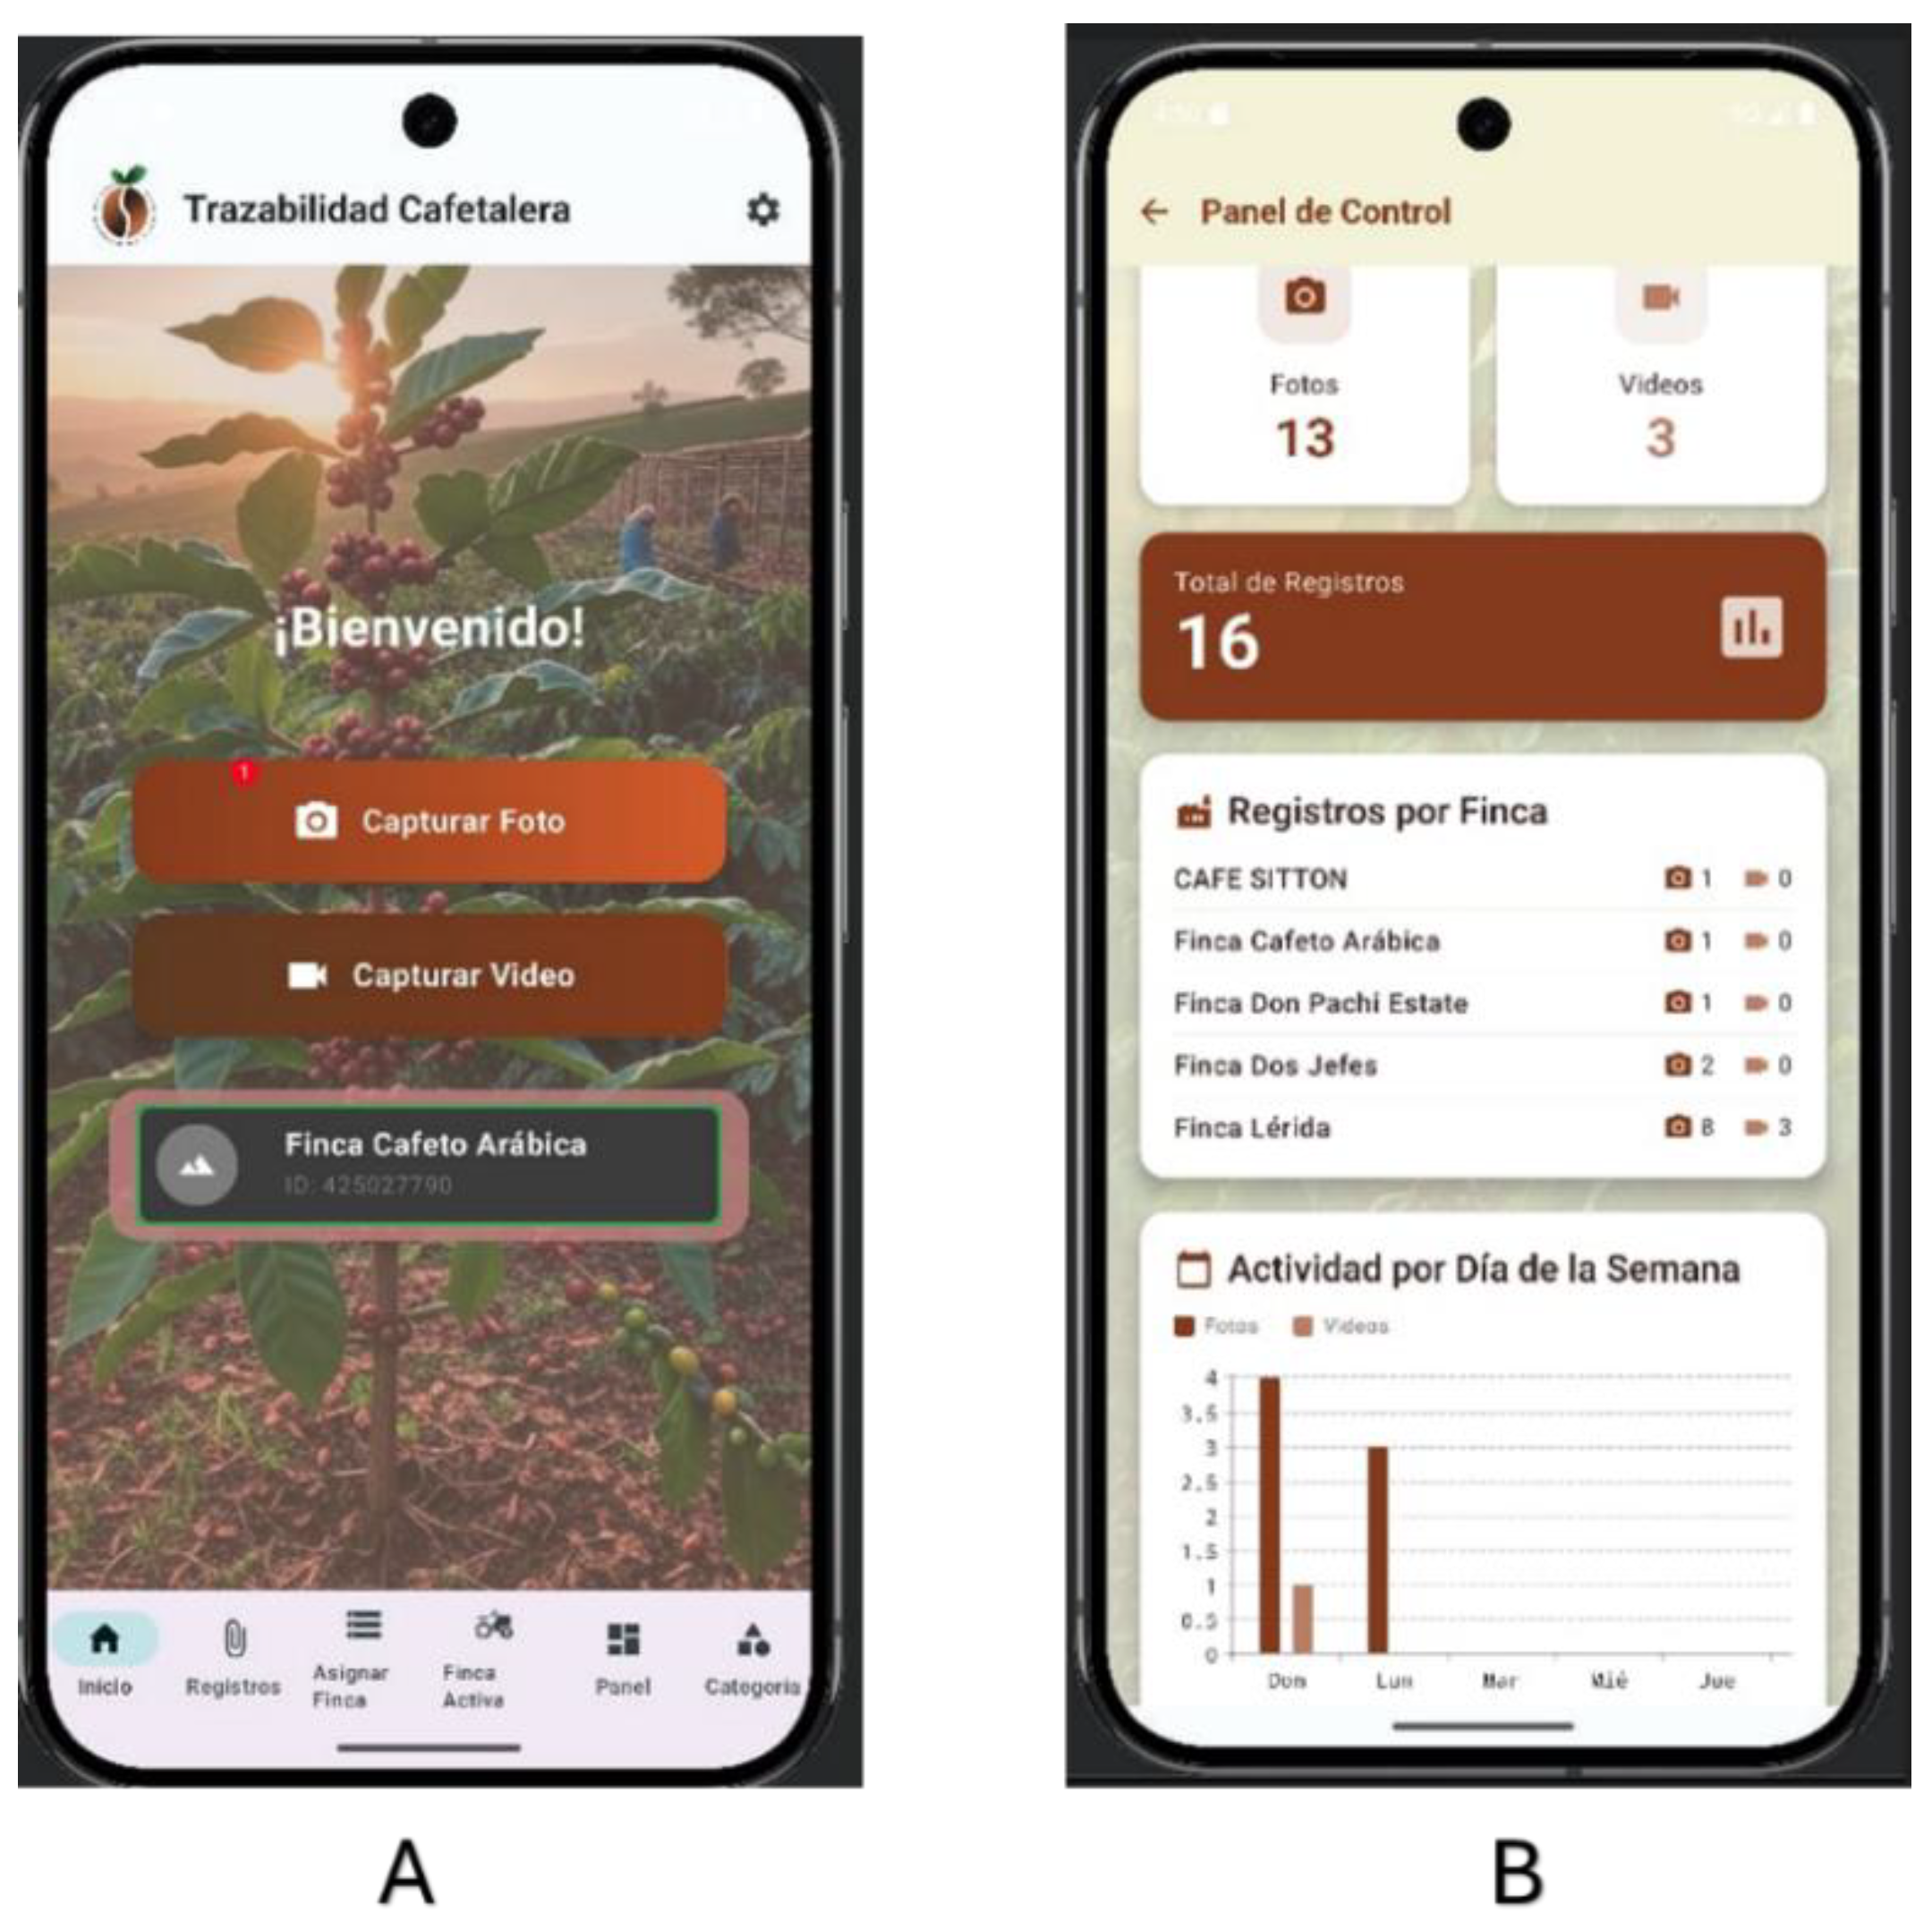

Table 1.
Specialty Coffee altitudes and temperatures by region.
| Region | Altitude Range (masl) | Temperature Range (°C) |
| Boquete | ~ 1,200 – 2,000 | ~13 – 24 |
| Tierras Altas | ~ 1,200 – 1,900 | ~ 12 – 25 |
| Renacimiento | ~ 1,200 – 1,950 | ~ 14 – 29 |
Table 2.
System components presented as tuples.
| Symbol | Formal Role | Meaning in This System |
| E | Static domain universe | Defines what exists in the system as users, farms, zones, coffee types, locations, etc. |
| State space | This application represents all valid configurations of entities, attributes, and stored objects. | |
| T | State evolution | Traceability coffee process is represented as system changes via actions or events. |
| Coordination mechanism | Blockchain technologies introduce consistency across concurrent or distributed transitions. | |
| Safety constraints or Invariants | Properties that must be configured during the activity logging processes. Invariants sample are: Every zone belongs to exactly one farm. Evidence must refer to a valid time. Stored objects must be associated with an entity. Users may only modify farms they own or manage. |
Table 3.
System’s entity application details.
| Symbol | Entity Set | Interpretation |
| U | Users | Represents the coffee grower or system actors interacting with the application. |
| F | Farms | Agricultural units under observation or management. |
| Z | Zones | Each farm could have many areas with different types of coffee (e.g., plots, microclimates). This areas are known as zones. |
| M | Evidence | Observations of coffee samples, measurements, or records (e.g., temperature data). This information is given without user manipulation and shared by internet connections. |
| Time | Temporal dimension enabling ordering and historical reasoning. | |
| D | Stored Objects |
Persisted digital artifacts such as files or datasets. |
Table 4.
Comparative approaches.
| Evaluation Attribute |
Traditional Method
(Q-Graders) |
Mobile System
(NIRS + PAMS) |
Advantage |
| Nature of Analysis | Sensory and Subjective (Taste/Smell) | Chemical and Objective (Spectroscopy) | Elimination of human bias |
| Turnaround Time | 24 - 48 hours (includes prep and panel) | < 5 minutes (Edge processing) | 95% reduction in time |
| Cost per Sample | High (Expert fees and logistics) | Low (Energy and cloud consumption) | Economic scalability |
| Data Traceability | Manual / Spreadsheets (Error-prone) | Automatic (Blockchain + Georeference) | Immutable data integrity |
| Requirements | On-site certified experts | Farm staff with minimal training | Decentralization of knowledge |
Disclaimer/Publisher’s Note: The statements, opinions and data contained in all publications are solely those of the individual author(s) and contributor(s) and not of MDPI and/or the editor(s). MDPI and/or the editor(s) disclaim responsibility for any injury to people or property resulting from any ideas, methods, instructions or products referred to in the content. |
© 2026 by the authors. Licensee MDPI, Basel, Switzerland. This article is an open access article distributed under the terms and conditions of the Creative Commons Attribution (CC BY) license (http://creativecommons.org/licenses/by/4.0/).
Copyright: This open access article is published under a Creative Commons CC BY 4.0 license, which permit the free download, distribution, and reuse, provided that the author and preprint are cited in any reuse.


