

Submitted:
01 February 2026
Posted:
03 February 2026
You are already at the latest version
Abstract
Background: Circulating tumor cells (CTCs) are key intermediates of hematogenous metastasis, yet their phenotype is shaped by transit through distinct anatomical niches. The cisterna chyli is the central lymphatic conduit draining lipid-rich intestinal lymph and peripheral lymphatics into the venous system. We investigated whether the cisterna chyli functions as a phenotypic “incubator” for aggressive CTC states.
Methods: In a 7-year prospective study, intraoperative samples (7.5 mL each) were collected from the cisterna chyli, peripheral lymph, and peripheral blood of 496 patients with stage III–IV solid tumors (21 tumor types). A control cohort of 118 non-oncological patients undergoing surgery after trauma was sampled with the same protocol. CTCs were enumerated by CellSearch and phenotyped using multi-marker immunocytochemistry for proliferation (Ki-67), invasion/migration (MMP-9, CXCR4), epithelial–mesenchymal transition (EMT), and stemness markers. Cell-free DNA (cfDNA) and circulating tumor DNA (ctDNA) were quantified across compartments.
Results: In the cancer cohort, cisterna chyli CTC counts were markedly higher than in peripheral blood or peripheral lymph (12–15× enrichment across tumor types). Cisterna chyli CTCs showed increased proliferative and invasive phenotypes (Ki-67 ~2.7×; MMP-9 ~3×; CXCR4 ~5×) and enrichment of EMT and stemness programs (Any EMT+ ~2.3×; Any stemness+ ~3.3×; ≥2 stemness markers ~3.4×). cfDNA and ctDNA levels were comparable across the three compartments. In controls, CTC-like events were detected in 23/118 participants (19.5%) with no enrichment reported between compartments.
Conclusions: The cisterna chyli harbors a substantially enriched and biologically aggressive CTC subpopulation, consistent with an “evolutionary incubator” model in which lymphatic transit promotes clonal selection and phenotypic plasticity. These findings support cisterna chyli sampling as a high-yield site for intraoperative liquid biopsy and suggest new regional therapeutic opportunities to target lymph-borne metastatic precursors.
Keywords:
cisterna chyli
; circulating tumor cells
; lymphatic metastasis
; EMT
; cancer stem cells
; liquid biopsy
; phenotypic plasticity
1. Introduction
CTCs are rare malignant cells shed from primary and metastatic lesions into the circulation and are strongly associated with prognosis in multiple tumor types, including metastatic breast, colorectal, prostate and lung cancers [1,2,3,4,5,16,17,18]. Standardized enrichment and imaging workflows (e.g., CellSearch) have enabled clinical validation and phenotyping of CTCs [13,14,23,24], while single-cell profiling has revealed extensive heterogeneity and phenotypic plasticity among CTCs [15]. CTC-based liquid biopsy concepts are increasingly integrated with other circulating biomarkers to support precision oncology [2,25,54]. However, CTC rarity and sampling limitations remain major barriers; approaches that increase sampled blood volume (e.g., diagnostic leukapheresis) can improve detection sensitivity [22]. Beyond enumeration, the biological state of CTCs—proliferation, invasion, immune interactions, EMT-like plasticity and stemness—appears to govern metastatic competence [11,12,19,20,21,34,35,36,37,38,39,40,41,42,43,44,45,46,47].
The lymphatic system is a major route of tumor dissemination, yet lymph-borne CTC biology is less studied than blood-borne CTCs. Lymphangiogenesis and lymphatic remodeling facilitate tumor cell transport, interactions with stromal and immune compartments, and access to downstream organs [6,7,8,26,27,28,29,30,31,32,33]. Lymphatic niches can be metabolically and immunologically distinct; adipose- and lymph node–associated microenvironments have been shown to promote metastatic traits and immune modulation [9,10].
The cisterna chyli is the primary collecting reservoir of intestinal and lower-body lymph that drains via the thoracic duct into the venous circulation. This unique niche is lipid-rich, subject to intermittent flow, and may present selective pressures (e.g., oxidative stress, hypoxia, immune interactions) that promote aggressive phenotypes.
We hypothesized that the cisterna chyli acts as an evolutionary incubator where CTCs are enriched and acquire proliferative, invasive, EMT-like and stem-like states before entering systemic circulation. To test this, we performed intraoperative matched sampling of cisterna chyli, peripheral lymph and peripheral blood in 614 participants (496 cancer; 118 controls) and compared CTC burden and phenotype across compartments.
2. Results
2.1. Study Cohorts
The cancer cohort comprised 496 patients with stage III–IV solid tumors representing 21 tumor types (Table 1 and Table 2). All cancer participants underwent intraoperative sampling of cisterna chyli, peripheral lymph and peripheral blood (7.5 mL each). The non-oncological control cohort included 118 trauma-surgery patients sampled with the same protocol.
CTC-like events were detected in 23/118 controls (19.5%). As reported by investigators, these events showed comparable distribution across cisterna chyli, peripheral lymph and peripheral blood, without the enrichment patterns observed in cancer participants.
2.2. Cisterna Chyli Markedly Enriches CTC Counts
Across all tumor types, mean CTC counts in cisterna chyli were 12–15-fold higher than in peripheral blood or peripheral lymph (Figure 1; Table 3). This enrichment was observed consistently across carcinomas and sarcomas, supporting a compartment-driven amplification rather than tumor-type restriction.
In peripheral blood and peripheral lymph, mean CTC burdens were similar, indicating that the cisterna chyli represents a distinct high-yield reservoir rather than a simple reflection of circulating load.
Table 3. (CTC enumeration by tumor type) is provided in the accompanying Excel file due to its size, and summarized in Figure 1.
2.3. Proliferation, Invasion and Migration Phenotypes Are Elevated in Cisterna Chyli CTCs
Cisterna chyli CTCs displayed increased proliferative activity (Ki-67) [55], enhanced invasive protease expression (MMP-9) [56], and elevated CXCR4 levels consistent with chemokine-driven trafficking (Table 4; Figure 2). The magnitude of enrichment was greatest for CXCR4 (~5×), implicating CXCR4/CXCL12 signaling as a potential mediator of lymphatic and nodal tropism [57,58].
2.4. EMT and Stemness Programs Are Enriched in Cisterna Chyli
Compared with blood/lymph CTCs, cisterna chyli CTCs showed increased expression of EMT markers (vimentin, N-cadherin, TWIST1, SNAIL/SLUG, ZEB1/2, nuclear β-catenin) and higher rates of multi-marker EMT positivity (Table 5; Figure 2). In parallel, cisterna chyli CTCs exhibited enrichment of stemness markers (ALDH1A1, CD44, CD133, SOX2/OCT4/NANOG, BMI1) and greater multi-marker stemness positivity (Table 6; Figure 2). These findings align with established links between EMT-like plasticity and cancer stem cell states [34,35,36,37,38,39,40,41,42,43,44,45,46,47].
2.5. cfDNA and ctDNA Levels Are Similar Across Compartments
Despite large differences in CTC burden and phenotype, cfDNA and ctDNA levels were comparable across cisterna chyli, peripheral lymph and peripheral blood (Table 7). This supports the concept that cellular (CTC) and acellular (cfDNA/ctDNA) compartments may capture distinct biological information and that cisterna chyli sampling preferentially augments cellular yield.

Table 7.
cfDNA/ctDNA levels across compartments (all tumor types pooled).
| Parameter | Blood | Peripheral lymph | Cisterna chyli |
| cfDNA (ng/mL) | 30.2 ± 5.7 | 29.8 ± 5.5 | 30.4 ± 5.9 |
| ctDNA fraction (%) | 1.22 ± 0.26 | 1.23 ± 0.25 | 1.21 ± 0.26 |
| cfDNA fold vs Blood | 1.00 | 0.99 | 1.01 |
| ctDNA fold vs Blood | 1.00 | 1.01 | 0.99 |
Table 8.
Control cohort summary.
| Metric | Value |
| Control cohort (non-oncological trauma surgery) | 118 |
| CTC-positive controls (any compartment) | 23 |
| CTC positivity rate (%) | 19.5 |
| Reported distribution | CTCs identified with comparable frequency in cisterna chyli, peripheral lymph, and peripheral blood |
| Identification method | CellSearch + ICC panel (same as cancer cohort) |
Control cohort details are provided as reported by investigators.
3. Discussion
This study provides evidence that the cisterna chyli is a high-yield compartment for CTC recovery and that cisterna-derived CTCs are enriched for proliferative, invasive, EMT-like and stem-like features. The observed 12–15× increase in cisterna chyli CTC counts across 21 tumor types suggests that lymphatic convergence and reservoir physiology concentrate tumor cells before venous entry. Importantly, phenotypic enrichment (Ki-67, MMP-9, CXCR4, EMT and stemness markers) indicates that cisterna chyli CTCs may represent a biologically selected subpopulation rather than a passive accumulation.
Mechanistically, lymphatic transport and nodal/cisternal microenvironments can impose unique selective pressures, including variable shear, intermittent flow, lipid-rich substrates, hypoxia-related signaling, and immune and stromal interactions [6,7,8,26,27,28,29,30,31,32,33,48,49,50,51,52,53]. CTC cluster biology and CTC–immune cell interactions may further support survival and metastatic competency [19,20,21]. The enrichment of EMT and stemness programs is consistent with models of metastasis requiring phenotypic plasticity and tumor-initiating capacity [34,35,36,37,38,39,40,41,42,43,44,45,46,47].
The control cohort yielded CTC-like events in ~20% of trauma-surgery patients without compartmental enrichment. Although the clinical meaning of these rare events remains uncertain in the absence of longitudinal follow-up, the lack of cisterna enrichment in controls supports that the marked cisterna signal in cancer participants is disease-associated.
Clinically, cisterna chyli sampling may serve as a superior intraoperative liquid biopsy site when feasible, enabling improved CTC enumeration and molecular profiling for prognosis, treatment resistance assessment, and investigation of metastatic potential. Therapeutically, the cisterna chyli and central lymphatic conduits could be explored as regional targets for drug delivery or for strategies aimed at limiting dissemination of highly plastic CTC states.
Chronobiology-related pathways, including melatonin signaling, may modulate oxidative stress, metabolic programming and metastatic behavior and therefore represent testable adjunct hypotheses for targeting metastatic traits [59,60,61,62,63,64,65,66,67].
Limitations include the intraoperative nature of sampling, heterogeneity in tumor types and prior therapies, and incomplete demographic characterization of the control cohort in the current dataset. Future work should integrate longitudinal outcomes, single-cell multi-omics, and standardized control phenotyping to better define the clinical significance of cisterna-derived CTCs.
4. Materials and Methods
4.1. Study Design and Participants
A prospective observational study was conducted over 7 years at the Institute for Personalized Medicine of Georgia. The cancer cohort included 496 adults with stage III–IV solid tumors undergoing surgery or diagnostic procedures allowing access to the cisterna chyli. Tumor types are listed in Table 2. The control cohort included 118 non-oncological patients undergoing surgery after trauma.
4.2. Sample Collection
Matched samples (7.5 mL each) were obtained intraoperatively from peripheral blood, peripheral lymph, and the cisterna chyli using sterile technique and processed immediately.
4.3. CTC Enumeration and Phenotyping
CTCs were enumerated using the CellSearch system (EpCAM enrichment with cytokeratin positivity and CD45 exclusion) [13,14,23,24]. For tumors with reduced epithelial marker expression (e.g., sarcomas or EMT-high phenotypes), immunocytochemistry panels including vimentin and additional lineage markers were used for phenotypic classification. Phenotyping assays targeted proliferation (Ki-67), invasion/migration (MMP-9, CXCR4), EMT markers (VIM, CDH2, TWIST1, SNAIL/SLUG, ZEB1/2, nuclear β-catenin), and stemness markers (ALDH1A1, CD44, CD133, SOX2/OCT4/NANOG, BMI1). Negative controls were included for each staining run.
4.4. cfDNA/ctDNA Quantification
cfDNA and ctDNA were quantified from matched plasma/lymph/cisternal fluid using standardized extraction and quantification workflows.
4.5. Statistics
Continuous variables are reported as mean ± SD. Comparisons between cisterna chyli and peripheral compartments used paired tests as appropriate; significance was set at p < 0.05. Where multiple comparisons were made across marker panels, results were interpreted with attention to overall effect sizes.
5. Conclusions
The cisterna chyli is a central lymphatic reservoir that concentrates CTCs and enriches for aggressive phenotypes characterized by proliferation, invasion, EMT and stemness. Cisterna chyli sampling may provide a high-yield intraoperative liquid biopsy and highlights the central lymphatic system as a potential therapeutic and diagnostic target in metastasis.
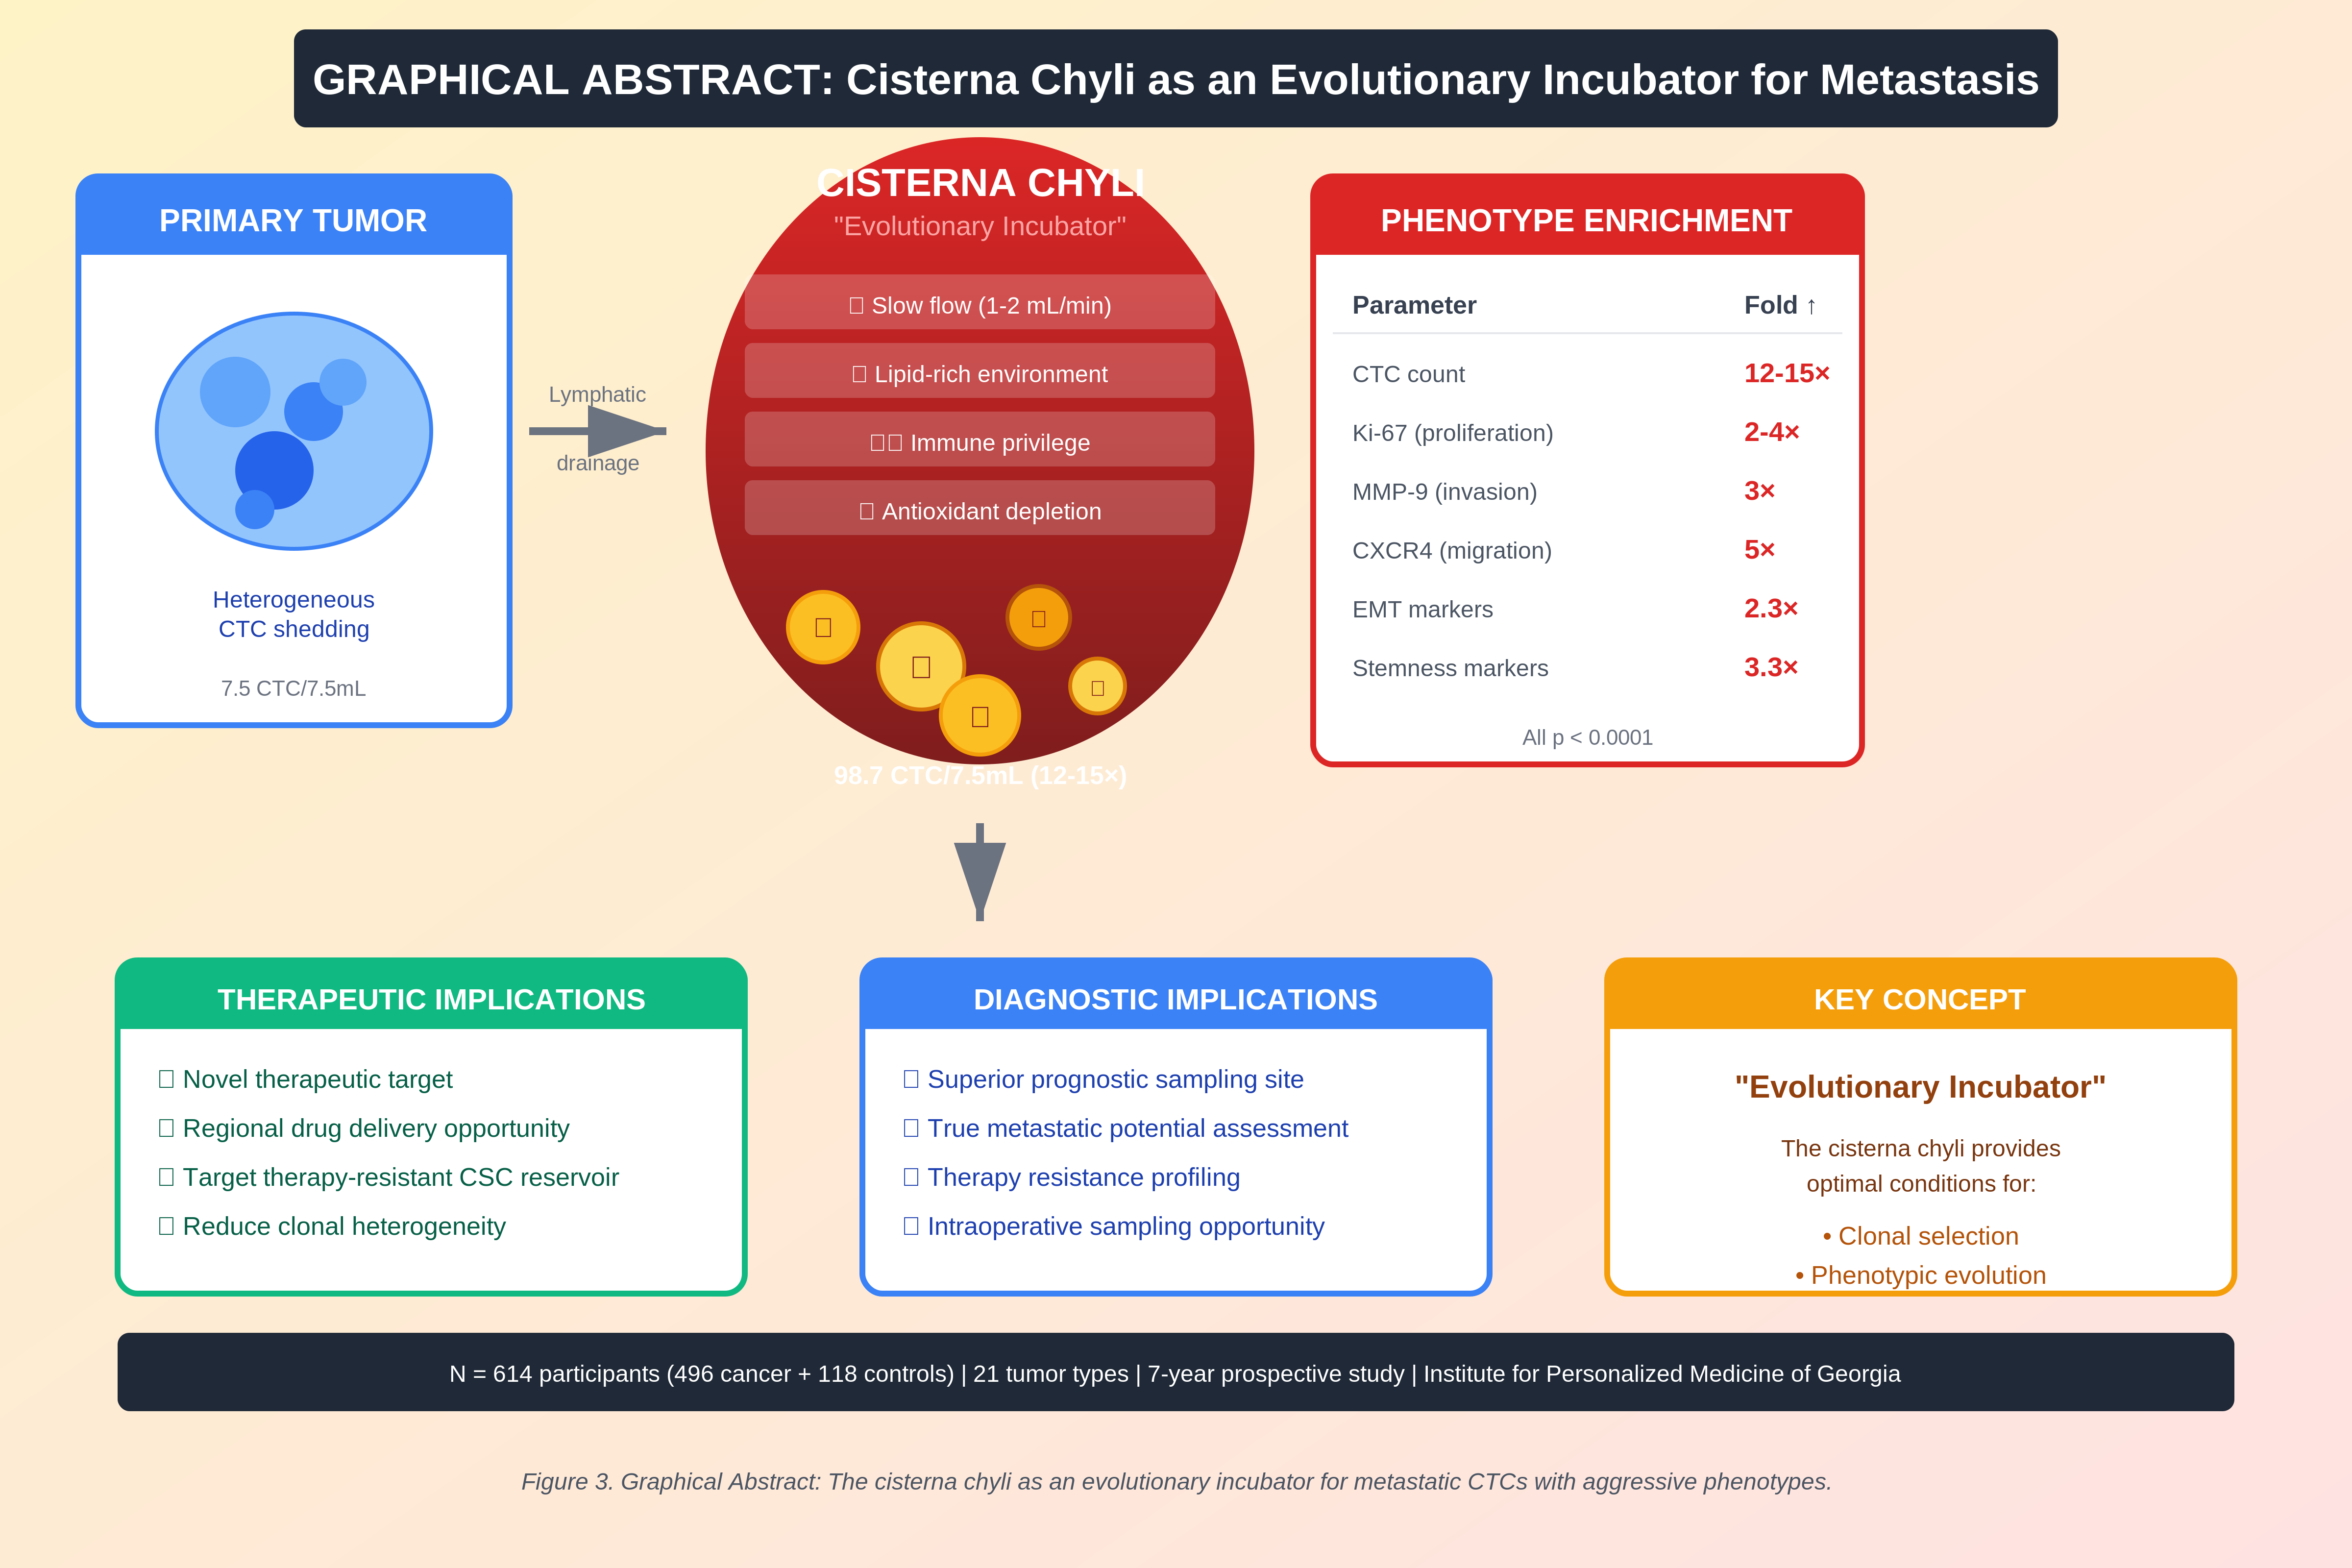
Figure 3.
Graphical abstract. Proposed model of the cisterna chyli as an “evolutionary incubator” that concentrates CTCs and enriches aggressive phenotypes, with diagnostic and therapeutic implications. N = 614 participants.
Figure 3.
Graphical abstract. Proposed model of the cisterna chyli as an “evolutionary incubator” that concentrates CTCs and enriches aggressive phenotypes, with diagnostic and therapeutic implications. N = 614 participants.
Figure 4.
CellSearch system principle. Schematic overview of EpCAM-based immunomagnetic enrichment, fluorescent labeling (CK/DAPI/CD45) and automated imaging used for CTC enumeration.
Figure 4.
CellSearch system principle. Schematic overview of EpCAM-based immunomagnetic enrichment, fluorescent labeling (CK/DAPI/CD45) and automated imaging used for CTC enumeration.
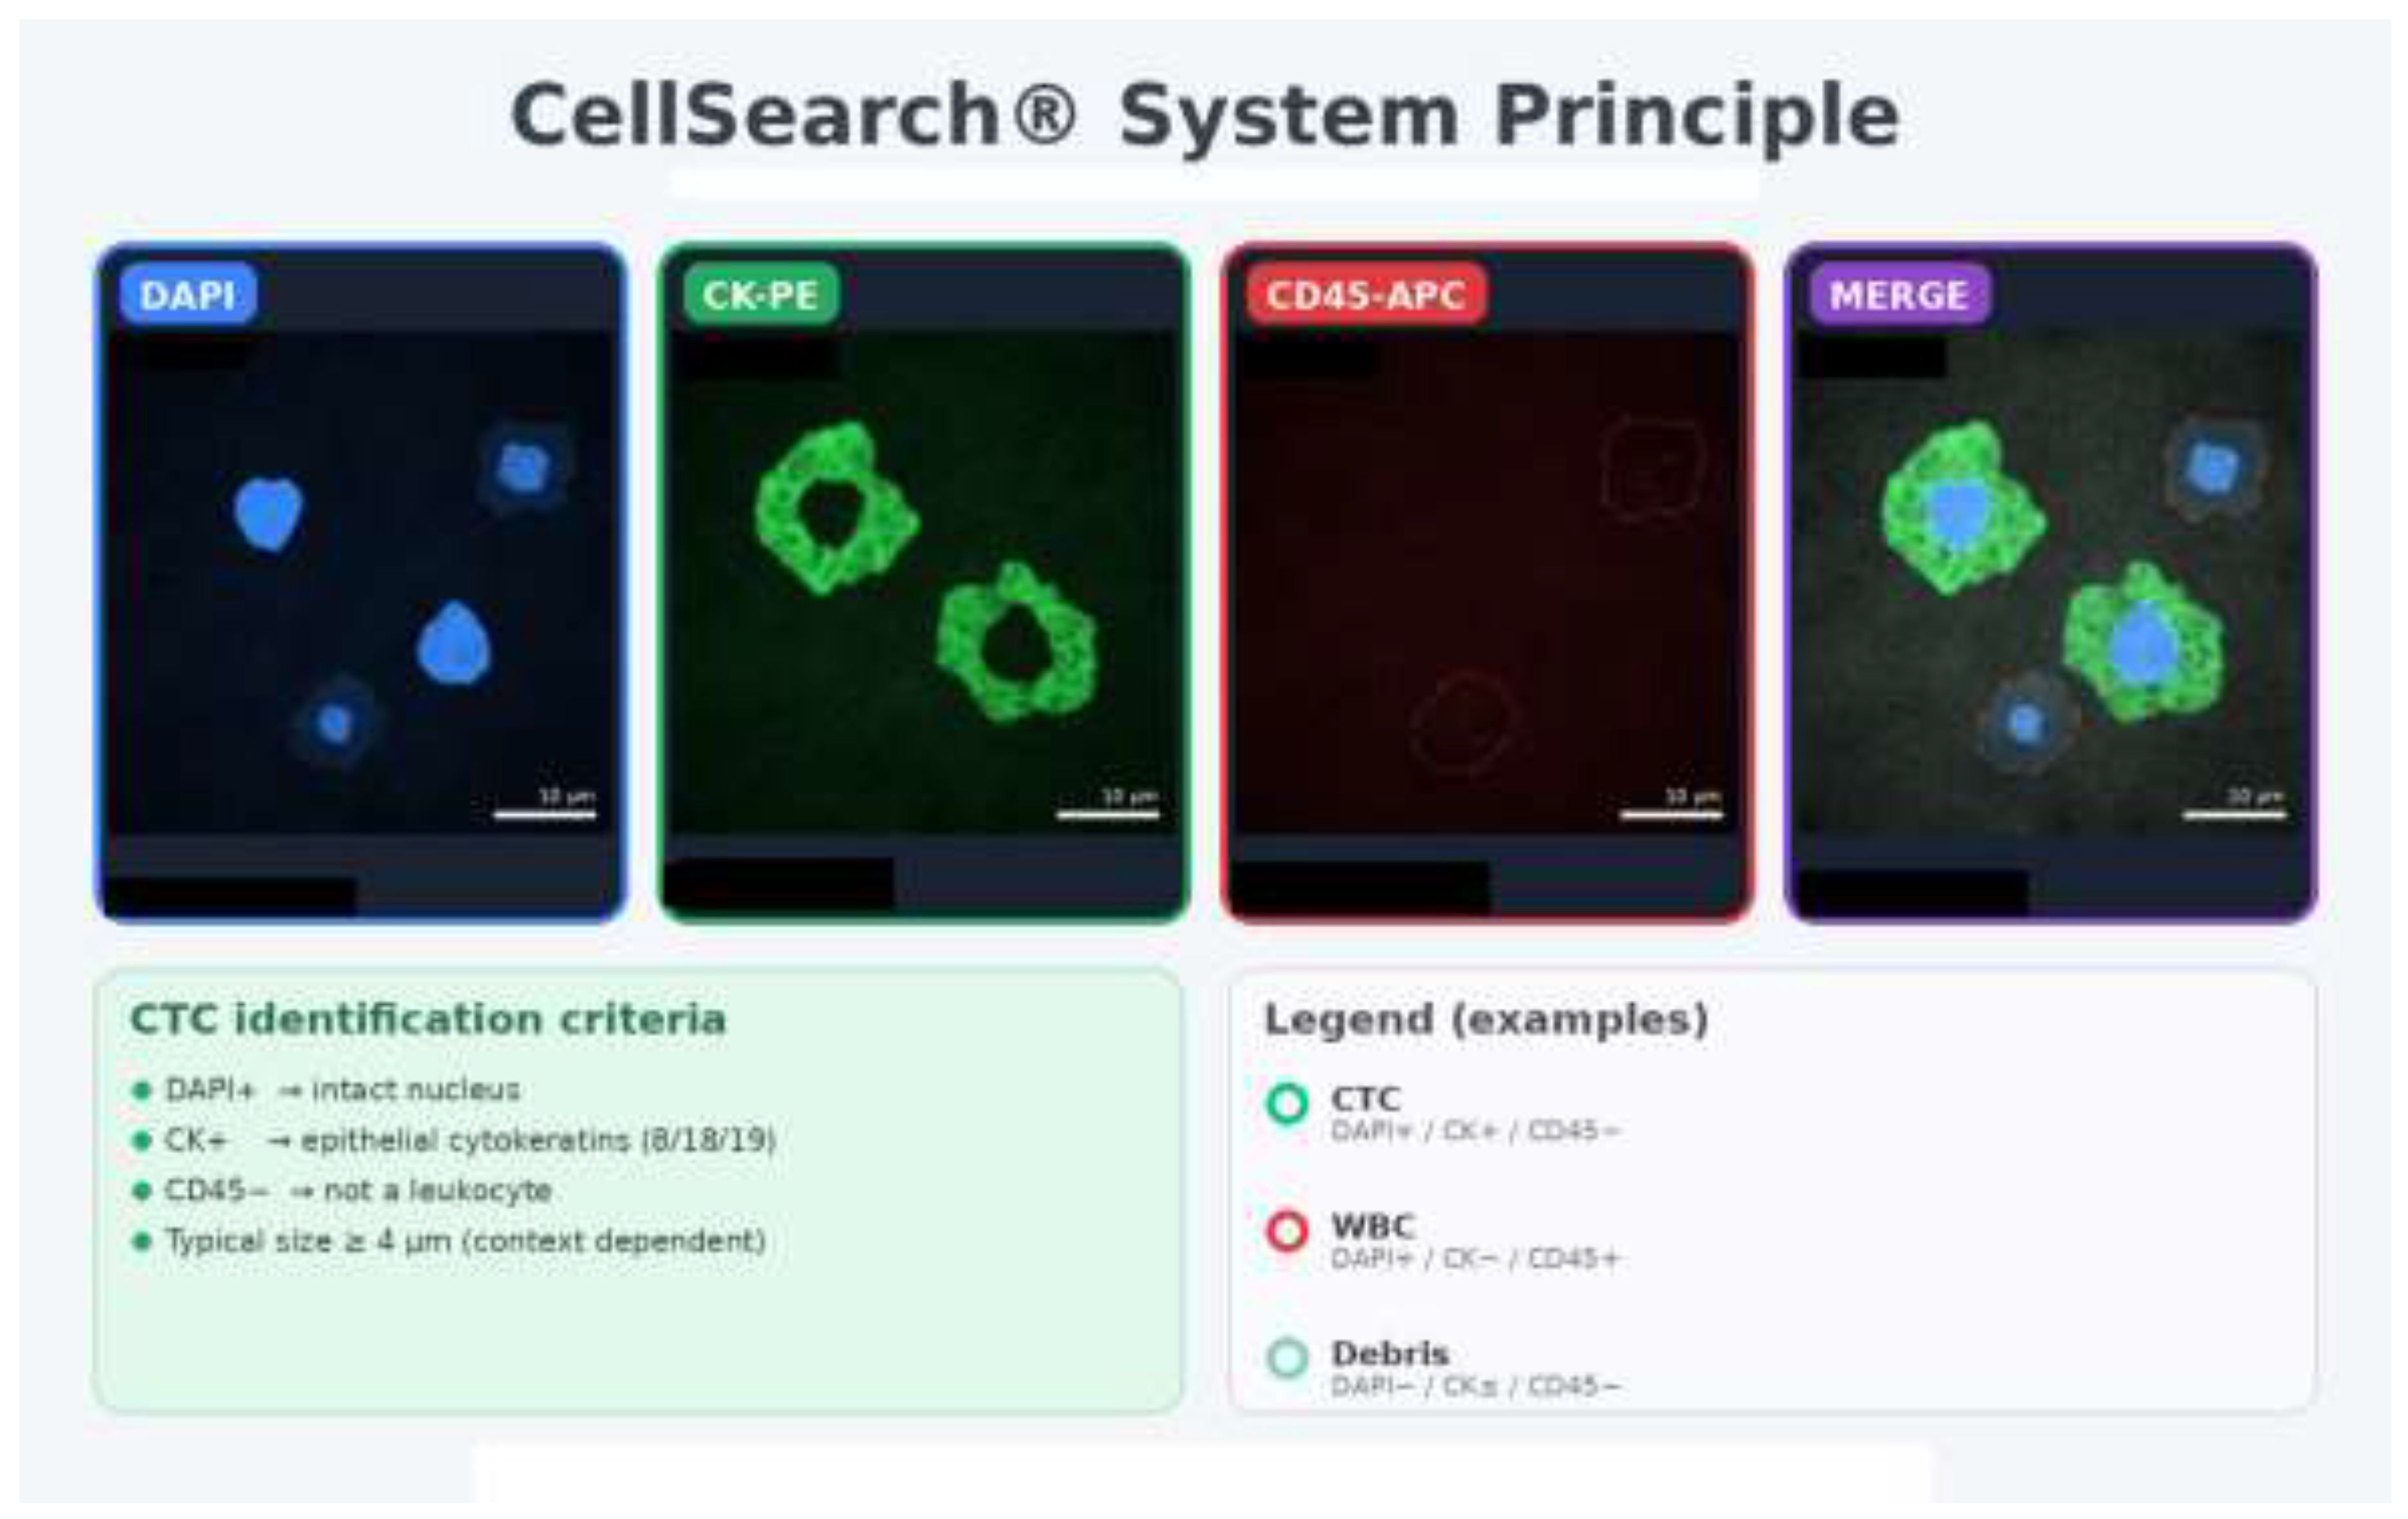
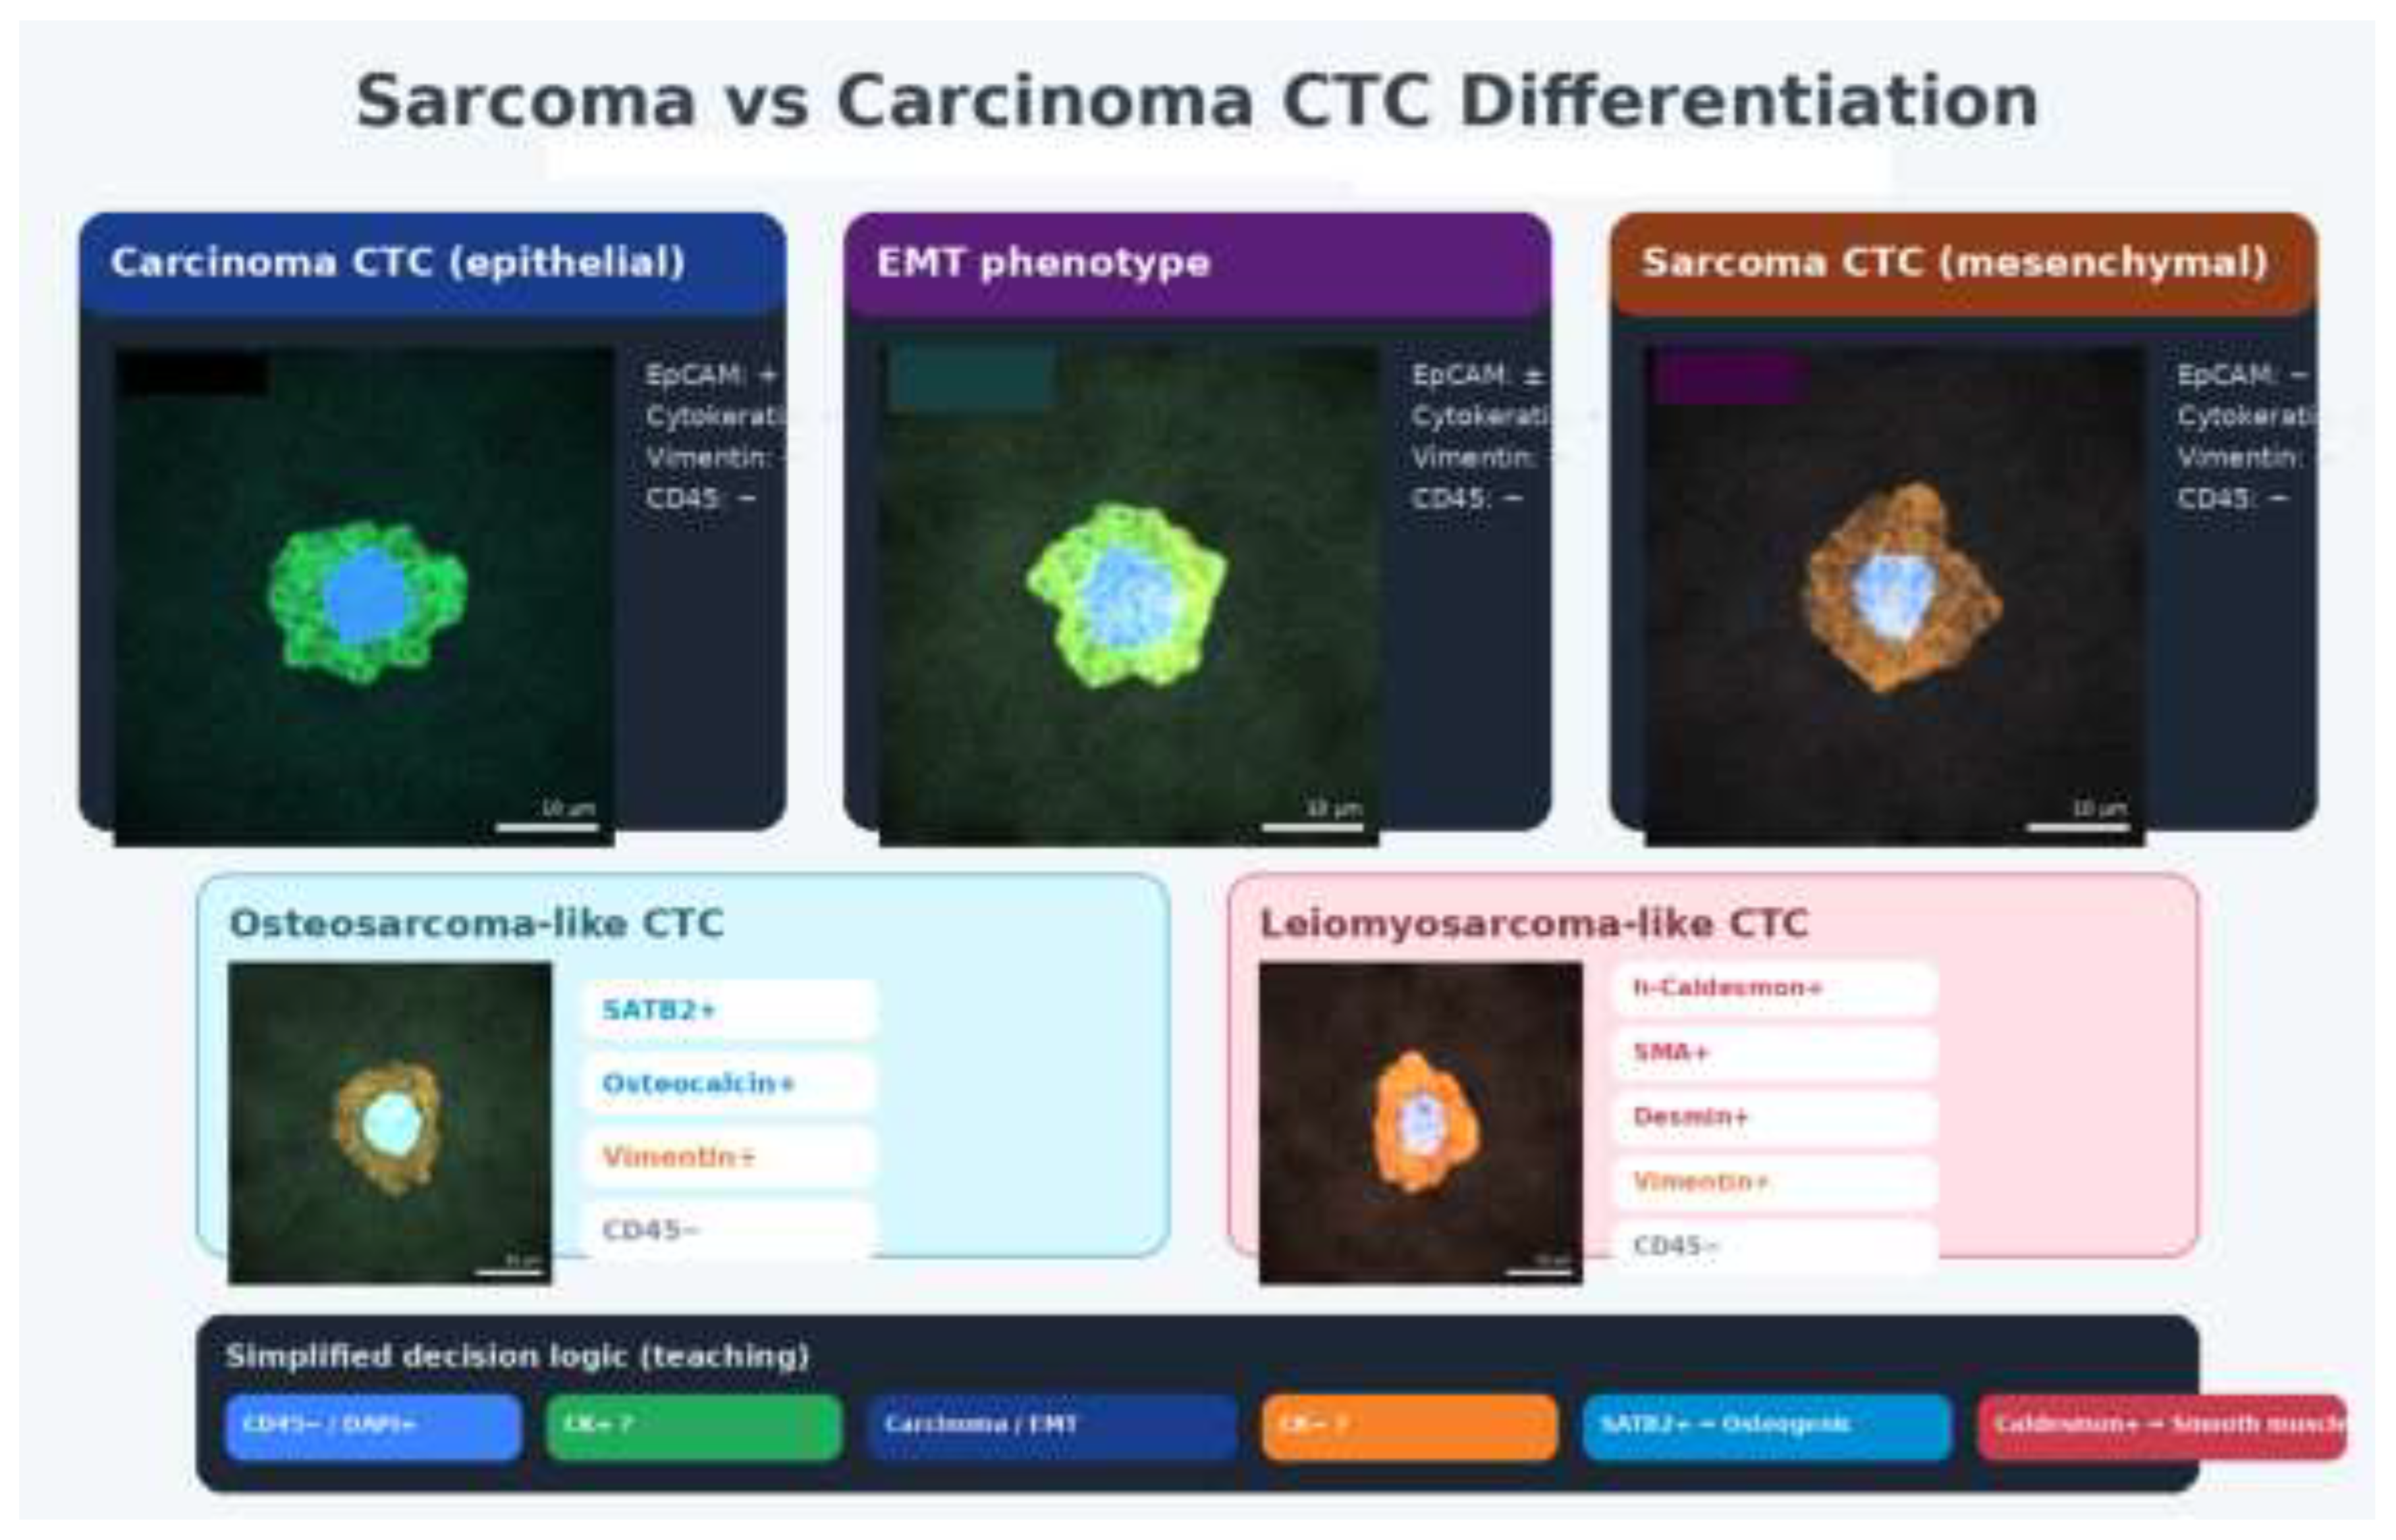
Figure 5.
Decision logic for differentiating carcinoma- vs sarcoma-like CTC phenotypes. Representative immunophenotyping patterns and simplified classification logic applied to epithelial and mesenchymal CTC states.
Figure 5.
Decision logic for differentiating carcinoma- vs sarcoma-like CTC phenotypes. Representative immunophenotyping patterns and simplified classification logic applied to epithelial and mesenchymal CTC states.
Supplementary Materials
The following supporting information can be downloaded at the website of this paper posted on Preprints.org. The Excel file provided with this submission contains full Table 3 (tumor-type-specific enumeration) and the complete set of tables used in this study.
Author Contributions
Conceptualization: A.T.; Methodology: A.T., L.T.; Investigation: A.T., L.T., D.K., N.O., P.R.; Data curation: A.T., L.T.; Writing—original draft: A.T.; Writing—review & editing: A.T., R.J.R., R.L.; Supervision: A.T.; All authors have read and agreed to the published version of the manuscript.
Funding
No external funding was reported. Update if applicable.
Institutional Review Board Statement
The study was conducted in accordance with the Declaration of Helsinki and approved by the Institutional Review Board/Ethics Committee of the Institute for Personalized Medicine of Georgia (Approval ID: insert).
Informed Consent Statement
Informed consent was obtained from all subjects involved in the study.
Data Availability Statement
De-identified data are available from the corresponding author upon reasonable request.
Conflicts of Interest
The authors declare no conflict of interest. Update if applicable.
References
- Cristofanilli, M; et al. N Engl J Med 2004, 351, 781–91. [CrossRef] [PubMed]
- Alix-Panabières, C; Pantel, K. Clin Chem 2013, 59, 110–8. [CrossRef] [PubMed]
- Cohen, SJ; et al. J Clin Oncol 2008, 26, 3213–21. [CrossRef] [PubMed]
- de Bono, JS; et al. Clin Cancer Res 2008, 14, 6302–9. [CrossRef]
- Hayes, DF; et al. Clin Cancer Res 2006, 12, 4218–24. [CrossRef]
- Stacker, SA; et al. Nat Rev Cancer 2014, 14, 159–72. [CrossRef]
- Alitalo, A; Detmar, M. Oncogene 2012, 31, 4499–508. [CrossRef]
- Nieman, KM; et al. Nat Med 2011, 17, 1498–503. [CrossRef]
- Wang, YY; et al. JCI Insight 2017, 2, e87489. [CrossRef]
- Lund, AW; et al. J Clin Invest 2016, 126, 3389–402. [CrossRef]
- Thiery, JP; et al. Cell 2009, 139, 871–90. [CrossRef]
- Yu, M; et al. Science 2013, 339, 580–4. [CrossRef]
- Batlle, E; Clevers, H. Nat Med 2017, 23, 1124–34. [CrossRef] [PubMed]
- Allard, WJ; et al. Clin Cancer Res 2004, 10, 6897–904. [CrossRef] [PubMed]
- Riethdorf, S; et al. Clin Cancer Res 2007, 13, 920–8. [CrossRef] [PubMed]
- Bidard, FC; et al. Lancet Oncol 2014, 15, 406–14. [CrossRef]
- Scher, HI; et al. Lancet Oncol 2009, 10, 233–9. [CrossRef]
- Krebs, MG; et al. J Clin Oncol 2011, 29, 1556–63. [CrossRef]
- Aceto, N; et al. Cell 2014, 158, 1110–22. [CrossRef]
- Szczerba, BM; et al. Nature 2019, 566, 553–7. [CrossRef]
- Gkountela, S; et al. Cell 2019, 176, 98–112. [CrossRef] [PubMed]
- Fischer, JC; et al. Proc Natl Acad Sci USA 2013, 110, 16580–85. [CrossRef] [PubMed]
- Alix-Panabières, C; Pantel, K. Nat Rev Cancer 2014, 14, 623–31. [CrossRef] [PubMed]
- Paoletti, C; et al. Clin Cancer Res 2015, 21, 2771–9. [CrossRef]
- Pantel, K; Alix-Panabières, C. Nat Rev Clin Oncol 2019, 16, 409–24. [CrossRef]
- Massagué, J; Obenauf, AC. Nature 2016, 529, 298–306. [CrossRef]
- Lambert, AW; et al. Cell 2017, 168, 670–91. [CrossRef]
- Padua, D; et al. Cell 2008, 133, 66–77. [CrossRef]
- Talmadge, JE; Fidler, IJ. Cancer Res 2010, 70, 5649–69. [CrossRef]
- Karaman, S; Detmar, M. J Clin Invest 2014, 124, 922–8. [CrossRef]
- Pereira, ER; et al. Science 2018, 359, 1403–7. [CrossRef]
- Brown, M; et al. Science 2018, 359, 1408–11. [CrossRef] [PubMed]
- Naxerova, K; et al. Science 2017, 357, 55–60. [CrossRef] [PubMed]
- Kalluri, R; Weinberg, RA. J Clin Invest 2009, 119, 1420–8. [CrossRef] [PubMed]
- Nieto, MA; et al. Cell 2016, 166, 21–45. [CrossRef]
- Pastushenko, I; et al. Nature 2018, 556, 463–8. [CrossRef]
- Dongre, A; Weinberg, RA. Nat Rev Mol Cell Biol 2019, 20, 69–84. [CrossRef]
- Mani, SA; et al. Cell 2008, 133, 704–15. [CrossRef]
- Morel, AP; et al. PLoS One 2008, 3, e2888. [CrossRef]
- Baccelli, I; et al. Nat Biotechnol 2013, 31, 539–44. [CrossRef]
- Ginestier, C; et al. Cell Stem Cell 2007, 1, 555–67. [CrossRef] [PubMed]
- Al-Hajj, M; et al. Proc Natl Acad Sci USA 2003, 100, 3983–8. [CrossRef] [PubMed]
- Ricci-Vitiani, L; et al. Nature 2007, 445, 111–5. [CrossRef] [PubMed]
- Hermann, PC; et al. Cell Stem Cell 2007, 1, 313–23. [CrossRef]
- Kreso, A; Dick, JE. Cell Stem Cell 2014, 14, 275–91. [CrossRef]
- Plaks, V; et al. Cell Stem Cell 2015, 16, 225–38. [CrossRef]
- Diehn, M; et al. Nature 2009, 458, 780–3. [CrossRef]
- Semenza, GL. Trends Pharmacol Sci 2012, 33, 207–14. [CrossRef]
- Keith, B; Simon, MC. Cell 2007, 129, 465–72. [CrossRef]
- Li, Z; et al. Cancer Cell 2009, 15, 501–13. [CrossRef]
- Steinbichler, TB; et al. Semin Cancer Biol 2018, 53, 156–67. [CrossRef] [PubMed]
- Dean, M; et al. Nat Rev Cancer 2005, 5, 275–84. [CrossRef] [PubMed]
- Gottesman, MM; et al. Nat Rev Cancer 2002, 2, 48–58. [CrossRef] [PubMed]
- Alix-Panabières, C; et al. Breast Cancer Res 2009, 11, R39. [CrossRef]
- Scholzen, T; Gerdes, J. J Cell Physiol 2000, 182, 311–22. [CrossRef]
- Kessenbrock, K; et al. Cell 2010, 141, 52–67. [CrossRef]
- Müller, A; et al. Nature 2001, 410, 50–6. [CrossRef]
- Balkwill, F. Semin Cancer Biol 2004, 14, 171–9. [CrossRef]
- Reiter, RJ; et al. Physiology 2014, 29, 325–33. [CrossRef]
- Reiter, RJ; Rosales-Corral, SA; Manchester, LC; Tan, DX. Int J Mol Sci 2017, 18, 843. [CrossRef]
- Hill, SM; et al. Endocr Relat Cancer 2015, 22, R183–204. [CrossRef]
- Sanchez-Barcelo, EJ; Mediavilla, MD; Tan, DX; Reiter, RJ. Clinical uses of melatonin: evaluation of human trials. Curr Med Chem 2010, 17, 2074–95. [Google Scholar] [CrossRef]
- Mediavilla, MD; Sanchez-Barcelo, EJ; Tan, DX; Manchester, L; Reiter, RJ. Basic mechanisms involved in the anti-cancer effects of melatonin. Curr Med Chem 2010, 17, 4462–81. [Google Scholar] [CrossRef]
- Reiter, RJ; et al. J Pineal Res 2016. [CrossRef]
- Su, SC; et al. J Pineal Res 2017. [CrossRef]
- Talib, WH; et al. Molecules 2018, 23, 518. [CrossRef]
- Al-Wajeeh, NS; et al. Cancers 2020, 12, 896. [CrossRef]
Figure 1.
CTC enumeration across matched compartments. CTC counts (per 7.5 mL) in peripheral blood, peripheral lymph and cisterna chyli for N = 496 cancer patients, demonstrating 12–15× enrichment in cisterna chyli. All comparisons: cisterna chyli vs. blood/lymph, p < 0.0001.
Figure 1.
CTC enumeration across matched compartments. CTC counts (per 7.5 mL) in peripheral blood, peripheral lymph and cisterna chyli for N = 496 cancer patients, demonstrating 12–15× enrichment in cisterna chyli. All comparisons: cisterna chyli vs. blood/lymph, p < 0.0001.
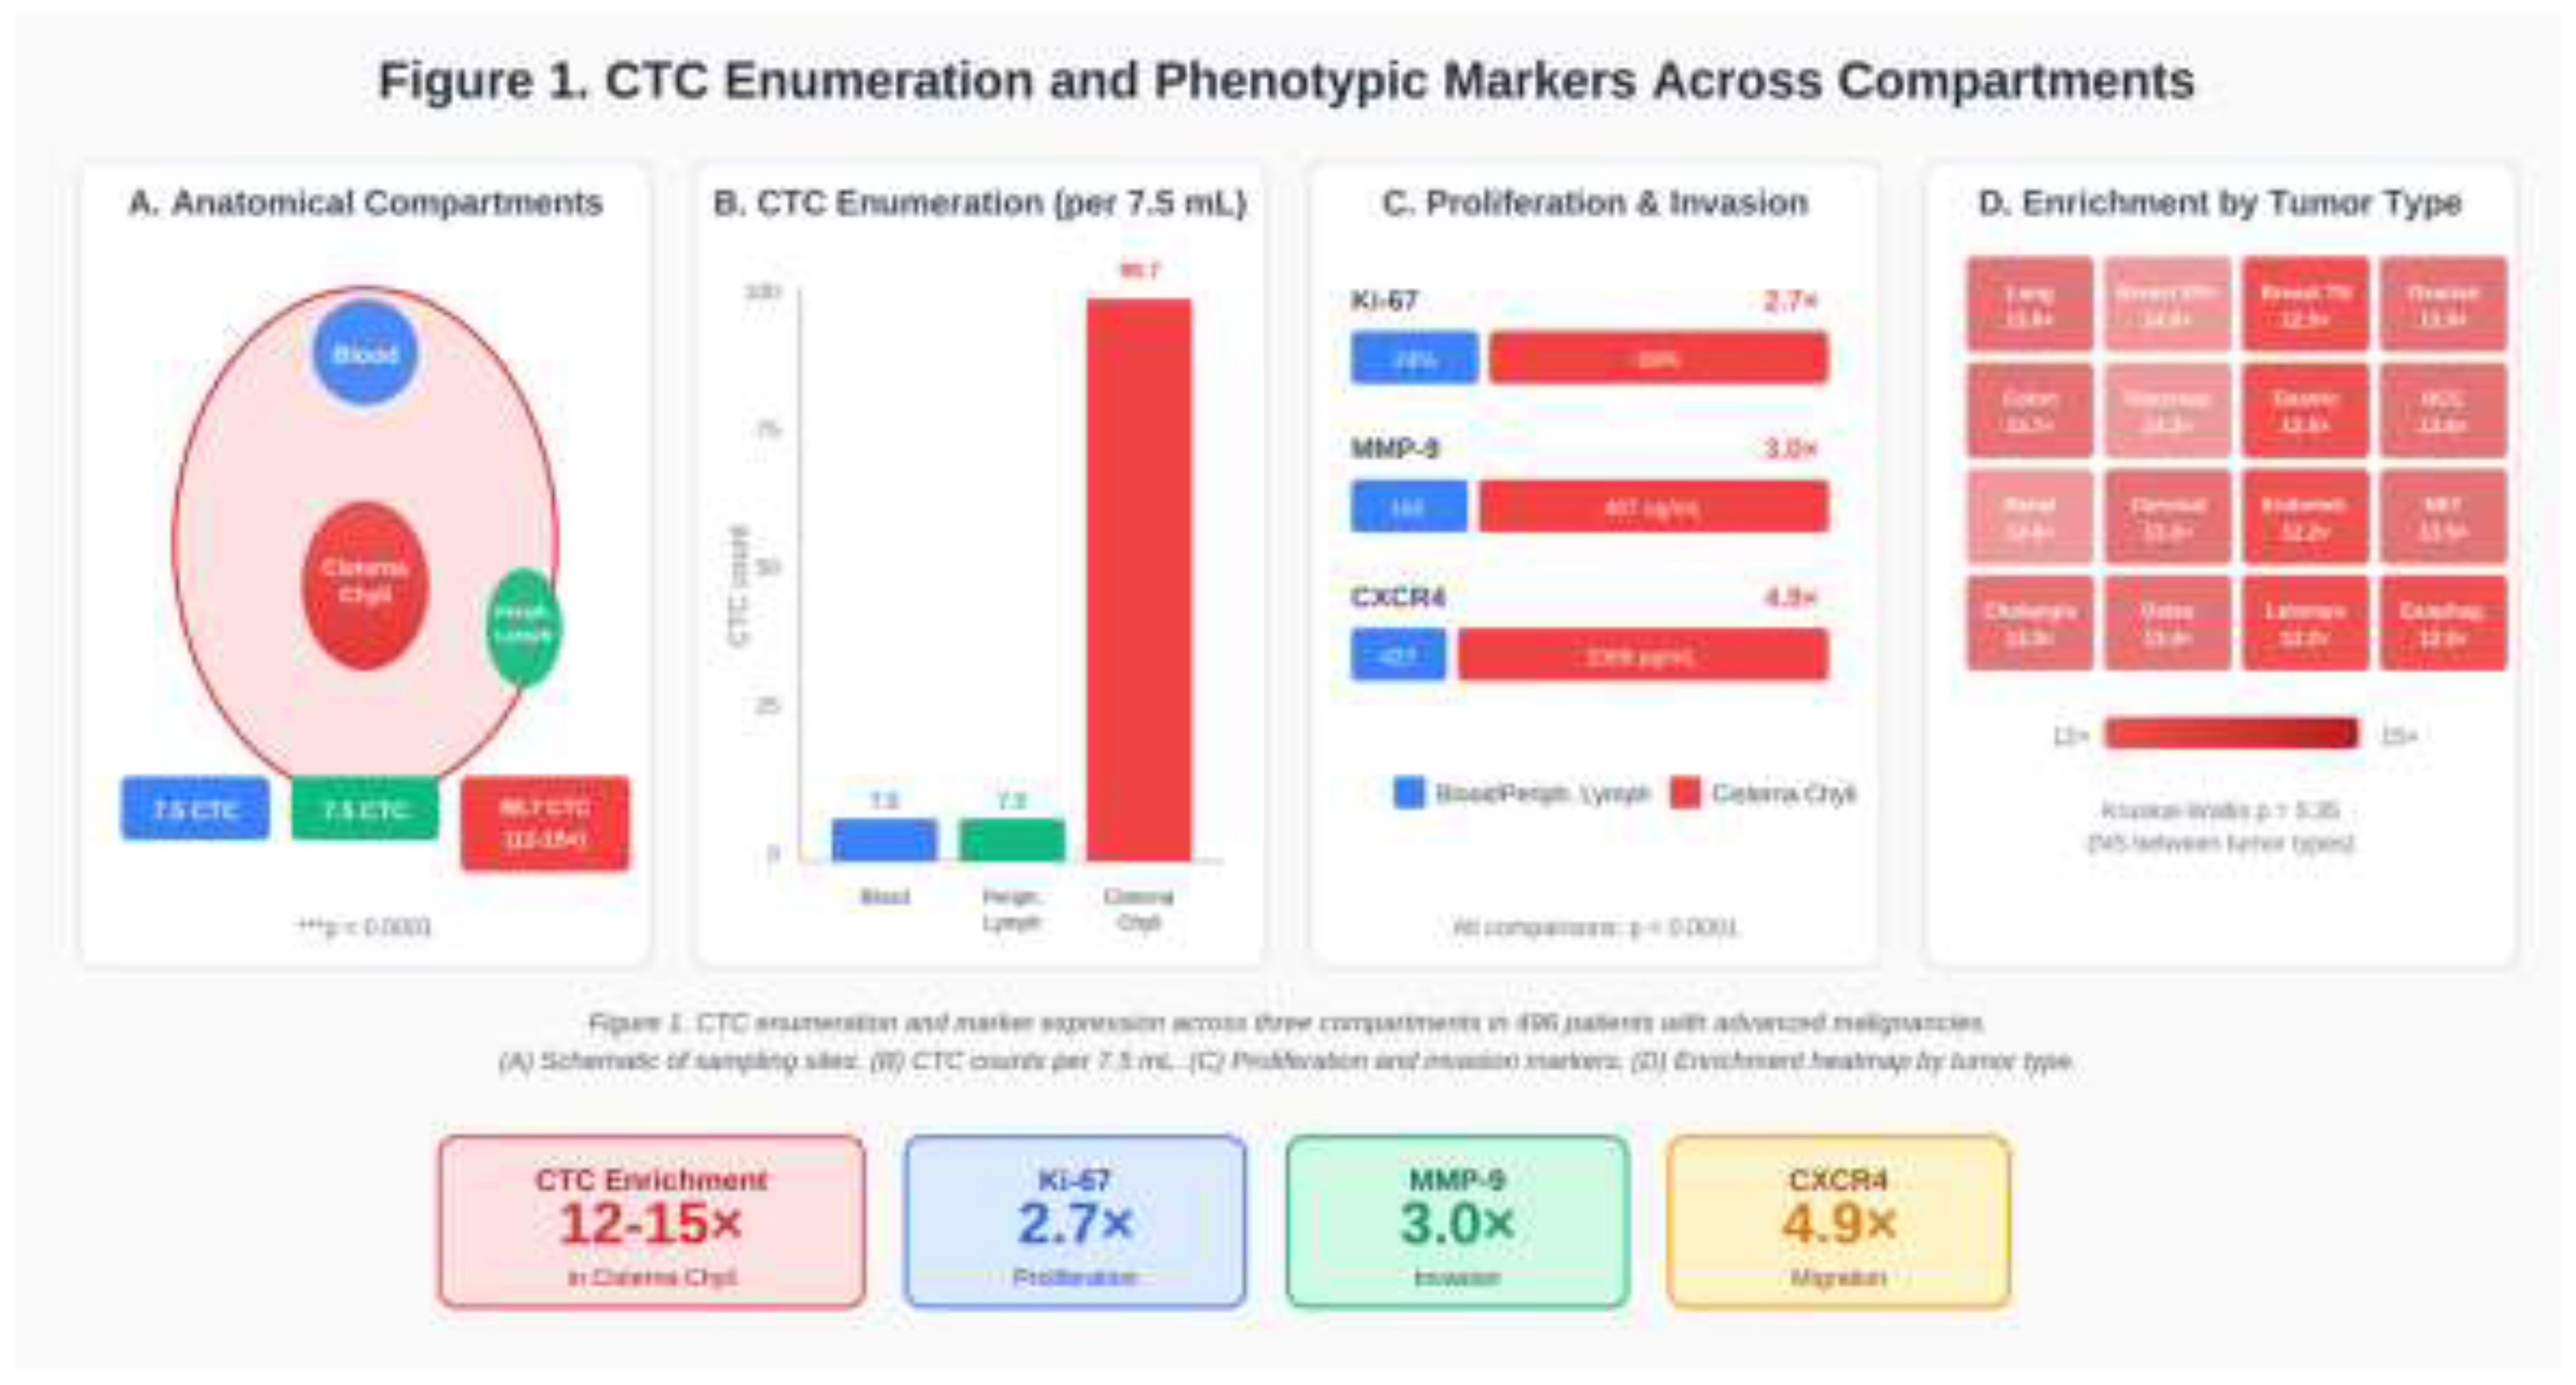
Figure 2.
EMT and stemness marker profiles in cisterna chyli CTCs. (A) EMT marker expression (% positive CTCs) showing ~2.3× enrichment in cisterna chyli. (B) Stemness marker expression showing ~3.3× enrichment in cisterna chyli. (C) Summary of key phenotypic enrichments in cisterna chyli. N = 496.
Figure 2.
EMT and stemness marker profiles in cisterna chyli CTCs. (A) EMT marker expression (% positive CTCs) showing ~2.3× enrichment in cisterna chyli. (B) Stemness marker expression showing ~3.3× enrichment in cisterna chyli. (C) Summary of key phenotypic enrichments in cisterna chyli. N = 496.
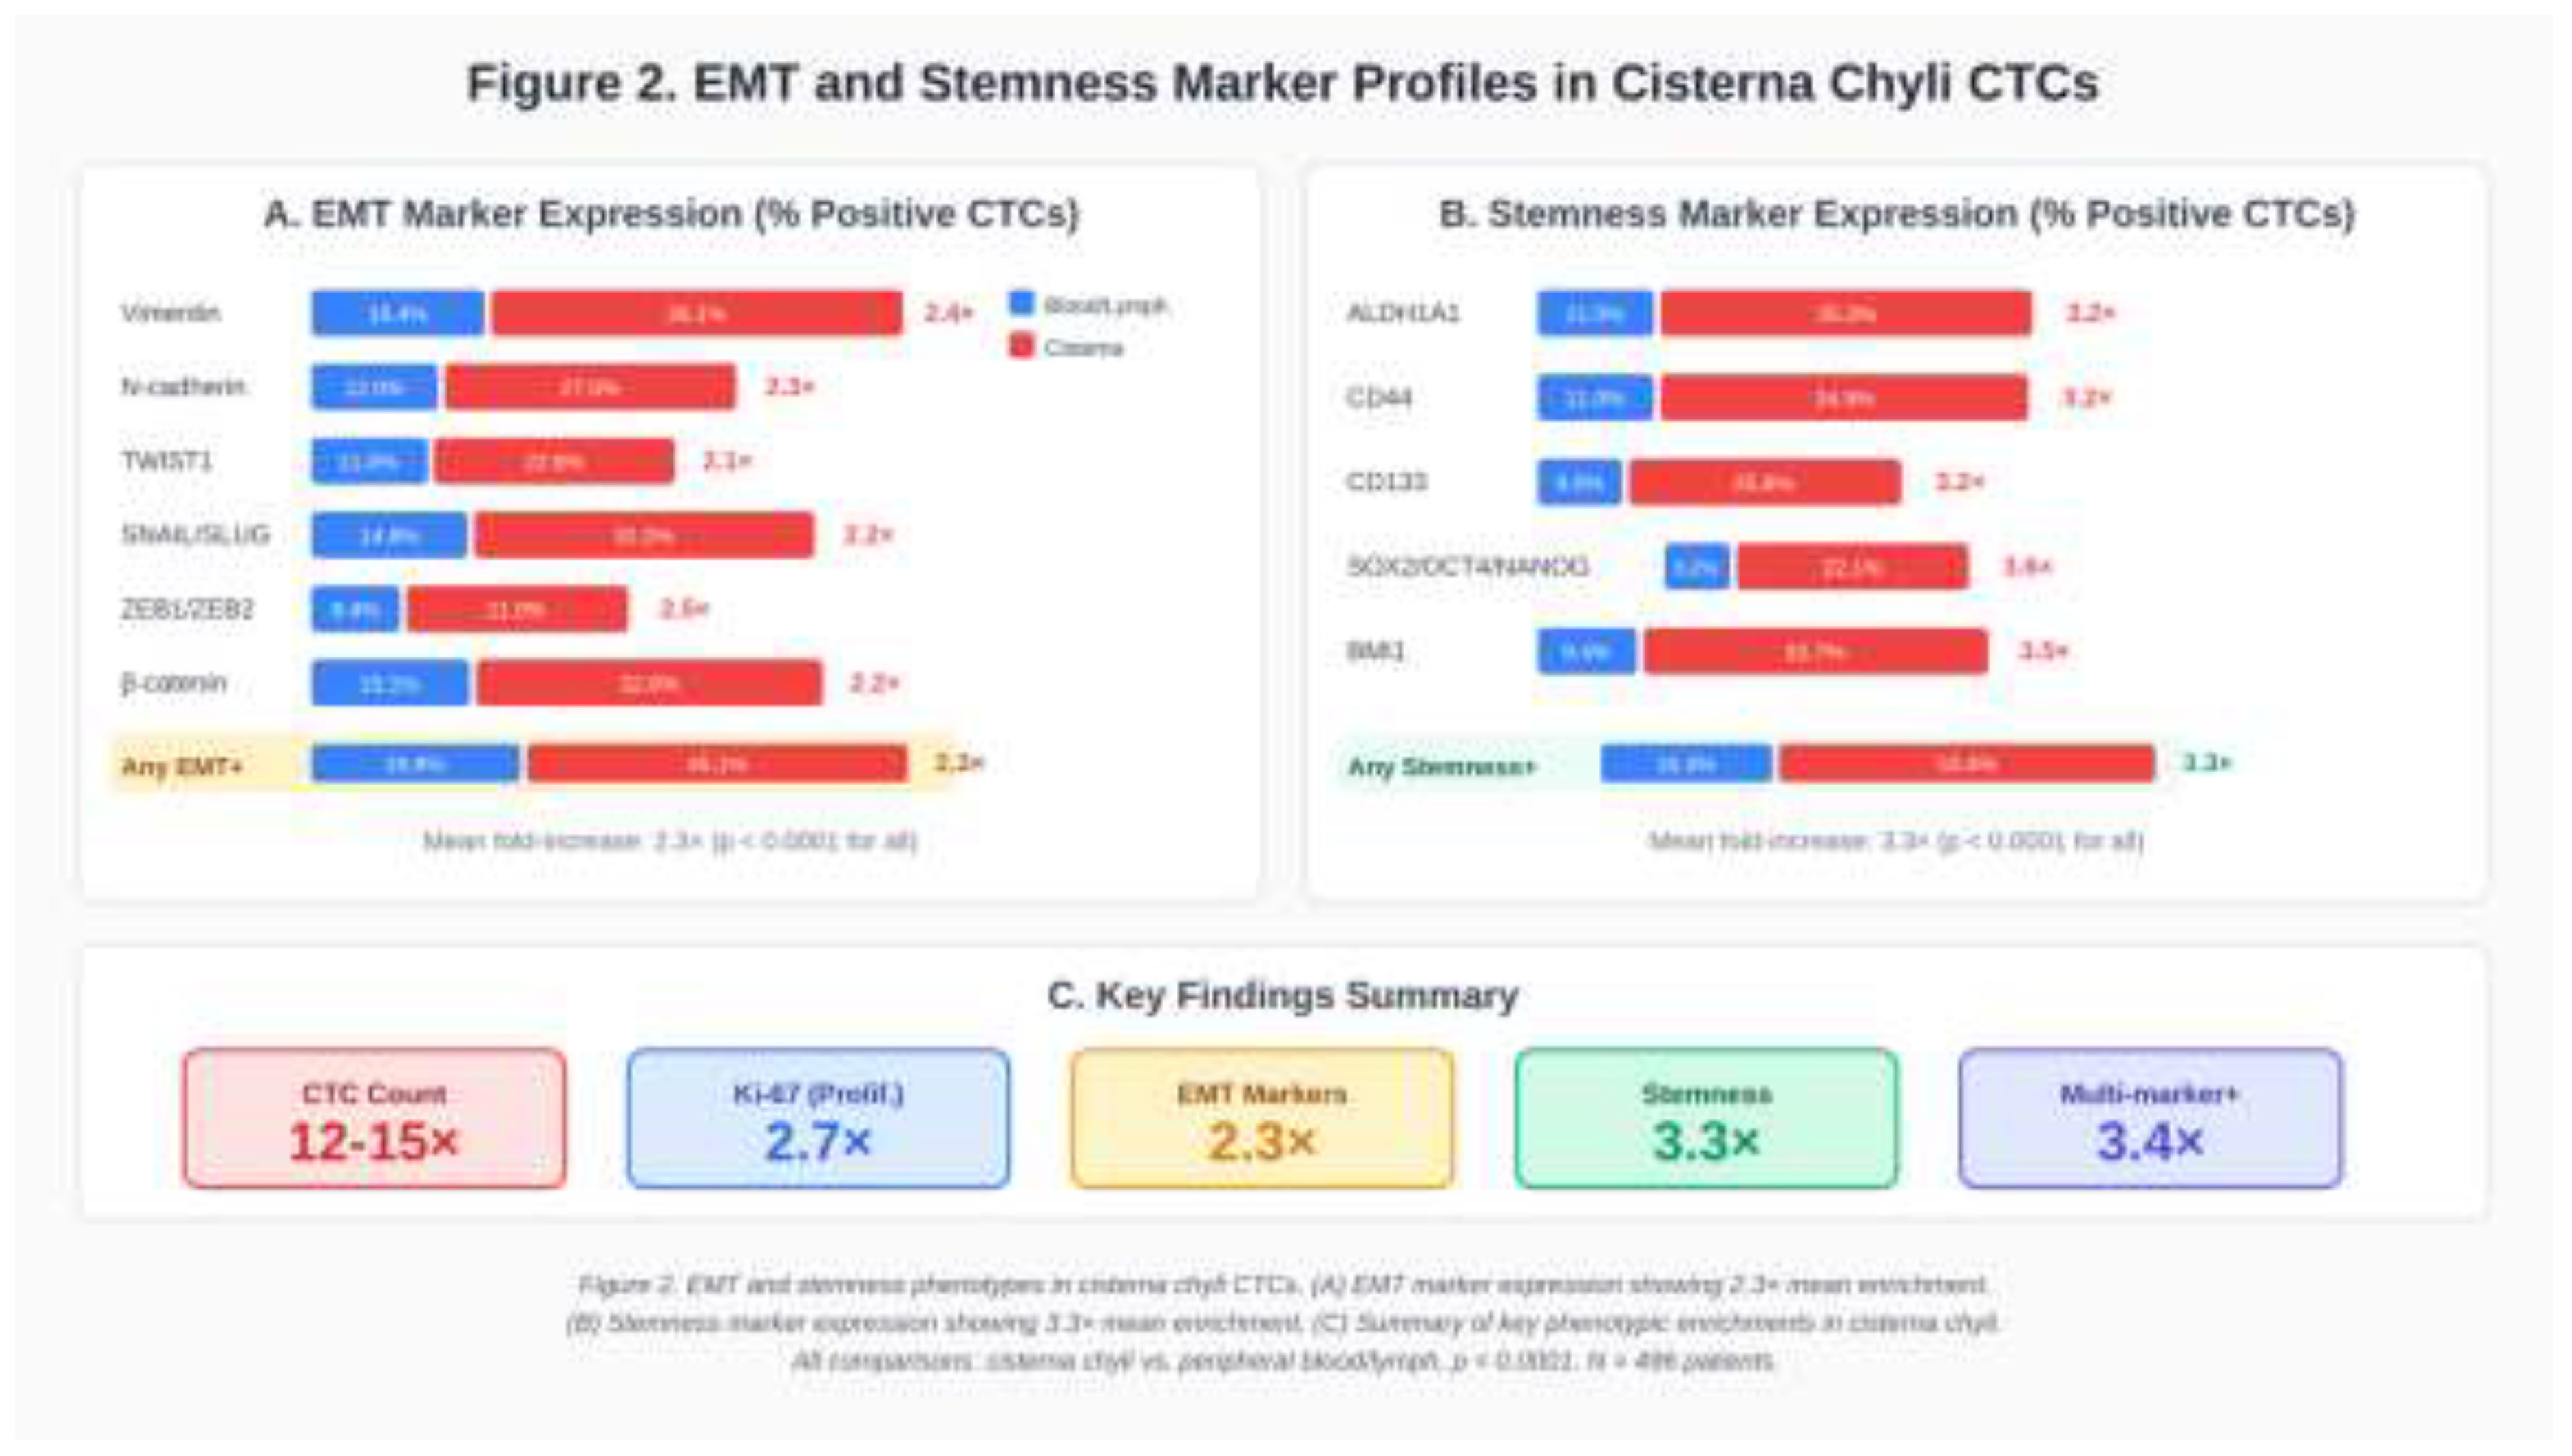
Table 1.
Cohorts and baseline characteristics.
| Characteristic | Cancer cohort | Control cohort |
| Participants (n) | 496 | 118 |
| Cohort description | Stage III–IV solid tumors (21 tumor types); intraoperative sampling | Non-oncological patients requiring surgery after trauma; intraoperative sampling |
| Sampling compartments (volume) | Peripheral blood, peripheral lymph, cisterna chyli (7.5 mL each) | Peripheral blood, peripheral lymph, cisterna chyli (7.5 mL each) |
| Age (years), mean ± SD | 56.0 ± 11.0 | NA |
| Age (years), range | 28–76 | NA |
| Sex, female n (%) | 207 (41.7) | NA |
| Sex, male n (%) | 289 (58.3) | NA |
| ECOG PS 1 n (%) | 248 (50.0) | NA |
| ECOG PS 2 n (%) | 176 (35.5) | NA |
| ECOG PS 3 n (%) | 72 (14.5) | NA |
| Prior systemic therapy, 3 lines n (%) | 320 (64.5) | NA |
| Prior systemic therapy, 4 lines n (%) | 176 (35.5) | NA |
| CTC-positive participants, n (%) | 496 (100.0)* | 23 (19.5) |
| CTC distribution across compartments | Cisterna chyli enriched (12–15× vs blood/lymph) | Comparable across cisterna/lymph/blood (no enrichment reported) |
NA, not available from the current dataset.
Table 2.
Distribution of tumor types in the cancer cohort (N=496).
| Tumor Type | n | % |
| Lung adenocarcinoma | 36 | 7.3 |
| Lung squamous cell carcinoma | 21 | 4.2 |
| Ovarian serous carcinoma | 29 | 5.8 |
| Breast cancer ER/PR+ HER2 - | 55 | 11.1 |
| Breast cancer Triple Negative | 47 | 9.5 |
| Breast cancer ER/PR - HER2+ | 18 | 3.6 |
| Osteosarcoma | 11 | 2.2 |
| Hepatocellular carcinoma | 27 | 5.4 |
| Cholangiocarcinoma | 11 | 2.2 |
| Pancreatic ductal adenocarcinoma | 29 | 5.8 |
| Colon adenocarcinoma | 41 | 8.3 |
| Rectal adenocarcinoma | 19 | 3.8 |
| Cervical squamous cell carcinoma | 17 | 3.4 |
| Endometrial adenocarcinoma | 22 | 4.4 |
| Esophageal squamous cell carcinoma | 7 | 1.4 |
| Esophageal adenocarcinoma | 11 | 2.2 |
| Gastric adenocarcinoma | 19 | 3.8 |
| Gastric signet -ring cell carcinoma | 14 | 2.8 |
| Neuroendocrine tumors | 23 | 4.6 |
| Renal clear cell carcinoma | 24 | 4.8 |
| Leiomyosarcoma | 15 | 3.0 |
Table 4.
Proliferation and invasion/migration markers in CTCs (all tumor types pooled).
| Marker | Blood | Peripheral lymph | Cisterna chyli | Fold |
| Ki-67 (%) | 24.2 ± 4.6 | 23.9 ± 4.7 | 68.9 ± 15.2 | 2.7× |
| MMP-9 (ng/mL) | 162.4 ± 33.8 | 161.7 ± 33.2 | 487.3 ± 102.1 | 3.0× |
| CXCR4 (pg/mL) | 426.8 ± 89.2 | 424.1 ± 88.6 | 2089.4 ± 428.6 | 4.9× |
Table 5.
EMT marker expression in CTCs (all tumor types pooled).
| Marker | Blood | Peripheral lymph | Cisterna chyli | Fold |
| Vimentin (VIM) | 16.4 ± 2.8 | 16.2 ± 2.7 | 39.1 ± 5.0 | 2.4× |
| N-cadherin (CDH2) | 12.0 ± 1.3 | 12.0 ± 2.3 | 27.5 ± 3.3 | 2.3× |
| TWIST1 | 11.0 ± 1.6 | 11.2 ± 2.0 | 22.8 ± 4.5 | 2.1× |
| SNAIL/SLUG | 14.8 ± 2.9 | 14.6 ± 1.8 | 32.2 ± 5.1 | 2.2× |
| ZEB1/ZEB2 | 8.4 ± 0.9 | 8.4 ± 1.5 | 21.0 ± 3.2 | 2.5× |
| β-catenin (nuclear) | 15.1 ± 2.9 | 15.3 ± 2.3 | 32.8 ± 3.4 | 2.2× |
| Any EMT marker+ | 19.8 ± 2.6 | 19.8 ± 2.3 | 45.1 ± 6.1 | 2.3× |
| ≥3 EMT markers | 5.4 ± 0.7 | 5.5 ± 0.8 | 13.5 ± 1.9 | 2.5× |
Table 6.
Stemness marker expression in CTCs (all tumor types pooled).
| Marker | Blood | Peripheral lymph | Cisterna chyli | Fold |
| ALDH1A1 | 11.0 ± 1.6 | 11.1 ± 1.4 | 35.3 ± 3.7 | 3.2× |
| CD44 (high) | 11.0 ± 2.1 | 11.3 ± 1.4 | 34.9 ± 4.4 | 3.2× |
| CD133 | 8.0 ± 1.6 | 7.9 ± 1.5 | 25.8 ± 4.7 | 3.2× |
| SOX2/OCT4/NANOG | 6.2 ± 1.0 | 6.3 ± 1.1 | 22.1 ± 2.3 | 3.6× |
| BMI1 | 9.4 ± 1.5 | 9.4 ± 1.2 | 32.7 ± 3.4 | 3.5× |
| Any stemness marker+ | 16.3 ± 2.2 | 15.9 ± 2.1 | 53.4 ± 9.3 | 3.3× |
| ≥2 stemness markers | 7.7 ± 1.0 | 7.6 ± 1.2 | 26.1 ± 3.6 | 3.4× |
Disclaimer/Publisher’s Note: The statements, opinions and data contained in all publications are solely those of the individual author(s) and contributor(s) and not of MDPI and/or the editor(s). MDPI and/or the editor(s) disclaim responsibility for any injury to people or property resulting from any ideas, methods, instructions or products referred to in the content. |
© 2026 by the authors. Licensee MDPI, Basel, Switzerland. This article is an open access article distributed under the terms and conditions of the Creative Commons Attribution (CC BY) license (http://creativecommons.org/licenses/by/4.0/).
Copyright: This open access article is published under a Creative Commons CC BY 4.0 license, which permit the free download, distribution, and reuse, provided that the author and preprint are cited in any reuse.