
Submitted:
02 February 2026
Posted:
03 February 2026
You are already at the latest version
Abstract
Physical exercise represents a relevant physiological stressor capable of activating the acute-phase response (APR) in horses. However, the relative influence of exercise intensity and duration on the dynamics of acute-phase proteins (APPs) remains incompletely defined. This study compared the effects of short, high-intensity exercise and prolonged, low-intensity exercise on serum amyloid A (SAA), haptoglobin (Hp), and ceruloplasmin (Cp) concentrations in Thoroughbred racehorses. Two groups of clinically healthy horses were evaluated: one group completed a 2,400 m gallop race (n = 12), and the other completed a 40 km endurance race (n = 13). Blood samples were collected before exercise and at multiple time points post-exercise, up to 144 h in endurance horses. Acute-phase proteins were quantified using validated assays, and data were analysed using mixed-effects models. Prolonged endurance exercise induced a significant and time-dependent increase in SAA concentrations, with peak values observed at 96 h post-exercise (p < 0.001), accompanied by a moderate but significant increase in Cp at 72 h (p < 0.05). In contrast, no statistically significant changes in SAA, Hp, or Cp were detected following the gallop race. Haptoglobin concentrations remained relatively stable in both groups. These findings indicate that exercise duration plays a key role in modulating the systemic inflammatory response in horses. Serum amyloid A emerged as the most sensitive biomarker of exercise-induced APR, particularly following prolonged endurance exercise. Monitoring APPs may provide a useful tool for assessing recovery status and supporting evidence-based training management in equine athletes.
Keywords:
exercise physiology
; acute-phase response
; serum amyloid A
; equine
; inflammation
; endurance exercise
; gallop race
1. Introduction
The athletic horse has been selectively bred for centuries to optimize its innate running capabilities, resulting in animals with exceptional anatomical and functional adaptations for high-intensity exercise [1]. While genetically influenced, a horse’s performance is profoundly enhanced through systematic training. This process aims to increase aerobic capacity, muscle mass and vascularization, delay fatigue, and improve biomechanical efficiency and neuromuscular coordination [2,3].
However, strenuous physical exertion activates multiple physiological pathways, some of which can have adverse effects. The primary loci minores resistentiae in equine athletes include the musculoskeletal, respiratory, cardiovascular, and hematopoietic systems. Here, physiological disturbances, transient pathophysiological states, or even pathological dysfunctions often manifest [4,5]. In response to such tissue damage—whether from inflammation, physical trauma, or extreme exertion—horses mount an acute-phase response (APR) [6,7,8,9,10,11,12]. This systemic reaction involves rapid metabolic and physiological changes, providing a non-specific, early defence mechanism until specific adaptive or immune responses are activated. The APR ultimately functions to increase host defence, minimize tissue damage, and accelerate recovery [6,7,13,14,15].
A cornerstone of the APR is the rapid hepatic synthesis and release of acute-phase proteins (APPs), whose plasma concentrations can increase several hundred-fold within hours of an inflammatory stimulus [6,13,16,17,18]. These proteins are classified as positive or negative based on their concentration changes. Their baseline levels show inter-individual, age, and sex-dependent variation, with significant differences also existing between species [7,18,19,20,21,22]. In the horse, serum amyloid A (SAA) and C-reactive protein (CRP) are considered major positive APPs. Other proteins like haptoglobin (Hp) and ceruloplasmin (Cp) also participate, though their increase is typically more moderate and sustained [19,23,24].
SAA, first isolated from equine serum during an APR, is an extremely sensitive marker [25]. Its concentration can rise 4 to 230 times above baseline within 48 hours in conditions ranging from infections and surgery to systemic inflammation [18,22,26,27,28]. Beyond its role as a marker, SAA is functionally involved in chemotaxis, macrophage activation, lipid metabolism, and the regulation of inflammatory processes, including the induction of matrix-degrading enzymes [22,29,30,31]. During the APR, SAA becomes the principal apolipoprotein of high-density lipoprotein (HDL), displacing apoA-I and altering HDL's function from anti-inflammatory to pro-inflammatory, a change critical for cholesterol redistribution to sites of tissue repair [32,33,34,35,36]. SAA can also be synthesized extrahepatically (e.g., inflamed joints), underscoring its local role in inflammation [37,38,39]. Due to its sensitivity and dynamic range, SAA is widely regarded as a valuable non-specific indicator of inflammation and general health status in equine [10,11,25,28,40,41,42,43,44,45,46,47].
Haptoglobin (Hp), with a short half-life of 2-4 days, is a sensitive marker of acute tissue damage [6,19,22,48]. Its synthesis is stimulated by cytokines such us IL-6. Hp's primary function is to bind free haemoglobin released during intravascular haemolysis, thereby exerting antibacterial and antioxidant effects through iron sequestration. It also possesses anti-inflammatory properties, inhibiting prostaglandin synthesis and attenuating the leukocyte respiratory burst [6,19,48].
Ceruloplasmin (Cp) is a copper-transporting glycoprotein and oxidase with a half-life of approximately four days [22,49]. It plays a crucial role in iron metabolism by oxidizing ferrous iron to its ferric form, enabling binding to transferrin. Cp contributes to antioxidant defence by binding copper and heme, and by scavenging reactive oxygen species [22,50]. Its synthesis increases during the APR, though typically later than that of SAA.
Studies monitoring APPs following inflammatory challenges, such as induced arthritis, show that SAA concentrations rise sharply within 16 hours, peak by 36-48 hours, and may take up to 15 days to normalize, while Hp increases more gradually [28]. These findings confirm that a localized insult can elicit a measurable systemic APR.
Despite established knowledge of the APR in disease, the impact of different exercise paradigms on this system in horses requires further elucidation. Exercise is a physiological stressor that can induce muscle microtrauma, haemolysis, and a systemic cytokine response, potentially activating the APR [9,10,11,51,52,53,54]. However, the effects of exercise intensity versus duration on the magnitude and kinetics of key APPs like SAA, Hp, and Cp is not well characterized. Such knowledge is vital for distinguishing physiological adaptation from excessive inflammation associated with overtraining or subclinical pathology.
Therefore, this study aimed to: (1) monitor and compare the post-exercise kinetics of serum amyloid A (SAA), haptoglobin (Hp), and ceruloplasmin (Cp) in Thoroughbred racehorses following two distinct exercise stimuli—a short, high-intensity gallop race (2,400 m) and a long, low-intensity endurance race (40 km); and (2) correlate the intensity and duration of physical activity with the dynamics of these acute-phase reactants. We hypothesized that prolonged endurance exercise would provoke a more pronounced and sustained acute-phase response compared to brief, high-intensity gallop exercise.
2. Materials and Methods
2.1. Ethical Approval
All procedures involving animals were conducted in accordance with the European Union Directive 2010/63/EU and the national legislation on animal welfare for scientific purposes. The study protocol was reviewed and approved by the Ethics Committee of the Faculty of Veterinary Medicine, University of Belgrade (Approval No. 323-07-10294/2021-05). The owners of all horses provided informed consent for participation in the study.
2.2. Animals and Study Design
The study was designed as a prospective, observational cohort investigation conducted during the competition season (May–June 2020). Two groups of clinically healthy, trained male Thoroughbred racehorses were included.
Group I (Gallop): This group consisted of 12 horses, aged 3–5 years (mean ± SD: 4.1 ± 0.8 years), which had successfully completed an official 2,400-meter flat gallop race on a sand track, finishing in 1st, 2nd, or 3rd place. The average race time was 2 minutes 42 seconds ± 5 seconds.
Group II (Endurance): This group comprised 13 horses, aged 3–8 years (mean ± SD: 6.2 ± 1.5 years), which completed an official 40-km endurance race in accordance with International Equestrian Federation (FEI) regulations. The average ride time was 2 hours 15 minutes ± 18 minutes, and all horses passed the mandatory veterinary checks at the finish line.
All horses underwent a standard clinical examination before inclusion to confirm the absence of fever, lameness, or systemic illness. Their routine training and nutritional regimens were maintained throughout the study period.
2.3. Experimental Procedures and Sample Collection
Blood samples were collected via jugular venipuncture using sterile vacuum tubes without anticoagulant (Vacuette® Serum Clot Activator, Greiner Bio-One).
For Group I (Gallop), sampling was performed at three time points:
- o
- T0: 24 hours before the race.
- o
- T1: 72 hours post-race.
- o
- T2: 96 hours post-race.
For Group II (Endurance), sampling was performed at seven time points:
- o
- T0: 24 hours before the race.
- o
- T1: Immediately after finishing the race (<10 min post-completion).
- o
- T2: 48 hours post-race.
- o
- T3: 72 hours post-race.
- o
- T4: 96 hours post-race.
- o
- T5: 120 hours post-race.
- o
- T6: 144 hours post-race.
Samples were allowed to clot at room temperature for 30 minutes and then centrifuged at 3,000 × g for 10 minutes. The collected serum was aliquoted and stored at –80 °C until analysis to prevent protein degradation.
2.4. Biochemical Analyses
Analyses were performed in a single batch for each analyte to minimize inter-assay variation.
Serum Amyloid A (SAA): Concentration was determined using a commercially available, equine-specific sandwich ELISA kit (Tridelta Phase™ Range SAA EIA Kit, Tridelta Development Ltd., Wicklow, Ireland; Catalog #TP-802). The assay was performed strictly according to the manufacturer’s instructions. The absorbance was read at 450 nm (with a 630 nm reference) using a microplate reader (Mod. A1, Nubenco Enterprises). The reported detection range of the kit is 0.5–200 µg/mL, with intra- and inter-assay coefficients of variation (CV) of <8%. Results are expressed in mg/L.
Haptoglobin (Hp): Concentration was determined using a commercially available, equine-specific colorimetric assay (Tridelta Phase™ Haptoglobin Assay, Tridelta Development Ltd.; Catalog #TP-801) based on the preservation of peroxidase activity of the haemoglobin-haptoglobin complex. The procedure followed the manufacturer's protocol. Absorbance was read at 630 nm. The assay’s detection range is 0.05–2.5 mg/mL, with intra- and inter-assay CVs of <7%. Results are expressed in mg/mL.
Ceruloplasmin (Cp): Ferroxidase activity, proportional to Cp concentration, was measured spectrophotometrically using p-phenylenediamine dihydrochloride as the substrate, according to the method of Sunderman and Nomoto [55]. Briefly, serum was incubated with acetate buffer (pH 5.5) and substrate. The rate of formation of the purple oxidation product was measured by the increase in absorbance at 530 nm over 30 minutes at 37 °C using a Cecil CE 2021 UV/VIS spectrophotometer. Cp concentration was calculated using a molar extinction coefficient and expressed in mg/L. The intra-assay CV for this method in our laboratory was <5%.
2.5. Statistical Analysis
Data were tested for normality using the Shapiro-Wilk test and are presented as mean ± standard deviation (SD). Because some APP data were not normally distributed and the study employed a repeated-measures design, statistical analysis was performed using mixed-effects models followed by Dunnett’s post-hoc test for comparisons against the respective pre-exercise baseline (T0) within each group. The factors in the model included Time (fixed effect) and Horse ID (random effect).
To compare the APP response between the two exercise types at comparable post-exercise time points (72h and 96h), an unpaired Student’s t-test or Mann-Whitney U test was applied based on data distribution. The relationship between APP concentrations at peak response time was assessed using Pearson’s or Spearman’s correlation coefficient (r).
Graphical presentation and statistical analysis were performed using GraphPad Prism software (Version 9.0 for Windows, GraphPad Software, San Diego, CA, USA). A two-tailed p-value of < 0.05 was considered statistically significant.
3. Results
3.1. Serum Amyloid A (SAA)
The concentrations of SAA in the blood serum of horses subjected to the two different exercise regimens are summarized in Table 1 and visualized in Figure 1 and Figure 2.
In Group I (Gallop), SAA concentrations showed a non-significant increasing trend from a pre-exercise mean of 12.1 ± 28.5 mg/L to 78.4 ± 82.3 mg/L at 72h post-exercise (p = 0.067), followed by a slight decline to 65.8 ± 75.1 mg/L at 96h (p = 0.112). This variability did not reach statistical significance compared to baseline (Figure 1A). In contrast, Group II (Endurance) exhibited a significant and time-dependent increase in SAA (Figure 1B). Concentrations rose from a pre-exercise baseline of 8.7 ± 6.2 mg/L, reaching statistical significance at 72h post-exercise (86.5 ± 45.7 mg/L, p < 0.01). The peak response occurred at 96h post-exercise (132.4 ± 67.2 mg/L, p < 0.001). Concentrations subsequently declined, returning to levels not statistically different from baseline by 144h (15.2 ± 10.5 mg/L, p = 0.210). Post-hoc analysis revealed that the SAA concentration at 96h was significantly higher than at all earlier time points (48h: p < 0.01; Immediate post: p < 0.001) and later time points (120h: p < 0.01; 144h: p < 0.05).
A direct comparison of the two exercise modalities at the 72h and 96h time points is shown in Figure 2. While mean SAA concentrations were consistently higher in the Endurance group, a statistically significant between-group difference was confirmed only at the 96h time point (Gallop: 65.8 ± 75.1 mg/L vs. Endurance: 132.4 ± 67.2 mg/L; p = 0.022).
3.2. Ceruloplasmin (Cp)
The concentrations of ceruloplasmin are detailed in Table 2.
For Group I (Gallop), Cp concentrations remained stable throughout the observation period (Figure 3A), with no significant differences between pre-exercise levels (285.4 ± 45.2 mg/L) and the 72h or 96h post-exercise measurements (p > 0.05).
In Group II (Endurance), Cp concentrations demonstrated a gradual rise post-exercise, achieving a peak at 72h (330.5 ± 50.8 mg/L) (Figure 3B). This increase was statistically significant compared to the pre-exercise value (270.8 ± 38.6 mg/L; p < 0.05). Although concentrations began to decline thereafter, they remained elevated above baseline through the 144h time point without regaining statistical significance (p > 0.05).
3.3. Haptoglobin (Hp)
The concentrations of haptoglobin are presented in Table 3.
In Group I (Gallop), Hp concentrations displayed a slight, non-significant decreasing tendency (Figure 4A) from a pre-exercise mean of 1.85 ± 0.62 mg/mL to 1.57 ± 0.54 mg/mL at 96h post-exercise (p > 0.05).
In Group II (Endurance), Hp concentrations varied after exercise, showing a trend of increase that peaked at 72h (2.15 ± 0.71 mg/mL) (Figure 4B). However, this and all other post-exercise values did not differ significantly from the pre-exercise baseline concentration of 1.78 ± 0.51 mg/mL (p > 0.05 for all time points).
3.4. Correlation Analysis
No statistically significant correlations were found between the peak concentrations (at 72h or 96h) of SAA, Cp, and Hp within either the Gallop or Endurance groups (all |r| < 0.45, p > 0.05).
4. Discussion
4.1. Overview of Main Findings
This study evaluated the acute-phase protein response in Thoroughbred racehorses subjected to two distinct exercise paradigms differing in intensity and duration. The main finding is that prolonged, low-intensity endurance exercise elicited a measurable systemic acute-phase response, whereas short, high-intensity gallop exercise did not induce statistically significant changes in the analysed APPs. Among the investigated biomarkers, serum amyloid A showed the greatest sensitivity to exercise-related stress, followed by ceruloplasmin, while haptoglobin remained largely unchanged.
4.2. Serum Amyloid A Response to Exercise
The marked increase in SAA concentrations observed after the endurance race confirms its role as a major and highly sensitive acute-phase protein in horses [18,21,25]. The delayed peak at 72–96 h post-exercise differs from the rapid SAA elevation typically reported in infectious or surgical conditions [28,40], suggesting that prolonged physical exertion triggers a distinct inflammatory profile characterized by cumulative metabolic and mechanical stress rather than acute tissue injury.
In contrast, the absence of a statistically significant SAA response following gallop exercise indicates that short-duration, high-intensity activity may primarily induce localized muscle stress insufficient to activate a systemic hepatic APR [51,52,53,54]. The high inter-individual variability observed in galloping horses likely reflects differences in training status, recovery capacity, and possible subclinical inflammatory conditions, emphasizing the importance of individual baseline monitoring.
4.3. Ceruloplasmin Dynamics and Oxidative Stress
Ceruloplasmin concentrations increased significantly 72 h after the endurance race, consistent with its classification as a moderate and later-rising acute-phase protein [65,85]. This kinetic profile supports a role for Cp in the secondary phase of the inflammatory response, particularly in relation to oxidative stress regulation and iron metabolism [22,49]. Prolonged exercise may enhance the production of reactive oxygen species and promote subtle haemolysis, thereby stimulating Cp synthesis to support antioxidant defence and limit iron-mediated oxidative damage [35,50,56].
The lack of Cp response after gallop exercise further reinforces the concept that exercise duration, rather than peak intensity, is the primary determinant of systemic inflammatory activation.
4.4. Haptoglobin Response and Haemolysis
Haptoglobin concentrations did not show significant changes following either exercise modality. This finding is consistent with previous reports describing a limited or delayed Hp response in horses subjected to physical exertion [1,9,57]. The slight, non-significant decrease observed after gallop exercise may be attributable to exercise-induced intravascular haemolysis, a well-recognized phenomenon in high-speed work, leading to transient Hp consumption [58].
Overall, the limited Hp response suggests that the exercise-induced inflammatory stimulus in the present study was moderate and subclinical, sufficient to activate highly sensitive APPs such as SAA but not strong enough to induce a marked Hp increase.
4.5. Integrated Interpretation and Practical Implications
The differential kinetics of the evaluated APPs highlight the complexity of the equine acute-phase response to exercise. Serum amyloid A appears to be the most responsive indicator of cumulative physiological stress, while ceruloplasmin may reflect secondary antioxidant and metabolic adaptations. These findings underline the value of using a panel of APPs to obtain a broader overview of exercise-induced systemic responses.
From a practical perspective, monitoring SAA concentrations in the days following prolonged exercise may help veterinarians and trainers assess recovery status and identify horses at risk of inadequate recovery or overtraining. Establishing individual baseline values remains essential, given the considerable inter-individual variability observed.
4.6. Study Limitations
The present study has several limitations. The relatively small sample size may have limited the detection of subtle effects, particularly for haptoglobin. The absence of early post-exercise sampling in the gallop group restricts direct comparison of initial APP kinetics between exercise types. Additionally, the lack of cytokine or oxidative stress marker measurements limits mechanistic interpretation. Future studies integrating APPs with inflammatory and metabolic biomarkers would further clarify the pathways linking exercise and systemic inflammation.
5. Conclusions
In conclusion, prolonged endurance exercise induces a measurable and time-dependent acute-phase response in horses, whereas short, high-intensity gallop exercise does not elicit a comparable systemic reaction. Exercise duration appears to be a key determinant of inflammatory activation. Serum amyloid A represents a sensitive and practical biomarker for monitoring exercise-induced stress and recovery in equine athletes, supporting its potential application in evidence-based training and welfare management.
Author Contributions
Conceptualization, B.D., O.G., and V.C.; methodology, C.S., B.D., O.G.; software, C.S., B.D., O.G.; validation, F.L. and V.C.; formal analysis, F.L. and V.C.; investigation, B.D., O.G.; data curation, F.L. and V.C.; writing—original draft preparation, C.S., B.D., O.G.; writing—review and editing, Y.L., F.L., and V.C.; visualization, F.L. and V.C.; supervision, Y.L. All authors have read and agreed to the published version of the manuscript.
Funding
This research received no external funding.
Institutional Review Board Statement
The study was conducted in accordance with the Declaration of Helsinki and approved by the Ethics Committee of the Faculty of Veterinary Medicine, University of Belgrade (Approval No. 323-07-10294/2021-05).
Informed Consent Statement
Informed consent was obtained from owners of all horses for participation in the study.
Data Availability Statement
All data generated or analysed during this study are included in this published article. The datasets used and/or analysed in this study are available from the corresponding author upon reasonable request.
Acknowledgments
“In Memory of Dr. Jović Slavoljub and Dr. Jelka Stevanović, Department of Physiology and Biochemistry, Faculty of Veterinary Medicine, University of Belgrade, Serbia.”
Conflicts of Interest
The authors declare no conflicts of interest.
Abbreviations
The following abbreviations are used in this manuscript:
| APR | Acute-Phase Response |
| APPs | Acute-Phase Proteins |
| SAA | Serum Amyloid A |
| CRP | C-Reactive Protein |
| Hp | Haptoglobin |
| Cp | Ceruloplasmin |
| HDL | High-Density Lipoprotein |
| FEI | International Equestrian Federation |
| CV | Coefficients of Variation |
| SD | Standard Deviation |
References
- Pollock, P.J.; Prendergast, M.; Schumacher, J.; Bellenger, C.R. Effects of surgery on the acute phase response in clinically normal and diseased horses. Vet Rec 2005, 156, 538–542. [Google Scholar] [CrossRef] [PubMed]
- Cray, C.; Zaias, J.; Altman, N. Acute phase response in animals: A Review. Comp Med 2009, 59, 517–526. [Google Scholar]
- Cywinska, A.; Szarska, E.; Gorecka, R.; Witkowski, L.; Hecold, M.; Bereznowski, A.; Schollenberger, A.; Winnicka, A. Acute phase protein concentrations after limited distance and long-distance endurance rides in horses. Res Vet Sci 2012, 93, 1402–1406. [Google Scholar] [CrossRef]
- Cywinska, A.; Turlo, A.; Witkowski, L.; Szarska, E.; Winnicka, A. Changes in blood cytokine concentrations in horses after long-distance endurance rides. Med Wet 2014, 70, 568–571. [Google Scholar]
- De Siqueira, R.F.; Fernandes, W.R. Post-ride inflammatory markers in endurance horses. Cienc Rural 2016, 46, 1256–1261. [Google Scholar] [CrossRef]
- Turlo, A.; Cywinska, A.; Czopowicz, M.; Witkowski, L.; Jaskiewicz, A.; Winnicka, A. Racing induces changes in the blood concentration of serum amyloid A in Thoroughbred racehorses. J Equine Vet Sci 2016, 36, 15–18. [Google Scholar] [CrossRef]
- Witkowska-Pilaszewicz, O.; Baska, P.; Czopowicz, M.; Zmigrodzka, M.; Szarska, E.; Szczepaniak, J.; Nowak, Z.; Winnicka, A.; Cywinska, A. Anti-inflammatory state in Arabian horses introduced to the endurance training. Animals 2019, 9, 616. [Google Scholar] [CrossRef]
- Witkowska-Piłaszewicz, O.; Bąska, P.; Czopowicz, M.; Żmigrodzka, M.; Szczepaniak, J.; Szarska, E.; Winnicka, A.; Cywińska, A. Changes in Serum Amyloid A (SAA) Concentration in Arabian Endurance Horses During First Training Season. Animals 2019, 9, 330. [Google Scholar] [CrossRef]
- Arfuso, F.; Giannetto, C.; Fazio, F.; Panzera, F.; Piccione, G. Training program intensity induces an acute phase response in clinically healthy horses. J Equine Vet Sci 2020, 88, 102986. [Google Scholar] [CrossRef] [PubMed]
- Eckersall, P.D. Recent advances and future prospects for the use of acute phase proteins as markers of disease in animals. Rev Med Vet 2000, 151, 577–584. [Google Scholar]
- Di Filippo, P.A.; Martins, L.P.; Meireles, M.A.D.; Quirino, C.R.; da Silva Nogueira, A.F.; Bogossian, P.M. Influence of marcha exercise on the serum concentrations of acute-phase proteins in Mangalarga Marchador horses. J Equine Vet Sci 2018, 63, 65–68. [Google Scholar] [CrossRef]
- Pepys, M.; Baltz, M.L. Acute phase proteins with special reference to C-reactive protein and related proteins (Pentraxins) and serum amyloid A protein. Adv Immunol 1983, 34, 141–212. [Google Scholar] [CrossRef]
- Miglio, A.; Morelli, C.; Maresca, C.; Felici, A.; Di Gianbattista, A.; Antognoni, M.T. Serum protein concentrations and protein fractions in clinically healthy Italian Heavy Draft Horses using agarose gel electrophoresis. Vet Clin Pathol 2019, 48, 677–682. [Google Scholar] [CrossRef]
- Witkowska-Pilaszewicz, O.; Zmigrodzka, M.; Winnicka, A.; Strzelec, K.; Cywinska, A. Serum amyloid A in equine health and disease. Equine Vet J 2019, 51, 293–298. [Google Scholar] [CrossRef] [PubMed]
- Clark, G.R.; Fraser, C.G. Biological variation of acute phase proteins. Ann Clin Biochem 1993, 30, 373–376. [Google Scholar] [CrossRef]
- Sufferdini, A.F.; Fantuzzi, G.; Badalato, R.; Oppenheim, J.J.; O΄Grady, N. New insight into the biological of the acute phase response. J Clin Immunol 1999, 19, 203–214. [Google Scholar] [CrossRef]
- Rajendren, S.K.; Khairuddin, N.H.; Sugnaseelan, S. Concentration of serum amyloid a in clinically normal endurance horses in Malaysia. J Vet Malaysia 2019, 31, 28–33. [Google Scholar] [CrossRef]
- Petersen, H.H.; Nielsen, J.P.; Heegaard, P.M.H. Application of acute phase protein measurements in veterinary clinical chemistry. Vet Res 2004, 35, 163–168. [Google Scholar] [CrossRef] [PubMed]
- Eckersall, P.D.; Bell, R. Acute phase proteins: Biomarkers of infection and inflammationin veterinary medicine. Vet J 2010, 185, 23–27. [Google Scholar] [CrossRef]
- Cray, C. Acute phase proteins in animals. Prog Mol Biol Transl Sci 2012, 105, 113–150. [Google Scholar] [CrossRef]
- Nunokawa, Y.; Fujinaga, T.; Taira, T.; Okamura, M.; Yamashita, K.; Tsunoda, N.; Hagio, M. Evaluation of serum amyloid A protein as an acute-phase reactive protein in horses. J Vet Med Sci 1993, 55, 1011–1016. [Google Scholar] [CrossRef]
- Horohov, D.W.; Dimock, A.N.; Guirnalda, P.D.; Folsom, R.W.; McKeever, K.H.; Malinowski, K. Effect of exercise on the immune response of young and old horses. Am J Vet Res 1999, 60, 643–647. [Google Scholar] [CrossRef]
- Hulten, C.; Gronlund, U.; Hirvonen, J.; Tulamo, R.M.; Suominen, M.M.; Marhaug, G.; Forsberg, M. Dynamics in serum of the inflammatory markers serum amyloid A (SAA), haptoglobin, fibrinogen and alpha2-globulins during induced noninfectiious arthritis in the horses. Equine Vet J 2002, 34, (7):699–704. [Google Scholar] [CrossRef] [PubMed]
- Long, A.; Nolen-Walston, R. Equine inflammatory markers in the twenty-first century: A focus on serum amyloid A. Vet Clin North Am Equine Pract 2020, 36, 147–160. [Google Scholar] [CrossRef]
- Badolato, R.; Wang, J.M.; Murphy, W.J.; Lloyd, A.R.; Michiel, D.F.; Bausserman, L.L.; Kelvin, D.J.; Oppenheim, J.J. Serum amyloid A is a chemoattractant: induction of migration, adhesion, and tissue infiltration of monocytes and polymorphonuclear leukocytes. J Exp Med 1994, 180, 203–209. [Google Scholar] [CrossRef]
- Uhlar, C.M.; Whitehead, A.S. Serum amyloid A, the major vertebrate acute-phase reactant. Eur J Biochem 1999, 265, 501–523. [Google Scholar] [CrossRef]
- Upragarin, N.; Landman, W.J.; Gaastra, W.; Gruys, A. Extraxepatic production of acute phase serum amyloid A. Histol Histopathol 2005, 20, 1295–1307. [Google Scholar] [CrossRef]
- Manley, P.N.; Ancsin, J.B.; Kisilevsky, R. Rapid recycling of cholesterol: the joint biologic role of C-reactive protein and serum amyloid A. Med Hypotheses 2006, 66, 784–792. [Google Scholar] [CrossRef] [PubMed]
- Vallon, R.; Freuler, F.; Desta-Tsedu, N.; Robeva, A.; Dawson, J.; Wanner, P.; Engelhardt, P.; Boes, L.; Schnyder, J.; Tschopp, C.; Urfer, R.; Baumann, G. Serum amyloid A (apoSAA) expresssion is up-regulated in rheumatoid arthritis and induces transcriptions of matrix metalloproteinases. J Immunol 2001, 166, 2801–2807. [Google Scholar] [CrossRef] [PubMed]
- O'Hara, R.; Murphy, E.P.; Whitehead, A.S.; FitzGerald, O.; Bresnihan, B. Local expression of the serum amyloid A and formyl peptide receptor-like 1 genes in synovial tissue is associated with matrix metalloproteinase production in patients with inflammatory arthritis. Arthritis Rheum 2004, 50, 1788–1799. [Google Scholar] [CrossRef]
- Malle, E.; Bollman, A.; Steinmetz, A.; Gemsa, D.; Leis, H.J.; Sattler, W. Serum amyloid A (SAA) protein enchances formation of cyclooxigenase metabolites of activated human monocytes. FEBS Lett 1997, 419, 215–219. [Google Scholar] [CrossRef] [PubMed]
- Van Lenten, B.J.; Hama, S.Y.; de Beer, F.C.; Stafforini, D.M.; McIntyre, T.M.; Prescott, S.M.; LaDu, B.N.; Fogelman, A.M.; Navab, M. Anti-inflammatory HDL becomes pro-inflammatory during the acute phase response: loss of protective effect of HDL against LDL oxidation in aortic wall cell cocultures. J Clin Invest 1995, 96, 2758–2767. [Google Scholar] [CrossRef]
- Uhlar, C.M.; Burgess, C.J.; Sharp, P.M.; Whitehead, A.S. Evolution of the serum amyloid A (SAA) protein superfamily. Genomics 1994, 19, 228–235. [Google Scholar] [CrossRef]
- Artl, A.; Marsche, G.; Lestavel, S.; Sattler, W.; Malle, E. Role of serum amyloid A during metabolism of acute-phase HDL by macrophages. Arterioscler Thromb Vasc Biol 2000, 20, 763–772. [Google Scholar] [CrossRef]
- Van Lenten, B.J.; Navab, M.; Shih, D.; Fogelman, A.M.; Lusis, A.J. The role of high-density lipoproteins in oxidation and inflammation. Trends Cardiovasc Med 2001, 11, 155–161. [Google Scholar] [CrossRef]
- Cabana, V.G.; Reardon, C.A.; Feng, N.; Neath, S.; Lukens, J.; Getz, GS. Serum paraoxonase: effect of the apolipoprotein composition of HDL and the acute phase response. J Lipid Res 2003, 44, 780–792. [Google Scholar] [CrossRef] [PubMed]
- Jacobsen, S.; Jensen, J.C.; Frei, S.; Jensen, A.L.; Thoefner, M.B. Use of serum amyloid A and other acute phase reactants to monitor the inflammatory response after castration in horses: a field study. Equine Vet J 2005, 37, 552–556. [Google Scholar] [CrossRef] [PubMed]
- Jacobsen, S.; Niewold, T.A.; Halling-Thomsen, M.; Nanni, S.; Olsen, E.; Lindegaard, C.; Haubro Andersden, P. Serum amyloid A isoforms in serum and synovial fluid in horses with lipopolysaccharide-induced arthritis. Vet Imunnol Immunopathol 2006, 110, 325–330. [Google Scholar] [CrossRef]
- Pepys, M.B.; Baltz, M.L.; Tennent, G.A.; Kent, J.; Ousey, J.; Rossdale, P.D. Serum amyloid A protein (SAA) in horses: objective measurement of acute phase response. Equine Vet J 1989, 21, 106–109. [Google Scholar] [CrossRef]
- Hulten, C.; Tulamo, R.M.; Suominen, M.M.; Burvall, K.; Marhaug, G.; Forsberg, M. A non-competitive chemiluminescence enzyme immunoassay for the equine acute phase protein serum amyloid A (SAA) - a clinically useful inflammatory marker in the horse. Vet Imunol Immunopathol 1999, 68, 267–281. [Google Scholar] [CrossRef]
- Cywinska, A.; Gorecka, R.; Szarska, E.; Witkowski, L.; Dziekan, P. Schollenberger A: Serum amyloid A level as a potential indicator of the status of endurance horses. Equine Vet J Suppl 2010, 42, 23–27. [Google Scholar] [CrossRef]
- Viner, M.; Mazan, M.; Bedenice, D.; Mapes, S.; Pusterla, N. Comparison of serum amyloid A in horses with infectious and noninfectious respiratory diseases. J Equine Vet Sci 2017, 49, 11–13. [Google Scholar] [CrossRef]
- Omidi, A.; Vakili, S.; Nazifi, S.; Parker, M.O. Acute-phase proteins, oxidative stress, and antioxidant defense in crib-biting horses. J Vet Behav 2017, 20, 31–36. [Google Scholar] [CrossRef]
- Wright, M.E.; Croser, E.L.; Raidal, S.; Baral, R.M.; Robinson, W.; Lievaart, J.; Freeman, K.P. Biological variation of routine haematology and biochemistry measurands in the horse. Equine Vet J 2019, 51, 384–390. [Google Scholar] [CrossRef] [PubMed]
- Jacobsen, S.; Vinther, A.M.; Kjelgaard-Hansen, M.; Nielsen, L.N. Validation of an equine serum amyloid A assay with an unusually broad working range. BMC Vet Res 2019, 15, 462:1–9. [Google Scholar] [CrossRef]
- Bazzano, M.; Arfuso, F.; Bonfili, L.; Eleuteri, A.M.; McLean, A.; Serri, E.; Spaterna, A.; Laus, F. Measuring Biochemical Variables and Serum Amyloid A (SAA) in Working Mules in Central Italy. Animals 2022, 12, 2793. [Google Scholar] [CrossRef]
- Bazzano, M.; Marchegiani, A.; Troisi, A.; McLean, A.; Laus, F. Serum Amyloid A as a Promising Biomarker in Domestic Animals’ Reproduction: Current Knowledge and Future Perspective. Animals 2022, 12, 589. [Google Scholar] [CrossRef]
- Eckersall, P.D.; Conner, J.G. Plasma haptogloin in cattle (Bos taurus) exists as polymers in association with albumin. Comp Biochem Physiol B 1990, 96, 309–314. [Google Scholar] [CrossRef] [PubMed]
- Wagner, EL; Potter, GD; Gibbs, PG; Eller, EM; Scott, BD; Vogelsang, MM; Walzem, RL. Copper and zinc balance in exercising horses fed 2 forms of mineral supplements. J Anim Sci 2010, 78, 722–728. [Google Scholar] [CrossRef] [PubMed]
- Bannister, J.V.; Bannister, W.H.; Hill, H.A.O.; Mahood, J.F.; Willson, R.L.; Wolfenden, B.S. Does caeruloplsamin dismute superoxide? No. FEBS Lett 1980, 118, 127–129. [Google Scholar] [CrossRef]
- Pyne, D.B. Exercise-induced muscle damage and inflammation: a review. Aust J Sci Med Sport 1994, 26, 49–58. [Google Scholar] [PubMed]
- Fallon, K.E. The acute phase response and exercise: the ultramarathon as prototype exercise. Clin J Sport Med 2001, 11, 38–43. [Google Scholar] [CrossRef]
- Clarkson, P.M.; Hubal, M.J. Exercise-induced muscle damage in humans. Am J Phys Med Rehabil 2002, 81, (11 Suppl):S52–69. [Google Scholar] [CrossRef]
- Liburt, N.R.; Adams, A.A.; Betancourt, A.; Horohov, D.W.; McKeever, K.H. Exercise-induced increases in inflammatory cytokines in muscle and blood of horses. Equine Vet J Suppl 2010, 42, 280–288. [Google Scholar] [CrossRef]
- Freestone, J.F.; Wolfsheimer, K.J.; Kamerling, S.G.; Church, G.; Hamra, J.; Bagwell, C. Exercise induced hormonal and metabolic changes in Thoroughbred horses: effects of conditioning and acepromazine. Equine Vet J 1991, 23, 219–223. [Google Scholar] [CrossRef]
- Gutteridge, J.M.; Halliwell, B. Iron toxicity and oxygen radicals. Baillieres Clin Haematol 1989, 2, 195–256. [Google Scholar] [CrossRef] [PubMed]
- Auer, D.E.; Ng, J.C.; Thompson, H.L.; Inglis, S.; Seawright, A.A. Acute phase response in horses: changes in plasma cation concentrations after localised tissue injury. Vet Rec 1989, 124, 235–239. [Google Scholar] [CrossRef] [PubMed]
- Mills, P.C.; Higgins, A.J. Oxidant injury, nitric oxide and pulmonary vascular function: implications for the exercising horse. Vet J 1997, 153, 119–121. [Google Scholar] [CrossRef]
Figure 1.
Serum amyloid A (SAA) concentrations (mg/L) in Thoroughbred racehorses subjected to a 2,400-m gallop race (A) and a 40-km endurance race (B). Blood samples were collected before exercise (T0) and at the indicated post-exercise time points. Data are presented as mean ± standard deviation (SD). Statistical significance refers to comparisons with pre-exercise baseline (T0) using mixed-effects models followed by Dunnett’s post-hoc test (**p < 0.01; ***p < 0.001; ns = not significant).
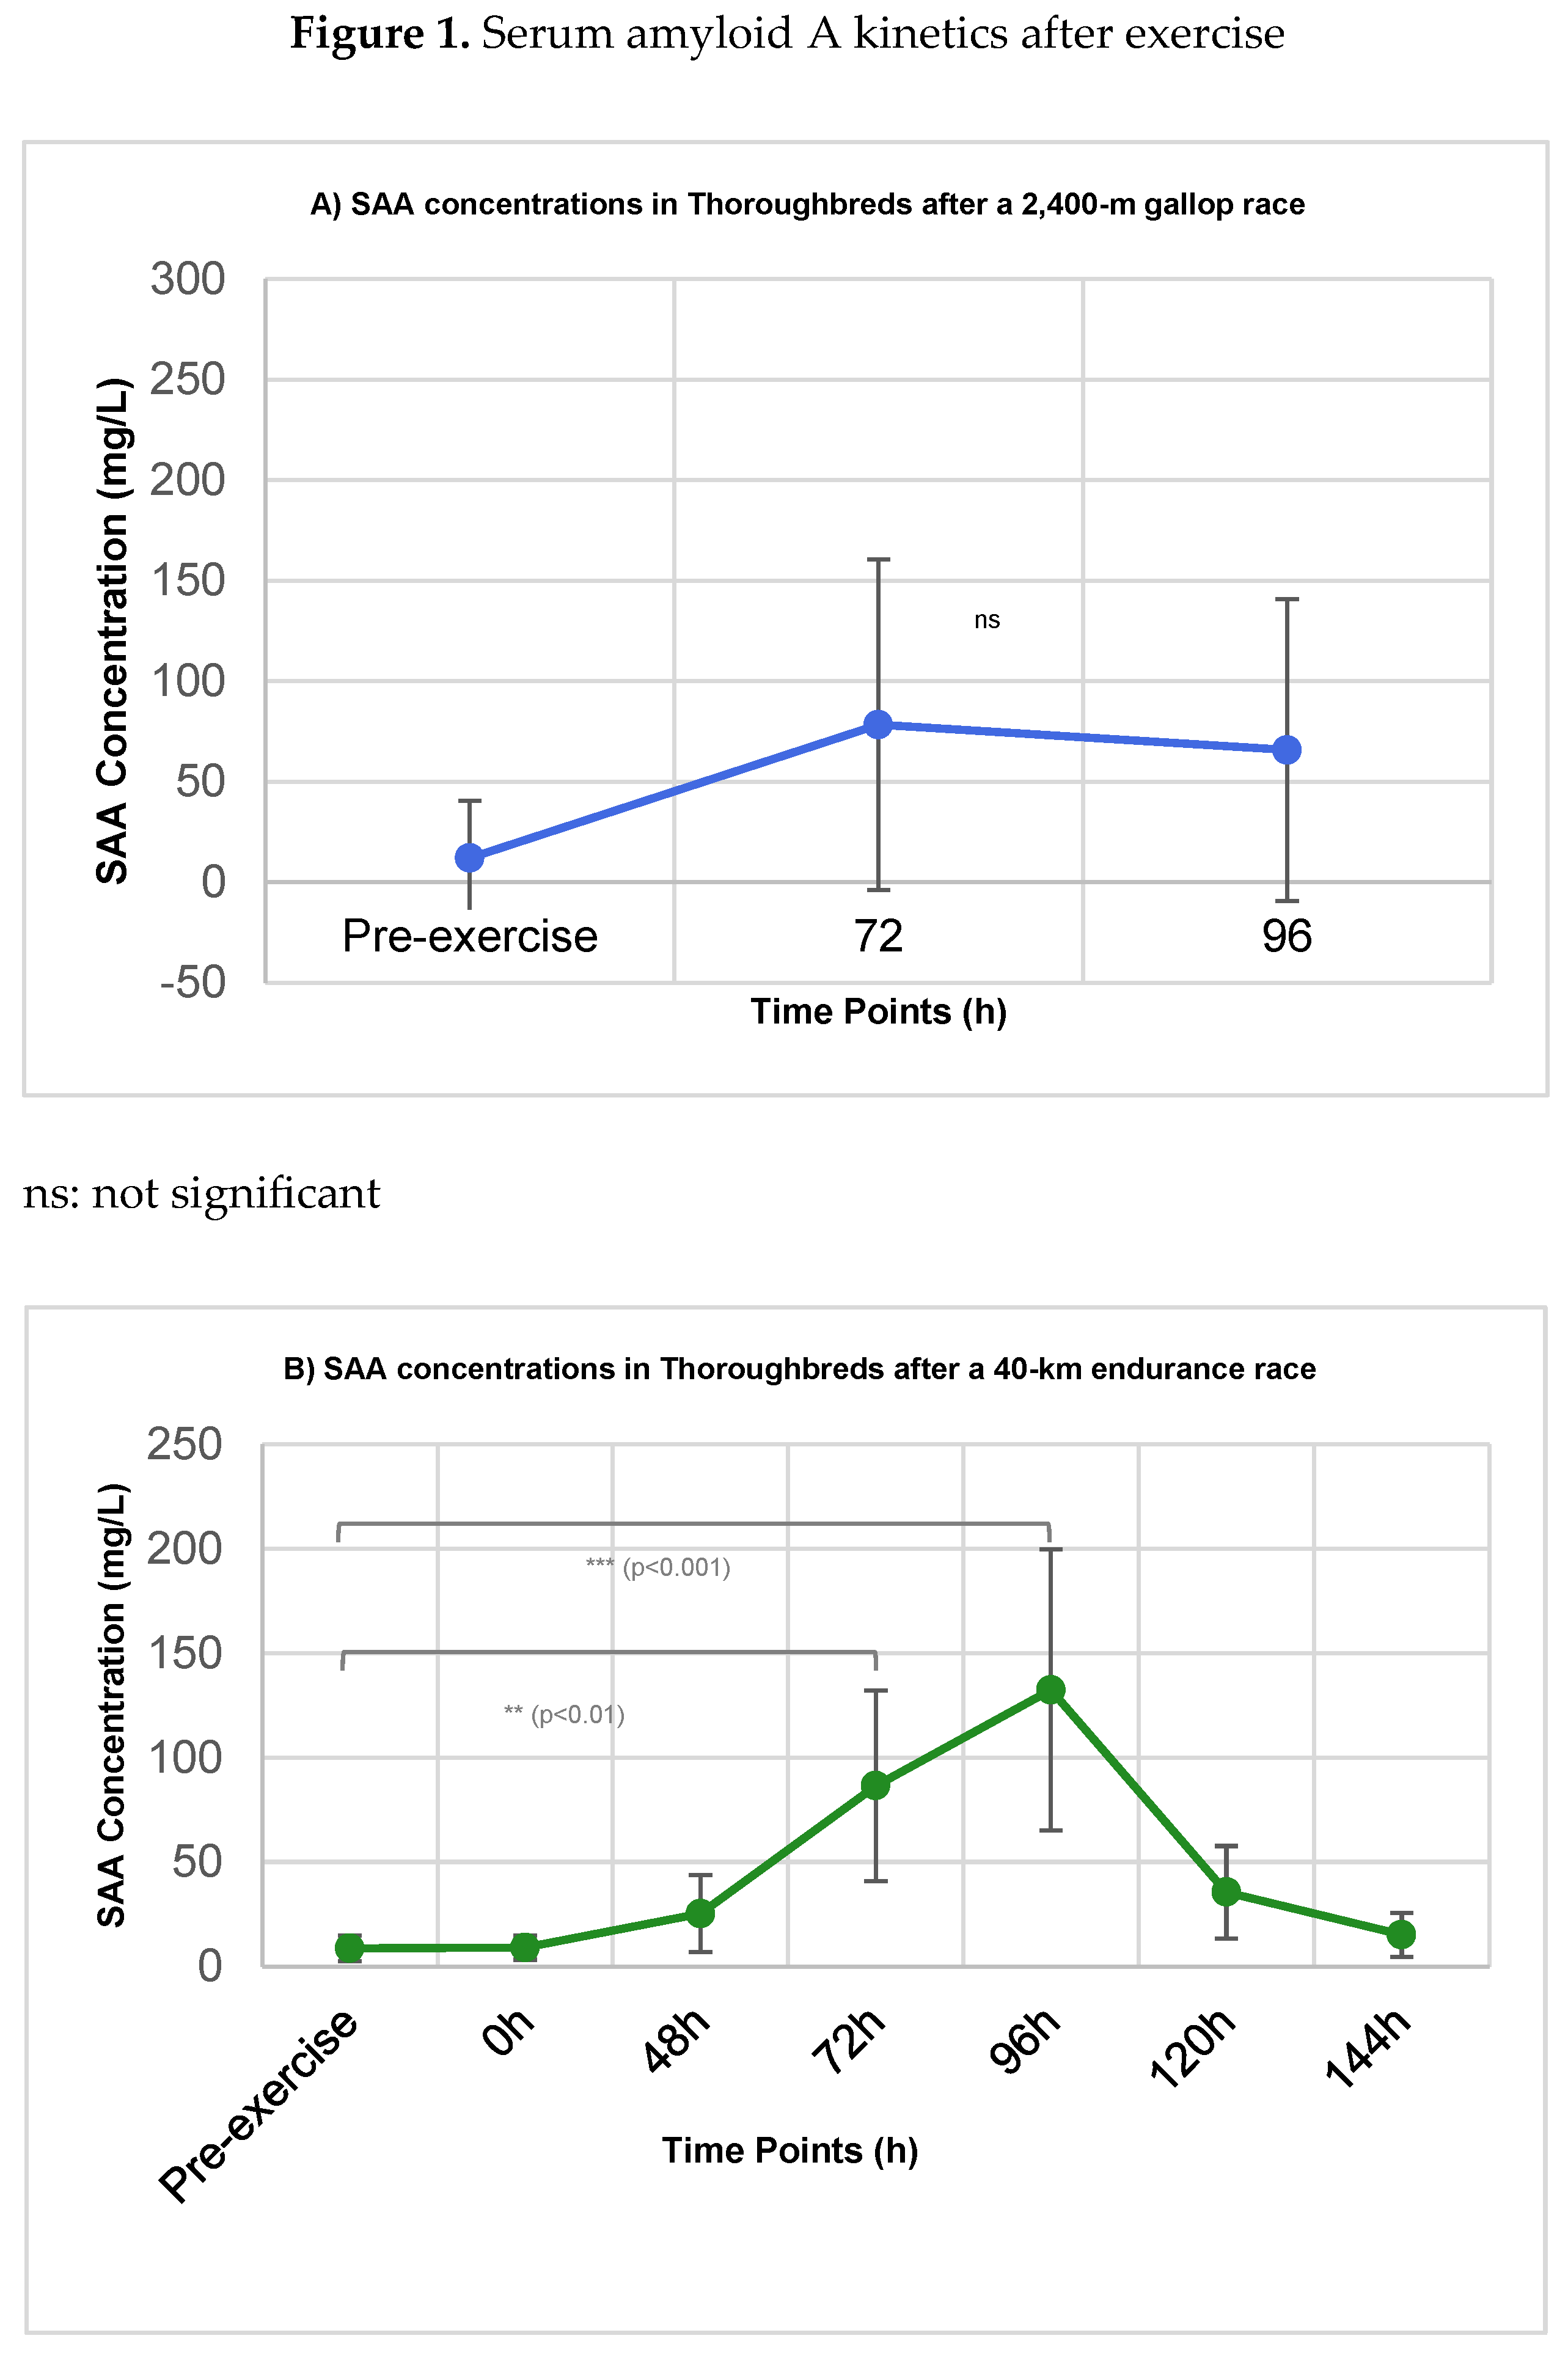
Figure 2.
Comparison of serum amyloid A (SAA) concentrations (mg/L) in Thoroughbred racehorses 72 h and 96 h after gallop race (GR) and endurance race (ER). Data are presented as mean ± standard deviation (SD). Between-group comparisons were performed using an unpaired Student’s t-test or Mann–Whitney U test, as appropriate. p < 0.05 indicates a statistically significant difference between exercise modalities.
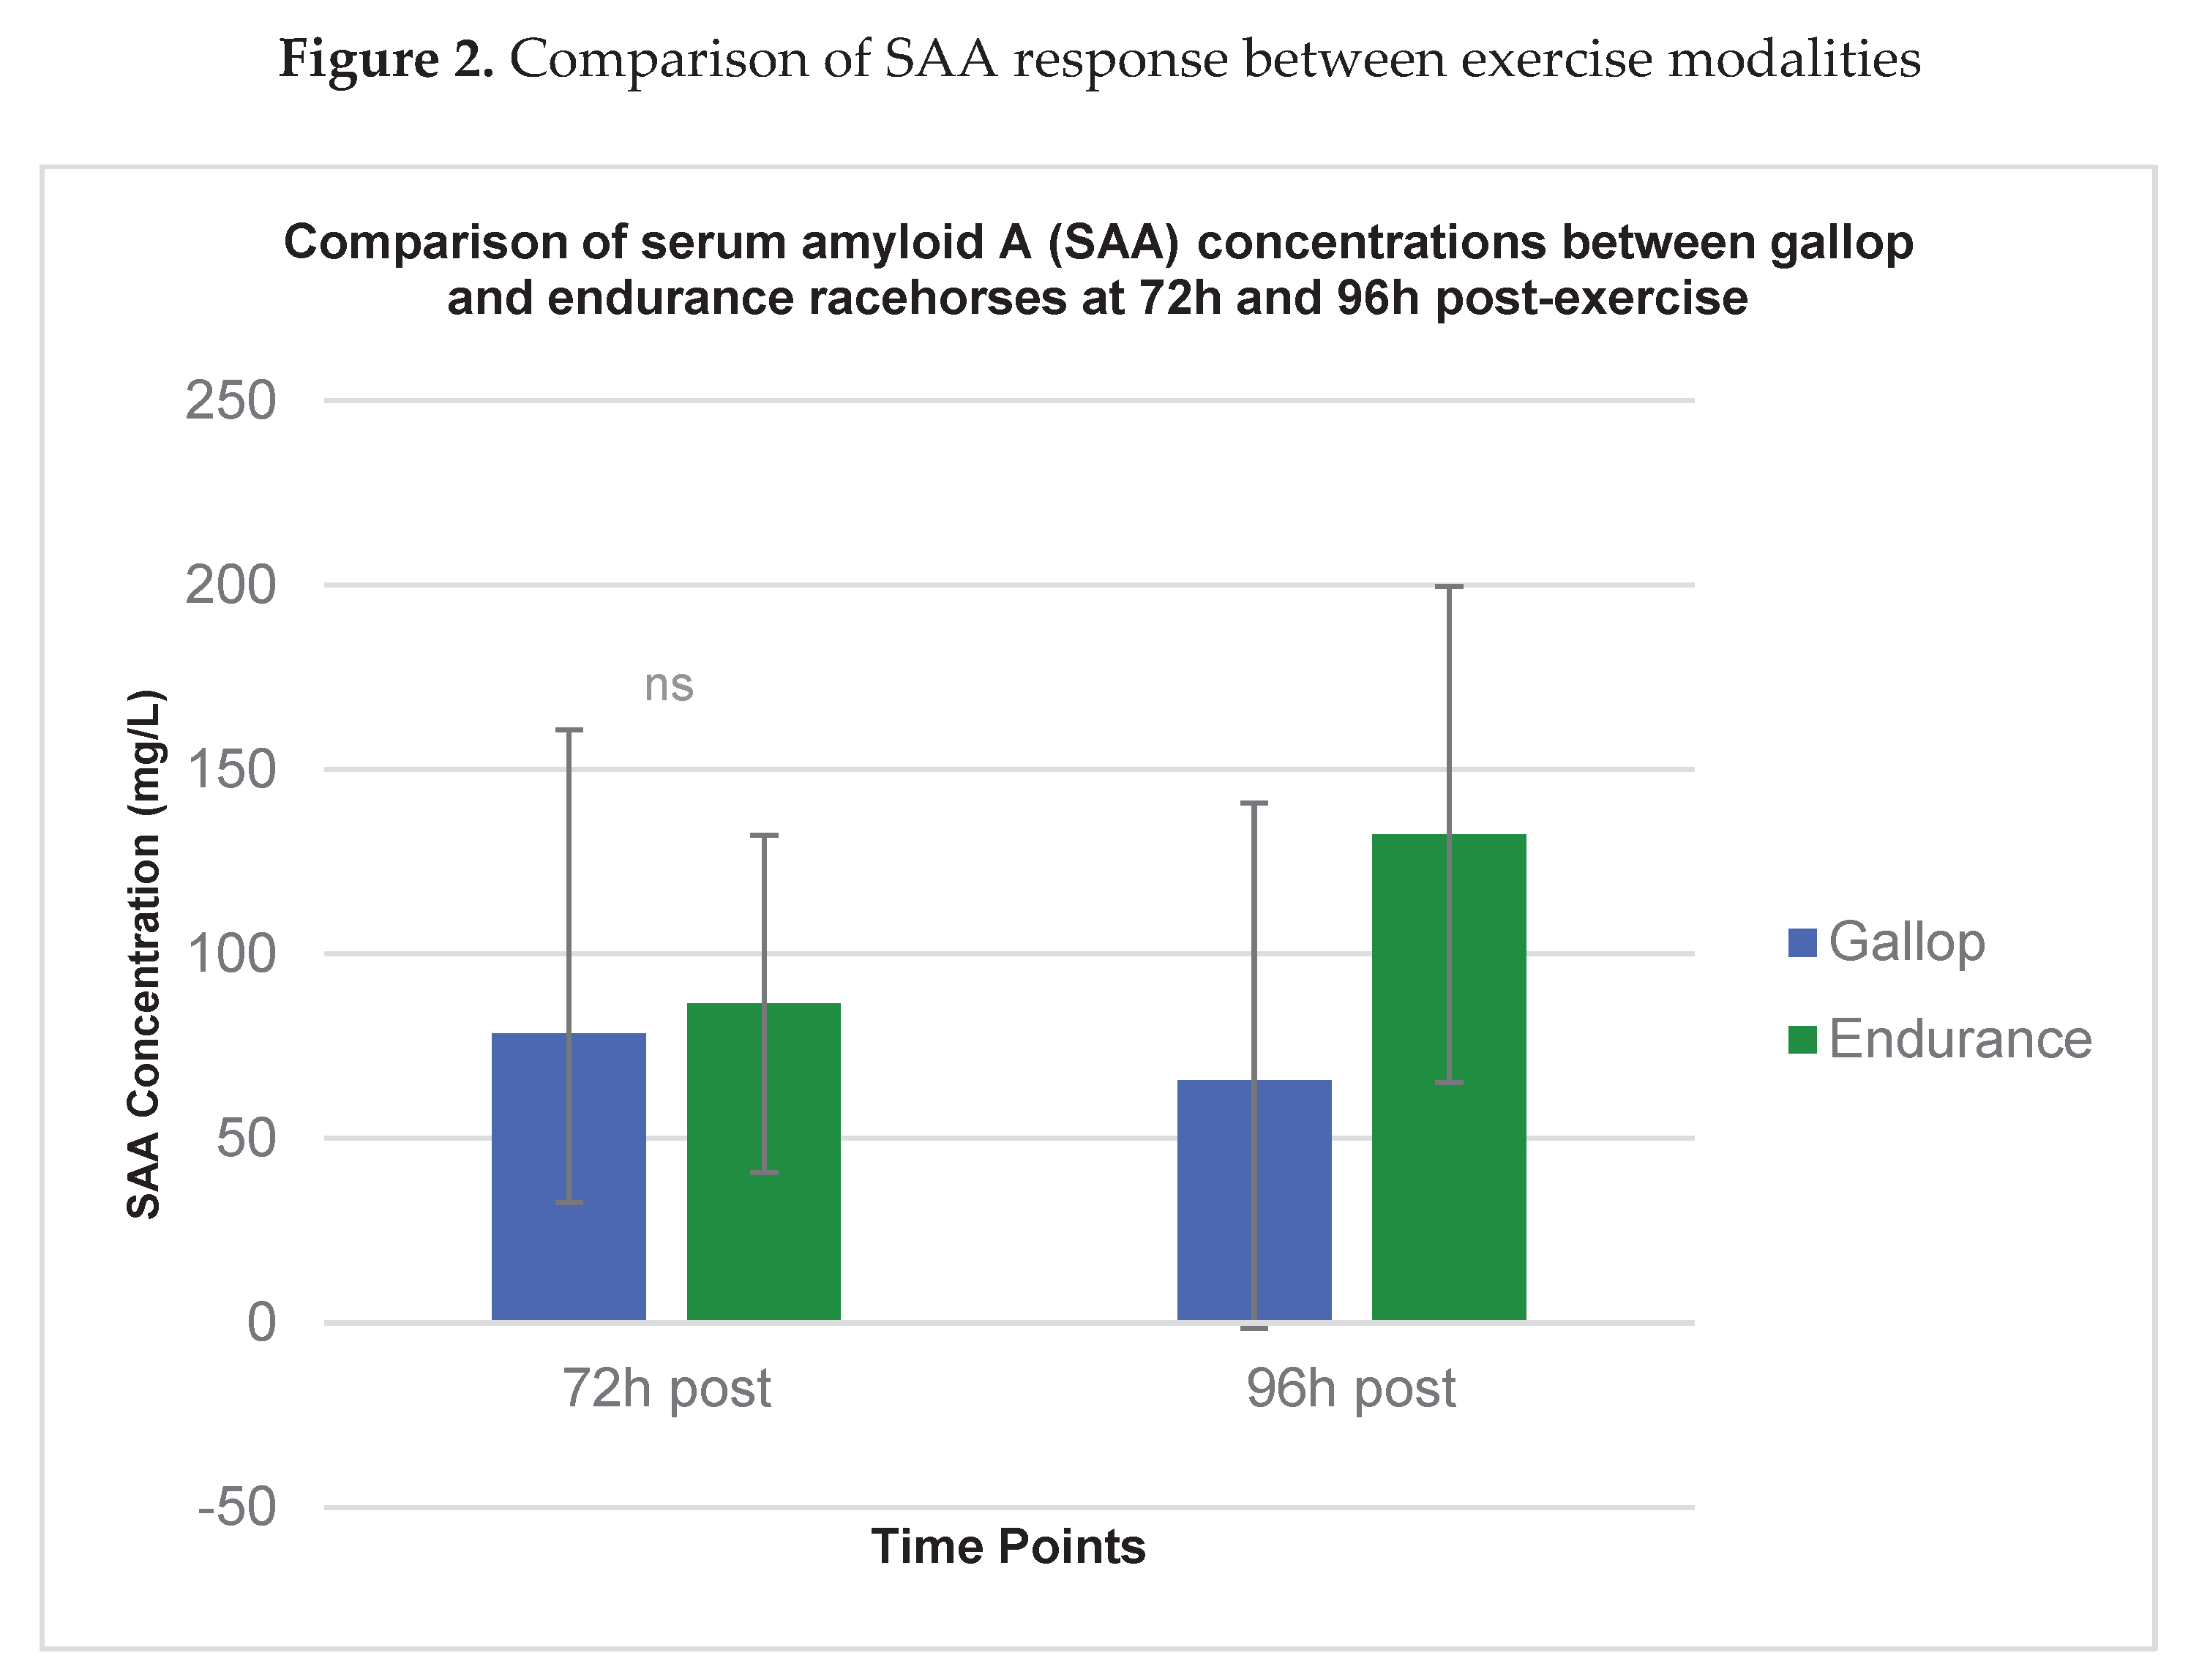
Figure 3.
Ceruloplasmin (Cp) concentrations (mg/L) in Thoroughbred racehorses subjected to a 2,400-m gallop race (A) and a 40-km endurance race (B). Data are shown as mean ± standard deviation (SD). Statistical significance refers to comparisons with pre-exercise baseline (T0) using mixed-effects models (p < 0.05).
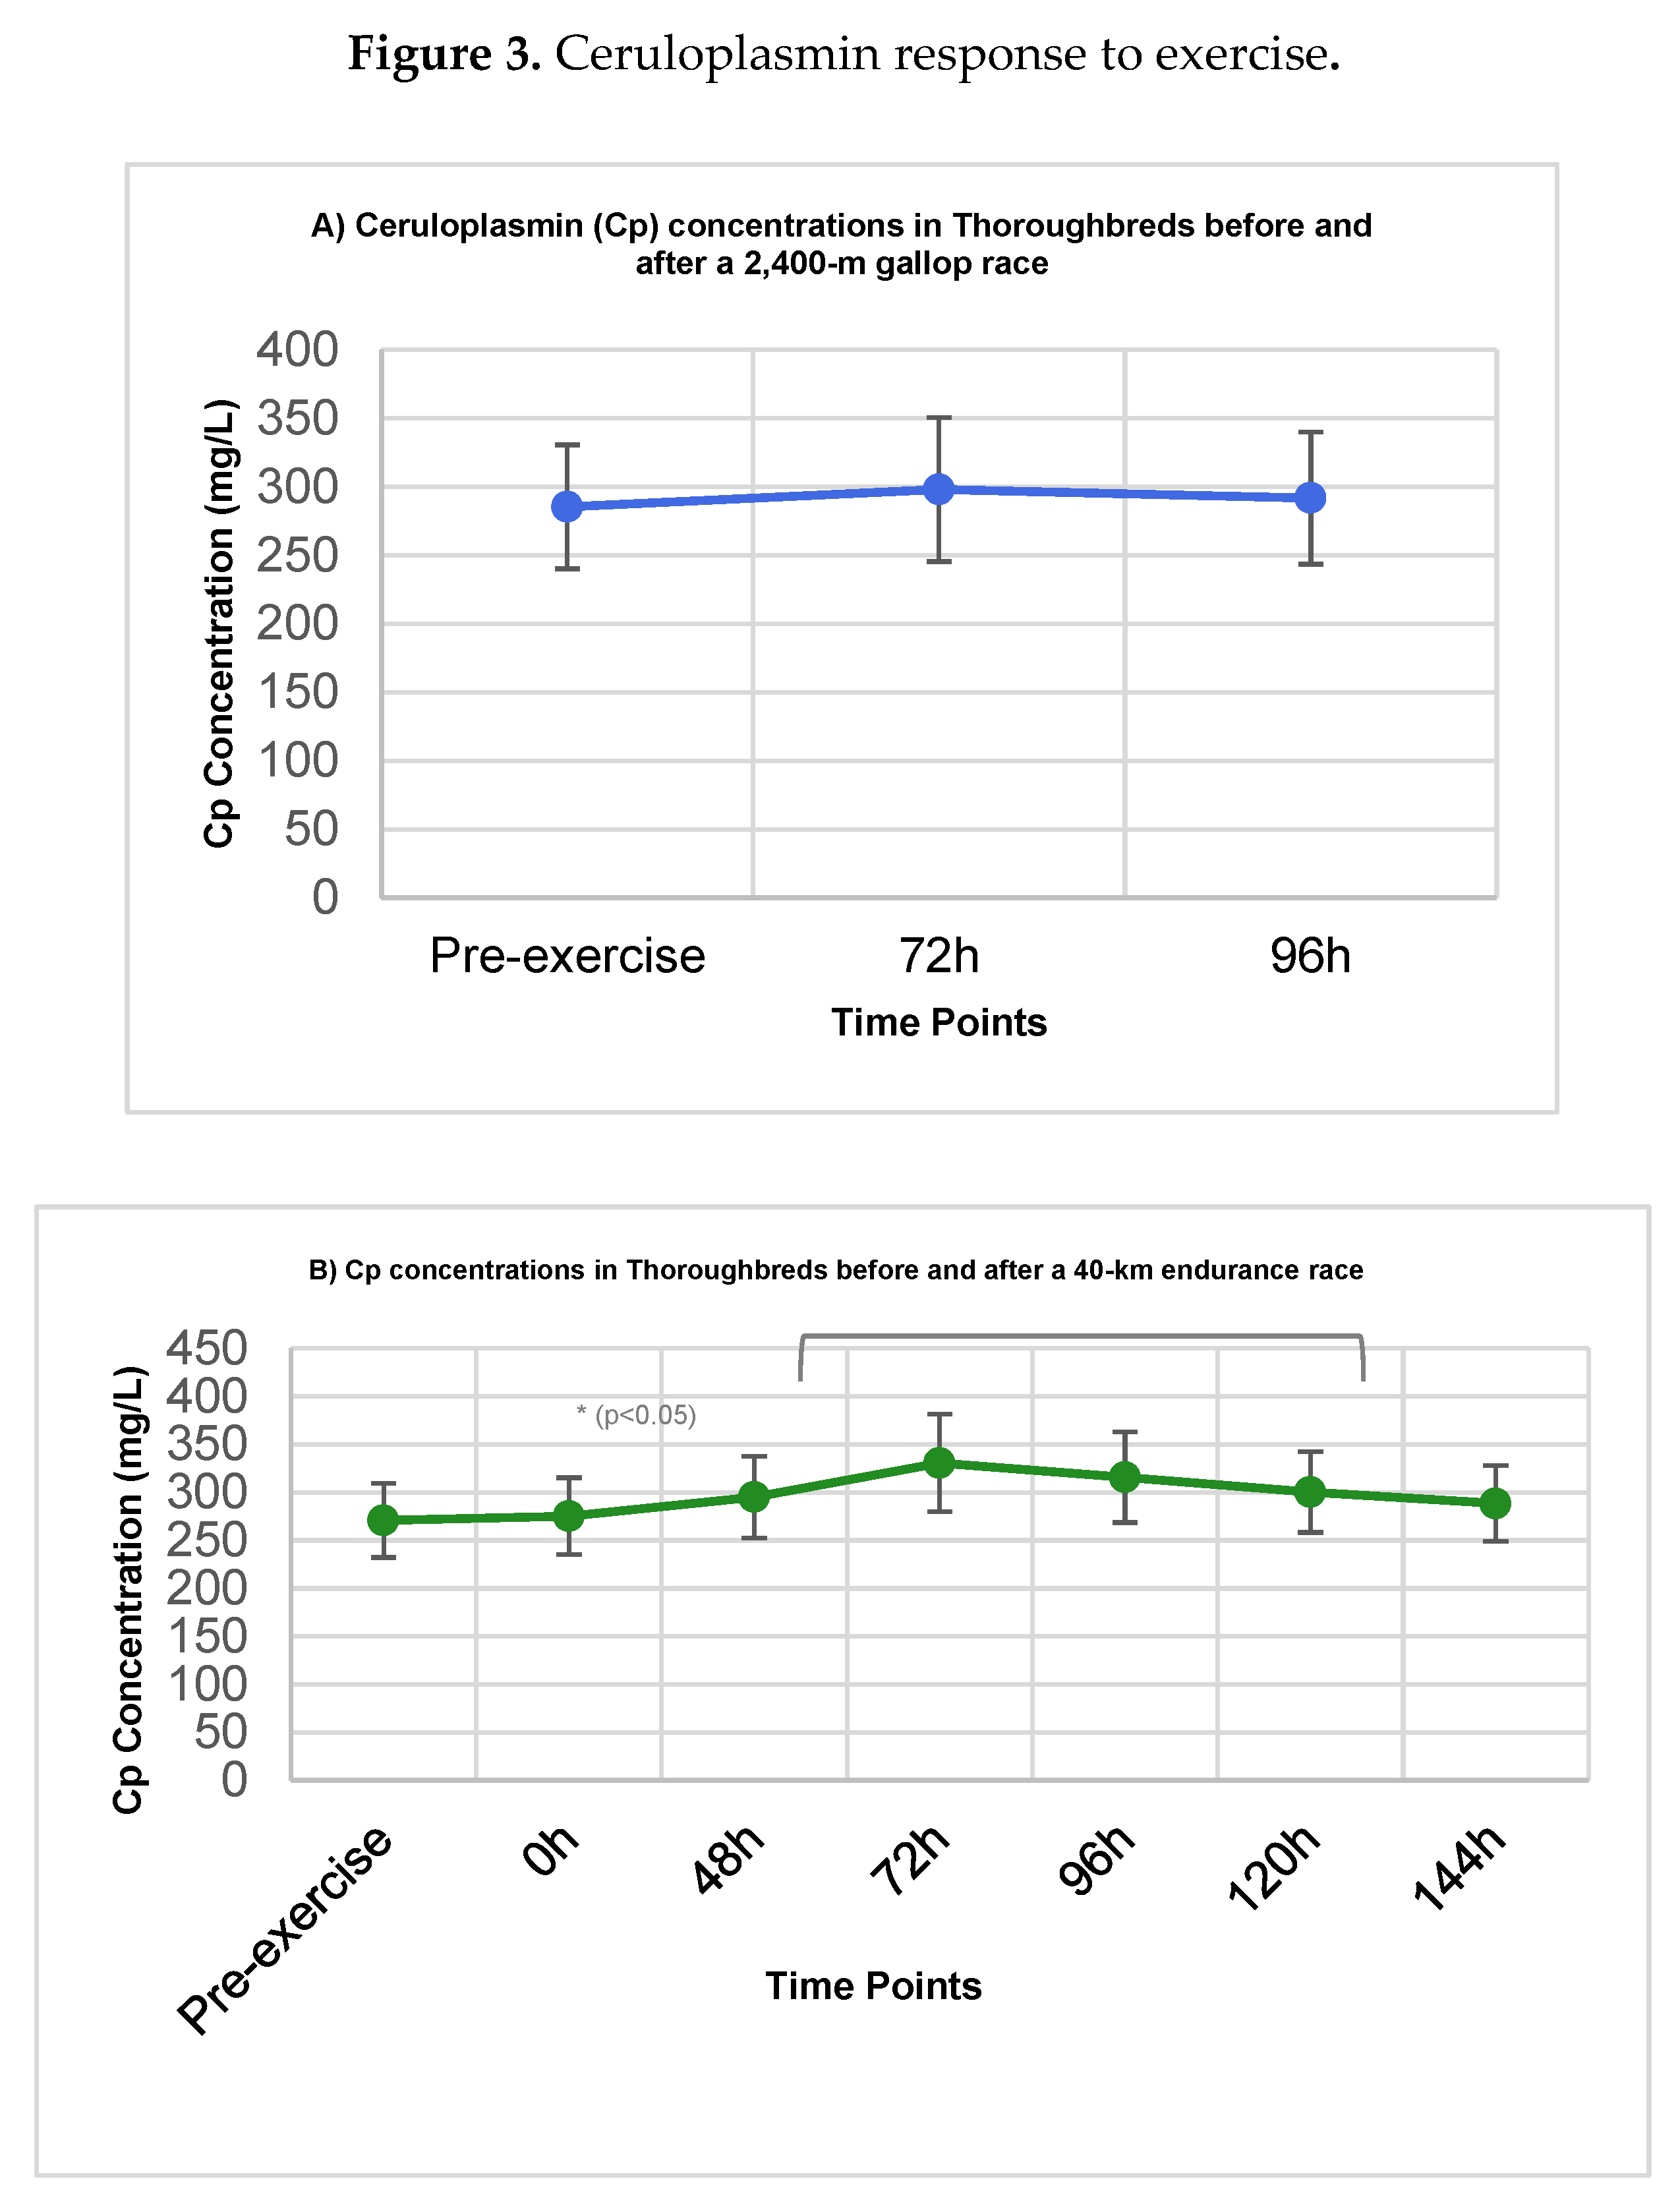
Figure 4.
Haptoglobin (Hp) concentrations (mg/mL) in Thoroughbred racehorses subjected to a 2,400-m gallop race (A) and a 40-km endurance race (B). Data are presented as mean ± standard deviation (SD). No statistically significant differences were detected compared with pre-exercise baseline (T0) (p > 0.05).
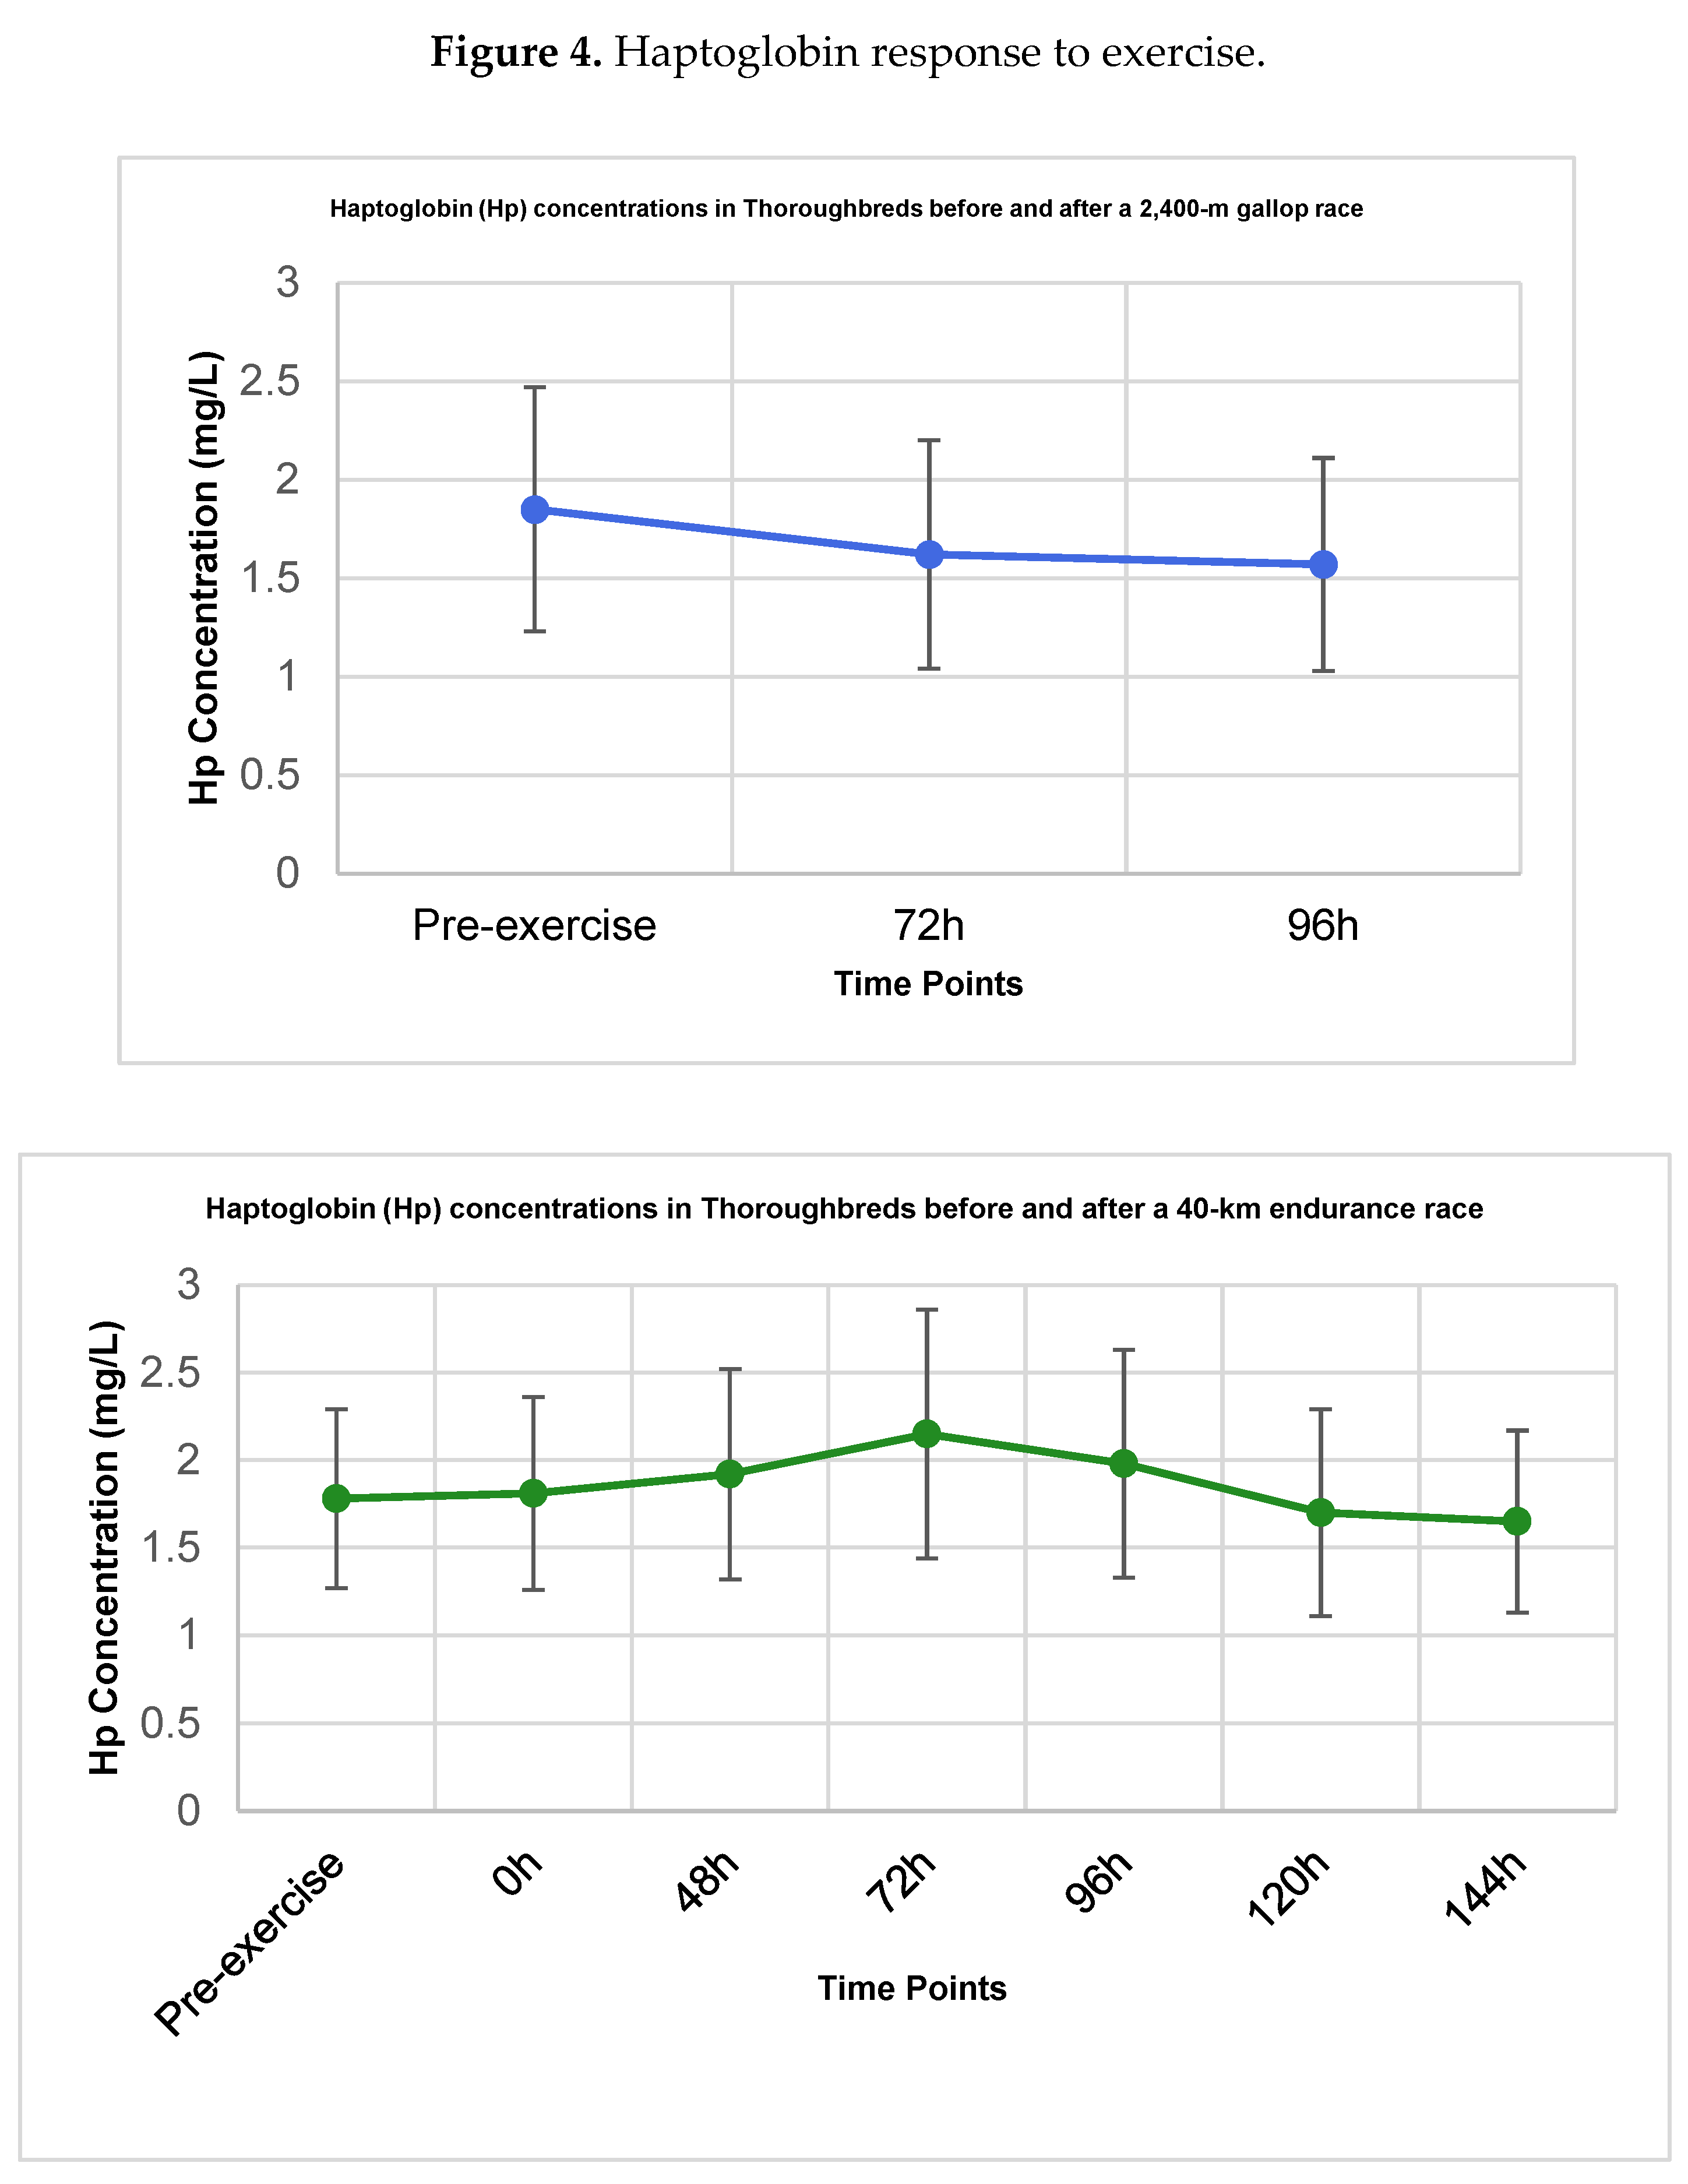

Table 1.
Serum amyloid A (SAA) concentrations (mg/L) in Thoroughbred racehorses before and after gallop or endurance exercise.
Table 1.
Serum amyloid A (SAA) concentrations (mg/L) in Thoroughbred racehorses before and after gallop or endurance exercise.
| Group | Time Point | SAA (mg/L) Mean ± SD |
p-value (vs. Pre-exercise) |
| Gallop (n=12) | Pre-exercise (T0) | 12.1 ± 28.5 | - |
| 72h post-exercise | 78.4 ± 82.3 | p = 0.067 | |
| 96h post-exercise | 65.8 ± 75.1 | p = 0.112 | |
| Endurance (n=13) | Pre-exercise (T0) | 8.7 ± 6.2 | - |
| Immediate post-exercise | 9.1 ± 5.8 | p = 0.850 | |
| 48h post-exercise | 25.3 ± 18.4 | p = 0.057 | |
| 72h post-exercise | 86.5 ± 45.7 | p < 0.01 | |
| 96h post-exercise | 132.4 ± 67.2 | p < 0.001 | |
| 120h post-exercise | 35.6 ± 22.1 | p = 0.084 | |
| 144h post-exercise | 15.2 ± 10.5 | p = 0.210 |
Data are presented as mean ± standard deviation (SD). Pre-exercise values (T0) were obtained 24 h before competition. Post-exercise values refer to the indicated time points after completion of the race. Statistical comparisons were performed within each group against the respective pre-exercise baseline (T0) using mixed-effects models followed by Dunnett’s post-hoc test. A p-value < 0.05 was considered statistically significant.
Table 2.
Ceruloplasmin (Cp) concentrations (mg/L) in Thoroughbred racehorses before and after gallop or endurance exercise.
Table 2.
Ceruloplasmin (Cp) concentrations (mg/L) in Thoroughbred racehorses before and after gallop or endurance exercise.
| Group | Time Point | Cp (mg/L) Mean ± SD |
p-value (vs. Pre-exercise) |
| Gallop (n=12) | Pre-exercise (T0) | 285.4 ± 45.2 | - |
| 72h post-exercise | 298.1 ± 52.7 | p = 0.421 | |
| 96h post-exercise | 291.8 ± 48.3 | p = 0.683 | |
| Endurance (n=13) | Pre-exercise (T0) | 270.8 ± 38.6 | - |
| Immediate post-exercise | 275.2 ± 40.1 | p = 0.715 | |
| 48h post-exercise | 295.1 ± 42.5 | p = 0.098 | |
| 72h post-exercise | 330.5 ± 50.8 | p < 0.05 | |
| 96h post-exercise | 315.7 ± 47.2 | p < 0.051 | |
| 120h post-exercise | 300.2 ± 41.9 | p = 0.089 | |
| 144h post-exercise | 288.4 ± 39.5 | p = 0.185 |
Data are presented as mean ± standard deviation (SD). Ceruloplasmin concentration was determined by measuring serum ferroxidase activity. Statistical comparisons were performed within each group versus pre-exercise baseline (T0) using mixed-effects models with horse as a random effect. Significance was set at p < 0.05.
Table 3.
Haptoglobin (Hp) concentrations (mg/mL) in Thoroughbred racehorses before and after gallop or endurance exercise.
Table 3.
Haptoglobin (Hp) concentrations (mg/mL) in Thoroughbred racehorses before and after gallop or endurance exercise.
| Group | Time Point | Hp (mg/mL) Mean ± SD |
p-value (vs. Pre-exercise) |
| Gallop (n=12) | Pre-exercise (T0) | 1.85 ± 0.62 | - |
| 72h post-exercise | 1.62 ± 0.58 | p = 0.254 | |
| 96h post-exercise | 1.57 ± 0.54 | p = 0.198 | |
| Endurance (n=13) | Pre-exercise (T0) | 1.78 ± 0.51 | - |
| Immediate post-exercise | 1.81 ± 0.55 | p = 0.891 | |
| 48h post-exercise | 1.92 ± 0.60 | p = 0.502 | |
| 72h post-exercise | 2.15 ± 0.71 | p = 0.124 | |
| 96h post-exercise | 1.98 ± 0.65 | p = 0.398 | |
| 120h post-exercise | 1.70 ± 0.59 | p = 0.674 | |
| 144h post-exercise | 1.65 ± 0.52 | p = 0.529 |
Data are presented as mean ± standard deviation (SD). Statistical comparisons were conducted within each group against the respective pre-exercise baseline (T0) using mixed-effects models. No statistically significant differences were observed (p > 0.05).
Disclaimer/Publisher’s Note: The statements, opinions and data contained in all publications are solely those of the individual author(s) and contributor(s) and not of MDPI and/or the editor(s). MDPI and/or the editor(s) disclaim responsibility for any injury to people or property resulting from any ideas, methods, instructions or products referred to in the content. |
© 2026 by the authors. Licensee MDPI, Basel, Switzerland. This article is an open access article distributed under the terms and conditions of the Creative Commons Attribution (CC BY) license (http://creativecommons.org/licenses/by/4.0/).
Copyright: This open access article is published under a Creative Commons CC BY 4.0 license, which permit the free download, distribution, and reuse, provided that the author and preprint are cited in any reuse.


