Submitted:
02 February 2026
Posted:
03 February 2026
You are already at the latest version
Abstract
The recent proliferation of electronic waste (E-waste) in developing countries has become a pressing environmental and socio-economic issue, particularly in urban areas dominated by informal waste management practices. The current E-waste collection system in Yaoundé comprises three collection streams: informal, formal, and municipal solid waste collection. However, transitioning to a prospective, integrated system requires optimizing E-waste collection. Given that the current formal collection (CFC) scenario has only 3 formal collection points, this study employs a survey-based and GIS network analyses to allocate 8 additional collection points to maximize formal collection coverage in Yaoundé. The results indicate a 52.81% increase in formal collection coverage for the maximized formal collection (MFC) scenario. Furthermore, Route 1 proved to be the most cost-effective, with a fuel consumption cost of 2,074,553.15 FCFA/year. Additionally, Route 1 yielded the lowest GHG emissions, at 6,714.74 kg CO₂ eq/year, compared with Routes 2 and 3. Finally, transitioning from the current business-as-usual (BAU) to a prospective integrated E-waste management (IEM) system resulted in a 13.83% reduction in emissions. This contributed 3.04% to Cameroon’s 2030 greenhouse gas (GHG) emission reduction target, as defined in its nationally determined contributions (NDC). The study’s findings are informative for decision-making in optimizing E-waste management systems in developing economies.
Keywords:
E-waste
; collection
; system
; optimization
; network analysis
; Cameroon
1. Introduction
1.1. Research Background
Electronic waste (E-waste), also known as discarded electrical and electronic equipment (EEE), is among the fastest-growing waste streams worldwide. This expansion is attributed to rapid technological progress, increased device ownership, and shorter product life spans [1]. In 2022, approximately 62 million tons of E-waste were generated globally, averaging 7.8 kg per capita, with projections indicating further increases by 2030 [2]. Despite this rapid expansion, only about 22–23% of E-waste was officially recorded as collected and recycled in 2022. The remainder was either stored, discarded, sold illicitly, or processed informally [3].
Furthermore, most E-waste originates from developed economies such as Europe, North America, and East Asia [4]. Meanwhile, developing economies, including certain areas of Asia, Africa, and Latin America, are experiencing a rapid increase in volumes due to rising consumption and the influx of imported (occasionally illicit) used electronics [5,6]. However, due to infrastructure and legislative disparities between developed and developing countries, E-waste recovery rates differ across high- and middle- to low-income economies, with developing countries achieving very low recovery rates [7]. This implies that varying recovery rates may determine the magnitude of public health and environmental impacts associated with formal and informal E-waste treatment methods across different economic contexts.
In developed economies such as the European Union (EU) and Japan, with well-established E-waste management legislation, policies, and state-of-the-art recycling infrastructure, formal collection and treatment are more prevalent, thereby mitigating environmental and public health impacts from E-waste disposal [8,9]. Conversely, in developing countries where E-waste management is poorly regulated, about 70-80% is handled by the informal sector, which often applies treatment methods with adverse public health and environmental impacts [10]. Informal E-waste treatment methods often include manual dismantling, open burning, acid leaching, crude melting to extract valuable materials, and landfilling hazardous materials [11].
Theoretically, the proportion of formal E-waste recovery in E-waste management inherently determines the magnitude of adverse environmental impacts from improper E-waste treatment in the informal sector [12]. Hence, it is crucial to ensure optimal formal E-waste recovery within E-waste management systems to mitigate potential negative health and environmental impacts from improper E-waste treatment within the informal sector [13,14]. Therefore, this study investigates how to enhance E-waste management systems (EMS) by optimizing E-waste collection, which accounts for 50-70% of EMS operational costs and is critical to environmental sustainability.
1.2. E-Waste Collection System in Cameroon
The Republic of Cameroon is a Central African country on the Gulf of Guinea, with a land area of 475,400 km². The country’s population in 2025 was 30.15 million, with a growth rate of 2.57% from 2024 [15]. The country’s sources of electronic equipment are primarily imports from manufacturing countries in Europe, Asia, and North America [16]. Therefore, due to the constant influx of electronic appliances and inadequate end-of-life management, E-waste management has recently become a significant challenge in the country, especially in cities with rapid urbanization, high living standards, and increasing consumption of electronic goods [17].
In Cameroon, the E-waste management system comprises three collection streams: informal, formal, and municipal solid waste. A depiction of the current business-as-usual (BAU) E-waste management system is shown in Figure 1. In the country’s administrative capital (Yaoundé), the bulk of generated E-waste is discarded informally, along with a proportion that is mixed with municipal solid waste collected by the municipal solid waste collection company [18,19]. On the other hand, the formal collection quantity per year amounts to approximately 130 tons, of which about 50 tons are refurbished by the formal collection company, Solidarité Technologique (SoliTech) [20]. SoliTech is the sole actor in the formal sector for the collection, treatment, and disposal of E-waste. Despite the activities of the formal collection company, informal practices in E-waste treatment and disposal still predominate, resulting in significant environmental and health impacts from non-ecofriendly methods used in the informal sector.
Concerning the key factors influencing E-waste collection in Yaoundé, despite the adoption of legislation regulating E-waste management, there remains insufficient infrastructure to boost formal collection capacity. Based on information gathered from SoliTech, the current formal collection system comprises one primary collection point and two secondary collection points. The primary collection point is the company’s E-waste pre-processing facility located in the Ewonkan district of Yaoundé. The secondary collection points are in the Mendong and Tsinga-Elobi neighborhoods, 25 km and 21 km, respectively, from the primary collection point. The number of collection rounds at the secondary collection points averages 4 per month. Given SoliTech’s aim to increase formal collection coverage and quantity, it is necessary to expand the number of secondary collection points to reach yet-unreached areas in Yaoundé. Furthermore, in line with the anticipated implementation of an integrated E-waste management system, it is crucial to identify suitable locations for potential expansion of formal E-waste collection relative to the current formal collection scheme.
1.3. Past Studies on E-Waste Collection Optimization and Research Gaps
Regarding research objectives, recent studies on optimizing E-waste collection systems have primarily aimed to enhance economic efficiency, improve collection rates, and minimize environmental impacts. A significant trend is the integration of technologies, particularly the Internet of Things (IoT), to streamline data collection and improve data management practices [21,22,23]. By utilizing smart sensors and connectivity, these collection systems can more accurately predict waste volumes, optimize collection routes, and reduce operational costs. Another vital objective in optimizing E-waste collection systems is to enhance reverse logistics, which involves efficiently managing the return flow of products from consumers to producers for refurbishment or recycling [24,25]. Consequently, various methodologies, such as linear programming and model simulation, have been employed to address complex logistics challenges, demonstrating promising results in reducing turnover time and costs [26,27]. Furthermore, there has been a shift in focus toward multi-stakeholder engagement and collaboration within the E-waste management ecosystem. The collaboration between manufacturers, consumers, policymakers, and recyclers has been recognized as essential for improving the efficiency and effectiveness of E-waste collection [28,29].
Nonetheless, despite the growing research in E-waste collection optimization, with focus areas in reverse logistics, artificial intelligence (AI), machine learning (ML) applications, mathematical optimization, internet of things (IoT), and smart systems, the application of such research outcomes is mainly suited to E-waste management systems within developed economies that have ample technological infrastructure and effective legislative instruments or functional policies to enforce environmental and economic sustainability in E-waste management practices. However, despite significant advancements in E-waste management, several research gaps remain in optimizing E-waste collection systems. One such gap is the lack of comprehensive studies focused on developing countries, where E-waste accumulation and management challenges are most prevalent [8,30]. Given the limited infrastructure and resources in these regions, implementing effective E-waste collection systems remains a challenge. Hence, there is a need to adopt a tailored approach to optimize E-waste collection systems in developing economies. However, relative to developing countries, the existing literature on waste collection optimization has primarily focused on route optimization and on solving routing problems to minimize economic and environmental impacts, such as transportation costs and carbon dioxide (CO2) emissions [31]. Some prior studies have evaluated modeling approaches to waste-collection optimization, implemented either through non-intelligent or intelligent systems [32,33].
Furthermore, other aspects of waste collection optimization, such as optimization objectives, constraints, and challenges related to achieving the SDGs, have been examined to clarify the key factors to consider when designing efficient and robust solid waste collection systems that contribute to achieving the SDGs [34]. Additionally, the scope of waste collection optimization research primarily comprises studies that apply geographic information systems (GIS) tools, either singularly or in combination with other methodologies, to achieve expected outcomes. Subsequently, various waste-collection optimization objectives have been pursued to improve the economic and environmental sustainability of the evaluated waste-collection systems. A compilation of past studies illustrating trends in the objectives investigated in waste collection optimization is presented in Table 1. Ultimately, prior research on waste collection optimization indicates that most studies have focused on optimizing municipal solid waste collection by addressing specific factors that influence collection efficiency. However, among the ten factors identified, this study investigates seven to optimize them for the current E-waste collection system in Yaoundé.
According to [18], on leveraging life cycle assessment and system dynamics model analysis for an integrated household E-waste management system in Yaoundé, an integrated E-waste management model proved to be more environmentally sustainable and economically viable to mitigate the impacts of improper treatment and disposal. The integrated model proposes eliminating mixed E-waste disposal with municipal solid waste and formalizing the informal E-waste collection scheme. An illustration of the prospective integrated E-waste management (IEM) system is shown in Figure 2.
In Cameroon, previous E-waste studies have quantified E-waste generation and characterized its composition in a few major urban cities, such as Maroua, Douala, and Yaoundé [19,49,50]. Consequently, this study’s novelty lies in its investigation of how to maximize formal E-waste collection coverage in Yaoundé with a focus on mitigating the environmental and economic impacts of the current BAU formal collection system. This is achieved by proposing an optimized formal collection scheme for the prospective IEM system. Hence, the study addresses the following research questions:
- What is the annual E-waste generation and potential collection quantity in Yaoundé?
- What are the suitable secondary collection points to be allocated for increased formal E-waste collection coverage?
- What is the maximum collection capacity of the optimized formal collection scenario?
- What are the optimal formal collection routes for cost and emission reduction?
- What is the GHG emission reduction potential in the waste sector, following the country’s 2030 NDC target?
An illustration of the optimization of the formal E-waste collection scheme within the IEM system is shown in Figure 3. The following sections elucidate the methodologies applied to assess the research questions, outline the results and discussion, and provide the study’s outcome and conclusion.
2. Materials and Methods
2.1. Data Collection
The data collection involved primary data on the potential quantity of E-waste to be collected annually in Yaoundé. Primary data collection involved administering a survey questionnaire to respondents in Yaoundé. The survey sought to assess public awareness of the environmental and health risks associated with improper E-waste disposal and willingness to pay for E-waste recycling in a hypothetical scenario in which an integrated E-waste management policy is implemented in the city. The survey questionnaire consisted of five sections, each containing questions designed to collect data on different aspects of household E-waste management. One of these sections focused on the use of electronic devices in households. The questionnaire was tailored to elicit information on the most commonly used electronic devices in the city [51] to streamline data collection. These devices included telephones, flat-screen televisions, cathode-ray televisions, laptops, desktop computers, refrigerators, and deep freezers. The survey was conducted from February 1, 2024, to April 30, 2024. The target respondents were household representatives in Yaoundé. The number of households in the city was estimated at 644,143, based on a population of 4,509,000 [52] and an average household size of 7 [53]. Subsequently, the survey sample size was calculated using Taro Yamane’s formula [54], as shown in Equation (1) below.
where:
N = Number in population (number of households in this study)
e = Margin of error
n = Sample size (number of respondents)
By applying a 5% margin of error, the sample size was calculated to be approximately 400 households. However, 423 households were surveyed for the data collection. The 5% margin of error was applied because it strikes a balance between precision, feasibility, and cost [55]. The following sections detail the estimation of the potential quantity of E-waste to be collected per year, and subsequently, the maximization of the formal collection quantity of the city’s household E-waste.
2.1.1. Calculation of Annual E-waste Generation Quantity
Based on the formula given in Equation (2.2), adapted from [56], the consumption and use model was used to calculate the annual quantity of E-waste generated in Yaoundé for the selected electronic appliances considered in the conducted survey.
where:
WEEEgenQ(t) = E-waste generation quantity (kg/year)
P(t) = Population (number of inhabitants)
Np(t) = Number of electronic devices owned by a person (value < or > than 1) (number of devices)
W = Average weight of each type of electronic device (kg)
L = Average lifespan of each type of electronic device (years)
Given that the survey conducted for this study investigated the E-waste generation quantities per household, the P(t) and Np(t) formula variables were modified to depict the following:
P(t) = Number of households
Np(t) = Average number of electronic devices per household
The results of the calculation are presented in the results section.
2.1.2. Calculation of the Potential Annual Collection Quantity
The calculation was also done following the consumption and use model formula given in Equation (2.3), adapted from [56].
where:
P(t) = Population
Np(t) = Number of electronic devices owned by a person (value < or > than 1)
W = Average weight of each type of electronic device
Lr(t) = Average duration from when the electronic device was bought until it is collected (years)
Again, based on the objective of the survey conducted, and the responses from the respondents concerning the usage duration of their previous devices and how long they expect to use the current devices, the P(t), Np(t), and Lr(t) variables were modified as follows:
P(t) = Number of households
Np(t) = Average number of electronic devices per household
Lr(t) = Average of the usage duration of the previous device and the expected usage duration of the current device (years)
The results of the calculation are presented in the results section.
2.2. Data Processing
2.2.1. Allocation of Suitable Secondary Collection Points for Increased Formal E-Waste Collection Coverage
The methodology employed for this assessment used Google Maps, Google Earth Pro, and network analysis tools in ArcGIS 10.8. Google Maps was used to identify and extract GPS coordinates of electronic repair shops in Yaoundé that could be designated as secondary collection points in the optimized E-waste collection scheme. The identified electronic repair shops were then geo-localized using Google Earth Pro. This process generated point data, which was then converted to a shapefile for a location-allocation analysis in ArcGIS. Location allocation analysis is one of the analytical functions in ArcGIS Network Analysis. It is used to efficiently allocate facilities or service provision points to demand or consumption points based on various parameters, depending on the demand and supply objective and the operational context [57]. Hence, the location-allocation analysis used both primary and secondary geospatial data. The primary data included shapefiles for the identified electronic repair shops and for the existing primary and secondary formal collection points. The secondary data consisted of shapefiles for Yaoundé’s road network and 2020 population clusters, obtained from the GeoFabrik and DIVA GIS databases, respectively.
Accordingly, 76 electronic repair shops were identified as potential secondary collection points. However, given that the current formal collection (CFC) scenario comprises one primary and two secondary collection points, an allocated formal collection (AFC) scenario was modeled to select eight optimal points from the 76 identified points. The 8 points were selected via location-allocation analysis, using parameters defined relative to the three existing collection points in the CFC scenario. Hence, a total of 10 secondary collection points and 1 primary collection point were selected for the resultant maximized formal collection (MFC) scenario, as determined via the location-allocation analysis. The existing formal collection points and potential secondary collection points were assigned as the facilities for allocation in the CFC and AFC scenarios, respectively. Meanwhile, the population clusters served as the demand points. The road shapefile was used to create a network dataset, which serves as the foundation for running all network analysis operations in ArcGIS. The parameter settings and location-allocation analysis properties are presented in Table 2. The resultant map, which illustrates the allocated secondary E-waste collection points for the optimized formal collection scheme, is presented in the results section.
2.2.2. Calculation of the Maximum Collection Capacity of the MFC Scenario
Having allocated the optimum number of secondary E-waste collection points based on the population to be covered, it was necessary to evaluate the collection coverage capacity of the maximized formal collection (MFC) scenario. This analysis involved calculating the maximum formal collection quantity across several distance ranges from demand points (households) to allocated secondary collection points (facilities). It was accomplished through a service area analysis, a specialized analytical function within ArcGIS Network Analysis. A service area analysis identifies the area reachable from a facility based on specific travel time or distance limits [58].
The service area analysis distance limits were determined from survey responses indicating the distance from houses to the current municipal solid waste collection bins. The responses indicated that individuals are likely to travel the same distance to dispose of their E-waste. The average distance to a municipal solid waste collection bin was 0.93km. The minimum, maximum, and median distances were given as 0.003km, 7km, and 0.5km, respectively. Hence, the service area distance limits were set at 0.25km, 0.5km, 1km, 2km, and 3km away from the allocated formal collection (AFC) points. Based on the distance limits, the service-area analysis generated polygons delineating potential collection coverage within the city of Yaoundé.
The number of population clusters within each polygon was counted, and the number of households per service area was calculated from population and household-size data. Following the previous calculation of the annual E-waste generation quantity in Yaoundé, the annual generation quantity per household was calculated to be 18.04kg. This value was then used to determine the potential formal collection quantity per year for each generated service-area polygon. Subsequently, based on the potential E-waste collection quantity calculated for the largest service area polygon, the maximum formal collection quantity was determined.
In addition, the service area analysis was applied to the CFC and MFC scenarios. Given that the CFC and MFC represent the formal collection schemes within the business-as-usual (BAU) and integrated E-waste management (IEM) systems, respectively, a comparative analysis was performed to determine the more sustainable collection scenario. The results of this analysis are shown in the results section.
2.2.3. Selection of Optimal Formal Collection Routes for Cost and Emission Reduction
After successfully allocating additional secondary collection points to maximize formal collection in Yaoundé, it was necessary to identify the optimal formal collection routes from the primary collection point to the secondary collection points during an E-waste collection round. This was accomplished by conducting a route analysis, a specialized analytical function within ArcGIS Network Analysis. The route analysis aimed to identify the route with the shortest travel time, shortest distance, and lowest slope, thereby selecting the most optimal option with respect to transportation costs and emissions reduction. The route analysis identified one suitable route for each of the three impedance factors (time, distance, and slope). Hence, three routes were identified, from which the most cost-effective and emission-reducing was selected.
For the identified routes with the lowest travel time, distance, and slope, the annual fuel-consumption cost and greenhouse gas (GHG) emissions were calculated to determine the optimal route for formal E-waste collection within the prospective integrated E-waste management system. Both primary and secondary data were used for the calculations, given as follows:
- -
- Annual fuel consumption cost
It was calculated for the formal E-waste collection truck, currently used by the collection company (SoliTech). The first step was to estimate the truck’s total resistance, the sum of rolling resistance, aerodynamic drag, and slope resistance. The truck’s total power demand was then calculated, followed by its fuel consumption rate. Finally, the total travel time and fuel cost per liter were used to calculate fuel consumption per collection round, and the annual fuel cost was then calculated. A summary of the variables used in the calculations is provided in Table 3, followed by the formulae employed.
where:
Froll = Rolling resistance (Newtons)
Faero = Aerodynamic drag (Newtons)
Fslope = Slope resistance (ohm)
FT = Total resistance (Newtons)
P = Total power demand (watt)
FCrate = Fuel consumption rate (kg/s)
FCtotal/collr = Total fuel consumption per collection round (liters)
FCcost/y = Fuel consumption cost per year (FCFA/year)
- Annual greenhouse gas (GHG) emissions
It entailed calculating annual carbon dioxide emissions for E-waste collection across the three suitable routes to select the optimal option. GHG emissions per year were calculated for each suitable route using total annual fuel consumption and the GHG emissions per kilogram of diesel combustion. GHG emissions per kilogram of diesel combustion were converted to per-liter emissions, then multiplied by the total annual fuel consumption. The computation is given in Equation (12) below.
where:
GHGtotal/y = Total GHG emissions per year (kg CO2 eq/year)
FCtotal/y = Total fuel consumption per year (liters/year)
DGHG/L = GHG emissions per liter of diesel combustion (kg CO2 eq)
The resultant calculations are shown in the results section.
2.2.4. Calculation of the GHG Emission Reduction Potential in the Waste Sector
This was done in accordance with Cameroon’s Nationally Determined Contribution (NDC) 2030 target, which aims to achieve a 35% conditional reduction in GHG emissions relative to the 2010 base scenario. Given the waste sector as a key domain for mitigation, the calculation aimed to determine the achievable GHG emission reduction in the waste sector resulting from transitioning from the BAU E-waste management system to the prospective IEM system. The calculations were executed following simple proportion principles. It entailed determining the GHG emission quantities from the formal collection percentage in the BAU and IEMS.
First, GHG emissions were calculated for a functional unit (1 ton) of E-waste treatment for both systems, based on data from a previously conducted lifecycle analysis of the E-waste management system in Yaoundé [18]. The GHG emission quantities for 1% formal E-waste treatment in both systems were then calculated and used to estimate the potential annual GHG emissions from formal E-waste treatment in both the current formal collection scenario of the BAU system and the maximized formal collection scenario of the IEM system. Finally, the potential annual GHG emission reduction resulting from transitioning from BAU to the IEM system was calculated. The emission reduction quantity was then factored into the NDC 2030 emission reduction contribution target for the waste sector, to determine the potential contribution percentage of the E-waste management sub-sector. The results are given in the results section.
3. Results
3.1. Annual E-Waste Generation Quantity for Selected Household Appliances
Based on the average lifespan of each type of electronic device, the annual E-waste generation quantity in Yaoundé was calculated to be 6,639,481.19 kg, as shown in Table 4. This quantity represents only the types of E-waste devices investigated in this study. This quantity was calculated based on manufacturers’ standard device lifespans, defined as the time from manufacture to the point at which the devices are expected to cease functioning and be discarded.
3.2. Potential Annual E-Waste Collection Quantity for Selected Household Appliances
The potential quantity of E-waste to be collected was calculated to be 12,063,241.30 kg per year, as shown in Table 5. This value was calculated from survey responses on the expected device usage duration. This quantity exceeds the calculated E-waste generation because the expected service life of the appliances in the surveyed households is shorter than the assumed value. This implies that the currently used electronic devices are expected to be discarded before the manufacturer’s standard lifespan. Therefore, it is likely that a significant amount of E-waste will accumulate in Yaoundé over the next few years. Furthermore, based on the prospective quantity of E-waste for collection, the expected collection rate was estimated at 18.04 kg/household/year.
3.3. Allocated Secondary Collection Points for Maximizing Formal E-Waste Collection Coverage
Of the 79 collection points to be allocated under the current formal collection scheme, 3 were designated as required points. These included the current primary formal collection point (SoliTech) and two existing secondary collection points. From the remaining 76 points (identified electronic repair shops), 8 points were selected as additional secondary collection points to the 3 required points. Hence, the 11 allocated points (1 primary and 10 secondary) are shown in Figure 4 as required and chosen collection points.
3.4. Potential Collection Capacity of the Maximized Formal Collection (MFC) Scenario
As illustrated in Figure 5, the service area analysis of the current formal E-waste collection scenario delineates 5 travel distance ranges from the three formal collection points to the population clusters located around each point. Based on the distance ranges, the population within each distance range around each collection point was determined. Considering the populations reachable within different distance ranges, the number of households was calculated to determine the potential annual quantity of E-waste collected at each formal collection point. The potential annual quantity of E-waste to be collected for the various distance ranges for the current formal collection (CFC) scenario is presented in Table 6.
Regarding the maximized formal collection (MFC) scenario (Figure 6), the maximum formal E-waste collection quantity was calculated in the same manner as given in Table 7. As observed from the results, the maximum formal collection quantity is 4,181,401.40 kg/year for the CFC scenario. In comparison, the MFC scenario yielded 8,860,585.67 kg/year, representing a 52.81% increase in formal E-waste collection coverage. This observation implies that increasing the number of secondary collection points in the city will counteract informal collection volumes and provide a more environmentally friendly pathway for E-waste treatment in Yaoundé.
3.5. Optimal Formal Collection Route for Cost and Emission Reduction
Concerning the optimal formal collection route selection, three suitable routes for formal E-waste collection in Yaoundé were identified through the route analysis. Each route comprises 12 stops beginning from the primary collection point as the first stop. The properties considered for choosing the optimal route included travel time, distance, and slope. The time-optimized route is illustrated in Figure 7, while the distance- and slope-optimized routes are shown in Figure 8 and Figure 9, respectively. The recorded values for the route properties are shown in Table 8. The values indicate the relative efficiencies of the suitable routes based on E-waste collection costs and GHG emissions.
Considering the aim of reducing formal E-waste collection costs, Route 1 (time-optimized) was found to procure the lowest annual fuel consumption cost, at 2,074,553.15 FCFA. Additionally, Route 1 also produced the lowest annual GHG emissions at 6,714.74 kg CO2 eq, compared with Routes 2 and 3. Therefore, Route 1 was designated as the optimum route for both cost and emission reduction in the maximized formal collection scenario. This implies that optimizing travel time for formal E-waste collection under the prospective integrated E-waste management system would be both economically and environmentally beneficial for the formal E-waste collection company in Yaoundé. This conclusion is supported by findings from similar studies, which advocate enhancing formal E-waste collection systems [69,70].
3.6. Potential GHG Emission Reduction Contribution to the 2030 NDC Target for the Waste Sector
The potential GHG emission reduction contribution to the 2030 nationally determined contributions (NDC) target in the waste sector was calculated to be 82,050,987.98 kg CO2 eq. This emission reduction can be achieved by transitioning from the current formal collection (CFC) scenario under the BAU E-waste management system to the maximized formal collection (MFC) scenario proposed for the IEM system. The achievable emission reduction proportion via the transition was estimated at 13.83%, as shown in Table 9. Furthermore, with respect to the contribution to the NDC 2030 target in the waste sector, 3.04% would be achieved through the proposed transition in the E-waste management system. It should be noted that this contribution percentage applies only to the selected electronic appliances investigated in this study. Hence, even more could be achieved by extending the maximized formal collection system to other types of electronic devices. Hence, recommendations for transitioning Cameroon’s E-waste management system must be carefully considered to gain the benefits of an integrated management system while building sustainable cities.
4. Discussion
The results of this study indicate that Yaoundé generates about 6.6 million kg of E-waste annually, based on manufacturers’ lifespans. However, the survey data suggest a potential annual collection quantity of over 12 million kg. This discrepancy indicates that households in Yaoundé discard devices much faster than manufacturers predict. Therefore, regarding E-waste disposal rates, rapid electronics turnover is common in developing urban centers, where second-hand goods often have shorter remaining functional lives. Similar patterns have been observed in other West African contexts, where the actual waste stream often doubles theoretical estimates due to the influx of used electronic equipment [71,72].
Furthermore, the estimated E-waste collection rate of 18.04 kg per household per year in Yaoundé highlights a significant opportunity for formal E-waste management. The transition from the current formal collection (CFC) scenario to the maximized formal collection (MFC) scenario resulted in a 52.81% increase in collection coverage. Hence, by integrating existing electronic repair shops as secondary collection points, the system captures a larger volume of waste that would otherwise enter the informal sector. This strategy aligns with findings from studies in Ghana and Nigeria, which suggest that formalizing informal networks through designated drop-off points reduces hazardous processing methods [73,74].
Subsequently, based on the route optimization analysis, travel time was identified as the most critical factor for both economic and environmental efficiency. Route 1 resulted in the lowest fuel costs and the lowest greenhouse gas (GHG) emissions. This confirms that reducing idling and transit time in congested urban environments is more effective than simply minimizing physical distance. Previous research on municipal solid waste logistics supports this, noting that time-based optimization significantly lowers the carbon footprint of collection fleets [75].
With respect to the environmental implications of this study, the proposed MFC scenario would contribute 13.83% to emissions reductions in the E-waste sector. More importantly, this transition accounts for 3.04% of Cameroon’s total 2030 Nationally Determined Contributions (NDC) target for the waste sector. These figures are conservative because they account only for the specific devices investigated. However, expanding the scope to include all electronic categories would likely yield a substantially greater contribution to national climate goals.
Finally, future studies should expand the scope of investigated devices to include large household appliances and other electronic equipment. This would provide a more holistic view of the total E-waste burden in Cameroon. Furthermore, studies should investigate the socio-economic barriers that prevent households from using formal collection points despite their proximity. Additionally, understanding consumer behavior and the incentive structures of the informal sector is necessary for the long-term sustainability of the E-waste management system in Cameroon.
5. Conclusions
This study aimed to maximize formal E-waste collection coverage in Yaoundé by implementing a prospective integrated E-waste management system proposed in a previous study. The study’s justification aimed to increase formal E-waste collection coverage following a transition from the BAU E-waste management system to the proposed IEM system. This assessment entailed investigating five research questions. The assessment resulting in calculating the annual E-waste generation quantity for the survey-based selected household electronic appliances in Yaoundé, calculating the annual potential collection quantity for the selected electronic appliances, allocating suitable secondary collection points for maximizing formal E-waste collection coverage, calculating the maximum collection capacity of the maximized formal collection scenario, determining the optimal formal collection route for cost and emission reduction, and calculating the GHG emission reduction potential in the waste sector, following the 2030 NDC target.
First, the annual E-waste generation for the investigated electronic devices was calculated to be 6,639,481.19 kg/year. Consequently, based on lower expected usage durations than the standard manufacturer’s assigned appliance life span for the various devices, the potential annual E-waste collection quantity was estimated at 12,063,241.30 kg, implying an expected E-waste collection rate of 18.04 kg/household/year. The following step allocated secondary collection points to maximize formal E-waste collection coverage in Yaoundé using ArcGIS’ location-allocation analysis. The potential maximum collection capacity was calculated for both the current formal collection (CFC) scenario, with 3 formal collection points, and the maximized formal collection (MFC) scenario, with 11 formal collection points. A comparative analysis indicated that the potential maximum collection quantity in the MFC scenario exceeded that in the CFC scenario by 52.81%, thereby confirming the need to expand secondary collection points to increase formal E-waste collection in the city.
Subsequently, a route analysis was conducted to determine the optimal formal E-waste collection route in Yaoundé, based on the potential for cost savings and GHG emission reductions. The most viable of the three options was Route 1, which optimized collection travel time. The cumulative time from the primary collection point through all secondary collection points and back to the starting point was 38.67 minutes per collection round. The cumulated distance was 43 km, and the route average slope was calculated to be 4.70 degrees. Concerning collection costs, Route 1 proved to be the most cost-effective, with the least fuel consumption cost calculated at 2,074,553.15 FCFA/year. Furthermore, GHG emissions of 6,714.74 kg CO2 eq/year for E-waste collection following Route 1 were the least, compared to Routes 2 and 3. This observation implies that optimizing travel time for formal E-waste collection proves more effective for achieving a more sustainable and cost-saving E-waste management system. Lastly, the potential contribution of GHG emission reductions to the 2030 nationally determined contributions (NDC) target for the waste sector was calculated. The GHG emission reduction achieved by transitioning from the BAU E-waste management system to the IEM system was 82,050,987.98 kg CO2 eq, representing a 13.83% reduction. This reduction subsequently accounted for a 3.04% contribution to the NDC 2030 target for GHG emissions reduction in the waste sector.
Finally, the study’s findings are relevant to minimizing the adverse economic and environmental impacts of the predominant informal E-waste treatment scenario, which operates under the current business-as-usual E-waste management system. These findings illustrate that spatially optimized formal E-waste collection systems not only improve logistical efficiency but also provide a viable pathway to align with national climate policy. The incorporation of GIS-based planning into E-waste management thus provides a dual advantage: operational cost savings and quantifiable climate benefits. For policymakers, this underscores the critical need for infrastructural expansion and the utilization of digital planning tools to foster sustainable E-waste governance in Cameroon.
Author Contributions
Conceptualization, Y.E.; methodology, Y.E., H.Y.; investigation, Y.E.; formal analysis, Y.E., H.Y.; writing—original draft; Y.E.; writing—review and editing, Y.E.; supervision, H.Y. All authors have read and agreed to the published version of the manuscript.
Funding
This research received no external funding.
Institutional Review Board Statement
Not applicable to this study.
Informed Consent Statement
Not applicable to this study.
Data Availability Statement
All data are reported in this work.
Acknowledgments
The authors are grateful for Helmut Yabar’s supervision and orienting guidance. We also appreciate the University of Tsukuba, the Graduate School of Science and Technology, and the Department of Life and Environmental Sciences for providing a conducive study environment with all the necessary equipment. We thank the administrators of Solidarité Technologique Yaoundé for granting access to all essential data required for the research. Finally, we appreciate all survey respondents for providing valuable data for this research.
Conflicts of Interest
The authors declare no conflicts of interest.
References
- Holuszko, M.E.; Kumar, A.; Espinosa, D.C.R. Electronic Waste: Recycling and Reprocessing for a Sustainable Future, 1st ed.; Wiley-VCH GmbH: Weinheim, Germany, 2022; ISBN 9783527816392. [Google Scholar]
- Serpe, A.; Purchase, D.; Bisschop, L.; Chatterjee, D.; De Gioannis, G.; Garelick, H.; et al. 2002-2022: 20 years of e-waste regulation in the European Union and the worldwide trends in legislation and innovation technologies for a circular economy. RSC Sustain. 2025, 3, 1039–1083. [Google Scholar] [CrossRef]
- Baldé, C.P.; Kuehr, R.; Yamamoto, T.; McDonald, R.; D’Angelo, E.; Althaf, S.; et al. Global E-waste Monitor 2024; International Telecommunication Union (ITU): Geneva, Switzerland, 2024. [Google Scholar]
- Shahabuddin, M.; Uddin, M.N.; Chowdhury, J.I.; Ahmed, S.F.; Uddin, M.N.; Mofijur, M.; et al. A review of the recent development, challenges, and opportunities of electronic waste (E-waste). Int. J. Environ. Sci. Technol. 2023, 20, 4513–4520. [Google Scholar] [CrossRef]
- Agbondinmwin, W.O. Flows of Waste and Secondhand Items from Developed to Developing Countries: A Case Study of E-Wastes in Nigeria and China. Master’s Thesis, University of Gothenburg, Gothenburg, Sweden, 2024. [Google Scholar]
- Andeobu, L.; Wibowo, S.; Grandhi, S. Environmental and health consequences of e-waste dumping and recycling carried out by selected countries in Asia and Latin America. Sustainability 2023, 15, 10405. [Google Scholar] [CrossRef]
- Noah, A.O.; David, O.O.; Osakwe, C.N. Electronic waste effects of ICT: does income level matter? Discov. Sustain. 2025, 6, 412. [Google Scholar] [CrossRef]
- Dias, P.; Bernardes, A.M.; Huda, N. E-waste management and practices in developed and developing countries. In Electronic Waste, 1st ed.; Holuszko, M.E., Kumar, A., Espinosa, D.C.R., Eds.; Wiley: Hoboken, NJ, USA, 2022; pp. 15–32. [Google Scholar] [CrossRef]
- Nandan, A.; Suresh, A.; Saole, P.; Jeevanasai, S.; Chandrasekaran, R.; Meili, L.; et al. An integrated approach for electronic waste management: Overview of sources of generation, toxicological effects, assessment, governance, and mitigation approaches. Sustainability 2023, 15, 16946. [Google Scholar] [CrossRef]
- Bimir, M.N. Revisiting e-waste management practices in selected African countries. J. Air Waste Manag. Assoc. 2020, 70, 659–669. [Google Scholar] [CrossRef]
- Dutta, D.; Goel, S. Understanding the gap between formal and informal e-waste recycling facilities in India. Waste Manag. 2021, 125, 163–171. [Google Scholar] [CrossRef]
- Grant, K.; Goldizen, F.C.; Sly, P.D.; Brune, M.N.; Neira, M.; van den Berg, M.; et al. Health consequences of exposure to e-waste: A systematic review. Lancet Glob. Health 2013, 1, e350–e361. [Google Scholar] [CrossRef] [PubMed]
- Ádám, B.; Göen, T.; Scheepers, P.T.J.; Adliene, D.; Batinic, B.; Budnik, L.T.; et al. From inequitable to sustainable e-waste processing for reduction of impact on human health and the environment. Environ. Res. 2021, 194, 110728. [Google Scholar] [CrossRef] [PubMed]
- Sengupta, D.; Ilankoon, I.M.S.K.; Dean Kang, K.; Nan Chong, M. Circular economy and household e-waste management in India: Integration of formal and informal sectors. Miner. Eng. 2022, 184, 107661. [Google Scholar] [CrossRef]
- Macrotrends. Cameroon Population (1950-2025). Available online: https://www.macrotrends.net/global-metrics/countries/cmr/cameroon/population (accessed on 27 January 2026).
- Röschenthaler, U. Chinese-manufactured commodities and African agency in the democratization of consumption: The example of electronic devices in Cameroon. Crit. Afr. Stud. 2023, 15, 53–72. [Google Scholar] [CrossRef]
- Egeonu, N.; Herat, S. E-waste: A problem or an opportunity? Review of issues, challenges and solutions in African countries. Int. J. Environ. Waste Manag. 2016, 17, 318–334. [Google Scholar] [CrossRef]
- Esopere, Y.; Yabar, H.; Mizunoya, T.; Richards, D. Leveraging life cycle assessment and system dynamics model analysis for an integrated household e-waste management system in Yaoundé, Cameroon. Urban Sci. 2024, 8, 77. [Google Scholar] [CrossRef]
- Ngnikam, E.; Naquin, P.; Oumbe, R.; Djietcheu, K.B. Evolution of household solid waste characteristics in Yaoundé city, Cameroon (1995-2015). Environ. Ing. Dév 2017, 74. [Google Scholar] [CrossRef]
- Insider, African. Cameroon’s Electronic Waste Recyclers Struggle Despite Historic Law. Available online: https://www.africaninsider.com/news/cameroons-electronic-waste-recyclers-struggle-despite-historic-law/ (accessed on 21 September 2025).
- Kazancoglu, Y.; Ozbiltekin, M.; Ozkan Ozen, Y.D.; Sagnak, M. A proposed sustainable and digital collection and classification center model to manage e-waste in emerging economies. J. Enterp. Inf. Manag. 2021, 34, 267–291. [Google Scholar] [CrossRef]
- Nowakowski, P.; Szwarc, K.; Boryczka, U. Combining an artificial intelligence algorithm and a novel vehicle for sustainable e-waste collection. Sci. Total Environ. 2020, 730, 138726. [Google Scholar] [CrossRef] [PubMed]
- Selvakanmani, S.; Rajeswari, P.; Krishna, B.V.; Manikandan, J. Optimizing e-waste management: Deep learning classifiers for effective planning. J. Clean. Prod. 2024, 443, 141021. [Google Scholar] [CrossRef]
- Kumar Singh, S.; Chauhan, A.; Sarkar, B. Supply chain management of e-waste for end-of-life electronic products with reverse logistics. Mathematics 2022, 11, 124. [Google Scholar] [CrossRef]
- Ni, Z.; Chan, H.K.; Tan, Z. Systematic literature review of reverse logistics for e-waste: Overview, analysis, and future research agenda. Int. J. Logist. Res. Appl. 2023, 26, 843–871. [Google Scholar] [CrossRef]
- Demirel, E.; Demirel, N.; Gökçen, H. A mixed integer linear programming model to optimize reverse logistics activities of end-of-life vehicles in Turkey. J. Clean. Prod. 2016, 112, 2101–2113. [Google Scholar] [CrossRef]
- González-Reséndiz, J.; Arredondo-Soto, K.C.; Realyvásquez-Vargas, A.; Híjar-Rivera, H.; Carrillo-Gutiérrez, T. Integrating simulation-based optimization for lean logistics: A case study. Appl. Sci. 2018, 8, 2448. [Google Scholar] [CrossRef]
- Cao, D.; Puntaier, E.; Gillani, F.; Chapman, D.; Dewitt, S. Towards integrative multi-stakeholder responsibility for net zero in e-waste: A systematic literature review. Bus. Strat. Environ. 2024, 33, 8994–9014. [Google Scholar] [CrossRef]
- Pongajow, V.; Qin, Y.; Xu, K.; Liu, S. Stakeholder perspectives on extended producer responsibility (EPR) and e-waste management: A case study of China. J. Environ. Sci. Sustain. Dev. 2025, 8, 11. [Google Scholar] [CrossRef]
- Ikhlayel, M. An integrated approach to establish e-waste management systems for developing countries. J. Clean. Prod. 2018, 170, 119–130. [Google Scholar] [CrossRef]
- Han, H.; Ponce Cueto, E. Waste collection vehicle routing problem: Literature review. Promet Traffic Transp. 2015, 27, 345–358. [Google Scholar] [CrossRef]
- Bale, D.; Ugwu, C.; Nwachukwu, E. Route optimization techniques: An overview. Int. J. Sci. Eng. Res. 2016, 7, 1367–1372. [Google Scholar]
- Liang, Y.C.; Minanda, V.; Gunawan, A. Waste collection routing problem: A mini-review of recent heuristic approaches and applications. Waste Manag. Res. 2022, 40, 519–537. [Google Scholar] [CrossRef] [PubMed]
- Hannan, M.; Lipu, M.H.; Akhtar, M.; Begum, R.; Al Mamun, M.A.; Hussain, A.; et al. Solid waste collection optimization objectives, constraints, modeling approaches, and their challenges toward achieving sustainable development goals. J. Clean. Prod. 2020, 277, 123557. [Google Scholar] [CrossRef]
- Rathore, P.; Sarmah, S.P. Modeling transfer station locations considering source separation of solid waste in urban centers: A case study of Bilaspur city, India. J. Clean. Prod. 2019, 211, 44–60. [Google Scholar] [CrossRef]
- Abdallah, M.; Adghim, M.; Maraqa, M.; Aldahab, E. Simulation and optimization of dynamic waste collection routes. Waste Manag. Res. 2019, 37, 793–802. [Google Scholar] [CrossRef]
- Nguyen-Trong, K.; Nguyen-Thi-Ngoc, A.; Nguyen-Ngoc, D.; Dinh-Thi-Hai, V. Optimization of municipal solid waste transportation by integrating GIS analysis, equation-based, and agent-based model. Waste Manag. 2017, 59, 14–22. [Google Scholar] [CrossRef]
- Pourreza Movahed, Z.; Kabiri, M.; Ranjbar, S.; Joda, F. Multi-objective optimization of life cycle assessment of integrated waste management based on genetic algorithms: A case study of Tehran. J. Clean. Prod. 2020, 247, 119153. [Google Scholar] [CrossRef]
- Mantzaras, G.; Voudrias, E.A. An optimization model for collection, haul, transfer, treatment, and disposal of infectious medical waste: Application to a Greek region. Waste Manag. 2017, 69, 518–534. [Google Scholar] [CrossRef] [PubMed]
- Ferri, G.L.; Diniz Chaves, G.D.L.; Ribeiro, G.M. Reverse logistics network for municipal solid waste management: The inclusion of waste pickers as a Brazilian legal requirement. Waste Manag. 2015, 40, 173–191. [Google Scholar] [CrossRef] [PubMed]
- Mohsenizadeh, M.; Tural, M.K.; Kentel, E. Municipal solid waste management with cost minimization and emission control objectives: A case study of Ankara. Sustain. Cities Soc. 2020, 52, 101807. [Google Scholar] [CrossRef]
- Lyeme, H.A.; Mushi, A.; Nkansah-Gyekye, Y. Implementation of a goal programming model for solid waste management: A case study of Dar es Salaam-Tanzania. Int. J. Simul. Multisci. Des. Optim. 2017, 8, A2. [Google Scholar] [CrossRef]
- Hemidat, S.; Oelgemöller, D.; Nassour, A.; Nelles, M. Evaluation of key indicators of waste collection using GIS techniques as a planning and control tool for route optimization. Waste Biomass Valor 2017, 8, 1533–1554. [Google Scholar] [CrossRef]
- Sulemana, A.; Donkor, E.A.; Forkuo, E.K.; Asantewaa, J.; Ankrah, I.N.A.; Musah, A.M.O. Optimized routing of trucks for institutional solid waste collection in Kumasi Ghana. Detritus 2020, 9, 50–58. [Google Scholar] [CrossRef]
- Amal, L.; Son, L.H.; Chabchoub, H.; Lahiani, H. Analysis of municipal solid waste collection using GIS and multi-criteria decision aid. Appl. Geomat. 2020, 12, 193–208. [Google Scholar] [CrossRef]
- Kinobe, J.R.; Bosona, T.; Gebresenbet, G.; Niwagaba, C.B.; Vinnerås, B. Optimization of waste collection and disposal in Kampala city. Habitat Int. 2015, 49, 126–137. [Google Scholar] [CrossRef]
- Malakahmad, A.; Bakri, P.M.; Mokhtar, M.R.M.; Khalil, N. Solid waste collection routes optimization via GIS techniques in Ipoh city, Malaysia. Procedia Eng. 2014, 77, 20–27. [Google Scholar] [CrossRef]
- Zsigraiova, Z.; Semiao, V.; Beijoco, F. Operation costs and pollutant emissions reduction by definition of new collection scheduling and optimization of MSW collection routes using GIS. The case study of Barreiro, Portugal. Waste Manag. 2013, 33, 793–806. [Google Scholar] [CrossRef] [PubMed]
- Tchoupou, A.D.; Ngnikam, E.; Yelkouni, M. Contribution à l’amélioration de la gestion des déchets d’équipements électriques et électroniques ménagers au Cameroun: Cas de la ville de Douala. Environ. Ing. Dév 2017, 73, 77–84. [Google Scholar] [CrossRef]
- Tsamo, C. E-waste assessment in Cameroon. Case study: Town of Maroua. Int. J. ChemTech Res. 2014, 6, 681–690. [Google Scholar]
- Desk, N. Cameroon Has the Highest ICT Penetration in the CEMAC Region. Available online: https://trendsnafrica.com/cameroon-has-the-highest-ict-penetration-in-the-cemac-region/ (accessed on 24 September 2025).
- Macrotrends. Cameroon Population 1950-2024. Available online: https://www.macrotrends.net/global-metrics/countries/CMR/cameroon/population (accessed on 23 April 2024).
- NIS. Quatrième Enquête Camerounaise Auprès des Ménages Tendances, Profil et Déterminants de la Pauvreté au Cameroun Entre 2001-2014; Cameroon National Institute of Statistics: Yaoundé, Cameroon, 2015; p. 72. [Google Scholar]
- Adam, A.M. Sample size determination in survey research. J. Sci. Res. Rep. 2020, 90–97. [Google Scholar] [CrossRef]
- Mukherjee, S.; Sinha, B.K.; Chattopadhyay, A.K. Statistical Methods in Social Science Research; Springer: Berlin/Heidelberg, Germany, 2018. [Google Scholar]
- Ikhlayel, M. Differences of methods to estimate generation of waste electrical and electronic equipment for developing countries: Jordan as a case study. Resour. Conserv. Recycl. 2016, 108, 134–139. [Google Scholar] [CrossRef]
- ESRI. Location Allocation Analysis. ArcMap Documentation. Available online: https://desktop.arcgis.com/en/arcmap/latest/extensions/network-analyst/location-allocation.htm (accessed on 30 September 2025).
- ESRI. Service Area Analysis. ArcMap Documentation. Available online: https://desktop.arcgis.com/en/arcmap/latest/extensions/network-analyst/service-area.htm (accessed on 2 October 2025).
- Logistics, Cluster. Cameroon Fuel: Digital Logistics Capacity Assessments. Available online: https://lca.logcluster.org/31-cameroon-fuel (accessed on 4 October 2025).
- Malik, C. HGV Payload Size and Weight Limits. Available online: https://www.reddit.com/r/uktrucking/comments/pgdzly/anyone_know_the_hgv_payload_size_and_weight_limits/ (accessed on 4 October 2025).
- Fontaras, G.; Zacharof, N.G.; Ciuffo, B. Fuel consumption and CO₂ emissions from passenger cars in Europe-Laboratory versus real-world emissions. Prog. Energy Combust. Sci. 2017, 60, 97–131. [Google Scholar] [CrossRef]
- Chowdhury, H.; Moria, H.; Ali, A.; Khan, I.; Alam, F.; Watkins, S. A study on aerodynamic drag of a semi-trailer truck. Procedia Eng. 2013, 56, 201–205. [Google Scholar] [CrossRef]
- ILS. Typical Trailer Dimensions & Equipment. Available online: https://www.ilscompany.com/trailer-dimensions/ (accessed on 4 October 2025).
- Hulio, Z.H.; Jiang, W.; Rehman, S. Techno-economic assessment of wind power potential of Hawke’s Bay using Weibull parameter: A review. Energy Strateg. Rev. 2019, 26, 100375. [Google Scholar] [CrossRef]
- Johannes, W.J.; Smilde, P.L. Fundamentals of gravity, elements of potential theory. In Gravity Interpretation; Springer: Berlin/Heidelberg, Germany, 2009; pp. 23–111. [Google Scholar] [CrossRef]
- Betiha, M.A.; Rabie, A.M.; Ahmed, H.S.; Abdelrahman, A.A.; El-Shahat, M.F. Oxidative desulfurization using graphene and its composites for fuel containing thiophene and its derivatives: An update review. Egypt. J. Pet. 2018, 27, 715–730. [Google Scholar] [CrossRef]
- WNA. Heat Values of Various Fuels. Available online: https://world-nuclear.org/information-library/facts-and-figures/heat-values-of-various-fuels (accessed on 4 October 2025).
- Diesel, DFC. Diesel Engine Rebuilder in Canada and the USA. Available online: https://dfcdiesel.com/ (accessed on 4 October 2025).
- Batoo, K.M.; Pandiaraj, S.; Muthuramamoorthy, M.; Raslan, E.H.; Krishnamoorthy, S. Behavior-based swarm model using fuzzy controller for route planning and e-waste collection. Environ. Sci. Pollut. Res. 2022, 29, 19940–19954. [Google Scholar] [CrossRef]
- Hannan, M.A.; Akhtar, M.; Begum, R.A.; Basri, H.; Hussain, A.; Scavino, E. Capacitated vehicle-routing problem model for scheduled solid waste collection and route optimization using PSO algorithm. Waste Manag. 2018, 71, 31–41. [Google Scholar] [CrossRef] [PubMed]
- Abalansa, S.; El Mahrad, B.; Icely, J.; Newton, A. Electronic waste, an environmental problem exported to developing countries: The good, the bad, and the ugly. Sustainability 2021, 13, 5302. [Google Scholar] [CrossRef]
- Moletsane, R.I.; Venter, C. Transboundary movement of electronic waste, issues and challenges in African countries. In Proceedings of the 2018 International Conference on Advances in Big Data, Computing and Data Communication Systems, Durban, South Africa, 6-7 August 2018; IEEE: Piscataway, NJ, USA, 2018; pp. 1–6. [Google Scholar] [CrossRef]
- Asante, K.A.; Amoyaw-Osei, Y.; Agusa, T. E-waste recycling in Africa: Risks and opportunities. Curr. Opin. Green Sustain. Chem. 2019, 18, 109–117. [Google Scholar] [CrossRef]
- Issah, I.; Arko-Mensah, J.; Agyekum, T.P.; Dwomoh, D.; Fobil, J.N. Health risks associated with informal electronic waste recycling in Africa: A systematic review. Int. J. Environ. Res. Public Health 2022, 19, 14278. [Google Scholar] [CrossRef]
- Restrepo-Franco, A.M.; Valencia-Rodríguez, O.; Toro-Ocampo, E.M. The vehicle routing problem as applied to residential solid waste collection operations: Systematic review. Waste Manag 2024. [Google Scholar] [CrossRef]
Figure 1.
Current BAU E-waste management system in Yaoundé.
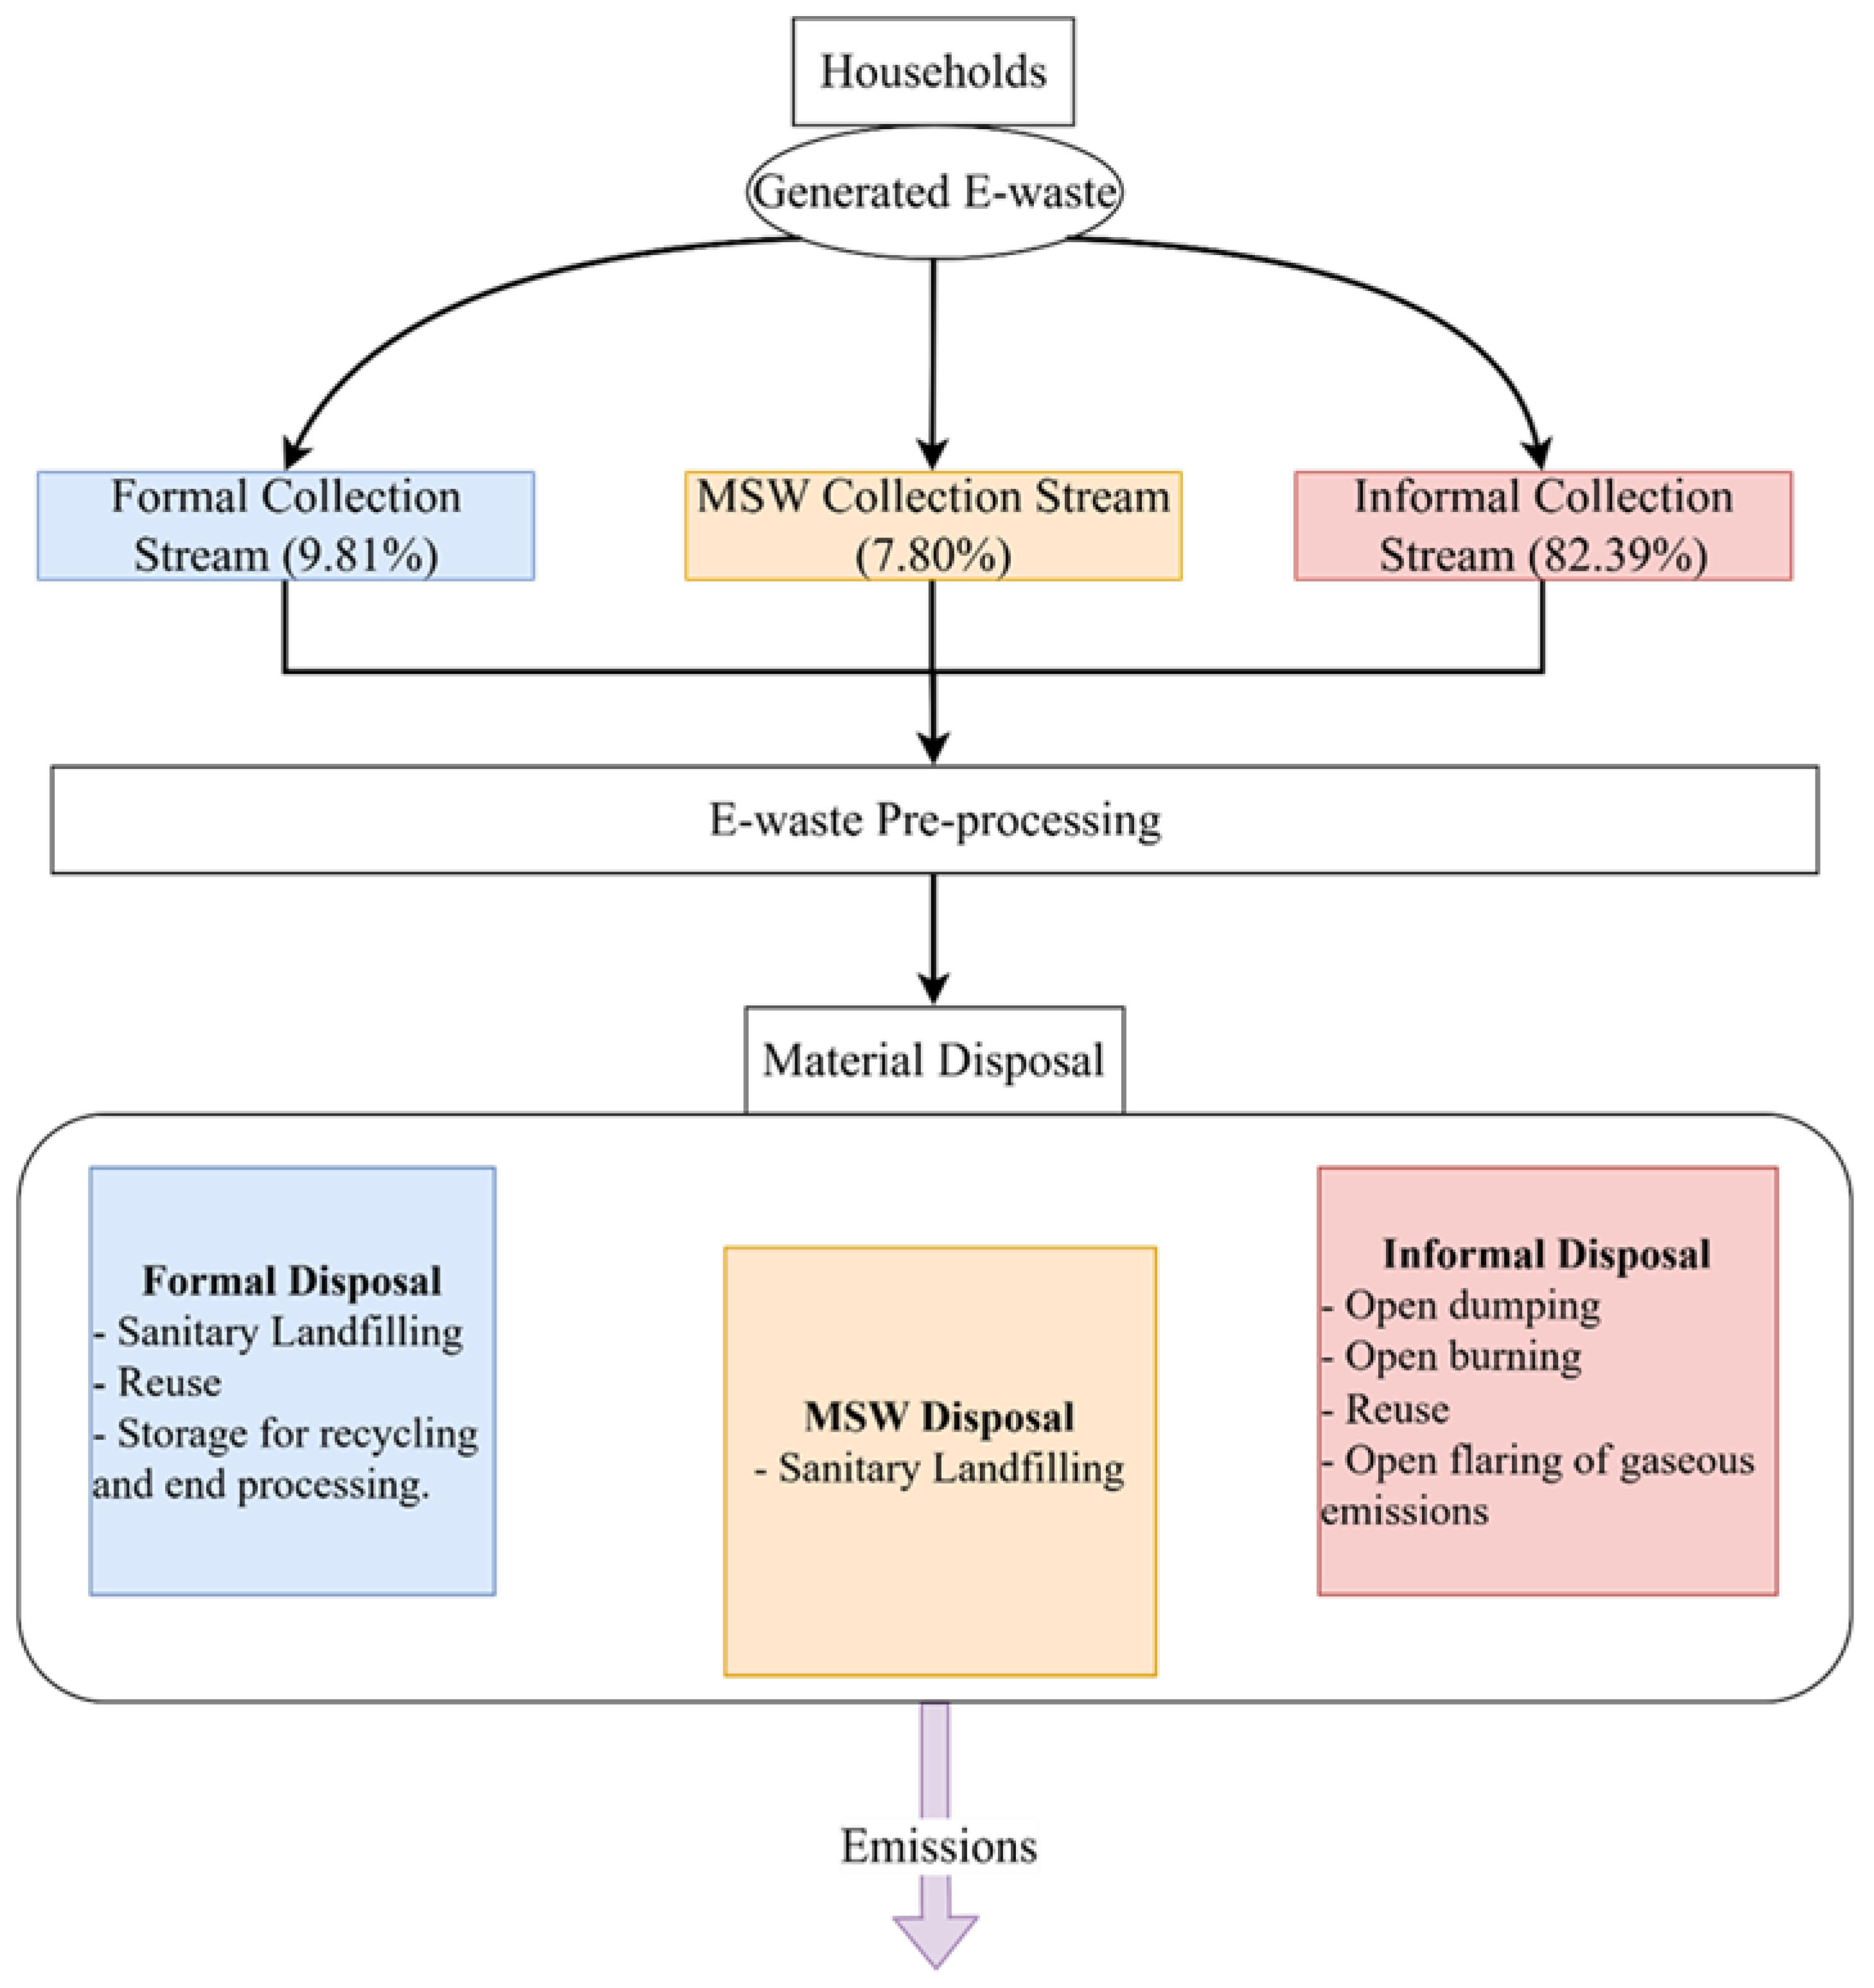
Figure 2.
Prospective IEM system in Yaoundé.
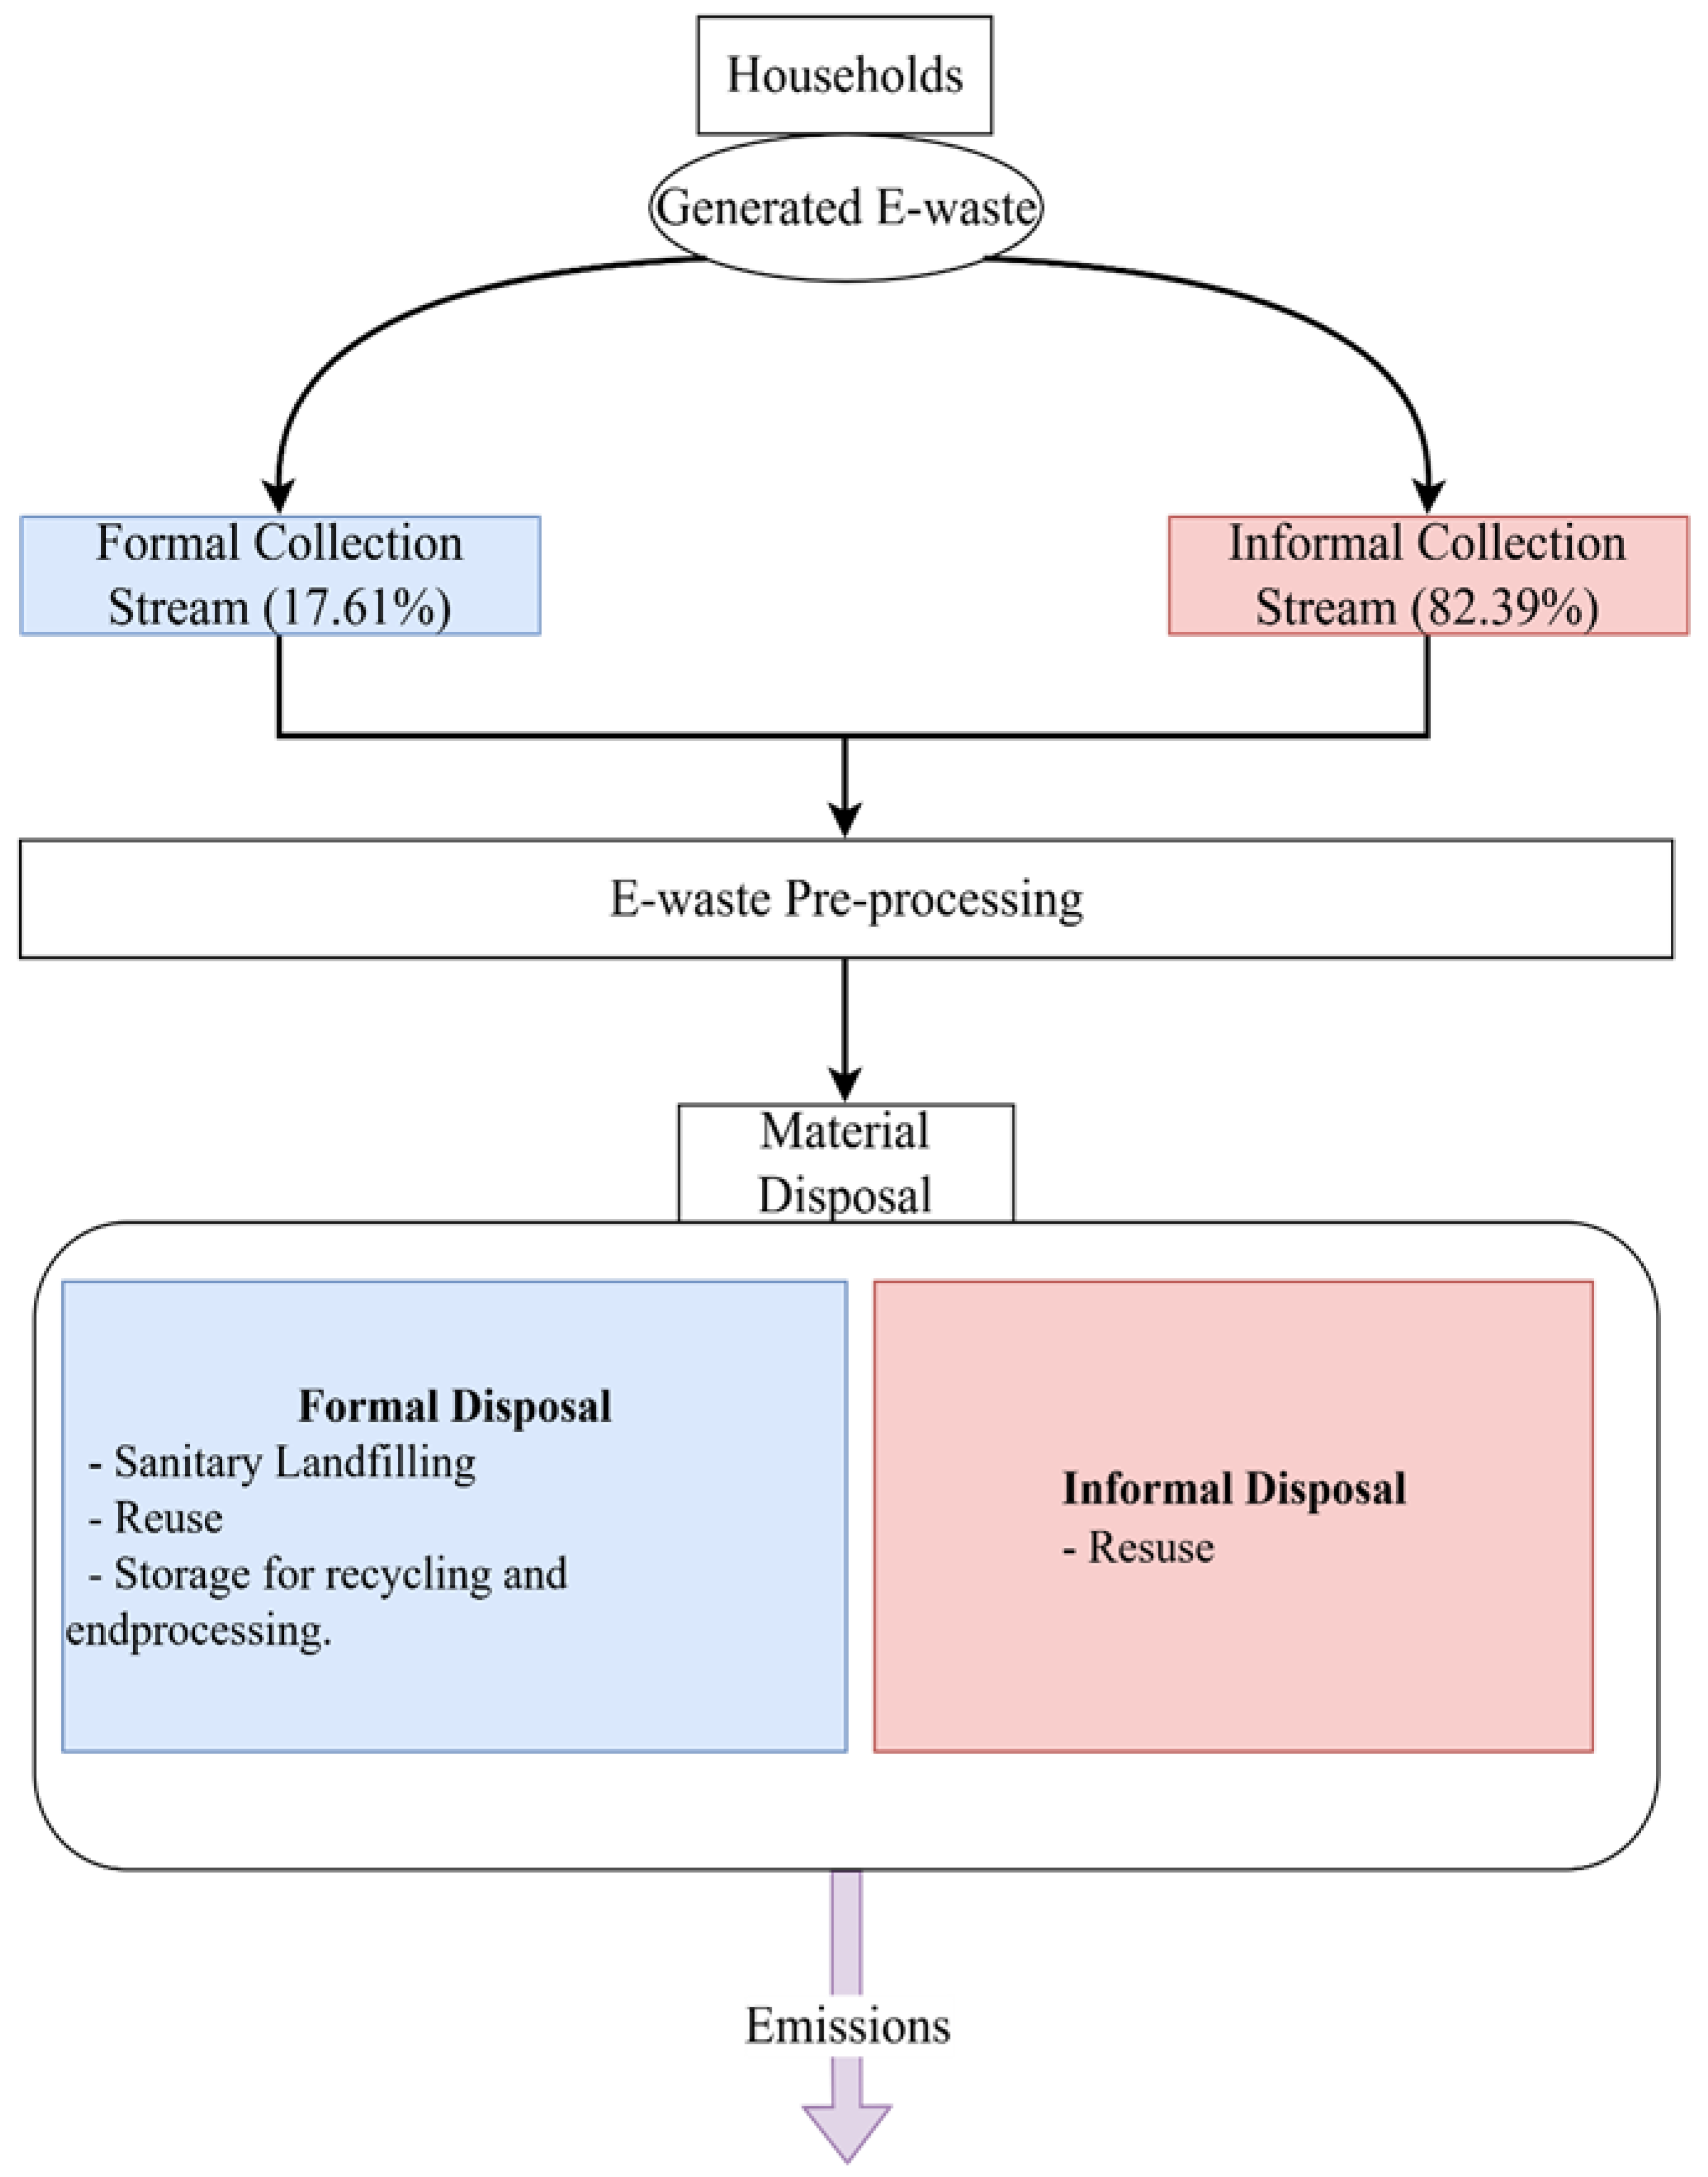
Figure 3.
Formal E-waste collection system optimization in Yaoundé.
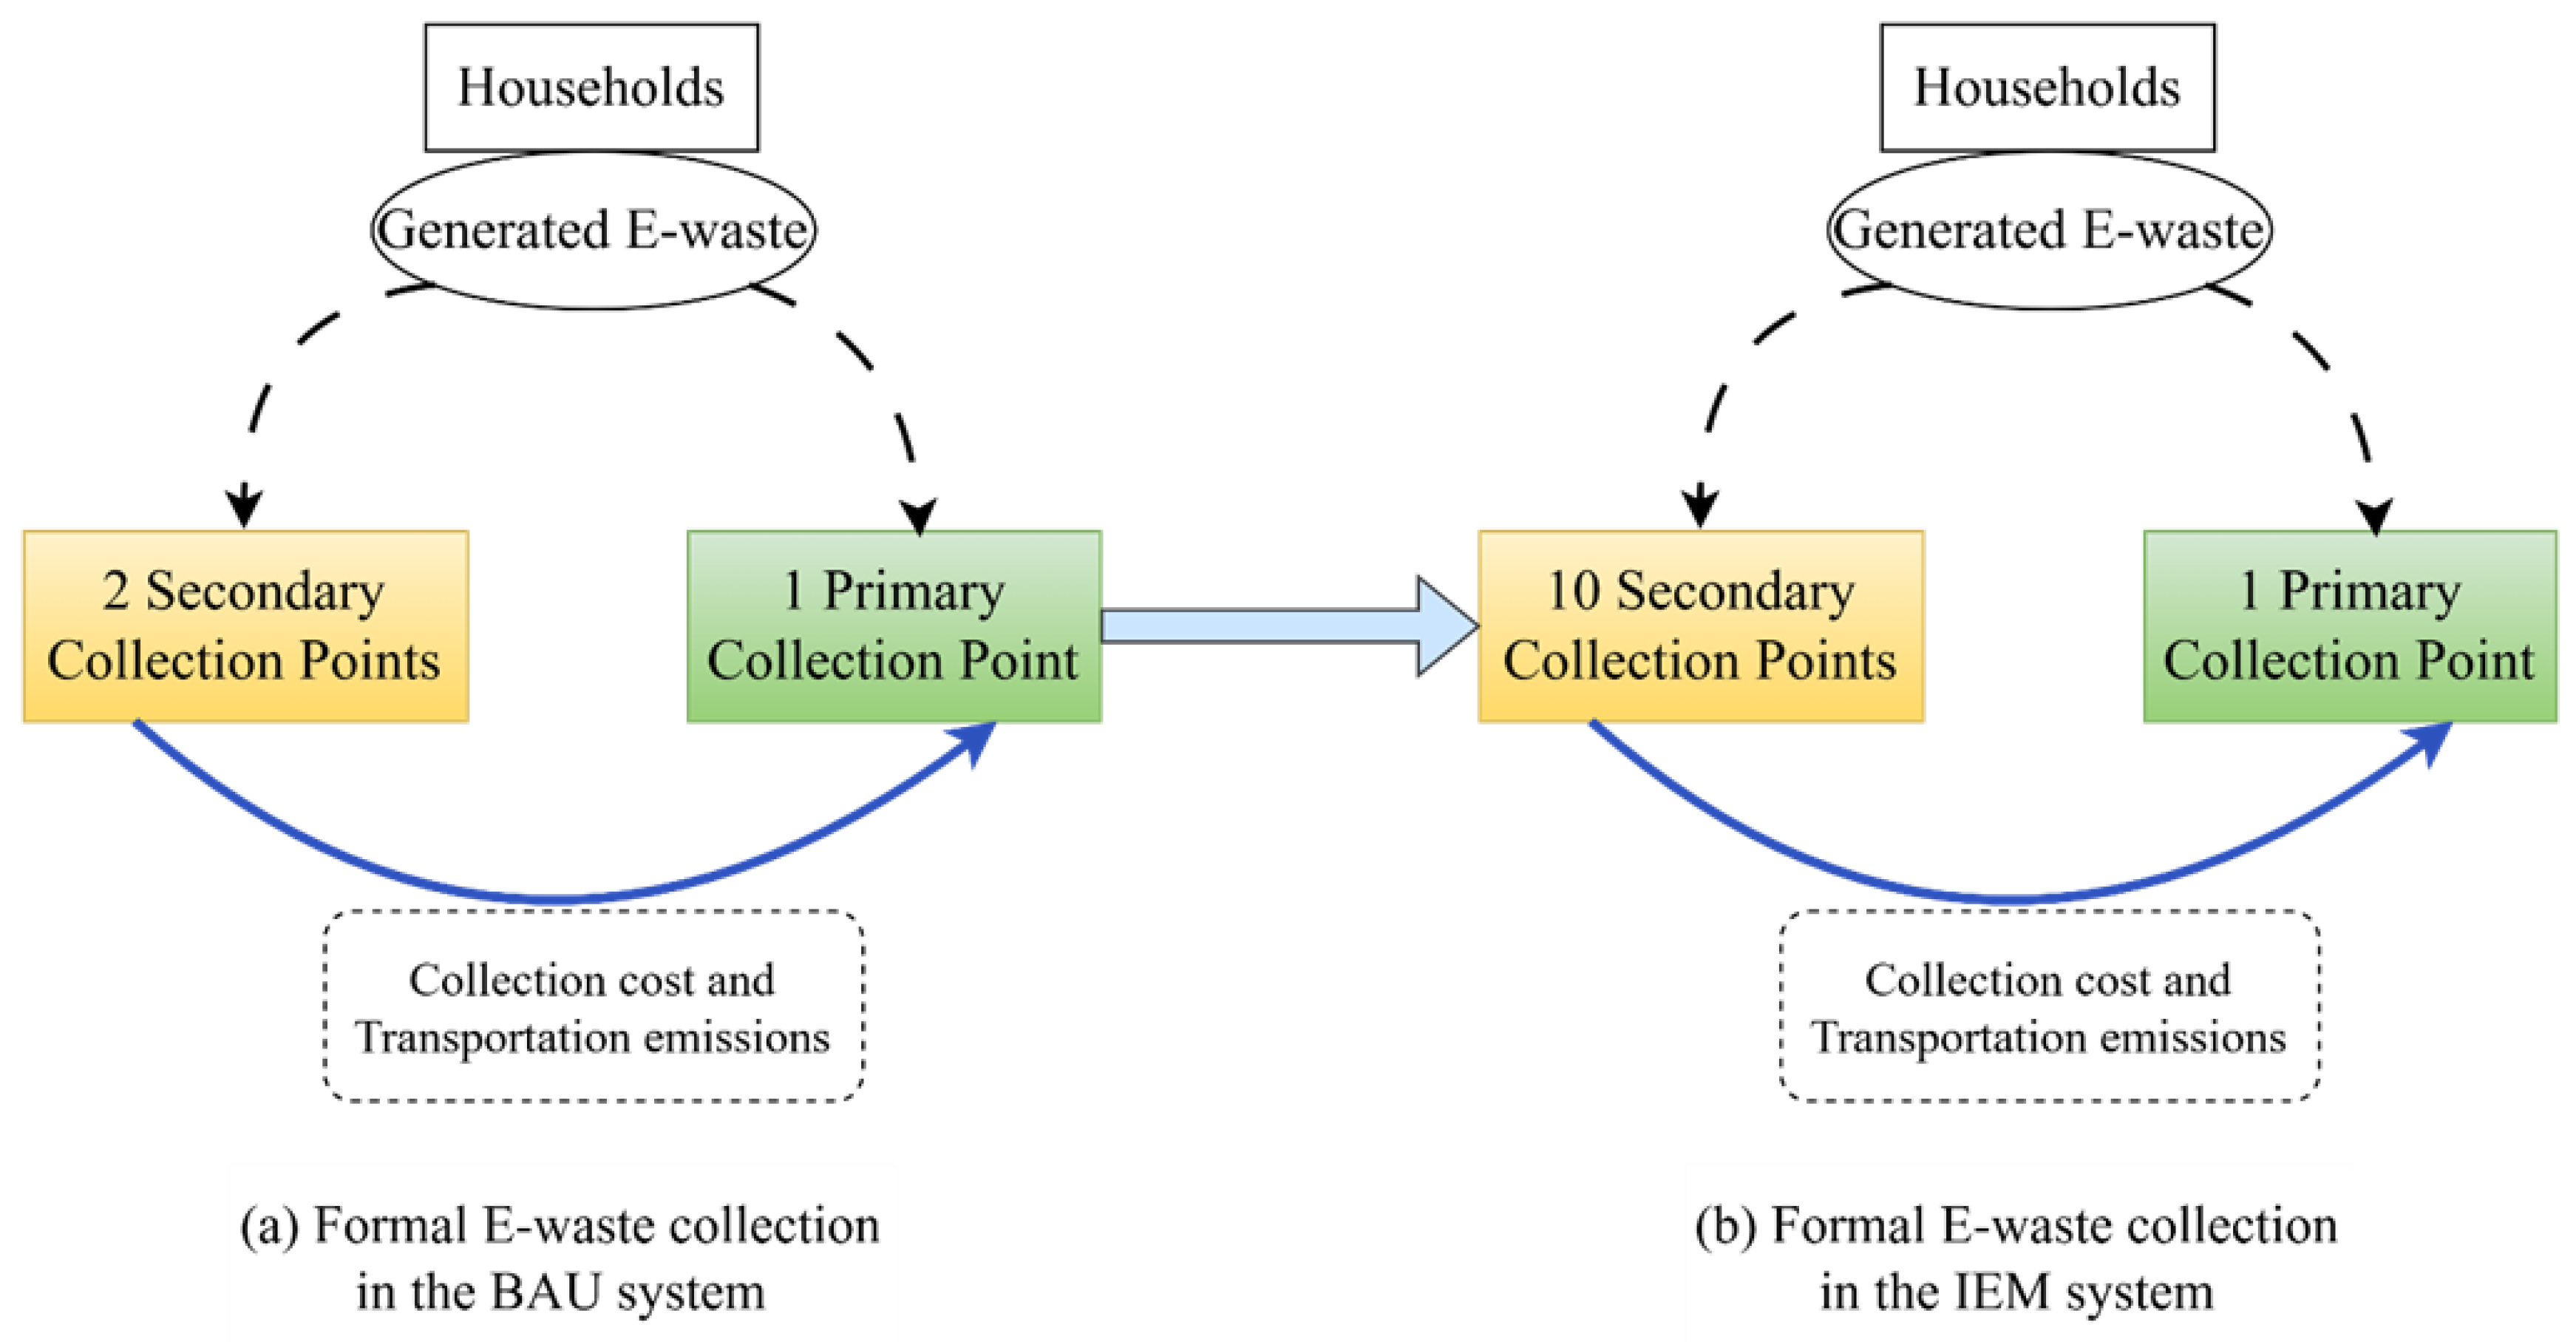
Figure 4.
Allocated secondary collection points for maximizing formal E-waste collection coverage.
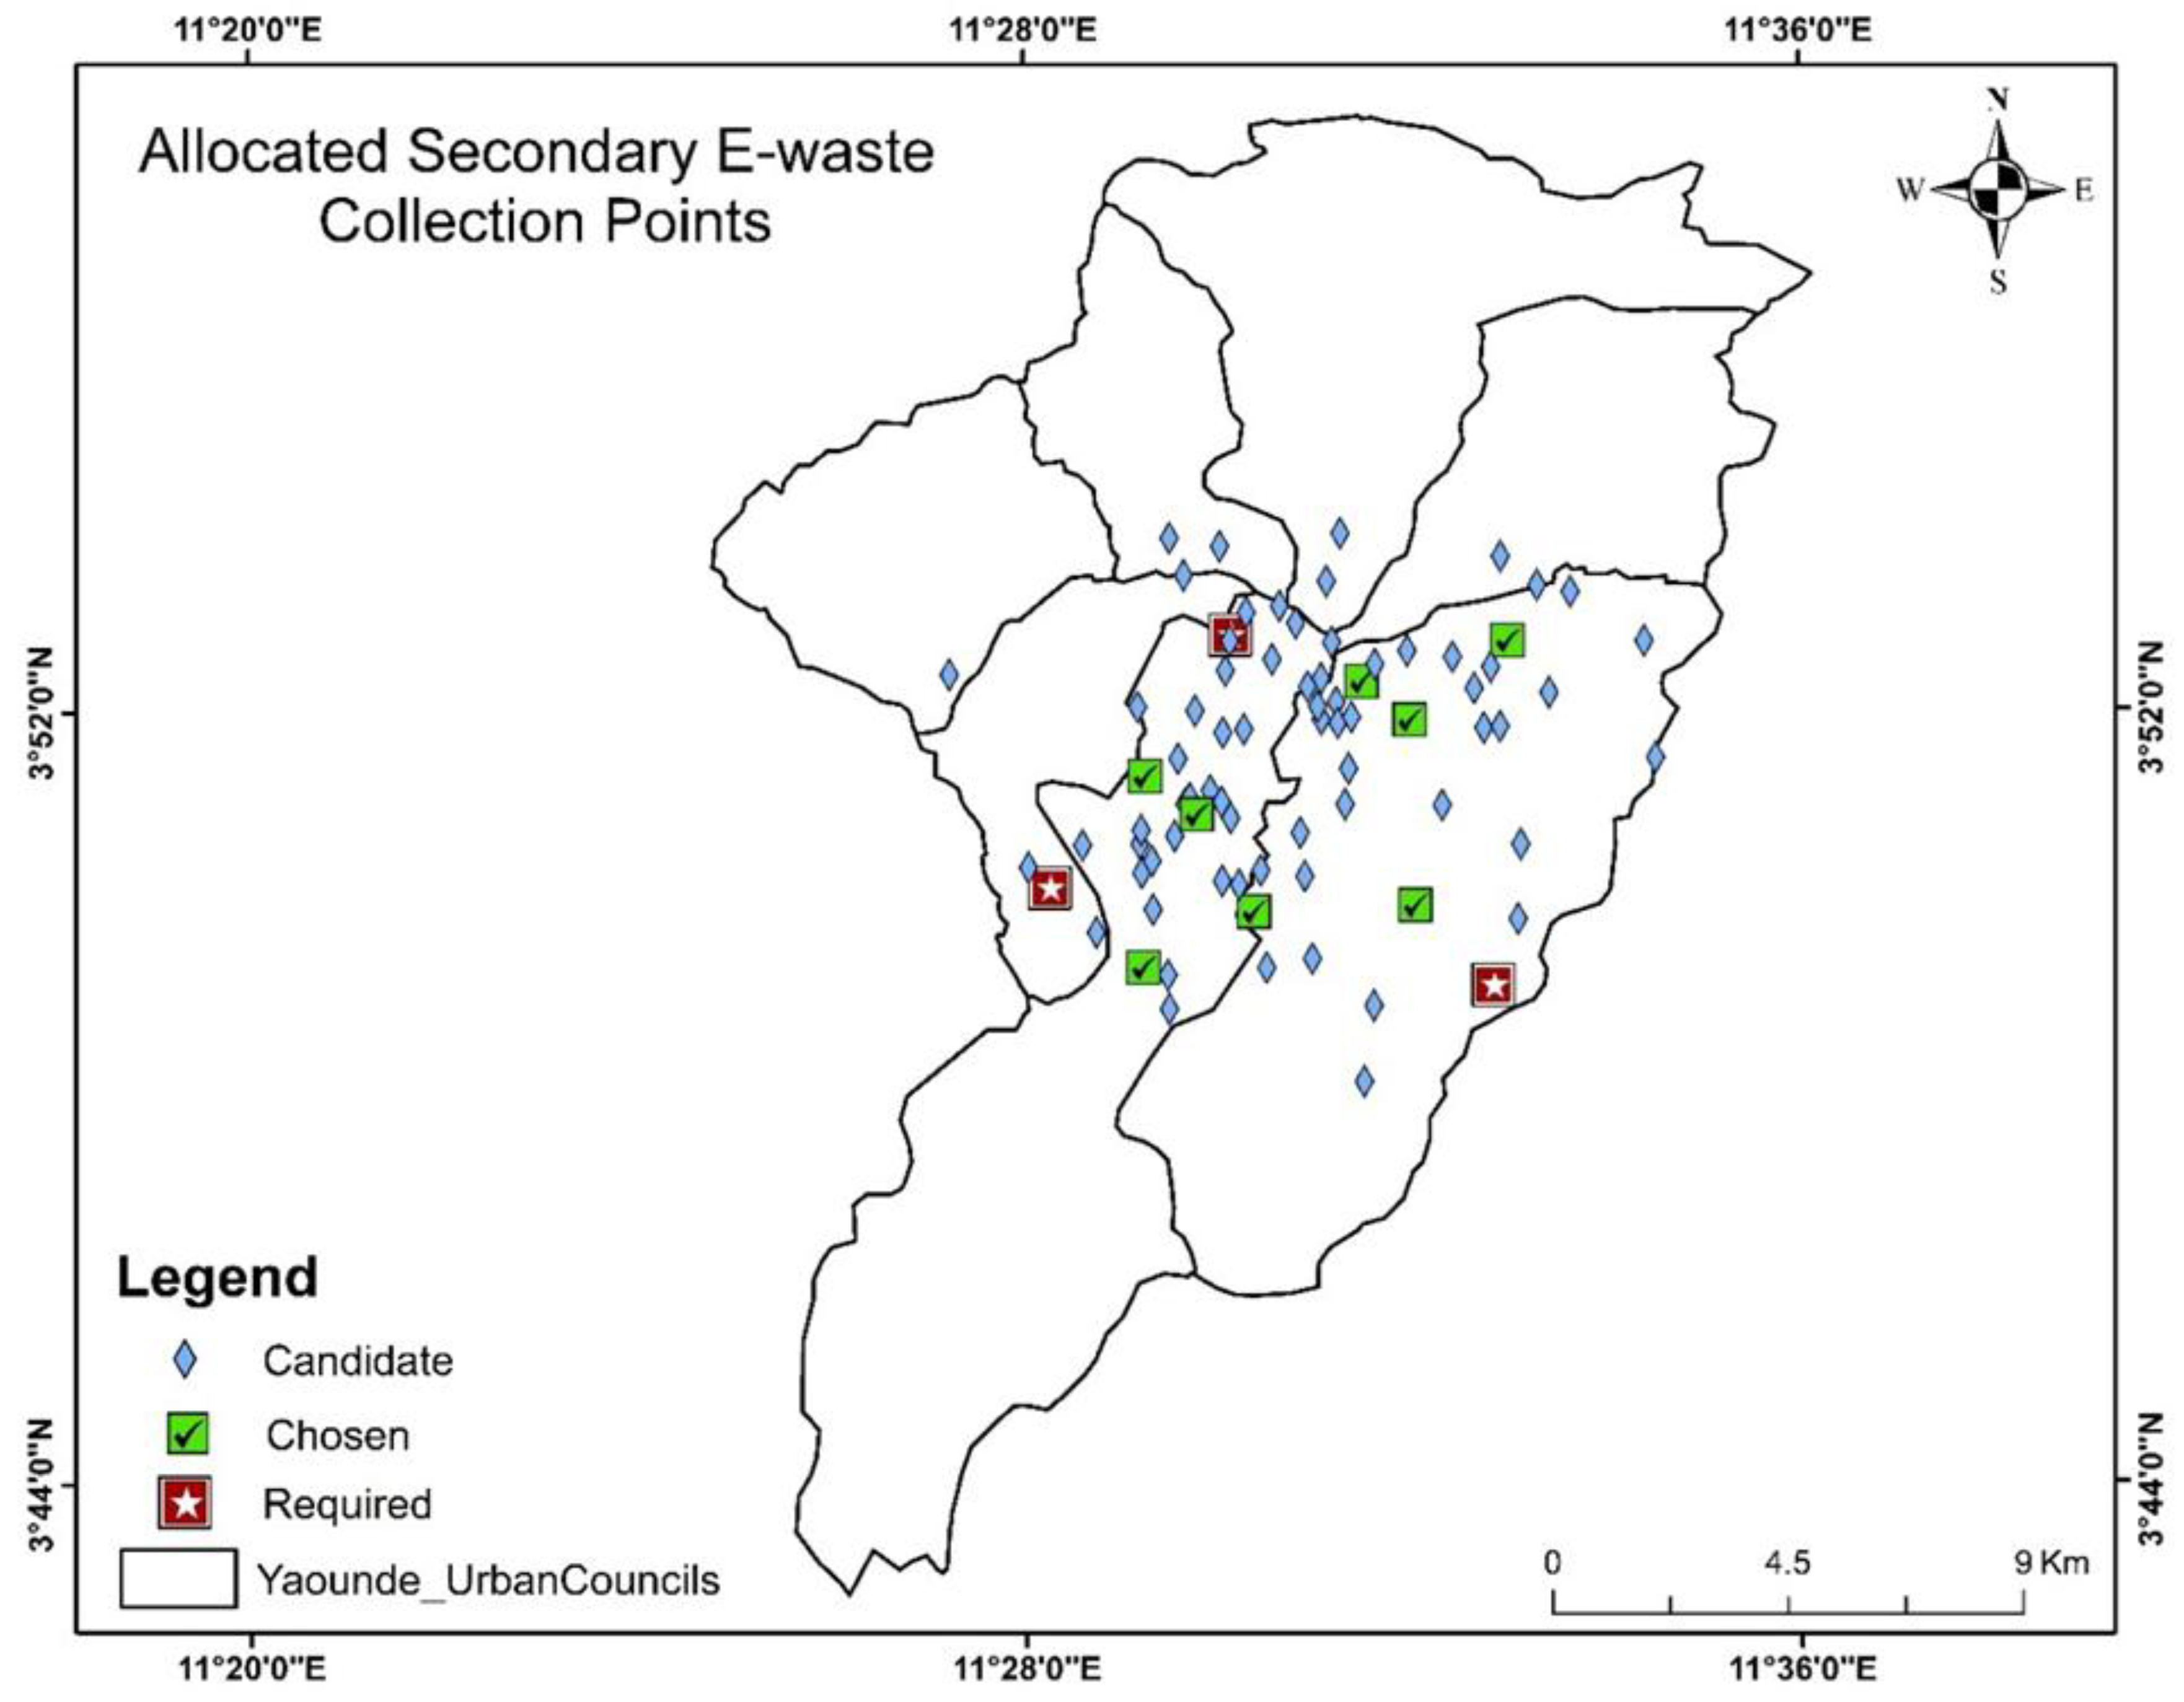
Figure 5.
Service area coverage of the maximized formal collection (CFC) scenario.
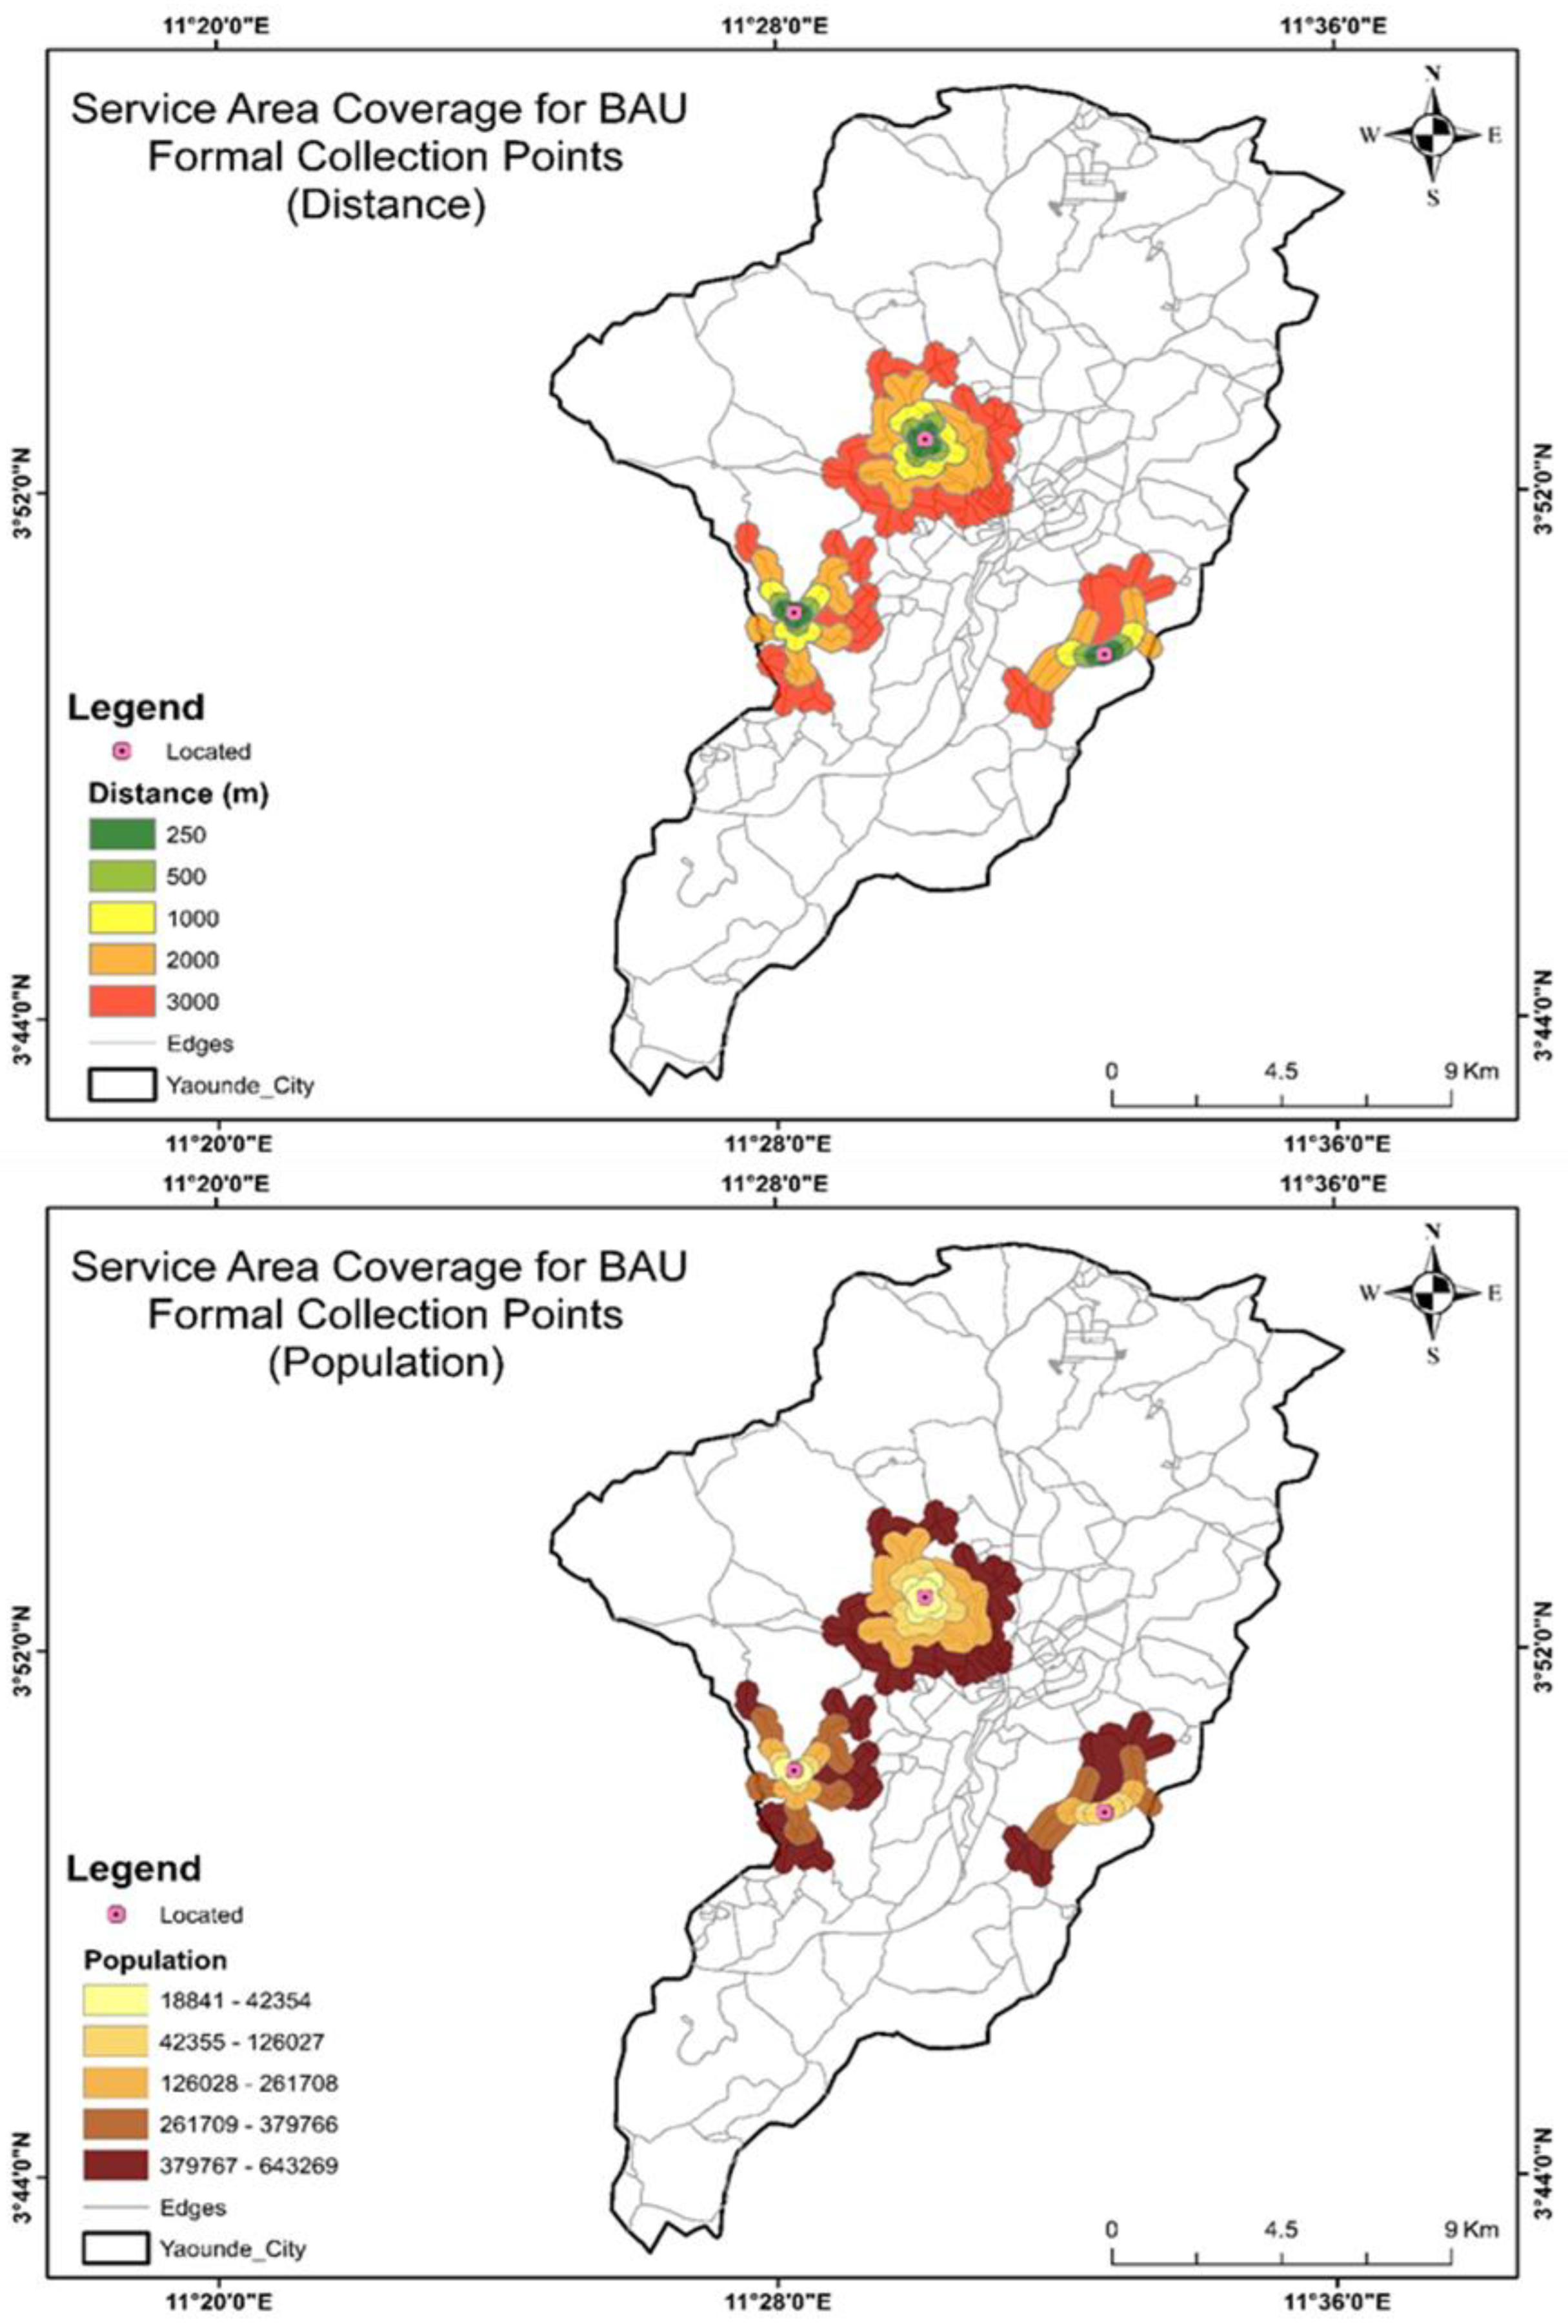
Figure 6.
Service area coverage of the maximized formal collection (MFC) scenario.
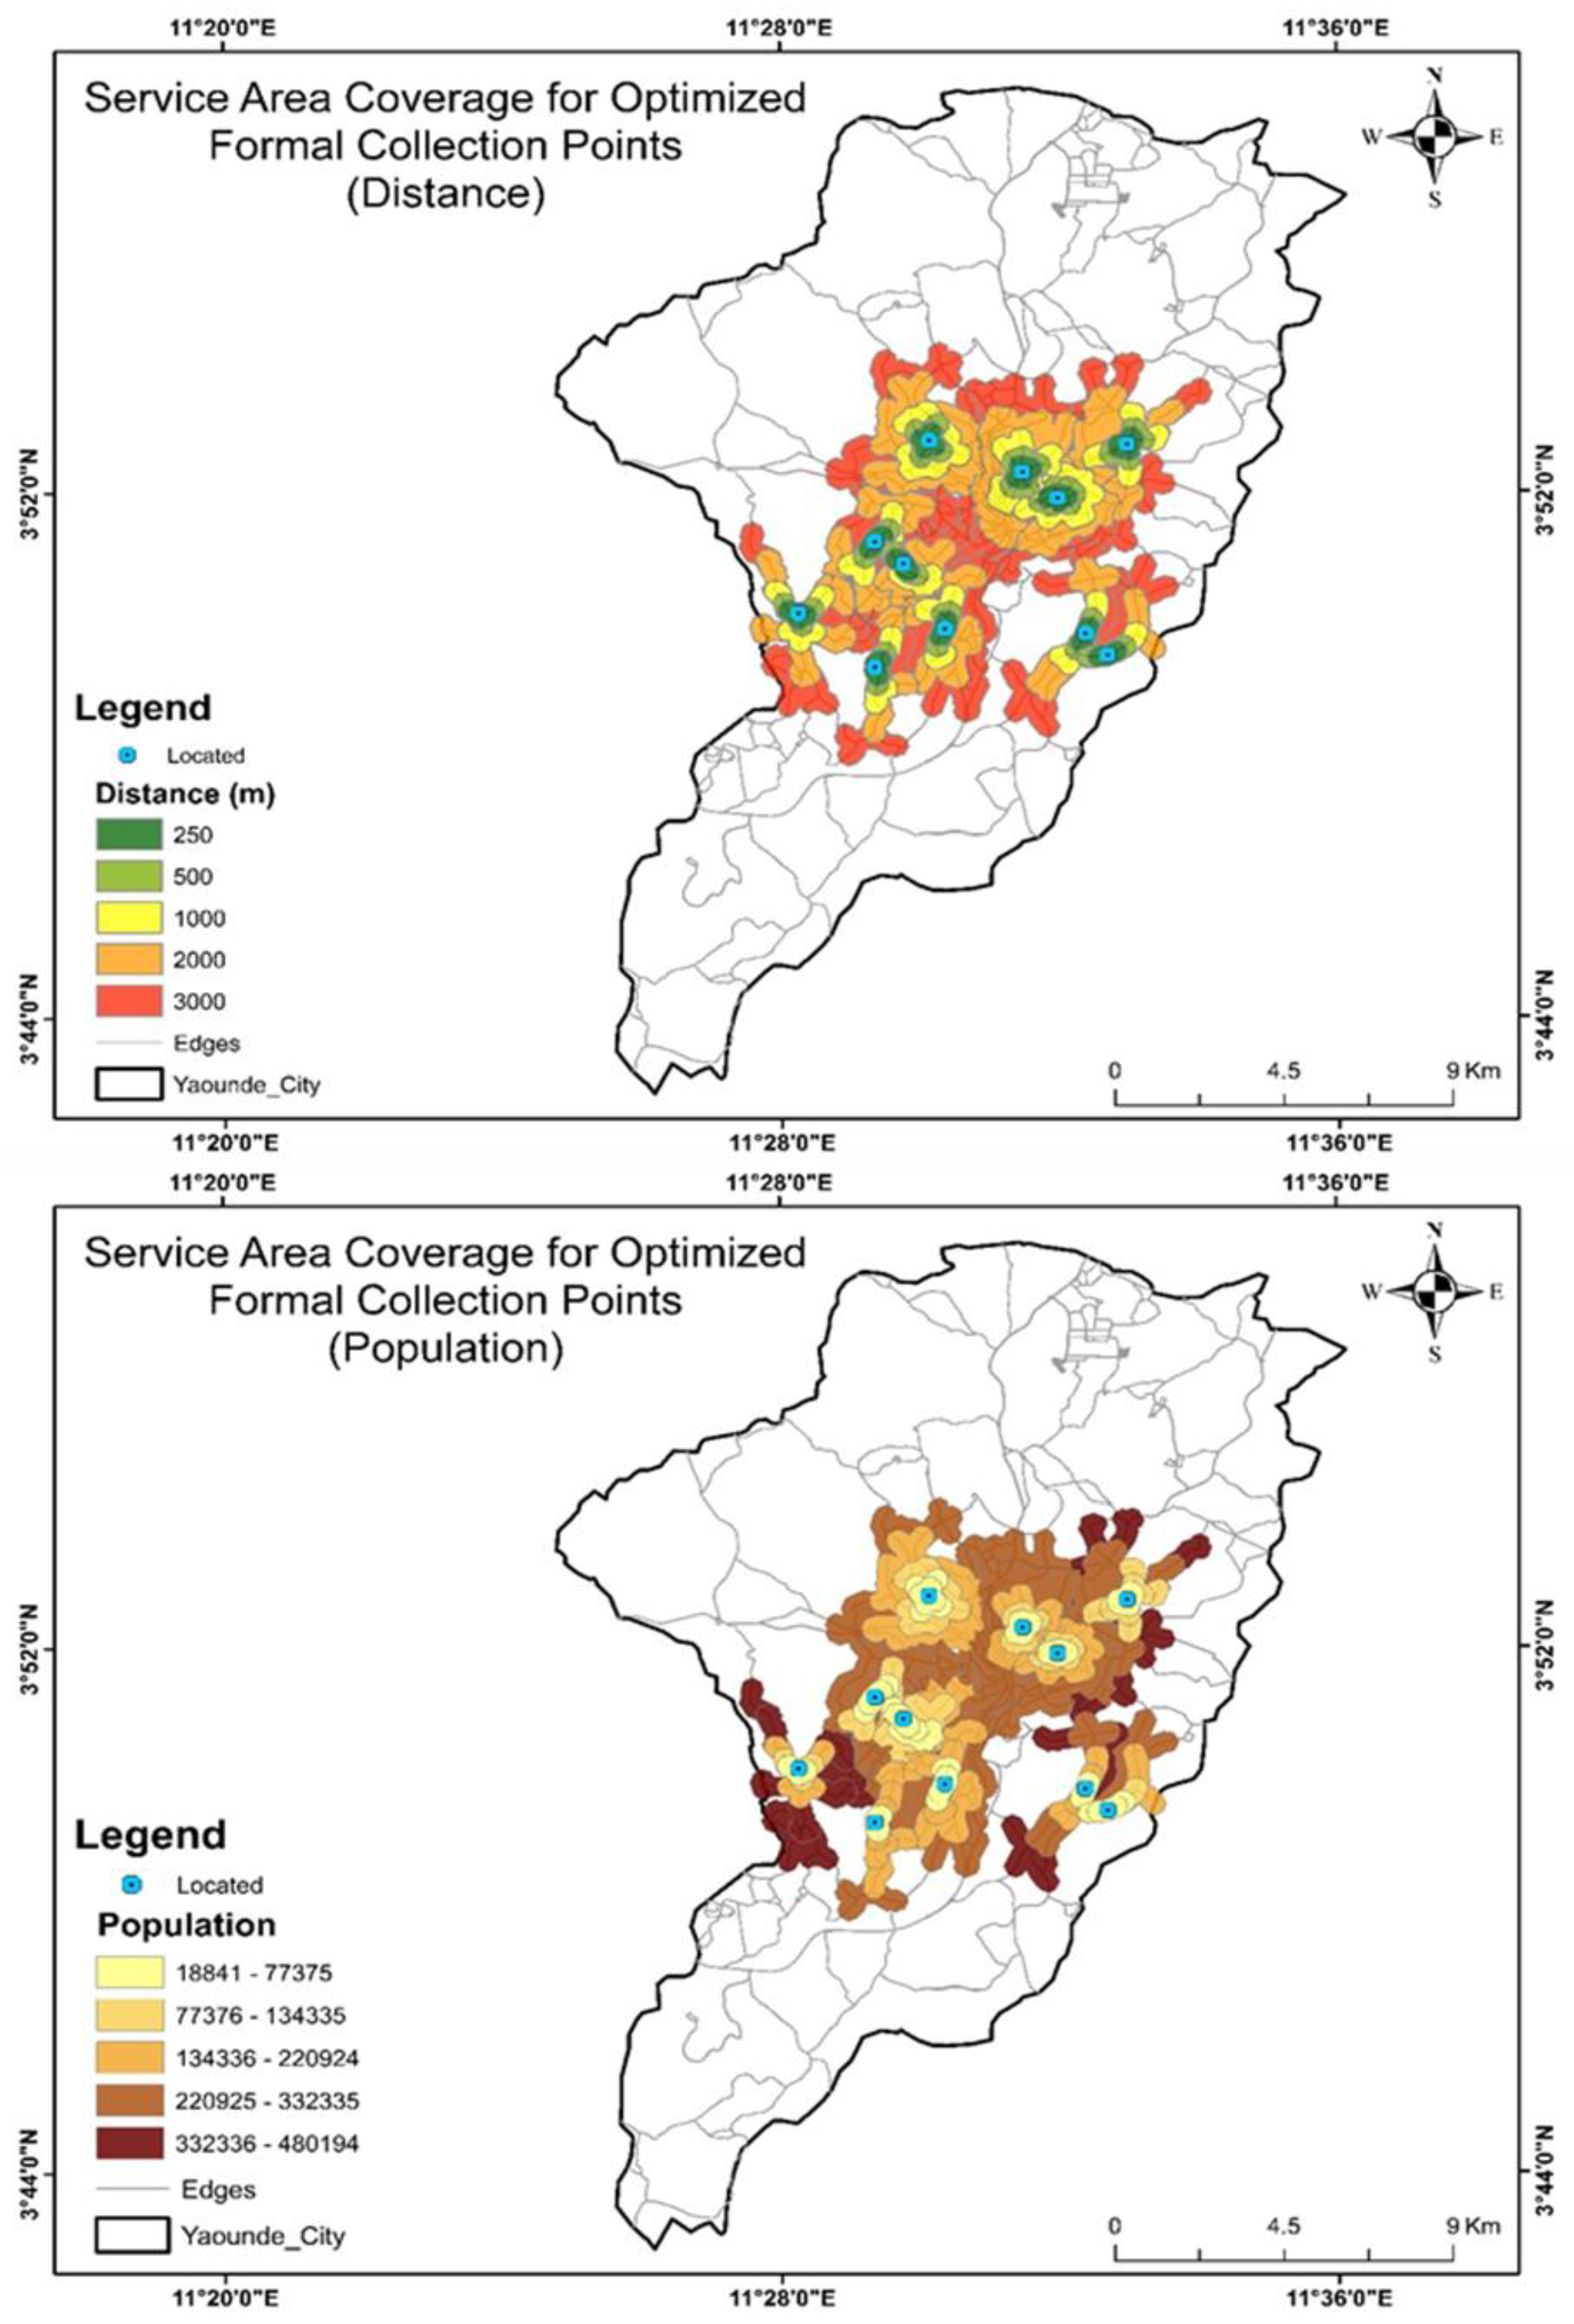
Figure 7.
Time-optimized formal E-waste collection route.
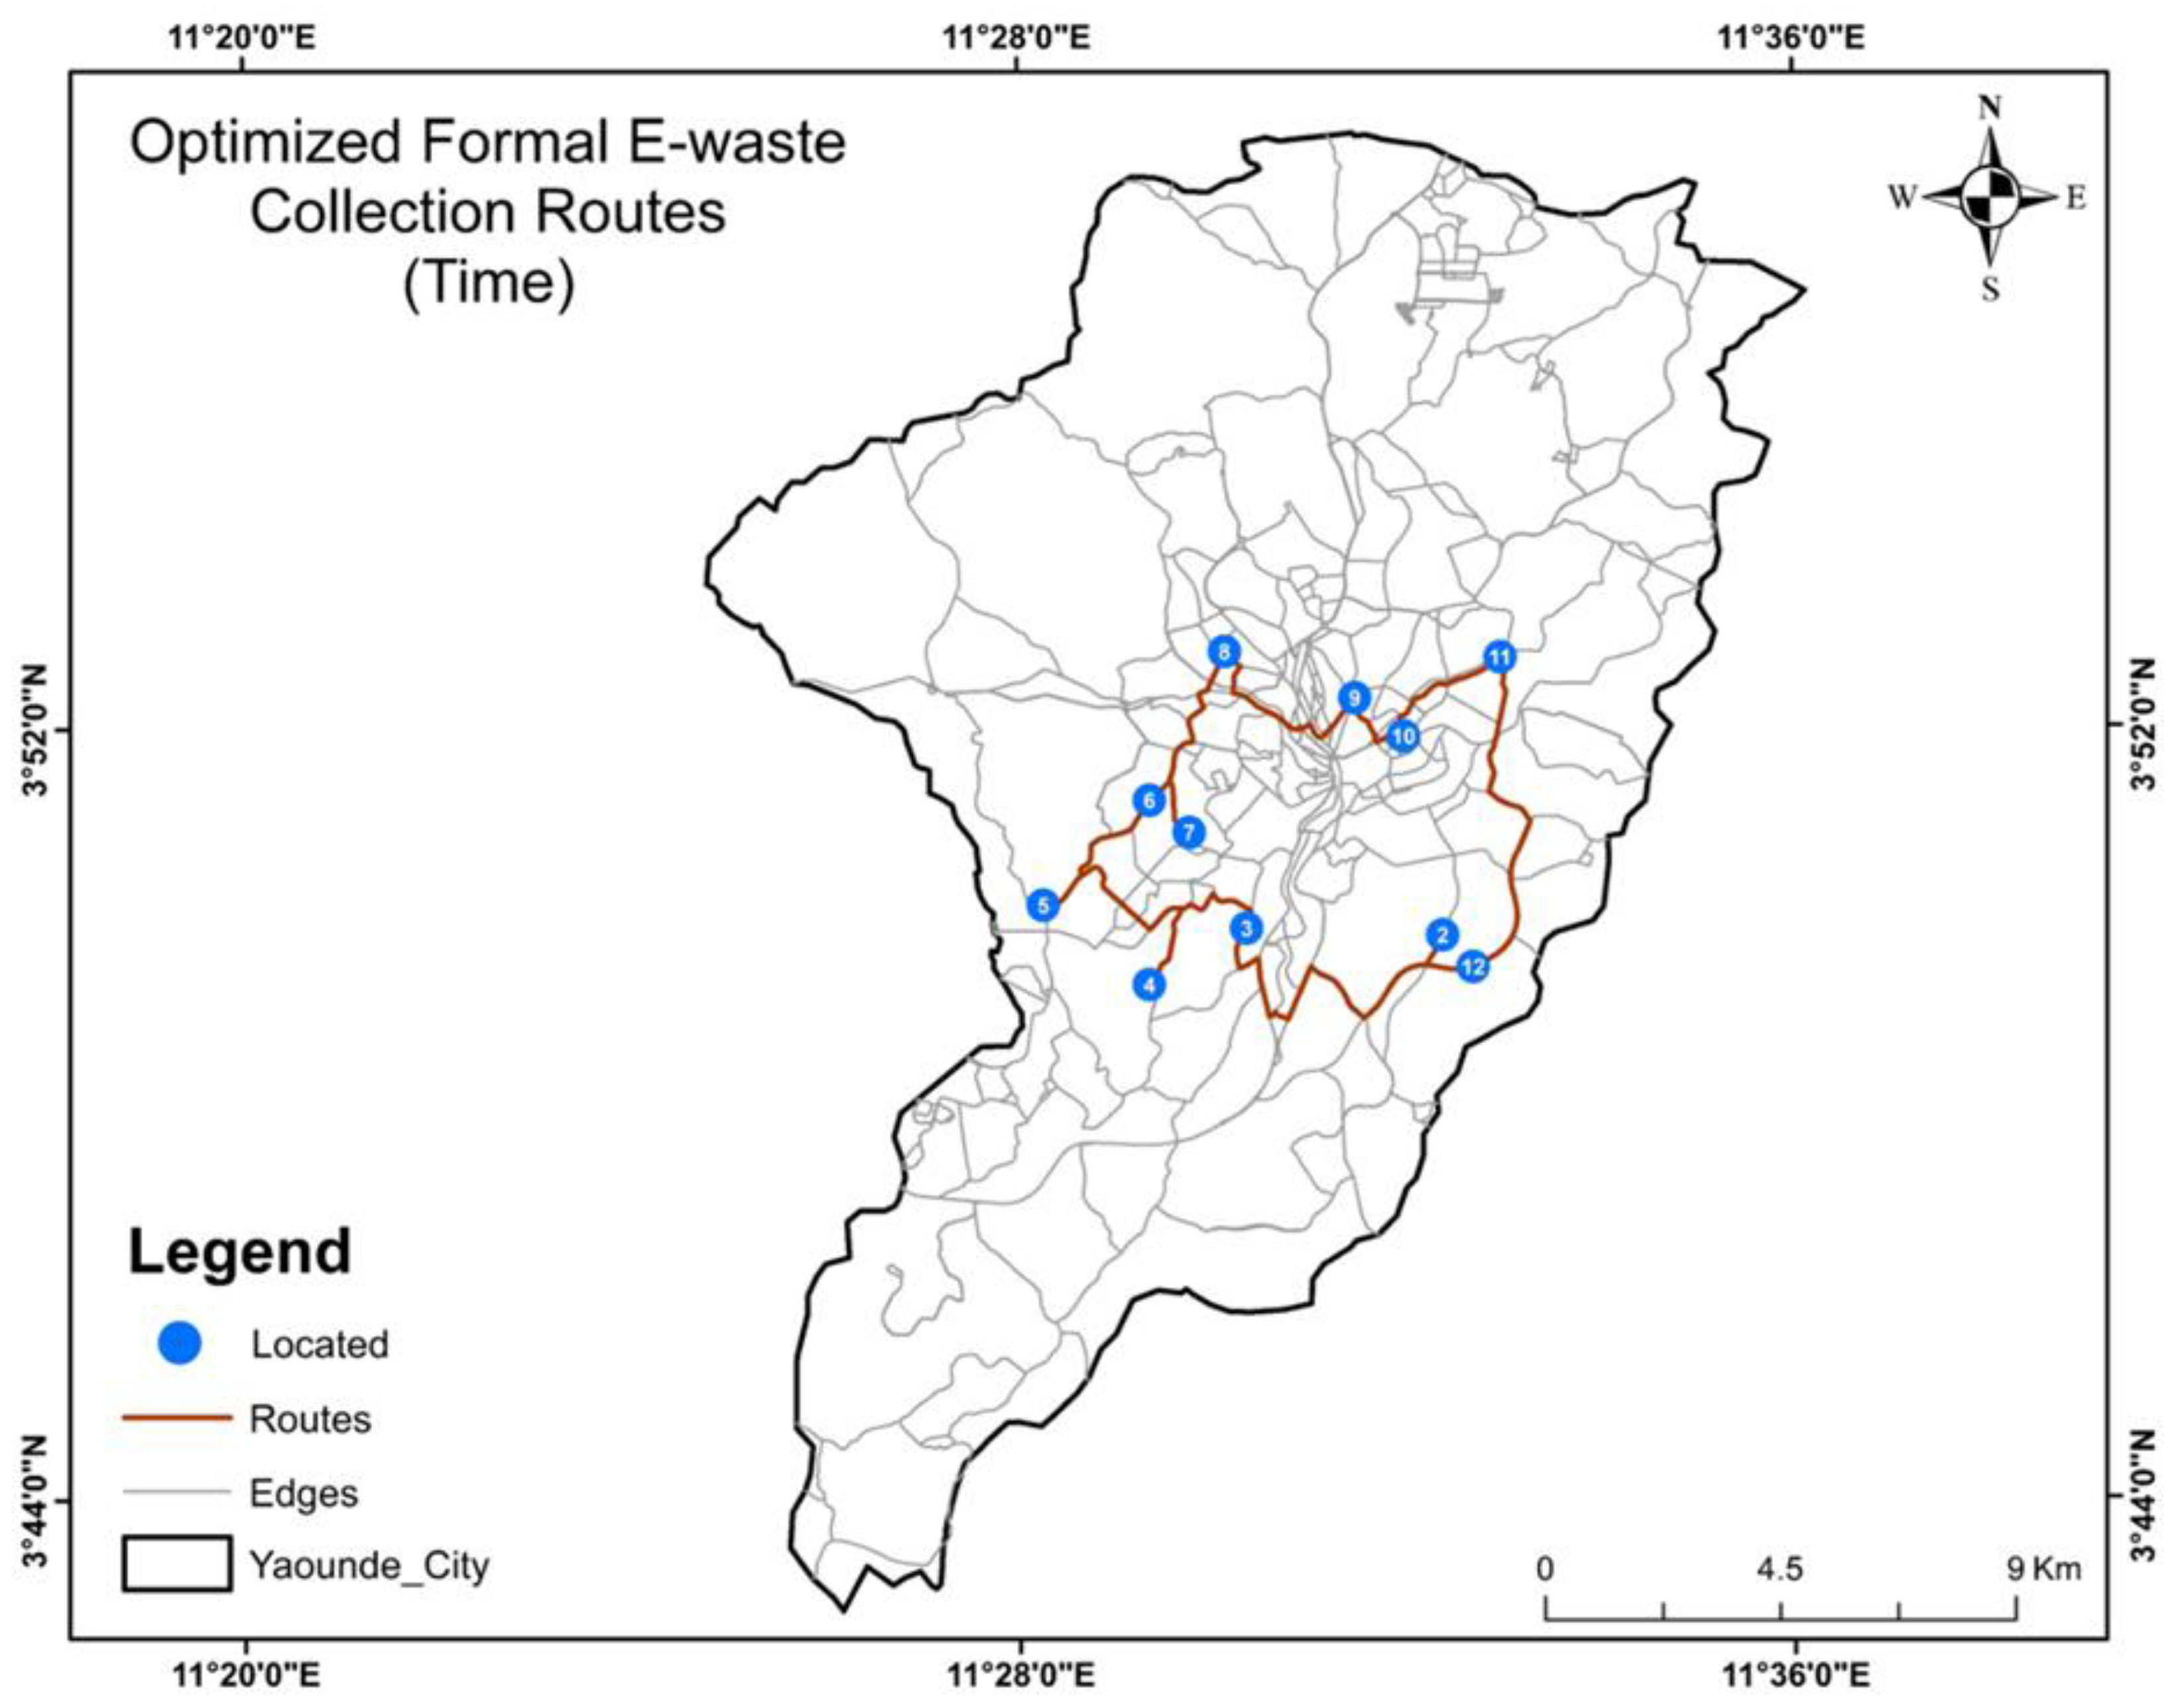
Figure 8.
Distance-optimized formal E-waste collection route.
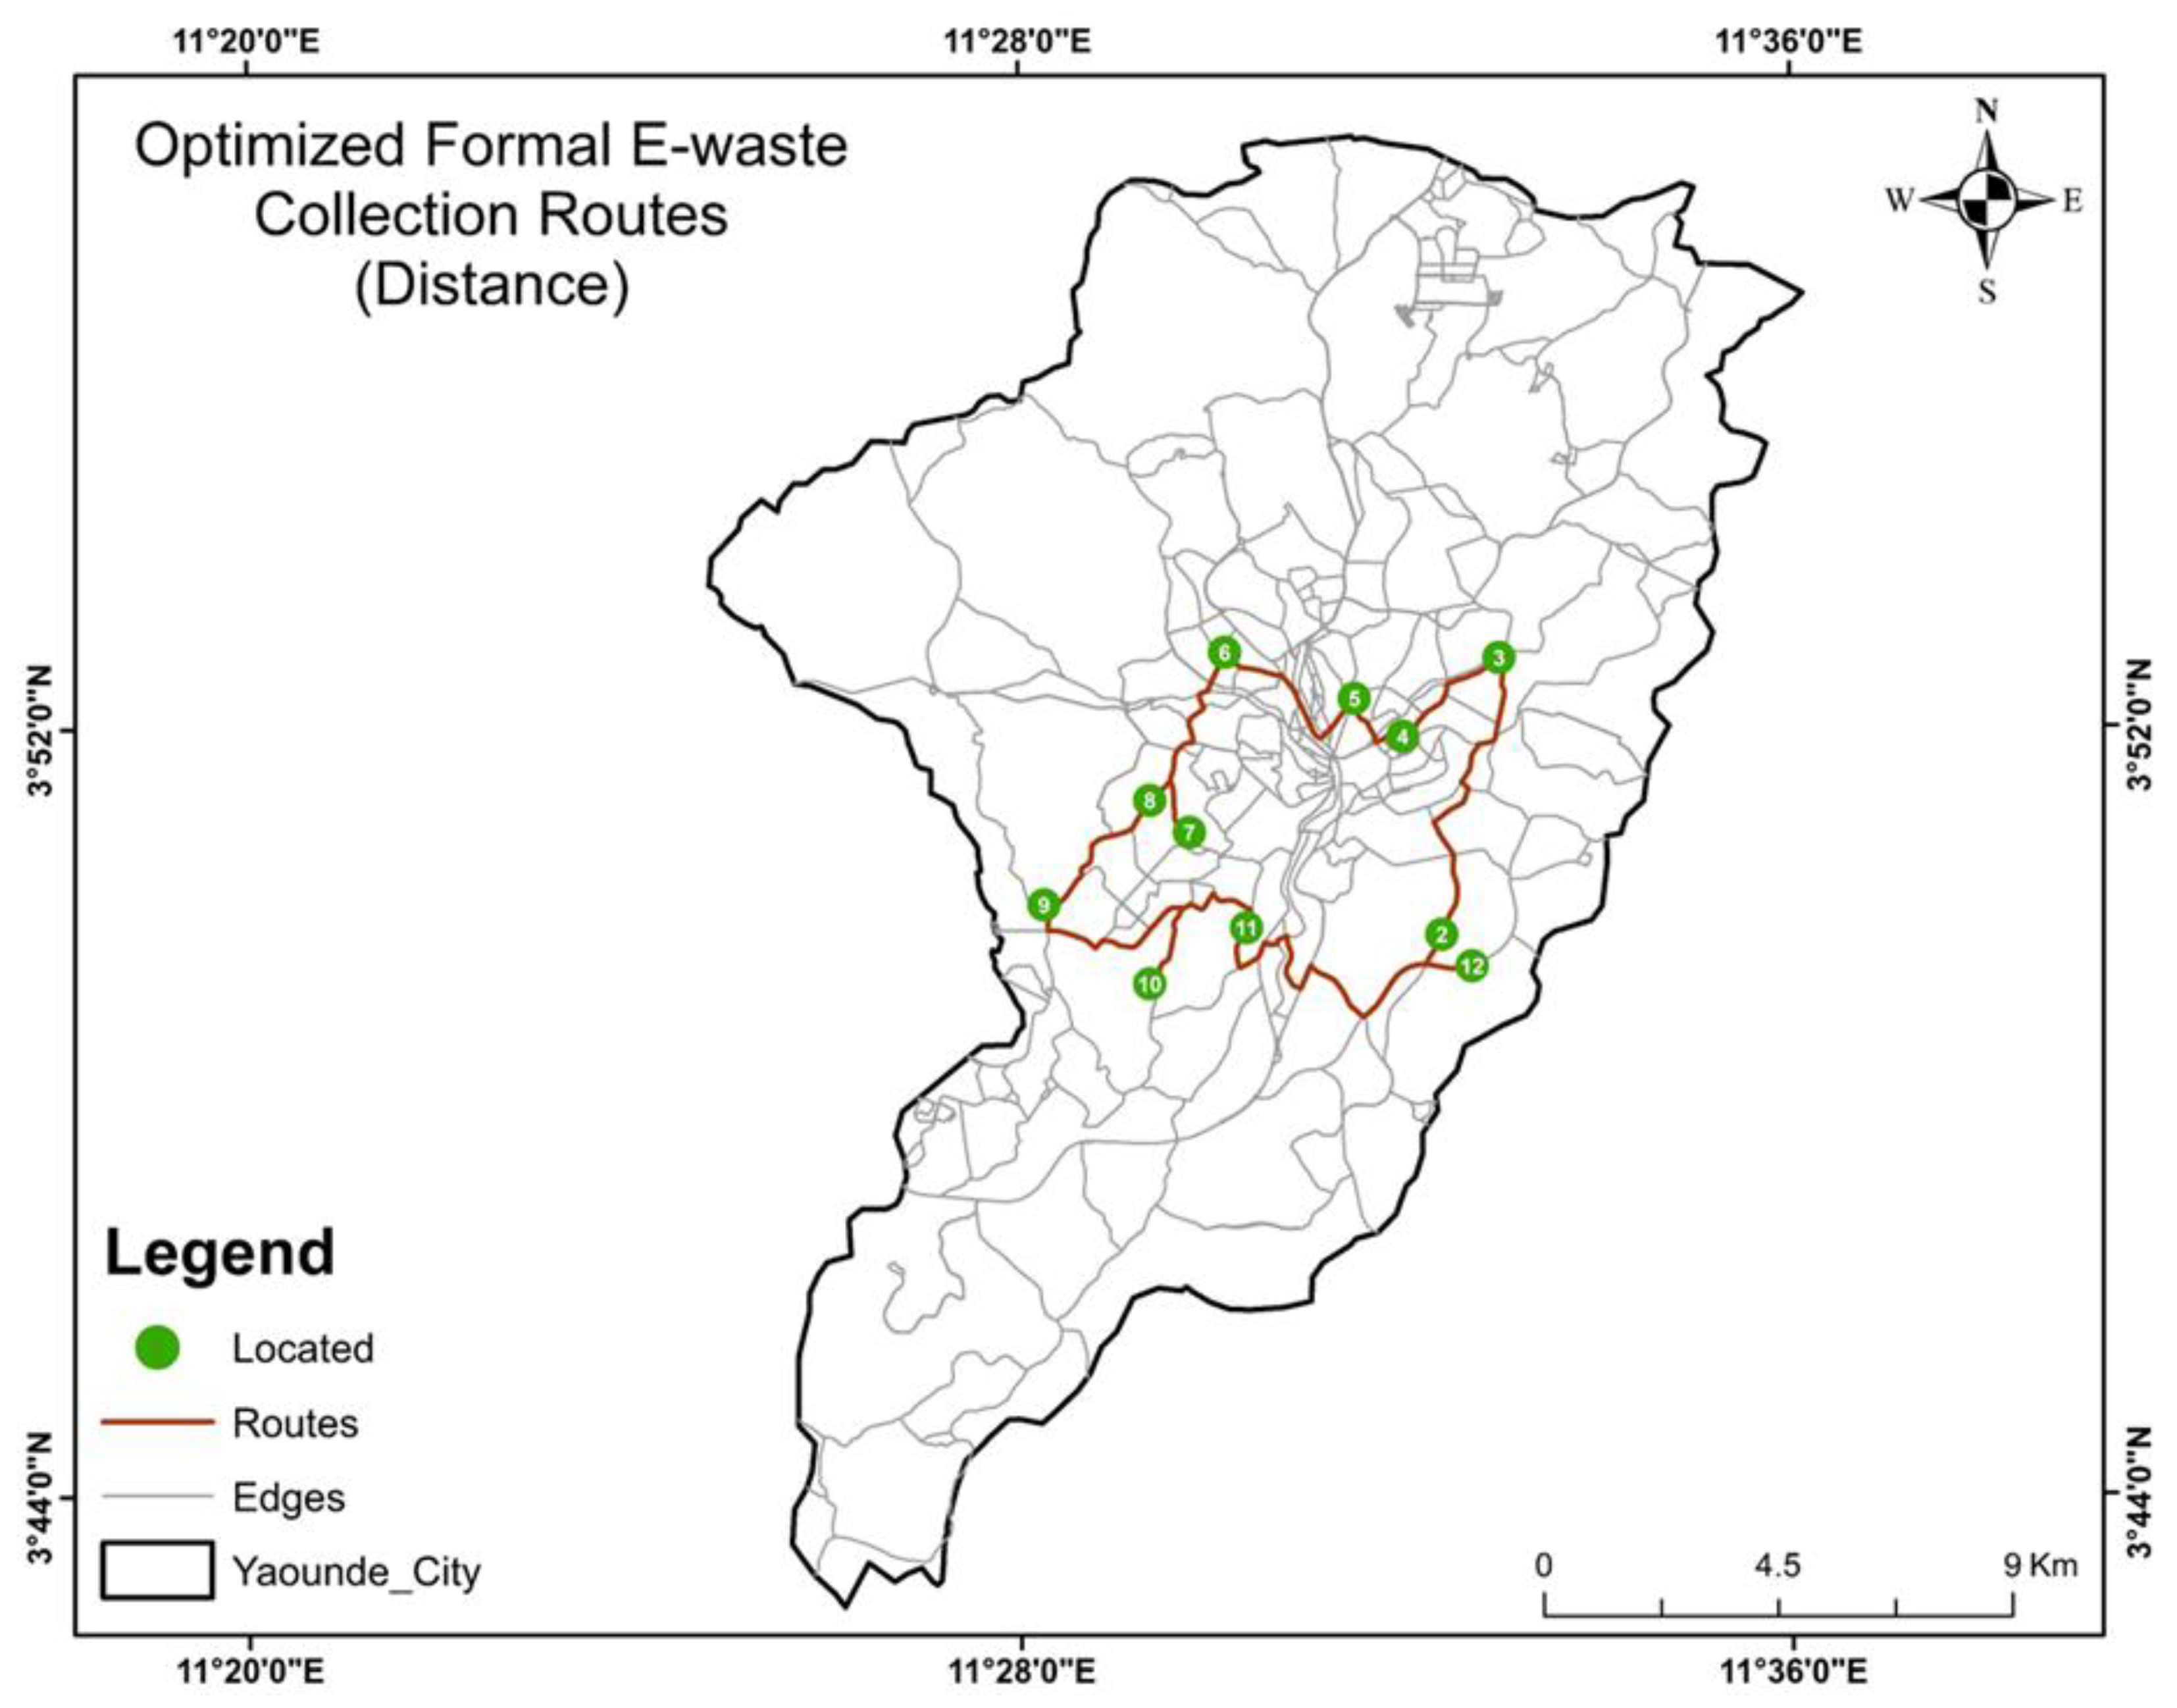
Figure 9.
Slope-optimized formal E-waste collection route.
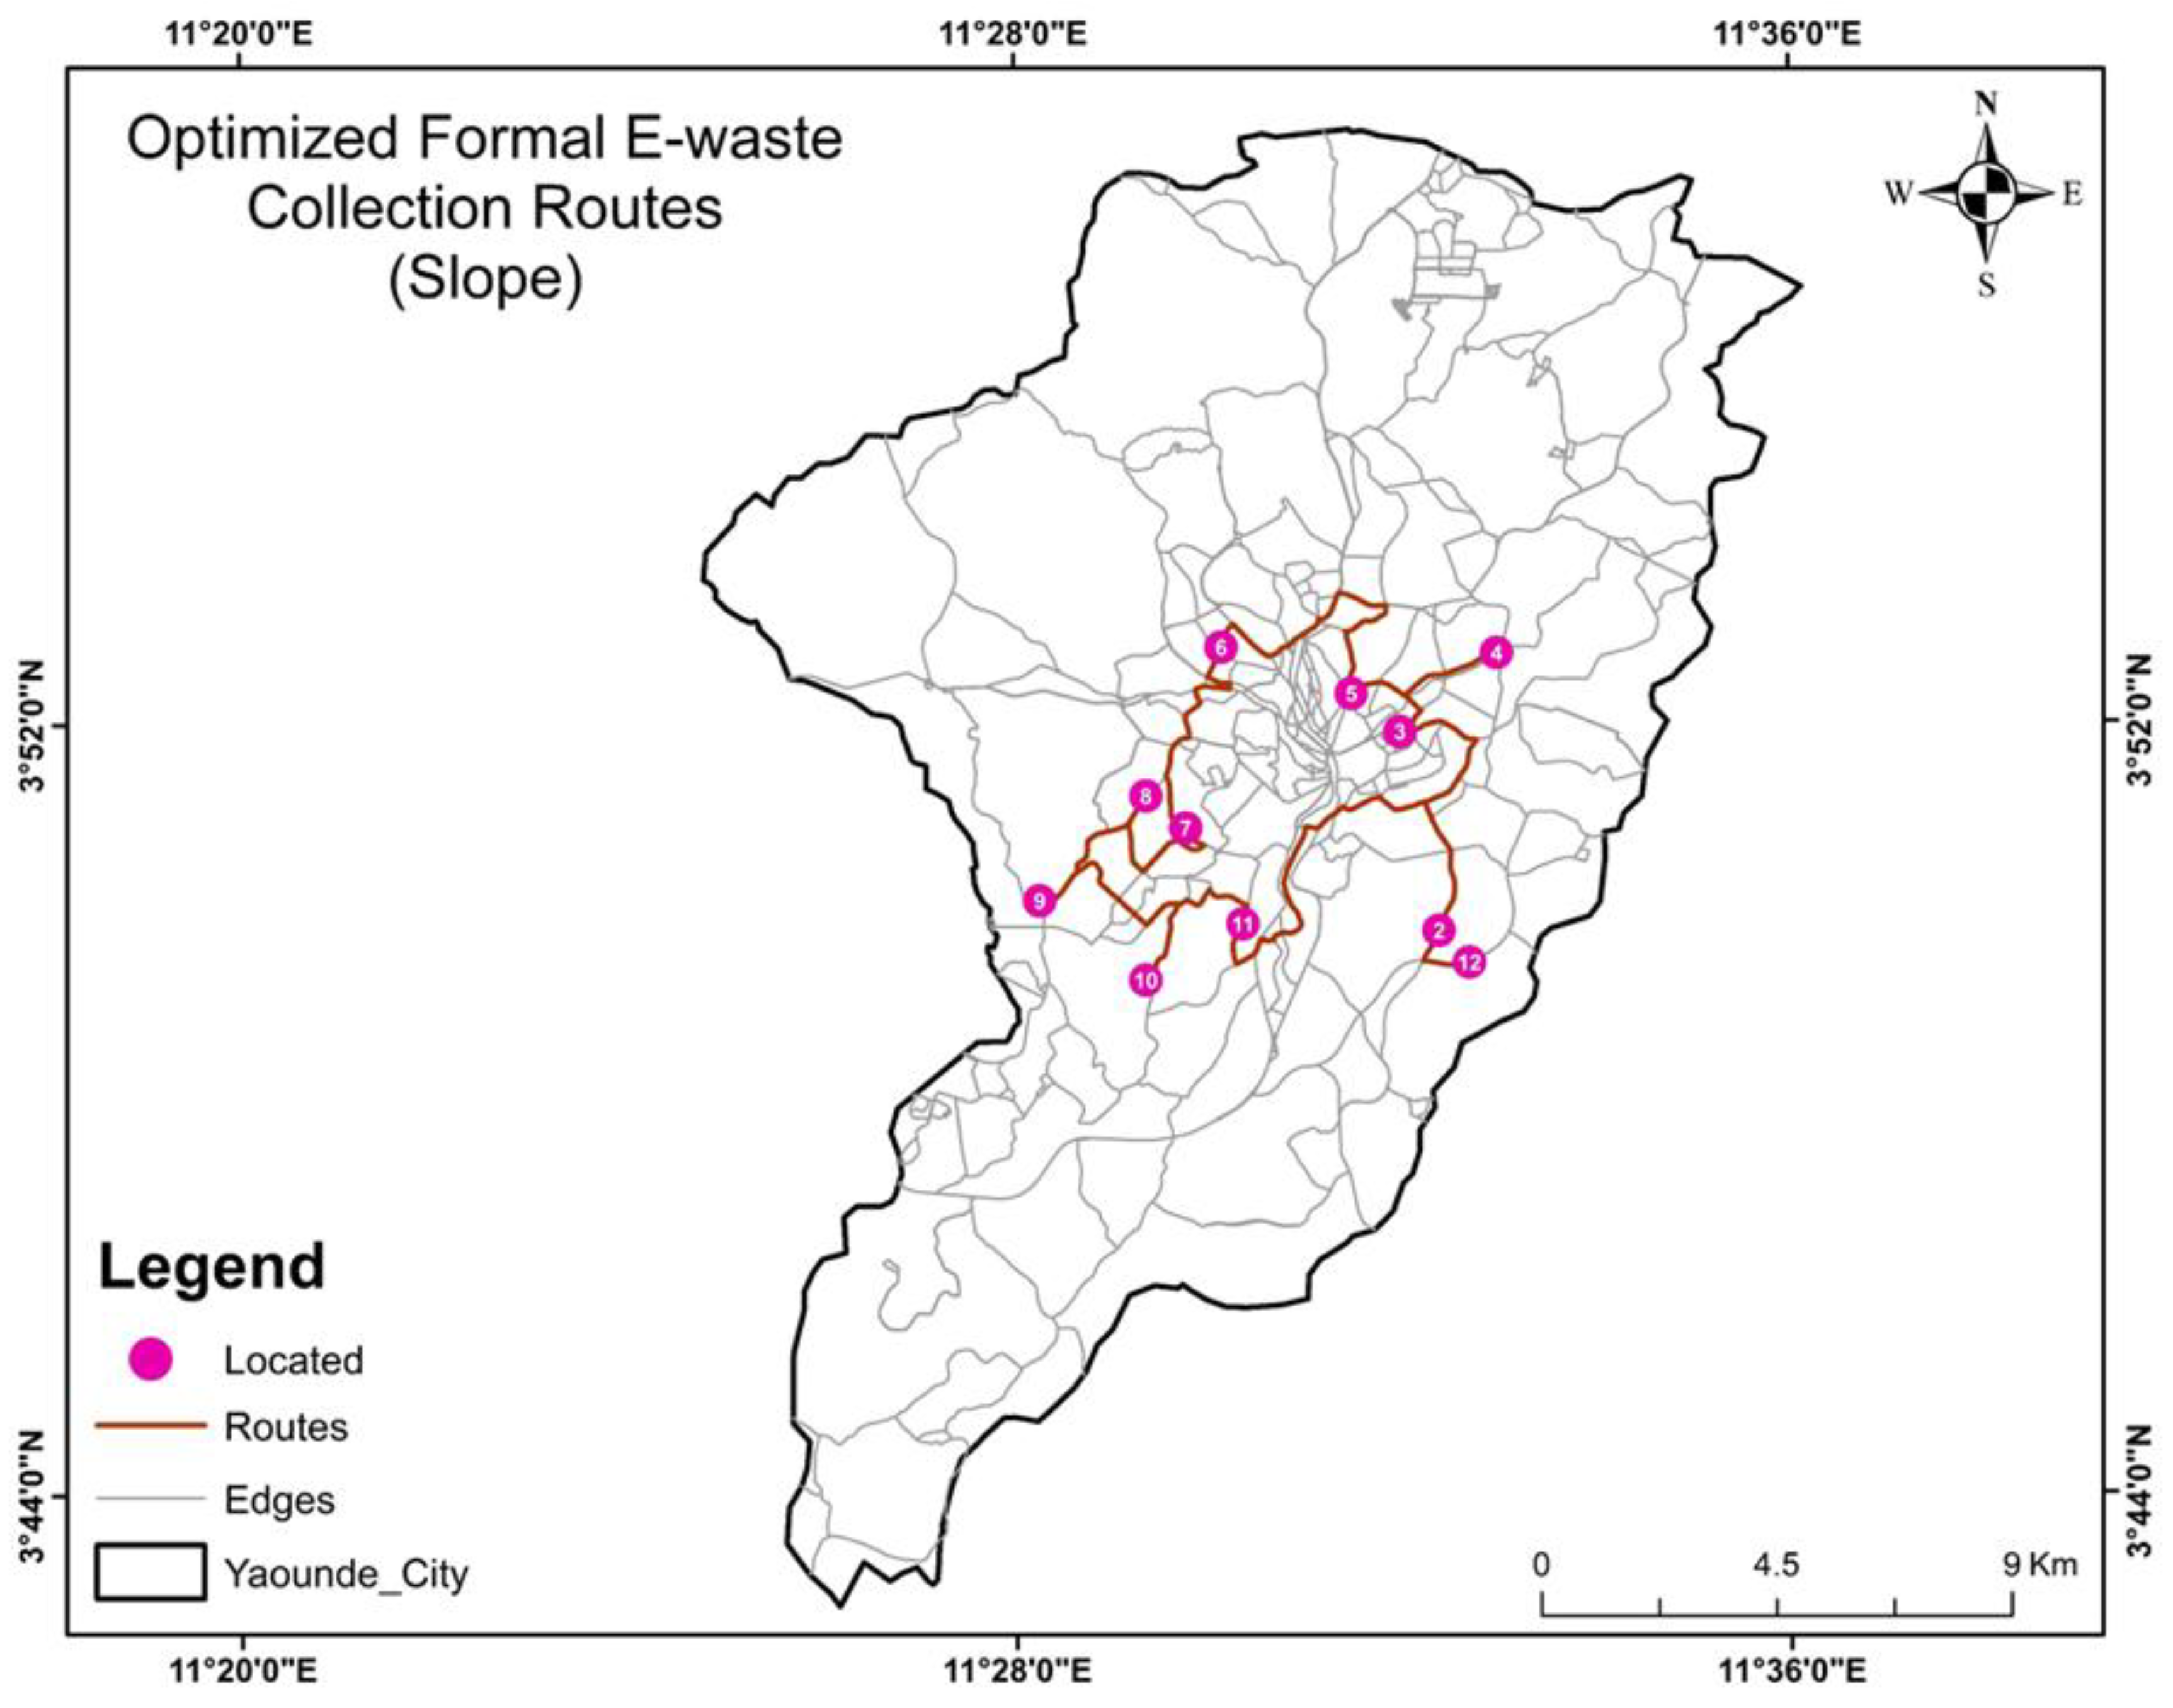

Table 1.
Past studies in waste collection optimization.
| Reference | Study Area | Methodology | Optimization Objectives | |||||||||
|---|---|---|---|---|---|---|---|---|---|---|---|---|
| CQ | D | T | FC | C | BA | Emis. | WC | FA | E | |||
| Rathore & Sarmah (2019) | India | GIS + ANOVA | X | X | X | X | O | O | O | X | X | X |
| Abdallah et al. (2019) | UAE | GIS + Survey | X | O | O | X | X | X | O | O | X | X |
| Nguyen-Trong et al. (2017) | Vietnam | GIS + ABM | X | X | O | X | O | X | X | X | X | X |
| Pourreza Movahed et al. (2020) | Iran | LCA + Genetic Algorithms | X | X | X | X | X | X | O | X | X | O |
| Mantzaras & Voudrias (2017) | Greece | Optimization Model | X | X | X | X | O | X | X | X | X | X |
| Ferri et al. (2015) | Brazil | Mathematical Model | X | X | X | X | O | X | X | X | X | X |
| Mohsenizadeh et al. (2020) | Turkey | MILP Model | X | X | X | X | O | X | O | X | X | X |
| Lyeme et al. (2017) | Tanzania | Goal programming method | X | X | X | X | O | X | O | X | O | X |
| Hemidat et al. (2017) | Jordan | GIS | X | O | O | X | O | X | O | X | X | X |
| Sulemana et al. (2020) | Ghana | GIS | X | X | O | X | O | X | X | X | X | X |
| Amal et al. (2020) | Tunisia | GIS + MCDA | X | O | O | O | X | O | X | X | O | |
| Kinobe et al. (2015) | Uganda | GIS | X | O | X | X | O | X | O | X | X | X |
| Malakahmad et al. (2014) | Malaysia | GIS | X | O | X | X | X | X | X | X | X | X |
| Zsigraiova et al. (2013) | Portugal | GIS | X | X | X | O | O | X | O | X | X | X |
| This Study | Cameroon | GIS + C&U Model | O | O | O | O | O | X | O | X | O | X |
(ANOVA: Analysis of Variance; ABM: Agent-based Modelling; MILP: Mixed Integer Linear Programming; MCDA: Multi-Criteria Decision Aid; C&U: Consumption and Use; CQ: Collected quantity; D: Distance; T : Time; FC: Fuel Consumption; C : Cost; BA: Bin Allocation; Emis.: Emissions; WC: Waste Content; FA : Facility Allocation; E : Energy).
Table 2.
Parameter settings and location allocation analysis properties.
| CFC Scenario | AFC Scenario | MFC scenario | |
|---|---|---|---|
| Parameter Settings | |||
| Number of primary collection point(s) | 1 | 1 | 1 |
| Number of secondary collection point(s) | 2 | 2 | 10 |
| Number of Candidate facilities | 3 | 76 | NA |
| Number of Required facilities | 3 | 3 | NA |
| Number of Chosen facilities | 3 | 8 | 11 |
| Location Allocation Properties | |||
| Number of demand points | 25,764 population clusters | 25,764 population clusters | NA |
| Problem type | Maximize formal collection coverage | Maximize formal collection coverage | NA |
| Impedance | Distance (km) | Distance (km) | NA |
| Travel mode | Truck | Truck | NA |
| Travel direction | Demand points to Facilities | Demand points to Facilities | NA |
| Facility search tolerance | 5 km | 5 km | NA |
| Impedance cut off | 7 km | 7 km | NA |
| Number of potential supply-demand pathways | 496 lines | 4,503 lines | NA |
Table 3.
Variables for the fuel consumption cost calculation.
| Parameter | Symbol | Route 1 (time) | Route 2 (distance) | Route 3 (slope) | Source |
|---|---|---|---|---|---|
| Speed | v | 70 km/h = 19.44 m/s | 70 km/h = 19.44 m/s | 70 km/h = 19.44 m/s | Primary data |
| Road slope angle | θ | 4.70 degrees | 4.48 degrees | 4.13 degrees | Primary data |
| Total travel time | t | 38.67 minutes | 39.29 minutes | 50.06 minutes | Primary data |
| Number of collection rounds per year | Ncol | 48 | 48 | 48 | Primary data |
| Fuel cost per liter | fL | 828 FCFA | 828 FCFA | 828 FCFA | [59] |
| Truck mass | m | 18,000 kg | 18,000 kg | 18,000 kg | [60] |
| Rolling resistance coefficient | Cr | 0.007 (for heavy truck) |
0.007 | 0.007 | [61] |
| Drag coefficient | Cd | 0.80 | 0.80 | 0.80 | [62] |
| Truck frontal area | A | 8.50 m2 | 8.50 m2 | 8.50 m2 | [63] |
| Air density | ρair | 1.20 kg/m³ | 1.20 kg/m³ | 1.20 kg/m³ | [64] |
| Gravity | g | 9.81 m/s² | 9.81 m/s² | 9.81 m/s² | [65] |
| Fuel density (diesel) |
ρf |
0.85 kg/L | 0.85 kg/L | 0.85 kg/L | [66] |
| Diesel low heat value (LHV) | Qlhv | 43,100,000 J/kg | 43,100,000 J/kg | 43,100,000 J/kg | [67] |
| Engine efficiency | η | 0.40 | 0.40 | 0.40 | [68] |
Table 4.
Annual E-waste generation quantity for selected household appliances.
| E-waste Device | No of households in Yaoundé | Average No of devices per household (units) | Average weight of device (kg) | Average lifespan (years) | E-waste generation quantity (kg/year) |
|---|---|---|---|---|---|
| Telephones | 668,857 | 3.89 | 0.18 | 4.00 | 117,026.09 |
| Flat screen televisions | 1.29 | 23.40 | 10.00 | 2,011,767.87 | |
| Cathode-ray televisions | 0.20 | 18.12 | 15.00 | 157,748.33 | |
| Laptops | 2.03 | 3.10 | 5.00 | 840,401.05 | |
| Desktop computers | 0.35 | 5.00 | 7.00 | 165,021.65 | |
| Refrigerators and Freezers | 1.25 | 64.00 | 16.00 | 3,347,516.19 | |
| Total | 6,639,481.19 | ||||
Table 5.
Potential annual E-waste collection quantity for selected household appliances.
| Electronic Appliances | No of households in Yaoundé | Average No of devices per household (units) | Average weight of device (kg) | Average expected usage duration (years) | Potential E-waste collection quantity (kg/year) |
|---|---|---|---|---|---|
| Telephones | 668,857 | 3.89 | 0.18 | 4.84 | 96,688.95 |
| Flat screen televisions | 1.29 | 23.40 | 5.86 | 3,432,222.46 | |
| Cathode-ray televisions | 0.20 | 18.12 | 3.67 | 643,960.16 | |
| Laptops | 2.03 | 3.10 | 5.49 | 765,271.71 | |
| Desktop computers | 0.35 | 5.00 | 3.41 | 338,843.51 | |
| Refrigerators and Freezers | 1.25 | 64.00 | 7.89 | 6,786,254.52 | |
| Total | 12,063,241.30 | ||||
Table 6.
Maximum formal E-waste collection quantity for the CFC scenario.
| Current formal collection points | Number of households | Potential E-waste Collection Quantity (kg/year) | Max. E-waste Collection Quantity (kg/year) | ||||||||
|---|---|---|---|---|---|---|---|---|---|---|---|
| 0.25 km | 0.5 km | 1 km | 2 km | 3 km | 0.25 km | 0.5 km | 1 km | 2 km | 3 km | ||
| Mendong Market | 11,054 | 11,054 | 37,387 | 49,540 | 69,764 | 199,406.43 | 199,406.43 | 674,458.90 | 893,709.33 | 1,258,547.71 | 1,258,547.71 |
| Tradex Tsinga Elobi | 6,051 | 18,004 | 30,501 | 54,252 | 91,896 | 109,152.31 | 324,789.58 | 550,245.77 | 978,711.23 | 1,657,796.11 | 1,657,796.11 |
| SoliTech | 2,692 | 5,291 | 13,853 | 29,721 | 70,125 | 48,555.95 | 95,457.37 | 249,913.27 | 536,166.84 | 1,265,057.58 | 1,265,057.58 |
| Total maximum E-waste collection quantity | 4,181,401.40 | ||||||||||
Table 7.
Maximum formal E-waste collection quantity for the MFC scenario.
| Allocated formal collection points | Population | Potential E-waste Collection Quantity (kg/year) | Max. E-waste Collection Quantity (kg/year) | ||||||||
|---|---|---|---|---|---|---|---|---|---|---|---|
| 0.25 km | 0.5 km | 1 km | 2 km | 3 km | 0.25 km | 0.5 km | 1 km | 2 km | 3 km | ||
| Mendong Market | 6,051 | 18,004 | 30,501 | 51,865 | 68,599 | 109,152.31 | 324,789.58 | 550,245.77 | 935,644.60 | 1,237,528.54 | 1,237,528.54 |
| Tradex Tsinga Elobi | 2,692 | 5,291 | 13,853 | 24,429 | 37,160 | 48,555.95 | 95,457.37 | 249,913.27 | 440,704.31 | 670,363.82 | 670,363.82 |
| SoliTech | 11,054 | 11,054 | 16,364 | 28,059 | 32,888 | 199,406.43 | 199,406.43 | 295,214.29 | 506,192.09 | 593,307.25 | 593,307.25 |
| Barclés Digital Technologies | 10,194 | 12,695 | 16,637 | 39,068 | 58,209 | 183,894.61 | 229,010.07 | 300,131.48 | 704,791.87 | 1,050,092.94 | 1,050,092.94 |
| Blue Sky Electronic | 9,585 | 24,948 | 24,948 | 35,507 | 58,966 | 172,921.13 | 450,059.34 | 450,059.34 | 640,551.43 | 1,063,746.64 | 1,063,746.64 |
| Ekeson Eclairage | 7,941 | 14,065 | 21,494 | 35,944 | 38,827 | 143,258.22 | 253,732.60 | 387,746.61 | 648,432.34 | 700,431.35 | 700,431.35 |
| Est Samy Services | 6,174 | 7,143 | 21,816 | 27,798 | 43,198 | 111,371.23 | 128,867.45 | 393,555.49 | 501,481.07 | 779,286.77 | 779,286.77 |
| Felixtel Cornier | 8,281 | 13,421 | 26,151 | 35,305 | 41,679 | 149,396.97 | 242,122.57 | 471,766.62 | 636,904.78 | 751,891.74 | 751,891.74 |
| F-Shop | 9,656 | 22,222 | 22,222 | 31,561 | 42,630 | 174,191.66 | 400,890.03 | 400,890.03 | 569,352.71 | 769,052.93 | 769,052.93 |
| Genie Electronique | 5,912 | 10,165 | 19,191 | 40,267 | 47,476 | 106,660.21 | 183,384.33 | 346,200.49 | 726,421.83 | 856,474.77 | 856,474.77 |
| Martelec Industriel | 6,670 | 7,399 | 8,045 | 17,673 | 21,530 | 120,329.38 | 133,485.69 | 145,134.38 | 318,815.77 | 388,408.93 | 388,408.93 |
| Total maximum E-waste collection quantity | 8,860,585.67 | ||||||||||
Table 8.
Comparative analysis of the identified suitable formal E-waste collection routes.
| Route 1 (time-optimized) | Route 2 (distance-optimized) | Route 3 (slope-optimized) | |
|---|---|---|---|
| Route properties | |||
| Cumulated time | 38.67 minutes | 39.29 minutes | 50.06 minutes |
| Cumulated distance | 43 km | 41.63 km | 52.79 km |
| Average slope | 4.70 degrees | 4.48 degrees | 4.13 degrees |
| E-waste collection costsproperties | |||
| Total resistance of the collection truck (Newton) | 17,257.51 N | 16,551.19 N | 15,491.71 N |
| Total power demand (Watts) | 335,485.95 W | 321,755.08 W | 301,158.79 W |
| Fuel consumption rate | 0.02 kg/second | 0.02 kg/second | 0.02 kg/second |
| Fuel consumption per collection round (liters) | 52.20 L | 52.70 L | 61.65 L |
| Fuel consumption cost per year | 2,074,553.15 FCFA | 2,094,363.44 FCFA | 2,450,372.95 FCFA |
| GHG emission properties | |||
| Fuel consumption per year (liters) | 2,505.50 L | 2,529.42 L | 2,959.39 L |
| GHG emission quantity per liter of diesel | 2.68 kg CO2 eq | 2.68 kg CO2 eq | 2.68 kg CO2 eq |
| GHG emissions per year | 6,714.74 kg CO2 eq | 6,778.86 kg CO2 eq | 7,931.16 kg CO2 eq |
Table 9.
Potential GHG emission reduction contribution to the 2030 NDC target.
| CFC scenario | MFC scenario | |
|---|---|---|
| GHG emission quantities for the current formal collection capacity | ||
| Formal collection percentage per functional unit (1ton) | 98.10 kg | 176.10 kg |
| Total GHG emission quantity | 13,922.40 kg CO2 eq | 10,163.35 kg CO2 eq |
| GHG emissions from 1% of the formal collection quantity per functional unit | 1,419.20 kg CO2 eq | 577.14 kg CO2 eq |
| GHG emission quantities for the maximized formal collection capacity | ||
| Potential E-waste collection quantity/year | 12,063,241.30 kg | 12,063,241.30 kg |
| Potential maximum formal collection quantity/year | 4,181,401.40 kg | 8,860,585.67 kg |
| Maximum formal collection percentage/year | 34.66% | 73.45% |
| GHG emissions for the maximum formal collection quantity/year | 593,426,532.63 kg CO2 eq | 511,375,544.65 kg CO2 eq |
| GHG emissions reduction contribution to the NDC 2030 target for the waste sector | ||
| GHG emission reduction quantity (from BAU to IEMS scenario) | 82,050,987.98 kg CO2 eq | |
| Emission reduction percentage | 13.83% | |
| NDC 2030 GHG emission reduction target quantity for the waste sector | 2,701,780,000 kg CO2 eq | |
| Potential annual GHG emissions reduction contribution to the 2030 NDC target | 3.04% | |
Disclaimer/Publisher’s Note: The statements, opinions and data contained in all publications are solely those of the individual author(s) and contributor(s) and not of MDPI and/or the editor(s). MDPI and/or the editor(s) disclaim responsibility for any injury to people or property resulting from any ideas, methods, instructions or products referred to in the content. |
© 2026 by the authors. Licensee MDPI, Basel, Switzerland. This article is an open access article distributed under the terms and conditions of the Creative Commons Attribution (CC BY) license (http://creativecommons.org/licenses/by/4.0/).
Copyright: This open access article is published under a Creative Commons CC BY 4.0 license, which permit the free download, distribution, and reuse, provided that the author and preprint are cited in any reuse.


