
Submitted:
30 January 2026
Posted:
30 January 2026
You are already at the latest version
Abstract
Eating disorders (EDs) are complex conditions that can significantly affect health and productivity, yet their assessment in occupational settings remains underexplored. This study aimed to evaluate the psychometric properties of the Italian version of the Eating Disorder Examination Questionnaire–Short Form (EDE-QS) among 1,912 workers undergoing health surveillance. Using an Item Response Theory framework, we tested dimensionality, reliability, and measurement invariance across gender, applying a graded response model to assess item discrimination and threshold parameters. Results supported a unidimensional structure with excellent internal consistency (ω ≈ .95) and strong indices of factor score determinacy and construct replicability. Measurement invariance analyses indicated configural and metric invariance but not full scalar invariance, due to differential item functioning in a subset of items. Latent mean differences were small, with women scoring slightly higher than men, and associations with psychological, occupational, and health-related variables did not differ by gender. These findings indicate that the Italian EDE-QS is a reliable and valid instrument for rapid screening of ED symptoms in workplace contexts. However, gender-related item bias warrants cautious interpretation of specific behaviors, suggesting the need for tailored assessments to enhance diagnostic accuracy and inform preventive interventions.
Keywords:
eating disorders
; eating disorder examination questionnaire
; short form
; graded response model
; measurement invariance
; gender differences
; workplace
; health promotion
; health surveillance
; prevention
1. Introduction
Eating disorders (EDs) are complex disorders with multiple causes, as defined by the Diagnostic and Statistical Manual of Mental Disorders (DSM-5-TR; American Psychiatric Association, 2022) and the World Health Organization (WHO) International Classification of Diseases and Related Health Problems (ICD-11; World Health Organization, 2019). They are a heterogeneous set of persistent alterations in eating behavior accompanied by an intense emotional component (Feng et al., 2023). The most common forms include anorexia nervosa (AN), bulimia nervosa (BN), binge eating disorder (BED), and other feeding and ED (Treasure et al., 2020). EDs tend to be more frequent in adolescence and early adulthood (Silén & Keski-Rahkonen, 2022; Smink et al., 2012), but in more than 25% of cases are persistent or recurrent and are still present after more than 5 years of follow-up (Solmi et al., 2024). Moreover, these disorders can also appear in adulthood (Davies, 2024; Samuels et al., 2019; Taba et al., 2021, p. 20; Ward et al., 2019). Clusters of first-onset cases may be associated with a concomitant medical condition (e.g., during the perimenopausal phase (Baker & Runfola, 2016); following cancer treatment (Rakusin et al., 2021); in polycystic ovary syndrome (Thannickal et al., 2020) or with psychological factors such as perfectionism, emotional discomfort, maladaptive coping mechanisms, insecure attachment patterns developed in childhood, emotional dysregulation, mood disorders (for reviews, see Barakat et al., 2023; Holland et al., 2013; Solmi et al., 2021; Striegel-Moore & Bulik, 2007; Varela et al., 2023; Zanella & Lee, 2022).
EDs are challenging to treat (De Boer et al., 2023; Johnson & Taylor, 1996; Touma et al., 2023) and have a relatively high mortality rate (Amiri & Ab Khan, 2025; Arcelus et al., 2011; Krug et al., 2025). Moreover, they often go undetected (Baranauskas et al., 2022; Cachelin & Striegel-Moore, 2006). It has been estimated that only around one-third of cases are identified by medical professionals and promptly treated (Keski-Rahkonen & Mustelin, 2016). For this reason, screening is a recommended measure in populations exposed to risk factors (Murray et al., 2025).
Work environments represent one of the settings in which these issues should be investigated, given that among ED determining factors there are several stressors that can be linked to work such as night work (Duong et al., 2020; Sørensen et al., 2013), circadian disruption and sleep deprivation (Mendoza, 2019), atypical light exposure (Engin, 2024), night eating (Abbott et al., 2018; Chellappa et al., 2025; Lent et al., 2022), interaction of shift work with chronotype (Amicis et al., 2023; Romo-Nava et al., 2022; Romo-Nava et al., 2020), alterations in biological rhythms (Hemmer et al., 2021; Kosmadopoulos et al., 2020; Meléndez-Fernández et al., 2023), disordered sleep (Mason et al., 2019; Nagata et al., 2021; Wilcox et al., 2024), emotional traumas (Convertino et al., 2022; Rienecke et al., 2022; Thomeczek et al., 2023), workplace or school violence and bullying (Day et al., 2022; Magnavita & Isolani, 2025), and occupational stress (King et al., 2009; Medisauskaite & Kamau, 2019; Qi & Wu, 2025).
The frequent association of EDs with metabolic (Dean et al., 2024; Hudson et al., 2010, 2020; Yu & Muehleman, 2023), cardiovascular (Sachs et al., 2016; TODAY Study Group et al., 2022), and mental illnesses (Alcaraz-Ibáñez et al., 2023; Conti et al., 2021; Dolan et al., 2022; Jelinek et al., 2018; Mitchell et al., 2021; Nelson et al., 2022; Rijkers et al., 2019) means that these disorders have a direct impact on productivity (e.g, absenteeism or presenteeism; Ubhi et al., 2025) and high healthcare costs (Ahmed et al., 2025). This should prompt corporate health and safety departments to actively investigate the presence of EDs and initiate policies to promote healthy eating. ED screening can be conducted by occupational physicians, and this is an essential step in improving worker health.
Although the incidence and prevalence of EDs in workplaces are significant, there are few studies conducted on workers. They have mostly focused on young people, such as students (Alhaj et al., 2022), especially medical students (Fekih-Romdhane et al., 2022; Jahrami et al., 2019) or on those with a particular focus on their body, such as athletes (Bratland-Sanda & Sundgot-Borgen, 2013; Chapa et al., 2022; Milano et al., 2020; Neglia, 2021). The presence of EDs has also been frequently studied in military personnel, especially in relation to obesity (Bartlett & Mitchell, 2015; Himmerich et al., 2024; Touma et al., 2023). Further research is needed to determine the prevalence of suspected EDs in workplace settings and to inform strategies that promote nutritional health and facilitate effective treatment.
The screening tools to be used in workplaces must be simple, quick-to-complete, and easily readable, as the time spent on these activities must not significantly impact productive activities. The occupational physician will be able to thoroughly examine the cases identified by screening and, if necessary, refer them to further specialized investigations.
The Eating Disorder Examination (EDE; Cooper et al., 1989; Fairburn & Cooper, 1993) is widely regarded as the gold standard for assessing ED symptomatology. Its self-report counterpart, the Eating Disorder Examination Questionnaire (EDE-Q; Fairburn & Beglin, 1994) has become a prevalent tool for ED assessment and monitoring (e.g., National Institute for Mental Health in England, 2008). However, the replicability of the EDE-Q’s original four-factor structure (restraint, eating concerns, weight concerns, and shape concerns) has been repeatedly questioned. Empirical evidence for this structure is inconsistent, with numerous studies failing to confirm the model and instead proposing alternative configurations, such as three- or two-factor solutions (Berg et al., 2012; Jenkins & Rienecke, 2022) Even large, heterogeneous samples have produced results that diverge substantially from the original framework (Burke et al., 2017; Kjeldbjerg et al., 2021). These issues are particularly pronounced in cross-cultural research, where symptom expression may vary, prompting calls for structural modifications to enhance validity across diverse populations (Costello et al., 2023; Heiss et al., 2018; Lichtenstein et al., 2021).
The original EDE-Q (28 items, 28-day reference) is unsuitable for session-by-session monitoring, as it cannot reliably capture weekly changes (Gideon et al., 2016). To address this limitation, several abbreviated versions have been proposed (for a review, see Machado et al., 2020). Gideon et al. (2016) developed the EDE-QS, a 12-item short form derived through statistical analyses and expert review. Modifications included reducing the response scale from six to four frequency levels and shortening the recall period to seven days, enhancing recall accuracy and sensitivity to short-term change. Initial validation demonstrated adequate internal consistency and temporal stability in adults, supporting its use for routine clinical outcome monitoring. Subsequent studies confirmed the EDE-QS’s reliability and validity across culturally diverse populations (Duffy et al., 2021; He et al., 2021; Mousavi Asl et al., 2021; Prnjak et al., 2020).
Cross-cultural adaptations of the EDE-QS (Dahlgren et al., 2025; Duffy et al., 2021; He et al., 2021; Mousavi Asl et al., 2021; Prnjak et al., 2020) have generally supported its validity and reliability across culturally diverse populations, and the unidimensional structure derived from Rasch modeling. However, differential item functioning (DIF) has emerged across gender groups in both Norwegian adolescents (Dahlgren et al., 2025) and Chinese college students (He et al., 2021). Specifically, item 6 (“desire to lose weight”) exhibited substantial DIF in the Chinese sample, while the Norwegian study identified similar DIF for item 6 and an additional effect for item 5 (“fear of weight gain”). These findings suggest that, at equivalent levels of symptom severity, women are more likely than men to endorse stronger weight-loss desires and fear of weight gain.
These findings align with prior evidence on gender differences in ED symptomatology, reflecting the interplay of sociocultural norms, body image ideals, and clinical presentation. Research consistently shows that women report higher levels of disordered eating characterized by shape and weight concerns, whereas men more often exhibit symptoms related to muscularity and body composition (Lavender et al., 2017; Schaefer et al., 2018, 2019). For example, Schaefer et al. (2018, 2019) noted that EDE-Q items may better capture female symptom profiles. Additionally, men appear less likely to identify with conventional diagnostic labels, contributing to underreporting of disordered eating behaviors (Kinasz et al., 2016; Lavender et al., 2017). Overall, while core symptoms overlap across genders, stigma surrounding male body image concerns often shapes distinct patterns of symptom expression (Lavender et al., 2017; Rand-Giovannetti et al., 2017)
To date, no studies have examined the psychometric properties of the EDE-QS in Italian samples, despite the availability of an Italian adaptation of the EDE-Q (Calugi et al., 2017). Given the potential impact of cultural factors on symptom expression, establishing the validity and reliability of the Italian EDE-QS is essential for its use in clinical and research contexts. Accordingly, this study aimed to evaluate the psychometric properties of the Italian EDE-QS in a large sample of workers from diverse production sectors undergoing health surveillance at the Catholic University of the Sacred Heart in Rome. Using publicly available data (see Section 2.1), we assessed the measurement model, gender invariance, DIF, and reliability and validity. To advance understanding of the measurement structure and invariance, we employed an Item Response Theory (IRT) framework, applying a two-parameter logistic (2-PL) model (Birnbaum, 1968; Embretson & Reise, 2000) rather than the Rasch model used in the original development.
The 2-PL model offers distinct advantages over the Rasch model for ordinal items such as those in the EDE-QS, primarily by allowing item discrimination to vary. Unlike the Rasch model, which assumes equal discrimination across items, the 2-PL model estimates a discrimination parameter for each item, indicating how effectively it differentiates individuals along the latent trait. This flexibility provides richer insights into item performance and better accommodates the complexity of ordinal data without imposing overly restrictive assumptions (Embretson & Reise, 2000). It is particularly useful when homogeneity in item discrimination cannot be assumed (Crane et al., 2006). Moreover, the 2-PL framework facilitates a more nuanced assessment of measurement invariance, enabling tests of both discrimination and threshold parameters across groups, especially in the case of clinical scales (e.g., Baroni et al., 2022)
Given gender differences in ED prevalence, we examined whether EDE-QS scores differed in their associations with key correlates across men and women. As a first step, we assessed the relationship with age, given prior evidence that adolescents and young adults report higher levels of ED psychopathology, whereas symptom severity tends to decline in older adults (Carrard et al., 2014; Hilbert et al., 2012, 2013). To detect a non-linear association, we also considered age as an ordered factor (Young adulthood [age < 44]; Middle adulthood [45 ≤ BMI < 65]; Elder [age ≥ 65]). We then examined the association of EDE-QS scores with the Body Mass Index (BMI), both as a continuous variable and as an ordered factor (Underweight [BMI < 18.5], Normal [18.5 ≤ BMI < 24.5], Overweight [24.5 ≤ BMI < 29.5], and Obese [BMI ≥ 29.5]).
The other correlates investigated in this study included indicators of general psychological distress, such as depression and anxiety (e.g., Tan et al., 2023), and of psychological well-being (De Vos et al., 2018; Wade et al., 2012); occupational distress, which can lead to unhealthy coping mechanisms, including disordered eating patterns (Medisauskaite & Kamau, 2019); poor sleep patterns, which can contribute to dysregulated eating behaviors and unhealthy weight management strategies (Kenny et al., 2018); health literacy and the understanding of nutritional practices, as research has shown that individuals with low health literacy are less likely to engage in healthy eating behaviors, which can increase the risk of disordered eating (Iskender et al., 2024). Moreover, promoting healthy eating literacy in workplace settings can enhance employees’ comprehension of nutritional information, potentially decreasing stress and improving overall health, thereby reducing the incidence of EDs (Agriopoulou & Koutelekos, 2020; Malta et al., 2025). The effects of work-related fatigue, particularly among shift workers, further complicate this landscape, as erratic work hours lead to poor cooking habits and unhealthy dietary choices. This can exacerbate both sleep disturbances and symptoms (Navruz-Varlı & Mortaş, 2024; Olenik & Hećimović, 2024; Sum et al., 2024).
The relationship between workplace violence and the development of eating disorders is an understudied critical area of research, although it has been shown that experiences of violence can significantly impact psychological well-being and behavior. For instance, a study by Brady (2008) indicates that lifetime exposure to family violence is linked to current symptoms of eating disorders in both young men and women, highlighting the role of affective symptoms such as depression and anxiety as mediators in this relationship. These conditions may be exacerbated in work environments where stress and violence are prevalent.
Finally, research indicates that ED symptomatology is associated with increased cigarette smoking as well as problematic alcohol use, suggesting that these behaviors may serve a dual function of weight control and emotional regulation (Baker et al., 2010, 2018; Munn-Chernoff et al., 2021).
2. Materials and Methods
2.1. Population
In 2022, employees of the Catholic University of Rome (Latium, Italy) who were undergoing routine preventive medical examinations for occupational exposure were invited to participate in a health promotion program designed to assess eating disorder symptomatology. Participants with suspected eating disorders were referred to the Italian National Health Service for further diagnostic evaluation and, where appropriate, treatment.
The initiative adopted a cross-sectional census design, inviting all workers to participate voluntarily, without exclusion criteria or active promotion. Participation rates were consistently high in similar programs (Magnavita, 2023), as neither employees nor companies incurred costs; activities fell within the occupational physician’s responsibilities. Participants provided informed consent and authorized the scientific use of their data. Results were anonymized and communicated to employers, company prevention services, and workers’ representatives, accompanied by the occupational physician’s recommendations for workplace preventive measures.
The data collected in the survey were deposited in a publicly available repository (Magnavita, 2025) and secondary data analyses other than the one presented here have already been published (Magnavita & Isolani, 2025). The sample used in this study comprised 1,912 participants. There were 1,170 (61.2%) women and 742 (38.8%) men, mean age was 45.63 (SD = 11.73, range 21-72). These workers were affiliated with various enterprises across sectors, including health (1,028, 53.8%), commercial (605, 31.6%), social (172, 9.0%), and industrial (107, 5.6%).
The research received approval from the Ethics Committee of Università Cattolica del Sacro Cuore, Policlinico A. Gemelli, Rome, on March 3, 2022 (ID 4671).
2.2. Measures
The Examination Questionnaire, Short Form (EDE-QS, Gideon et al., 2016; the Italian version of the items has been taken from the Italian EDE-Q by Calugi et al., 2017) comprises ten items describing ED-related behaviour and two items concerning negative feelings towards one’s body. The first ten items ask participants to report how often they have engaged in those behaviors over the past seven days on 4-point scale (from “never” = 0 to “6-7 days” = 3), while the last two items require reporting the impact of the negative feelings, still on a 4-point scale (from “not at all” = 0 to “markedly” = 3). The overall score varies from 0 to 36.
Depression and anxiety symptomatology was evaluated using the Italian version (Magnavita, 2007a) of the Goldberg Scale (GADS; Goldberg et al., 1988). Each scale consists of 9 binary questions, with one point awarded for each affirmative response. An individual exhibiting more than five anxiety symptoms or two depressive symptoms has a 50% likelihood of experiencing a clinically significant disruption, with the probability increasing markedly beyond these thresholds.
Psychological well-being was measured with a single question asking how happy the worker, in general, felt at that time in their life on a scale from 0 to 10. We employed a single-item instrument, consistent with most studies in literature (Lukoševičiūtė et al., 2022, 2022) and epidemiological research on extensive populations. It has been shown that such measure has a test-retest reliability of 0.86 and adequate criterion and construct validity (Abdel-Khalek, 2006).
The Italian version (Magnavita, 2007b) of Siegrist’s Effort-Reward Imbalance (ERI) questionnaire (Siegrist, 1996) was employed to assess work-related stress. This study employed the abbreviated Italian version of the questionnaire (Magnavita et al., 2012) that comprises 10 items. Three items tap into the effort exerted by workers in their daily job tasks while the remaining seven require the evaluation of the material or immaterial rewards derived from labor. Participants are asked to report their agreement with each item on a 4-point, Likert-type scale (from 1 = “completely disagree” to 4 = “completely agree”). A measure of occupational stress can be obtained as a weighted ratio of the mean score on effort items to the mean score of reward items (Effort/Reward Imbalance Index, ERI). Values exceeding 1 indicate distress.
Sleep quality was assessed using the Italian version (Curcio et al., 2013) of the Pittsburgh Sleep Quality Index (PSQI; Buysse et al., 1989). The PSQI is a self-report instrument comprising Likert-type and open-ended items that evaluate subjective sleep quantity and quality. Item scores range from 0 to 3, with higher scores indicating greater sleep impairment. The questionnaire yields seven component scores (i.e., subjective sleep quality, sleep latency, sleep duration, sleep efficiency, sleep disturbances, use of sleep medication, and daytime dysfunction) which are summed to produce a global PSQI score ranging from 0 to 21.
Health literacy was assessed using the Health Literacy Short Form (HLS-SF12; Finbråten et al., 2018), which consists of 12 selected questions relative to therapies, prevention, and promotion of health from the 47-item European Health Literacy Questionnaire (Sørensen et al., 2013; the Italian version of the items has been taken from the Italian HLS-EU-Q47 by Lorini et al., 2017). Participants were asked to evaluate the ease of performing specific tasks, such as locating information about sickness treatments, using a 4-point Likert-type scale ranging from 1 = “very easy” to 4 = “very difficult”. The overall score may vary from 12 to 48.
The Digital Healthy Diet Literacy survey (DHDLS; Duong et al., 2020) was employed to assess each worker’s proficiency in locating dietary information online. It comprises four items describing the ability to find, process, and implement dietary information. Each item is a 4-point Likert-type scale ranging from 1 = “very easy” to 4 = “very difficult”. The overall score may vary from 4 to 16.
Workers were also queried regarding factors potentially linked to EDs. The study examined carrying out night shifts in the preceding year through a binary yes/no question. The investigation into workplace violence utilized items from Arnetz’s 4-item Violent Incident Form (VIF; Arnetz, 1998) to determine if respondents experienced physical assault, threats, harassment, or persistent and intrusive violence (such as stalking) in the preceding year. Single questions were used to collect data about daily smoking (four categories: “never smoked”, “quitted smoking”, “sometimes”, “always”) and alcohol drinking (from 0 = “no unit” to 3 = “2 or more units”).
2.3. Data Analysis
Initially, frequency distributions of responses for each EDE-QS item were examined in the total sample and in gender-specific subsamples to verify that all response options were endorsed. The extent of missing data was also evaluated and found to be minimal, with missing responses limited to item 1 (n = 2; 0.10%), item 11 (n = 1; 0.05%), and item 12 (n = 9; 0.47%). Given the negligible proportion of missing values, data were assumed to be missing completely at random and were imputed using the imputeMissing function from the mirt package (version 1.45.1; Chalmers, 2012) in R (version 4.4.2; R Core Team, 2024).
The measurement model for the EDE-QS items was specified using the graded response model (GRM; Samejima, 1969, 1997). The GRM is a two-parameter logistic model suitable for items with two or more ordered response categories, such as those of the EDE-QS. It estimates an item-specific discrimination (slope) parameter and a set of k - 1 threshold parameters corresponding to the boundaries between adjacent response categories.
As with all item response theory (IRT) models, accurate estimation of graded response model (GRM) parameters depends on the extent to which the assumption of unidimensionality is satisfied (i.e., whether a single latent trait accounts for the observed item responses). As noted by Reise et al. (2015), psychological constructs are often defined by multiple, conceptually diverse indicators, and content-valid measurement therefore entails heterogeneous item pools. Consequently, strict unidimensionality is rarely achieved in practice; however, measures may still be considered sufficiently unidimensional for IRT modeling purposes. This issue has been discussed in detail by Reise et al. (2015) and Rodriguez et al. (2016a, 2016b).
The dimensionality and factor structure of the EDE-QS item pool were examined in the total sample and in gender-specific subsamples using multiple complementary methods. To determine whether a unidimensional or multidimensional measurement model was more appropriate, we first estimated the optimal number of factors using the scree test (Cattell, 1966), parallel analysis (PA; Horn, 1965; Longman et al., 1989), and the minimum average partial (MAP) correlation statistic (Velicer, 1976). The rationale for employing these methods is detailed in Section 1 of the Supplementary Materials (SM1). These analyses were conducted using the fa parallel and vss functions from the psych package (version 2.4.6.26; Revelle, 2024) in R. When evidence supported a multidimensional solution, exploratory multidimensional item response theory (E-MIRT) models were estimated to identify multiple latent traits underlying item responses without imposing a priori constraints on the factor structure. E-MIRT is well suited for binary or ordinal items and employs full-information maximum likelihood estimation, yielding likelihood-based fit indices (Reckase, 2009). This analysis was performed using the mirt function in the mirt package (version 1.45.1; Chalmers, 2012) in R.
Second, graded response models (GRMs) were fitted to the full sample and to gender-specific subsamples using the mirt function from the mirt package (version 1.45.1; Chalmers, 2012) in R. Unidimensionality was preliminarily evaluated by examining item loadings on the single latent factor, with loadings exceeding .30 indicating that the factor accounted for at least 10% of item variance. In addition, three recommended unidimensionality indices (Rodriguez et al., 2016a, 2016b) were computed using dedicated functions from the BifactorIndicesCalculator package (version 0.2.2; Dueber, 2021). Composite reliability was assessed using McDonald’s omega (McDonald, 1999), an index appropriate for summed total scores with equally weighted items and shown to provide a more accurate estimate of internal consistency than Cronbach’s alpha, as it does not assume tau-equivalence and accounts for variance attributable to all latent factors (Bentler, 2007; McNeish, 2018). Omega coefficients greater than .80 were interpreted as a necessary, though not sufficient, condition for unidimensionality (Rodriguez et al., 2016a, 2016b). Factor score determinacy (FSD) represents the multiple correlation between observed variables and their corresponding latent factor (Grice, 2001), indexing the proportion of factor variance captured by the estimated factor scores. Values exceeding .90 indicate adequate unidimensionality and support the validity of factor score use (Gorsuch, 1983). Finally, construct replicability was evaluated using the H index (Hancock & Mueller, 2001), which reflects the extent to which a latent variable is well defined by its indicators and is expected to replicate across studies. Values of .70 or higher were considered adequate. Confidence intervals for all indices were estimated via bootstrapping.
Model goodness of fit was evaluated using the C2 statistic (Cai & Monroe, 2014), an omnibus limited-information fit index with an approximate χ² distribution. Like the traditional χ² statistic, C2 is sensitive to sample size and may therefore reject well-fitting models in large samples. The M2 function in the mirt package additionally provided SEM-based fit indices derived from the C2 statistic, including the comparative fit index (CFIC2), Tucker–Lewis index (TLIC2) and the root mean square error of approximation (RMSEAC2) with 95% confidence intervals. Because no formal cutoff guidelines exist for C2-based indices, commonly used structural equation modeling (SEM) criteria were applied for heuristic evaluation of single-model fit (RMSEA ≤ .06/.08 and CFI/TLI ≥ .95/.90 for excellent/acceptable fit, respectively; Marsh et al., 2004), with due caution in their interpretation. Item-level fit was assessed using the S-X² statistic (Orlando & Thissen, 2003), computed via the itemfit function in the mirt package (version 1.45.1; Chalmers, 2012), which has demonstrated adequate performance with the GRM (Kang & Chen, 2011).
As a check for parsimony, we also tested a “reduced” model in which discrimination parameters were constrained to be equal for all items (hence a 1-PL model), and compared its fit with the 2-PL GRM model. The relative fit of the GRM and reduced GRM models was evaluated using a likelihood-ratio test based on the deviance statistic, defined as the difference in −2 log-likelihood (−2LL) between models. This statistic follows a χ² distribution with degrees of freedom equal to the difference in the number of estimated parameters between the full GRM (with item-specific discrimination parameters) and the reduced model (with a single discrimination parameter). Model comparisons were further informed by information criteria, including the Akaike Information Criterion (AIC; Akaike, 1974), the Bayesian Information Criterion (BIC; Schwarz, 1978), and the sample-size adjusted BIC (SABIC; Sclove, 1987). Although these indices do not provide absolute measures of model fit, lower values indicate superior relative fit. Therefore, they were used to compare the GRM and its reduced version and the measurement invariance models described below. Caution should also be exercised in considering these indices, since, with sufficiently large sample sizes, they tend to support more complex alternatives (see Marsh et al., 2005).
The same goodness-of-fit criteria were applied to evaluate measurement invariance of the EDE-QS across gender. Model comparisons were conducted using chi-square difference tests; however, given their sensitivity to sample size, changes in approximate fit indices were also considered. Consistent with recommendations in the SEM literature, invariance was supported when changes in the CFI were smaller than .01 and changes in the RMSEA were smaller than .015 (Chen, 2007; Cheung & Rensvold, 2002).
Measurement invariance across gender was evaluated using a sequence of nested models. First, a configural invariance model (Model 1) was specified, in which all discrimination (slope) and threshold parameters were freely estimated across groups. Next, a metric invariance model (Model 2) was estimated by constraining discrimination parameters to equality across groups. Finally, a scalar invariance model (Model 3) was tested, imposing equality constraints on both discrimination parameters and thresholds. This model permits valid comparisons of latent means and the evaluation of differential item functioning (DIF), defined as group differences in response probabilities among individuals with equivalent levels of the latent trait. Evidence of DIF across all items would invalidate latent mean comparisons, whereas partial invariance, which is expected when thresholds are invariant for only a subset of items, is sufficient for meaningful inference. Following Byrne et al. (1989), invariance of at least two item thresholds per latent trait was considered adequate for latent mean estimation.
To identify items exhibiting substantial DIF, we applied the procedure proposed by Meade and Wright (2012). Starting from the full scalar invariance model, likelihood ratio tests (LRTs; Thissen et al., 1988, 1993) were used to sequentially free item parameters while treating the remaining items as anchors. Five items with nonsignificant LRTs and the largest discrimination parameters were selected as anchor items according to the A5 method, and a partial scalar invariance model (Model 3p) was subsequently estimated. Because LRTs may detect trivial DIF in large samples, item-level DIF was additionally evaluated using the Expected Score Standardized Difference (ESSD), interpreted according to Cohen’s (1988) benchmarks for effect size (i.e., |d|< 0.20 negligible effect; 0.20 ≤ |d| < 0.50: small effect; 0.50 ≤ |d| < 0.80: moderate effect; |d| ≥ 0.80 large effect).
Finally, we tested whether the correlation of the EDE-QS score with the other variables of interest differed between women and men using a test for the comparison of independent correlation coefficients (Fisher, 1925), as implemented in the cocor.indep.groups function in the cocor package (version 1.1-4; Diedenhofen & Musch, 2015) in R. Correlations between the EDE-QS score and metric variables were computed as Pearson’s correlation coefficient using the cor.test function of the stats basic package in R. Correlations between the EDE-QS score and categorical variables were computed as the square root of the eta-square effect size of analysis of variance using the eta_squared function in the effectsize package (version 1.0.1; Ben-Shachar et al., 2020) in R. Correlations between the EDE-QS score and ordinal variables were computed as polyserial correlations using the polyserial function in the polycor package (version 0.8-1; Fox, 2022) in R.
3. Results
3.1. Frequency Distribution of EDE-QS
We initially inspected the frequency distribution of the four possible answers to the EDE-QS items (Figure 1).
All items showed a substantial positive skewness, particularly item 7. The details of frequencies and percentages are reported in SM2.
3.2. EDE-QS Dimensionality and Measurement Model
We then investigated the dimensionality of the EDE-QS in the total sample and in the subsamples defined by gender. The results of the scree-test, the PA, and the MAP are shown in Figure 2. In all cases, we found evidence of a strong first factor, which explained at least 58% of variance. The descending line of the eigenvalues started to flatten out from the second factor, and the MAP values reached their minimum with one factor. However, there was some evidence of multidimensionality, as the parallel analysis suggested that the optimal number of factors could be two in the total and in the men sample.
We thus tested a two-factor model in all samples using E-MIRT. According to the criteria described in Section 2.3, the two-factor models had a better fit than the unidimensional models (Table 1), but did not show evidence of ‘approximate simple structure’ (Sass & Schmitt, 2010), that is, a solution with all items substantially loading (> |0.30|) on only one factor, with near-zero cross-loadings, and with factors defined by at least three indicators. Instead, we found that in all solutions there was at least one item with more than one substantial loading, and the factor correlations exceeded .70, suggesting redundancy (see SM3 for details). Taking into account that the loadings on the first factor were all larger than 0.60 (see SM3), that the second factor explained at best 10.5% of variance, and that the first-to-second eigenvalue ratios were well over 4 (Slocum-Gori & Zumbo, 2011), we considered the unidimensional solution as an appropriate and a more parsimonious measurement model for the EDE-QS items.
The unidimensional GRM model proved also to have a better fit than the reduced model (1-PL), suggesting that the assumption of tau-equivalence was not adequately supported (loadings ranged from 0.60 to 0.90, see SM3).
Parameter estimates for the GRM are reported in Supplementary Material 4 (SM4). According to Baker (2001), discrimination parameters exceeding .65 indicate adequate differentiation between low and high levels of the latent trait; this criterion was surpassed by all items across samples. Although several items yielded statistically significant S-X² statistics following Benjamini–Hochberg false discovery rate correction (Benjamini & Hochberg, 2000), likely reflecting the large sample size, associated RMSEA values were consistently below .05. These results indicate satisfactory model fit across samples (see Supplementary Material 5, SM5).
The indices of unidimensionality were adequate in all samples. In the total sample omega was .949 [.942; .951], FSD was .981 [.979; .981], and H was .962 [.959; .962]. In the women sample these values were .950 [.940; .957], .979 [.976; .983], and .959 [.953; .966], respectively. In the men sample these values were .951 [.940; .959], .983 [.980; .987], and .967 [.961; .974], respectively.
Taken together, these results suggest that the EDE-QS could be considered as unidimensional in the total sample and in the subsamples defined by gender.
3.3. EDE-QS Invariance Across Gender
When we tested the measurement invariance across gender, we found support for configural (Model 1) and metric (Model 2) invariance but not for scalar invariance (Table 1). Model 2 had a CFI which was more than .01 smaller than the CFI of Model 1, but the chi-square difference was not statistically significant. Considering the sensitivity of this test to sample size, we interpreted this result as support for metric invariance (i.e., invariance of slopes). Moreover, when we tested the invariance of each slope, none of them were statistically significant (see SM6).
The drop in CFI from the metric to the scalar invariance model (Model 3) was larger than .01 and the chi-square test was statistically significant (Table 1). Therefore, we ran a DIF analysis and identified the five no-DIF items with the largest slopes, which were used as anchors (items 1 [‘Limit amount of food’], 3 [‘Thinking about food hinders concentration’], 4 [‘Thinking about weight hinders concentration’], 6 [‘Desire to lose weight’], and 11 [‘Weight/shape influenced self-concept’]). We then tested a partial invariance model (Model 3p), whose fit was adequate and not substantially different from that of Model 2 (Table 1). This model also allowed us to test the latent mean difference, which was statistically significant, with higher scores in women but a small effect size (estimate = 0.34, standard error = 0.06, z = 5.91, p < 0.001; d = 0.35 [0.25, 0.44]). ESSDs for the EDE-QS items are reported in Figure 3.
We observed a moderate DIF for item 8 (‘Exercising for controlling weight’), small DIFs for items 2 (‘Long periods not eating’), 7 (‘Vomiting or using laxatives’), and 9 (‘Lost control over eating’). Notably, in all these items men tended to show higher expected scores than women with the same trait level. In all other items the DIF was negligible.
3.4. Correlates of EDE-QS Across Gender
Table 2 reports the correlations of EDE-QS with the other variables considered in this study and the results of their comparisons across gender. No comparison was significant after adjustment of the p-values for multiple comparisons and effect sizes were all negligible (r < |0.10|), suggesting that the pattern of association of EDE-QS with the other variables did not differ between women and men.
4. Discussion
This study evaluated the psychometric properties of the Italian version of the Eating Disorder Examination Questionnaire-Short Form (EDE-QS; Gideon et al., 2016) in a large sample of workers undergoing health surveillance. Using an Item Response Theory framework, we examined dimensionality, reliability and measurement invariance across gender, and we tested associations with relevant correlates. Results supported a unidimensional structure, consistent with previous validations (Duffy et al., 2021; Gideon et al., 2016; He et al., 2021; Mousavi Asl et al., 2021; Prnjak et al., 2020). Internal consistency was excellent (ω ≈ .95; McDonald, 1999), and indices of factor score determinacy and construct replicability exceeded recommended thresholds (Hancock & Mueller, 2001). Measurement invariance analyses indicated configural and metric invariance but not full scalar invariance, due to differential item functioning (DIF) in a subset of items. Latent mean differences were small, with women scoring slightly higher than men, in line with prior evidence on gender differences in ED symptomatology (Lavender et al., 2017; Schaefer et al., 2018, 2019).
The findings confirm that the Italian EDE-QS is a psychometrically robust instrument for assessing ED symptoms in occupational settings. Strong unidimensionality indices and high discrimination parameters suggest that the scale effectively captures a single latent construct, consistent with the Rasch-based unidimensional structure reported in cross-cultural adaptations (Dahlgren et al., 2025; He et al., 2021). Reliability met conventional standards (Rodriguez et al., 2016b, 2016a), supporting the use of sum scores for assessment and screening purposes.
The lack of scalar invariance seems to reflect gender-specific symptom expression documented in previous studies (Lavender et al., 2017; Rand-Giovannetti et al., 2017). The detection of DIF in items assessing behaviors such as exercising to control weight, prolonged fasting, vomiting or laxative use, and loss of control on eating provides important insights into this issue. Notably, men exhibited higher expected scores than women at equivalent levels of the latent construct, suggesting that these behaviors may hold greater salience in male presentations of ED symptomatology. This pattern is consistent with prior research indicating that men often engage in compensatory behaviors, particularly excessive exercise, as part of weight-control strategies, likely reflecting sociocultural ideals that emphasize muscularity and leanness rather than thinness (Lavender et al., 2017; Schaefer et al., 2018, 2019). Such behaviors may be perceived as socially acceptable or even desirable in male populations, potentially contributing to under-recognition of disordered eating in men (Kinasz et al., 2016; Rand-Giovannetti et al., 2017)
The presence of DIF in items related to purging and fasting behaviors, although traditionally associated with female profiles, suggests that these strategies are not absent among men but may manifest differently or in response to distinct body image concerns. Previous studies have highlighted that while core symptoms overlap across genders, men often report patterns linked to muscularity-oriented goals rather than weight loss per se (Lavender et al., 2017; Schaefer et al., 2018, 2019). This divergence underscores the complexity of assessing ED symptoms in men and the limitations of instruments developed and phrased primarily for female populations (Thielemann et al., 2019). Furthermore, stigma surrounding male body image concerns and reluctance to endorse conventional diagnostic labels may lead men to emphasize behaviors such as exercise while minimizing other symptoms, complicating clinical detection (Rand-Giovannetti et al., 2017).
From a measurement perspective, these findings highlight the importance of considering gender-related item bias when interpreting EDE-QS scores. Although the overall impact of DIF on total scores was modest, failure to account for such differences could obscure meaningful variations in symptom profiles and perpetuate gender disparities in diagnosis and treatment, supporting the critical demand for tailored assessments that accurately reflect diverse gender experiences in EDs (Brasil et al., 2023). Future research should explore whether item-level adjustments or gender-specific norms can enhance the validity of screening tools in diverse populations. Clinically, practitioners should be aware that elevated scores on exercise-related items may signal significant pathology in men, even in the absence of high endorsement of traditional ED behaviors.
Nevertheless, metric invariance supports the meaningful comparison of associations with external variables across genders. In this study, we observed no significant gender differences in these associations, indicating that, despite minor gender-related item functioning differences, the overall relationship between ED symptomatology and psychological or occupational factors remains largely invariant. These findings suggest that mechanisms linking ED symptoms to correlates such as mood disturbances (Tan et al., 2023), sleep impairment (Kenny et al., 2018), and occupational stress (Medisauskaite & Kamau, 2019) operate similarly in men and women. Consistent with prior research, our results imply that while gender may influence prevalence and initial symptom expression, its impact on broader psychological health associations diminishes substantially (Coelho et al., 2021; Joy et al., 2022; Tomba et al., 2014). Practically, interventions addressing psychological distress, sleep problems, and health literacy appear equally relevant for both genders in workplace contexts.
Some limitations need to be acknowledged. First, the cross-sectional design precluded the assessment of temporal stability and predictive validity (Hilbert et al., 2012). Second, although the sample enrolled for this study was large and heterogeneous and included workers from multiple sectors, it was drawn from a single cultural context, limiting cross-cultural generalizability (Costello et al., 2023; Lichtenstein et al., 2021). Third, participants were not formally evaluated for an ED diagnosis, and this did not allow us to test the criterion validity and screening efficacy of the questionnaire and to compute diagnostic cut-off scores. While the current findings provided evidence of robust psychometric properties in a non-clinical population, the lack of clinical data limits conclusions regarding the questionnaire’s ability to accurately differentiate individuals with ED from those without. As a provisional guidance for Italian practitioners, we report the EDE-QS total scores that correspond to scores 2 and 3 standard deviations above the mean (Women: 16.01 and 21.40, respectively; Men: 13.62 and 18.45, respectively) and to the 95th, 97.5th, and 99th percentile (Women: 16.00, 19.00, and 23.00, respectively; Men: 14.00, 17.00, and 21.59, respectively). However, future research should incorporate clinically diagnosed participants to enable rigorous validation against gold-standard diagnostic criteria and to determine optimal thresholds for screening purposes. Such work is essential to ensure the tool’s applicability in both research and clinical settings.
5. Conclusions
The Italian EDE-QS appears suitable for rapid screening of ED symptoms in workplace health surveillance programs (Murray et al., 2025). Its brevity and strong psychometric properties make it an efficient tool for occupational physicians and mental health professionals (Gideon et al., 2016). The findings also contribute to the literature on gender differences in ED symptomatology (Lavender et al., 2017; Schaefer et al., 2018, 2019), highlighting the need for nuanced interpretation of specific items. Organizations may use the EDE-QS to identify employees at risk and implement preventive interventions, thereby promoting well-being and productivity (Ubhi et al., 2025). However, practitioners should be aware of potential gender-related response patterns when interpreting individual scores.
Supplementary Materials
The following supporting information can be downloaded at: Preprints.org. Table SM1: Rationale of the dimensionality tests; Table SM2: Frequencies and percentages of score endorsement. Table SM3: Factor loading matrices. Table SM4: Parameter estimates; Table SM5: Orlando and Thissen’s (2003) S-X2 item fit indices, Table SM6: Slopes modification indices for the metric invariance model. Table SM7: Details of the correlational analyses.
Author Contributions
Conceptualization, N.M. and C.C.; formal analysis, C.C.; investigation, N.M.; writing—original draft preparation, N.M. and C.C.; writing—review and editing, N.M. and C.C. All authors have read and agreed to the published version of the manuscript.
Funding
This research received no external funding.
Institutional Review Board Statement
The study was conducted in accordance with the Declaration of Helsinki, and approved by the Ethics Committee of the Università Cattolica del Sacro Cuore, Rome, Italy, on 3 March 2022 (ID 4671).
Informed Consent Statement
Informed consent was obtained from all subjects involved in the study.
Data Availability Statement
Data are deposited on Zenodo https://doi.org/10.5281/zenodo.15685523. (Uploaded on 17 June 2025). Supplementary materials are deposited on Zenodo. https://doi.org/10.5281/zenodo.18141113. (Uploaded on 3 January 2026).
Conflicts of Interest
The authors declare no conflicts of interest.
Abbreviations
The following abbreviations are used in this manuscript:
| 1-PL | One-parameter logistic model |
| −2LL | −2 log likelihood |
| 2-PL | Two-parameter logistic model |
| AIC | Akaike Information Criterion |
| AN | Anorexia nervosa |
| ANOVA | Analysis of variance |
| BED | Binge eating disorder |
| BIC | Bayesian Information Criterion |
| BMI | Body mass index |
| BN | Bulimia nervosa |
| CFI | Comparative fit index |
| CI | Confidence interval |
| df | Degrees of freedom |
| DHDLS | Digital Healthy Diet Literacy survey |
| DIF | Differential item functioning |
| DSM-5-TR | Diagnostic and Statistical Manual of Mental Disorders, 5th edition, Text Revision |
| ED | Eating disorder |
| EDE | Eating Disorder Examination |
| EDE-Q | Eating Disorder Examination - Questionnaire |
| EDE-QS | Eating Disorder Examination – Questionnaire short form |
| ERI | Effort-Reward Imbalance questionnaire |
| ESSD | Expected Score Standardized Difference |
| FSD | Factor score determinacy |
| GADS | Goldberg Depression/Anxiety Scale |
| GOF | Goodness of fit |
| GRM | Graded response model |
| HLS-EU-Q47 | European Health Literacy Questionnaire |
| HLS-SF12 | Health Literacy Scale-Short Form |
| ICD-11 | International Classification of Diseases, 11th edition |
| IRT | Item Response Theory |
| LRT | Likelihood ratio test |
| MAP | Velicer’s minimum average partial correlation statistic |
| PA | Parallel analysis |
| PSQI | Pittsburgh Sleep Quality Index |
| RMSEA | Root mean square error of approximation |
| SABIC | sample size-adjusted Bayesian Information Criterion |
| SEM | Structural equation modeling |
| SM | Supplementary material |
| TLI | Tucker-Lewis index |
| VIF | Violent Incident Form |
| WHO | World Health Organization |
References
- Abbott, S., Dindol, N., Tahrani, A. A., & Piya, M. K. (2018). Binge eating disorder and night eating syndrome in adults with type 2 diabetes: A systematic review. Journal of Eating Disorders, 6(1), 36. [CrossRef]
- Abdel-Khalek, A. M. (2006). Measuring happiness with a single-item scale. Social Behavior and Personality, 34(2), 139–150. [CrossRef]
- Agriopoulou, S., & Koutelekos, I. (2020). The impact of mediterranean diet in perioperative nurses’ health. Health & Research Journal, 6(1), 21. [CrossRef]
- Ahmed, M., Islam, M. D., Aouad, P., Miskovic-Wheatley, J., Touyz, S., Maguire, S., & Cunich, M. (2025). Global and regional economic burden of eating disorders: A systematic review and critique of methods. International Journal of Eating Disorders, 58(1), 91–116. [CrossRef]
- Akaike, H. (1974). A new look at the statistical model identification. IEEE Transactions on Automatic Control, 19(6), 716–723. [CrossRef]
- Alcaraz-Ibáñez, M., Paterna, A., & Griffiths, M. D. (2023). Social physical anxiety and eating disorders: A systematic review and meta-analysis. Body Image, 45, 133–141. [CrossRef]
- Alhaj, O. A., Fekih-Romdhane, F., Sweidan, D. H., Saif, Z., Khudhair, M. F., Ghazzawi, H., Nadar, M. Sh., Alhajeri, S. S., Levine, M. P., & Jahrami, H. (2022). The prevalence and risk factors of screen-based disordered eating among university students: A global systematic review, meta-analysis, and meta-regression. Eating and Weight Disorders, 27(8), 3215–3243. [CrossRef]
- American Psychiatric Association. (2022). Diagnostic and statistical manual of mental disorders (5th ed., text rev.). [CrossRef]
- Amicis, R. D., Galasso, L., Cavallaro, R., Mambrini, S. P., Castelli, L., Montaruli, A., Roveda, E., Esposito, F., Leone, A., Foppiani, A., Battezzati, A., & Bertoli, S. (2023). Sex differences in the relationship between chronotype and eating behaviour: A focus on binge eating and food addiction. Nutrients, 15(21), 4580. [CrossRef]
- Amiri, S., & Ab Khan, M. (2025). Is eating disorders a risk agent for all-cause mortality: A meta-analysis. Eating Disorders, 33(5), 602–636. [CrossRef]
- Arcelus, J., Mitchell, A. J., Wales, J., & Nielsen, S. (2011). Mortality rates in patients with anorexia nervosa and other eating disorders:. A meta-analysis of 36 studies. Archives of General Psychiatry, 68(7), 724. [CrossRef]
- Arnetz, J. E. (1998). The Violent Incident Form (VIF): A practical instrument for the registration of violent incidents in the health care workplace. Work & Stress, 12(1), 17–28. [CrossRef]
- Baker, F. B. (2001). The basics of item response theory (2nd ed.). ERIC Clearinghouse on Assessment and Evaluation.
- Baker, J. H., Johnson, N. K., Munn-Chernoff, M. A., Lichtenstein, P., Larsson, H., Maes, H. H., & Kendler, K. S. (2018). Illicit drug use, cigarette smoking, and eating disorder symptoms: Associations in an adolescent twin sample. Journal of Studies on Alcohol and Drugs, 79(5), 720–724. [CrossRef]
- Baker, J. H., Mitchell, K. S., Neale, M. C., & Kendler, K. S. (2010). Eating disorder symptomatology and substance use disorders: Prevalence and shared risk in a population based twin sample. International Journal of Eating Disorders, 43(7), 648–658. [CrossRef]
- Baker, J. H., & Runfola, C. D. (2016). Eating disorders in midlife women: A perimenopausal eating disorder? Maturitas, 85, 112–116. [CrossRef]
- Barakat, S., McLean, S. A., Bryant, E., Le, A., Marks, P., National Eating Disorder Research Consortium, Aouad, P., Barakat, S., Boakes, R., Brennan, L., Bryant, E., Byrne, S., Caldwell, B., Calvert, S., Carroll, B., Castle, D., Caterson, I., Chelius, B., Chiem, L., … Maguire, S. (2023). Risk factors for eating disorders: Findings from a rapid review. Journal of Eating Disorders, 11(1), 8. [CrossRef]
- Baranauskas, M., Kupčiūnaitė, I., & Stukas, R. (2022). Potential triggers for risking the development of eating disorders in non-clinical higher-education students in emerging adulthood. Nutrients, 14(11), 2293. [CrossRef]
- Baroni, D., Caccico, L., Ciandri, S., Di Gesto, C., Di Leonardo, L., Fiesoli, A., Grassi, E., Lauretta, F., Lebruto, A., Marsigli, N., Policardo, G. R., Rosadoni, M., & Chiorri, C. (2022). Measurement invariance of the Liebowitz Social Anxiety Scale-Self-Report. Journal of Clinical Psychology. [CrossRef]
- Bartlett, B. A., & Mitchell, K. S. (2015). Eating disorders in military and veteran men and women: A systematic review. International Journal of Eating Disorders, 48(8), 1057–1069. [CrossRef]
- Benjamini, Y., & Hochberg, Y. (2000). On the adaptive control of the false discovery rate in multiple testing with independent statistics. Journal of Educational and Behavioral Statistics, 25(1), 60–83. [CrossRef]
- Ben-Shachar, M., Lüdecke, D., & Makowski, D. (2020). effectsize: Estimation of effect size indices and standardized parameters. Journal of Open Source Software, 5(56), 2815. [CrossRef]
- Bentler, P. M. (2007). Covariance structure models for maximal reliability of unit-weighted composites. In S. Lee (A c. Di), Handbook of computing and statistics with applications: Vol. 1 (pp. 1–19). Elsevier.
- Berg, K. C., Peterson, C. B., Frazier, P., & Crow, S. J. (2012). Psychometric evaluation of the Eating Disorder Examination and Eating Disorder Examination-Questionnaire: A systematic review of the literature. International Journal of Eating Disorders, 45(3), 428–438. [CrossRef]
- Birnbaum, A. (1968). Some latent trait models and their use in inferring an examinee’s ability. In F. M. Lord & M. R. Novick (A c. Di), Statistical theories of mental test scores. Addison-Wesley.
- Brady, S. S. (2008). Lifetime family violence exposure is associated with current symptoms of eating disorders among both young men and women. Journal of Traumatic Stress, 21(3), 347–351. [CrossRef]
- Brasil, K. M., Mims, C. E., McDermott, R. C., & Pritchard, M. E. (2023). Checking the scales: A psychometric evaluation of the Weight Concerns Scale in a sample of college-aged cisgender men from the United States. Psychological Assessment, 35(3), 218–228. [CrossRef]
- Bratland-Sanda, S., & Sundgot-Borgen, J. (2013). Eating disorders in athletes: Overview of prevalence, risk factors and recommendations for prevention and treatment. European Journal of Sport Science, 13(5), 499–508. [CrossRef]
- Burke, N. L., Tanofsky-Kraff, M., Crosby, R. D., Mehari, R. D., Marwitz, S. E., Broadney, M. M., Shomaker, L. B., Kelly, N. R., Schvey, N. A., Cassidy, O., Yanovski, S. Z., & Yanovski, J. A. (2017). Measurement invariance of the Eating Disorder Examination in black and white children and adolescents. International Journal of Eating Disorders, 50(7), 758–768. [CrossRef]
- Buysse, D. J., Reynolds, C. F., Monk, T. H., Berman, S. R., & Kupfer, D. J. (1989). The Pittsburgh Sleep Quality Index: A new instrument for psychiatric practice and research. Psychiatry Research, 28(2), 193–213. [CrossRef]
- Byrne, B. M., Shavelson, R. J., & Muthén, B. (1989). Testing for the equivalence of factor covariance and mean structures: The issue of partial measurement invariance. Psychological Bulletin, 105(3), 456–466. [CrossRef]
- Cachelin, F. M., & Striegel-Moore, R. H. (2006). Help seeking and barriers to treatment in a community sample of Mexican American and European American women with eating disorders. International Journal of Eating Disorders, 39(2), 154–161. [CrossRef]
- Cai, L., & Monroe, S. (2014). A new statistic for evaluating item response theory models for ordinal data (No. CRESST Report 839). University of California, National Center for Research on Evaluation, Standards, and Student Testing (CRESST). http://cresst.org/publications/cresst–publication–3208.
- Calugi, S., Milanese, C., Sartirana, M., El Ghoch, M., Sartori, F., Geccherle, E., Coppini, A., Franchini, C., & Dalle Grave, R. (2017). The Eating Disorder Examination Questionnaire: Reliability and validity of the Italian version. Eating and Weight Disorders - Studies on Anorexia, Bulimia and Obesity, 22(3), 509–514. [CrossRef]
- Carrard, I., Lien Rebetez, M. M., Mobbs, O., & der Linden, M. V. (2014). Factor structure of a French version of the Eating Disorder Examination—Questionnaire among women with and without binge eating disorder symptoms. Eating and Weight Disorders, 20(1), 137–144. [CrossRef]
- Cattell, R. B. (1966). The scree test for the number of factors. Multivariate Behavioral Research, 1(2), 245–276. [CrossRef]
- Chalmers, R. P. (2012). mirt: A multidimensional item response theory package for the R environment. Journal of Statistical Software, 48(6), 1–29. [CrossRef]
- Chapa, D. A. N., Johnson, S. N., Richson, B. N., Bjorlie, K., Won, Y. Q., Nelson, S. V., Ayres, J., Jun, D., Forbush, K. T., Christensen, K. A., & Perko, V. L. (2022). Eating-disorder psychopathology in female athletes and non-athletes: A meta-analysis. International Journal of Eating Disorders, 55(7), 861–885. [CrossRef]
- Chellappa, S. L., Gao, L., Qian, J., Vujovic, N., Li, P., Hu, K., & Scheer, F. A. J. L. (2025). Daytime eating during simulated night work mitigates changes in cardiovascular risk factors: Secondary analyses of a randomized controlled trial. Nature Communications, 16(1), 3186. [CrossRef]
- Chen, F. F. (2007). Sensitivity of goodness of fit indexes to lack of measurement invariance. Structural Equation Modeling, 14(3), 464–504. [CrossRef]
- Cheung, G. W., & Rensvold, R. B. (2002). Evaluating goodness-of-fit indexes for testing measurement invariance. Structural Equation Modeling, 9(2), 233–255. [CrossRef]
- Coelho, J. S., Suen, J., Marshall, S., Burns, A., Geller, J., & Lam, P.-Y. (2021). Gender differences in symptom presentation and treatment outcome in children and youths with eating disorders. Journal of Eating Disorders, 9(1), 113. [CrossRef]
- Conti, C., Di Francesco, G., Severo, M., Lanzara, R., Richards, K., Guagnano, M. T., & Porcelli, P. (2021). Alexithymia and metabolic syndrome: The mediating role of binge eating. Eating and Weight Disorders - Studies on Anorexia, Bulimia and Obesity, 26(6), 1813–1823. [CrossRef]
- Convertino, A. D., Morland, L. A., & Blashill, A. J. (2022). Trauma exposure and eating disorders: Results from a United States nationally representative sample. International Journal of Eating Disorders, 55(8), 1079–1089. [CrossRef]
- Cooper, Z., Cooper, P. J., & Fairburn, C. G. (1989). The validity of the Eating Disorder Examination and its subscales. British Journal of Psychiatry, 154(6), 807–812. [CrossRef]
- Costello, K., Hildebrandt, T., Michaelides, A., Herron, D. M., & Sysko, R. (2023). An exploratory structural equation modelling (ESEM) of the Eating Disorder Examination-Questionnaire in bariatric patients. Clinical Obesity, 13(4), e12595. [CrossRef]
- Crane, P. K., Gibbons, L. E., Jolley, L., & Belle, G. van. (2006). Differential item functioning analysis with ordinal logistic regression techniques. Medical Care, 44(11 Suppl 3), S115–S123. [CrossRef]
- Curcio, G., Tempesta, D., Scarlata, S., Marzano, C., Moroni, F., Rossini, P. M., Ferrara, M., & De Gennaro, L. (2013). Validity of the Italian Version of the Pittsburgh Sleep Quality Index (PSQI). Neurological sciences, 34(4), 511–519. [CrossRef]
- Dahlgren, C. L., Bang, L., & Degobi, E. B. (2025). Screening for eating disorders in adolescents: Psychometric evaluation of the Eating Disorder Examination-Questionnaire short version (EDE-QS) in a community sample. BMC Psychology, 13(1), 1042. [CrossRef]
- Davies, H. O. (2024). Eating disorders of the perimenopause. Post Reproductive Health, 30(4), 233–238. [CrossRef]
- Day, S., Bussey, K., Trompeter, N., & Mitchison, D. (2022). The impact of teasing and bullying victimization on disordered eating and body image disturbance among adolescents: A systematic review. Trauma, Violence, & Abuse, 23(3), 985–1006. [CrossRef]
- De Boer, K., Johnson, C., Wade, T. D., Radunz, M., Fernando, A. N., Babb, J., Stafrace, S., & Sharp, G. (2023). A systematic review and meta-analysis of intensive treatment options for adults with eating disorders. Clinical Psychology Review, 106, 102354. [CrossRef]
- De Vos, J. A., Radstaak, M., Bohlmeijer, E. T., & Westerhof, G. J. (2018). Having an eating disorder and still being able to flourish? Examination of patho-logical symptoms and well-being as two continua of mental health in a clinical sample. Frontiers in Psychology, 9, 2145. [CrossRef]
- Dean, Y. E., Motawea, K. R., Aslam, M., Pintado, J. J. L., Popoola-Samuel, H. A. O., Salam, M., Dundi, P. O. R., Donaldy, W., Aledani, E. M., Alqiqie, Z., Sultana, N., Mohamed, A. R. H., Elalem, A., Syeda, S. T. H., Mohamed, M. S., Assal, M. W., Attia, N. M., Hagar, H., Abdelaziz, H. A., … Aiash, H. (2024). Association between type 1 diabetes mellitus and eating disorders: A systematic review and meta-analysis. Endocrinology, Diabetes & Metabolism, 7(3), e00473. [CrossRef]
- Diedenhofen, B., & Musch, J. (2015). cocor: A comprehensive solution for the statistical comparison of correlations. PLoS ONE, 10(4), e0121945. [CrossRef]
- Dolan, S. C., Khindri, R., Franko, D. L., Thomas, J. J., Reilly, E. E., & Eddy, K. T. (2022). Anhedonia in eating disorders: A meta-analysis and systematic review. International Journal of Eating Disorders, 55(2), 161–175. [CrossRef]
- Dueber, D. (2021). BifactorIndicesCalculator: Bifactor indices calculator [Manual]. https://CRAN.R-project.org/package=BifactorIndicesCalculator.
- Duffy, M. E., Calzo, J. P., Lopez, E., Silverstein, S., Joiner, T. E., & Gordon, A. R. (2021). Measurement and construct validity of the Eating Disorder Examination Questionnaire Short Form in a transgender and gender diverse community sample. Psychological Assessment, 33(5), 459–463. [CrossRef]
- Duong, T. V., Pham, K. M., Do, B. N., Kim, G. B., Dam, H. T. B., Le, V.-T. T., Nguyen, T. T. P., Nguyen, H. T., Nguyen, T. T., Le, T. T., Do, H. T. T., & Yang, S.-H. (2020). Digital healthy diet literacy and self-perceived eating behavior change during COVID-19 pandemic among undergraduate nursing and medical students: A rapid online survey. International Journal of Environmental Research and Public Health, 17(19), 7185. [CrossRef]
- Embretson, S. E., & Reise, S. P. (2000). Item response theory for psychologists. Lawrence Erlbaum Associates.
- Engin, A. (2024). Misalignment of circadian rhythms in diet-induced obesity. In A. B. Engin & A. Engin (A c. Di), Obesity and Lipotoxicity (Vol. 1460, pp. 27–71). Springer International Publishing. [CrossRef]
- Fairburn, C. G., & Beglin, S. J. (1994). Assessment of eating disorders: Interview or self-report questionnaire? International Journal of Eating Disorders, 16(4), 363–370. [CrossRef]
- Fairburn, C. G., & Cooper, Z. (1993). The Eating Disorder Examination (12th edition). In Binge eating: Nature, assessment, and treatment (pp. 317–360). Guilford Press.
- Fekih-Romdhane, F., Daher-Nashif, S., Alhuwailah, A. H., Al Gahtani, H. M. S., Hubail, S. A., Shuwiekh, H. A. M., Khudhair, M. F., Alhaj, O. A., Bragazzi, N. L., & Jahrami, H. (2022). The prevalence of feeding and eating disorders symptomology in medical students: An updated systematic review, meta-analysis, and meta-regression. Eating and Weight Disorders, 27(6), 1991–2010. [CrossRef]
- Feng, B., Harms, J., Chen, E., Gao, P., Xu, P., & He, Y. (2023). Current discoveries and future implications of eating disorders. International Journal of Environmental Research and Public Health, 20(14), 6325. [CrossRef]
- Finbråten, H. S., Wilde-Larsson, B., Nordström, G., Pettersen, K. S., Trollvik, A., & Guttersrud, Ø. (2018). Establishing the HLS-Q12 short version of the European Health Literacy Survey Questionnaire: Latent trait analyses applying Rasch modelling and confirmatory factor analysis. BMC Health Services Research, 18(1), 506. [CrossRef]
- Fisher, R. A. (1925). Statistical methods for research workers. Oliver & Boyd. https://psychclassics.yorku.ca/Fisher/Methods/.
- Fox, J. (2022). polycor: Polychoric and polyserial correlations [Manual]. https://CRAN.R-project.org/package=polycor.
- Gideon, N., Hawkes, N., Mond, J., Saunders, R., Tchanturia, K., & Serpell, L. (2016). Development and psychometric validation of the EDE-QS, a 12 item short form of the Eating Disorder Examination Questionnaire (EDE-Q). PLoS ONE, 11(5), e0152744. [CrossRef]
- Goldberg, D., Bridges, K., Duncan-Jones, P., & Grayson, D. (1988). Detecting anxiety and depression in general medical settings. BMJ, 297(6653), 897–899. [CrossRef]
- Gorsuch, R. L. (1983). Factor analysis (2nd ed.). Lawrence Erlbaum Associates.
- Grice, J. W. (2001). Computing and evaluating factor scores. Psychological Methods, 6(4), 430–450. [CrossRef]
- Hancock, G. R., & Mueller, R. O. (2001). Rethinking construct reliability within latent variable systems. In R. Cudeck, S. du Toit, & D. Sörbom (A c. Di), Structural equation modeling: Present and future: A festschrift in honor of karl jöreskog (pp. 195–216). Scientific Software International.
- He, J., Sun, S., & Fan, X. (2021). Validation of the 12-item Short Form of the Eating Disorder Examination Questionnaire in the Chinese context: Confirmatory factor analysis and Rasch analysis. Eating and Weight Disorders, 26(1), 201–209. [CrossRef]
- Heiss, S., Boswell, J. F., & Hormes, J. M. (2018). Confirmatory factor analysis of the Eating Disorder Examination-Questionnaire: A comparison of five factor solutions across vegan and omnivore participants. International Journal of Eating Disorders, 51(5), 418–428. [CrossRef]
- Hemmer, A., Mareschal, J., Dibner, C., Pralong, J. A., Dorribo, V., Perrig, S., Genton, L., Pichard, C., & Collet, T.-H. (2021). The effects of shift work on cardio-metabolic diseases and eating patterns. Nutrients, 13(11), 4178. [CrossRef]
- Hilbert, A., De Zwaan, M., & Braehler, E. (2012). How frequent are eating disturbances in the population? Norms of the Eating Disorder Examination-Questionnaire. PLoS ONE, 7(1), e29125. [CrossRef]
- Hilbert, A., Hartmann, A. S., Czaja, J., & Schoebi, D. (2013). Natural course of preadolescent loss of control eating. Journal of Abnormal Psychology, 122(3), 684–693. [CrossRef]
- Himmerich, H., Gravina, D., Schalinski, I., Willmund, G.-D., Zimmermann, P. L., Keeler, J. L., & Treasure, J. (2024). Eating- and weight-related disorders in the armed forces. Metabolites, 14(12), 667. [CrossRef]
- Holland, L. A., Bodell, L. P., & Keel, P. K. (2013). Psychological factors predict eating disorder onset and maintenance at 10-year follow-up. European Eating Disorders Review, 21(5), 405–410. [CrossRef]
- Horn, J. L. (1965). A rationale and test for the number of factors in factor analysis. Psychometrika, 30(2), 179–185. [CrossRef]
- Hudson, J. I., Javaras, K. N., & Pope, H. G. (2020). The challenges of metabolic syndrome in eating disorders. Psychiatric Annals, 50(8), 346–350. [CrossRef]
- Hudson, J. I., Lalonde, J. K., Coit, C. E., Tsuang, M. T., McElroy, S. L., Crow, S. J., Bulik, C. M., Hudson, M. S., Yanovski, J. A., Rosenthal, N. R., & Pope, H. G. (2010). Longitudinal study of the diagnosis of components of the metabolic syndrome in individuals with binge-eating disorder. The American Journal of Clinical Nutrition, 91(6), 1568–1573. [CrossRef]
- Iskender, H., Yildiz, N., & Dokumacioglu, E. (2024). Investigation of the healthy nutrition attitude and nutritional literacy level of university students receiving health education. Mediterranean Journal of Nutrition and Metabolism, 17(1), 35–42. [CrossRef]
- Jahrami, H., Sater, M., Abdulla, A., Faris, M. A.-I., & AlAnsari, A. (2019). Eating disorders risk among medical students: A global systematic review and meta-analysis. Eating and Weight Disorders, 24(3), 397–410. [CrossRef]
- Jelinek, H. F., Spence, I., Cornforth, D. J., Tarvainen, M. P., & Russell, J. (2018). Depression and cardiac dysautonomia in eating disorders. Eating and Weight Disorders - Studies on Anorexia, Bulimia and Obesity, 23(3), 369–374. [CrossRef]
- Jenkins, P. E., & Rienecke, R. D. (2022). Structural validity of the Eating Disorder Examination-Questionnaire: A systematic review. International Journal of Eating Disorders, 55(8), 1012–1030. [CrossRef]
- Johnson, C. L., & Taylor, C. (1996). Working with difficult-to-treat eating disorders using an integration of twelve-step and traditional psychotherapies. Psychiatric Clinics of North America, 19(4), 829–841. [CrossRef]
- Joy, P., White, M., & Jones, S. (2022). Exploring the influence of gender dysphoria in eating disorders among gender diverse individuals. Nutrition & Dietetics, 79(3), 390–399. [CrossRef]
- Kang, T., & Chen, T. T. (2011). Performance of the generalized S-X2 item fit index for the graded response model. Asia Pacific Education Review, 12(1), 89–96. [CrossRef]
- Kenny, T. E., Van Wijk, M., Singleton, C., & Carter, J. C. (2018). An examination of the relationship between binge eating disorder and insomnia symptoms. European Eating Disorders Review, 26(3), 186–196. [CrossRef]
- Keski-Rahkonen, A., & Mustelin, L. (2016). Epidemiology of eating disorders in Europe: Prevalence, incidence, comorbidity, course, consequences, and risk factors. Current Opinion in Psychiatry, 29(6), 340–345. [CrossRef]
- Kinasz, K., Accurso, E. C., Kass, A. E., & Grange, D. L. (2016). Does sex matter in the clinical presentation of eating disorders in youth? Journal of Adolescent Health, 58(4), 410–416. [CrossRef]
- King, K. A., Vidourek, R., & Schwiebert, M. (2009). Disordered eating and job stress among nurses. Journal of Nursing Management, 17(7), 861–869. [CrossRef]
- Kjeldbjerg, M. L., Clausen, L., & Højgaard, D. R. M. A. (2021). Factor analysis of the Eating Disorder Examination in a sample of female adolescents and adults with eating disorders. International Journal of Eating Disorders, 54(5), 879–886. [CrossRef]
- Kosmadopoulos, A., Kervezee, L., Boudreau, P., Gonzales-Aste, F., Vujovic, N., Scheer, F. A. J. L., & Boivin, D. B. (2020). Effects of shift work on the eating behavior of police officers on patrol. Nutrients, 12(4), 999. [CrossRef]
- Krug, I., Liu, S., Portingale, J., Croce, S., Dar, B., Obleada, K., Satheesh, V., Wong, M., & Fuller-Tyszkiewicz, M. (2025). A meta-analysis of mortality rates in eating disorders: An update of the literature from 2010 to 2024. Clinical Psychology Review, 116, 102547. [CrossRef]
- Lavender, J. M., Brown, T. A., & Murray, S. B. (2017). Men, muscles, and eating disorders: An overview of traditional and muscularity-oriented disordered eating. Current Psychiatry Reports, 19(6), 32. [CrossRef]
- Lent, M. R., Atwood, M., Bennett, W. L., Woolf, T. B., Martin, L., Zhao, D., Goheer, A. A., Song, S., McTigue, K. M., Lehmann, H. P., Holzhauer, K., & Coughlin, J. W. (2022). Night eating, weight, and health behaviors in adults participating in the Daily24 study. Eating Behaviors, 45, 101605. [CrossRef]
- Lichtenstein, M. B., Haastrup, L., Johansen, K. K., Bindzus, J. B., Larsen, P. V., Støving, R. K., Clausen, L., & Linnet, J. (2021). Validation of the Eating Disorder Examination-Questionnaire in Danish eating disorder patients and athletes. Journal of Clinical Medicine, 10(17), 3976. [CrossRef]
- Longman, R. S., Cota, A. A., Holden, R. R., & Fekken, G. C. (1989). A regression equation for the parallel analysis criterion in principal components analysis: Mean and 95th percentile eigenvalues. Multivariate Behavioral Research, 24(1), 59–69. [CrossRef]
- Lorini, C., Santomauro, F., Grazzini, M., Mantwill, S., Vettori, V., Lastrucci, V., Bechini, A., Boccalini, S., Bussotti, A., & Bonaccorsi, G. (2017). Health literacy in Italy: A cross-sectional study protocol to assess the health literacy level in a population-based sample, and to validate health literacy measures in the Italian language. BMJ Open, 7(11), e017812. [CrossRef]
- Lukoševičiūtė, J., Argustaitė-Zailskienė, G., & Šmigelskas, K. (2022). Measuring happiness in adolescent samples: A systematic review. Children, 9(2), 227. [CrossRef]
- Machado, P. P., Grilo, C. M., Rodrigues, T. F., Vaz, A., & Crosby, R. D. (2020). Eating Disorder Examination – Questionnaire short forms: A comparison. International Journal of Eating Disorders, 53(6), 937–944. [CrossRef]
- Magnavita, N. (2007a). Anxiety and depression at work. The A/D Goldberg Questionnaire. Giornale Italiano di Medicina del Lavoro ed Ergonomia, 29(3), 670–671. https://www.researchgate.net/publication/5442596_Anxiety_and_depression_at_work_The_AD_Goldberg_Questionnaire.
- Magnavita, N. (2007b). Two tools for health surveillance of job stress: The Karasek Job Content Questionnaire and the Siegrist Effort Reward Imbalance Questionnaire. Giornale Italiano di Medicina del Lavoro ed Ergonomia, 29(3 Suppl), 667–670. https://www.researchgate.net/publication/5442595_Two_tools_for_health_surveillance_of_job_stress_The_Karasek_Job_Content_Questionnaire_and_the_Siegrist_Effort_Reward_Imbalance_Questionnaire.
- Magnavita, N. (2023). Workplace health promotion embedded in medical surveillance: The Italian way to total worker health program. International Journal of Environmental Research and Public Health, 20(4), 3659. [CrossRef]
- Magnavita, N. (2025). Eating disorders in the workplace [Dataset]. Zenodo. [CrossRef]
- Magnavita, N., Garbarino, S., & Siegrist, J. (2012). The use of parsimonious questionnaires in occupational health surveillance: Psychometric properties of the short Italian version of the Effort/Reward Imbalance Questionnaire. The Scientific World Journal, 2012, 1–7. [CrossRef]
- Magnavita, N., & Isolani, L. (2025). Violence in healthcare workers is associated with disordered eating. International Journal of Environmental Research and Public Health, 22(8), 1221. [CrossRef]
- Malta, G., Plescia, F., & Cannizzaro, E. (2025). Exploring the impact of obesity and insomnia on work productivity: Insights for occupational health and sustainability in the workplace. Sustainability, 17(2), 424. [CrossRef]
- Marsh, H. W., Hau, K.-T., & Grayson, D. (2005). Goodness of fit evaluation in structural equation modeling. In J. Maydeu-Olivares & A. McArdle (A c. Di), Contemporary psychometrics. A festschrift for roderick P. McDonald (pp. 275–340). Lawrence Erlbaum Associates.
- Marsh, H. W., Hau, K.-T., & Wen, Z. (2004). In search of golden rules: Comment on hypothesis-testing approaches to setting cutoff values for fit indexes and dangers in overgeneralizing Hu and Bentler’s (1999) findings. Structural Equation Modeling, 11(3), 320–341. [CrossRef]
- Mason, T. B., Engwall, A., Mead, M. P., & Irish, L. A. (2019). Sleep and eating disorders among adults enrolled in a commercial weight loss program: Associations with self-report and objective sleep measures. Eating and Weight Disorders, 24(2), 307–312. [CrossRef]
- McDonald, R. P. (1999). Test theory: A unified treatment. Lawrence Erlbaum.
- McNeish, D. (2018). Thanks coefficient alpha, we’ll take it from here. Psychological Methods, 23(3), 412–433. [CrossRef]
- Meade, A. W., & Wright, N. A. (2012). Solving the measurement invariance anchor item problem in item response theory. Journal of Applied Psychology, 97(5), 1016–1031. [CrossRef]
- Medisauskaite, A., & Kamau, C. (2019). Does occupational distress raise the risk of alcohol use, binge-eating, ill health and sleep problems among medical doctors? A UK cross-sectional study. BMJ Open, 9(5), e027362. [CrossRef]
- Meléndez-Fernández, O. H., Liu, J. A., & Nelson, R. J. (2023). Circadian rhythms disrupted by light at night and mistimed food intake alter hormonal rhythms and metabolism. International Journal of Molecular Sciences, 24(4), 3392. [CrossRef]
- Mendoza, J. (2019). Food intake and addictive-like eating behaviors: Time to think about the circadian clock(s). Neuroscience & Biobehavioral Reviews, 106, 122–132. [CrossRef]
- Milano, W., Milano, L., & Capasso, A. (2020). Eating disorders in athletes: From risk management to therapy. Endocrine, Metabolic & Immune Disorders - Drug Targets, 20(1), 2–14. [CrossRef]
- Mitchell, K. S., Scioli, E. R., Galovski, T., Belfer, P. L., & Cooper, Z. (2021). Posttraumatic stress disorder and eating disorders: Maintaining mechanisms and treatment targets. Eating Disorders, 29(3), 292–306. [CrossRef]
- Mousavi Asl, E., Mahaki, B., Khanjani, S., & Mohammadian, Y. (2021). Assessment of eating disorder psychopathology: The psychometric properties of the Persian version of the Eating Disorder Examination Questionnaire Short Form. Journal of Research in Medical Sciences, 26(1), 71. [CrossRef]
- Munn-Chernoff, M. A., Johnson, E. C., Chou, Y., Coleman, J. R. I., Thornton, L. M., Walters, R. K., Yilmaz, Z., Baker, J. H., Hübel, C., Gordon, S., Medland, S. E., Watson, H. J., Gaspar, H. A., Bryois, J., Hinney, A., Leppä, V. M., Mattheisen, M., Ripke, S., Yao, S., … Agrawal, A. (2021). Shared genetic risk between eating disorder- and substance-use-related phenotypes: Evidence from genome-wide association studies. Addiction Biology, 26(1), e12880. [CrossRef]
- Murray, S. B., Friedlich, C. E., & Kesheshian, T. (2025). The impact of incorporating an eating disorder screening tool and an eating disorder diagnostic workshop in outpatient general psychiatry settings in publicly insured populations: A case series. Eating Disorders, Epub ahead of print. [CrossRef]
- Nagata, J. M., Thurston, I. B., Karazsia, B. T., Woolridge, D., Buckelew, S. M., Murray, S. B., & Calzo, J. P. (2021). Self-reported eating disorders and sleep disturbances in young adults: A prospective cohort study. Eating and Weight Disorders, 26(2), 695–702. [CrossRef]
- National Institute for Mental Health in England. (2008). Mental health compendium. National Institute for Mental Health in England.
- Navruz-Varlı, S., & Mortaş, H. (2024). Shift work, shifted diets: An observational follow-up study on diet quality and sustainability among healthcare workers on night shifts. Nutrients, 16(15), 2404. [CrossRef]
- Neglia, A. (2021). Nutrition, eating disorders, and behavior in athletes. Psychiatric Clinics of North America, 44(3), 431–441. [CrossRef]
- Nelson, J. D., Cuellar, A. E., Cheskin, L. J., & Fischer, S. (2022). Eating disorders and posttraumatic stress disorder: A network analysis of the comorbidity. Behavior Therapy, 53(2), 310–322. [CrossRef]
- Olenik, H., & Hećimović, D. (2024). The influence of night work on the eating habits of workers. In A. Petelin (A c. Di), Zdravje delovno aktivnih in starejših odraslih / Health of Working-Age and Older Adults (pp. 87–95). Založba Univerze na Primorskem. [CrossRef]
- Orlando, M., & Thissen, D. (2003). Further investigation of the performance of S-X2: An item fit index for use with dichotomous item response theory models. Applied Psychological Measurement, 27(4), 289–298. [CrossRef]
- Prnjak, K., Mitchison, D., Griffiths, S., Mond, J., Gideon, N., Serpell, L., & Hay, P. (2020). Further development of the 12-item EDE-QS: Identifying a cut-off for screening purposes. BMC Psychiatry, 20(1), 146. [CrossRef]
- Qi, B., & Wu, Y. (2025). Operational police stress is associated with disordered eating in police officers. International Journal of Eating Disorders, 58(3), 531–541. [CrossRef]
- R Core Team. (2024). R: A language and environment for statistical computing. R version 4.4.2. R Foundation for Statistical Computing. http://www.r-project.org/.
- Rakusin, D., O’Brien, K., & Murphy, M. (2021). Case reports of new-onset eating disorders in older adult cancer survivors. Journal of Eating Disorders, 9(1), 166. [CrossRef]
- Rand-Giovannetti, D., Cicero, D. C., Mond, J., & Latner, J. D. (2017). Psychometric properties of the Eating Disorder Examination—Questionnaire (EDE-Q): A confirmatory factor analysis and assessment of measurement invariance by sex. Assessment, 27(1), 164–177. [CrossRef]
- Reckase, M. D. (2009). Multidimensional item response theory. Springer New York. [CrossRef]
- Reise, S. P., Cook, K. F., & Moore, T. M. (2015). Evaluating the impact of multidimensionality on unidimensional item response theory model parameters. In S. P. Reise & D. A. Revicki (A c. Di), Handbook of item response theory modeling. Applications to typical performance assessment (pp. 13–40). Routledge.
- Revelle, W. (2024). psych: Procedures for psychological, psychometric, and personality research [Manual]. Northwestern University. https://CRAN.R-project.org/package=psych.
- Rienecke, R. D., Johnson, C., Le Grange, D., Manwaring, J., Mehler, P. S., Duffy, A., McClanahan, S., & Blalock, D. V. (2022). Adverse childhood experiences among adults with eating disorders: Comparison to a nationally representative sample and identification of trauma profiles. Journal of Eating Disorders, 10(1), 72. [CrossRef]
- Rijkers, C., Schoorl, M., Van Hoeken, D., & Hoek, H. W. (2019). Eating disorders and posttraumatic stress disorder. Current Opinion in Psychiatry, 32(6), 510–517. [CrossRef]
- Rodriguez, A., Reise, S. P., & Haviland, M. G. (2016a). Applying bifactor statistical indices in the evaluation of psychological measures. Journal of Personality Assessment, 98(3), 223–237. [CrossRef]
- Rodriguez, A., Reise, S. P., & Haviland, M. G. (2016b). Evaluating bifactor models: Calculating and interpreting statistical indices. Psychological Methods, 21(2), 137–150. [CrossRef]
- Romo-Nava, F., Blom, T. J., Guerdjikova, A., Winham, S. J., Cuellar-Barboza, A. B., Nunez, N. A., Singh, B., Biernacka, J. M., Frye, M. A., & McElroy, S. L. (2020). Evening chronotype, disordered eating behavior, and poor dietary habits in bipolar disorder. Acta Psychiatrica Scandinavica, 142(1), 58–65. [CrossRef]
- Romo-Nava, F., Guerdjikova, A. I., Mori, N. N., Scheer, F. A. J. L., Burgess, H. J., McNamara, R. K., Welge, J. A., Grilo, C. M., & McElroy, S. L. (2022). A matter of time: A systematic scoping review on a potential role of the circadian system in binge eating behavior. Frontiers in Nutrition, 9, 978412. [CrossRef]
- Sachs, K. V., Harnke, B., Mehler, P. S., & Krantz, M. J. (2016). Cardiovascular complications of anorexia nervosa: A systematic review. International Journal of Eating Disorders, 49(3), 238–248. [CrossRef]
- Samejima, F. (1969). Estimation of latent ability using a response pattern of graded scores. Psychometrika, 34(1), 1–97. [CrossRef]
- Samejima, F. (1997). Graded response model. In W. J. van der Linden & R. K. Hambleton (A c. Di), Handbook of modern item response theory (pp. 85–100). Springer. [CrossRef]
- Samuels, K. L., Maine, M. M., & Tantillo, M. (2019). Disordered eating, eating disorders, and body image in midlife and older women. Current Psychiatry Reports, 21(8), 70. [CrossRef]
- Sass, D. A., & Schmitt, T. A. (2010). A comparative investigation of rotation criteria within exploratory factor analysis. Multivariate Behavioral Research, 45(1), 73–103. [CrossRef]
- Schaefer, L. M., Anderson, L. M., Simone, M., O’Connor, S. M., Zickgraf, H., Anderson, D. A., Rodgers, R. F., & Thompson, J. K. (2019). Gender-based differential item functioning in measures of eating pathology. International Journal of Eating Disorders, 52(9), 1047–1051. [CrossRef]
- Schaefer, L. M., Smith, K. E., Leonard, R. C., Wetterneck, C. T., Smith, B., Farrell, N. R., Riemann, B. C., Frederick, D. A., Schaumberg, K., Klump, K. L., Anderson, D. A., & Thompson, J. K. (2018). Identifying a male clinical cutoff on the Eating Disorder Examination-Questionnaire (EDE-Q). International Journal of Eating Disorders, 51(12), 1357–1360. [CrossRef]
- Schwarz, G. E. (1978). Estimating the dimension of a model. Annals of Statistics, 6(2), 461–464. [CrossRef]
- Sclove, S. L. (1987). Application of model-selection criteria to some problems in multivariate analysis. Psychometrika, 52(3), 333–343. [CrossRef]
- Siegrist, J. (1996). Adverse health effects of high-effort/low-reward conditions. Journal of Occupational Health Psychology, 1(1), 27–41. [CrossRef]
- Silén, Y., & Keski-Rahkonen, A. (2022). Worldwide prevalence of DSM-5 eating disorders among young people. Current Opinion in Psychiatry, 35(6), 362–371. [CrossRef]
- Slocum-Gori, S. L., & Zumbo, B. D. (2011). Assessing the unidimensionality of psychological scales: Using multiple criteria from factor analysis. Social Indicators Research, 102(3), 443–461. [CrossRef]
- Smink, F. R. E., Van Hoeken, D., & Hoek, H. W. (2012). Epidemiology of eating disorders: Incidence, prevalence and mortality rates. Current Psychiatry Reports, 14(4), 406–414. [CrossRef]
- Solmi, M., Monaco, F., Højlund, M., Monteleone, A. M., Trott, M., Firth, J., Carfagno, M., Eaton, M., De Toffol, M., Vergine, M., Meneguzzo, P., Collantoni, E., Gallicchio, D., Stubbs, B., Girardi, A., Busetto, P., Favaro, A., Carvalho, A. F., Steinhausen, H., & Correll, C. U. (2024). Outcomes in people with eating disorders: A transdiagnostic and disorder-specific systematic review, meta-analysis and multivariable meta-regression analysis. World Psychiatry, 23(1), 124–138. [CrossRef]
- Solmi, M., Radua, J., Stubbs, B., Ricca, V., Moretti, D., Busatta, D., Carvalho, A. F., Dragioti, E., Favaro, A., Monteleone, A. M., Shin, J. I., Fusar-Poli, P., & Castellini, G. (2021). Risk factors for eating disorders: An umbrella review of published meta-analyses. Brazilian Journal of Psychiatry, 43(3), 314–323. [CrossRef]
- Sørensen, K., Van Den Broucke, S., Pelikan, J. M., Fullam, J., Doyle, G., Slonska, Z., Kondilis, B., Stoffels, V., Osborne, R. H., & Brand, H. (2013). Measuring health literacy in populations: Illuminating the design and development process of the European Health Literacy Survey Questionnaire (HLS-EU-Q). BMC Public Health, 13(1), 948. [CrossRef]
- Striegel-Moore, R. H., & Bulik, C. M. (2007). Risk factors for eating disorders. American Psychologist, 62(3), 181–198. [CrossRef]
- Sum, K., Cheshire, A., Ridge, D., Sengupta, D., & Deb, S. (2024). Doctors’ and nurses’ eating practices during shift work: Findings from a qualitative study. Proceedings of the Nutrition Society, 83(OCE2), E204. [CrossRef]
- Taba, J., Suzuki, M., Nascimento, F., Iuamoto, L., Hsing, W., Pipek, L., Carneiro-D’Albuquerque, L., Meyer, A., & Andraus, W. (2021). The development of feeding and s after bariatric surgery: A systematic review and meta-analysis. Nutrients, 13(7), 2396. [CrossRef]
- Tan, E. J., Raut, T., Le, L. K.-D., Hay, P., Ananthapavan, J., Lee, Y. Y., & Mihalopoulos, C. (2023). The association between eating disorders and mental health: An umbrella review. Journal of Eating Disorders, 11(1), 51. [CrossRef]
- Thannickal, A., Brutocao, C., Alsawas, M., Morrow, A., Zaiem, F., Murad, M. H., & Javed Chattha, A. (2020). Eating, sleeping and sexual function disorders in women with polycystic ovary syndrome (PCOS): A systematic review and meta-analysis. Clinical Endocrinology, 92(4), 338–349. [CrossRef]
- Thielemann, D., Richter, F., Strauss, B., Braehler, E., Altmann, U., & Berger, U. (2019). Differential item functioning in brief instruments of disordered eating. European Journal of Psychological Assessment, 35(6), 823–833. [CrossRef]
- Thissen, D., Steinberg, L., & Wainer, H. (1988). Use of item response theory in the study of group differences in trace lines. In H. Wainer & H. I. Braun (A c. Di), Test validity (pp. 147–172). Erlbaum.
- Thissen, D., Steinberg, L., & Wainer, H. (1993). Detection of differential item functioning using the parameters of item response models. In P. W. Holland & H. Wainer (A c. Di), Differential item functioning (pp. 67–113). Erlbaum.
- Thomeczek, M. L., Negi, S., Chen, Y., & Forbush, K. T. (2023). The impact of trauma-related symptoms and neuroticism on compensatory behaviors in a sample of adults with eating disorders. Eating Behaviors, 51, 101819. [CrossRef]
- TODAY Study Group, Marcus, M. D., Gandica, R., El Ghormli, L., Higgins, J., Tesfaldet, B., Koren, D., Macleish, S., Escaname, E. N., & Weinstock, R. S. (2022). Longitudinal association of depressive symptoms, binge eating, and quality of life with cardiovascular risk factors in young adults with youth-onset type 2 diabetes: The TODAY2 study. Diabetes Care, 45(5), 1073–1081. [CrossRef]
- Tomba, E., Offidani, E., Tecuta, L., Schumann, R., & Ballardini, D. (2014). Psychological well-being in out-patients with eating disorders: A controlled study. International Journal of Eating Disorders, 47(3), 252–258. [CrossRef]
- Touma, D. A., Quinn, M. E., Freeman, V. E., & Meyer, E. G. (2023). Eating disorders in U.S. active duty military members and veterans: A systematic review. Military Medicine, 188(7–8), 1637–1648. [CrossRef]
- Treasure, J., Duarte, T. A., & Schmidt, U. (2020). Eating disorders. The Lancet, 395(10227), 899–911. [CrossRef]
- Ubhi, S., Bani-Fatemi, A., Howe, A., Safi, F., Aniserowicz, A., & Nowrouzi-Kia, B. (2025). Impact of eating disorders on paid or unpaid work participation and performance: A systematic review. Eating and Weight Disorders, 30(1), 63. [CrossRef]
- Varela, C., Hoyo, Á., Tapia-Sanz, M. E., Jiménez-González, A. I., Moral, B. J., Rodríguez-Fernández, P., Vargas-Hernández, Y., & Ruiz-Sánchez, L. J. (2023). An update on the underlying risk factors of eating disorders onset during adolescence: A systematic review. Frontiers in Psychology, 14, 1221679. [CrossRef]
- Velicer, W. (1976). Determining the number of components from the matrix of partial correlations. Psychometrika, 41(3), 321–327. [CrossRef]
- Wade, T. D., Wilksch, S. M., & Lee, C. (2012). A longitudinal investigation of the impact of disordered eating on young women’s quality of life. Health Psychology, 31(3), 352–359. [CrossRef]
- Ward, Z. J., Rodriguez, P., Wright, D. R., Austin, S. B., & Long, M. W. (2019). Estimation of eating disorders prevalence by age and associations with mortality in a simulated nationally representative US cohort. JAMA Network Open, 2(10), e1912925. [CrossRef]
- Wilcox, H., Paz, V., Saxena, R., Winkelman, J. W., Garfield, V., & Dashti, H. S. (2024). The role of circadian rhythms and sleep in anorexia nervosa. JAMA Network Open, 7(1), e2350358. [CrossRef]
- World Health Organization. (2019). International Classification of Diseases, Eleventh Revision (ICD-11). World Health Organization.
- Yu, Z., & Muehleman, V. (2023). Eating disorders and metabolic diseases. International Journal of Environmental Research and Public Health, 20(3), 2446. [CrossRef]
- Zanella, E., & Lee, E. (2022). Integrative review on psychological and social risk and prevention factors of eating disorders including anorexia nervosa and bulimia nervosa: Seven major theories. Heliyon, 8(11), e11422. [CrossRef]
Figure 1.
Score distribution of EDE-QS items.
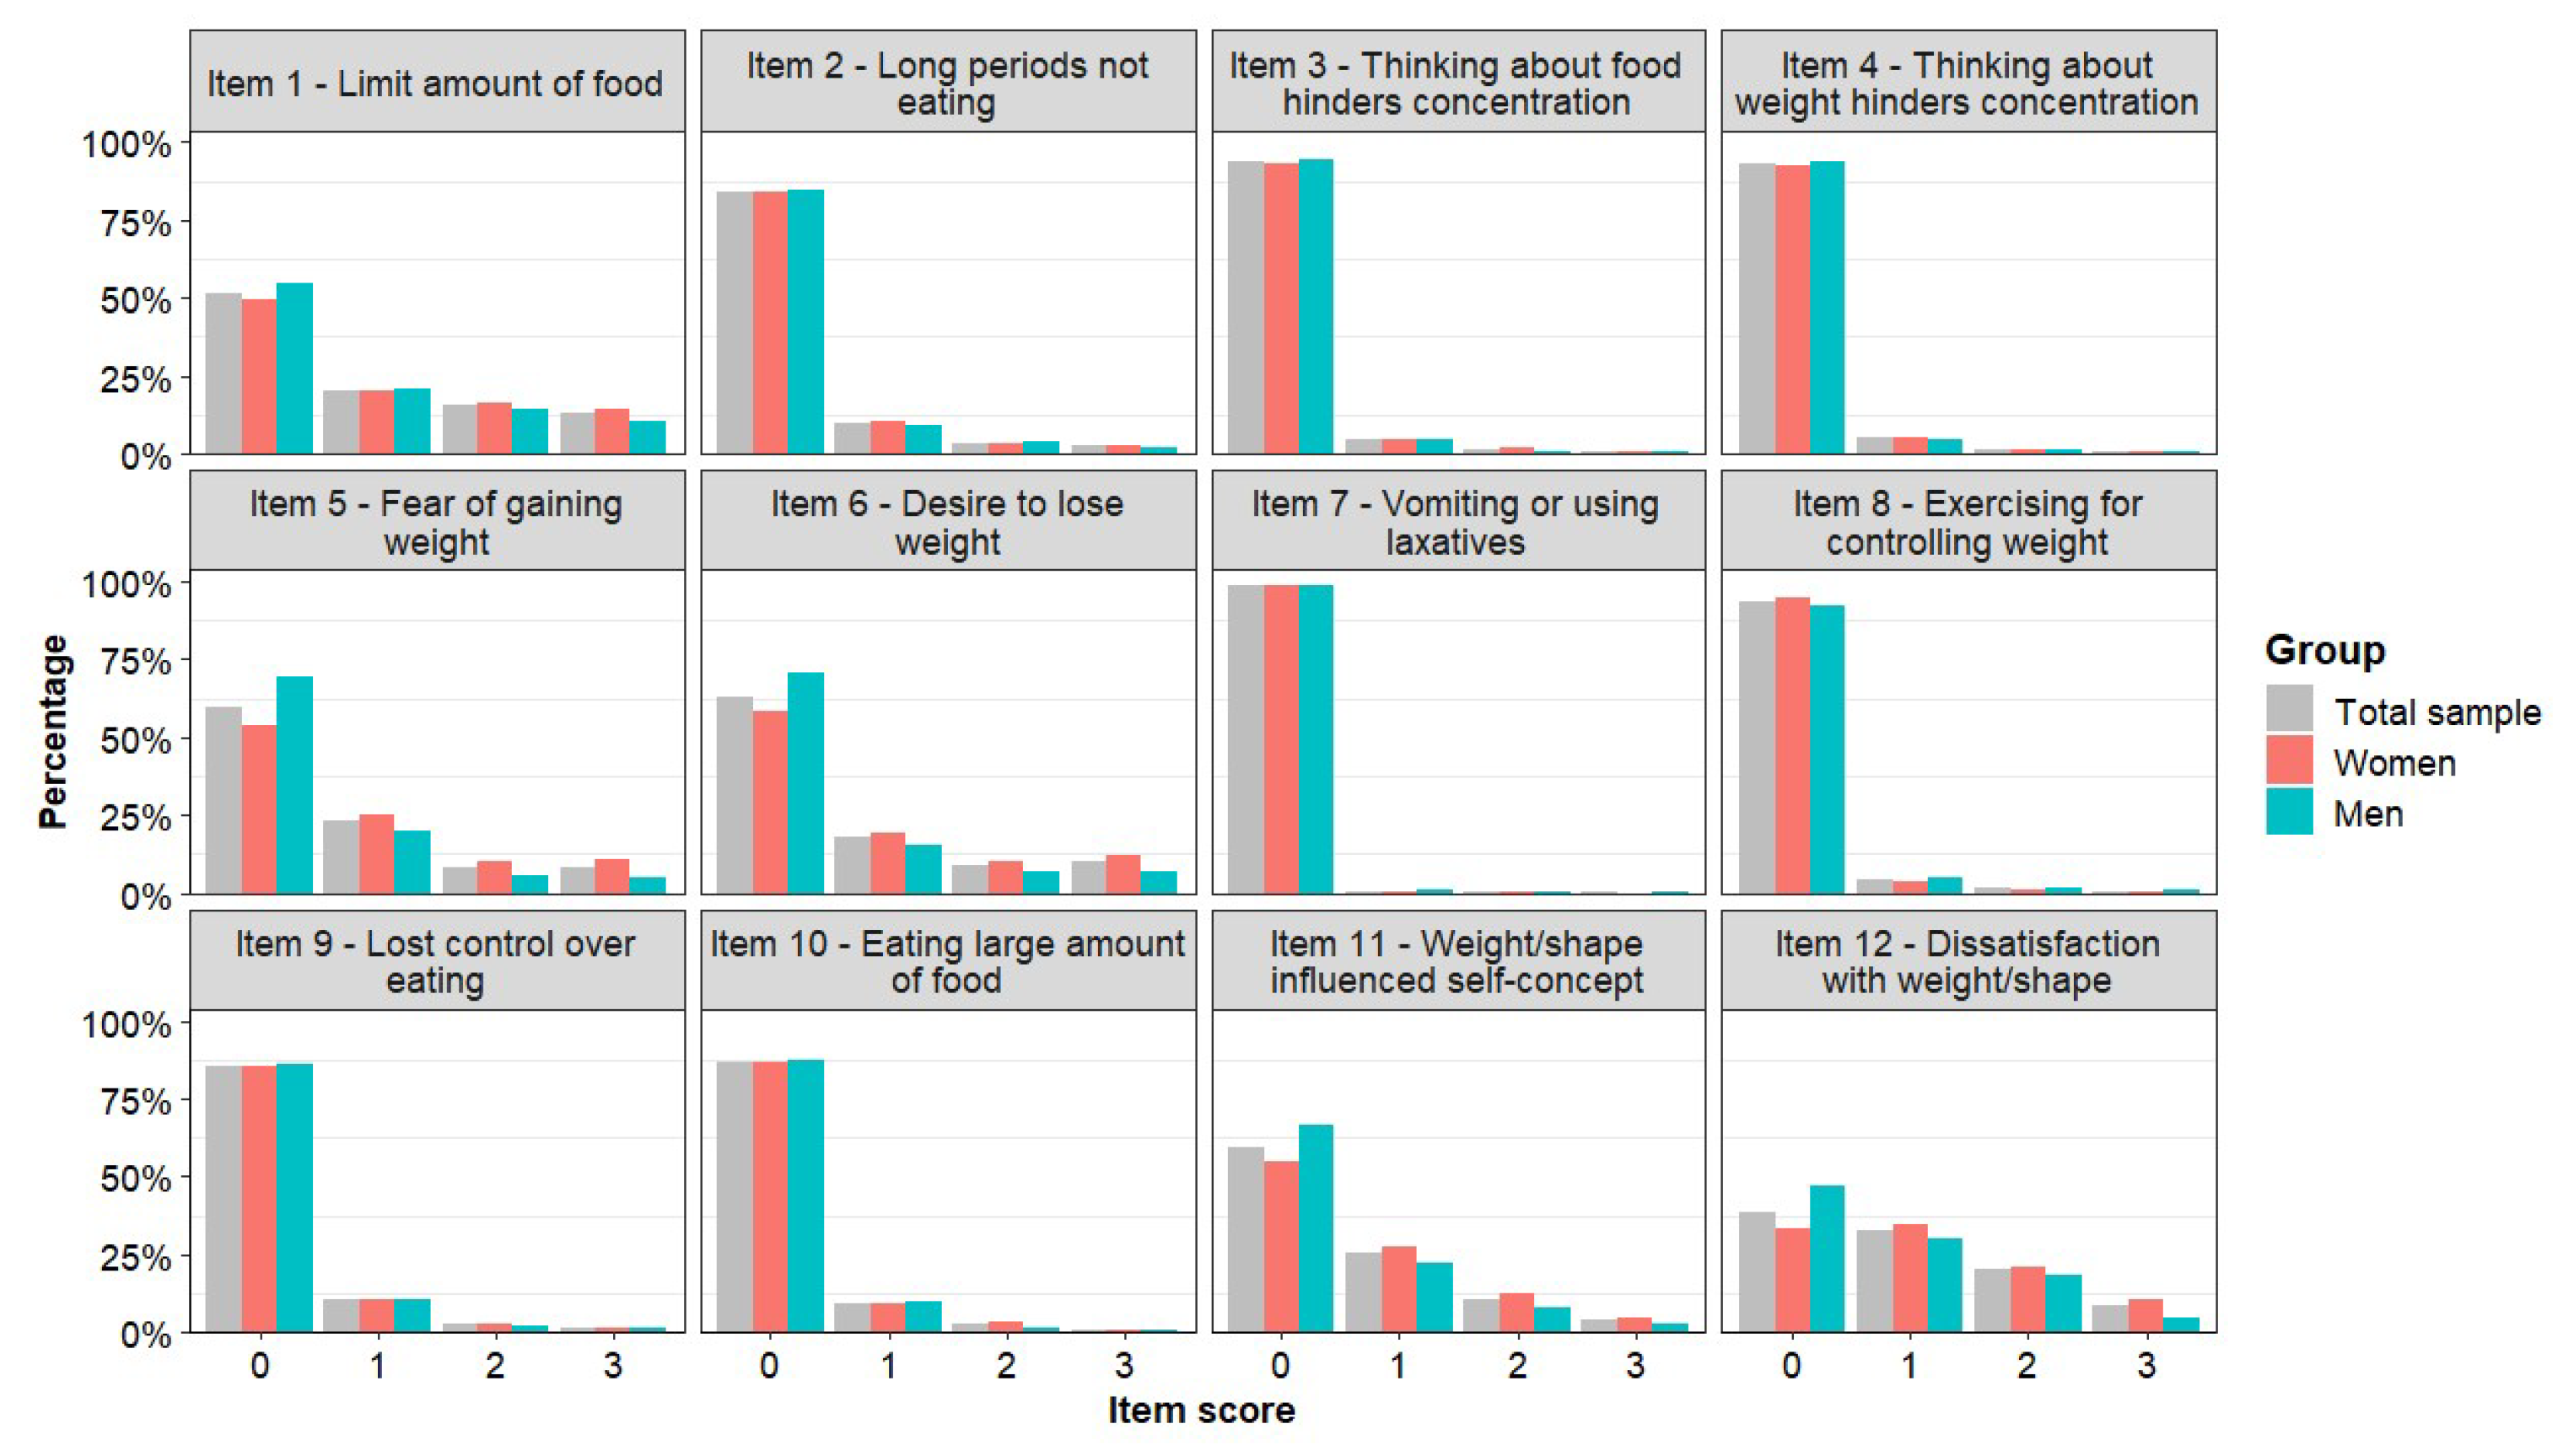
Figure 2.
Scree-plots, results from the parallel analysis and the Minimum Average Partial (MAP) correlation statistic for the EDE-QS in total sample and in the subsamples defined by gender.
Figure 2.
Scree-plots, results from the parallel analysis and the Minimum Average Partial (MAP) correlation statistic for the EDE-QS in total sample and in the subsamples defined by gender.
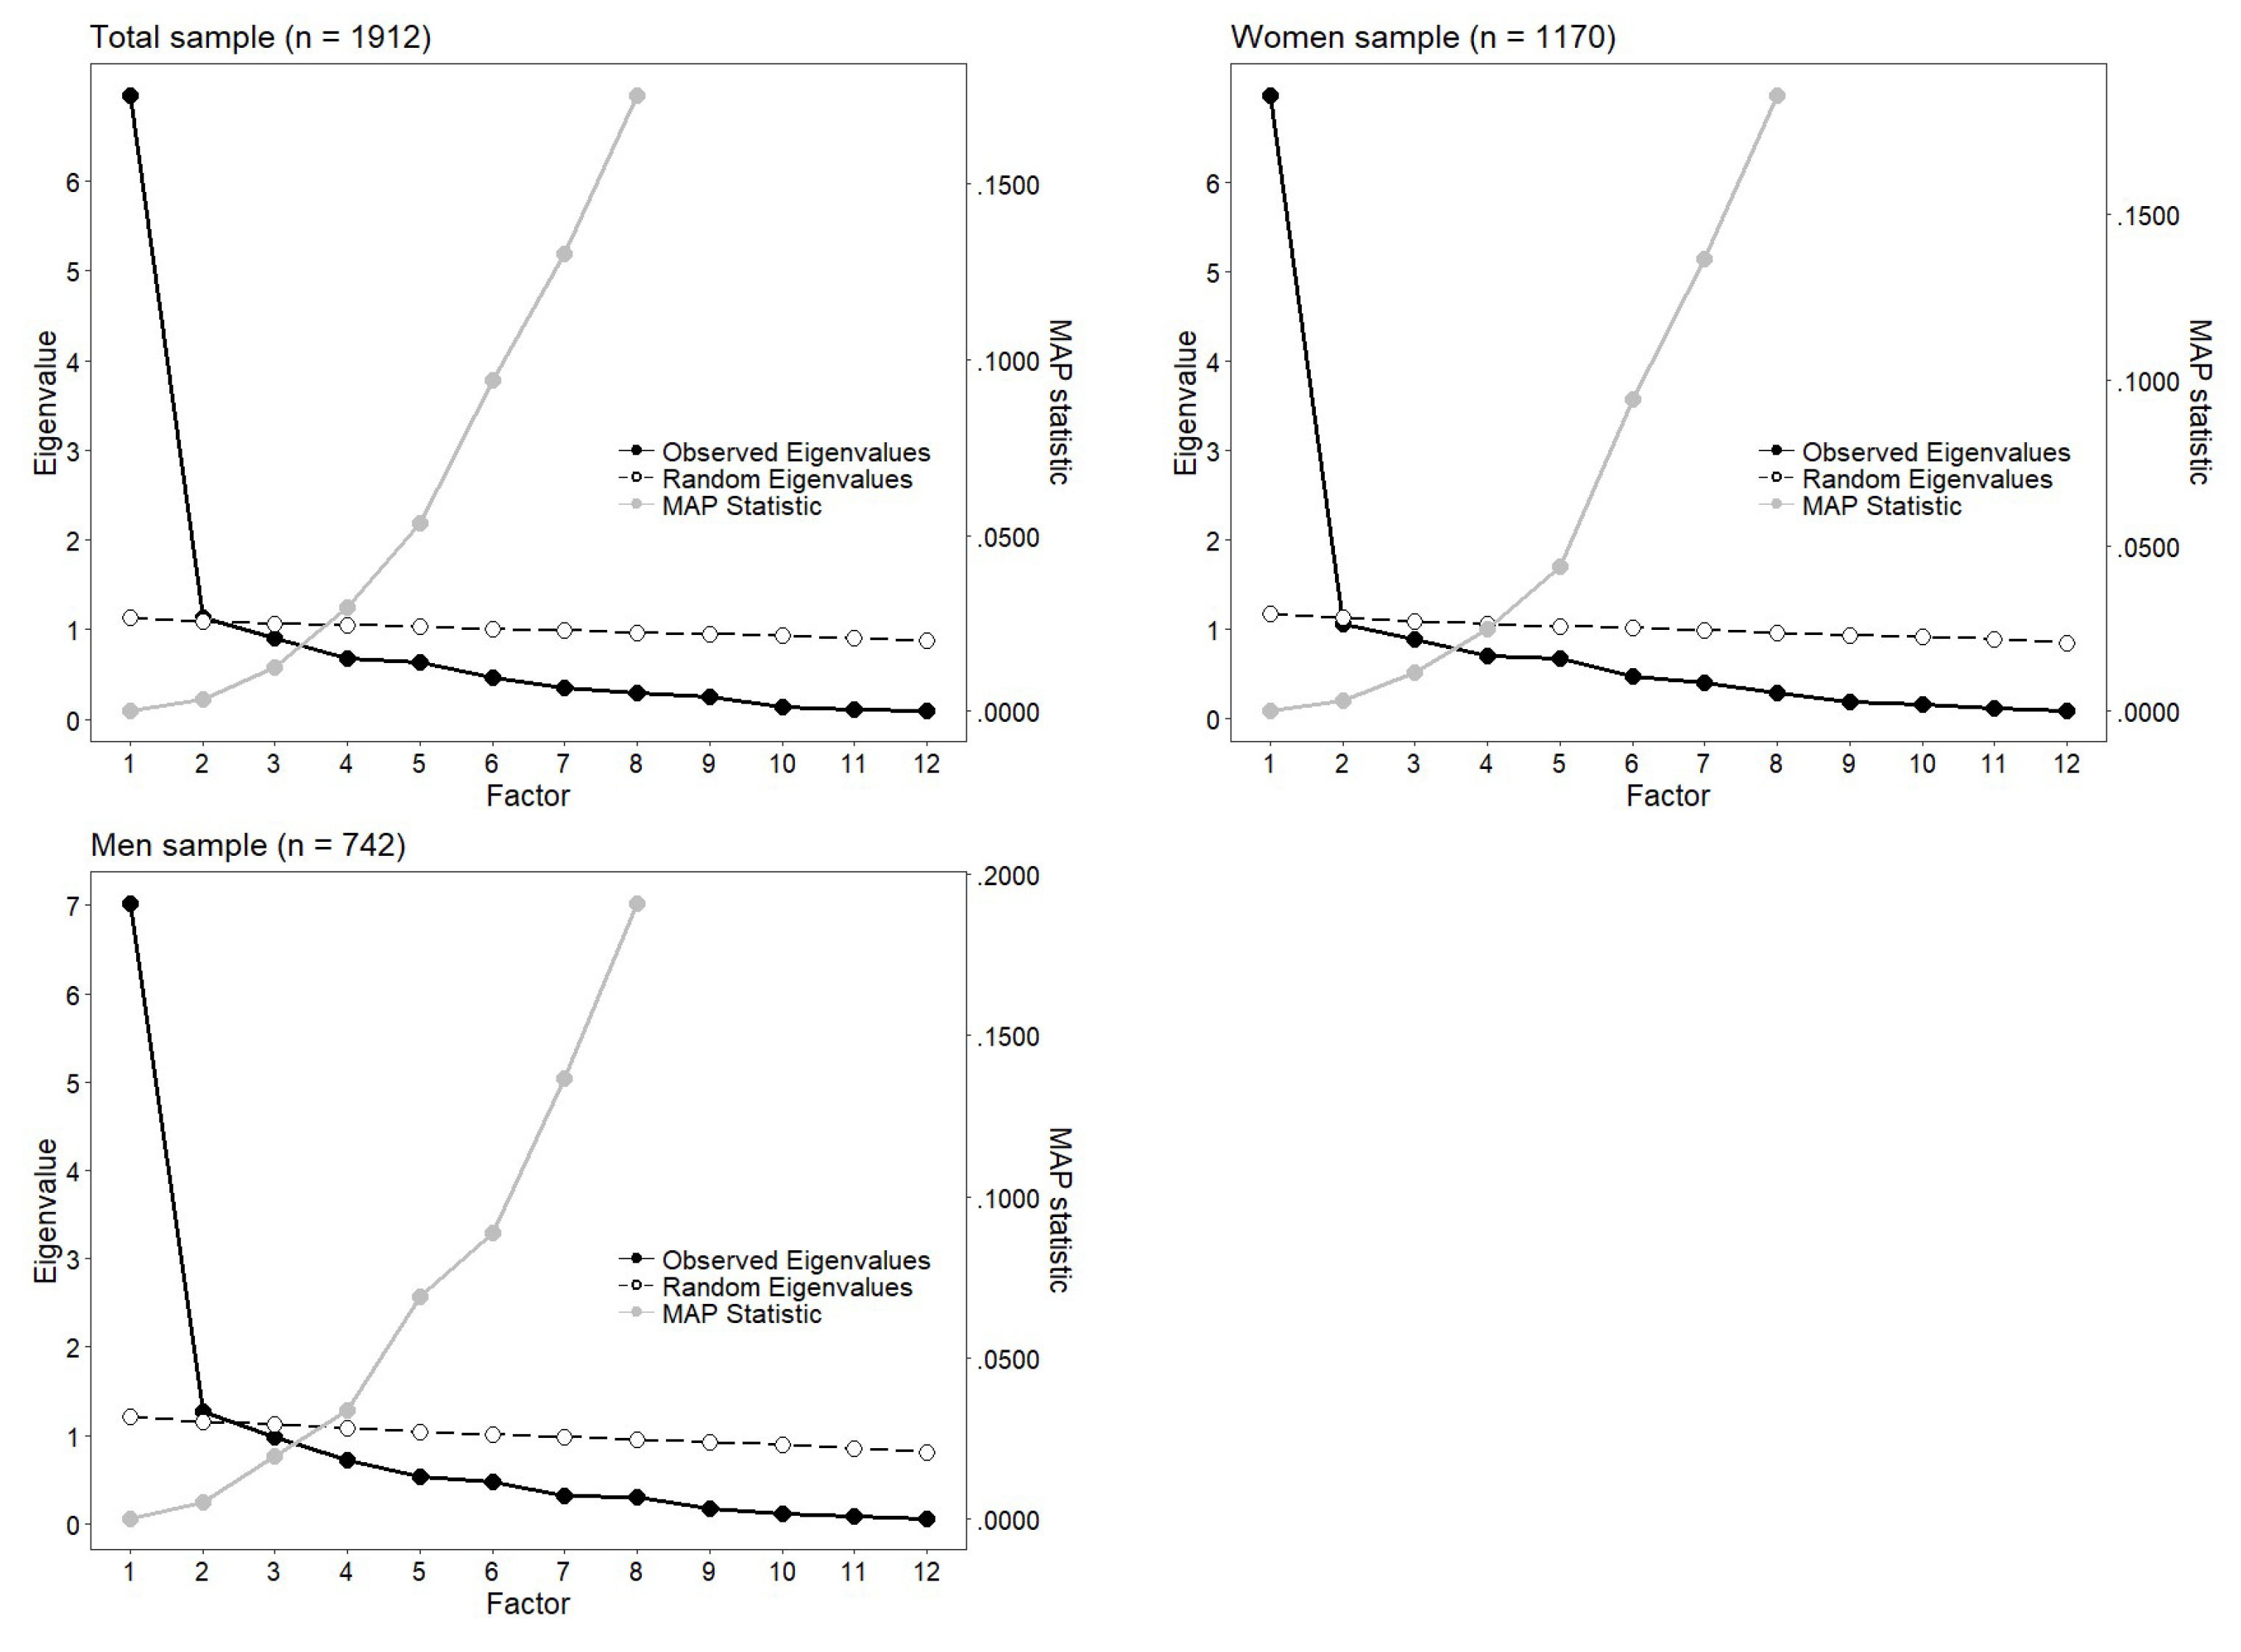
Figure 3.
Expected Score Standardized Difference (ESSD) and Differential Item Functioning of the EDE-QS across gender. Negative values indicate higher expected scores in men.
Figure 3.
Expected Score Standardized Difference (ESSD) and Differential Item Functioning of the EDE-QS across gender. Negative values indicate higher expected scores in men.
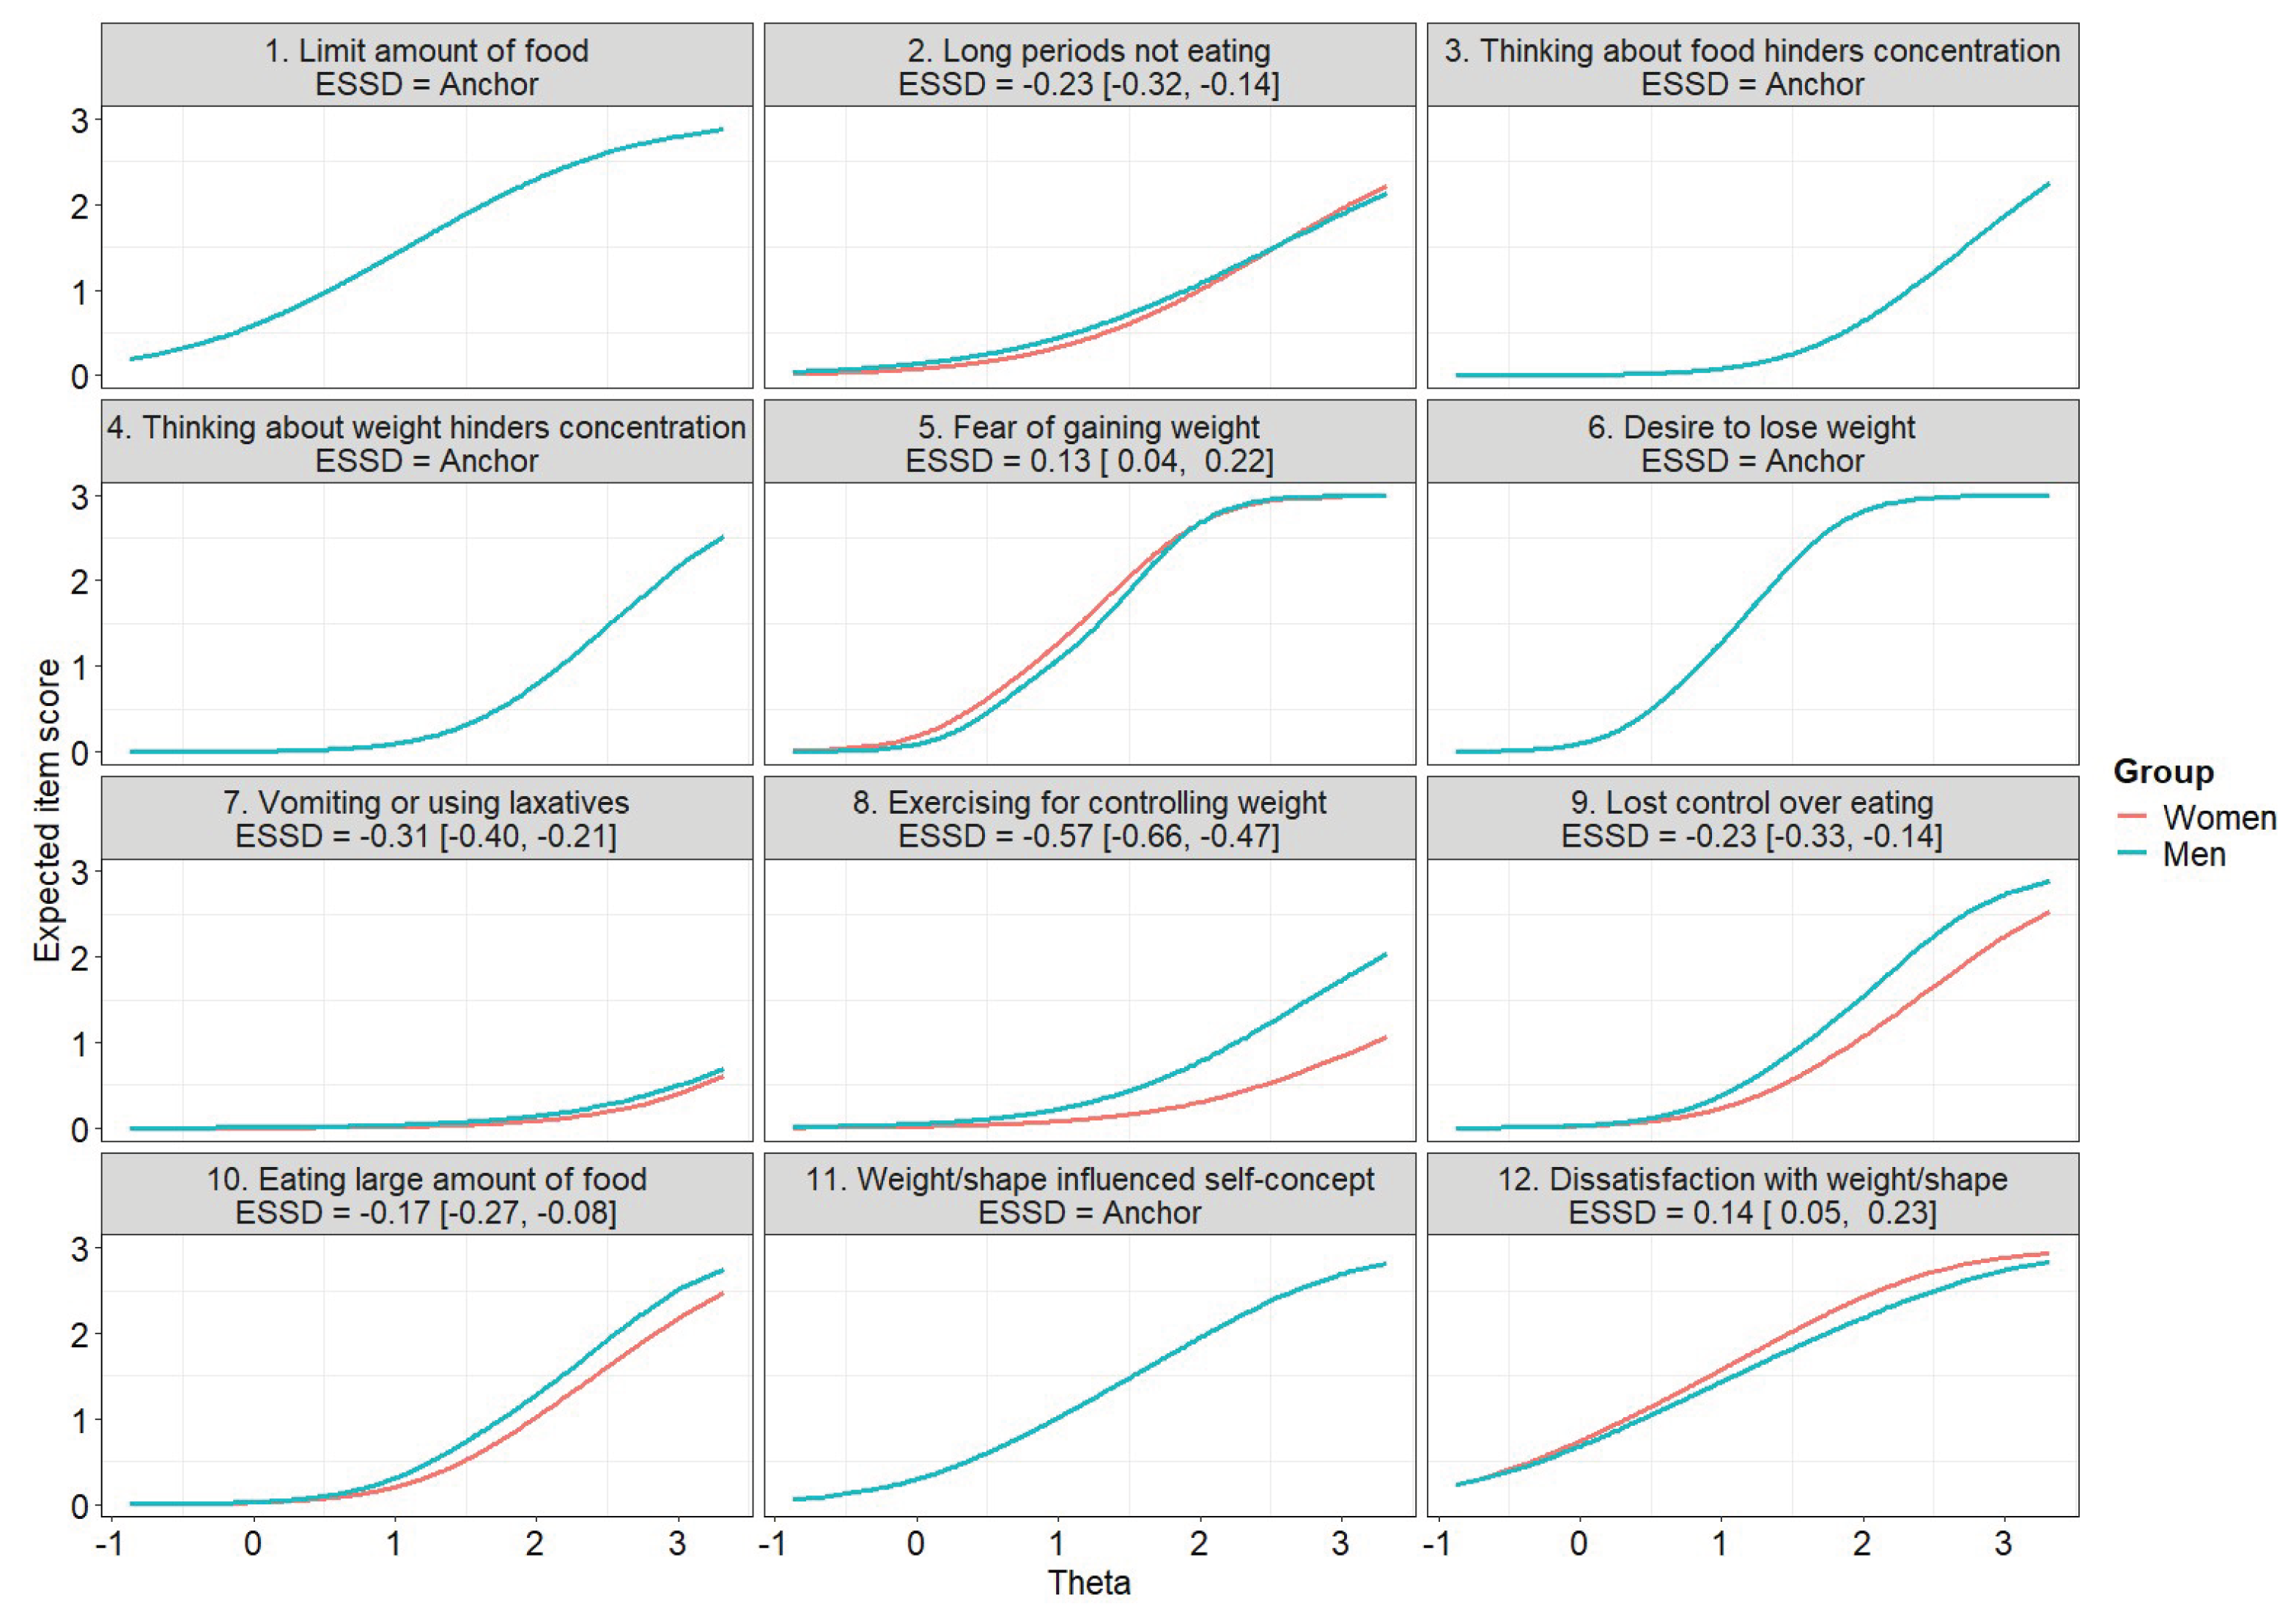

Table 1.
Fit indices of the single sample and invariance Graded Response Models (GRM).
| Model | M2 | df | p | CFI | TLI | RSMEA [95% CI} | AIC | BIC | SABIC | LL | Dχ2 | Ddf | Dp |
| Total sample (n = 1912) | |||||||||||||
| GRM (single-factor) | 2780.56 | 30 | <0.001 | 0.968 | 0.955 | 0.066 [0.059, 0.073] | 258420.75 | 261090.43 | 259560.94 | –128730.38 | |||
| Two-factor | 750.85 | 19 | <0.001 | 0.993 | 0.984 | 0.040 [0.030, 0.049] | 255010.58 | 258290.38 | 256410.94 | –126910.79 | 3630.17° | 11 | <0.001 |
| Reduced | 5780.89 | 41 | <0.001 | 0.930 | 0.928 | 0.083 [0.077, 0.089] | 261800.88 | 263860.45 | 262680.90 | –130530.44 | 3600.13° | 11 | <0.001 |
| Women (n = 1170) | |||||||||||||
| GRM (single-factor) | 2130.61 | 30 | <0.001 | 0.959 | 0.942 | 0.072 [0.063, 0.082] | 165470.77 | 167900.88 | 166380.41 | –82250.89 | |||
| Two-factor | 510.68 | 19 | <0.001 | 0.993 | 0.984 | 0.038 [0.026, 0.051] | 163430.49 | 166420.31 | 164540.91 | –81120.75 | 2260.28° | 11 | <0.001 |
| Reduced | 4060.24 | 41 | <0.001 | 0.918 | 0.916 | 0.087 [0.080, 0.095] | 166990.97 | 168870.37 | 167690.85 | –83120.99 | 1740.20° | 11 | <0.001 |
| Men (n = 742) | |||||||||||||
| GRM (single-factor) | 1100.57 | 30 | <0.001 | 0.976 | 0.966 | 0.060 [0.048, 0.072] | 92210.70 | 94420.95 | 92900.53 | –45620.85 | |||
| Two-factor | 480.65 | 19 | <0.001 | 0.991 | 0.980 | 0.046 [0.030, 0.062] | 91020.80 | 93740.75 | 91870.41 | –44920.40 | 1400.90° | 11 | <0.001 |
| Reduced | 2530.65 | 41 | <0.001 | 0.937 | 0.935 | 0.084 [0.074, 0.094] | 93880.63 | 95590.17 | 94410.69 | –46570.31 | 1880.93° | 11 | <0.001 |
| Invariance models | |||||||||||||
| Model 1 - configural | 3240.13 | 60 | <0.001 | 0.975 | 0.965 | 0.048 [0.043, 0.053] | 257690.47 | 263020.83 | 259970.84 | –127880.73 | |||
| Model 2 - Weak/metric | 4400.36 | 72 | <0.001 | 0.965 | 0.959 | 0.052 [0.047, 0.056] | 257600.16 | 262260.85 | 259590.98 | –127960.08 | 140.69 | 12 | 0.259 |
| Model 3 - Strong/scalar | 5980.04 | 106 | <0.001 | 0.953 | 0.963 | 0.049 [0.045, 0.053] | 258020.93 | 260800.72 | 259210.87 | –128510.46 | 1100.77 | 34 | <0.001 |
| Model 3p- Partial strong/scalar | 4740.97 | 78 | <0.001 | 0.962 | 0.959 | 0.052 [0.047, 0.056] | 257520.96 | 261860.32 | 259380.52 | –127980.48 | 40.81^ | 6 | 0.569 |
Note: M2: model statistic; df: degrees of freedom; p: p-value; CFI: Comparative Fit Index; TLI: Tucker-Lewis Index; RMSEA [95% CI]: Root Mean Square Error of Approximation and its 95% confidence interval; AIC: Akaike Information Index; BIC: Bayesian Information Index; SABIC: Sample-size Adjusted BIC; LL: log-likelihood; Δχ2 = −2× (LLrestricted−LLnull); Δdf: dfrestricted−dfnull; Δp: p-value for Δχ2; °: tested against GRM; ^: tested against Model 2.
Table 2.
Bivariate correlations EDE-QS scores with the other variables in women and men. Coefficients are Pearson correlations unless otherwise indicated. More details are reported in SM7.
Table 2.
Bivariate correlations EDE-QS scores with the other variables in women and men. Coefficients are Pearson correlations unless otherwise indicated. More details are reported in SM7.
| Variable | Women | Men | Z | p | adj-p | r |
| Age | 0.104*** | 0.018 | −1.822 | 0.069 | 0.393 | –0.086 [–0.130, –0.041] |
| Age categoricala | 0.122*** | 0.060 | –1.324 | 0.185 | 0.393 | –0.062 [–0.107, –0.017] |
| BMI | 0.387*** | 0.328*** | –1.453 | 0.146 | 0.393 | –0.068 [–0.113, –0.024] |
| BMI categoricala | 0.363*** | 0.285*** | –1.838 | 0.066 | 0.393 | –0.086 [–0.131, –0.042] |
| Depression | 0.377*** | 0.351*** | –0.634 | 0.526 | 0.745 | –0.030 [–0.075, 0.015] |
| Anxiety | 0.380*** | 0.318*** | –1.496 | 0.135 | 0.393 | –0.070 [–0.115, –0.026] |
| Happiness | –0.290*** | –0.259*** | 0.732 | 0.464 | 0.717 | 0.034 [–0.010, 0.079] |
| Effort | 0.155*** | 0.161*** | 0.135 | 0.893 | 0.955 | 0.006 [–0.039, 0.051] |
| Reward | –0.203*** | –0.189*** | 0.307 | 0.759 | 0.922 | 0.014 [–0.030, 0.059] |
| ERI | 0.215*** | 0.209*** | –0.128 | 0.899 | 0.955 | –0.006 [–0.051, 0.039] |
| PSQI | 0.349*** | 0.316*** | –0.789 | 0.430 | 0.717 | –0.037 [–0.082, 0.008] |
| HLS-SF12 | –0.155*** | –0.211*** | –1.253 | 0.210 | 0.397 | –0.059 [–0.103, –0.014] |
| DHDLS | –0.038 | –0.120** | –1.770 | 0.077 | 0.393 | –0.083 [–0.128, –0.039] |
| Night work | –0.008 | –0.076* | –1.463 | 0.144 | 0.393 | –0.069 [–0.113, –0.024] |
| Violence | 0.123*** | 0.143*** | 0.441 | 0.660 | 0.863 | 0.021 [–0.024, 0.065] |
| Smokinga | 0.018 | 0.019 | 0.034 | 0.973 | 0.973 | 0.002 [–0.043, 0.046] |
| Drinkingb | 0.048 | –0.016 | –1.367 | 0.172 | 0.393 | –0.064 [–0.109, –0.020] |
Note: Z: Z-statistic; p: p-value; adj-p: False Discovery Rate-adjusted p-value; r: effect size for the difference between independent correlation coefficients; BMI: Body Mass Index; ERI: Effort/Reward Imbalance Index; PSQI: Pittsburgh Sleep Quality Index; HLS-SF12: Health Literacy Short Form; DHDLS: Digital Healthy Diet Literacy Survey; a: square root of ANOVA’s eta-square effect size; b: polyserial correlation.
Disclaimer/Publisher’s Note: The statements, opinions and data contained in all publications are solely those of the individual author(s) and contributor(s) and not of MDPI and/or the editor(s). MDPI and/or the editor(s) disclaim responsibility for any injury to people or property resulting from any ideas, methods, instructions or products referred to in the content. |
© 2026 by the authors. Licensee MDPI, Basel, Switzerland. This article is an open access article distributed under the terms and conditions of the Creative Commons Attribution (CC BY) license.
Copyright: This open access article is published under a Creative Commons CC BY 4.0 license, which permit the free download, distribution, and reuse, provided that the author and preprint are cited in any reuse.


