
Submitted:
23 April 2025
Posted:
23 April 2025
You are already at the latest version
Abstract
Background: Accurately assessing eating disorder (ED) severity and treatment progress is essential for effective intervention. The Comprehensive and Continuous Tool to Assess Severity and Improvement of Eating Disorders (CONTASI-ED) was developed to address limitations in existing assessments by incorporating behavioral, cognitive, and physiological markers. This study evaluates its psychometric properties and sensitivity to symptom changes in a clinical sample. Methods: Participants were 58 females diagnosed with EDs and 10 healthy controls. CONTASI-ED assessments were conducted over multiple time points, in outpatient and intensive treatment settings. We examined reliability, validity, and sensitivity to treatment-related change. CONTASI-ED scores were compared with EAT-26, and multivariable analyses explored the effects of BMI, age, and PTSD on symptom trajectories. Results: CONTASI-ED demonstrated excellent reliability, with test-retest correlations between 0.72–0.90 and inter-rater reliability of 0.68–0.95. The tool effectively distinguished ED patients from healthy controls (p < 0.001) and correlated strongly with EAT-26. Significant reductions in CONTASI-ED scores over time (p < 0.001) reflected treatment-related improvements, although temporary score increases highlighted greater self-awareness and symptom disclosure. BMI, age, and PTSD significantly influenced symptom severity and treatment response. Conclusions: CONTASI-ED is a reliable and valid tool for tracking ED severity and treatment progress. Its ability to detect hidden symptoms and fluctuating behaviors enhances its clinical utility. Future research should validate CONTASI-ED in diverse populations and explore digital applications for real-time monitoring and early intervention.
Keywords:
Eating disorders
; assessment
; primary care
; severity
; longitudinal
1. Introduction
The clinical assessment of eating disorders (EDs) remains a significant challenge, due to their complex, multifaceted nature. EDs manifest in a wide range of physical, cognitive, and emotional symptoms, varying widely across individuals. Although existing screening tools have high specificity and sensitivity, many are impractical in primary care, due to complexity, cultural adaptability issues, or administration demands.
Clinicians rely on self-report questionnaires, structured interviews and symptom-specific measures, yet most tools fail to provide a comprehensive picture of illness severity over time (Forbush et al., 2020; Treasure & Schmidt, 2021; Austin et al, 2023).
Several well-known tools assess ED pathology. The Eating Disorder Inventory-3 (EDI-3) measures psychological traits linked to EDs—such as perfectionism and low self-esteem (Garner et al., 1983; Clausen et al., 2010). However, it is time consuming, and not suited for short-term treatment evaluation. The Eating Disorder Examination (EDE)—a gold-standard interview—is time-intensive, and requires clinician training (Fairburn & Cooper, 1993; Thomas et al., 2014). The self-report version (EDE-Q) is more practical, but susceptible to self-report biases—particularly in individuals with poor insight, or profound shame (Luce et al., 2008).
Other instruments focus on symptom tracking. The CHEDS (Spangler, 2010) measures session-by-session fluctuations, but lacks coverage of psychiatric comorbidities. The Munich ED-Quest (Fichter et al., 2015) is DSM-5-based, but overlooks factors such as depression and trauma, which are crucial for predicting treatment outcomes (Weissman et al., 2021).
Tools such as the Eating Disorder Quality of Life (EDQoL) Scale assess broader life impacts. It is often used as a supplementary measure, and may not be sensitive to short-term symptom changes (Adair et al., 2007).
The CR-EAT (Moessner et al., 2015) captures long-term patterns, but lacks responsiveness to rapid treatment—an essential component for guiding clinical decisions and ensuring timely intervention adjustments shifts.
Newer methods, such as the Ecological Momentary Assessment (EMA), use digital tracking to reduce recall bias, but fail to quantify illness severity or track treatment progress in a standardized manner (Heron et al., 2017).
Common screening tools such as the SCOFF questionnaire (Morgan et al., 1999), the EAT-26 (Garner et al., 1982), and the EDE-Q (Mond et al., 2004) use cutoff scores, but often miss atypical presentations—such as restrictive eating disorder (RED) patients, who maintain Normal Weight despite severe metabolic dysregulation (Dufour. R., Steiger. H., Booij, L.,2025), or ED in males, older adults, or those or diverse cultural backgrounds (Zhang et al., 2024; Alexander et al., 2024). For example, individuals from cultures where weight gain is perceived as a sign of health or prosperity may experience EDs differently, and focus more on control or ritualistic eating behaviors than on body dissatisfaction (Mishra & Harrop, 2023; Schmidt et al., 2025). Such cultural variability underscores the need for more inclusive, context-sensitive tools.
Many existing tools overly rely on BMI—despite evidence that BMI alone explains less than 15% of ED-related quality-of-life variance (APA, 2013).
To conclude, current available tools address a narrow range of illness symptoms, do not quantify illness severity, and are mostly more appropriate for one-off use, or for tracking short-term treatment progress.
1.1. The Need for a Comprehensive and Continuous Assessment Tool
The need for CONTASI-ED arises from critical limitations in existing instruments—namely, their narrow symptom focus, poor responsiveness to change, and low utility in day-to-day clinical practice. CONTASI-ED was specifically developed to overcome these limitations by offering a brief yet comprehensive tool that captures both overt behaviors and covert drivers of pathology (e.g., compulsiveness, obsessive thinking, comorbidity, and psychosocial functioning). This approach aligns with research suggesting that symptom count is a stronger predictor of severity than diagnostic label alone (Ouellette et al., 2018; Carr et al., 2021; Koehler et al., 2021). By integrating state and trait features, it enables clinicians to monitor patients continuously across settings and phases of illness—providing real-time insight for timely intervention adjustments.
1.2. Study Aims
The present study sought to examine the psychometric properties of CONTASI-ED—including its reliability and validity across diverse clinical populations—and to measure illness severity and to track within-person changes in treatment outcomes, over short- and long-term periods alike.
2. Methods
2.1. Development of CONTASI-ED
The Comprehensive and Continuous Tool to Assess Severity and Improvement of Eating Disorders (CONTASI-ED) was developed using a user-centered design process. It integrates core ED symptoms with broader psychiatric, physical, and psychosocial indicators, and is designed for rapid administration (under 20 minutes), making it practical for routine use in clinical settings.
2.2. Item Generation and Tool Structure
Item generation for CONTASI-ED was based on clinical records and established ED assessment models (Schmidt et al., 2021; Gleaves et al., 2015; Fichter MM, Quadflieg, Gierk, et al. 2015; Moessner, Fassnacht, Bauer., 2015; de Young, Anderson, 2017; Bachner-Melman, Lev-Ari, Zohar et al., 2018; Kennedy, Kovan, Werner, et al.; Schaefer, Crosby & Machado, 2021; Austin et al., 2023; Hatoum, Burton, Berry et al., 2023; Tournayre, Alencar, Balbinotti et al., 2024; Forbush et al., 2020). The initial item pool comprised 78 items, grouped into eight proposed domains. Initial refinement focused on eliminating redundancy, clarifying ambiguous phrasing, and enhancing cultural adaptability. Through iterative review by the development team and an expert panel, the tool was refined to 61 items across six domains. Concept saturation was monitored throughout item generation, and no new themes emerging in the final phase—indicating adequate content coverage.
The tool was structured as a checklist with a summed severity score, including objective biomarkers such as: sodium levels (associated with excessive water consumption); amylase levels (indicative of purging); and creatine phosphokinase (CPK) (linked to over-exercising). Higher scores indicated greater illness severity.
2.3. Expert Panel Review and Scoring
An expert panel consisting of one psychiatrist, two clinical psychologists, four dietitians and one statistician, all with substantial experience in eating disorder treatment — reviewed the tool for clinical relevance, clarity, and scoring feasibility.
The review process involved two formal consensus rounds. In Round 1, panelists rated each item on a 5-point Likert scale for clarity, clinical relevance, and contribution to illness severity and relapse risk. Items with high variability or low median ratings were flagged for further discussion. In Round 2, a structured Delphi method was employed to resolve disagreements and finalize the scoring schema.
Weights were assigned based on both empirical findings and clinical judgment. For instance, the Obsessiveness domain was weighted more heavily, reflecting evidence that cognitive rigidity and intrusive thoughts are strong predictors of relapse (Forbush et al., 2020; Treasure & Schmidt, 2021). Conversely, while physiological markers (e.g., bradycardia, lab values) are diagnostically important, they were weighted lower due to their limited predictive value for long-term outcomes.
Final category weights were derived from a combination of Exploratory Factor Analysis (EFA) and expert judgment. Items with higher factor loadings were assigned greater weight within their domain, while expert clinicians adjusted the final weighting scheme to reflect treatment priorities and relapse risk. This iterative process ensured both statistical robustness and clinical coherence across diverse ED subtypes.
Based on panel input, the checklist was further refined to include standardized, clearly worded scoring anchors for symptom frequency. The tool was also designed for flexible use—either as a clinician-administered interview or a self-report questionnaire—depending on the clinical context and patient preference.
The final version comprises six main categories, with a maximum total score of 101, as detailed in Table 1.
2.4. Pilot Testing
The pilot study was conducted with a diverse sample of participants, to identify any issues with item wording, administration, or scoring. The first version of CONTASI-ED was pilot-tested by eight clinical dietitians across three different clinical settings: inpatient unit, intensive day treatment program, and outpatient clinics. During the pilot phase, clinicians completed the proposed tool alongside the EAT-26 questionnaire for all their patients. Based on detailed feedback from the dietitians, 11 items were revised to enhance clarity, improve comprehensibility of behavior descriptions, and to ensure the tool’s clinical relevance.
Key modifications included the addition of items related to previous treatment history and occupation; conversion of categorical or dichotomous variables into continuous scales for greater sensitivity in capturing symptom severity; and inclusion of dimensions reflecting core emotional components—such as mood disorders, anxiety, and impulse control disorders, which often underlie eating pathology.
These modifications ensured that the tool captures a comprehensive picture of illness severity and progress beyond the traditional symptoms-focused assessment. The refined version was then subjected to a psychometric evaluation, to assess its reliability and validity within real-world data, where samples of individuals report levels of psychopathology that generally range widely and have no clear points of discontinuity across severity levels.
2.5. Statistical Analysis
To evaluate the psychometric properties of CONTASI-ED and its sensitivity in tracking longitudinal changes in illness severity and treatment outcomes, a series of statistical analyses was performed:
The dataset was reformatted from a wide to long format, to facilitate time-series analysis. Participants with at least two valid BMI measurements were included.
Although diagnostic categories (e.g., AN, BN, BED) were available, analyses were conducted using BMI-based groups. This approach was chosen due to diagnostic fluidity across time-points, particularly in patients transitioning between restrictive and binge-purge behaviors. Grouping by BMI allowed clearer interpretation of symptom trajectories, minimized misclassification, and aligned with the tool's aim to track severity across a transdiagnostic spectrum. Thus to investigate how CONTASI-ED scores varied across different BMI categories, the BMI from the first three valid time points was calculated for each participant. Based on this, participants were categorized into three groups: Underweight, Normal Weight, and Overweight .
All analyses were conducted using R statistical software (version 3.5.0). Longitudinal data was analyzed using linear mixed-effects models, with random intercepts at the participant level, to account for repeated measurements. The model included Time as a fixed effect, to assess the trajectory of symptom changes. An interaction term between Time and BMI group was introduced, to determine whether the patterns of CONTASI-ED and EAT-26 scores differed across BMI categories. Univariate and multivariate survival analyses were also performed, to explore the predictive value of CONTASI-ED scores for treatment outcomes.
To visualize the longitudinal trends, line plots were generated, displaying the mean CONTASI-ED and EAT-26 scores over time, for each BMI group. To better understand the trend of EAT-26 measurements over time across BMI groups, we applied the locally estimated scatterplot smoothing (LOESS) method. Since CONTASI-ED involved more frequent measurements than EAT-26, gaps in the data related to the latter made it difficult to observe a clear trend using traditional line plots. The LOESS method was used to smooth fluctuations and provide a continuous representation of the trajectory over time. This approach allowed us to visualize the overall trend of EAT26 scores while preserving local variations, ensuring a more accurate interpretation of changes within each BMI group.
3. Results
3.1. Study Population
All participants were recruited and assessed in Israel. All procedures adhered to the Declaration of Helsinki. Assessments took place within community-based clinics, hospital-affiliated outpatient programs, and intensive day programs. The study included 58 Israeli female patients, who were admitted to community-based outpatient clinic for eating disorders during 2022–23. Data from repeated assessments of 31 patients over 22 time points, and from the remaining 17 patients (who had not remained in treatment long enough) at 3 timepoints, was incorporated into the psychometric analysis of CONTASI-ED. Ten other patients of this sample were treated in an intensive day program, with CONTASI-ED assessments over three months.
ED diagnoses: 54% Anorexia Nervosa (restricting type); 12% Anorexia Nervosa (binge/purge type); 14% Atypical Anorexia Nervosa; 10% Bulimia Nervosa; 10% Binge Eating Disorder. Over half had been previously diagnosed with PTSD, and/or borderline personality.
Participants’ overall mean age was 23.9 years (SD = 6.9), and mean BMI at admission was 20.0 (SD= 5.7).
Ten healthy women—of the same mean age, but with a mean BMI of 23.7 (SD=2.2)—served as a control group, adjusted for age and education.
All participants provided written consent to have their data used for this study’s analysis and publication.
The assessment sample was divided into three BMI categories: Normal Weight (reference group), Underweight, and Overweight. CONTASI-ED and EAT26 scores were analyzed to examine changes over time, and the effect of BMI group status on those changes.
3.2. Psychometric Properties
The psychometric evaluation of CONTASI-ED revealed strong reliability and validity across multiple measures:
Test-retest reliability: Pearson’s correlation coefficients (r) for test-retest reliability of the total CONTASI-ED score ranged from 0.72 to 0.90—indicating excellent stability over time.
Inter-Rater reliability: Three clinicians independently interviewed and scored 22 patients. Fleiss’s Kappa reliability (κ) ranged from 0.68 to 0.95—reflecting high agreement between different raters using the tool.
Patient-Dietitian reliability: Spearman correlations between patient self-reports and dietitian-administered assessments ranged from 0.75 to 0.92—indicating strong alignment between the two modes of administration.
Criterion (Discriminant) validity: CONTASI-ED demonstrated excellent criterion validity. A comparison of CONTASI-ED scores between eating disorder patients and healthy control women revealed statistically significant differences (p < 0.001), (M = 7.6, SD = 4.7)—indicating an extremely large difference between groups, with effect sizes (Cohen’s d) of 3.73 confirming the tool’s ability to discriminate between clinical and non-clinical populations. Moreover, when comparing CONTASI-ED and EAT26 scores between diagnosed participants and healthy controls, both tools exhibited higher scores for diagnosed participants—as shown in Table 2.
Convergent validity: Convergent validity was assessed by examining correlations between CONTASI-ED and EAT-26 scores over the course of treatment. CONTASI-ED scores were strongly correlated with EAT-26 scores throughout treatment (Figure 1 and 2). Initially, both measures were high, gradually decreasing over the course of treatment, until around 12 months—after which occasional regressions were observed. These regressions initially reflected the disclosure of previously hidden symptoms and subsequent shifts in eating disorder subtypes (e.g., from restrictive anorexia nervosa to binge-purge anorexia or bulimia nervosa).
Internal consistency: Internal consistency was calculated using McDonald’s Omega, accounting for different item loadings and variations in the strength of the items’ associations with the construct being measured (Nunnally & Bernstein, 1994; McNeish, 2018). Apart from the “Start” category, all other categories exhibit omega coefficients above the acceptable threshold of 0.70—ranging between 0.72 and 0.9.
3.3. Change in CONTASI-ED Scores Over Time
CONTASI-ED scores decreased significantly over time. From Time 1 to Time 2, scores decreased by 12.75 units (B = -12.75, 95% CI: -15.12 to -10.39).By Time 13, the cumulative reduction reached 20.87 units (B = -20.87, 95% CI: -23.80 to -17.94). Occasional score increases at later time points were interpreted as indicators of improved self-awareness and the disclosure of previously unreported symptoms, rather than clinical deterioration.
BMI Group Differences
At baseline, Underweight participants had significantly higher CONTASI-ED scores than the Normal Weight group (B = 10.04, 95% CI: 2.86 to 17.21, p = 0.006). The Overweight group did not significantly differ from the Normal Weight group (B = -1.32, 95% CI: -10.51 to 7.87, p = 0.778). Interaction effects indicated that Underweight participants showed a slower rate of improvement in the early stage of treatment. For example, at Time 2, the difference in reduction was significantly smaller (Time 2: B = 9.19, 95% CI: 3.98 to 14.39, p = 0.001). By Time 8, however, this difference diminished and was no longer statistically significant (B = 3.67, 95% CI: -1.67 to 9.01, p = 0.177).
Conversely, participants in the Overweight participants demonstrated greater reductions in CONTASI-ED scores than those of the Normal Weight group, with significant interaction effects at multiple time points (e.g., Time 2: B = 11.08, 95% CI: 4.16 to 17.99, p = 0.002).
3.4. Change in EAT-26 Scores Over Time
EAT-26 scores also showed significant reductions across time (p < 0.001). From baseline to Time 2, scores dropped by 14.77 units (B = -14.77, 95% CI: -21.01 to -8.54). By Time 10, the total reduction reached 22.13 units (B = -22.13, 95% CI: -28.79 to -15.46).
In the Underweight group, interaction effects indicated limited changes in EAT26 scores over time. While early time points suggested larger increases (e.g., Time 2: B = 9.85, 95% CI: -5.32 to 25.02, p = 0.201), these trends were not statistically significant, and diminished further at subsequent time points (e.g., Time 10: B = 2.80, 95% CI: -14.01 to 19.62, p = 0.742).
In contrast, the Overweight group showed significant increases in EAT-26 scores at specific time points—notably at Time 4 (B = 33.54, 95% CI: 6.59 to 60.49, p = 0.015). However, these patterns were inconsistent over time, with many time points yielding non-significant interaction effects (e.g., Time 9: B = 4.86, 95% CI: -12.22 to 21.94, p = 0.574).
3.5. Multivariable Analysis
3.5.1. Effect of Age on CONTASI-ED Scores
Age was significantly associated with higher CONTASI-ED scores in the Overweight group (B = 1.42, 95% CI: 0.36 to 2.49, p = 0.010), but only to a limited degree with Underweight and Normal Weight participants.
Including Age as a covariate improved model fit for the Overweight group: marginal R² increased from 0.437 to 0.604.
3.5.2. Effect of PTSD
PTSD had a significant impact only in the Normal Weight group (B = -16.81, 95% CI: -22.50 to -11.12, p < 0.001), whereas it did not significantly affect CONTASI-ED scores for Underweight or Overweight participants.
3.5.3. Effect of PTSD on CONTASI-ED Scores
Adjusting for PTSD had a more pronounced effect on the Normal Weight participants. In the Underweight group, PTSD had no significant impact (B = 1.42, 95% CI: -13.14 to 15.98, p = 0.848), and baseline CONTASI-ED scores remained stable (41.48, 95% CI: 34.94 to 48.02).
Similarly, in the Overweight group, PTSD was not a significant predictor (B = 8.89, 95% CI: -1.85 to 19.63, p = 0.102), and its inclusion did not substantially change baseline CONTASI-ED estimates (30.12, 95% CI: 23.36 to 36.89). However, in the Normal Weight group, PTSD was strongly associated with lower CONTASI-ED scores (B = -16.81, 95% CI: -22.50 to -11.12, p < 0.001), and adjusting for PTSD increased the baseline estimate from 33.99 (95% CI: 28.29 to 39.70) to 31.45 (95% CI: 27.28 to 35.61).
4. Discussion
CONTASI-ED provides a comprehensive, multidimensional approach to ED assessment. It integrates state (e.g., physiological markers) and trait factors (e.g., trauma history), thereby offering a holistic assessment framework. Repeated usage enables tracking of changes in transient symptoms, as well as maladaptive personality traits and adjusted treatment.
The need for a comprehensive and continuous assessment tool is highlighted by the limitations of existing tools, which often focus narrowly on symptomatology, while neglecting broader clinical factors such as comorbidities, psychosocial functioning, and treatment history. CONTASI-ED was developed to address this shortcoming, by integrating both subjective and objective health indicators, thus enhancing its suitability for routine clinical use. It also makes it possible to assess the patients’ status on the same scale, even if they had changed the treatment setting from full-time hospitalization (where they may have regained some weight) to outpatient status, but still require treatment due to preoccupied thinking, compulsive behavior, or dismissal from work or school due to their condition.
The inclusion of pathophysiological biomarkers—derived from common laboratory tests—adds an essential objective dimension to the assessment. This enhancement not only validates the assessment but also enables clinicians to tailor treatment plans based on a more comprehensive set of data, thereby improving the likelihood of desired outcomes.
Unlike static screening tools, CONTASI-ED offers enhanced sensitivity to treatment-related change—particularly in detecting previously concealed symptoms or shifts between diagnostic categories. For instance, in several cases, score increases reflected not clinical deterioration, but increased authenticity and trust in the therapeutic alliance. This capacity to register ‘honest worsening’ is a key distinction from tools like EAT-26, which often remain flat in the face of internal symptom shifts. CONTASI-ED therefore contributes uniquely to clinical insight, therapeutic pacing, and relapse prevention.
Although self-report tools may pose challenges in terms of compliance and data completeness—especially among individuals facing significant distress or cognitive impairment—the repeated assessments by CONTASI-ED mitigate subjective bias. Having clinicians complete the tool concurrently with patients can also alleviate the potential effects of mood fluctuations and environmental factors.
The psychometric evaluation of CONTASI-ED has demonstrated robust external reliability and validity across diverse clinical populations. It has shown strong reliability, validity, and sensitivity to treatment-related changes. It has effectively distinguished between ED patients and healthy controls and captured dynamic symptom shifts—including ED subtype transitions (e.g., Anorexia to Bulimia). The tool’s temporal flexibility proved to be critical during pilot testing, where intensive day-treatment patients showed a 22% greater score variability than inpatients—a pattern EAT-26 failed to detect. Moreover, strong patient-dietitian correlations indicate that CONTASI-ED maintains reliability across different administration modes, thus enhancing its applicability in both clinical and research settings.
With respect to internal consistency, all categories other than the “Start” category exhibit omega coefficients above the acceptable threshold of 0.70. While internal consistency is often used as a measure of scale reliability (because it provides evidence that the scale is consistently measuring the same thing, rather than concluding that the scale is measuring the intended construct, which is a question of scale validity), it assumes that all items within a category measure a single, cohesive construct. As McNeish (2018) points out, omega is often lower for broad constructs that assess multiple symptom dimensions, compared with narrowly defined, homogeneous constructs. For example, the “Start” category means to take into account diverse risk factors indicators (such as trauma history, occupation status, substance use), which are clinically relevant and usually have high impact on illness severity, treatment decisions and outcome, but may not cluster statistically as strongly as more uniform symptom groups (such as compulsions or obsessions). Therefore, lower internal consistency in this case does not indicate poor measurement reliability, but rather reflects the expected multidimensional nature of eating disorder severity assessment.
Longitudinal data confirmed the ability of CONTASI-ED to track symptom fluctuations over time—both in outpatient and in intensive day-care settings—thus reflecting treatment progress. Occasional “blips” in scores suggest that improved self-awareness and disclosure of previously hidden symptoms play a role in symptom fluctuation, as well as the tool’s ability to capture dynamic shifts in eating disorder pathology beyond surface-level behavioral changes. When compared with EAT-26, CONTASI-ED proved to be more sensitive to nuanced and evolving symptom presentations—particularly those linked to compensatory behaviors and cognitive distortions. This suggests that CONTASI-ED may be particularly valuable for monitoring patients with complex and fluctuating symptom profiles, such as those transitioning between eating disorder subtypes.
The study identified significant BMI-related differences in CONTASI-ED scores, with Underweight participants exhibiting higher baseline scores and a slower rate of improvement than their Normal Weight counterparts. This aligns with prior research that found that individuals of lower BMI often present more entrenched eating disorder cognitions, resulting in slower treatment response. In contrast, Overweight participants demonstrated greater reductions in CONTASI-ED scores, which may reflect enhanced responsiveness to interventions aimed at addressing binge-eating patterns.
The multivariable analysis also revealed the effect of age and PTSD on CONTASI-ED scores. The association between age and higher scores in the Overweight group suggests that older participants in this category may experience more persistent symptomatology. Meanwhile, PTSD had a significant impact in the Normal Weight group, highlighting the importance of trauma-informed approaches in eating disorder treatment. These findings reinforce the need for personalized intervention strategies that are tailored to the interplay between psychological and physiological factors.
The incorporation of CONTASI-ED into clinical practice has several implications. It takes less than 20 minutes to administer—making it feasible for use in busy clinical settings. By fostering a continuous assessment framework, clinicians can monitor treatment efficacy dynamically, and make timely adjustments to interventions (for example, by focusing on behaviors rather than attitudes—or vice versa). The capacity to track longitudinal changes enables early identification of relapse indicators or shifts in symptomatology, thus ensuring treatments remain relevant to patients’ evolving needs.
Another key advantage is that CONTASI-ED does not operate on a cutoff system, thus allowing it to be applied flexibly across diverse clinical scenarios. Users can adapt the tool’s parameters, making it suitable for individuals of different cultural backgrounds, thereby broadening its impact and applicability. In our experience, treatment intensity was reduced to once a week (from 3–5 days a week) when CONTASI-ED scores dropped to 10 and less.
Limitations and Future Research Directions
While the current findings support CONTASI-ED’s reliability and validity, the study sample was predominantly female, limiting generalizability to males or culturally diverse populations. Further research is essential to validate the utility of CONTASI-ED across more diverse populations—including males and individuals of varying cultural backgrounds—to ensure its generalizability.
Although CONTASI-ED is designed to capture a wide range of factors relevant to EDs, some nuances may still be missed, unless users are encouraged to adapt the tool to specific populations or settings.
Moreover, the exclusion of potential protective factors—such as social strengths, body appreciation or self-compassion, which could mitigate ED risk and support recovery—may limit the tool’s comprehensiveness.
The subjective nature of scoring dimensions stems from a lack of evidenced-based data on the relative contribution of each factor to illness severity and treatment progression. The proposed tool’s greater consideration of pathological behaviors than of pathological thinking, and the perception that obsessive thinking and rigid concepts are more difficult to mitigate than pathological behaviors, resulted in greater weight being attributed to each obsessive thought.
The relatively small sample size and the demographic homogeneity of participants in the evaluation study may limit generalizability and restrict thorough predictive analyses regarding the contributions of various factors to treatment outcomes. Further research, with larger sample sizes, may improve its validation process. Long-term studies might also examine its effectiveness in contrasting settings—both inpatient and outpatient—and among diverse demographic groups. Additionally, the integration of CONTASI-ED into digital health platforms may enhance real-time symptom monitoring, thereby offering early intervention with high-risk patients.
Finally, the addition of “Social and/or mentalizing impairment” was performed after the main analysis, so its contribution to the tool should be further assessed.
5. Conclusions
CONTASI-ED represents a significant advancement in eating disorder assessment by offering a comprehensive and dynamic approach to symptom monitoring. By integrating clinical and psychosocial factors, it enables more personalized, nuanced, and effective treatment strategies for individuals affected by eating disorders.
By addressing the limitations of existing tools and providing detailed insights into symptom trajectories, CONTASI-ED has the potential to transform both clinical practice and research. Further refinement and broader validation will solidify its role as a cornerstone of personalized eating disorder care.
References
- Adair, C. E. , Marcoux, G. C., Cram, B. S., Ewashen, C. J., Chafe, J., Cassin, S. E., Pinzon, J., Gusella, J. L., Geller, J., Scattolon, Y., Fergusson, P., Styles, L., & Brown, K. E. (2007). Development and multi-site validation of a new condition-specific quality of life measure for eating disorders. Health and Quality of Life Outcomes, 5, Article 23. [CrossRef]
- Alexander, T. , Burnette, C. B., Cory, H., McHale, S., & Simone, M. (2024). The need for more inclusive measurement to advance equity in eating disorders prevention. Eating Disorders, 32, (6), 798–816. [CrossRef]
- American Psychiatric Association. 2013. Diagnostic Statistical Manual of Mental Disorders, 5th ed, DSM-5. Washington, DC: American Psychiatric Association. [CrossRef]
- Austin, A. , De Silva, U., Ilesanmi, C., Likitabhorn, T., Miller, I., Fialho, M. D. L. S.,... & Richmond, T. K. (2023). International consensus on patient-centred outcomes in eating disorders. The Lancet Psychiatry, Dec;10(12):966–973. [CrossRef]
- Bachner-Melman, R. , Lev-Ari, L., Zohar, A. H., & Lev, S. L. (2018). Can we predict who will be more successful in a cognitive behavioral therapy for eating disorders? Journal of Clinical Psychology, 74, (9), 1612–1625. [CrossRef]
- Carr, M. M. , Lydecker, J. A., White, M. A., & Grilo, C. M. (2021). Examining the clinical utility of the DSM-5 severity specifier for binge-eating disorder. International Journal of Eating Disorders, 54(8), 1455–1460. [CrossRef]
- Clausen, L. , Rosenvinge, J. H., Friborg, O., & Rokkedal, K. (2011). Validating the Eating Disorder Inventory-3 (EDI-3): A comparison between 561 female eating disorders patients and 878 females from the general population. Journal of Psychopathology and Behavioral Assessment, 33(1), 101–110. [CrossRef]
- de Young, K. P. , & Anderson, D. A. (2017). Prevalence and correlates of exercise motivated by negative affect. International Journal of Eating Disorders, 50(1), 52–56. [CrossRef]
- Dufour, R. , Steiger, H., & Booij, L. (2025). Examining dimensionality and item-quality of the Eating Disorder Examination Questionnaire in individuals with eating disorders using item response theory analysis. International Journal of Eating Disorders, 58, (3), 349–361. [CrossRef]
- Fairburn, C. G. , & Cooper, Z. (1993). The Eating Disorder Examination (12th ed.). In C. G. Fairburn & G. T. Wilson (eds.), Binge eating: Nature, assessment, and treatment (pp. 317–360). Guildford Press.
- Fichter, M. M. , Quadflieg, N., Gierk, B., Voderholzer, U., & Heuser, J. (2015). The Munich Eating and Feeding Disorder Questionnaire (Munich ED-Quest) DSM-5/ICD-10: Validity, reliability, sensitivity to change and norms. European Eating Disorders Review, 23(3), 229–240. [CrossRef]
- Forbush, K. T. , Bohrer, B. K., Hagan, K. E., Chapa, D. A. N., Gould, S. R., & Petkus, J. M. (2020). Development and initial validation of the Eating Pathology Symptoms Inventory-Clinician-Rated Version (EPSI-CRV). Psychological Assessment, 32(9), 943–955. [CrossRef]
- Gleaves, D. H. , Graham, E. C., & Ambwani, S. (2013). Measuring "Orthorexia": Development of the Eating Habits Questionnaire. International Journal of Eating Disorders, 46(3), 276–287. [CrossRef]
- Garner, D. M. , Olmsted, M. P., Bohr, Y., & Garfinkel, P. E. (1982). The Eating Attitudes Test: Psychometric features and clinical correlates. Psychological Medicine, 12(4), 871–878. [CrossRef]
- Garner, D. M. , Olmsted, M. P., & Polivy, J. (1983). Development and validation of a multidimensional eating disorder inventory for anorexia nervosa and bulimia. International Journal of Eating Disorders, 2 (2), 15–34. [CrossRef]
- Hatoum, A. S. , Burton, J. D., Berry, J. D., Keller, M. C., & Munn-Chernoff, M. A. (2023). Genome-wide association study of disordered eating in a large twin sample. Molecular Psychiatry, 28(1), 485–493. [CrossRef]
- Heron, K. E. , Everhart, R. S., McHale, S. M., & Smyth, J. M. (2017). Using mobile-technology-based ecological momentary assessment (EMA) methods with youth: A systematic review and recommendations. Journal of Pediatric Psychology, 42(10), 1087–1107. [CrossRef]
- Jurich, P.D. & Madison M.J. (2023) Measuring item influence for diagnostic classification models. Educational Assessment, 28, 4, 229–245. [CrossRef]
- Kennedy, S. F. , Kovan, J., Werner, E., Egan, A. M., Becker, C. B., & Becker, A. E. (2021). Examining eating disorder screening instruments for use in transgender and gender diverse populations. Journal of Eating Disorders, 9(1), 1–11.
- Koehler, J. M. , Breithaupt, L., Waring, M. E., Bulik, C. M., & Matheson, B. E. (2021). A systematic review of smartphone applications for eating disorder prevention. European Eating Disorders Review, 29(6), 808–824.
- Luce KH, Crowther JH, Pole M. (2000). Eating Disorder Examination Questionnaire (EDE-Q): Norms for undergraduate women. International Journal of Eating Disorders, 41(3), 273–6. [CrossRef]
- McNeish, D. (2018). Thanks coefficient alpha, we’ll take it from here. Psychological Methods, 23(3), 412–433. [CrossRef]
- Mishra, K. and Erin Harrop E. (2023). Teaching how to avoid overreliance on BMI in diagnosing and caring for patients with eating disorders. 25(7), E507–513. [CrossRef] [PubMed]
- Moessner, M. , Fassnacht, D. B., & Bauer, S. (2015). Online assessment of eating disorders: the clinical and research inventory for eating disorders (CR-EAT). Mental Health & Prevention, 3(4), 170–177.
- Mond JM, Hay PJ, Rodgers B, Owen C, & Beumont PJV (2004). Validity of the Eating Disorder Examination Questionnaire (EDE-Q) in screening for eating disorders in community samples. Behaviour Research and Therapy, 42(5), 551–567. [PubMed: 15033501]. [CrossRef]
- Morgan JF, Reid F, Lacey JH. (1999). The SCOFF questionnaire: Assessment of a new screening tool for eating disorders. British Medical Journal, 319, 1467–1468. [PubMed: 10582927]. [CrossRef]
- Ouellette, A. S. , Rodrigue, C., Lemieux, S., Tchernof, A., Biertho, L., & Bégin, C. (2018). An examination of the mechanisms and personality traits underlying food addiction among individuals with severe obesity awaiting bariatric surgery. Eating and Weight Disorders-Studies on Anorexia, Bulimia and Obesity, 23(1), 1–8. [CrossRef]
- Schaefer, L. M. , Crosby, R. D., & Machado, P. P. (2021). Defining remission, recovery, and relapse in eating disorders: A systematic review. International Journal of Eating Disorders, 54(12), 2079–2098.
- Schmidt, U. , Sharpe, H., Bartholdy, S., Bonin, E. M., Davies, H., Easter, A.,... & Treasure, J., (2025). Treatment of anorexia nervosa: A multimethod investigation translating experimental neuroscience into clinical practice. Program Grants for Applied Research, 5(16), 1–258. [CrossRef]
- Schmidt UH, Claudino A, Fernández-Aranda F, Giel KE, Griffiths J, Hay PJ, Kim YR, Marshall J, Micali N, Schaefer LM, Crosby RD, Machado PPP. (2021). A systematic review of instruments for the assessment of eating disorders among adults. Current Opinion in Psychiatry. 34 (6), 543–562. [CrossRef] [PubMed] [PubMed Central]
- Spangler, D. L. (2010). The change in eating disorder symptoms scale: scale development and psychometric properties. Eating Behaviors, 11(3), 131–137. [CrossRef]
- Thomas, J. J. , Roberto, C. A., & Berg, K. C. (2014). The Eating Disorder Examination: a semi-structured interview for the assessment of the specific psychopathology of eating disorders. Advances in Eating Disorders: Theory, Research and Practice, 2(2), 190–203.
- Tournayre, L. , Alencar M., Balbinotti A., Johana Monthuy-Blanc, J. (2024) Some hope for a dimensional assessment? A critical review of psychometric validated (semi-) structured interview to assess eating disorders. European Eating Disorders Reviews, 32, 1138–1156. [CrossRef]
- Treasure, J. , & Schmidt, U. (2021). The cognitive-interpersonal maintenance model of anorexia nervosa revisited: A summary of the evidence for cognitive, socio-emotional and interpersonal predisposing and perpetuating factors. Journal of Eating Disorders, 9 (1), 1–10. [CrossRef]
- Weissman, R. S. , Becker, A. E., Bulik, C. M., Frank, G. K., Klump, K. L., Steiger, H.,... & Walsh, B. T. (2021). Speaking of that: terms to avoid or reconsider in the eating disorders field. International Journal of Eating Disorders, 54(8), 1501–1507. [CrossRef]
- Zhang, J. , Cui, S., Xu, Y., Cui, T., Barnhart, W. R., Ji, F., Nagata, J. M., & He, J. (2024). Introducing diagnostic classification modelling as an unsupervised method for screening probable eating disorders. Assessment. [CrossRef]
Figure 1.
Differences in CONTASI-ED based on BMI group.
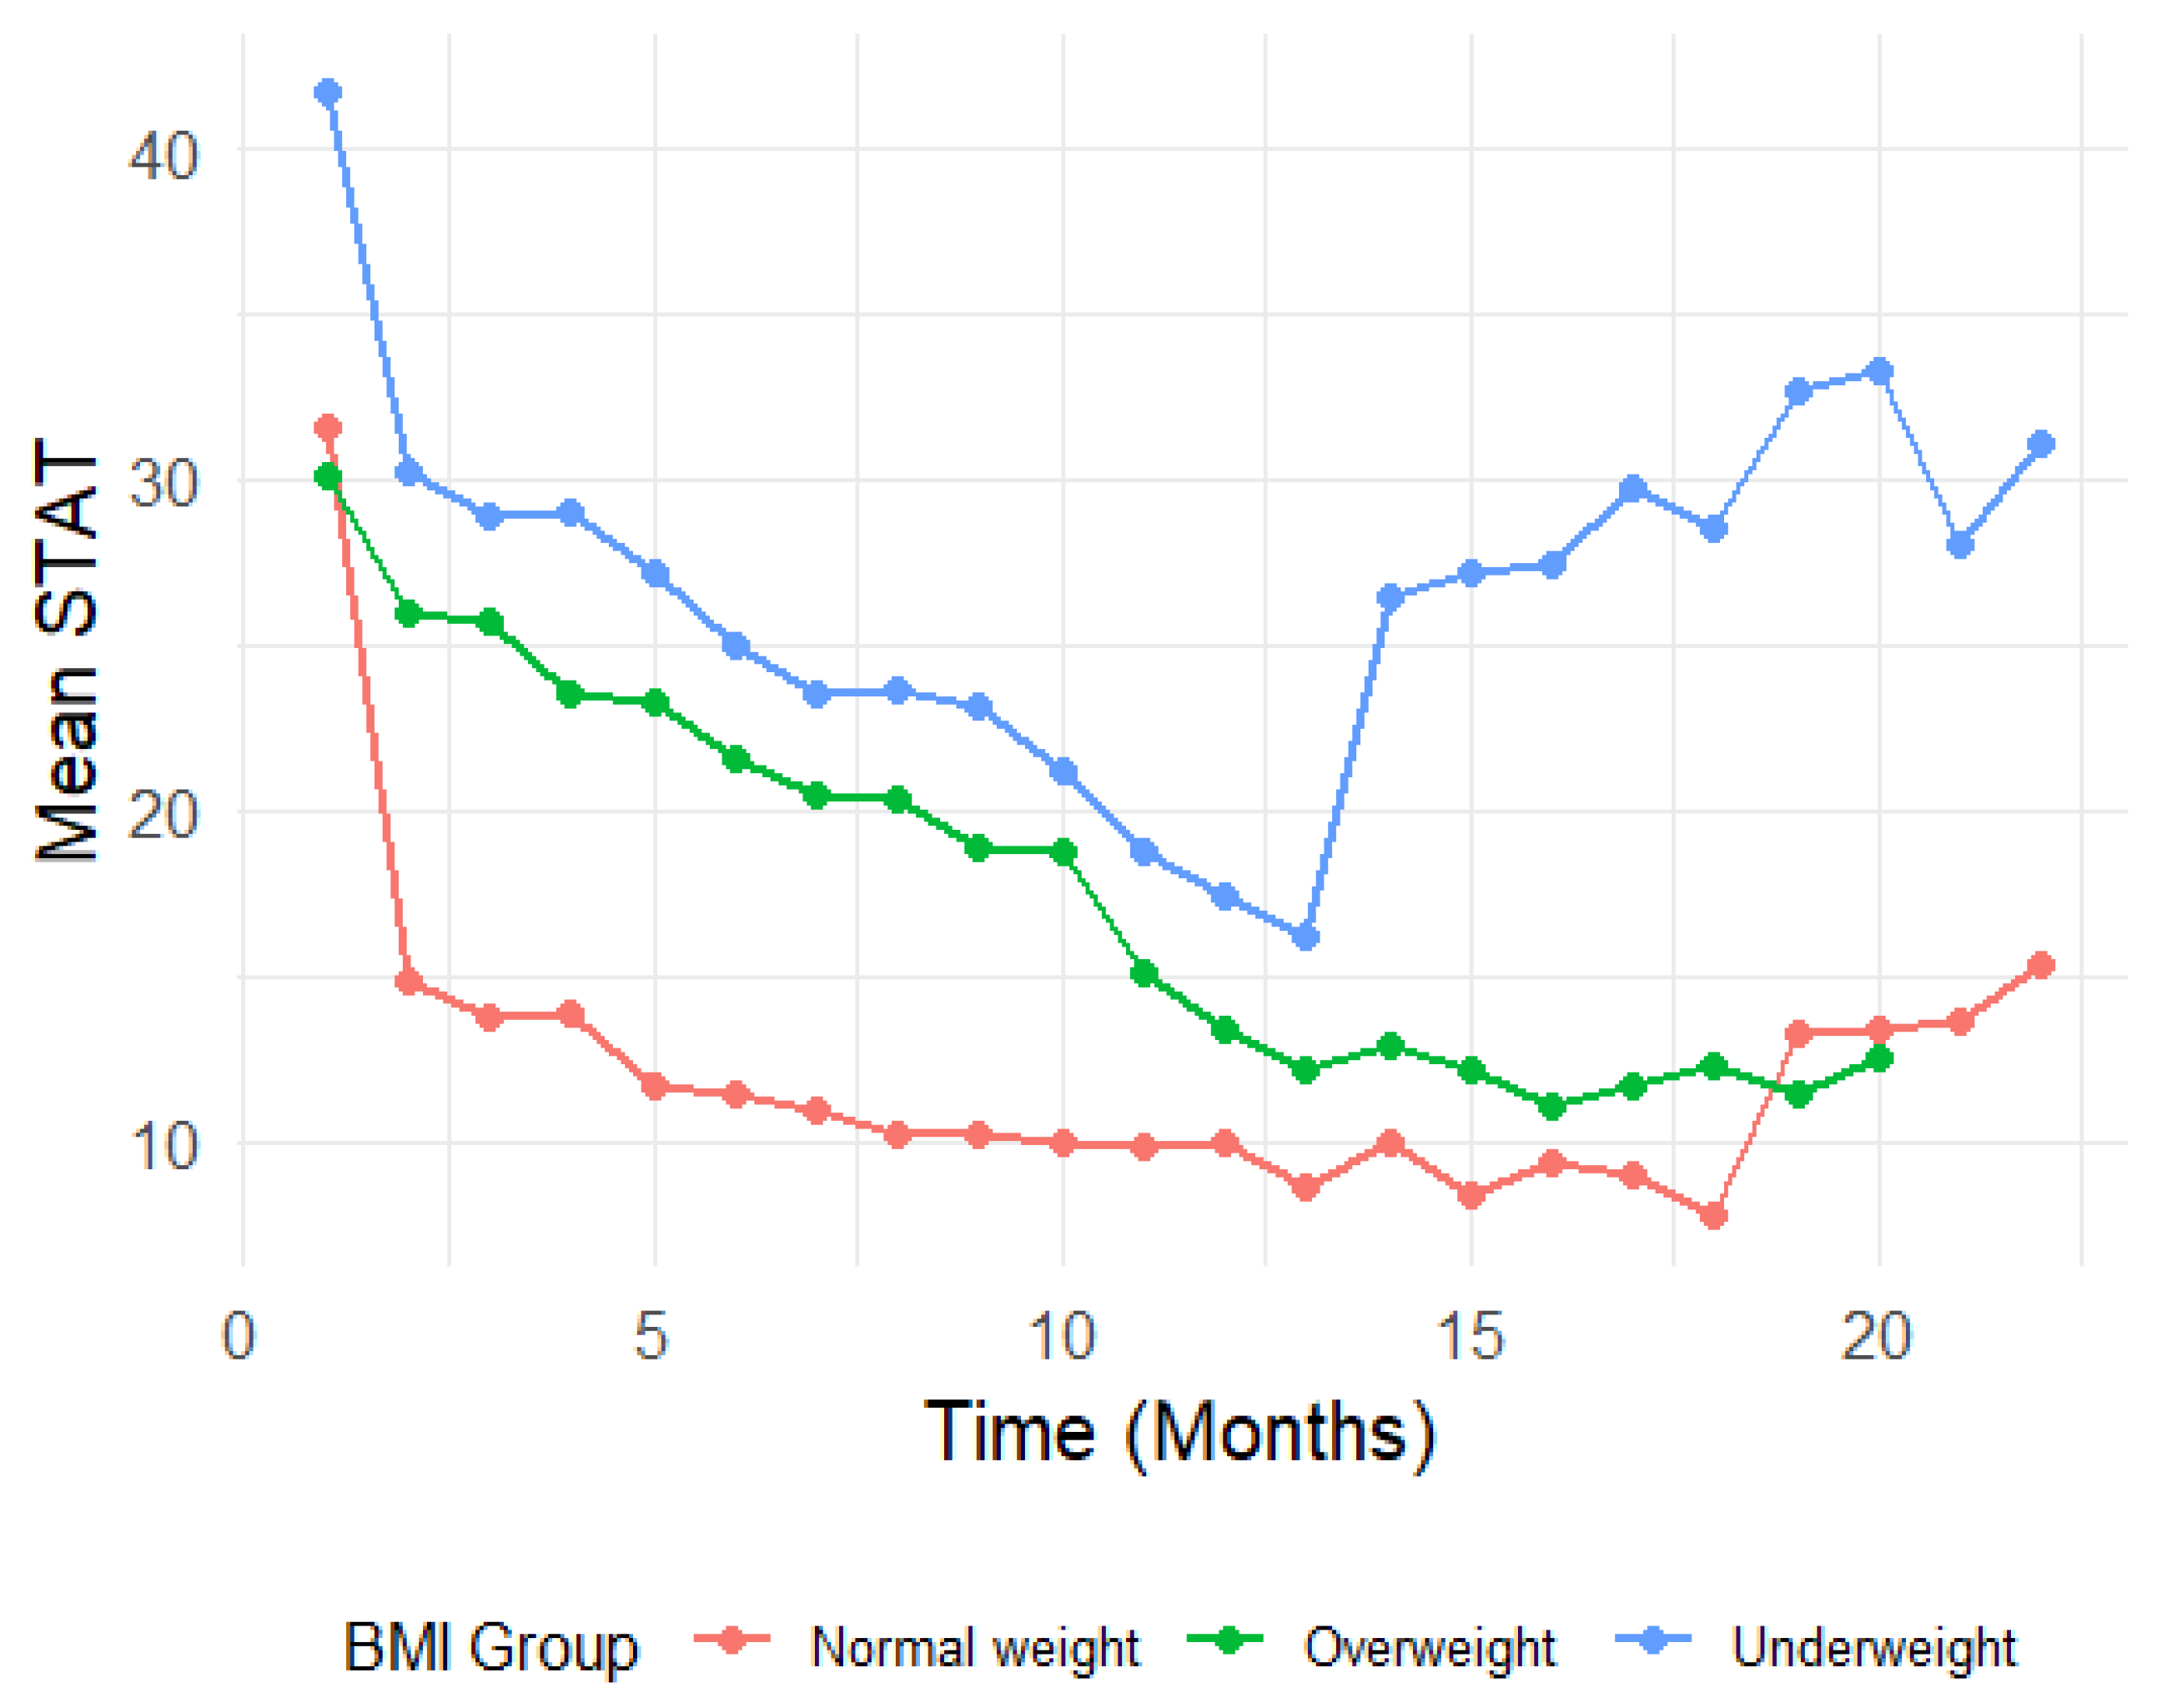
Figure 2.
Differences in EAT-26 scores based on BMI group.
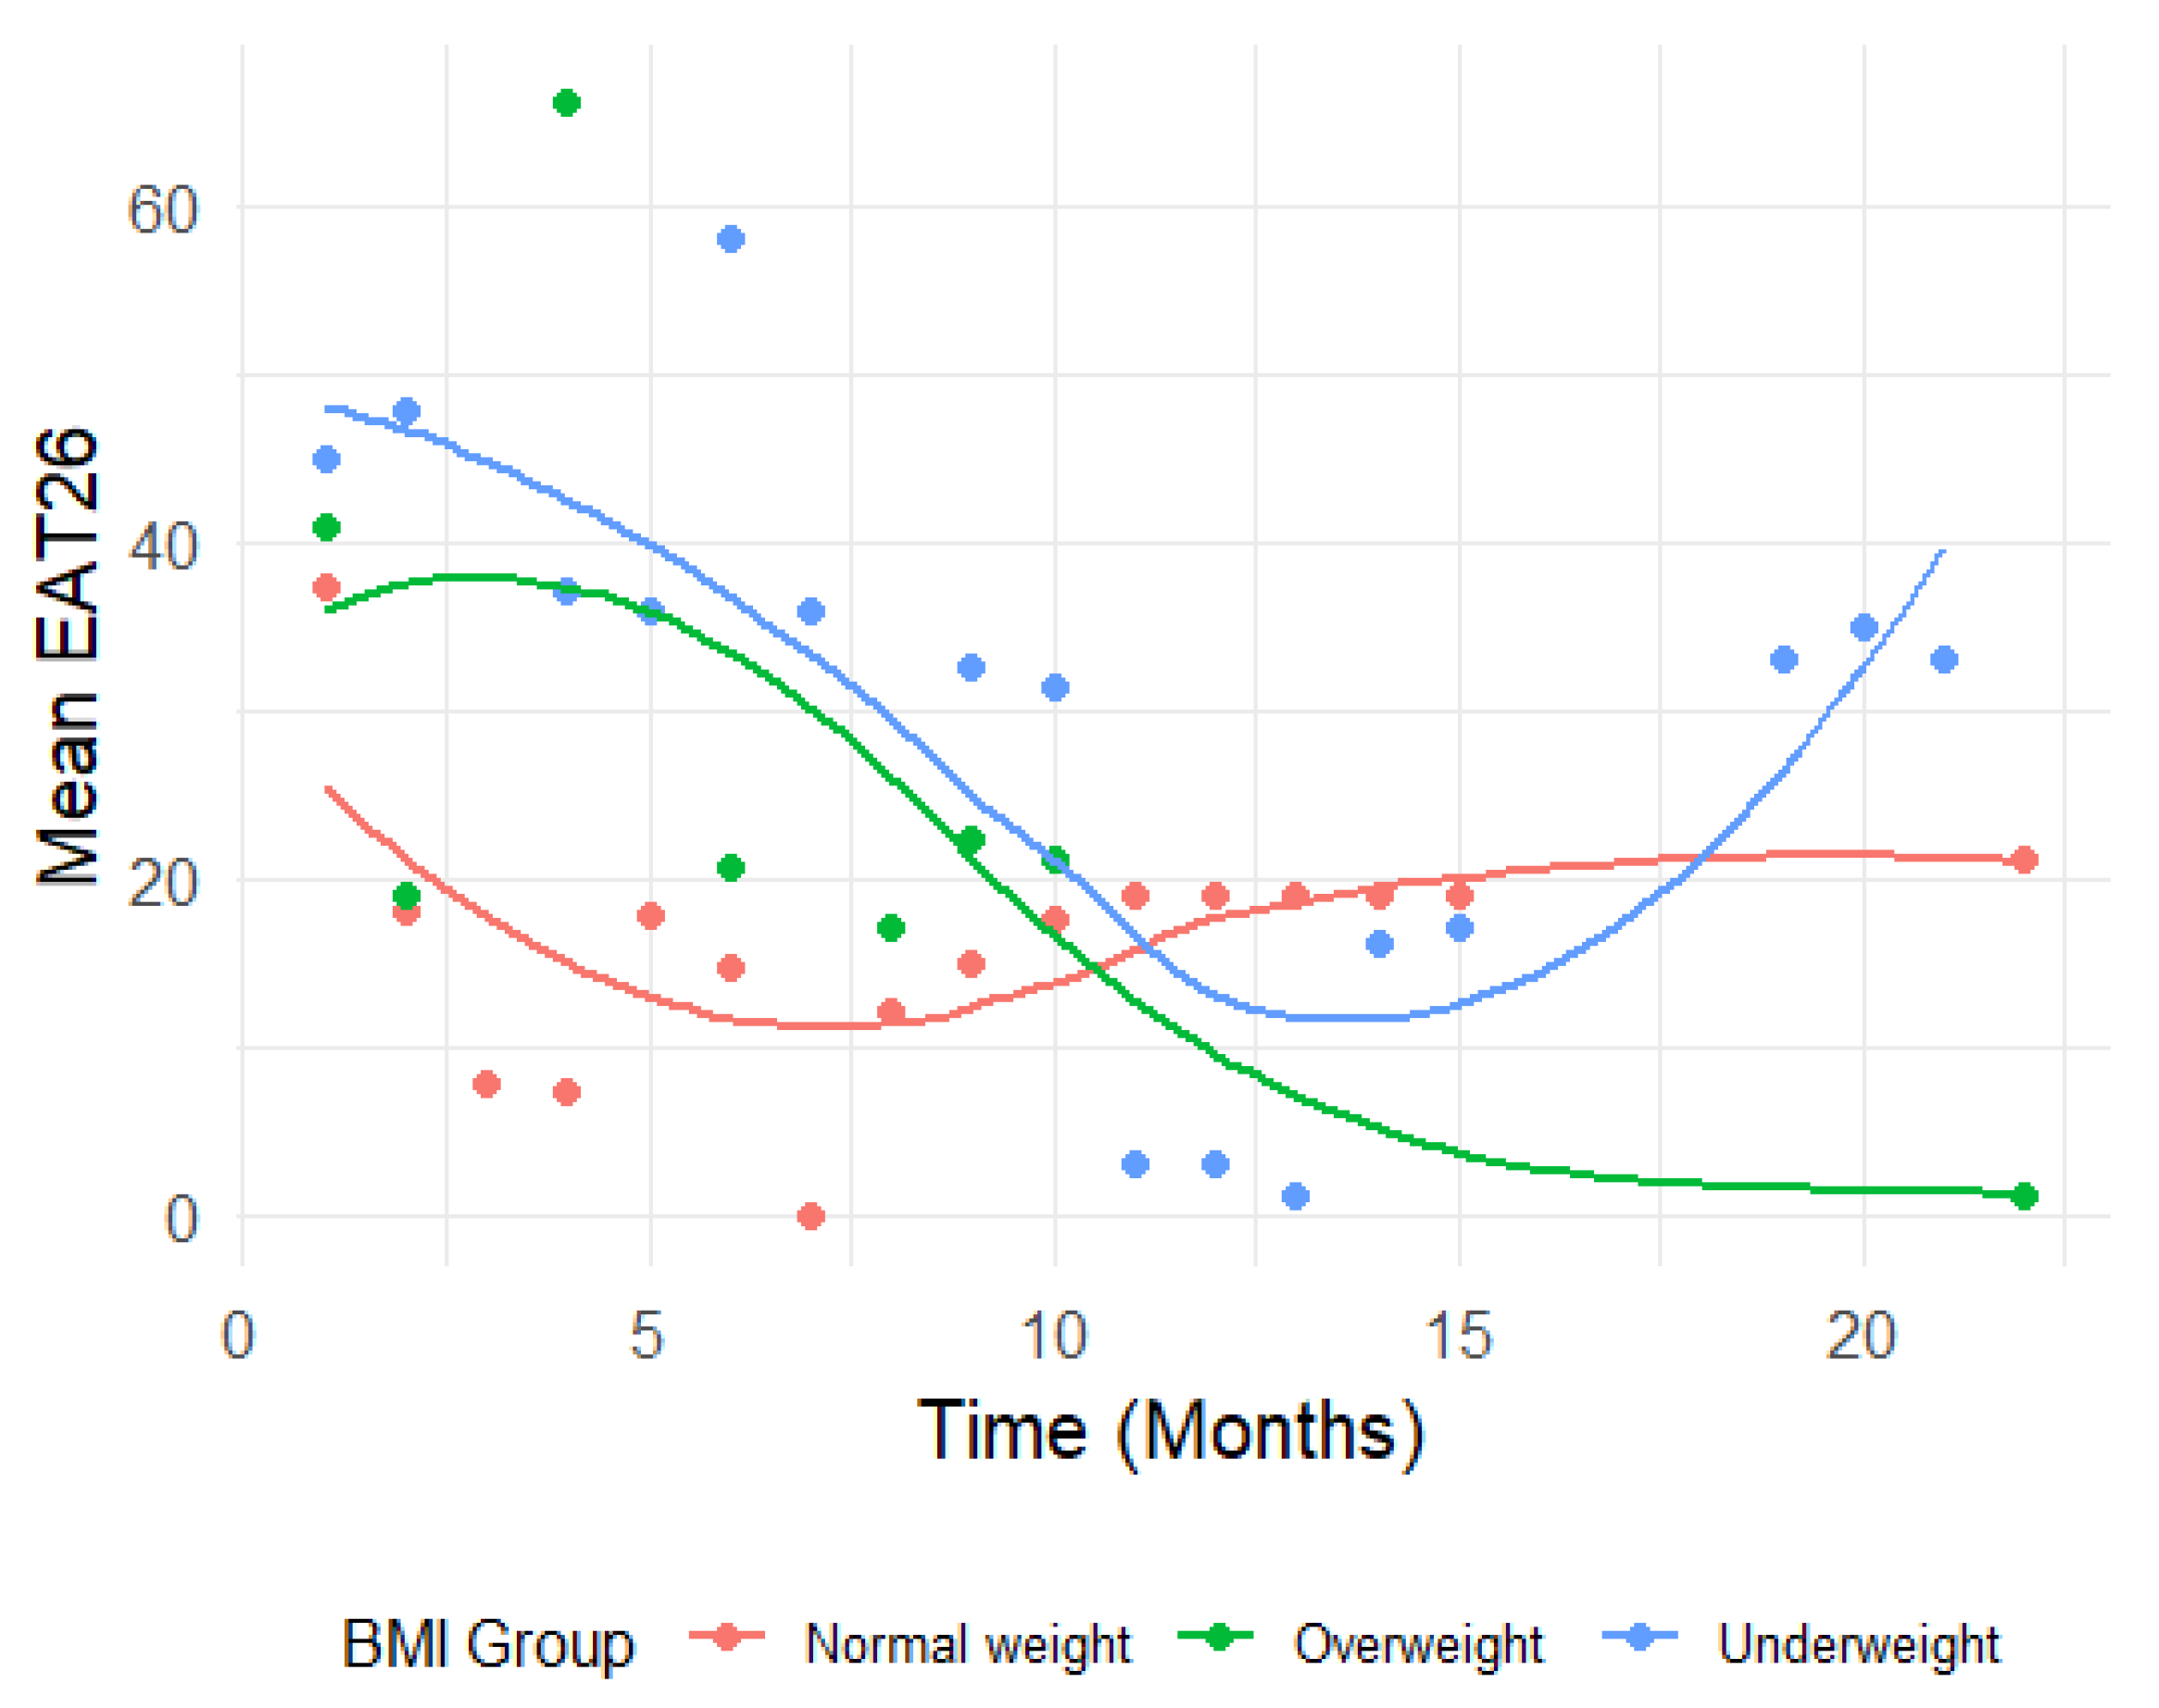

Table 1.
Structure and scoring of the final version of the assessment tool.
| Domain | Number of subcategories | Number of items | Max score | Weight Key indicators* | Example of factors included |
|---|---|---|---|---|---|
| Starting Point | 6 | 11 | 22 | 22% | Previous treatments; occupation status; trauma history; substance use |
| Anthropometrics and Menstrual Cycle | 4 | 4 | 16 | 16% | Weight trajectory; weight stability; menstrual status |
| Pathophysiology | 3 | 19 | 13 | 13% | Bradycardia; orthostatic; hypotension; gastrointestinal symptoms; blood test |
| Self-Care | 4 | 4 | 16 | 16% | Sleep hygiene; general self-care behaviors; physical activity patterns; medication adherence |
| Compulsiveness | 4 | 22 | 16 | 16% | eating restriction; over controlling; other compulsive behaviors; use of laxatives or vomiting |
| Obsessiveness | 7 | 20 | 18 | 18% | Intrusive thoughts; cognitive rigidity |
* WKI=Max category score/Max Points.
Table 2.
Comparison of CONTASI-ED and EAT-26 scores between diagnosed and healthy participants.
| Variable | Overall, N = 581 | Diagnosed, N = 171 | Healthy, N = 411 | p-value2 |
|---|---|---|---|---|
| STATT1 | 26.7 (14.9) | 7.6 (4.7) | 34.6 (9.4) | <0.001 |
| Eat26T1 | 35.8 (19.0) | 5.7 (3.4) | 40.2 (16.0) | <0.001 |
| Unknown | 11 | 11 | 0 | |
| 1 Mean (SD) | ||||
| 2 Welch Two Sample t-test. | ||||
Disclaimer/Publisher’s Note: The statements, opinions and data contained in all publications are solely those of the individual author(s) and contributor(s) and not of MDPI and/or the editor(s). MDPI and/or the editor(s) disclaim responsibility for any injury to people or property resulting from any ideas, methods, instructions or products referred to in the content. |
© 2025 by the authors. Licensee MDPI, Basel, Switzerland. This article is an open access article distributed under the terms and conditions of the Creative Commons Attribution (CC BY) license (http://creativecommons.org/licenses/by/4.0/).
Copyright: This open access article is published under a Creative Commons CC BY 4.0 license, which permit the free download, distribution, and reuse, provided that the author and preprint are cited in any reuse.


