

Submitted:
22 August 2023
Posted:
24 August 2023
You are already at the latest version
Abstract
Unfortunately in recent years, the global healthcare system has noted a notable increase in the prevalence of obesity and its associated health complications. What is more, one of the significant phenomena is the increasing demand for bariatric procedures among individuals of working age. This trend is pronounced in Poland., due to the increasing number of patients meeting the qualifying criteria for surgery among the group of professionally active and as well as unactive patients. The aim of the study is to characterize alarmingly increasing number of candidates for bariatric procedures among professionally active Poles, who underwent occupational medicine examinations in Poland in 2016-2022 and its strong relationship with cardiovascular co-morbidities (POL-O-CARIA 2022 study). In total, the results of 2,056,861 initial, control and periodic visits as part of the occupational medicine certificate were analyzed. Statistical calculations were performed with the use of IBM SPSS Statistics 25. It was noticed that, there was a consistent rise in the proportion of individuals classified as candidates for bariatric procedures ( increase of 0.3%) alongside a notable decrease in the percentage of individuals maintaining a healthy body weight Moreover, it is imperative to conduct yearly evaluations of the prevalence of obesity and its associated health conditions. This proactive approach is essential in order to adequately equip the healthcare system for addressing the increasing population of obese individuals who are actively engaged in their professions. By doing so, we can strategically implement the most efficient interventions to counteract this trend and ensure optimal health outcomes.
Keywords:
BMI index
; professionally active adult population
; cardiovascular diseases
; obesity
; bariatric procedures
1. Introduction
Unfortunately in recent years, the global healthcare system has noted a notable increase in the prevalence of obesity and its associated health complications[1,2]. What is more, one of the significant phenomena is the increasing demand for bariatric procedures among individuals of working age[3]. This trend is pronounced in Poland., due to the increasing number of patients meeting the qualifying criteria for surgery among the group of professionally active patients.. This study investigates the alarming rise in the number of professionally active Poles seeking bariatric interventions and investigates the significant correlation between this trend and the occurrence of cardiovascular co-morbidities.
It is worth noticing, that the growing prevalence of obesity has raised concerns not only for individual well-being but also for healthcare systems and economies worldwide[4]. Bariatric procedures have emerged as crucial interventions in addressing severe obesity and its related health risks, offering the potential for improved quality of life and long-term health outcomes[5,6,7]. However, the precise consequences of this increase in the context of individuals engaged in professional activities remain an area of limited exploration. POL-O-CARIA 2022 study aims to pay attention on the increasing tendency observed among profesionally active Polish individuals who opt for bariatric procedures.. By examining the main factor driving this trend and the cardiovascular co-morbidities commonly associated with it, the study aims to contribute valuable insights to both medical practitioners and policymakers. Understanding the very complicated relationship between the rising demand for bariatric interventions and cardiovascular health can inform targeted interventions, public health campaigns, and policy measures to mitigate the long-term health impact and economic burden of obesity-related illnesses[8].
Through a comprehensive analysis of data and trends, the POL-O-CARIA 2022 study seeks to provide a comprehensive understanding of the complex interplay between bariatric procedures, cardiovascular co-morbidities, and the professional lives of individuals in Poland. This research has the potential to drive informed decision-making in healthcare, facilitating proactive strategies that address the multifaceted challenges posed by the increasing prevalence of obesity and its associated health consequences among the working-age population.
1.1. Obesity and Comorbidities
Beyond its evident impact on physical appearance, obesity is closely associated with a spectrum of accompanying health conditions that significantly compromise individual well-being. Numerous research studies documented in existing literature underscore the strong link connecting excess weight and obesity to the onset of a diverse range of medical conditions[9].A comprehensive meta-analysis conducted in 2015 yielded illuminating insights, revealing that even a moderate 5 kg increase in weight substantially increases the risk of certain cancers. Specifically, the analysis indicated an 11% elevated risk of post-menopausal breast cancer, a 39% escalated risk of endometrial cancer, a 13% increased risk of ovarian cancer, and a 9% augmented risk of colon cancer in men[10]. Further explorations through cohort investigations, undertaken as part of the Me-Can 2.0 program across several European nations such as Austria, Norway, and Sweden, corroborated these findings. These investigations illuminated that individuals classified as overweight up until the age of 40 exhibit a significant rise in the probability of developing various malignancies. Notably, these encompassed increased risks for endometrial cancer, renal-cell cancer and colon cancer in men[11]. Beyond its immediate impacts, obesity assumes the status of a chronic metabolic disorder that influence profoundly on the prevalence of cardiovascular diseases. This complex association is underscored by such alterations as decreased cardiac output, increased left ventricular mass, and augmented wall thickness. Scientific research leaves little room for doubt regarding the complex connections between obesity and conditions such as hypertension, coronary artery disease, atrial fibrillation, obstructive sleep apnea and diabetes[2,9,12]. The body of evidence not only underscores the complexities of obesity's impacts on health but also emphasizes the urgency of comprehensive approaches to address its wide-ranging consequences.
1.2. Who is Eligible for Bariatric Surgery?
First of all, individuals who have not achieved weight loss through diet, physical activity and pharmacotherapy with a body mass index (BMI) of 40 or more, indicating severe obesity. Moreover, those with a BMI ranging from 35 to 39.9 (considered obese), along with a significant weight-related medical issue like type 2 diabetes, hypertension, or severe sleep apnea.
1.4. Obesity and Professional Activity
The impact of work on overweight and obesity is acknowledged. Employers take steps to encourage healthy eating habits and boost physical activity among their staff. Providing complimentary fruits and vegetables at workplaces is becoming more common. Factors within the work environment that can contribute to overweight and obesity encompass sedentary job roles, stress, and sleep issues. Engaging in office work and sedentary tasks escalates the susceptibility to obesity among employees. A study by Shields and Tremblay in 2008 affirmed a positive correlation between obesity and prolonged sitting during leisure time, such as when using a computer[13]. Conversely, there are various studies that refute the link between sedentary work or leisure pursuits and the prevalence of overweight and obesity. Stress encountered in the workplace is also a significant factor associated with overweight and obesity
1.5. Aim of the Study
The aim of the study is to characterize alarmingly increasing number of candidates for bariatric procedures among professionally active Poles, who underwent occupational medicine examinations in Poland in 2016-2022 and its strong relationship with cardiovascular co-morbidities(POL-O-CARIA 2022 study). Because the study aimed to explore rather than confirm specific research hypotheses, the article did not propose any research hypotheses. Instead, it formulated research inquiries that delineated the primary focus of the investigations: examining how the severity of obesity evolves over time and its interactions with other medical conditions.
2. Materials and Methods
The article analyzes the results of the POLOCARIA 2016-2022 study, concerning adults who are professionally active and visited in the years 01.2016-09.2022 as part of occupational medicine. The data for analyzes was provided by the LUX MED Group. In total, the results of 2,056,861 initial, control and periodic visits as part of the occupational medicine certificate were analyzed. During the study, sex, age, province of residence, information on the period of the issued medical certificate and data contained in the medical history (subjective assessment of health, smoking) were controlled. Over the course of many years, there has been a consistent increase in the proportion of individuals who are overweight or obese. Consequently, it holds great significance to continually assess the occurrence of obesity within distinct social segments. Investigating the population of professionally active Poles holds significance for various reasons. It aids in tracking health status and predicting the emergence of particular lifestyle-related illnesses within a particular community. The presence of specific conditions (like obesity, high blood pressure, diabetes, obstructive sleep apnea, nonalcoholic steatohepatitis) leads to reduced medical clearances for employment purposes.
2.1. Statistical Analysis
Statistical calculations were performed with the use of IBM SPSS Statistics 25. Percentage and number of occurrences were used to analyze qualitative data, while the following were used to characterize qualitative data: mean (M), standard deviation (SD), median, skewness, kurtosis, and the minimum and maximum values. Significant statistical results were considered to be those where the probability of making a type I error was lower than 5% (p <0.05). The following were used for statistical calculations: chi-square analysis in cross tables (Bonferroni correction was used to test column proportions) and one-way analysis of variance (Scheffe's post hoc test was used for mean comparisons). The charts were made in the R program.
3. Results
3.1. Information on BMI
It was noticed that over successive years of observation, there was a consistent rise in the proportion of individuals classified as overweight or obese (regardless of the level of severity), alongside a notable decrease in the percentage of individuals maintaining a healthy body weight. Detailed results are presented in Table 1.
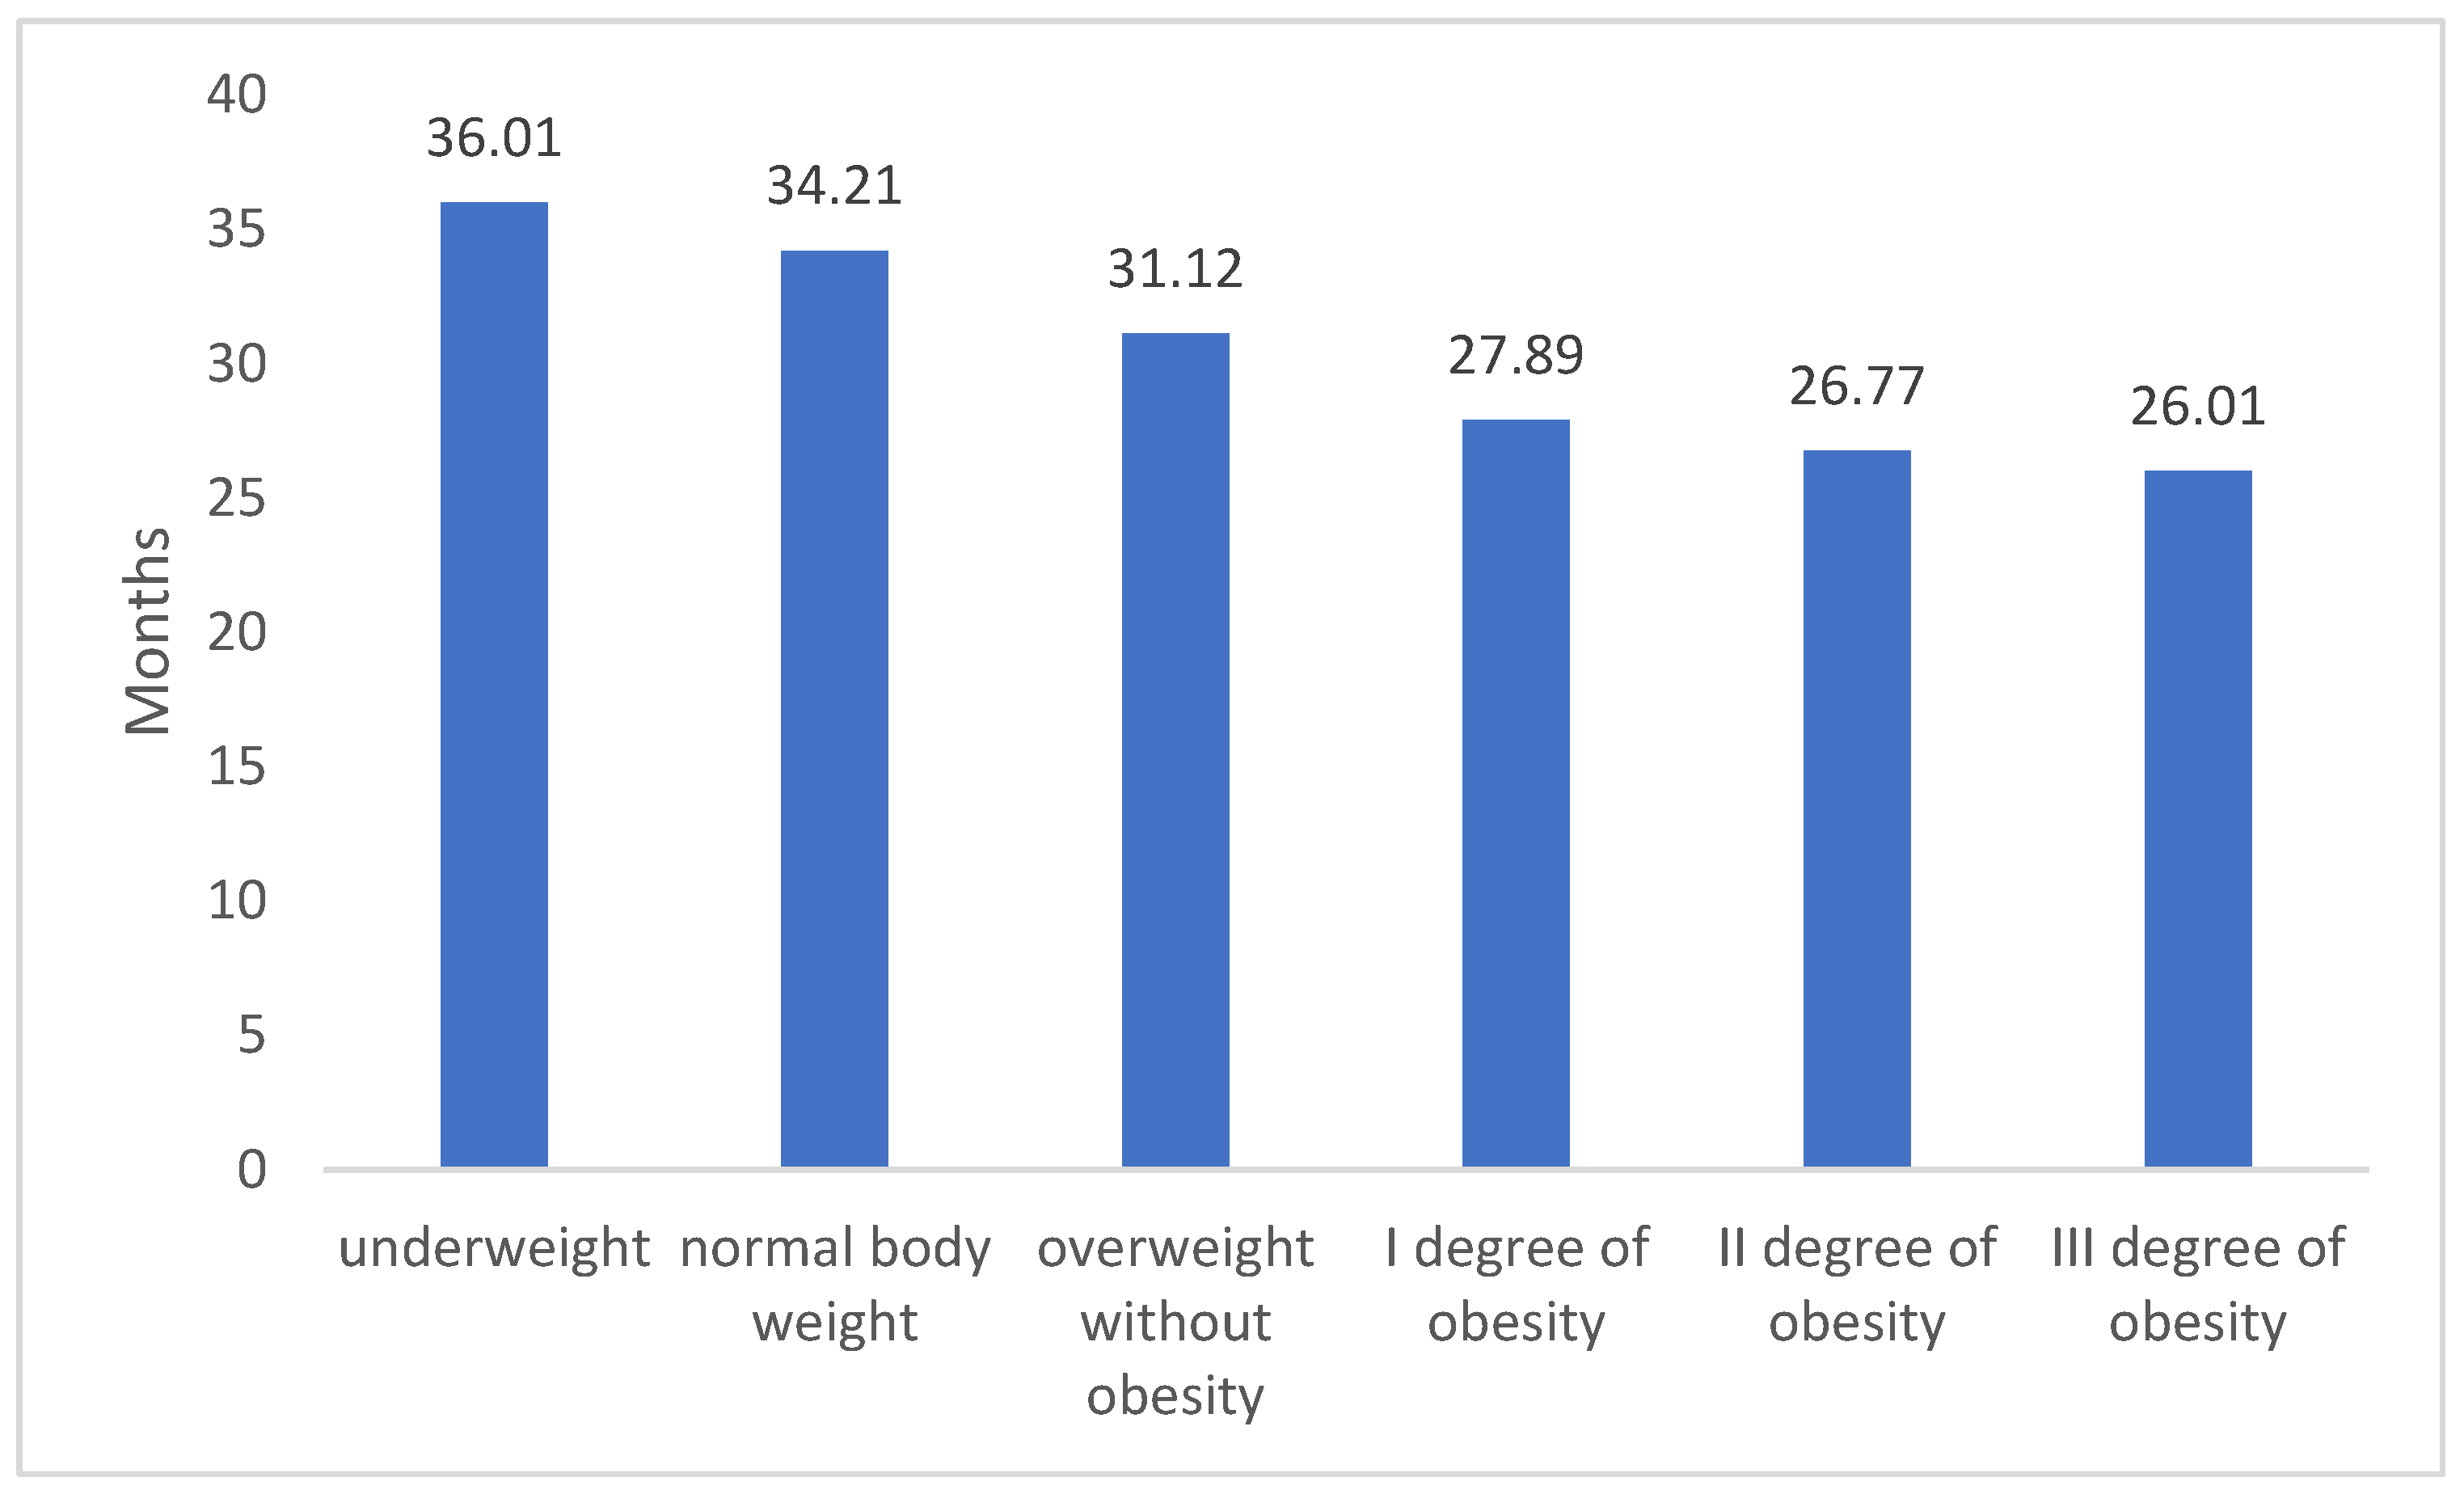
In relation to Body Mass Index (BMI), it was discovered that individuals with a normal body weight, who were actively engaged in their professions, obtained the lengthiest medical certificates. These certificates lasted for approximately 34 months. For those categorized as overweight or dealing with obesity, a clear correlation emerged between the severity of obesity and the duration of medical certification (refer to Table 2). Based on medical decisions, individuals with overweight conditions were granted work-related medical certificates, averaging around 31 months. The capacity to remain occupationally active notably declined as the obesity level escalated: 1st degree obesity led to an average certificate duration of about 28 months, 2nd degree obesity was associated with roughly 27 months, and 3rd degree obesity resulted in nearly 26 months of certification. – we presented details in Table 2.
3.2. Patient Characteristics Depending on the BMI Level
Chi-square analysis showed that for both women and men similar trends were observed regarding the dynamics of occurrence of individual BMI categories. In both groups, a noteworthy decline was identified on an annual basis among individuals with a normal body weight. Additionally, the inclination towards an increase in individuals categorized with 1st and 3rd degree obesity was more pronounced among men. Here we observe a concerning rise in potential candidates for bariatric surgery (see Table 3).
Significant differences, regardless of the year of measurement, were observed using a one-way analysis of variance for the age and time for which the measurement was issued (in both cases, the significance of differences between the groups was p <0.001). The exact results are discussed below.
In the case of Patients' age, post-hoc analysis with Scheffe's correction showed that only between people with II and III degree of obesity there were no differences for the average age; in other cases, the significance of differences between individual groups was p <0.001. The highest average age was observed for people with obesity, while the lowest - for people with underweight or normal weight (see Figure 1).
Patients with normal body weight most often occurred in the group under 35 years of age, while the percentage of people with obesity (especially 1st degree) increased significantly in each age category (see Table 4).
Table 5 presents the same data by changing the percentage to the BMI category. The obtained results showed that together with the higher BMI level the percentage of people under 35 years of age decreased in each group. In the case of people aged 35-69, it was obtained that they were more often classified into the group with obesity or overweight compared to groups with normal body weight.

Table 5.
Relationship between BMI and age of patients - data percentage to the BMI category.
| underweight | normal body weight | overweight without obesity | I degree of obesity | II degree of obesity | III degree of obesity | Total | |
| <18 | 0,10% | 0,20% | 0,10% | 0,10% | 0,00% | 0,00% | 0,00% |
| 18-35 | 83,70% | 63,80% | 44,30% | 33,20% | 31,60% | 33,80% | 54,20% |
| 35-54 | 14,10% | 29,50% | 42,10% | 49,00% | 51,20% | 51,60% | 38,60% |
| 55-69 | 2,10% | 6,40% | 13,40% | 17,50% | 17,10% | 14,50% | 7,10% |
| >69 | 0,00% | 0,10% | 0,10% | 0,20% | 0,10% | 0,10% | 0,10% |
| Total | 100,00% | 100,00% | 100,00% | 100,00% | 100,00% | 100,00% | 100,00% |
When analyzing the time periods for issuing a medical certificate, significant differences between the groups were also observed. A linear trend was obtained showing that, along with the BMI level, the average number of months of the issued decision decreased. In addition, post-hoc analysis with Scheffe correction showed that significant differences were observed between all BMI categories. Detailed results are presented below.
Figure 2.
Average number of months for the issued medical certificate depending on the BMI category (in the figure, all groups are statistically significantly different at least at the p<0.05 level; due to the number of groups compared, results for differences are not shown in Fig.).
Figure 2.
Average number of months for the issued medical certificate depending on the BMI category (in the figure, all groups are statistically significantly different at least at the p<0.05 level; due to the number of groups compared, results for differences are not shown in Fig.).
Patients with normal weight or underweight were less likely to smoke than overweight or obese (groups are statistically significantly different at least at the p<0.05 level). This relationship was observed regardless of the year of measurement (see Figure 3).
The relationship between BMI categories and subjective health assessment was also examined. It was found that people who subjectively assessed their own health as good, less often than people who assessed their health as very good, were classified into the group of people with normal body weight. Inverse relationship was obtained for overweight and obese people. Detailed results are presented below.
Table 5.
Relationship between BMI and subjective assessment of health - data percentage for health assessment.
Table 5.
Relationship between BMI and subjective assessment of health - data percentage for health assessment.
| Subjective health assessment | Total | ||
| good | very good | ||
| underweight | 3,10% | 3,20% | 3,10% |
| normal body weight | 48,10% | 58,30% | 52,30% |
| overweight without obesity | 32,10% | 31,50% | 31,90% |
| I degree of obesity | 14,10% | 5,60% | 10,30% |
| II degree of obesity | 2,10% | 1,10% | 1,90% |
| III degree of obesity | 0,50% | 0,30% | 0,50% |
| Total | 100,00% | 100,00% | 100,00% |
Table 6. shows the relationship between selected diseases and BMI categories. A significant relationship between variables was obtained (p <0.001). The most pronounced differences were observed for hypertension (with the BMI level the percentage of people with this disease increased) and for lipid disorders and type 2 diabetes.
Table 6.
Relationship between BMI and the incidence of selected diseases - percentage data for the BMI category.
Table 6.
Relationship between BMI and the incidence of selected diseases - percentage data for the BMI category.
| underweight | normal body weight | overweight without obesity | I degree of obesity | II degree of obesity | III degree of obesity | Total | |
| Hypertension | 29,8% | 38,9% | 45,7% | 50,6% | 52,5% | 56,1% | 45,3% |
| Type 2 diabetes | 8,7% | 6,1% | 7,1% | 10,1% | 16,1% | 17,1% | 8,2% |
| Lipid disorders | 58,7% | 52,1% | 43,1% | 35,5% | 28,1% | 24,1% | 43,5% |
| Coronary disease | 2,8% | 2,9% | 4,1% | 3,8% | 3,3% | 2,7% | 3,0% |
| Total | 100,0% | 100,0% | 100,0% | 100,0% | 100,0% | 100,0% | 100,0% |
3.3. BMI and Observed Comorbidities
A significant relationship was also observed between BMI categories and the occurrence of comorbidities (chi2 (70) = 16138; p < 0.001). Detailed results showed that in the group of patients diagnosed with hypertension or lipid disorders, significant differences were observed between all groups - it turned out that as the BMI level increased, the percentage of occurrence of a given disease increases. A comparison of all comorbidities depending on BMI level is shown in the table below.
Table 7.
Relationship between BMI and comorbidities - data percentage to BMI.
| underweight | normal body weight | overweight without obesity | I degree of obesity | II degree of obesity | III degree of obesity | Total | |
| Hypertension | 26,4% | 31,2% | 34,5% | 39,4% | 42,2% | 46,5% | 35,1% |
| Type 2 diabetes | 6,8% | 3,0% | 2,6% | 3,4% | 4,7% | 6,2% | 3,6% |
| Lipid disorders | 58,4% | 48,1% | 32,7% | 18,9% | 12,3% | 8,4% | 33,1% |
| Coronary disease | 2,1% | 0,8% | 1,2% | 1,2% | 0,8% | 0,3% | 1,0% |
| Hypertension+type 2 diabetes | 0,8% | 0,7% | 2,6% | 4,4% | 8,1% | 10,3% | 2,7% |
| Hypertension + Lipid disorders | 4,3% | 12,4% | 18,4% | 22,3% | 18,9% | 15,9% | 17,6% |
| Hypertension + Coronary disease | 0,2% | 0,8% | 0,5% | 1,5% | 1,1% | 0,9% | 0,4% |
| Type 2 diabetes + Lipid disorders | 0,3% | 0,4% | 1,3% | 0,9% | 1,4% | 1,2% | 0,8% |
| Type 2 diabetes + Coronary disease | 0,1% | 0,0% | 0,2% | 0,1% | 0,4% | 0,1% | 0,1% |
| Lipid disorders + Coronary disease | 0,2% | 0,8% | 0,6% | 0,4% | 0,4% | 0,1% | 0,5% |
| Hypertension + type 2 diabetes + Lipid disorders | 0,1% | 1,2% | 2,9% | 4,2% | 7,6% | 7,6% | 2,6% |
| Hypertension + type 2 diabetes + Coronary disease | 0,1% | 0,1% | 0,1% | 0,1% | 0,2% | 0,2% | 0,1% |
| Hypertension + Lipid disorders + Coronary disease | 0,1% | 0,4% | 1,6% | 1,9% | 0,7% | 1,1% | 1,6% |
| Type 2 diabetes + Lipid disorders + Coronary disease | 0,1% | 0,0% | 0,1% | 0,1% | 0,1% | 0,2% | 0,1% |
| All | 0,1% | 0,7% | 1,2% | 1,1% | 1,2% | 0,7% | |
| Total | 100,0% | 100,0% | 100,0% | 100,0% | 100,0% | 100,2% | 100,0% |
The cross-tabulation chi-square analysis performed confirmed that there was an association between age and comorbidities (chi2(56)=27809.28; p <0.001). In the case of hypertension, it was obtained that the prevalence of hypertension was more common in those aged 18-54 compared to other age groups. In addition, the prevalence of lipid disorders was significantly different in each of the age groups - a trend was observed showing that the diagnosis of this disease decreased with age. A detailed comparison of the age groups for the other diseases is shown below.
Table 8.
Relationship between age and comorbidities - data percentage to age1.
| age | Total | |||||
| <18 | 18-35 | 35-54 | 55-69 | >69 | ||
| Hypertension | 50.0% | 37,50% | 34,60% | 32,10% | 30,50% | 34,60% |
| Type 2 diabetes | 50.0% | 6,80% | 3,30% | 2,50% | 2,10% | 3,40% |
| Lipid disorders | 44,70% | 35,10% | 18,10% | 7,50% | 33,20% | |
| Coronary disease | 0,40% | 0,70% | 2,40% | 1,70% | 0,80% | |
| Hypertension+type 2 diabetes | 0,80% | 2,20% | 4,40% | 6,80% | 2,40% | |
| Hypertension + Lipid disorders | 8,50% | 18,50% | 21,70% | 19,40% | 17,60% | |
| Hypertension + Coronary disease | 0,20% | 0,30% | 2,40% | 4,10% | 0,70% | |
| Type 2 diabetes + Lipid disorders | 0,50% | 0,80% | 1,30% | 1,20% | 1,20% | |
| Type 2 diabetes + Coronary disease | 0,00% | 0,10% | 0,30% | 0,70% | 0,10% | |
| Lipid disorders + Coronary disease | 0,20% | 0,40% | 1,40% | 1,40% | 0,70% | |
| Hypertension + type 2 diabetes + Lipid disorders | 0,30% | 2,40% | 6,30% | 7,50% | 3,10% | |
| Hypertension + type 2 diabetes + Coronary disease | 0,00% | 0,20% | 0,50% | 2,10% | 0,10% | |
| Hypertension + Lipid disorders + Coronary disease | 0,10% | 1,20% | 4,60% | 9,50% | 1,50% | |
| Type 2 diabetes + Lipid disorders + Coronary disease | 0,00% | 0,00% | 0,10% | 0,60% | 0,10% | |
| All | 0,00% | 0,20% | 1,90% | 4,90% | 0,50% | |
| Total | 100,0% | 100,0% | 100,0% | 100,0% | 100,0% | 100,0% |
4. Discussion
In this research study, we utilized data obtained from a substantial cohort of 1,450,455 distinct adult patients. Employing a comprehensive analytical approach, we derived estimations regarding the trends in Body Mass Index (BMI). While previous analyses have explored the prevalence of obesity in Poland in preceding years, none have focused on the present time frame nor have they encompassed such an extensive patient pool[14].
A distinctive aspect of our analysis lies in its incorporation of correlations between BMI and critical factors, including the average duration of medical certificates issued and the concurrent presence of severe illnesses, primarily associated with the cardiovascular system. Notably concerning is the revelation that as BMI escalates, individuals' capacity to remain productive within the workforce diminishes. Importantly, our study does not encompass individuals who, due to obesity and its related comorbidities, are unable to engage in work altogether.
It is paramount to emphasize that within this vast patient cohort, we have established the coexistence of ailments that profoundly compromise patients' overall quality of life[7]. The extent of such comorbidities distinctly corresponds to the degree of obesity. Our data unequivocally demonstrated that approximately one third of active female professionals and nearly two thirds of their male counterparts fall within the overweight or obese categories. This finding is deeply disconcerting.
Furthermore, our study illuminates an alarming temporal trend that indicates a surge in this phenomenon over time. This development raises apprehensions regarding both access to medical services and the economic burden on the healthcare system. The data underscore the non-uniform distribution of this issue across various regions of the country. Supplementary materials provide unique insights, delineating how obesity diversifies based on geographic regions.
Whereas grade II and grade III obesity were once exceptional occurrences, our findings intimate that they may soon dominate the spectrum of BMI categories within patient populations. Given the existing limitations in physicians' capacity to effectively manage obese patients, the persistent progression of this trend is poised to become a formidable challenge for the entirety of the healthcare sector.
5. Conclusions
Moreover, it is imperative to conduct yearly evaluations of the prevalence of obesity and its associated health conditions. This proactive approach is essential in order to adequately equip the healthcare system for addressing the increasing population of obese individuals who are actively engaged in their professions. By doing so, we can strategically implement the most efficient interventions to counteract this trend and ensure optimal health outcomes..
Conflicts of Interest
There is No conflict of interest ( all Cases ) . Anna Rulkiewicz, Iwona Pilchowska, Simona Wójcik and Justyna Domienik-Karłowicz are Lux med employees
Appendix A. Additional analyzes
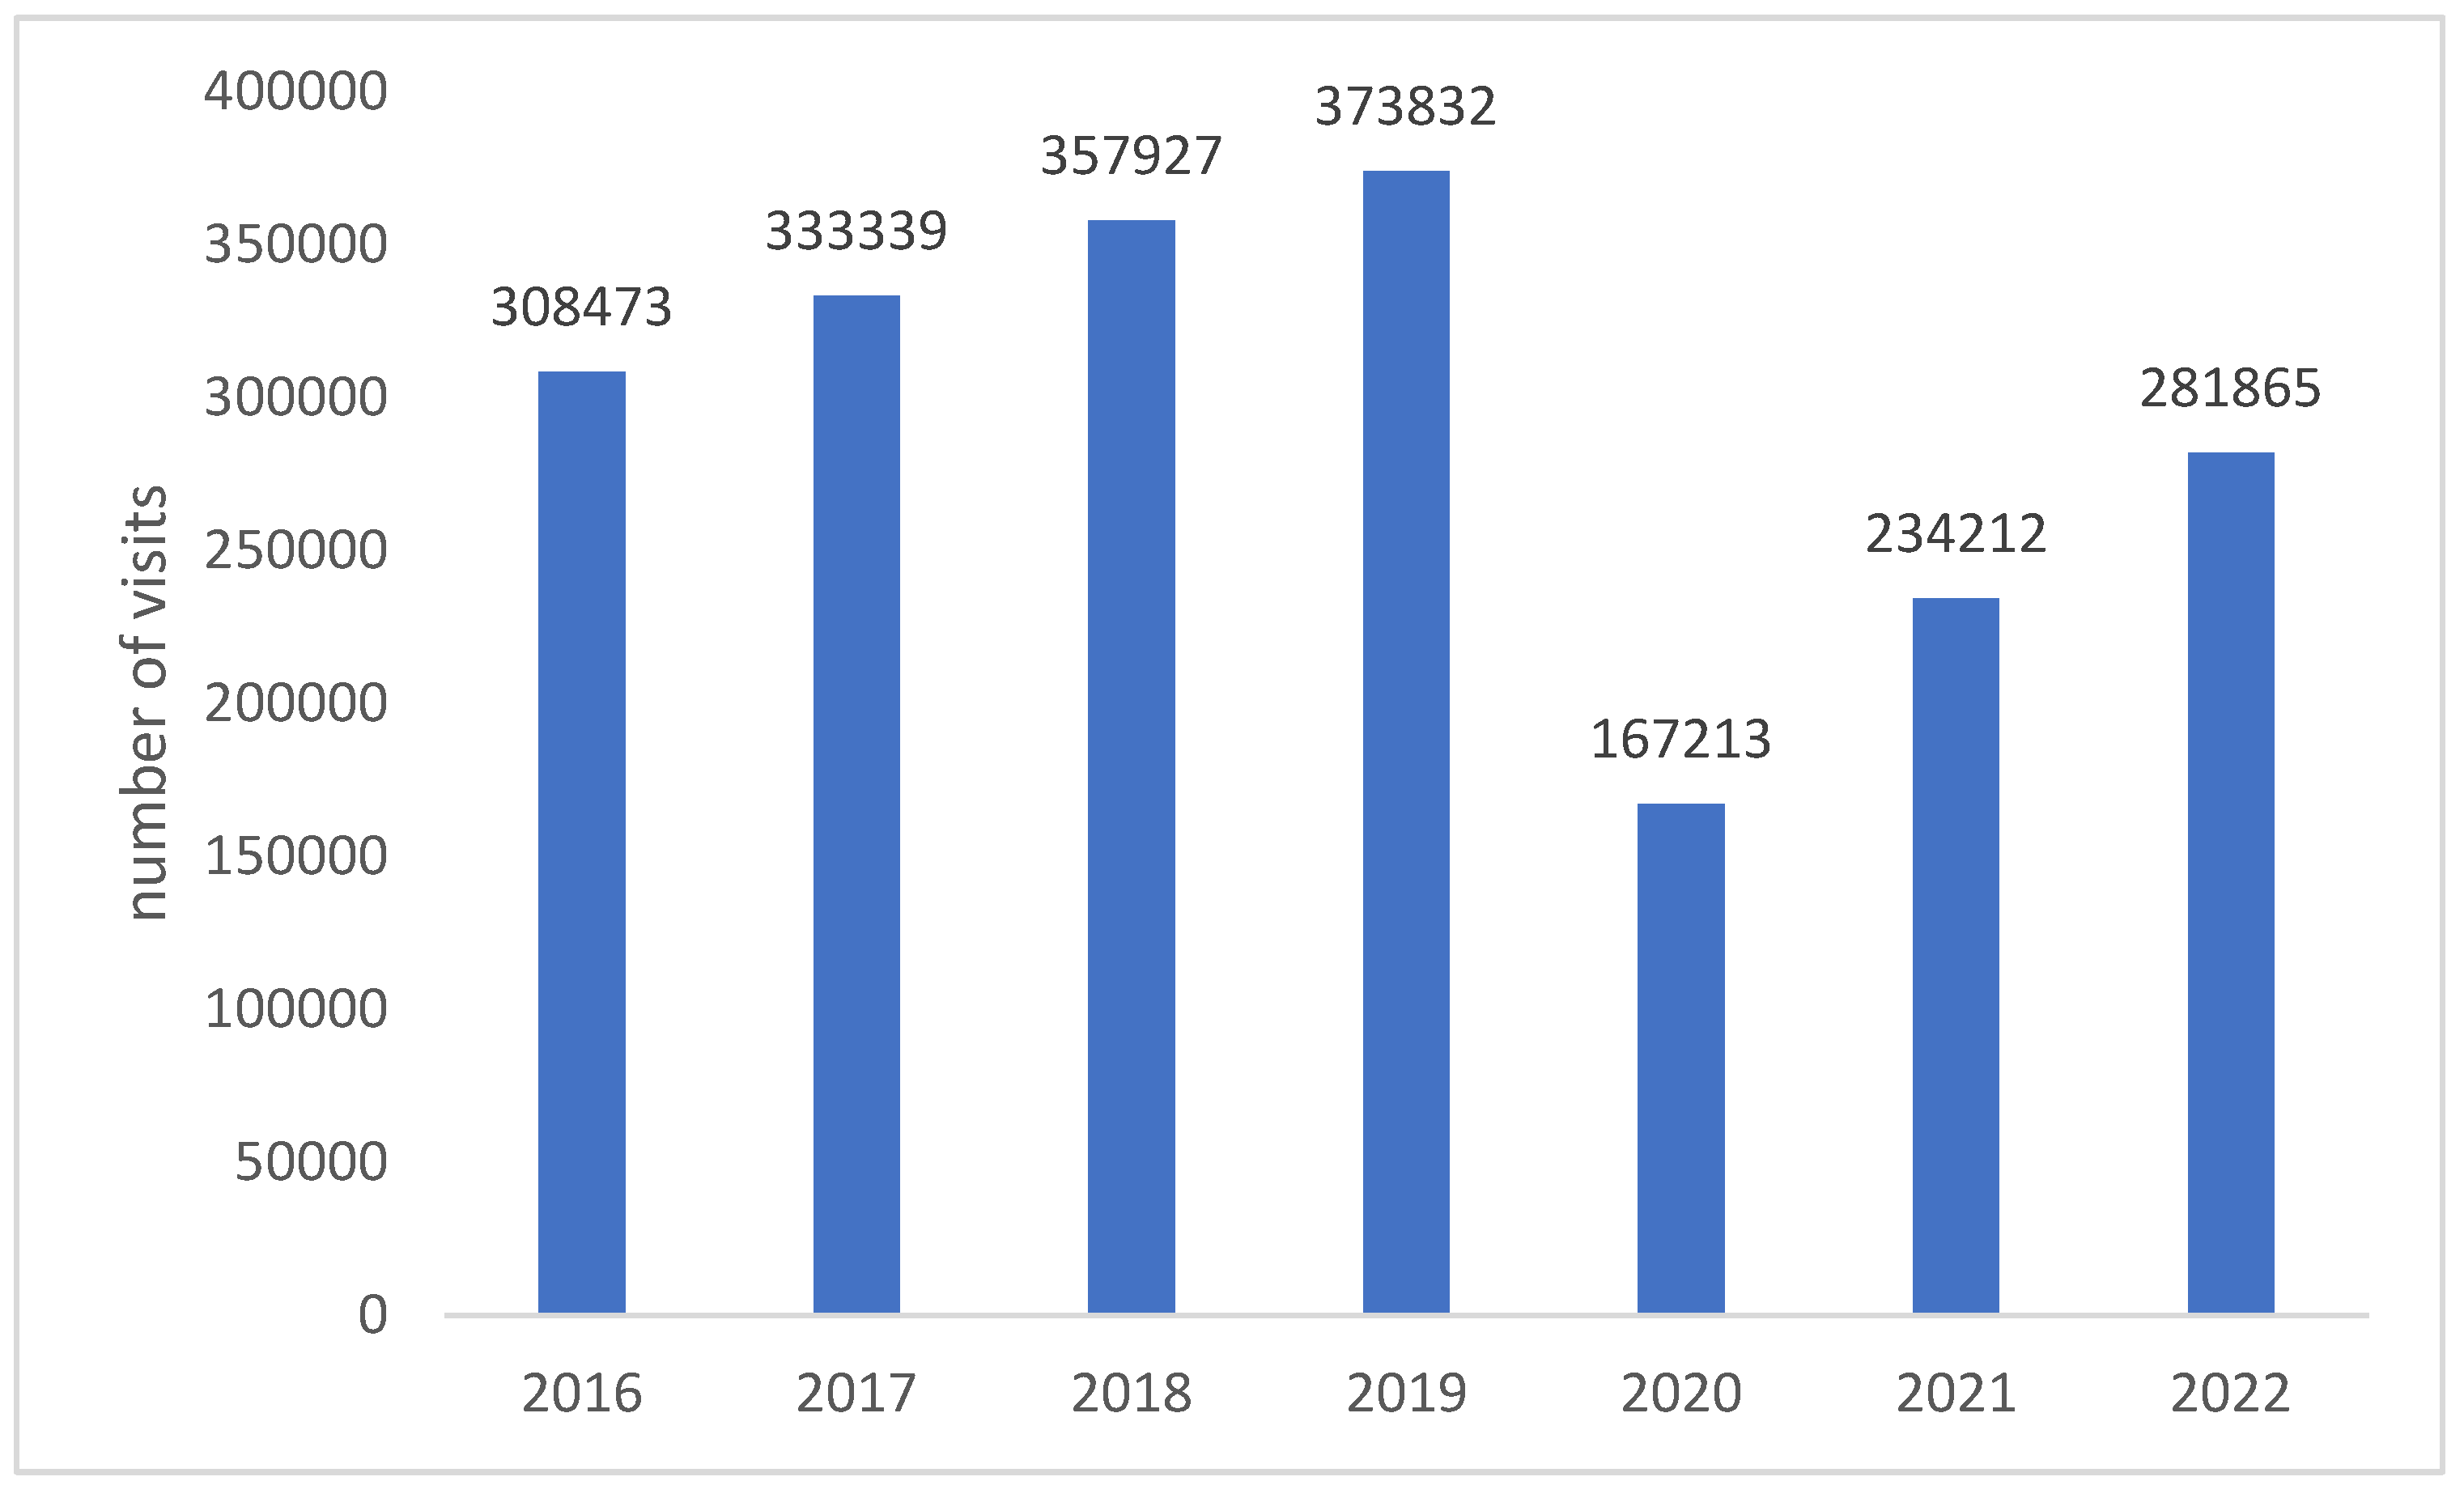
The study included 2,056,861 visits to occupational medicine (collected from 1,342,749 unique Patients) from 2016-2022. The exact number of collected results depending on the year of measurement is presented below.
Figure A1.
The number of visits analyzed versus the year of measurement.
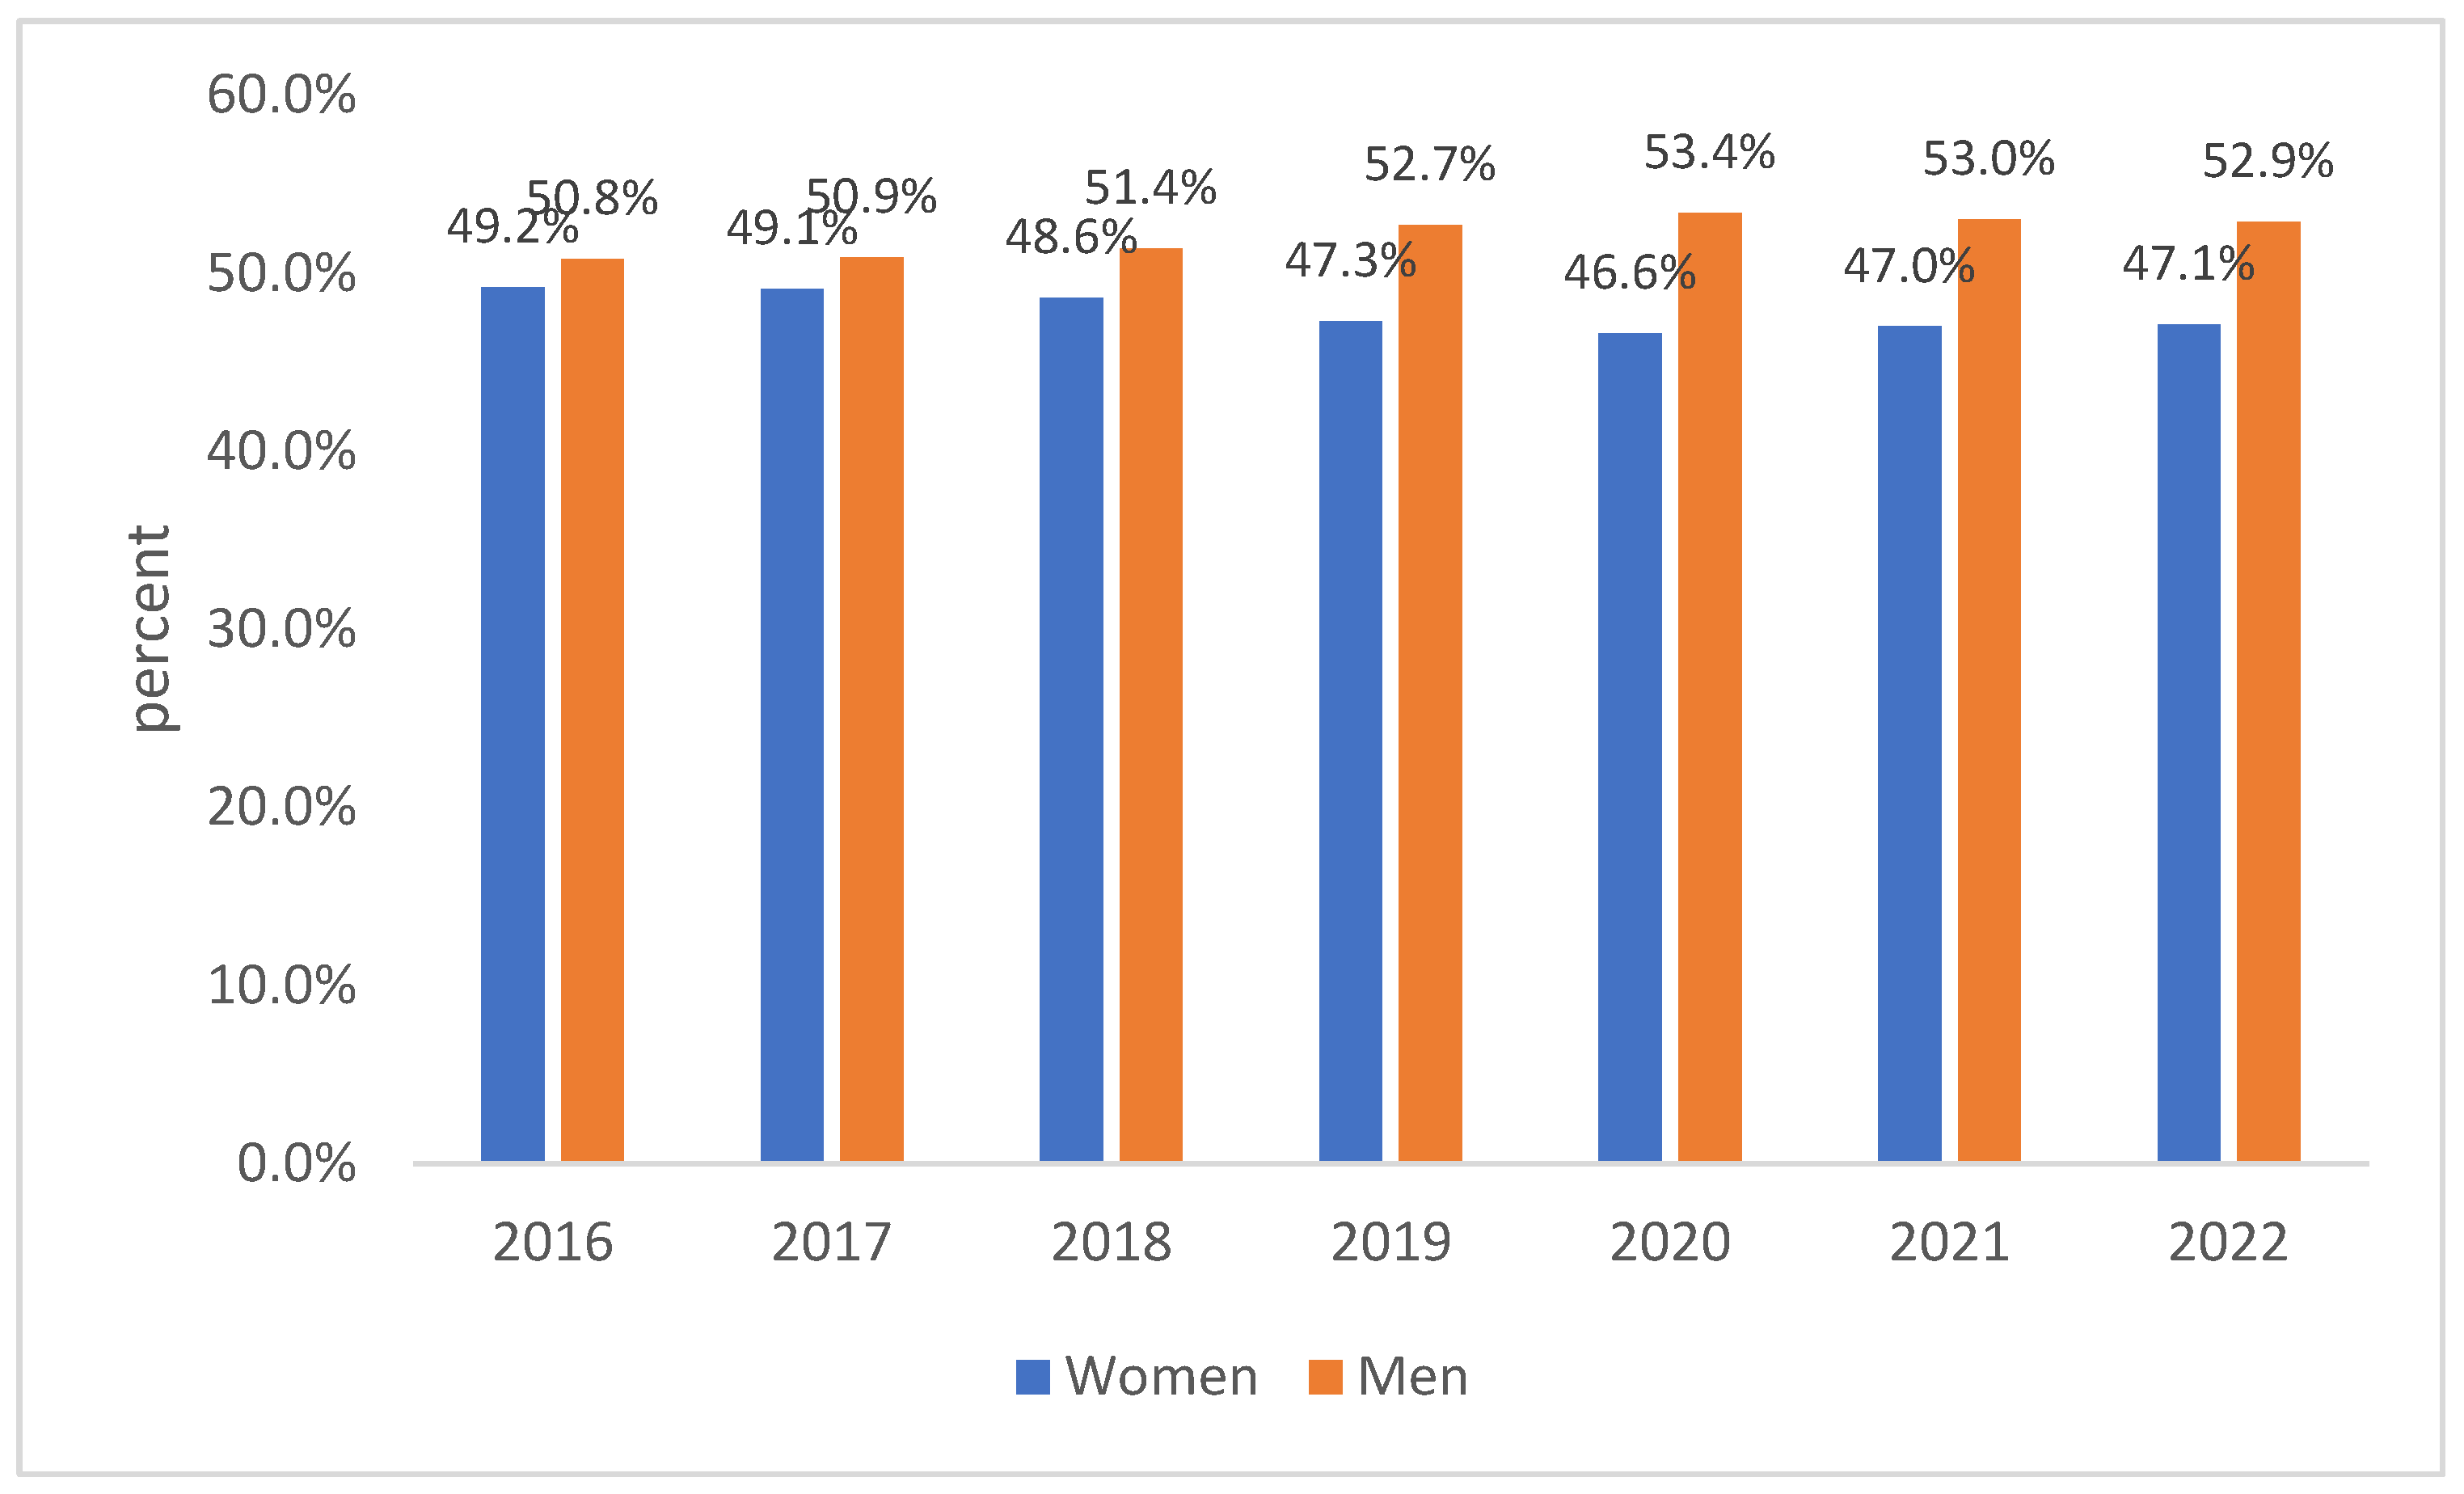
In terms of sex, the results of men accounted for a slightly higher percentage (51.7%). Along with the successive stages of the study, the percentage of surveyed men slightly increased (see Figure A2).
Figure A2.
Sex distribution depending on the year of measurement (95% CI: ±0.2%).
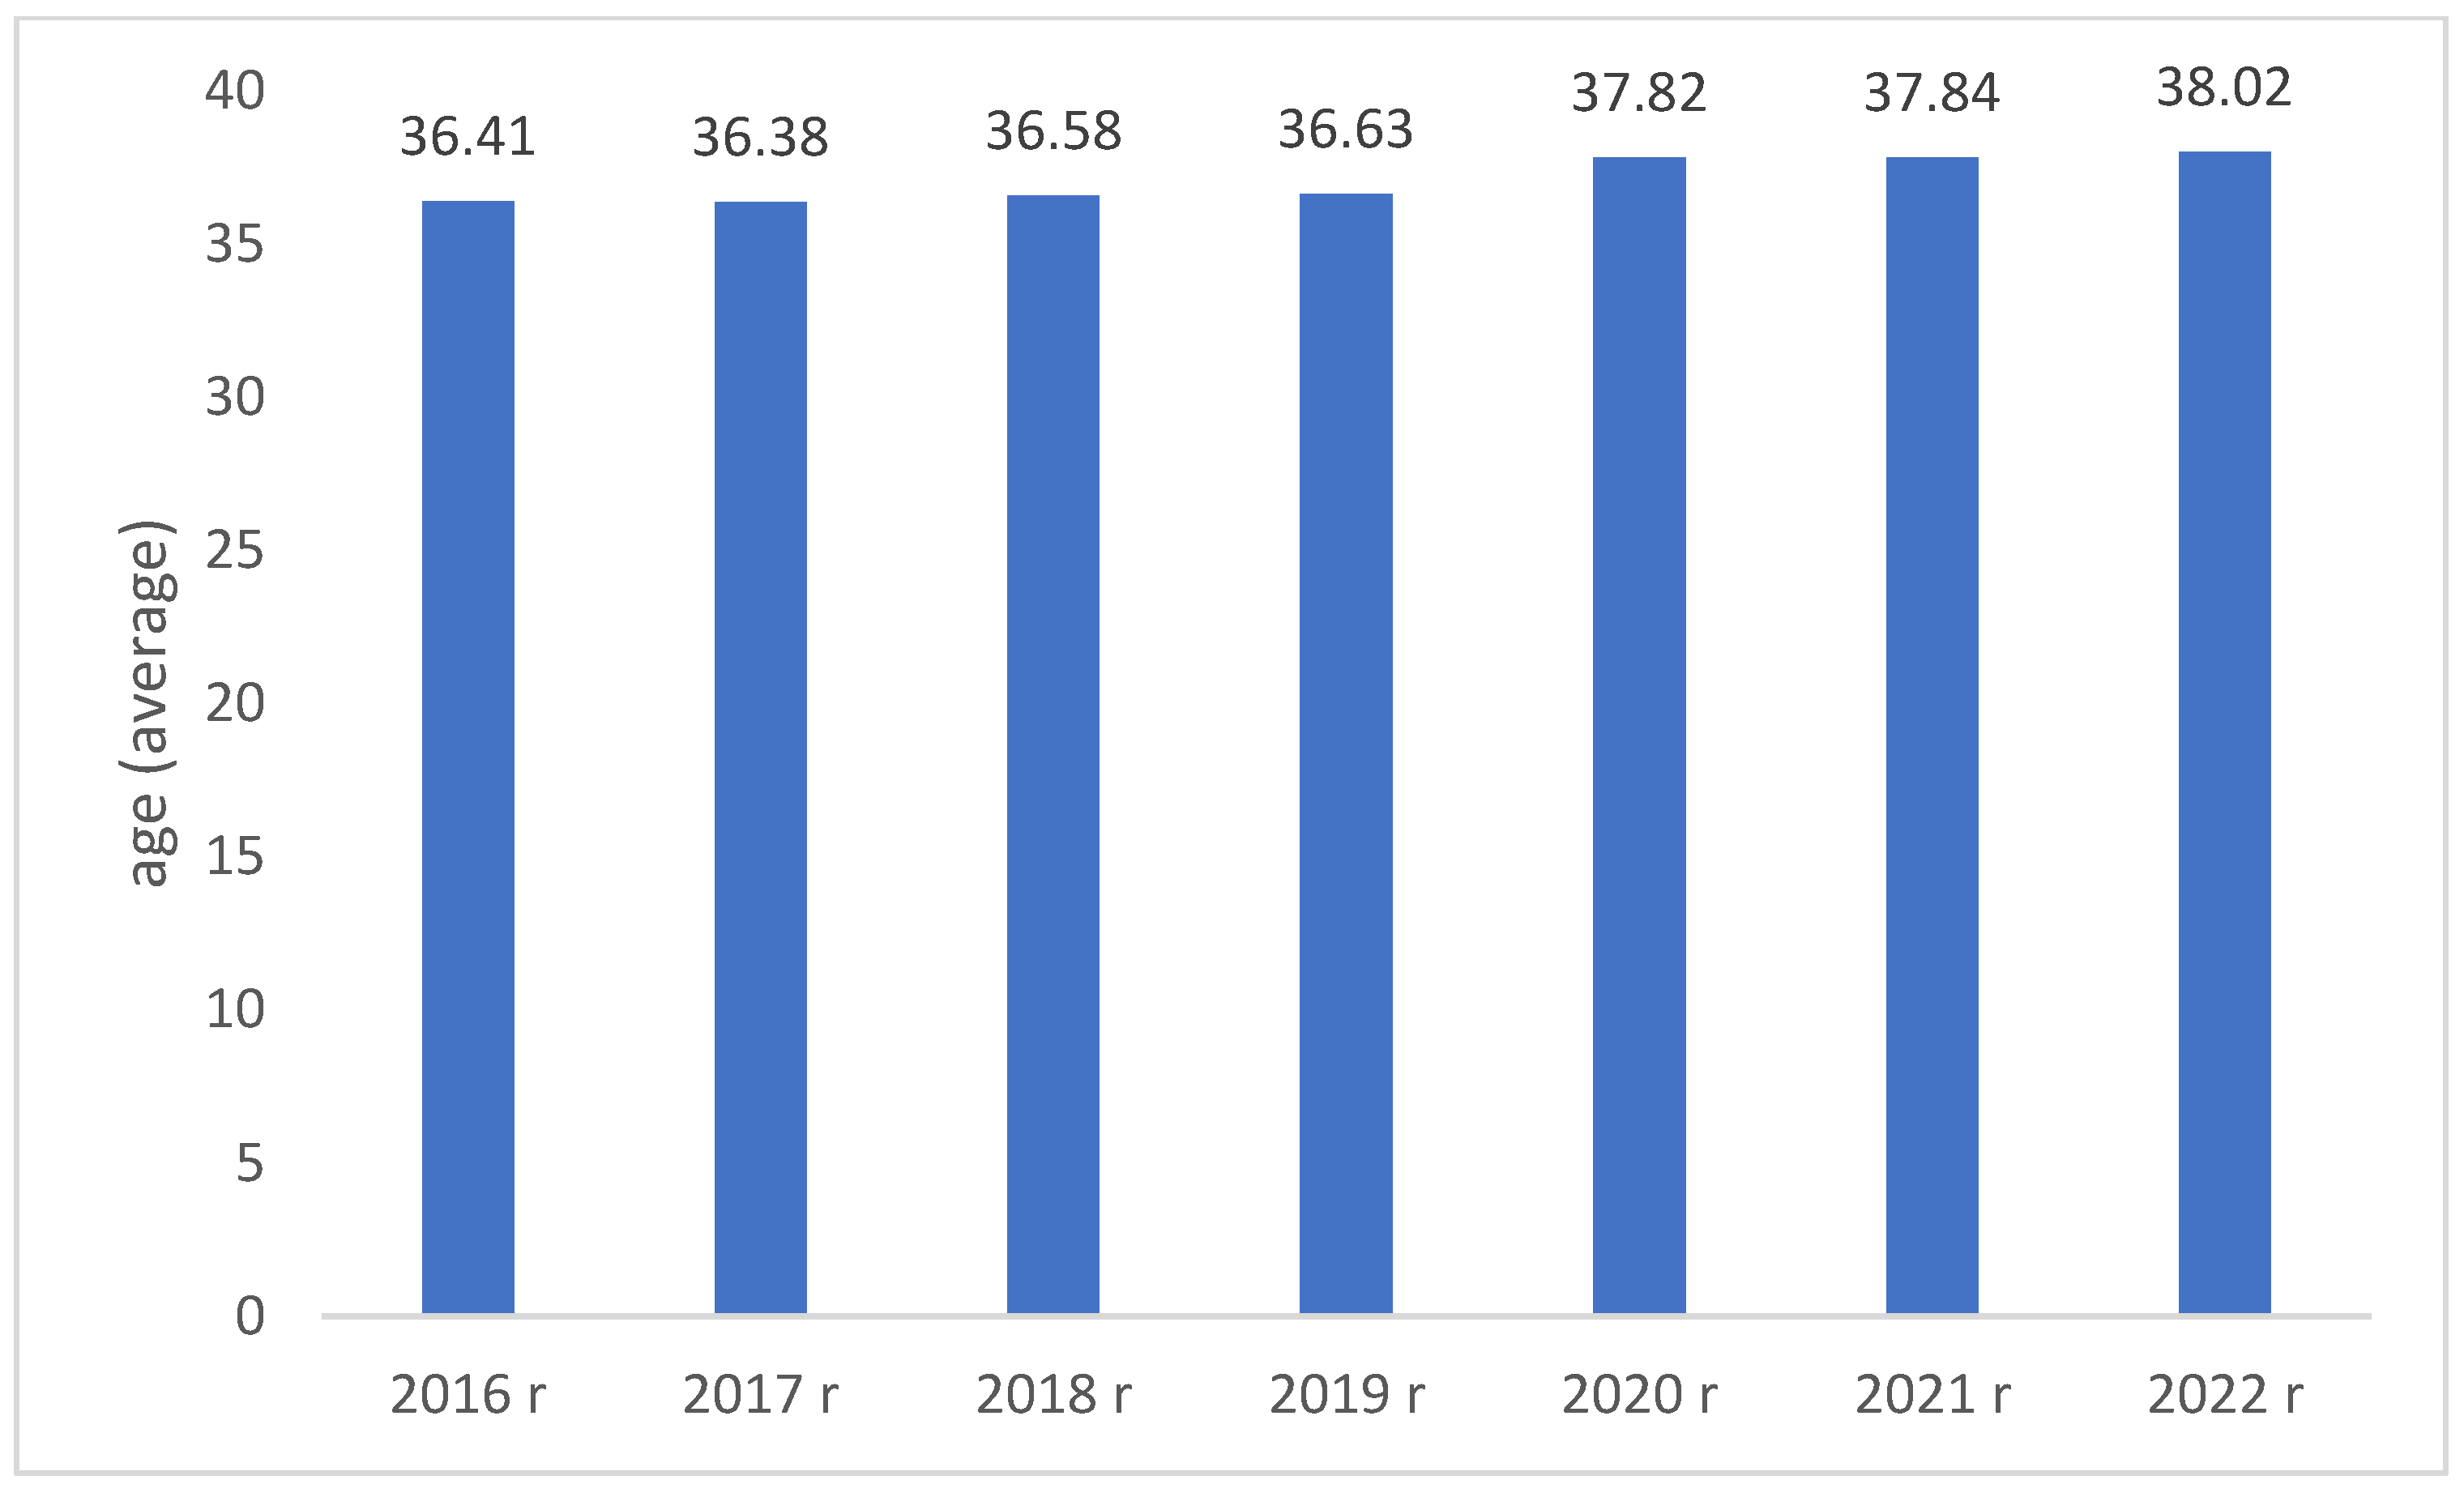
The age of the respondents ranged between 14 and 90 years (M = 36.81; SD = 10.91). A slight trend was observed indicating the mean age of the examined patients slightly increased with each year of measurement (see Figure A3). Clarification: patients can change age categories if their change in age necessitates this; this is not to be misinterpreted for a tautological restatement of the patients aging with time.
Figure A3.
Patient age distribution versus the year of measurement.
The exact distribution of age groups depending on the year of measurement is presented in the table below. It was found that with successive years of measurement, a decreased percentage of people aged 18-35 and an increased percentage in the age group 35-54 were observed; in the case of the remaining age groups, the trends were not as clear as in the case of these two age categories.
Table A1.
Distribution of age groups versus the year of measurement (with 95% CI).
| 2016 | 2017 | 2018 | 2019 | 2020 | 2021 | 2022 | Total | |
| <18 | 0.0% (±0.1%) | 0.0% (±0.1%) | 0.1% (±0.1%) | 0.1% (±0.1%) | 0.0% (±0.2%) | 0.1%(±0.1%) | 0.0%(±0.1%) | 0.1% (±0.2%) |
| 18-35 | 54.5% (±0.2%) | 54.3% (±0.3%) | 53.3% (±0.2%) | 52.5% (±0.2%) | 46.6% (±0.2%) | 52.1%(±0.2%) | 52.3%(±0.2%) | 53.3% (±0.2%) |
| 35-54 | 35.7% (±0.2%) | 35.8% (±0.2%) | 36.7% (±0.2%) | 37.6% (±0.2%) | 42.0% (±0.3%) | 36.9%(±0.2%) | 36.4%(±0.2%) | 36.5% (±0.2%) |
| 55-69 | 9.6% (±0.1%) | 9.7% (±0.1%) | 9.8%(±0.1%) | 9.7% (±0.1%) | 11.2% (±0.1%) | 10.7%(±0.1%) | 10.4%(±0.1%) | 9.1% (±0.1%) |
| >69 | 0.1% (±0.1%) | 0.1% (±0.1%) | 0.2% (±0.1%) | 0.2% (±0.1%) | 0.3% (±0.1%) | 0.3% (±0.1%) | 0.9% (±0.1%) | 0.2% (±0.1%) |
| Total | 100.0% | 100.0% | 100.0% | 100.0% | 100.0% | 100.0% | 0.1%(±0.1%) | 100.0% |
There were also no significant differences in terms of the distribution of the respondents by year of measurement and the voivodeship of residence (see Table 2).
Table A2.
Distribution of voivodships depending on the year of measurement (with 95% CI).
| 2016 | 2017 | 2018 | 2019 | 2020 | 2021 | 2022 | Total | |
| Lower Silesia | 12.6% (±0.2%) | 13.1% (±0.2%) | 12.7% (±0.1%) | 13.0% (±0.1%) | 13.6% (±0.2%) | 12.6% (±0.2%) | 11.7 (±0.2%) | 12.8% (±0.2%) |
| Kuyavian-Pomeranian | 3.9%(±0.1%) | 4.1%(±0.1%) | 4.1% (±0.1%) | 3.8% (±0.1%) | 3.7% (±0.1%) | 4.2%(±0.1%) | 3.9%(±0.1%) | 4.0% (±0.1%) |
| Lublin | 0.9% (±0.1%) | 0.9%(±0.1%) | 0.9%(±0.1%) | 0.8%(±0.1%) | 0.7%(±0.1%) | 0.9%(±0.1%) | 1.1%(±0.1%) | 0.8%(±0.1%) |
| Lubusz | 1.4% (±0.1%) | 1.4% (±0.1%) | 1.5% (±0.1%) | 1.6% (±0.1%) | 1.9% (±0.1%) | 1.4% (±0.1%) | 1.5%(±0.1%) | 1.4% (±0.1%) |
| Lodz | 7.2% (±0.1%) | 7.1% (±0.1%) | 6.6% (±0.1%) | 6.7% (±0.2%) | 6.3% (±0.1%) | 7.2% (±0.1%) | 7.4%(±0.1%) | 7.0% (±0.1%) |
| Lesser | 10.9% (±0.1%) | 11.2% (±0.2%) | 11.8% (±0.2%) | 11.3% (±0.2%) | 11.6% (±0.2%) | 11.4% (±0.2%) | 10.5%(±0.2%) | 11.3% (±0.2%) |
| Mazowieckie | 33.6% (±0.2%) | 32.0% (±0.3%) | 30.8% (±0.3%) | 28.6% (±0.2%) | 29.0% (±0.2%) | 32.0% (±0.3%) | 31.6%(±0.3%) | 31.1% (±0.2%) |
| Opole | 1.1% (±0.1%) | 1.1% (±0.1%) | 1.1% (±0.1%) | 1.2% (±0.1%) | 1.2% (±0.1%) | 1.2% (±0.1%) | 1.2% (±0.1%) | 1.1% (±0.1%) |
| Subcarpathian | 2.0% (±0.1%) | 2.4% (±0.1%) | 3.4% (±0.1%) | 3.1% (±0.1%) | 2.8% (±0.1%) | 2.4% (±0.1%) | 1.8% (±0.1%) | 2.8% (±0.1%) |
| Podlasie | 1.8% (±0.1%) | 1.9% (±0.1%) | 1.7% (±0.1%) | 1.6% (±0.1%) | 1.5% (±0.1%) | 1.9% (±0.1%) | 1.4% (±0.1%) | 1.7% (±0.1%) |
| Pomeranian | 6.2% (±0.1%) | 6.3% (±0.1%) | 6.8% (±0.2%) | 7.3% (±0.1%) | 6.5% (±0.1%) | 6.3% (±0.1%) | 6.5% (±0.1%) | 6.7% (±0.1%) |
| Silesian | 6.1% (±0.1%) | 6.2% (±0.1%) | 6.2% (±0.1%) | 8.2% (±0.1%) | 8.3% (±0.1%) | 6.2% (±0.1%) | 5.6% (±0.1%) | 6.8% (±0.1%) |
| Świetokrzyskie | 0.7% (±0.1%) | 0.7% (±0.1%) | 0.7% (±0.1%) | 0.7% (±0.1%) | 0.7% (±0.1%) | 0.7% (±0.1%) | 0.8% (±0.1%) | 0.7% (±0.1%) |
| Warmia-Masurian | 2.1% (±0.1%) | 1.9% (±0.1%) | 2.0% (±0.1%) | 2.1% (±0.1%) | 2.1% (±0.1%) | 1.9% (±0.1%) | 2.2% (±0.1%) | 2.0% (±0.1%) |
| Greater | 7.0% (±0.2%) | 6.8% (±0.2%) | 6.7% (±0.3%) | 6.4% (±0.2%) | 6.7% (±0.2%) | 6.8% (±0.2%) | 7.5% (±0.2%) | 6.7% (±0.2%) |
| West Pomeranian | 2.6% (±0.1%) | 3.0% (±0.1%) | 3.0% (±0.1%) | 3.5% (±0.1%) | 3.5% (±0.1%) | 3.0% (±0.1%) | 5.3% (±0.1%) | 3.1% (±0.1%) |
| Total | 100.0% | 100.0% | 100.0% | 100.0% | 100.0% | 100.0% | 100.0% | 100.0% |
References
- Rulkiewicz A, Pilchowska I, Lisik W, Pruszczyk P, Ciurzyński M, Domienik-Karłowicz J. Prevalence of Obesity and Severe Obesity among Professionally Active Adult Population in Poland and Its Strong Relationship with Cardiovascular Co-Morbidities-POL-O-CARIA 2016-2020 Study. Journal of clinical medicine. 2022 Jun 27;11(13). Pubmed Central PMCID: PMC9267690. Epub 2022/07/10. eng. [CrossRef]
- Powell-Wiley TM, Poirier P, Burke LE, Després JP, Gordon-Larsen P, Lavie CJ, et al. Obesity and Cardiovascular Disease: A Scientific Statement From the American Heart Association. Circulation. 2021 May 25;143(21):e984-e1010. Pubmed Central PMCID: PMC8493650. Epub 2021/04/23. eng. [CrossRef]
- Wysocki M, Łabul M, Małczak P, Proczko-Stepaniak M, Szymański M, Hady HR, et al. Analysis of the risk factors for perioperative morbidity after laparoscopic revisional bariatric procedures: results from the multicenter Polish Revision Obesity Surgery Study. Surgery for obesity and related diseases : official journal of the American Society for Bariatric Surgery. 2023 Jan;19(1):68-75. Epub 2022/10/02. eng. [CrossRef]
- Worldwide trends in body-mass index, underweight, overweight, and obesity from 1975 to 2016: a pooled analysis of 2416 population-based measurement studies in 128·9 million children, adolescents, and adults. Lancet (London, England). 2017 Dec 16;390(10113):2627-42. Pubmed Central PMCID: PMC5735219. Epub 2017/10/17. eng. [CrossRef]
- Riedel O, Braitmaier M, Dankhoff M, Hornschuch M, Klein M, Zachariassen W, et al. Quality of life in bariatric patients up to twelve years after surgery - Results from a nationwide retrospective cohort study. Obesity research & clinical practice. 2023 Aug 15. Epub 2023/08/18. eng. [CrossRef]
- Domienik-Karlowicz J, Dzikowska-Diduch O, Lisik W, Chmura A, Pruszczyk P. Short-term cardiometabolic risk reduction after bariatric surgery. Hellenic journal of cardiology : HJC = Hellenike kardiologike epitheorese. 2015 Jan-Feb;56(1):61-5. Epub 2015/02/24. eng. [PubMed]
- Soroceanu RP, Timofte DV, Danila R, Timofeiov S, Livadariu R, Miler AA, et al. The Impact of Bariatric Surgery on Quality of Life in Patients with Obesity. Journal of clinical medicine. 2023 Jun 23;12(13). Pubmed Central PMCID: PMC10342241. Epub 2023/07/14. eng. [CrossRef]
- Reilly JJ, El-Hamdouchi A, Diouf A, Monyeki A, Somda SA. Determining the worldwide prevalence of obesity. Lancet (London, England). 2018 May 5;391(10132):1773-4. Epub 2018/05/10. eng. [PubMed]
- Badimon L, Bugiardini R, Cenko E, Cubedo J, Dorobantu M, Duncker DJ, et al. Position paper of the European Society of Cardiology–working group of coronary pathophysiology and microcirculation: obesity and heart disease. European heart journal. 2017;38(25):1951-8. [CrossRef]
- Keum N, Greenwood DC, Lee DH, Kim R, Aune D, Ju W, et al. Adult weight gain and adiposity-related cancers: a dose-response meta-analysis of prospective observational studies. Journal of the National Cancer Institute. 2015 Mar;107(3). Epub 2015/01/27. eng. [CrossRef] [PubMed]
- Bjørge T, Häggström C, Ghaderi S, Nagel G, Manjer J, Tretli S, et al. BMI and weight changes and risk of obesity-related cancers: a pooled European cohort study. International journal of epidemiology. 2019 Dec 1;48(6):1872-85. Epub 2019/10/01. eng. [CrossRef] [PubMed]
- Hall ME, Cohen JB, Ard JD, Egan BM, Hall JE, Lavie CJ, et al. Weight-Loss Strategies for Prevention and Treatment of Hypertension: A Scientific Statement From the American Heart Association. Hypertension (Dallas, Tex : 1979). 2021 Nov;78(5):e38-e50. Epub 2021/09/21. eng. [CrossRef]
- Shields M, Tremblay MS. Sedentary behaviour and obesity. Health reports. 2008 Jun;19(2):19-30. Epub 2008/07/23. eng. [PubMed]
- Zawadzka K, Więckowski K, Stefura T, Major P, Szopa M. Current Knowledge and Perceptions of Bariatric Surgery among Diabetologists and Internists in Poland. Journal of clinical medicine. 2022 Apr 5;11(7). Pubmed Central PMCID: PMC8999568. Epub 2022/04/13. eng. [CrossRef]
Figure 1.
Average age depending on the BMI category (in the figure, all groups are statistically significantly different at least at the p<0.001 level; due to the number of groups compared, results for differences are not shown in Fig.).
Figure 1.
Average age depending on the BMI category (in the figure, all groups are statistically significantly different at least at the p<0.001 level; due to the number of groups compared, results for differences are not shown in Fig.).
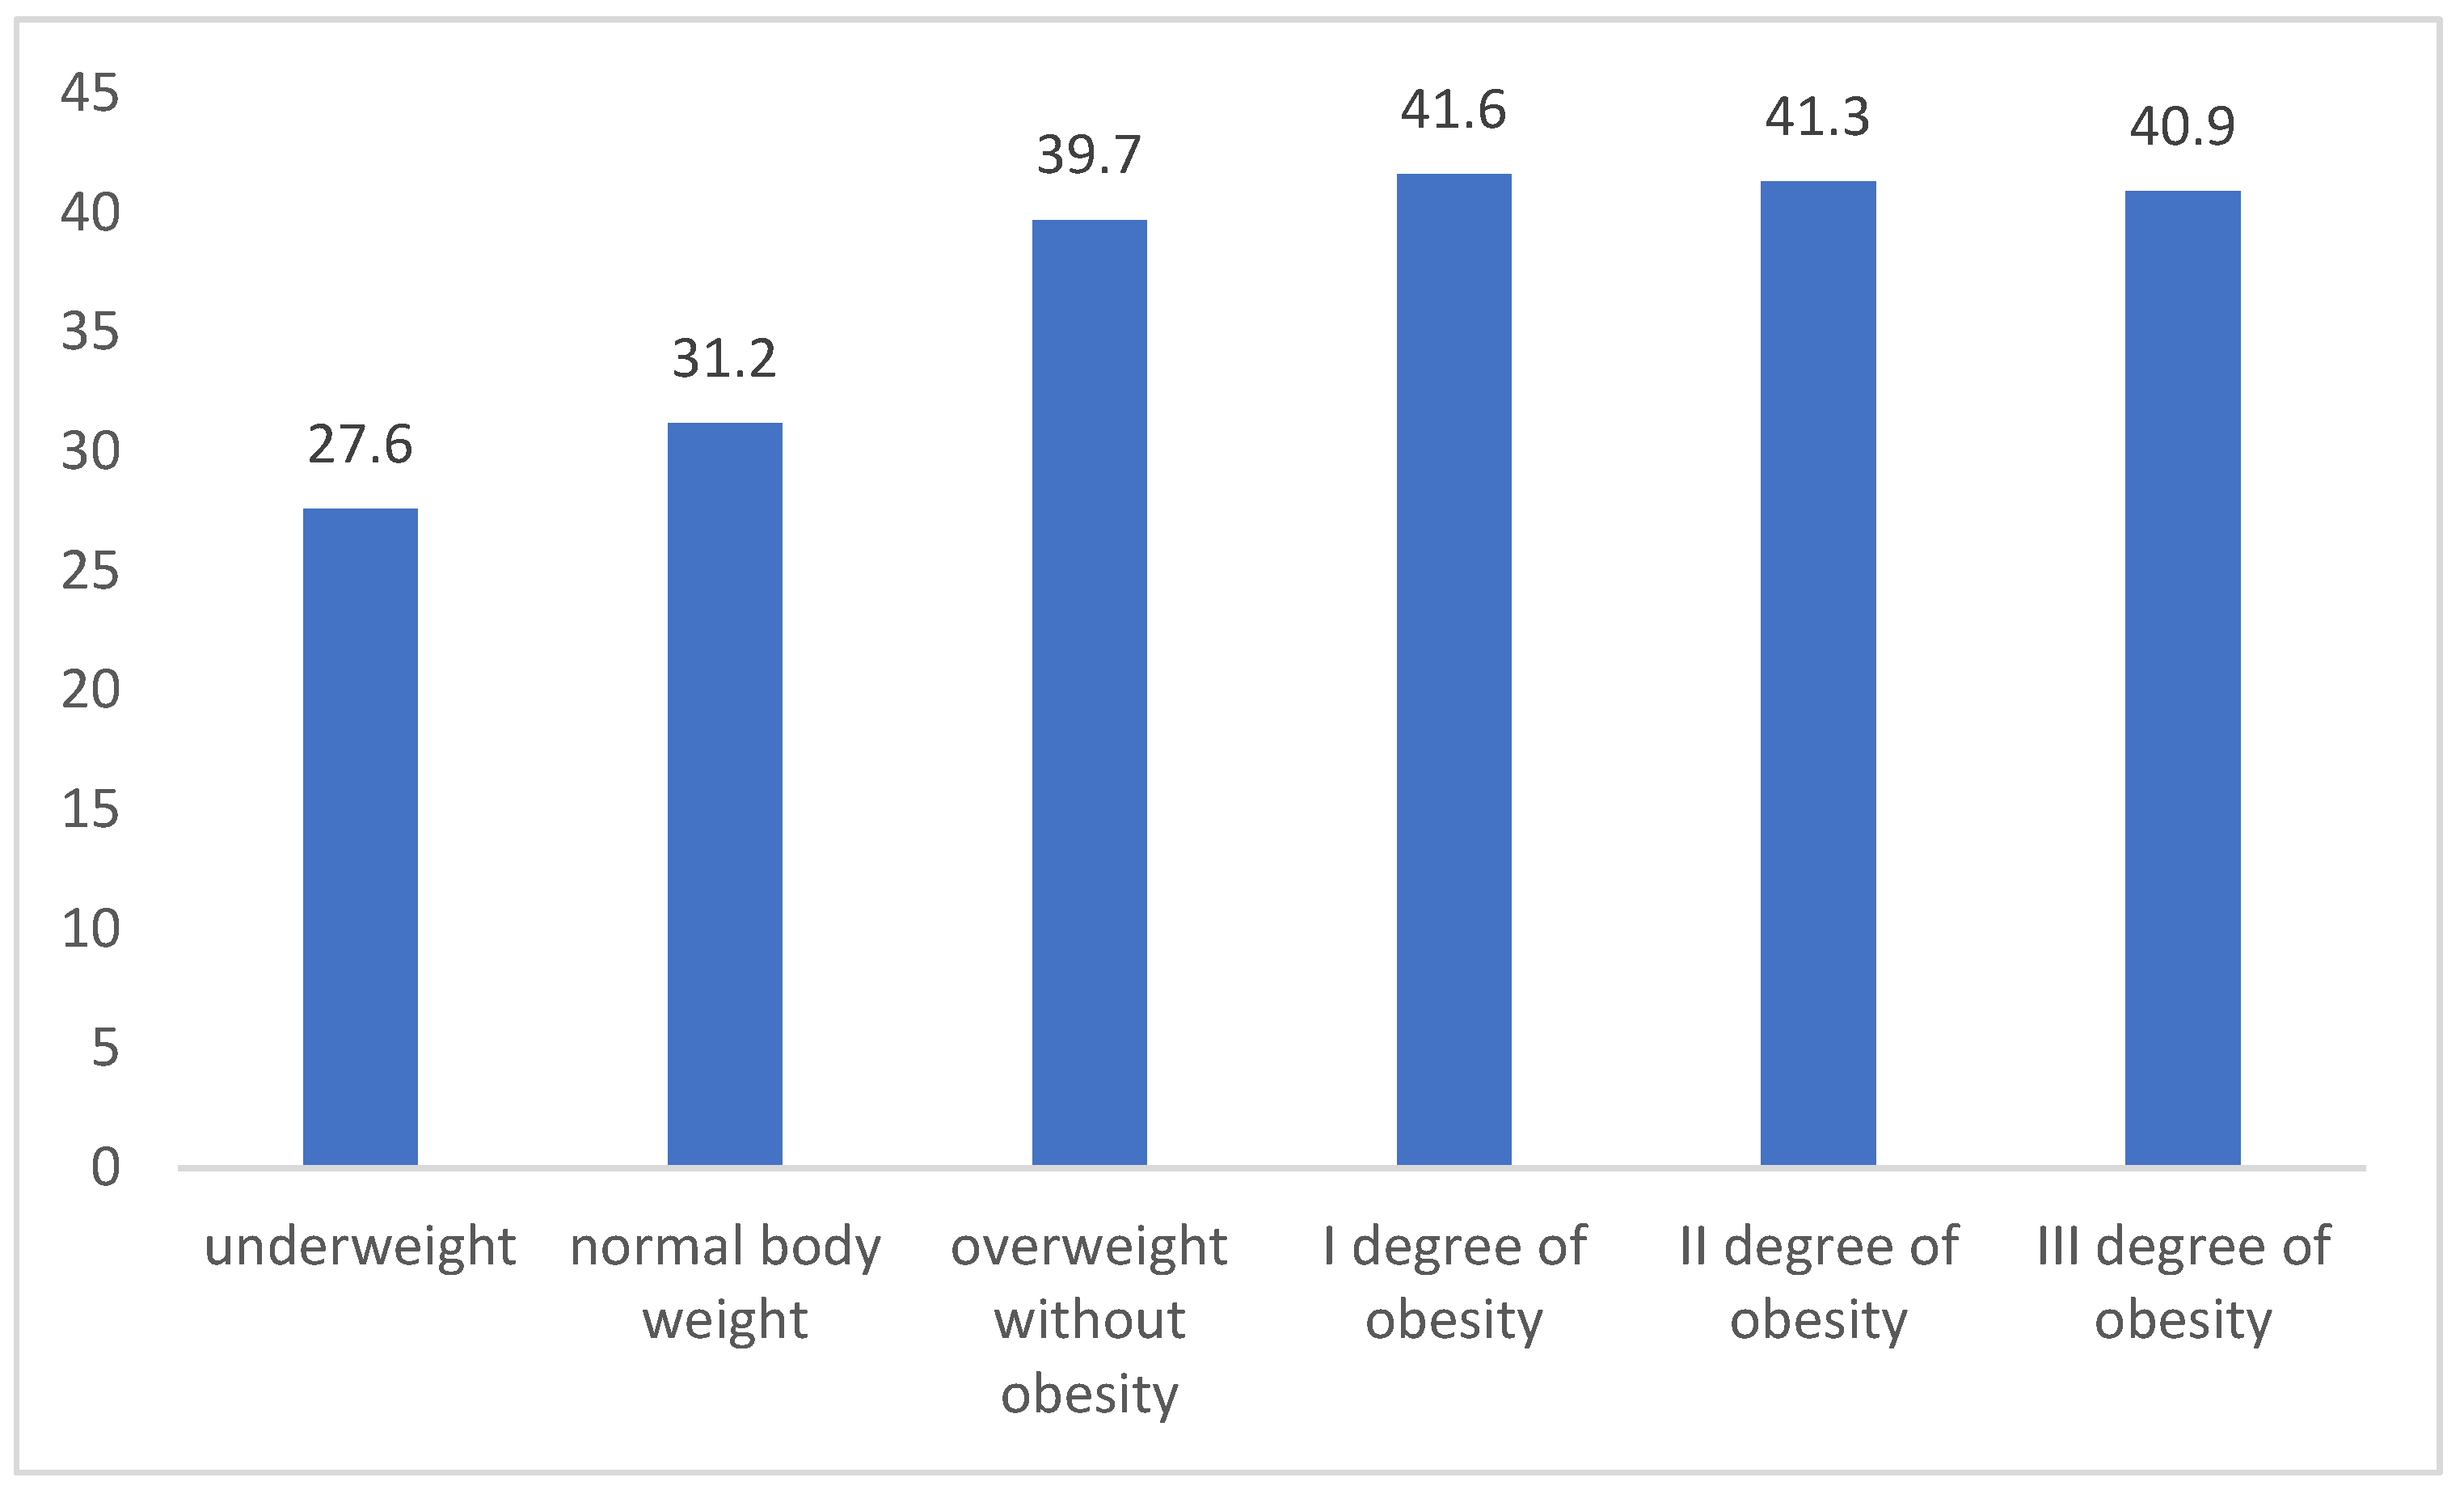
Figure 3.
Percentage of people declaring smoking depending on the BMI category (due to the number of groups compared, results for differences are not shown in Fig.).
Figure 3.
Percentage of people declaring smoking depending on the BMI category (due to the number of groups compared, results for differences are not shown in Fig.).
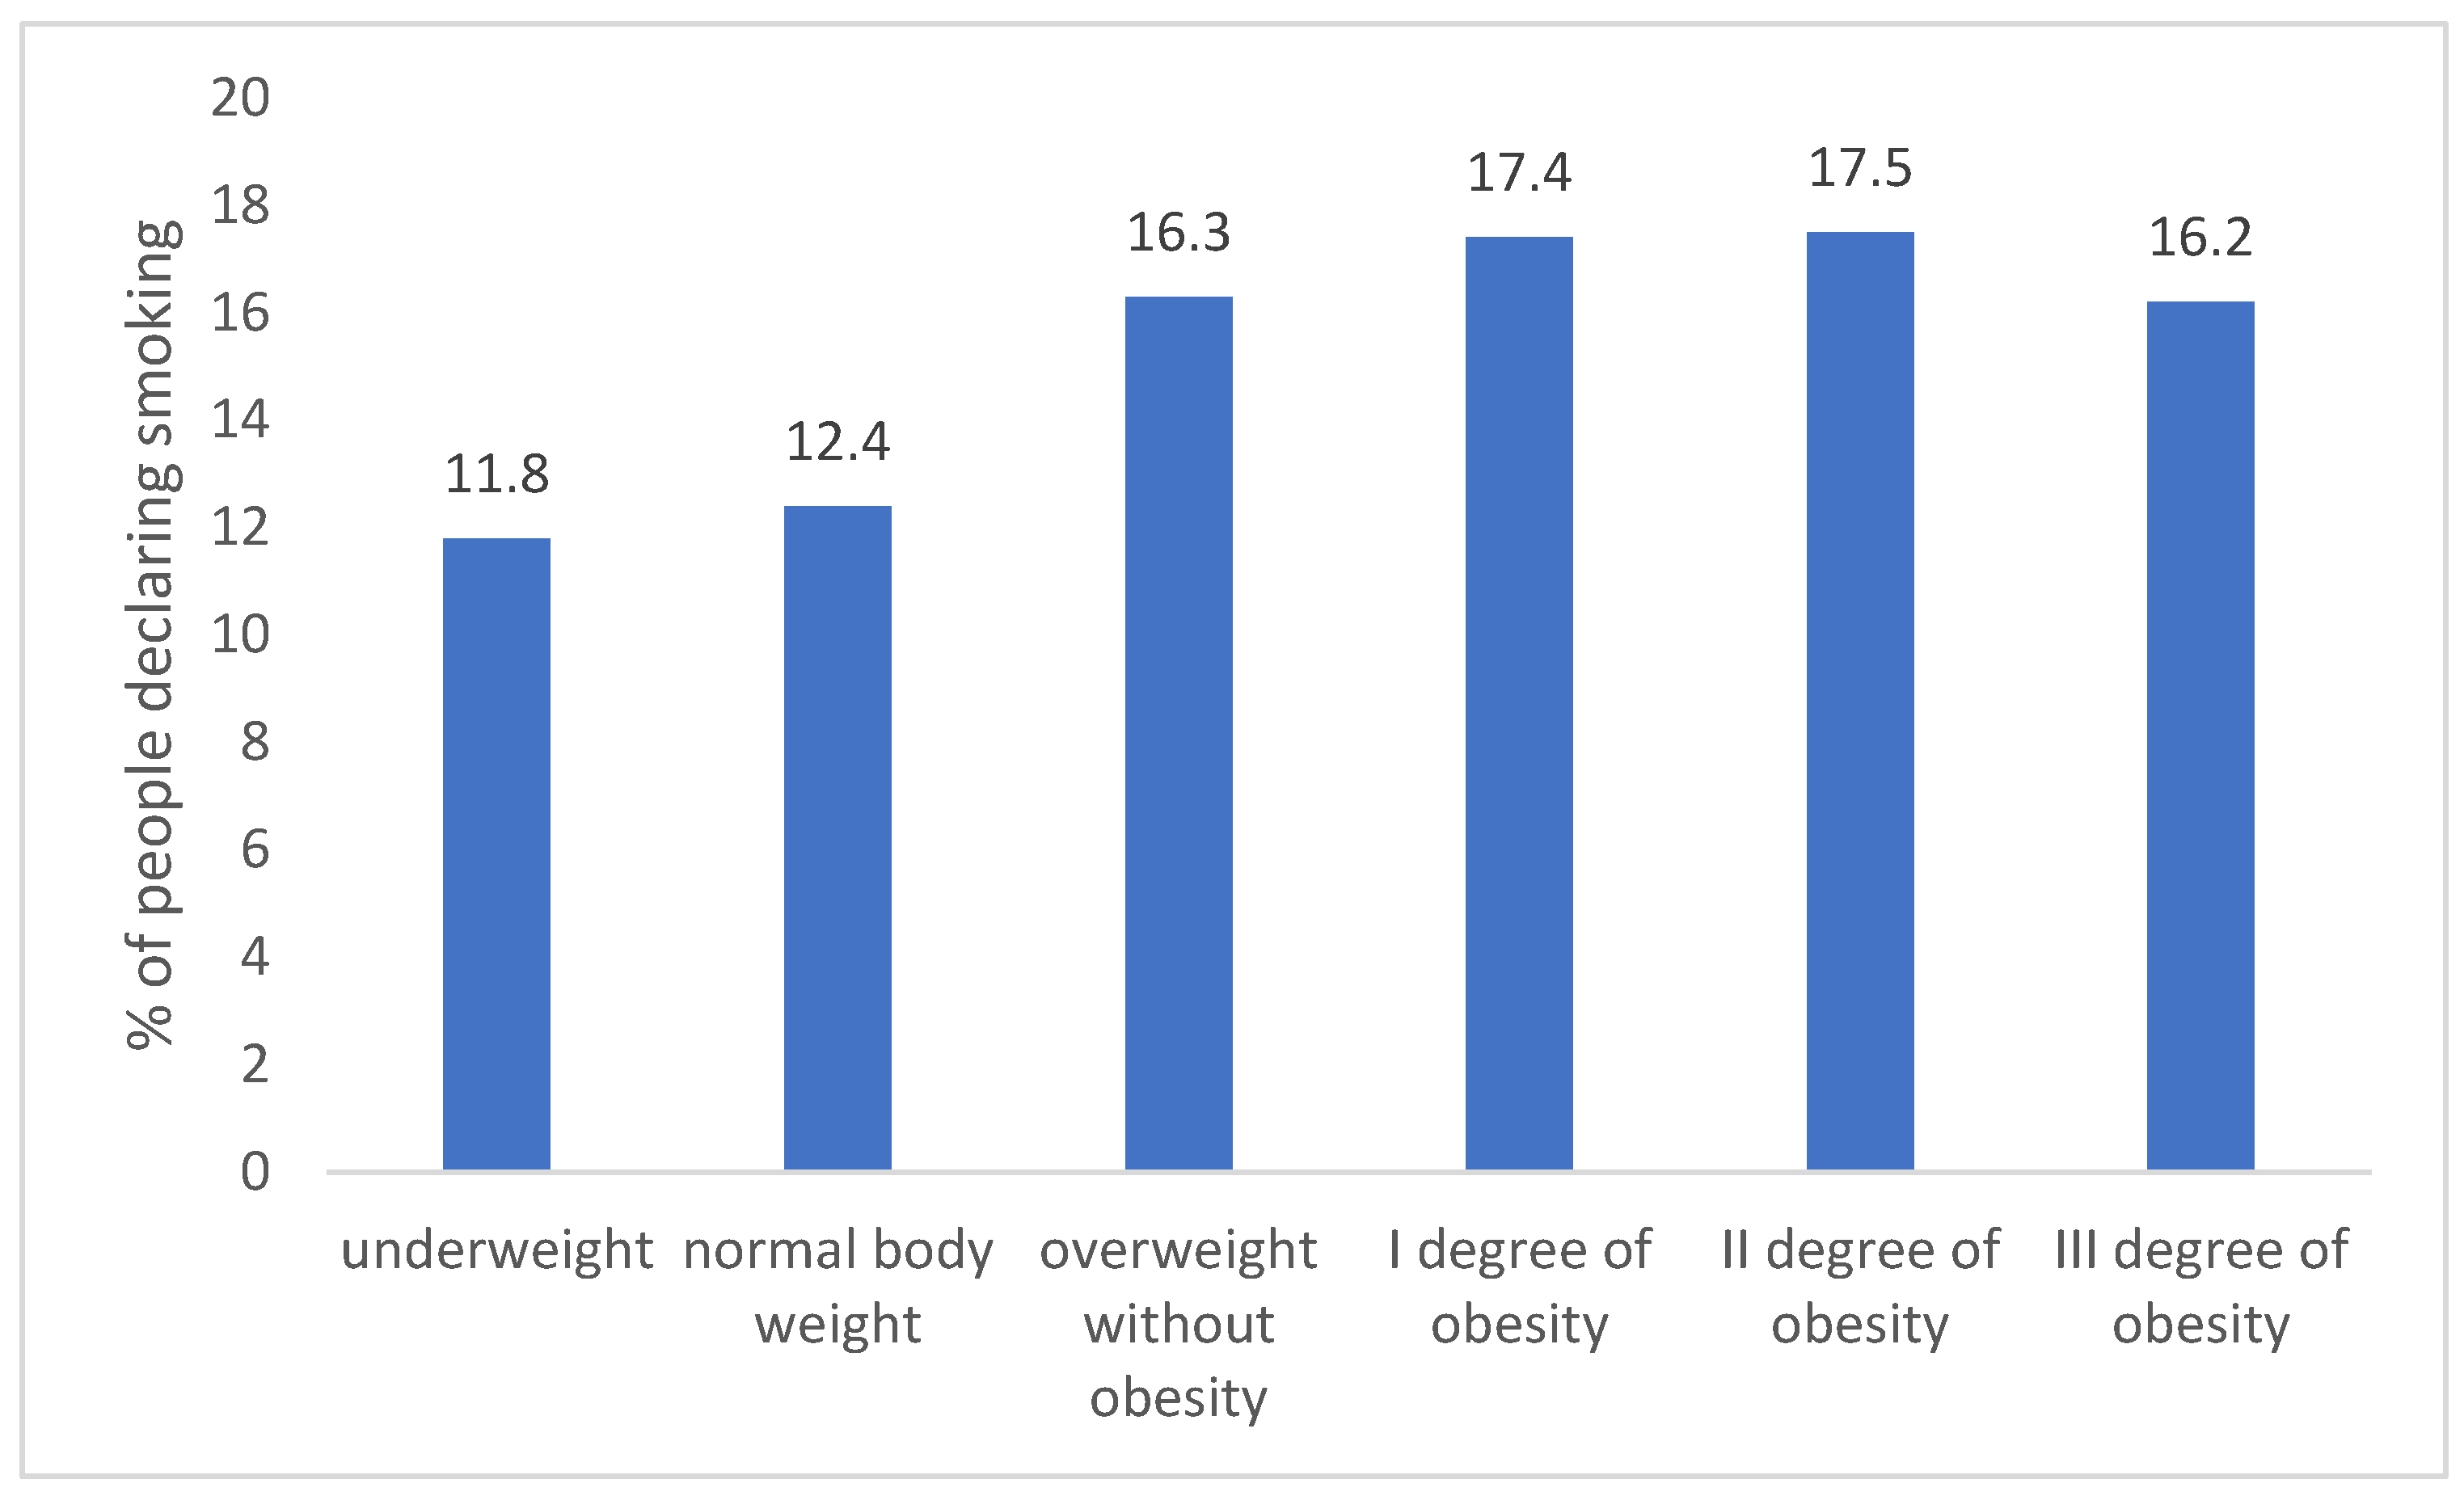
Table 1.
BMI distribution depending on the year of measurement.
| 2016 | 2017 | 2018 | 2019 | 2020 | 2021 | 2022 | Total | |
| underweight | 3,4% | 3,4% | 3,4% | 3,2% | 3,1% | 3,0% | 2,8% | 3,0% |
| normal body weight | 51,6% | 51,1% | 50,2% | 49,3% | 48,2% | 48,1% | 47,6% | 49,3% |
| overweight without obesity | 31,4% | 31,5% | 32,0% | 32,2% | 32,1% | 32,4% | 32,7% | 32,4% |
| I degree of obesity | 10,4% | 10,7% | 11,0% | 11,5% | 12,1% | 12,3% | 12,4% | 12,4% |
| II degree of obesity | 2,5% | 2,6% | 2,7% | 2,9% | 3,7% | 4,1% | 4,4% | 2,6% |
| III degree of obesity | 0,7% | 0,7% | 0,8% | 0,8% | 0,8% | 0,1% | 0,1% | 0,3% |
| Total | 100,0% | 100,0% | 100,1% | 99,9% | 100,0% | 100,0% | 100,0% | 100,0% |
Table 2.
Descriptive statistics on the average number of months of the issued medical certificate depending on BMI.
Table 2.
Descriptive statistics on the average number of months of the issued medical certificate depending on BMI.
| underweight | normal body weight | overweight without obesity | I degree of obesity | II degree of obesity | III degree of obesity | |
| M | 36,01 | 34,21 | 31,12 | 27,89 | 26,77 | 26,01 |
| Me | 36,00 | 36,00 | 36,00 | 23,00 | 23,00 | 23,00 |
| SD | 11,67 | 12,83 | 13,78 | 15,23 | 14,29 | 13,71 |
| Skewness | -0,54 | -0,62 | -0,34 | -0,14 | 0,23 | 0,21 |
| Kurtosis | -0,12 | -0,53 | -0,66 | -0,76 | -0,58 | -0,63 |
| Min | 0,00 | 0,00 | 0,00 | 0,00 | 0,00 | 0,00 |
| Max | 156,00 | 156,00 | 178,00 | 155,00 | 156,00 | 70,00 |
Table 3.
Relationship between BMI and measurement time as well as patients' sex - data percentage to the year of measurement1.
Table 3.
Relationship between BMI and measurement time as well as patients' sex - data percentage to the year of measurement1.
| 2016 | 2017 | 2018 | 2019 | 2020 | 2021 | 2022 | Total | ||
| Women | underweight | 6,1% | 6,2% | 6,0% | 5,8% | 5,6% | 5,6% | 5,4% | 5,9% |
| normal body weight | 64,4% | 63,7% | 62,7% | 62,0% | 61,9% | 61,5% | 61,3% | 62,4% | |
| overweight without obesity | 19,6% | 19,9% | 20,7% | 20,9% | 21,4% | 21,6% | 22,1% | 20,6% | |
| I degree of obesity | 7,1% | 7,3% | 7,5% | 8,0% | 8,1% | 8,2% | 8,1% | 7,9% | |
| II degree of obesity | 2,1% | 2,2% | 2,2% | 2,4% | 2,1% | 2,3% | 2,5% | 2,4% | |
| III degree of obesity | 0,7% | 0,8% | 0,8% | 0,8% | 0,9% | 0,8% | 0,6% | 0,8% | |
| Total | 100,0% | 100,0% | 100,0% | 100,0% | 100,0% | 100,0% | 100,0% | 100,0% | |
| Men | underweight | 0,8% | 0,8% | 0,9% | 0,9% | 0,8% | 0,8% | 0,9% | 0,8% |
| normal body weight | 39,3% | 38,9% | 38,3% | 37,9% | 37,1% | 37,1% | 36,9% | 38,1% | |
| overweight without obesity | 42,7% | 42,8% | 42,7% | 42,4% | 42,3% | 42,6% | 42,6% | 42,6% | |
| I degree of obesity | 13,6% | 14,0% | 14,3% | 14,7% | 15,3% | 15,6% | 15,7% | 14,6% | |
| II degree of obesity | 2,9% | 2,9% | 3,2% | 3,3% | 3,4% | 3,2% | 3,1% | 3,1% | |
| III degree of obesity | 0,6% | 0,7% | 0,8% | 0,8% | 1,1% | 0,7% | 0,8% | 0,8% | |
| Total | 100,0% | 100,0% | 100,0% | 100,0% | 100,0% | 100,0% | 100,0% | 100,0% | |
Table 4.
Relationship between BMI and patients' age - data percentage to age groups.
| <18 | 18-35 | 35-54 | 55-69 | >69 | Total | |
| underweight | 13,9% | 4,9% | 1,2% | 0,4% | 0,4% | 3,0% |
| normal body weight | 61,3% | 59,3% | 39,9% | 26,5% | 26,8% | 49,3% |
| overweight without obesity | 18,1% | 26,0% | 40,3% | 42,4% | 52,1% | 32,4% |
| I degree of obesity | 4,2% | 7,4% | 14,4% | 24,4% | 18,4% | 12,4% |
| II degree of obesity | 2,0% | 1,8% | 3,3% | 6,2% | 2,1% | 2,6% |
| III degree of obesity | 0,5% | 0,6% | 0,9% | 0,1% | 0,2% | 0,3% |
| Total | 100,0% | 100,0% | 100,0% | 100,0% | 100,0% | 100,0% |
Disclaimer/Publisher’s Note: The statements, opinions and data contained in all publications are solely those of the individual author(s) and contributor(s) and not of MDPI and/or the editor(s). MDPI and/or the editor(s) disclaim responsibility for any injury to people or property resulting from any ideas, methods, instructions or products referred to in the content. |
© 2023 by the authors. Licensee MDPI, Basel, Switzerland. This article is an open access article distributed under the terms and conditions of the Creative Commons Attribution (CC BY) license (http://creativecommons.org/licenses/by/4.0/).
Copyright: This open access article is published under a Creative Commons CC BY 4.0 license, which permit the free download, distribution, and reuse, provided that the author and preprint are cited in any reuse.


